Embed Size (px)
Citation preview

Butte Mine Flooding Operable Unit Water-Level Monitoring and Water-Quality Sampling
2010 Consent Decree Update Butte, Montana
1982-2010 prepared for
The Montana Department of Environmental Quality Remediation Division
and U.S. Environmental Protection Agency
Region VIII
(Photo courtesy of Butte-Silver Bow Archives)
October 2011
Prepared by
Terence E. Duaime and
Nicholas J. Tucci Montana Bureau of Mines and Geology
1300 West Park Street Butte, MT 59701-8997
Contract No. 400022-TO-35
Montana Bureau of Mines and Geology Open File Report 609


Butte Mine Flooding Operable Unit Water-Level Monitoring and Water-Quality Sampling
2010 Consent Decree Update Butte, Montana
1982-2010
prepared for
The Montana Department of Environmental Quality Remediation Division
and U.S. Environmental Protection Agency
Region VIII
October 2011
Prepared by
Terence E. Duaime and
Nicholas J. Tucci
Montana Bureau of Mines and Geology 1300 West Park Street Butte, MT 59701-8997
Contract No. 400022-TO-35
Montana Bureau of Mines and Geology Open File Report 609

i

ii
Table of Contents
List of Figures ..................................................................................................................... iv Executive Summary ............................................................................................................ x SECTION 1.0 SITE BACKGROUND .................................................................................. 1 Section 1.1 Introduction ................................................................................................... 3 Section 1.2 Notable 2010 Activities and Water-Level and Water-Quality Observations ... 8 Section 1.3 Precipitation Trends ...................................................................................... 8
SECTION 2.0 EAST CAMP SYSTEM ............................................................................. 10 Section 2.1 East Camp Alluvial System ......................................................................... 10 Section 2.1.1 AMC-Series Wells .................................................................................. 12 Section 2.1.1.1 AMC Series Water Quality ................................................................ 18 Section 2.1.2 LP-Series Wells .................................................................................... 21 Section 2.1.2.1 LP-Series Wells Water Quality ........................................................... 30 Section 2.1.3 Precipitation Plant Area Wells ............................................................... 31 Section 2.1.4 GS and BMF05-Series Wells ................................................................ 37 Section 2.1.4.1 GS and BMF05-Series Wells Water Quality ...................................... 45
Section 2.2 East Camp Underground Mines ................................................................. 46 Section 2.2.1 Water Quality ........................................................................................ 53 Section 2.2.2 RI/FS Bedrock Monitoring Wells .......................................................... 57 Section 2.2.2.1 RI/FS Bedrock Well Water Quality ................................................... 67 Section 2.2.3 DDH Series Wells ................................................................................. 70
Section 2.3 Berkeley Pit and Horseshoe Bend Drainage .............................................. 72 Section 2.3.1 Berkeley Pit and Horseshoe Bend Drainage Water Quality.................... 76 Section 2.3.1.1 Berkeley Pit Water-Quality Sampling and Monitoring Overview .......... 77 Section 2.3.1.2 Berkeley Pit Water Chemistry .......................................................... 79 Section 2.3.1.3 Physical Parameters .......................................................................... 79 Section 2.3.1.4 Chemical Parameters ........................................................................ 83 Section 2.3.2 Horseshoe Bend Water Quality ............................................................. 92
SECTION 3.0 WEST CAMP SYSTEM ............................................................................ 94 Section 3.1 West Camp Underground Mines ................................................................. 94

iii
Section 3.2 West Camp Monitoring Wells ..................................................................... 99 Section 3.2.1 West Camp Mines and Monitoring Wells Water Quality ....................... 104
SECTION 4. OUTER CAMP SYSTEMS ........................................................................ 108 Section 4.1 Outer Camp System Water Levels ............................................................ 108 Section 4.2 Outer Camp Water Quality ........................................................................ 113
SECTION 5.0 PARK WELLS ......................................................................................... 115 Section 5.1 Park Wells’ Water Levels .......................................................................... 115 Section 5.2 Park Wells’ Water Quality ........................................................................ 123
SECTION 6.0 REVIEW OF THE BERKELEY PIT MODEL ............................................ 125 SECTION 7.0 CONCLUSIONS AND SUMMARY ........................................................... 127 ACKNOWLEDGEMENTS ................................................................................................ 129 REFERENCES ................................................................................................................ 130

iv
List of Figures
Figure 1-1. Map showing location of selected underground mines engulfed by development and expansion of the Berkeley Pit. ..................................................................................... 2
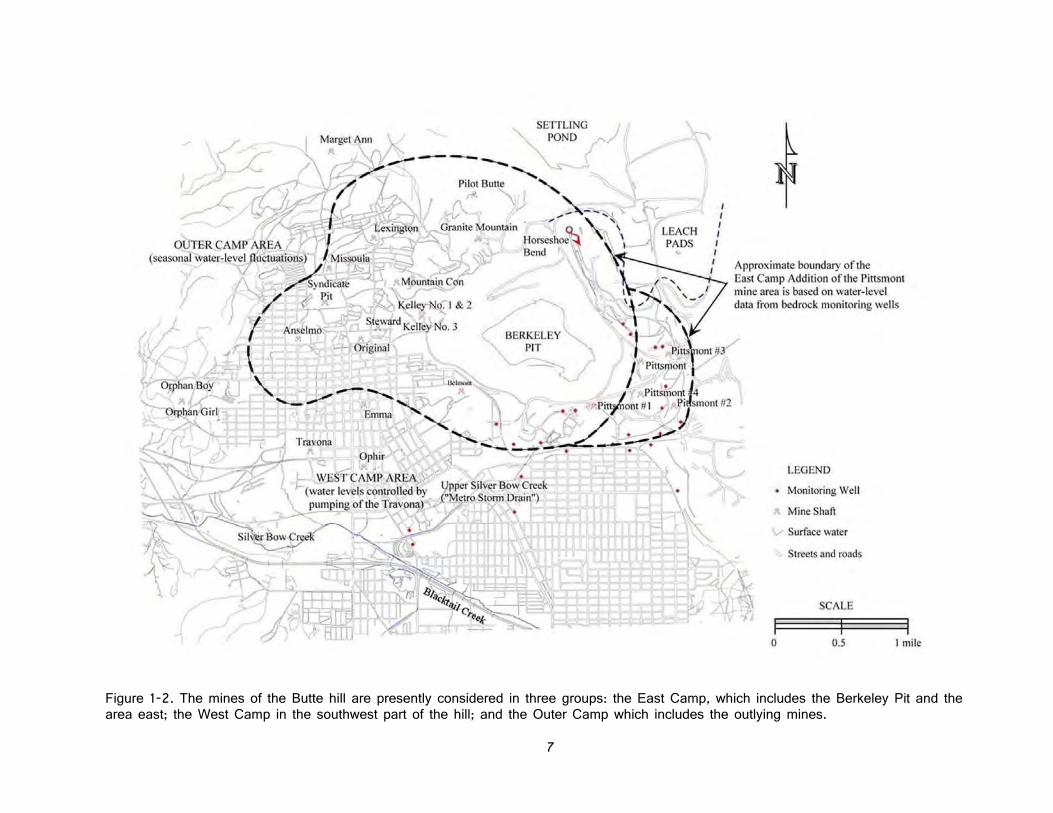
Figure 1-2. The mines of the Butte hill are presently considered in three groups: the East Camp, which includes the Berkeley Pit and the area east; the West Camp in the southwest part of the hill; and the Outer Camp which includes the outlying mines. ............ 7
Figure 1-3. Yearly precipitation totals 1982-2010, showing 1895-2010 mean. ................... 9
Figure 1-4. Percent precipitation variation from normal, 1895-2010. ................................... 9
Figure 2-1. East Camp monitoring sites. ............................................................................ 11
Figure 2-2. AMC well location map. ................................................................................. 14
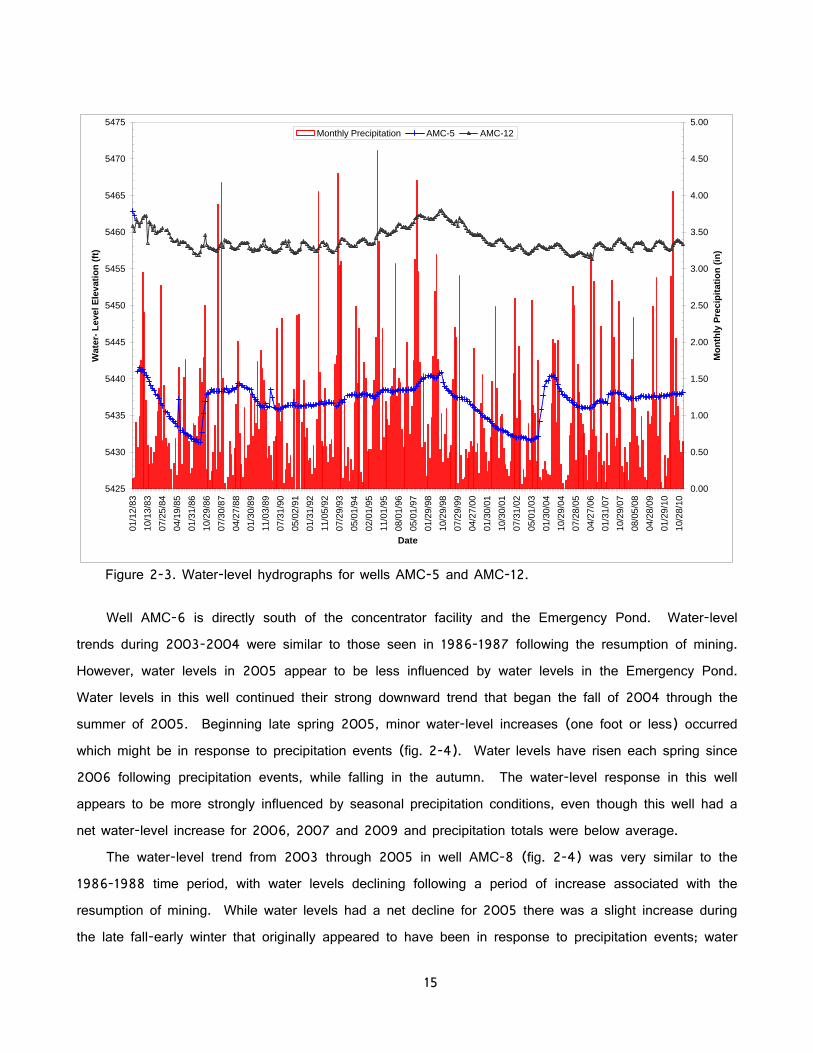
Figure 2-3. Water-level hydrographs for wells AMC-5 and AMC-12. ................................ 15
Figure 2-4. Water-level hydrographs for wells AMC-6 and AMC-8. ................................. 16
Figure 2-5. Water-level hydrographs for wells AMC-13 (a), and AMC-15 (b). ................ 17
Figure 2-6. Graphs showing pH and sulfate concentration changes over time for wells AMC-6 (top) and AMC-8 (bottom). ................................................................................. 20
Figure 2-7. LP series and MR97 wells location map. ...................................................... 24
Figure 2-8. Water-level hydrographs for wells LP-01 and LP-02. .................................... 25
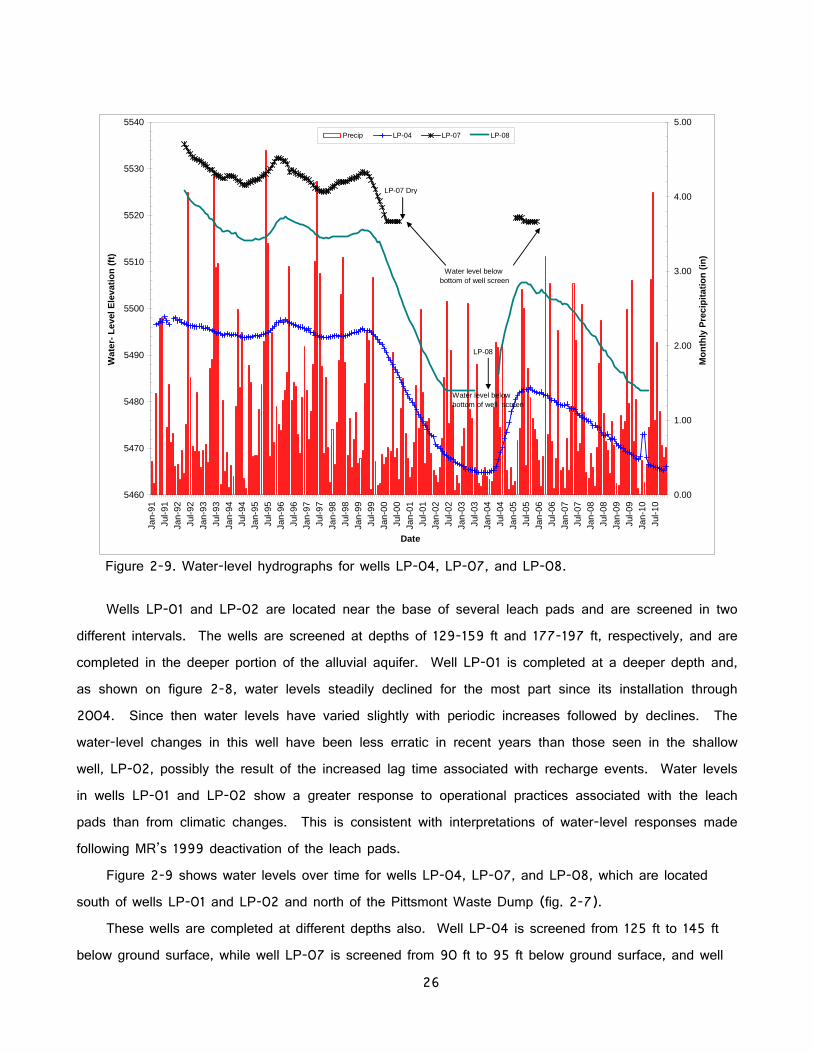
Figure 2-9. Water-level hydrographs for wells LP-04, LP-07, and LP-08. ...................... 26
Figure 2-10. Water-level hydrographs for wells LP-14, LP-15, and LP-16. ....................... 28
Figure 2-11. Alluvial aquifer potentiometric map for December, 2010 (contour interval is 1 foot). ................................................................................................................................. 29
Figure 2-12. Sulfate (top) and zinc (bottom) concentrations vs. pH in well LP-09. ......... 32
Figure 2-13. Water-level hydrograph for well MR97-1. ..................................................... 33
Figure 2-14. Water-level hydrograph for well MR97-2. .................................................... 35
v
Figure 2-15. Water-level hydrograph for well MR97-3. .................................................... 36
Figure 2-16. Water-level hydrograph for well MR97-4. .................................................... 37
Figure 2-17. GS and BMF wells ....................................................................................... 39
Figure 2-18. Water-level hydrographs for wells GS-41S and GS-41D. ............................. 41
Figure 2-19. Water-level hydrographs for wells GS-44S and GS-44D. ............................ 42
Figure 2-20. Water-level hydrographs for wells GS-46S and GS-46D. ........................... 42
Figure 2-21. Average daily water-levels for BMF05 series wells. ..................................... 44
Figure 2-22. Monthly water-levels versus precipitation, BMF05 series wells. ................... 44
Figure 2-23. East Camp and bedrock wells location map. ............................................... 48
Figure 2-24. East Camp mines annual water-level changes. ........................................... 49
Figure 2-25. Anselmo Mine and Kelley Mine hydrograph, 1983-2010. ............................ 50
Figure 2-26. Anselmo Mine and Kelley Mine hydrograph, 1995-2010. ............................ 50
Figure 2-27. Water-level hydrograph for the Berkeley Pit, 1991-2010.............................. 51
Figure 2-28. Water level hydrograph for selected East Camp mines, with monthly precipitation. ...................................................................................................................... 52
Figure 2-29. Iron and arsenic concentrations over time in the Kelley Mine. ..................... 54
Figure 2-30. Iron and arsenic concentrations (top) and cadmium and zinc concentrations (bottom) over time in the Anselmo Mine. ......................................................................... 55
Figure 2-31. Iron and arsenic concentrations (top) and cadmium and zinc concentrations (bottom) over time in the Steward Mine. .......................................................................... 56
Figure 2-32. RI/FS bedrock wells annual water-level change. ........................................ 57
Figure 2-33. Water-level hydrograph for bedrock well A. ................................................. 60
Figure 2-34. Water-level hydrographs for East Camp bedrock wells A and B. ................. 61
Figure 2-35. Water-level hydrographs for East Camp bedrock wells E and F. ................. 62
Figure 2-36. Water-level hydrographs for bedrock wells G, H, and J. .............................. 63

vi
Figure 2-37. Hydrographs for well A comparing daily average water level (top) and monthly water level (bottom) monitoring frequency. .......................................................... 65
Figure 2-38. Potentiometric map for the East Camp bedrock aquifer, December, 2010; arrows indicate direction of ground-water flow (contour interval is 10 feet). ..................... 66
Figure 2-39. Bedrock well iron and arsenic concentration comparisons, spring 2010. .... 69
Figure 2-40. Selected trace metal comparisons between bedrock wells A, J and the Berkeley Pit 1-ft depth sample. ......................................................................................... 69
Figure 2-41. Water-level hydrograph for bedrock well DDH-2. ......................................... 71
Figure 2-42. Water-level hydrograph of Berkeley Pit, 1995-2010. ................................... 72
Figure 2-43. Horseshoe Bend Drainage flow rate, July 2000 through December 2010. .. 75
Figure 2-44. Horseshoe Bend Falls long-term daily average flow rates, includes both MR and MBMG data. .............................................................................................................. 76
Figure 2-45. 1985 Berkeley Pit sampling event. ............................................................. 78
Figure 2-46. MR pontoon boat is used for Berkeley Pit sampling. Boat is docked next to pump station used for pumping pit water to precipitation plant for copper recovery. (Photo courtesy of Daryl Reed, DEQ) .......................................................................................... 78
Figure 2-47. 2010 spring depth profile for the Berkeley Pit Lake System. ...................... 80
Figure 2-48. Long-term changes in depth profiles for selected parameter in the Berkeley Pit Lake. All data from all years are representative of fall sampling events, and were collected by the MBMG. ................................................................................................... 81
Figure 2-49 Depth of the Berkeley Pit Chemocline over time. .......................................... 83
Figure 2-50. Accumulation of secondary iron precipitates in a sediment trap deployed in the Berkeley Pit for 150 days. .......................................................................................... 86
Figure 2-51. Effects of MR Cu-precipitation plant on dissolved iron. ............................... 88
Figure 2-52. Effects of MR Cu-cementation process on Fe speciation. .......................... 89
Figure 2-53. Effects of MR Cu-precipitation plant on dissolved copper. .......................... 90
Figure 2-54. Effect of MR Cu-precipitation on dissolved As at all depths. ...................... 91
Figure 2-55. Horseshoe Bend water quality comparisons of selected constituents, 2000-2010. ................................................................................................................................ 93

vii
Figure 3-1. West Camp monitoring sites location map. ..................................................... 95
Figure 3-2. Annual amount of water pumped from the West Camp system...................... 96
Figure 3-3. Annual water-level changes for West Camp site ............................................ 97
Figure 3-4. Water-level hydrographs for West Camp mines. ............................................ 98
Figure 3-5. Water-level hydrographs for West Camp wells BMF96-1D, BMF96-1S, and BMF96-4. ........................................................................................................................ 101
Figure 3-6. Area of the West Camp affected by basement flooding problems, 1960s. Blue hatch area outlines problem locations. .................................................................... 102
Figure 3-7. Water-level hydrographs for BMF96 series wells. ........................................ 103
Figure 3-8. Water-level hydrographs for wells BMF96-2 and BMF96-3, 2002-2010. ... 103
Figure 3-9a. Iron and manganese concentrations in the West Camp mines. .................. 105
Figure 3-9b. Arsenic and zinc concentrations in West Camp mines. .............................. 106
Figure 3-10. Selected water chemistry for West Camp well BMF96-4. .......................... 107
Figure 4-1. Outer Camp monitoring sites location map. .................................................. 109
Figure 4-2. Outer Camp sites annual water-level change. ............................................... 111
Figure 4-3. Water-level hydrograph for the Orphan Boy Mine and Montana Tech well. .. 112
Figure 4-4. Water-level hydrograph for the Marget Ann Mine and well S-4. ................... 113
Figure 4-5. Iron and manganese concentrations for the Orphan Boy Mine. ..................... 114
Figure 4-6. Arsenic and zinc concentrations for the Orphan Boy Mine. ........................... 114
Figure 5-1. East Camp Park monitoring wells location map. ............................................ 118
Figure 5-2. Park wells annual water-level changes. ........................................................ 119
Figure 5-3. Water-level hydrograph for the Hebgen Park well. ........................................ 119
Figure 5-4. Water-level hydrograph for Parrot Park well. ............................................... 120
Figure 5-5. Water-level hydrographs for Parrot Park and Hebgen Park wells. ................. 121
Figure 5-6. Water-level hydrograph for Belmont Well #1. .............................................. 122
viii
Figure 5-7. Hydrograph showing average daily water-level elevations for the Belmont Well #1. ................................................................................................................................. 123
Figure 5-8a. Cadmium and copper concentrations for the Parrot Park well. ................... 124
Figure 5-8b. Arsenic and zinc concentrations for the Parrot Park well. .......................... 124
Figure 6-1. Figure showing projected Berkeley Pit filing rate and dates of treatment review and upgrades. ................................................................................................................. 126
ix
List of Tables Table 1.3.1 Butte Precipitation Statistics, 1982-2010. .................................................. 8
Table 2.1.1.1 AMC-Series Wells ................................................................................... 13
Table 2.1.1.2. Exceedences and trends for AMC series wells, 2010 .............................. 19
Table 2.1.2.1. Annual water-level change in LP-Series wells (ft). .................................. 22
Table 2.1.2.2 Exceedences and trends for LP series wells, 2010 ................................ 31
Table 2.1.3.1 Annual water-level changes in MR97-series wells. (ft) .......................... 31
Table 2.1.4.1 Annual water-level changes in GS and BMF05-series wells. (ft) ........... 40
Table 2.1.4.2 ...... Mean concentrations of analytes that exceed water-quality standards, well BMF05-1. ......................................................................................................................... 45
Table 2.2.1 Annual water-level changes in East Camp mines, in feet. ...................... 47
Table 2.2.1.1 RI/FS bedrock well annual water-level change, in feet. ........................ 58
Table 2.2.1.1.1 Exceedences and recent trends for East Camp bedrock wells, 1989 through 2010. ................................................................................................................... 68
Table 2.3.1 Summary of Events impacting Berkeley Pit Filling Rates. ....................... 73
Table 2.3.2. East Camp Points of Compliance and Depth Below CWL, December 2010. ......................................................................................................................................... 74
Table 2.3.1.4.1 Water composition that currently represents the Berkeley Pit Lake System. ......................................................................................................................................... 84
Table 2.3.1.4.2 Water quality changes to Precipitation plant influent. ............................... 87
Table 2.3.2.1 Selected chemistry from Berkeley Pit and Horseshoe Bend waters. ......... 92
Table 3.1.1 Annual quantity of water pumped from the West Camp, in acre-feet. ..... 96
Table 3.2.1 Annual water-level changes for the West Camp sites, in feet. ............... 100
Table 4.1.1 Annual water-level changes for the Outer Camp sites, in feet. ................ 110
Table 5.1.1 Annual water-level change for miscellaneous wells, in feet. .................... 115

x
Executive Summary
The Record of Decision and Consent Decree for the Butte Mine Flooding Operable Unit stipulates that a yearly update of data collected from the Post Remedial Investigation/Feasibility Study and Consent Decree monitoring program be prepared. The report is to incorporate the most recent year’s data with existing information. This report presents data collected during the year 2010, combined with data collected since 1982, when the Anaconda Company suspended underground mine dewatering and mining in the Berkeley Pit.
Major observations and developments discussed in this report are:
1. The annual Berkeley Pit model was updated taking into account the continued diversion of Horseshoe Bend drainage water away from the pit, discharge of sludge from the treatment plant into the pit, and the addition of storm water flow from the Butte Hill. The projected date when the 5,410-foot water-level elevation would be reached at the Anselmo Mine was modified from December 2022 (2009 Report) to February 2023, a change of -0.16 years (-2 months);
2. West Camp pumping activities continue to maintain the groundwater level below the 5,435-foot elevation, stipulated in the 1994 Record of Decision. The volume of water pumped in 2010 was up 3 percent from 2009 (253 vs. 247 acre-ft). As a result of more water pumped during 2010, water levels decreased between 1.26-ft and 1.94-ft throughout the West Camp underground system; and
3. Water-quality variations in East Camp alluvial wells LP-9 and LP-17 continued. Both wells were sampled once during 2010 and metal concentrations remain very elevated, however concentrations decreased from 2009 levels. Nitrate concentrations decreased by 30 percent in 2010; however they are still 7 times the recommended standard.

xi
Previous reports include: MBMG 376 Duaime, Metesh, Kerschen, Dunstan 1998
MBMG 409 Metesh, Duaime 2000
MBMG 410 Duaime, Metesh 2000
MBMG 435 Duaime, Metesh 2001
MBMG 456 Metesh, Duaime 2002
MBMG 473 Duaime, Metesh 2003
MBMG 489 Duaime, Metesh 2004
MBMG 518 Duaime, Metesh 2005
MBMG 527 Duaime, Metesh 2005
MBMG 549 Duaime, Metesh 2006
MBMG 566 Duaime, Tucci 2007
MBMG 577 Duaime, Tucci 2008
MBMG 589 MBMG 599
Duaime, Tucci Duaime, Tucci
2009 2011
Total and yearly water-level changes for all sites are presented along with hydrographs for
selected sites. Water-quality data follow the presentation of water-level data in each section where water-quality data are available, as not all sites are sampled.
Monitoring and sampling activities performed during 2010 reflect the long-term program outlined in the 2002 Consent Decree. Therefore, some monitoring sites that were part of the early monitoring program have been deleted, while others have been added. There have been some minor organizational changes in this year’s report in an effort to make it more readable.

xii
List of acronyms used in text AMC Anaconda Mining Company ARCO Atlantic Richfield Company BP/ARCO British Petroleum/Atlantic Richfield Company BMFOU Butte Mine Flooding Operable Unit CD Consent Decree CWL Critical Water Level DEQ Montana Department of Environmental Quality EPA U.S. Environmental Protection Agency GPM Gallons per Minute GWIC MBMG Ground Water Information Center HSB Horseshoe Bend Drainage HSB Falls Horseshoe Bend Falls MBMG Montana Bureau of Mines and Geology MCL Maximum Contaminant Level MGD Million Gallons per Day MR Montana Resources MSD Metro Storm Drain MSL Mean Sea Level ORP Oxidation-Reduction Potential RI/FS Remedial Investigation/Feasibility Study ROD Record of Decision SC Specific Conductance at 250C SMCL Secondary Maximum Contaminant Level

1
Butte Mine Flooding Operable Unit Water-Level Monitoring and Water-Quality Sampling
2010 Consent Decree Update Butte, Montana
1982-2010
SECTION 1.0 SITE BACKGROUND
Butte has a long history of mining dating back to 1864 with the development of gold placers in Missoula and Dublin gulches and along Silver Bow Creek, (Miller, 1978). Placer mining only lasted for a short period of time. It was followed by the development of silver mining in 1866 (Miller, 1978). The major silver deposits were developed in the early 1870s and consisted of such mines as the Alice, Travona, Lexington and Colusa. However, with the repeal of the Sherman Silver Purchase Act in 1893, and the presence of high-grade copper outcrops, Butte mining shifted its focus to the development of copper deposits.
Mining expanded and mines deepened as mining companies followed the rich copper veins. With the expanded mining, improved methods to handle groundwater became a major concern; therefore, the mining companies began interconnecting mines to drain water to central pump stations to improve efficiency (Daly and Berrien, 1923). The Anaconda Copper Mining Company, which would eventually control a majority of the underground mines, began interconnecting selected mine levels for draining water to a central pump station as early as 1901. This water, which was acid in nature and contained high concentrations of dissolved minerals, necessitated specialized pumps and piping to transport the water. Once the water reached the surface it was routed to a precipitation plant for recovery of copper. Once the copper was removed from the water, the water was discharged to Silver Bow Creek. This practice of discharging untreated, acidic, metal-laden water to Silver Bow Creek continued until the late 1950s when the Anaconda Company began adding lime to the water to raise the pH and reduce the mineral content of the water (Spindler, 1977).
The cost of mining increased as the mines deepened and the ore grades lessened. Therefore, the Anaconda Company began open-pit mining operations in the Berkeley Pit in July 1955. As the open-pit mining expanded, it consumed some of the primary underground mines (figure 1-1) that were important to Butte’s early development.

2
Figure 1-1. Map showing location of selected underground mines engulfed by development and expansion of the Berkeley Pit.

3
Mines located in the areas described by Sales (1914) as the Intermediate and Peripheral Zones, were shut down and eventually sealed off from the remainder of the operating mines. These areas were isolated from the working mines to reduce the amount of water pumped from the underground workings and to lessen the required amount of fresh air brought into the mines for worker safety.
Active underground mining continued in the Kelley and Steward Mines until 1975 (Burns, 1994) when the Anaconda Company ceased underground mining operations; however, they continued to operate the underground pumping system, which not only kept the mines dewatered, but also did the same for the Berkeley Pit. When the Anaconda Company discontinued selective underground vein mining they eventually allowed the lower-most mine workings to flood to a level just below the 3,900-level pump station in 1977.
Open-pit mining expanded to east of the Berkeley Pit with the development of the East Berkeley Pit in 1980 (Burns, 1994). This open-pit mine was developed to remove both copper and molybdenum reserves. The Berkeley Pit continued to operate until shortly after the Anaconda Company’s announcement in April 1982 that they were no longer going to operate the Kelley Mine pump station. When the pumping suspension was announced, the pump station was removing up to 5,000 gallons per minute (gpm) of water. The East Berkeley Pit continued to operate until June 30, 1983 when the Anaconda Company closed all its Butte mine operations.
The Anaconda Company, which had been purchased by the Atlantic Richfield Company (ARCO) in 1977, sold its Butte operations to Dennis Washington in December 1985, who then formed Montana Resources (MR) (Burns, 1994), renaming the East Berkeley Pit the Continental Pit. MR resumed mining in the Continental Pit in July 1986.
Section 1.1 Introduction
The Anaconda Company announced on April 23, 1982 the suspension of pumping operations at the Kelley Mine pump station, located at the 3,900-level of the mine. (The 3,900-level pump station was located at a depth of ~3,600 ft below ground surface.) At the same time, the Anaconda Company also announced the suspension of mining in the Berkeley Pit, beginning May 1982. However, they continued to operate the East Berkeley Pit (now referred to as the Continental Pit) until June 30, 1983, when they announced a suspension of all mining operations in Butte.
The Anaconda Company developed and implemented a groundwater monitoring program following the 1982 suspension of mining. This program included a number of mine shafts, alluvial dewatering

4
wells, existing domestic and irrigation wells, along with a number of newly installed alluvial monitoring wells. Monitoring included water-level measurements and water-quality sampling. This monitoring program continued until changes were made as part of the Butte Mine Flooding Operable Unit (BMFOU) Superfund investigation.
The U.S. Environmental Protection Agency (EPA) and the Montana Department of Environmental Quality (DEQ) approved and oversaw the BMFOU Remedial Investigation/Feasibility Study (RI/FS) that ran from the fall of 1990 through the spring of 1994. Major tasks of the RI/FS included the installation of a number of new monitoring wells, both bedrock and alluvial. Access was also gained into several previously capped underground mines for monitoring purposes. The 1994 Record of Decision (ROD) included a monitoring program that included portions of the 1982 Anaconda Company monitoring network, portions of the RI/FS monitoring network, and portions of a supplemental surface water and groundwater network operated by the Montana Bureau of Mines and Geology (MBMG) since the summer of 1983.
The ROD included provisions for: 1) continued monitoring and sampling of both groundwater and surface water, 2) diversion of the Horseshoe Bend Drainage (HSB) water away from the Berkeley Pit (to slow the pit-water filling rate), 3) incorporation of the HSB water in the MR mining operations for treatment, 4) construction of a water treatment plant if changes in mining operations prevent treatment of HSB water (e.g. mine shutdown), and 5) establishment of a maximum water level to which water in the underground mines and Berkeley Pit can rise before a water treatment plant must be built and in operation.
The ROD monitoring program consisted of 73 monitoring wells, 12 mine shafts, and three surface water-monitoring sites, which can be broken down into the following categories:
1) East Camp bedrock wells – 18; 2) East Camp Mines – 7; 3) East Camp alluvial wells within active mine area – 19; 4) East Camp alluvial wells outside active mine area – 31; 5) West Camp mines – 3; 6) West Camp monitoring wells – 5; and 7) Outer Camp mines – 2.
The final monitoring network described in the 2002 Consent Decree (CD) replaced this monitoring network. The current monitoring program includes 63 monitoring wells, 11 mine shafts, and four surface-water sites. The Berkeley Pit and Continental Pit, as appropriate, are also part of the

5
monitoring network. The monitoring network can be broken down into the following categories: 1) East Camp bedrock wells – 13; 2) East Camp mines – 6; 3) East Camp alluvial wells within the active mine area – 22; 4) East Camp alluvial wells outside the active mine area – 16; 5) Bedrock wells outside active mine area – 4; 6) West Camp mines – 3; 7) West Camp wells – 6; 8) Outer Camp mines – 2; and 9) Outer Camp wells – 2.
The 1994 ROD and 2002 CD established separate critical maximum water levels (CWLs) for the East Camp bedrock system and West Camp bedrock system, while the 2002 CD specified compliance points that groundwater levels could not exceed. In the East Camp bedrock system, the maximum water level cannot exceed an elevation of 5,410 ft (mean sea level (msl), USGS NAD 27 datum) at any of the eight compliance points, while in the West Camp bedrock system, the maximum water level cannot exceed an elevation of 5,435 ft msl (USGS NAD 27datum) at well BMF96-1D. The compliance points in the East Camp consist of the following mine shafts and bedrock monitoring wells:
1) Anselmo 2) Granite Mountain 3) Kelley 4) Pilot Butte 5) Belmont Well #2 6) Bedrock Well A 7) Bedrock Well C 8) Bedrock Well G In addition to the compliance point stipulations, water levels in the East Camp bedrock system
must be maintained at a level lower than the West Camp water levels. (Refer to the CD and Explanation of Significance Differences to see the entire scope of activities addressed in the CD and an explanation of differences from items contained in the 1994 ROD.)
The CD addressed all current and future activities relating to the BMFOU and reimbursed EPA and DEQ for past costs associated with the site. Funding for the continuation of the long-term

6
groundwater, surface water, and Berkeley Pit/Continental Pit monitoring were included in the CD. The monitoring performed by the MBMG is under the direction of DEQ and EPA. British Petroleum/Atlantic Richfield Company (BP/ARCO) and the Montana Resources Group agreed in the CD to be responsible for all costs associated with the design, construction, operation, and maintenance of a water-treatment plant for treating HSB, Berkeley Pit, and other contaminated waters associated with the site.
The present study is the fifteenth such report, summarizing 29 years of data collection. Notable changes and a comparison of trends for water levels and water quality are discussed. This report does not present a detailed overview of the history of mining on the Butte Hill, nor the Superfund processes that have been followed since the EPA designated the flooding underground Butte Mines and Berkeley Pit a Superfund site in 1987. The reader is referred to the Butte Mine Flooding RI/FS, Butte Mine Flooding ROD, Butte Mine Flooding CD, and MBMG Open-File Report No. 376 for greater detail and information about the site.
Monitoring activities continued in 2010 in the East Camp, West Camp and Outer Camp systems (fig. 1-2). The East Camp System includes mines and mine workings draining to the Kelley Mine pump station when mining and dewatering were suspended in 1982. The West Camp System includes mines and underground workings that historically drained to the East Camp from the southwest portion of the Butte mining district, but were hydraulically isolated by the placement of bulkheads within the interconnected mine workings to separate the West Camp from the East Camp. The Outer Camp System consists of the western and northern extent of mine workings that were connected to the East Camp at some time, but were isolated many decades ago, with water levels returning to, or near, pre-mining conditions.
By the time water levels in the underground mines reached the elevation of the bottom of the Berkeley Pit in late November 1983, more than 66 percent of the underground workings had been flooded. More than 82 percent of the underground mine workings have been inundated with water through 2010. The upper 15 percent of the underground workings will never be flooded as they are at elevations above the specified CWL; therefore less than 3 percent of the underground workings remain to be flooded.
7
Figure 1-2. The mines of the Butte hill are presently considered in three groups: the East Camp, which includes the Berkeley Pit and the area east; the West Camp in the southwest part of the hill; and the Outer Camp which includes the outlying mines.

8
Section 1.2 Notable 2010 Activities and Water-Level and Water-Quality Observations
For the third consecutive year nothing significant occurred, i.e. earthquake, landslide or mine exploration, that had a dramatic impact on water levels or water-quality conditions throughout the monitoring network. The main activities and observations for 2010 are listed below:
(1) Montana Resources (MR) continued mining and milling operations throughout 2010 following their November 2003 resumption of mining.
(2) East Camp alluvial wells LP-9 and LP-17 had a decrease in metal concentrations from 2009 concentrations; however, they are considerably higher than previous levels (pre-2003).
(3) West Camp pumping rates were increased slightly from last year; as a result, water levels decreased in West Camp mines.
Section 1.3 Precipitation Trends
Total precipitation for 2010 was 14.86 inches, compared to 11.87 inches in 2009. The 2010 amount is 2.13 inches above the long-term (1895-2010) average. Precipitation totals have been below average for nine of the past twelve years and seventeen of the last twenty-nine years. The 2010 precipitation total was an increase of sixteen percent above the long-term average of 12.73 inches. Table 1.3.1 contains monthly precipitation statistics from 1982 through 2010, while figure 1-3 shows this information graphically in comparison to the long-term yearly average. Overall precipitation totals, since flooding of the mines began, are very similar to the long-term average (12.59 inches vs. 12.73 inches). Figure 1-4 shows departure from normal precipitation from 1895 through 2010.
Table 1.3.1 Butte Precipitation Statistics, 1982-2010.
JAN FEB MAR APR MAY JUN JUL AUG SEP OCT NOV DEC
ANNUAL
Mean 0.47 0.43 0.74 1.10 1.96 2.27 1.35 1.37 1.01 0.78 0.60 0.52 12.59Std. Dev. 0.33 0.29 0.40 0.69 0.79 1.18 1.07 0.89 0.68 0.56 0.39 0.38 2.95Maximum 1.40 1.26 1.84 3.20 3.88 4.62 4.18 3.10 2.56 2.21 1.50 1.99 19.96Minimum 0.09 0.11 0.11 0.00 0.81 0.50 0.00 0.09 0.07 0.00 0.07 0.01 8.32Number of years precipitation greater than mean 12
Number of years precipitation less than mean 17

9
12.8
3
12.5
5
10.9
7
9.49
12.8
1
12.8
0
8.32
13.7
5
9.81
10.9
8
11.6
0
17.9
5
12.0
8
19.2
6
17.1
0
19.9
6
15.4
7
11.5
1
9.40
10.8
1
10.2
9
9.67
10.8
7
13.2
4
12.1
3
12.7
2
10.0
9
11.8
7
14.8
6
0.00
5.00
10.00
15.00
20.00
25.00
1982 1984 1986 1988 1990 1992 1994 1996 1998 2000 2002 2004 2006 2008 2010
Year
Yea
rly P
reci
pitat
ion (in
)
Yearly Total 1895-2010 Mean
1895-2010 Mean 12.73"
Figure 1-3. Yearly precipitation totals 1982-2010, showing 1895-2010 mean.
-60.00
-40.00
-20.00
0.00
20.00
40.00
60.00
80.00
1895
1900
1905
1910
1915
1920
1925
1930
1935
1940
1945
1950
1955
1960
1965
1970
1975
1980
1985
1990
1995
2000
2005
2010
Perc
ent D
iffere
nce
Fro
m A
vera
ge
Year
2007 precipitation difference (<0.5%) to small to see on graph
Figure 1-4. Percent precipitation variation from normal, 1895-2010.

10
SECTION 2.0 EAST CAMP SYSTEM
The East Camp is comprised of that portion of the bedrock aquifer affected by underground mine dewatering in 1982 and the overlying shallow alluvial aquifer (fig. 2-1). The East Camp Bedrock Monitoring System consists of the Anselmo, Belmont, Granite Mountain, Kelley, Steward, Lexington and Pilot Butte Mines, and the Berkeley Pit. It also includes the bedrock system adjacent to the East Camp mines and the shallow East Camp alluvial system. The East Camp alluvial system includes the alluvial aquifer within the active mine area and a portion of the alluvial aquifer outside the active mine area, primarily to the south. The East Camp alluvial system is discussed first, followed by the East Camp bedrock system.
Section 2.1 East Camp Alluvial System
The East Camp alluvial groundwater monitoring system consists of the LP- and MR97-series wells that are located within the active mine area, plus selected AMC, GS, AMW, and BMF05 series wells. All of the wells associated with the latter four groups are located south of the active mine area, with the exception of wells AMC-5 and AMC-15, which are located within the mine area. Each group of wells represents sites installed or monitored during different studies that have been incorporated in the BMFOU-CD monitoring program. Water-level elevations and monthly precipitation amounts are shown on hydrographs for selected wells. Water-quality results are shown and discussed for the sampled wells. Unlike the water-level monitoring program, water-quality sampling did not occur at every East Camp monitoring well and takes place only once or twice per year. Four new alluvial monitoring wells were installed within the East Camp system during late 2005 and early 2006 as stipulated in the 2002 Consent Decree. These wells replaced domestic wells that were monitored from 1997 through 2002. The wells were situated in areas where data gaps existed and were equipped with transducers for increased water-level data collection. The new wells were identified as BMF05 and are discussed with the GS-series wells. Water-quality samples were collected quarterly throughout 2007 (to help establish baseline conditions) and semi-annually thereafter.
Water-level conditions and water-quality characteristics vary throughout the alluvial system. Wells within or adjacent to historic mining activities show trends relating to the influence of those activities, i.e. elevated metal concentrations. Sites outside historic mining areas reflect conditions more typical of the regional hydrogeology.

11
Figure 2-1. East Camp monitoring sites.

12
Section 2.1.1 AMC-Series Wells
The locations of the Anaconda Mining Company (AMC) wells are shown on figure 2-2; table 2.1.1.1 lists the annual water-level changes for these sites. Water levels decreased in four of seven AMC series wells for 2010, with one well (AMC-10) remaining dry. This well has been dry since its installation in 1983. The decrease in water levels for 2010 is a change from recent trends. Water levels had a net decline during the first 20 years of monitoring; however they had a net rise during six of the past eight years. The overall water-level change is a net decline in six wells, with one well dry. Net declines vary from 3 ft to more than 25 ft.
Well AMC-5 is located within the active mine area, while wells AMC-6, and AMC-8 are located south of the active mine area and the Butte Concentrator facility (fig. 2-2). Well AMC-12 is located southwest of these wells. Hydrographs for wells AMC-5, AMC-12 (fig. 2-3) and AMC-6 and AMC-8 (fig. 2-4) show the long-term trends in the shallow alluvial groundwater system south of the pit. Monthly precipitation amounts are shown as bars and are plotted on the right-hand y-axis.
Well AMC-5 exhibited the greatest water-level increase following MR’s resumption of mining in 2003, followed by two years of water-level decline. This well is located just north of the Emergency Pond in the west corner of the concentrator yard (fig. 2-2). This pond received considerable inputs of fresh water prior to MR’s start-up in the fall of 2003. The water-level trend for 2003-2005 shown on figure 2-3 for this well is similar to the trend seen in 1986-1987, which coincides with the start-up of mining following ARCO’s 1983 suspension of mining. It is apparent that filling the Emergency Pond with make-up water for milling operations has a considerable influence on alluvial water levels in the immediate area. The water level in well AMC-5 began to rise in the summer of 2006 following increased precipitation in April and June. The water level continued to rise throughout the remainder of the summer before leveling off in the fall; water levels rose again in early 2007 before stabilizing the remainder of the year. While the initial water-level increases coincide somewhat with early spring precipitation, the overall water-level trends for 2006 through 2010 do not appear to completely respond to seasonal precipitation changes; it is more likely a response to operational changes within MR’s water-handling system.

13
Table 2.1.1.1 AMC-Series Wells
Year AMC-5 AMC-6 AMC-8 AMC-10 AMC-12 AMC-13 AMC-151983 -23.75 -2.30 -4.90 DRY 0.20 0.60 -5.801984 -4.50 -2.55 -3.75 DRY -1.80 -1.10 -3.401985 -3.60 -4.05 -2.55 DRY -2.75 -2.15 -2.901986 6.10 2.40 -0.40 DRY 0.10 -0.20 -1.601987 0.10 0.60 1.30 DRY 0.70 0.20 0.301988 0.20 -0.60 -0.20 DRY -0.10 -1.00 0.801989 -2.30 -0.80 -0.90 DRY -0.20 -0.10 0.101990 0.20 0.10 0.30 DRY 1.10 0.00 -0.101991 0.00 0.30 0.80 DRY -0.60 0.30 -0.301992 0.40 -0.40 0.50 DRY -0.30 0.00 -0.10Change Yrs 1-10 -27.15 -7.30 -9.80 0.00 -3.65 -3.445 -13.00 1993 0.40 0.70 0.80 DRY 1.10 1.00 -0.40 1994 0.64 0.53 0.91 DRY -0.19 -0.50 0.961995 0.64 1.01 0.51 DRY 1.23 1.13 0.971996 -0.05 0.62 2.14 DRY 0.74 0.69 2.601997 1.80 1.47 2.24 DRY 1.20 0.70 2.801998 -1.52 0.42 0.40 DRY 0.18 0.09 0.581999 -1.56 -2.03 -1.70 DRY -1.56 -1.09 -1.502000 -2.46 -2.56 -3.88 DRY -1.77 -1.17 -3.732001 -1.89 -1.92 -3.03 DRY -0.55 -0.36 -2.342002 -0.89 -1.25 -1.77 DRY -0.98 -0.73 -1.65Change Yrs 11-20 -4.89 -3.01 -3.38 0.00 -0.60 -0.24 -1.71
2003 6.97 3.50 0.97 DRY 0.53 0.03 0.37 2004 -1.13 0.44 1.42 DRY -0.37 -0.42 0.382005 -1.68 -1.06 -0.45 DRY -0.51 -0.22 -0.762006 0.73 0.97 2.72 DRY 1.24 0.72 1.722007 1.07 0.63 1.14 DRY 0.32 0.55 1.122008 -0.23 -0.50 -0.26 DRY -0.06 -0.42 0.702009 0.05 0.57 2.53 DRY 0.04 1.02 0.352010 0.49 -0.03 -0.37 DRY -0.10 -0.63 1.25Year AMC-5 AMC-6 AMC-8 AMC-10 AMC-12 AMC-13 AMC-15Change Yrs 21-28 6.27 4.52 7.70 0.00 1.09 0.63 5.13
Net Change -25.77 -5.79 -5.48 0.00 -3.16 -3.06 -9.58

14
Figure 2-2. AMC well location map.
15
5425
5430
5435
5440
5445
5450
5455
5460
5465
5470
547501
/12/
83
10/1
3/83
07/2
5/84
04/1
9/85
01/3
1/86
10/2
9/86
07/3
0/87
04/2
7/88
01/3
0/89
11/0
3/89
07/3
1/90
05/0
2/91
01/3
1/92
11/0
5/92
07/2
9/93
05/0
1/94
02/0
1/95
11/0
1/95
08/0
1/96
05/0
1/97
01/2
9/98
10/2
9/98
07/2
9/99
04/2
7/00
01/3
0/01
10/3
0/01
07/3
1/02
05/0
1/03
01/3
0/04
10/2
9/04
07/2
8/05
04/2
7/06
01/3
1/07
10/2
9/07
08/0
5/08
04/2
8/09
01/2
9/10
10/2
8/10
Date
Wat
er-
Le
vel E
lev
atio
n (
ft)
0.00
0.50
1.00
1.50
2.00
2.50
3.00
3.50
4.00
4.50
5.00
Mo
nth
ly P
rec
ipit
atio
n (
in)
Monthly Precipitation AMC-5 AMC-12
Figure 2-3. Water-level hydrographs for wells AMC-5 and AMC-12.
Well AMC-6 is directly south of the concentrator facility and the Emergency Pond. Water-level trends during 2003-2004 were similar to those seen in 1986-1987 following the resumption of mining. However, water levels in 2005 appear to be less influenced by water levels in the Emergency Pond. Water levels in this well continued their strong downward trend that began the fall of 2004 through the summer of 2005. Beginning late spring 2005, minor water-level increases (one foot or less) occurred which might be in response to precipitation events (fig. 2-4). Water levels have risen each spring since 2006 following precipitation events, while falling in the autumn. The water-level response in this well appears to be more strongly influenced by seasonal precipitation conditions, even though this well had a net water-level increase for 2006, 2007 and 2009 and precipitation totals were below average.
The water-level trend from 2003 through 2005 in well AMC-8 (fig. 2-4) was very similar to the 1986-1988 time period, with water levels declining following a period of increase associated with the resumption of mining. While water levels had a net decline for 2005 there was a slight increase during the late fall-early winter that originally appeared to have been in response to precipitation events; water

16
levels continued to rise throughout almost all of 2006 and 2007, independent of climatic trends. Water levels continued their upward trend through 2008; however, there was more of a seasonal trend than seen the past several years. Water levels continued their upward trend throughout 2010 with no consistent seasonal variation.
5445
5450
5455
5460
5465
5470
5475
01/1
2/8
3
10/1
3/8
3
07/2
5/8
4
04/1
9/8
5
01/3
1/8
6
10/2
9/8
6
07/3
0/8
7
04/2
7/8
8
01/3
0/8
9
11/0
3/8
9
07/3
1/9
0
05/0
2/9
1
01/3
1/9
2
11/0
5/9
2
07/2
9/9
3
05/0
1/9
4
02/0
1/9
5
11/0
1/9
5
08/0
1/9
6
05/0
1/9
7
01/2
9/9
8
10/2
9/9
8
07/2
9/9
9
04/2
7/0
0
01/3
0/0
1
10/3
0/0
1
07/3
1/0
2
05/0
1/0
3
01/3
0/0
4
10/2
9/0
4
07/2
8/0
5
04/2
7/0
6
01/3
1/0
7
10/2
9/0
7
08/0
5/0
8
04/2
8/0
9
01/2
9/1
0
10/2
8/1
0Date
Wa
ter-
Le
vel E
lev
atio
n (
ft)
0.00
0.50
1.00
1.50
2.00
2.50
3.00
3.50
4.00
4.50
5.00
Mo
nth
ly P
rec
ipit
ati
on
(in
ches
)
Monthly Precipitation AMC-6 AMC-8
Figure 2-4. Water-level hydrographs for wells AMC-6 and AMC-8.
Well AMC-12 water-level variations during 2006-2007 differed from those between 2001 and 2005, with a net water-level rise of more than 3.5 ft (fig. 2-3). These changes in water levels may be related to the completion of construction activities in the nearby Silver Bow Creek (SBC) portion of the Metro Storm Drain (MSD) channel and the periodic discharge of clean water to this channel. Annual water-level changes have been a tenth of a foot or less during 2008-2010. Seasonal trends are noticeable on the well hydrograph.

17
Well AMC-13 is located on the west side of Clark Park, south of wells GS-44S and GS-44D. This well’s hydrograph shows both a response to precipitation events and possibly lawn watering (fig. 2-5a). Water levels began to rise in late spring and continued throughout the summer, before starting to decline in the fall. This trend is similar to that of prior years showing typical seasonal changes.
5448
5450
5452
5454
5456
5458
5460
5462
5464
5466
5468
01/1
2/83
11/0
9/83
09/2
4/84
07/2
3/85
05/2
8/86
03/2
6/87
01/2
9/88
12/0
1/88
10/0
5/89
07/3
1/90
06/0
3/91
03/3
1/92
01/3
0/93
10/0
1/94
08/0
1/95
06/0
1/96
04/0
1/97
01/2
9/98
11/3
0/98
09/2
9/99
07/2
7/00
05/3
0/01
03/2
6/02
01/3
1/03
11/2
5/03
09/2
9/04
07/2
8/05
05/3
1/06
03/2
8/07
01/3
0/08
12/0
5/08
10/0
1/09
07/2
8/10
Wat
er-
Lev
el E
leva
tio
n (
ft)
0.00
0.50
1.00
1.50
2.00
2.50
3.00
3.50
4.00
4.50
5.00
Pre
cip
itat
ion
(in
)
Precip SWL2.5(a) AMC-13
2.5(b) AMC-15
5460
5462
5464
5466
5468
5470
5472
5474
5476
5478
5480
01/1
2/83
11/0
9/83
09/2
4/84
07/2
3/85
05/2
8/86
03/2
6/87
01/2
9/88
12/0
1/88
10/0
5/89
07/3
1/90
06/0
3/91
03/3
1/92
01/3
0/93
10/0
1/94
08/0
1/95
06/0
1/96
04/0
1/97
01/2
9/98
11/3
0/98
09/2
9/99
07/2
7/00
05/3
0/01
03/2
6/02
01/3
1/03
11/2
5/03
09/2
9/04
07/2
8/05
05/3
1/06
03/2
8/07
01/3
0/08
12/0
5/08
10/0
1/09
07/2
8/10
Date
Wat
er-
Lev
el E
leva
tio
n (
ft)
0.00
0.50
1.00
1.50
2.00
2.50
3.00
3.50
4.00
4.50
5.00
Pre
cip
itat
ion
(in
)
Figure 2-5. Water-level hydrographs for wells AMC-13 (a), and AMC-15 (b).
Well AMC-15 is located on the west side of the Hillcrest waste dump (fig. 2-2) in an area where reclamation has taken place. Water in this well is much deeper (90 ft) compared to the other AMC wells, and the hydrograph reflects this. There were minor seasonal changes in water levels for a number of years. The influence of the recent below-normal precipitation is shown by the steep decline in water levels beginning in late 1999 (fig. 2-5b), when this well did not show any significant response to precipitation. The water-level decline began leveling off in mid-2003, when the water level rose almost

18
one-half foot from September through December 2003. The water level continued to rise (0.43 ft) throughout 2004, before declining in 2005. The water level remained static or declined slightly through the spring of 2006, before rising in July. Water levels continued to rise through the remainder of 2006 and most of 2007, for a net increase of 1.76 ft and 1.64 ft for 2006 and 2007 respectively. Water levels rose during late summer and early fall during 2008 and 2009 before leveling off, resulting in net yearly water-level increases for 2008 and 2009. Water levels remained mostly unchanged during the first part of 2010 before falling and then steadily rising the last half of the year. The water-level rise resulted in 1.25 ft rise for 2010. This recent trend does not show any consistent response to climatic conditions (above or below normal precipitation).
Section 2.1.1.1 AMC Series Water Quality
Trends of concentrations for chemical constituents for the 2010 data collected from the AMC-series wells are summarized in Table 2.1.1.2. Well AMC-5, just south of the Berkeley Pit, has exceeded maximum containment levels (MCLs) and secondary maximum containment levels (SMCLs) throughout the period of record. The concentrations of most of the dissolved metals have shown a slight downward trend.
AMC-6 shows a continued, consistent trend of decreasing concentrations of nearly all dissolved constituents. Cadmium is the only constituent whose concentration exceeds a drinking water standard. The concentration of sulfate has increased slightly from 175 mg/L in 2004 to 250 mg/L in 2008 (fig. 2-6). Current concentrations have decreased and are well below historic 1980s levels.
The concentrations of dissolved constituents in the 2010 samples in well AMC-8 are consistent with previous results. As in the past, the concentrations of sulfate continue to increase (fig. 2-6). Sulfate concentrations have doubled since the fall of 2006, increasing from 400 mg/L to more than 800 mg/L in November 2010. Cadmium concentrations have increased the past several years and are currently above the MCL.

19
Table 2.1.1.2 Exceedences and trends for AMC series wells, 2010
Well Name Exceedences Concentration Remarks AMC-5 Y Variable High iron, manganese, cadmium, copper and zincAMC-6 Y Downward Downward trend continues AMC-8 Y Variable Increasing sulfate and cadmium AMC-12 Y Downward Very high iron, manganese, cadmium and zincAMC-15 Y Variable Unchanged in recent years, currently only
sampled every two years Access was restored to wells AMC-12 and AMC-15 allowing the wells to be sampled in 2006 and
subsequent years. Well AMC-12 has high-to-very high concentrations of iron, manganese, cadmium, and zinc; this well is located just south of the historic Silver Bow Creek drainage (Metro Storm Drain) which received untreated mine and process water for decades.
As in the recent past, no strong trends are apparent in most of the AMC series wells; however, several show a slight downward trend over the period of record. Overall, metal concentrations in 2010 showed very little change from previous years, the exception being sulfate and cadmium concentrations in well AMC-8 that continue to increase. Wells closest to historic and current mining operations have the highest levels of contamination; well AMC-5 has very high levels of iron, manganese, cadmium, copper, and zinc.

20
Well AMC-6
2.00
3.00
4.00
5.00
6.00
7.00
8.00
04/0
1/83
04/0
1/84
04/0
1/85
04/0
1/86
04/0
1/87
04/0
1/88
04/0
1/89
04/0
1/90
04/0
1/91
04/0
1/92
04/0
1/93
04/0
1/94
04/0
1/95
04/0
1/96
04/0
1/97
04/0
1/98
04/0
1/99
04/0
1/00
04/0
1/01
04/0
1/02
04/0
1/03
04/0
1/04
04/0
1/05
04/0
1/06
04/0
1/07
04/0
1/08
04/0
1/09
04/0
1/10
Date
pH
0
200
400
600
800
1,000
1,200
Su
lfat
e C
on
cen
trat
ion
(m
g/L
)
pH Sulfate
Well AMC-8
2.00
3.00
4.00
5.00
6.00
7.00
8.00
04/0
1/83
04/0
1/84
04/0
1/85
04/0
1/86
04/0
1/87
04/0
1/88
04/0
1/89
04/0
1/90
04/0
1/91
04/0
1/92
04/0
1/93
04/0
1/94
04/0
1/95
04/0
1/96
04/0
1/97
04/0
1/98
04/0
1/99
04/0
1/00
04/0
1/01
04/0
1/02
04/0
1/03
04/0
1/04
04/0
1/05
04/0
1/06
04/0
1/07
04/0
1/08
04/0
1/09
04/0
1/10
Date
pH
0
200
400
600
800
1,000
1,200
Su
lfat
e C
on
cen
trat
ion
(m
g/L
)
pH Sulfate
Figure 2-6. Graphs showing pH and sulfate concentration changes over time for wells AMC-6 (top) and AMC-8 (bottom).

21
Section 2.1.2 LP-Series Wells
The locations of the LP-series monitoring wells are shown on figure 2-7. As discussed in Duaime and others (1998), these wells were installed in 1991 and 1992 as part of the BMFOU RI/FS study. Water-level monitoring and sampling of the LP-series wells continued throughout 2010. Table 2.1.2.1 presents a summary of annual water-level changes for these 17 sites. Well LP-11 was plugged and abandoned in 2001; well LP-03 was plugged and abandoned in 2002 to make room for the HSB water-treatment plant. Wells LP-06 and LP-7, had been dry for over three years, before having a water-level rise during 2004; however, they had a corresponding decline in 2005 and have been dry ever since. Water levels declined in the same five wells (LP-1, LP-4, LP-5, LP-8, and LP-9) during 2007 and 2008 and four of the five in 2009, while declining in only LP-4 and LP-5 in 2010. Well LP-1 had a water-level rise just under one foot in 2010; while the water level rose less than one-tenth of a foot on wells LP-8 and LP-9. Water levels rose in five of the remaining eight wells during 2010. Wells north of the Pittsmont Waste Dump had water-level declines for the year in two wells (LP-4 and LP-5), with declines varying from 1.42 ft to 2.13 ft. Since monitoring began, water levels have experienced a net decline in 13 of the LP series wells, ranging from 0.53 ft in LP-15 to 43 ft in well LP-8. Net water-level increases vary between 3.9 ft and 6.5 ft in the four wells (LP-12, 13, 14 and 17) where water levels have increased.

22
Table 2.1.2.1 Annual water-level change in LP-Series wells (ft).
Year LP-01 LP-02 LP-03 LP-04 LP-05 LP-06 LP-07 LP-08 LP-09 1991 1.23 -0.91 -2.02 1.38 4.35 -1.46 - - -0.70 1992 -1.14 -1.56 -0.66 -1.75 -1.08 0.80 -3.79 -3.78 -7.161993 -0.91 -1.69 1.84 -1.69 -2.42 -0.53 -3.06 -4.83 -2.241994 -0.53 -0.80 -1.61 -0.57 -1.42 -2.28 -1.03 -2.11 -2.901995 -0.08 -0.19 -1.74 2.94 0.34 0.47 4.91 4.30 3.351996 -2.05 -2.00 -0.73 -1.28 -3.40 2.01 -4.30 -1.14 -1.491997 -1.58 -1.86 -0.09 -1.73 -3.32 -1.37 -2.24 -2.63 -0.291998 0.12 0.23 -2.03 1.01 -0.03 -0.58 2.44 0.99 1.601999 -2.24 -1.76 -7.44 -2.64 -3.15 -1.65 -6.47 -3.52 -3.772000 -7.55 -7.16 -5.45 -10.83 -7.87 -0.20 -3.10 -14.03 -13.28
Change Years 1-10 -14.73 -17.70 -19.93 -15.16 -18.00 -3.79 -16.64 -26.75 -26.88
2001 -5.13 -4.73 9.51 -8.88 -5.47 Dry Dry -12.10 -3.042002 -5.21 -3.91 -2.01* -6.03 -4.86 Dry Dry -4.11 -3.462003 -2.29 1.60 P&A* -1.75 -2.00 Dry Dry -0.04 -1.152004 -0.65 0.46 P&A* 13.06 3.85 3.24 Dry 18.13 2.962005 0.81 -0.43 P&A* 4.12 3.40 -3.62 -0.79 2.85 2.082006 -1.43 -0.96 P&A* -2.77 -2.06 Dry Dry -2.35 -0.442007 -0.09 0.14 P&A* -3.39 -2.36 Dry Dry -5.59 -2.372008 -0.02 0.13 P&A* -3.80 -1.61 Dry Dry -7.83 -1.392009 0.48 0.13 P&A* -3.87 -1.59 Dry Dry -5.23 -0.072010 0.96 0.89 P&A* -2.13 -1.42 Dry Dry 0.01 0.06
Change Years 11-20 -12.57 -6.68 -11.52 -15.44 -14.12 -0.38 -0.79 -16.26 -6.82
Net Change -27.30 -24.38 -31.45 -30.60 -32.12 -4.17 -17.43 -43.01 -33.70

23
Table 2.1.2.1 Annual water-level change in LP-Series wells (ft). (cont.)
Year LP-10 LP-11 LP-12 LP-13 LP-14 LP-15 LP-16 LP-17 1991 - - - - - - - - 1992 -0.50 -1.83 0.31 -0.07 0.70 0.54 0.89 - 1993 -0.83 -2.78 1.42 1.11 1.18 1.62 1.83 - 1994 -2.14 1.65 -1.41 -1.47 -0.09 0.26 -1.16 - 1995 -0.57 -0.23 -0.16 0.43 0.18 1.89 3.57 3.10 1996 1.20 0.23 1.87 1.74 2.07 1.79 1.77 1.66 1997 0.23 -0.09 2.42 2.24 2.64 1.99 1.77 2.32 1998 0.92 0.07 1.00 -0.62 0.39 -7.90 -9.69 -2.41 1999 -2.05 -2.12 -2.94 -2.36 -2.73 -4.39 -4.60 -3.95 2000 -1.37 -0.28 -3.60 -2.93 -3.64 -1.73 -2.18 -2.86
Change Years 1-10 -5.11 -5.38 -1.09 -0.93 0.70 -5.93 -7.80 -2.14
2001 0.51 P&A* -1.16 -1.30 -2.31 -0.72 -1.18 -1.50 2002 -0.15 P&A* -1.83 -1.21 -1.65 -0.68 -0.86 -0.67 2003 -2.75 P&A* -1.74 -0.26 0.46 1.08 0.89 0.09 2004 -1.41 P&A* 0.20 0.26 0.95 -0.06 0.52 0.71 2005 4.19 P&A* 1.53 0.78 -0.27 0.27 -0.27 0.26 2006 3.19 P&A* 4.48 2.78 2.95 1.43 1.33 2.68 2007 0.73 P&A* 0.87 0.73 1.22 1.51 1.66 2.54 2008 1.23 P&A* 1.92 1.27 0.29 1.05 0.28 0.94 2009 -0.83 P&A* 3.23 1.97 3.32 1.70 1.47 2.20 2010 -0.77 P&A* 0.09 -0.19 0.53 -0.18 0.27 0.32
Change Years 11-20 3.94 0.00 7.59 4.83 5.49 5.40 4.11 7.57
Net Change -1.17 -5.38 6.50 3.90 6.19 -0.53 -3.69 5.43
(*) Plugged and abandoned

24
Figure 2-7. LP series and MR97 wells location map.

25
5450
5460
5470
5480
5490
5500
Jan-
91M
ay-
Sep
-Ja
n-92
May
-S
ep-
Jan-
93M
ay-
Sep
-Ja
n-94
May
-S
ep-
Jan-
95M
ay-
Sep
-Ja
n-96
May
-S
ep-
Jan-
97M
ay-
Sep
-Ja
n-98
May
-S
ep-
Jan-
99M
ay-
Sep
-Ja
n-00
May
-S
ep-
Jan-
01M
ay-
Sep
-Ja
n-02
May
-S
ep-
Jan-
03M
ay-
Sep
-Ja
n-04
May
-S
ep-
Jan-
05M
ay-
Sep
-Ja
n-06
May
-S
ep-
Jan-
07M
ay-
Sep
-Ja
n-08
May
-S
ep-
Jan-
09M
ay-
Sep
-Ja
n-10
May
-S
ep-
Date
Wat
er-
Lev
el E
leva
tio
n (
ft)
0.00
1.00
2.00
3.00
4.00
5.00
Mo
nth
ly P
reci
pit
atio
n (
in)
Monthly Precipitation LP-01 LP-02
The decline in water levels to the north of the Pittsmont Waste Dump is a substantial change from trends seen in 2004 and 2005, and is more consistent with the water-level trends (decline) observed between 1992 and 2003. The water-level declines had been especially true since the deactivation of the leach pads in 1999. However, as part of its resumption of mining, MR began leaching operations on a limited scale in 2004, continuing periodically throughout 2005. The wells with the greatest water-level rise in 2004 and 2005 (LP-04 and LP-10) are located south and down gradient of the leach pads where the leaching took place. Limited leaching operations were undertaken during 2010 by MR as part of their active mining operations, which might be reflected in minor water-level increases in several wells. Figures 2-8 and 2-9 show water levels over time for five of the LP series wells, which are located south of the leach pads and north of the Pittsmont Waste Dump.
Figure 2-8. Water-level hydrographs for wells LP-01 and LP-02.
26
5460
5470
5480
5490
5500
5510
5520
5530
5540
Jan-
91
Jul-9
1
Jan-
92
Jul-9
2
Jan-
93
Jul-9
3
Jan-
94
Jul-9
4
Jan-
95
Jul-9
5
Jan-
96
Jul-9
6
Jan-
97
Jul-9
7
Jan-
98
Jul-9
8
Jan-
99
Jul-9
9
Jan-
00
Jul-0
0
Jan-
01
Jul-0
1
Jan-
02
Jul-0
2
Jan-
03
Jul-0
3
Jan-
04
Jul-0
4
Jan-
05
Jul-0
5
Jan-
06
Jul-0
6
Jan-
07
Jul-0
7
Jan-
08
Jul-0
8
Jan-
09
Jul-0
9
Jan-
10
Jul-1
0
Date
Wat
er-
Le
vel E
leva
tio
n (
ft)
0.00
1.00
2.00
3.00
4.00
5.00
Mo
nth
ly P
rec
ipit
atio
n (
in)
Precip LP-04 LP-07 LP-08
LP-07 Dry
Water level below bottom of well screen
Water level below bottom of well screen
LP-08
Figure 2-9. Water-level hydrographs for wells LP-04, LP-07, and LP-08.
Wells LP-01 and LP-02 are located near the base of several leach pads and are screened in two different intervals. The wells are screened at depths of 129-159 ft and 177-197 ft, respectively, and are completed in the deeper portion of the alluvial aquifer. Well LP-01 is completed at a deeper depth and, as shown on figure 2-8, water levels steadily declined for the most part since its installation through 2004. Since then water levels have varied slightly with periodic increases followed by declines. The water-level changes in this well have been less erratic in recent years than those seen in the shallow well, LP-02, possibly the result of the increased lag time associated with recharge events. Water levels in wells LP-01 and LP-02 show a greater response to operational practices associated with the leach pads than from climatic changes. This is consistent with interpretations of water-level responses made following MR’s 1999 deactivation of the leach pads.
Figure 2-9 shows water levels over time for wells LP-04, LP-07, and LP-08, which are located south of wells LP-01 and LP-02 and north of the Pittsmont Waste Dump (fig. 2-7).
These wells are completed at different depths also. Well LP-04 is screened from 125 ft to 145 ft below ground surface, while well LP-07 is screened from 90 ft to 95 ft below ground surface, and well

27
LP-08 is screened 81 ft to 96 ft below ground surface. Based upon these well-completion depths, wells LP-07 and LP-08 would be considered to be completed in the upper portion of the alluvial aquifer, while well LP-04 would be considered to be completed in the deeper portion of the alluvial aquifer. The water-level trends are similar for wells LP-04, LP-07, and LP-08. It is interesting to note that while well LP-08 was dry for a period from mid-2003 through mid-2004, the subsequent water-level trend did not vary from that shown for well LP-04 once the water level rose back above the screen interval. It is apparent that the control on water levels is the same on all of these wells and the operation, or lack of operation of the leach pads whichever the case may be, has a much greater influence on water levels than climatic changes as there is very little seasonal variation noticeable on figure 2-9. Well LP-07 has remained dry since the later part of 2000, except for a short period of time in early 2005.
Wells LP-14, LP-15, and LP-16 are located southwest of the Pittsmont Dump (fig. 2-7). A consistent increase in water levels occurred in these wells following their installation in 1992, until the Berkeley Pit landslide of 1998 (fig. 2-10). After that landslide, water levels declined in a similar manner in all three wells until beginning to rise in September 2003 and continuing through May of 2004. Since then water-level changes had been minor until May 2006 when water levels increased at a greater rate. Wells LP-15 and LP-16 are located near one another and were completed as a nested pair, with well LP-15 screened from a depth of 215 ft to 235 ft below ground surface and well LP-16 screened from 100 ft to 120 ft below ground surface. Water-level trends are generally similar in these wells regardless of completion depth; however, water-levels declined in well LP-15 while rising in LP-16 for 2010. Neither of these wells shows any response to climatic conditions, i.e. precipitation events.
Well LP-14 is located south of wells LP-15 and LP-16, and its overall water-level trend had been similar to that seen in wells LP-15 and LP-16. The 2008 seasonal water-level trend did not continue in 2009-2010; water levels had a downward trend for the first half of the year followed by a mostly upward trend throughout the later part of the year, resulting in a 0.53-ft water-level rise for the year.

28
5420
5430
5440
5450
5460
5470
Jan-9
1
Aug
-91
Mar
-92
Oct
-92
May-
93
Dec-
93
Jul-9
4
Feb
-95
Sep
-95
Apr
-96
Nov
-96
Jun-9
7
Jan-9
8
Aug
-98
Mar
-99
Oct
-99
May-
00
Dec-
00
Jul-0
1
Feb
-02
Sep
-02
Apr
-03
Nov
-03
Jun-0
4
Jan-0
5
Aug
-05
Mar
-06
Oct
-06
May-
07
Dec-
07
Jul-0
8
Feb
-09
Sep
-09
Apr
-10
Nov
-10
Date
Wat
er-
Leve
l Ele
vati
on
(ft
)
0.00
1.00
2.00
3.00
4.00
5.00
Mo
nth
ly
Pre
cip
itati
on
(in
)
Precip LP-14
LP-15 LP-16
Figure 2-10. Water-level hydrographs for wells LP-14, LP-15, and LP-16.
The general observation made in the last several yearly reports, that wells between the leach pads and Pittsmont Waste Dump were affected by leach-pad operations, including the 1999 leach-pad dewatering and historic mine dewatering, remains true. Water levels in these LP-series wells were either controlled by the operation and subsequent dewatering of the leach pads, operation of the Yankee Doodle Tailings Dam, by depressed water levels in the Berkeley Pit, or a combination of all three. The water-level response seen in wells adjacent and down-gradient of limited leaching operations during 2004-2005 and 2009-2010 clearly demonstrates the relationship of water-level changes and the leach pads operations. The influence of climatic changes is minimal, at best, on these wells.
An alluvial aquifer potentiometric map (fig. 2-11), constructed using December 2010 water levels, shows how alluvial waters are flowing towards the Berkeley Pit from the north, east and south. Water contaminated by historic mining activities (Metesh, 2000) is flowing towards and into the Berkeley Pit, ensuring that there is no outward migration of contaminated water into the alluvial aquifer.

29
Figure 2-11. Alluvial aquifer potentiometric map for December, 2010 (contour interval is 1 foot).

30
Section 2.1.2.1 LP-Series Wells Water Quality
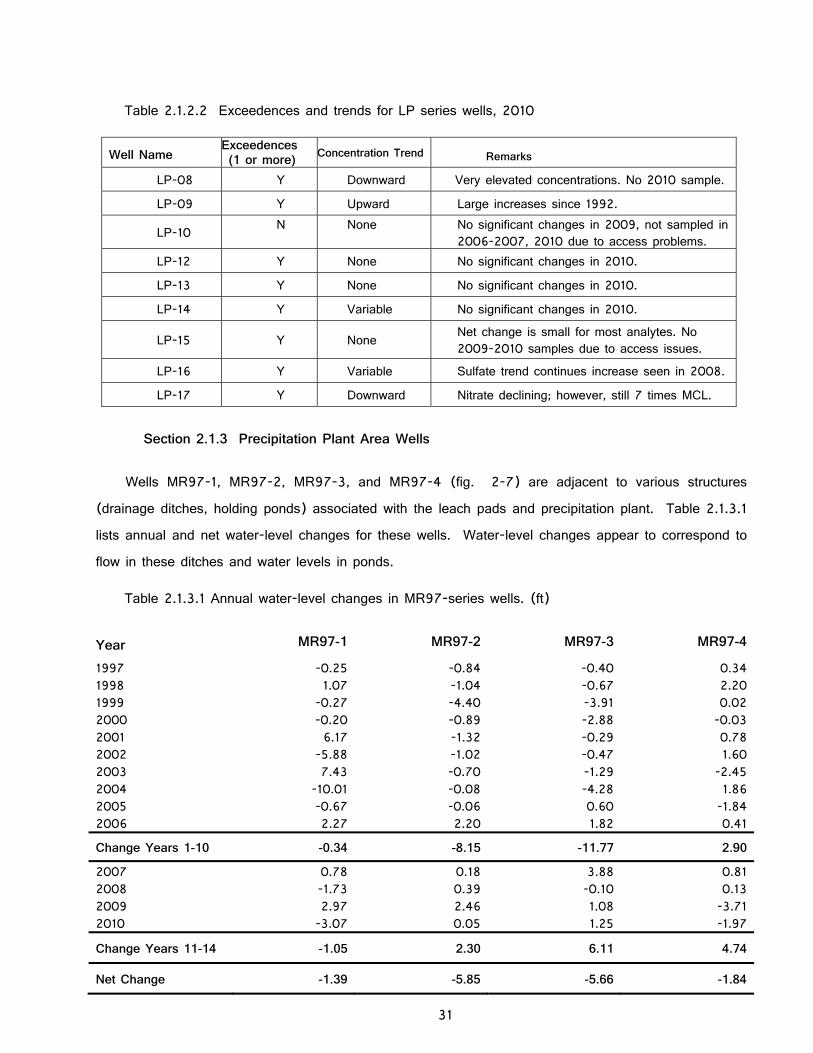
Current water-quality monitoring of the LP-series wells is restricted primarily to those wells west and south of the Pittsmont Dump (fig. 2-7) with the exception of three wells (LP-08, LP-09, and LP-10), which are south of the leach pad area and north of the Pittsmont dump. Water-quality trends in 2010 showed limited changes in several wells; the changes are summarized in Table 2.1.2.2.
Well LP-08 was sampled during the spring 2005-2009 sampling events to determine if water-quality changes seen previously in well LP-09 were occurring further south. While the water in this well was highly contaminated, concentrations were less than historic levels in most cases (i.e. Al 1,710,000 μg/L in 1992 and 1,226,189 μg/L in 2009). However, 2009 concentrations increased somewhat from those seen the past several years. There was insufficient water in the well to sample it in 2010.
Well LP-9 was sampled a half dozen times following its installation in 1992 through 1996 and then not sampled again until April of 2003; it has been sampled yearly since. A comparison of the data indicates large increases in the concentration of most dissolved constituents starting in 1994. Data collected in 2010 show that the increase is sustained (fig. 2-12). The concentration of aluminum increased from <100 μg/L in 1992 to 50,000 μg/L in 2003 continuing upward to concentrations greater than 646,000 μg/L in 2009 (2010 concentrations declined to 350,000 μg/L which are well above pre-2003 levels); cadmium increased from 600 μg/L in 1992 to levels greater than 11,000 μg/L in 2010; and zinc increased from 172,000 μg/L in 1992 to levels greater than 1,700,000 μg/L in 2010. (Zinc concentrations declined somewhat below those seen the past few years, however, they are still an order of magnitude above historic levels.) In general, the concentrations of dissolved metals increased by nearly an order of magnitude over the past six to ten years and approach those values seen in the pregnant solution of the up-gradient leach pads. The trend that first appeared in the 1994 data continued in 2010.
Well LP-17 had the most significant change in trend during 2006-2010 with concentrations of cadmium, copper, and zinc decreasing by 50 percent from 2003-2005 concentrations. Nitrate concentrations were extremely high, however, in the 2006-2009 samples.
The water-quality trend in other LP-series wells generally remained the same in 2010 as in recent years. A summary of exceedences and trends is presented in table 2.1.2.2.
31
Table 2.1.2.2 Exceedences and trends for LP series wells, 2010
Well Name Exceedences (1 or more) Concentration Trend Remarks
LP-08 Y Downward Very elevated concentrations. No 2010 sample.LP-09 Y Upward Large increases since 1992.
LP-10 N None No significant changes in 2009, not sampled in 2006-2007, 2010 due to access problems.
LP-12 Y None No significant changes in 2010. LP-13 Y None No significant changes in 2010. LP-14 Y Variable No significant changes in 2010.
LP-15 Y None Net change is small for most analytes. No 2009-2010 samples due to access issues.
LP-16 Y Variable Sulfate trend continues increase seen in 2008.LP-17 Y Downward Nitrate declining; however, still 7 times MCL.
Section 2.1.3 Precipitation Plant Area Wells
Wells MR97-1, MR97-2, MR97-3, and MR97-4 (fig. 2-7) are adjacent to various structures (drainage ditches, holding ponds) associated with the leach pads and precipitation plant. Table 2.1.3.1 lists annual and net water-level changes for these wells. Water-level changes appear to correspond to flow in these ditches and water levels in ponds.
Table 2.1.3.1 Annual water-level changes in MR97-series wells. (ft)
Year MR97-1 MR97-2 MR97-3 MR97-41997 -0.25 -0.84 -0.40 0.341998 1.07 -1.04 -0.67 2.201999 -0.27 -4.40 -3.91 0.022000 -0.20 -0.89 -2.88 -0.032001 6.17 -1.32 -0.29 0.782002 -5.88 -1.02 -0.47 1.602003 7.43 -0.70 -1.29 -2.452004 -10.01 -0.08 -4.28 1.862005 -0.67 -0.06 0.60 -1.842006 2.27 2.20 1.82 0.41Change Years 1-10 -0.34 -8.15 -11.77 2.902007 0.78 0.18 3.88 0.81 2008 -1.73 0.39 -0.10 0.13 2009 2.97 2.46 1.08 -3.71 2010 -3.07 0.05 1.25 -1.97Change Years 11-14 -1.05 2.30 6.11 4.74
Net Change -1.39 -5.85 -5.66 -1.84

32
2.00
3.00
4.00
5.00
6.00
7.00
Jan-
92
Jan-
93
Jan-
94
Jan-
95
Jan-
96
Jan-
97
Jan-
98
Jan-
99
Jan-
00
Jan-
01
Jan-
02
Jan-
03
Jan-
04
Jan-
05
Jan-
06
Jan-
07
Jan-
08
Jan-
09
Jan-
10
Jan-
11
Date
pH
0
5,000
10,000
15,000
20,000
25,000
Su
lfat
e C
on
cen
trat
ion
(m
g/L
)
pH Sulfate
2.00
3.00
4.00
5.00
6.00
7.00
Jan-
92
Jan-
93
Jan-
94
Jan-
95
Jan-
96
Jan-
97
Jan-
98
Jan-
99
Jan-
00
Jan-
01
Jan-
02
Jan-
03
Jan-
04
Jan-
05
Jan-
06
Jan-
07
Jan-
08
Jan-
09
Jan-
10
Jan-
11
Date
pH
0
500,000
1,000,000
1,500,000
2,000,000
2,500,000
Zin
c C
on
cen
trat
ion
(m
g/L
)
pH Zinc
Figure 2-12. Sulfate (top) and zinc (bottom) concentrations vs. pH in well LP-09.
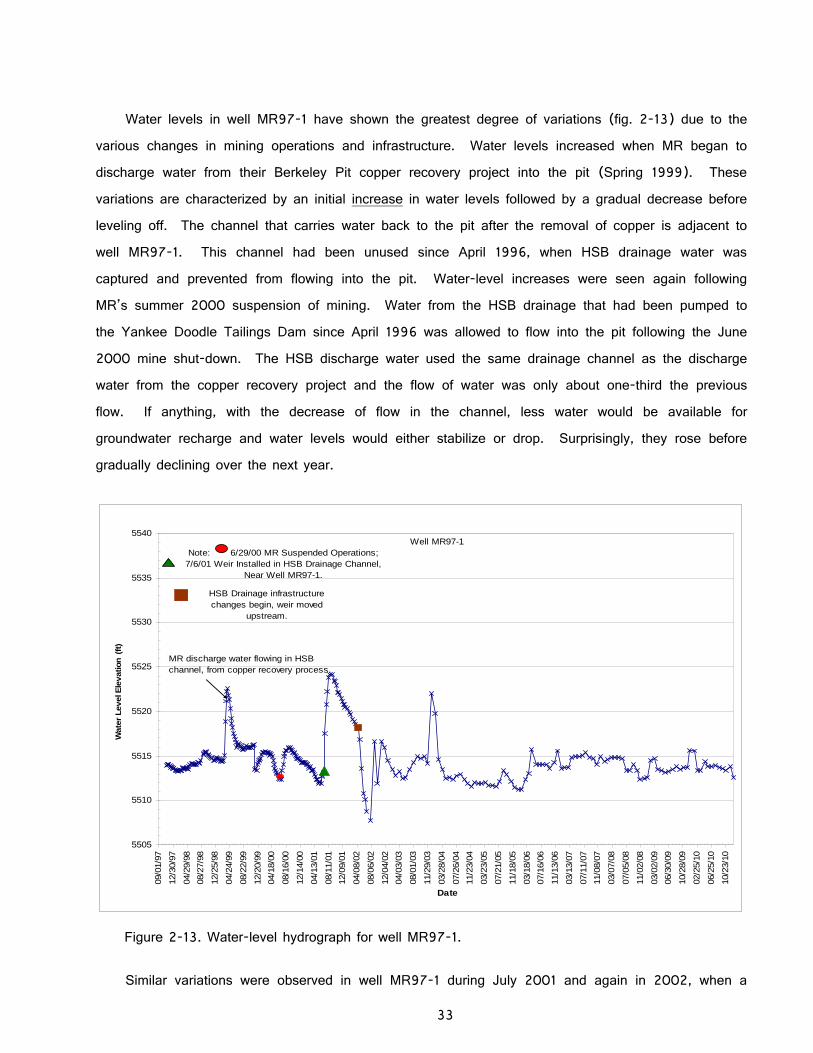
33
Water levels in well MR97-1 have shown the greatest degree of variations (fig. 2-13) due to the various changes in mining operations and infrastructure. Water levels increased when MR began to discharge water from their Berkeley Pit copper recovery project into the pit (Spring 1999). These variations are characterized by an initial increase in water levels followed by a gradual decrease before leveling off. The channel that carries water back to the pit after the removal of copper is adjacent to well MR97-1. This channel had been unused since April 1996, when HSB drainage water was captured and prevented from flowing into the pit. Water-level increases were seen again following MR’s summer 2000 suspension of mining. Water from the HSB drainage that had been pumped to the Yankee Doodle Tailings Dam since April 1996 was allowed to flow into the pit following the June 2000 mine shut-down. The HSB discharge water used the same drainage channel as the discharge water from the copper recovery project and the flow of water was only about one-third the previous flow. If anything, with the decrease of flow in the channel, less water would be available for groundwater recharge and water levels would either stabilize or drop. Surprisingly, they rose before gradually declining over the next year.
5505
5510
5515
5520
5525
5530
5535
5540
09/0
1/97
12/3
0/97
04/2
9/98
08/2
7/98
12/2
5/98
04/2
4/99
08/2
2/99
12/2
0/99
04/1
8/00
08/1
6/00
12/1
4/00
04/1
3/01
08/1
1/01
12/0
9/01
04/0
8/02
08/0
6/02
12/0
4/02
04/0
3/03
08/0
1/03
11/2
9/03
03/2
8/04
07/2
6/04
11/2
3/04
03/2
3/05
07/2
1/05
11/1
8/05
03/1
8/06
07/1
6/06
11/1
3/06
03/1
3/07
07/1
1/07
11/0
8/07
03/0
7/08
07/0
5/08
11/0
2/08
03/0
2/09
06/3
0/09
10/2
8/09
02/2
5/10
06/2
5/10
10/2
3/10
Date
Wate
r Level E
levation (
ft)
MR discharge water flowing in HSB channel, from copper recovery process.
Note: 6/29/00 MR Suspended Operations;7/6/01 Weir Installed in HSB Drainage Channel,
Near Well MR97-1.
HSB Drainage infrastructure changes begin, weir moved
upstream.
Well MR97-1
Figure 2-13. Water-level hydrograph for well MR97-1.
Similar variations were observed in well MR97-1 during July 2001 and again in 2002, when a

34
weir was installed (2001) and then relocated (2002) in the channel. The weir that was installed in 2001 was relocated upstream of the outlet that was historically referred to in MR’s precipitation plant operations as Pond 4. The weir was relocated as part of infrastructure changes relating to the HSB water treatment plant construction. The area occupied by Pond 4 was excavated and enlarged, then lined with lime rock during construction activities. The weir’s relocation resulted in a drop in water levels in well MR97-1 because the weir and the accompanying impounded water were moved up gradient of this well. Water levels showed some minor fluctuations during early 2003, before rising several feet and then leveling off, until a substantial rise during December 2003. The December rise coincides with the resumption of MR’s copper recovery project and the corresponding flow of discharge water in the drainage ditch near well MR97-1. Water levels subsequently declined the first part of 2004 before leveling off for most of the remainder of 2004 and early 2005. Water levels increased during the summer of 2005 before declining into the first part of 2006. Water levels have shown minor periodic variations between 2007-2010, with a slight downward trend.
Wells MR97-2 and MR97-3 are adjacent to historic collection ditches associated with the leach pads. Water-level changes were apparent in these two wells during 1999-2000 when MR made operational changes in leaching operations. As a result, the amount and level of water in collection ditches became less and were reflected as a drop in water levels in wells MR97-2 and MR97-3 (figs. 2-14 and 2-15). Increases in water levels were noticed in 2009-2010 when limited leaching operations resumed.
Water-level increases were also seen in wells MR97-2, MR97-3, and MR97-4 following MR’s suspension of mining (figs. 2-14, 2-15, and 2-16). The response in water levels in well MR97-2, figure 2-14, was very similar to that seen in well MR97-1. A similar increase was seen in well MR97-2 following the 2001 weir installation. Water levels were stable at this site during 2003-2005 through mid-2006 and did not show the same fluctuations as noted in well MR97-1. However, water levels increased during June, July and November 2006, leveled off before rising during early spring 2007 before leveling off then decreasing slightly the later part of 2007. Water levels had some minor variation from 2008-2010.

35
5530
5535
5540
5545
5550
5555
556009
/01/
97
12/3
0/97
04/2
9/98
08/2
7/98
12/2
5/98
04/2
4/99
08/2
2/99
12/2
0/99
04/1
8/00
08/1
6/00
12/1
4/00
04/1
3/01
08/1
1/01
12/0
9/01
04/0
8/02
08/0
6/02
12/0
4/02
04/0
3/03
08/0
1/03
11/2
9/03
03/2
8/04
07/2
6/04
11/2
3/04
03/2
3/05
07/2
1/05
11/1
8/05
03/1
8/06
07/1
6/06
11/1
3/06
03/1
3/07
07/1
1/07
11/0
8/07
03/0
7/08
07/0
5/08
11/0
2/08
03/0
2/09
06/3
0/09
10/2
8/09
02/2
5/10
06/2
5/10
10/2
3/10
Date
Wate
r L
evel E
levation (ft
)
Note: 6/29/00 MR Suspended Operations;
7/6/01 Weir Installed in HSB Drainage Channel, Near Well MR97-1.
Well MR97-2
Figure 2-14. Water-level hydrograph for well MR97-2.
The water level in well MR97-3 showed only minor responses during the 2001 and 2002 construction activities. However, water levels rose the first part of 2003, before leveling off for the next 5 to 6 months and falling the last several months of the year (fig. 2-15). With the exception of a brief period early in 2004, water levels continued to drop in this well until spring 2005 when they rose for several months before leveling off. Water levels continued to rise throughout most of 2006 and 2007 resulting in a net water-level increase of almost 1.8 ft and 3.88 ft in 2006 and 2007 respectively. Water levels have varied through the year from 2008-2010; however, there has been a modest upward trend during this time period. This MR-series well is the farthest away from the HSB drainage channel and appears to be the least responsive to operational changes and flows in the discharge channel.

36
5560
5565
5570
5575
5580
5585
5590
09/0
1/97
12/3
0/97
04/2
9/98
08/2
7/98
12/2
5/98
04/2
4/99
08/2
2/99
12/2
0/99
04/1
8/00
08/1
6/00
12/1
4/00
04/1
3/01
08/1
1/01
12/0
9/01
04/0
8/02
08/0
6/02
12/0
4/02
04/0
3/03
08/0
1/03
11/2
9/03
03/2
8/04
07/2
6/04
11/2
3/04
03/2
3/05
07/2
1/05
11/1
8/05
03/1
8/06
07/1
6/06
11/1
3/06
03/1
3/07
07/1
1/07
11/0
8/07
03/0
7/08
07/0
5/08
11/0
2/08
03/0
2/09
06/3
0/09
10/2
8/09
02/2
5/10
06/2
5/10
10/2
3/10
Date
Wat
er L
evel
Ele
vatio
n (ft
)
Note: 6/29/00 MR Suspended Operations.
7/6/01 Weir Installed in HSB Drainage Channel, Near Well MR97-1.
Well MR97-3
Figure 2-15. Water-level hydrograph for well MR97-3.
Water-level changes during 2003 in well MR97-4, figure 2-16, were similar to those seen in well MR97-3, except the decline in water levels began earlier in 2003 and were greater. Since this well is closer to the precipitation plant facilities and HSB ponds and drainage ditches, it is possible that changes in operational flows in this area are responsible for the water-level declines observed the later part of 2003. Changes would be more pronounced in this well than in well MR97-3. The water-level increase seen during early 2004 possibly relates to water flowing into holding ponds associated with the precipitation plant as these operations were brought back on-line with MR’s fall 2003 startup of mining. Water-level changes were similar to those observed in well MR97-3 until mid-2006 when they began to decline. Water levels had a moderate rise during 2007 followed by a minor net rise for 2008. Water levels rose in May and June 2009 before leveling off and declining steadily throughout the fall and winter of 2009, resulting in a net decline of 3.7-ft. Water levels continued to decline during most of 2010, with a net decline of all most 2 ft.

37
Well MR97-4
5535
5540
5545
5550
5555
5560
5565
09/0
1/97
12/3
0/97
04/2
9/98
08/2
7/98
12/2
5/98
04/2
4/99
08/2
2/99
12/2
0/99
04/1
8/00
08/1
6/00
12/1
4/00
04/1
3/01
08/1
1/01
12/0
9/01
04/0
8/02
08/0
6/02
12/0
4/02
04/0
3/03
08/0
1/03
11/2
9/03
03/2
8/04
07/2
6/04
11/2
3/04
03/2
3/05
07/2
1/05
11/1
8/05
03/1
8/06
07/1
6/06
11/1
3/06
03/1
3/07
07/1
1/07
11/0
8/07
03/0
7/08
07/0
5/08
11/0
2/08
03/0
2/09
06/3
0/09
10/2
8/09
02/2
5/10
06/2
5/10
10/2
3/10
Date
Wate
r Level E
levation (ft
)
Note: 6/29/00 MR Suspended Operations.
7/6/01 Weir Installed in HSB Drainage Channel, Near Well MR97-1.
Figure 2-16. Water-level hydrograph for well MR97-4.
Water levels have declined 5.5 ft or more in wells (MR97-2 and MR97-3) nearest the leach pads and ancillary facilities since their installation in 1997 (table 2.1.3.1), while declining between 1.3 and 1.8 ft in wells MR97-1and MR97-4, respectively. It appears there is a direct influence on the shallow alluvial aquifer in this area by mining operations. Changes in mine operations (i.e. precipitation plant and leach pad) affect groundwater recharge in this area. Other changes, such as the weir installation and relocation, have affected groundwater levels in the area in the past.
No water-quality samples have been collected from this group of wells between 2001 and 2010. Previous sampling documented the presence of elevated metals in the area. This contamination is most likely the result of leach pad and precipitation plant operations.
Section 2.1.4 GS and BMF05-Series Wells
Continuous and monthly water-level monitoring of the six GS wells and four BMF05 wells continued throughout 2010. The locations of these wells are shown on figure 2-17; table 2.1.4.1 contains annual water-level changes for these wells. Wells GS-41, GS-44, and GS-46 are nested pairs. That is, the wells are drilled adjacent to each other, but were drilled and completed at different depths. The S and D identify the shallow and deep well in each nested pair. Water levels had a net

38
decline in three of the six wells in 2008, which is in contrast to the increases seen in all six wells during 2006 and 2007; however, water levels rose in all six wells for 2009. Water levels rose in two wells in 2010 while declining in the other four. During most years water-level changes are similar in these six wells; therefore the variations during 2008 and 2010 are not characteristic of the long-term trends. Water levels have a net increase over the period of monitoring in all six GS-series wells, with the net increase being 2 ft or less.
Figures 2-18 through 2-20 are water-level hydrographs with monthly precipitation totals shown for the three well pairs (GS-41, GS-44, and GS-46). The seasonal variations in water levels closely follow monthly precipitation trends. Water levels begin a gradual increase in the spring as precipitation increases and then decline throughout the fall.
Water-level changes in wells GS-41S and GS-41D were similar once again during 2010 (fig. 2-18) and the influence of precipitation was very noticeable. Water levels increased about 0.10 ft in these two wells during 2010.
Net water-level changes in the GS-44 series wells during 2010 were similar to those seen in the past and in those seen in 2010 in the GS-41 wells. Seasonal trends of water levels rising in the summer and early fall then declining were similar to those seen in the past and in wells GS-41S and GS-41D throughout 2010 (fig. 2-19); however, there was a slight overall decline in water levels in contrast to the minor increase seen in the GS41 series wells. The water levels in wells GS-44S and GS-44D declined 0.02 and 0.04 ft, respectively, during 2010.
Overall, water-level trends were similar during 2010 in wells GS-46S and GS-46D (fig. 2-20), and followed similar seasonal trends discussed previously for wells GS-41 and GS-44. Water levels decreased 0.20 ft well GS-46S and 0.10 ft in well GS-46D during 2010, while having a net water-level rise since monitoring began.

39
Figure 2-17. GS and BMF wells
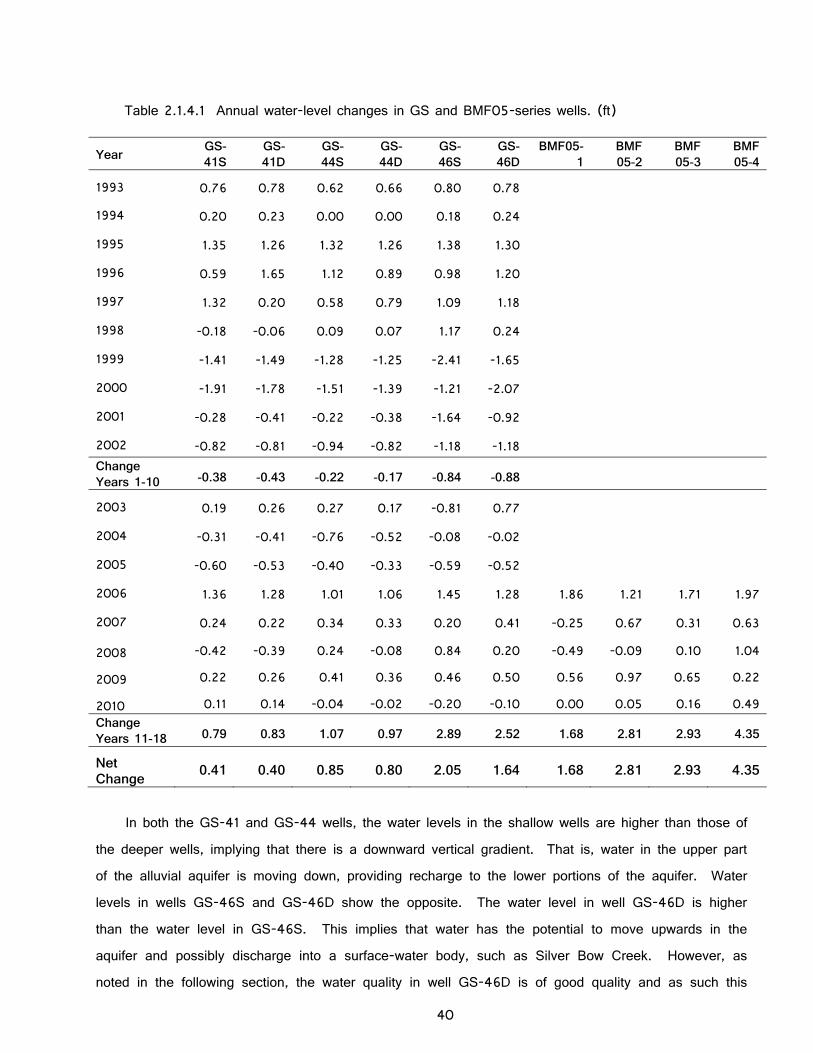
40
Table 2.1.4.1 Annual water-level changes in GS and BMF05-series wells. (ft)
Year GS-41S
GS-41D
GS-44S
GS-44D
GS-46S
GS-46D
BMF05-1
BMF 05-2
BMF 05-3
BMF 05-4
1993 0.76 0.78 0.62 0.66 0.80 0.78 1994 0.20 0.23 0.00 0.00 0.18 0.24 1995 1.35 1.26 1.32 1.26 1.38 1.30 1996 0.59 1.65 1.12 0.89 0.98 1.20 1997 1.32 0.20 0.58 0.79 1.09 1.18 1998 -0.18 -0.06 0.09 0.07 1.17 0.24 1999 -1.41 -1.49 -1.28 -1.25 -2.41 -1.65 2000 -1.91 -1.78 -1.51 -1.39 -1.21 -2.07 2001 -0.28 -0.41 -0.22 -0.38 -1.64 -0.92 2002 -0.82 -0.81 -0.94 -0.82 -1.18 -1.18 Change Years 1-10 -0.38 -0.43 -0.22 -0.17 -0.84 -0.88
2003 0.19 0.26 0.27 0.17 -0.81 0.77 2004 -0.31 -0.41 -0.76 -0.52 -0.08 -0.02 2005 -0.60 -0.53 -0.40 -0.33 -0.59 -0.52 2006 1.36 1.28 1.01 1.06 1.45 1.28 1.86 1.21 1.71 1.97
2007 0.24 0.22 0.34 0.33 0.20 0.41 -0.25 0.67 0.31 0.63
2008 -0.42 -0.39 0.24 -0.08 0.84 0.20 -0.49 -0.09 0.10 1.04
2009 0.22 0.26 0.41 0.36 0.46 0.50 0.56 0.97 0.65 0.22
2010 0.11 0.14 -0.04 -0.02 -0.20 -0.10 0.00 0.05 0.16 0.49Change Years 11-18 0.79 0.83 1.07 0.97 2.89 2.52 1.68 2.81 2.93 4.35
Net Change 0.41 0.40 0.85 0.80 2.05 1.64 1.68 2.81 2.93 4.35
In both the GS-41 and GS-44 wells, the water levels in the shallow wells are higher than those of the deeper wells, implying that there is a downward vertical gradient. That is, water in the upper part of the alluvial aquifer is moving down, providing recharge to the lower portions of the aquifer. Water levels in wells GS-46S and GS-46D show the opposite. The water level in well GS-46D is higher than the water level in GS-46S. This implies that water has the potential to move upwards in the aquifer and possibly discharge into a surface-water body, such as Silver Bow Creek. However, as noted in the following section, the water quality in well GS-46D is of good quality and as such this

41
would not be a concern.
5454
5455
5456
5457
5458
5459
5460
5461
5462
5463
546401/
06/
93
07/
07/
93
01/
04/
94
07/
01/
94
01/
03/
95
06/
27/
95
12/
29/
95
06/
26/
96
01/
02/
97
07/
01/
97
01/
07/
98
06/
30/
98
12/
28/
98
06/
29/
99
12/
28/
99
06/
30/
00
12/
29/
00
06/
29/
01
12/
28/
01
07/
02/
02
12/
27/
02
06/
26/
03
12/
30/
03
06/
29/
04
12/
28/
04
06/
27/
05
12/
28/
05
06/
30/
06
12/
27/
06
06/
27/
07
01/
02/
08
07/
02/
08
12/
30/
08
06/
26/
09
12/
22/
09
06/
30/
10
12/
28/
10
Date
Wat
er-L
evel
Ele
vation (ft
)
0.00
0.50
1.00
1.50
2.00
2.50
3.00
3.50
4.00
4.50
5.00
Month
ly P
reci
pitat
ion (in
)
Monthly Precipitation GS-41S GS-41D
GS-41SGS-41D
Berkeley Pit Landslide
Figure 2-18. Water-level hydrographs for wells GS-41S and GS-41D.

42
5450
5452
5454
5456
5458
5460
5462
5464
01/0
6/93
07/0
7/93
01/0
4/94
07/0
1/94
01/0
3/95
06/2
7/95
12/2
9/95
06/2
6/96
01/0
2/97
07/0
1/97
01/0
7/98
06/3
0/98
12/2
8/98
06/2
9/99
12/2
8/99
06/3
0/00
12/2
9/00
06/2
9/01
12/2
8/01
07/0
2/02
12/2
7/02
06/2
6/03
12/3
0/03
06/2
9/04
12/2
8/04
06/2
7/05
12/2
8/05
06/3
0/06
12/2
7/06
06/2
7/07
01/0
2/08
07/0
2/08
12/3
0/08
06/2
6/09
12/2
2/09
06/3
0/10
12/2
8/10
Date
Wat
er-L
eve
l Ele
vat
ion (ft)
0.00
0.50
1.00
1.50
2.00
2.50
3.00
3.50
4.00
4.50
5.00
Month
ly P
reci
pitat
ion (in
)
Monthly Precipitation GS-44S GS-44D
GS-44S
GS-44D
Figure 2-19. Water-level hydrographs for wells GS-44S and GS-44D.
5456
5457
5458
5459
5460
5461
5462
5463
5464
5465
5466
01/0
6/93
07/0
7/93
01/0
4/94
07/0
1/94
01/0
3/95
06/2
7/95
12/2
9/95
06/2
6/96
01/0
2/97
07/0
1/97
01/0
7/98
06/3
0/98
12/2
8/98
06/2
9/99
12/2
8/99
06/3
0/00
12/2
9/00
06/2
9/01
12/2
8/01
07/0
2/02
12/2
7/02
06/2
6/03
12/3
0/03
06/2
9/04
12/2
8/04
06/2
7/05
12/2
8/05
06/3
0/06
12/2
7/06
06/2
7/07
01/0
2/08
07/0
2/08
12/3
0/08
06/2
6/09
12/2
2/09
06/3
0/10
12/2
8/10
Date
Wat
er-L
evel
Ele
vation (ft
)
0.00
0.50
1.00
1.50
2.00
2.50
3.00
3.50
4.00
4.50
5.00
Month
ly P
reci
pitat
ion (in
)
Monthly Precipitation GS-46S GS-46D
GS-46S
GS-46D
Figure 2-20. Water-level hydrographs for wells GS-46S and GS-46D.

43
The BMF05-series wells were installed in late 2005 and early 2006. These wells were installed to replace the domestic wells that were part of the post RI/FS monitoring program. The domestic wells were monitored from 1997 through 2002; however, it was determined that dedicated monitoring wells would be more reliable for the long-term monitoring program and would not be influenced by household usage. The location of these wells is shown on figure 2-17. The wells were located to provide coverage throughout the same area covered by the domestic wells and to provide information for areas south of the Berkeley Pit-active mine area. This area is important to better define the groundwater divide between the Butte Mine Flooding alluvial aquifer and Butte Priority Soils. Pressure transducers were installed in the spring of 2006 in each well for continuous water-level monitoring. Water levels had a net rise in all four wells for 2006, three wells in 2007, two wells in 2008, four wells in 2009, and three wells in 2010 (water level in one well was unchanged); water levels have a net rise in all four wells since their installation (table 2.1.4.1).
Figure 2-21 shows daily average water levels for the BMF05 series wells based upon data collected from the pressure transducers. The transducers record water-level changes every hour; the data are then converted to daily averages to reduce the size of the data set. Each well has an overall upward water-level trend that levels off in the fall and early winter with the exception of well BMF05-4. The water level continued to rise throughout the fall and winter in this well. The data from the continuous monitoring shows a slight overall upward trend in these wells, with the exception of BMF05-1, whose maximum and minimum yearly water levels are very similar. Figure 2-22 is a hydrograph based upon monthly water levels and monthly precipitation totals. Each well’s response time to precipitation events varies most likely as a result of the different depths to water; the deeper the water level, the longer it takes for recharge from snow-melt and precipitation to reach the water table. The seasonal trends are not as pronounced in this group of alluvial wells as those seen in the GS series wells.

44
5456.00
5458.00
5460.00
5462.00
5464.00
5466.00
5468.00
5470.00
02/
02/0
6
05/
03/0
6
08/
01/0
6
10/
30/0
6
01/
28/0
7
04/
28/0
7
07/
27/0
7
10/
25/0
7
01/
23/0
8
04/
22/0
8
07/
21/0
8
10/
19/0
8
01/
17/0
9
04/
17/0
9
07/
16/0
9
10/
14/0
9
01/
12/1
0
04/
12/1
0
07/
11/1
0
10/
09/1
0
01/
07/1
1
Date
Ave
rage
Dai
ly W
ater-
Lev
el E
leva
tion (ft)
BMF05-2
BMF05-1
BMF05-3
BMF05-4
Figure 2-21. Average daily water-levels for BMF05 series wells.
5454.00
5456.00
5458.00
5460.00
5462.00
5464.00
5466.00
5468.00
5470.00
5472.00
5474.00
11/2
9/05
02/2
8/06
05/3
0/06
08/3
0/06
12/0
1/06
02/2
8/07
05/3
0/07
08/3
0/07
11/2
8/07
02/2
7/08
05/3
0/08
08/2
7/08
12/0
4/08
03/0
2/09
05/2
9/09
08/3
1/09
12/0
1/09
02/2
6/10
05/2
8/10
08/3
1/10
12/0
1/10
Date
Wat
er-L
eve
l Ele
vati
on
(ft
)
0.00
0.50
1.00
1.50
2.00
2.50
3.00
3.50
4.00
4.50
5.00
Pre
cip
itat
ion
(ft
)
Precip BMF05-1 BMF05-2 BMF05-3 BMF05-4
Figure 2-22. Monthly water-levels versus precipitation, BMF05 series wells.

45
Section 2.1.4.1 GS and BMF05-Series Wells Water Quality
Water-quality samples were collected during the spring (April) sample event from GS-series wells as part of the 2010 BMFOU monitoring. The poor water quality in GS-41S and GS-41D reflects their proximity to the Parrot Tailings area; concentrations of dissolved constituents are extremely high. Data collected in 2010 confirms the large increases noted in many of the dissolved constituents since 2004; however, concentrations were similar to those seen in 2009 data.
The concentration of several dissolved constituents continues to exceed MCLs in Well GS-44S at the north end of Clark Park. Cadmium concentrations continue to increase to levels above the MCL in 2005-2010 samples, after being below the MCL for the previous three years. Well GS-44D continues to exhibit concentrations greater than MCLs for cadmium also; overall concentrations have decreased by as much as 50 percent over the period of record. Wells GS-46S and D, northeast of Clark Park continued to exhibit good water quality in 2010 and show little or no change in trend, with the exception of uranium (GS-46S) which exceeds the MCL in the 2005-2010 sample results.
Quarterly water-quality samples were collected from the BMF05 wells during 2006-2007 to establish baseline conditions for these four sites. Semi-annual samples were collected beginning in 2008. Well BMF05-1 is extremely contaminated, having a pH less than 5.50 and elevated concentrations of iron, manganese, cadmium, copper and zinc. Table 2.1.4.2 shows the mean values for the elevated constituents and the appropriate MCL or SMCL standard.
Table 2.1.4.2 Mean concentrations of analytes that exceed water-quality standards, well BMF05-1.
Analyte Mean Concentration MCL (mg/L) SMCL (mg/L) pH 5.22 6.5-8.5 Iron 8.60 0.30 Manganese 124. 0.05 Aluminum 0.523 0.05-0.2 Cadmium 0.209 0.005 Copper 3.52 1.3 Zinc 48.5 5 Sulfate 1,557 250
Based upon the location of this well (fig. 2-17), adjacent to the historic Silver Bow Creek channel and down gradient from MR’s concentrator, it is not surprising that the groundwater in the area is contaminated with mining-related type wastes. Contaminant concentrations are similar to those in well AMC-5 located to the north.

46
Mean concentrations are above standards for pH and nitrate in well BFM05-2; and pH in well BMF05-4. However, 2010 nitrate concentrations in well BMF05-2 were below the MCL.
Section 2.2 East Camp Underground Mines
Monitoring of water levels in the seven East Camp underground mines continued. Their locations are shown on figure 2-23. During the year 2010, water levels rose between 6.4 and 7.8 ft in the mines, which was 0.1 ft to 0.5 ft more than last year’s totals. The Berkeley Pit water level rose 7.32 ft, which is 0.15 ft more than last year (Table 2.2.1). Figure 2-24 shows the annual water-level changes graphically for these sites. The net 2010 water-level changes between the mine shafts and Berkeley Pit were very comparable. The rate of water-level rise has slowed by 50 to 60 percent since 2003 when the Horseshoe Bend drainage water was diverted away from the pit.

47
Table 2.2.1 Annual water-level changes in East Camp mines, in feet.
Year Berkeley Pit
Anselmo Kelley Belmont (1) Steward GraniteMountain
Lexington(2) PilotButte
1982 1,304.00 117.00 85.00 1983 877.00 1,054.00 1,070.00 1984 262.00 269.00 274.00 1985 122.00 121.00 123.00 1986 56.00 96.00 102.00 101.00 1987 77.00 84.00 77.00 79.00 67.00 1988 53.00 56.00 53.00 52.00 57.00 8.10 1989 29.00 31.00 31.00 29.00 31.00 1990 32.00 33.00 34.00 33.00 34.00 1991 12.00 29.00 33.00 30.00 29.00 31.00 Change Years 1-10
12.00 276.00 2,898.00 1,888.00 1,875.00 220.00 8.10
1992 25.00 22.00 24.00 24.00 23.00 25.00 1993 26.00 24.00 25.00 26.00 25.00 26.00 1994 27.00 25.00 26.00 25.00 25.00 27.00 1995 29.00 28.00 27.00 18.00 28.00 30.00 1996 18.00 16.00 19.00 4.15 18.00 18.00 1.19 3.071997 12.00 13.58 16.09 15.62 14.80 15.68 12.79 18.121998 17.08 13.23 14.73 13.89 14.33 14.24 13.71 11.261999 12.53 11.07 11.52 12.15 11.82 11.89 10.65 11.612000 16.97 14.48 14.55 15.66 14.60 15.09 14.01 14.112001 17.97 16.43 11.77 16.96 16.48 16.35 15.95 16.59Change Years 11-20
201.74 184.45 188.69 170.64 190.62 199.12 68.30 74.76
2002 15.56 11.60 13.15 13.02 12.60 12.82 12.08 11.332003 13.08 13.05 13.94 13.74 13.44 14.23 2.75 14.052004 7.68 7.31 7.86 7.54 7.48 7.67 7.532005 7.03 7.10 7.37 7.17 7.00 6.98 6.972006 7.69 7.70 8.29 7.74 7.99 7.92 8.612007 6.90 6.91 7.55 6.38 7.25 7.28 7.392008 6.63 5.42 6.28 7.01 5.58 5.68 6.132009 7.17 6.69 6.79 7.33 7.13 6.92 52.79 6.382010 7.32 7.30 7.83 7.45 7.80 6.48 7.03 7.07Change Years 21-29
79.06 73.08 79.06 77.38 76.27 75.98 74.65 75.46
Net Change* 292.80 523.13 3,165.17 2,135.52 2,142.44 495.20 151.05 150.22
(1) Mine shaft collapsed in 1995; a replacement well was drilled adjacent to the mine, into mine workings, in 1997. Since the well was drilled into the Belmont Mine workings, it is assumed that this water level is reflective of the Belmont Mine.
(2) No water-level measurements since February 2003, due to obstruction in shaft at 366 ft below surface.
(*)Total change is the measured change in water level. Access or obstructions have prevented continuous water-level measurements at some sites.

48
Figure 2-23. East Camp and bedrock wells location map.

49
1
10
100
1000
10000
1982 1984 1986 1988 1990 1992 1994 1996 1998 2000 2002 2004 2006 2008 2010
Year
Wat
er-L
evel
Ch
ang
e (f
t)
Anselmo Belmont Granite Mtn Kelley Steward Berkeley
Figure 2-24. East Camp mines annual water-level changes.
The hydrograph (fig. 2-25) is based upon water levels for the Anselmo Mine and Kelley Mine for the period of record. Except for the steadily increasing water-levels, there are no obvious variations on this figure; however, when more detailed water levels are plotted from 1995 through 2010, several changes are noticeable (fig. 2-26). The removal of HSB drainage water from discharging into the pit in April 1996 resulted in a flattening of the line, while the July 2000 addition of the HSB drainage water, following MR’s suspension of mining, resulted in an increased slope of the line. The slope of the line, or rate of rise, shown on fig. 2-26 flattened out throughout 2010, corresponding to the continued removal of the HSB drainage water and its subsequent treatment. The HSB treatment plant came on-line during late November 2003. A similar trend was seen in all the East Camp underground mines.
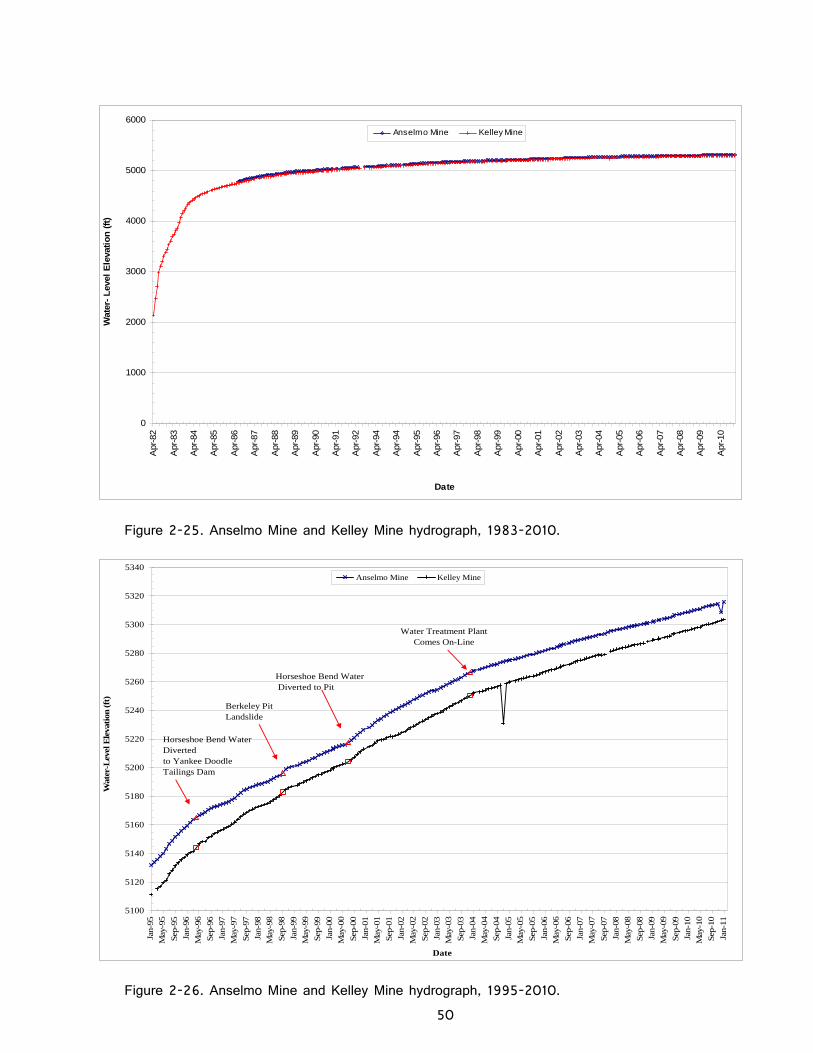
50
0
1000
2000
3000
4000
5000
6000
Apr
-82
Apr
-83
Apr
-84
Apr
-85
Apr
-86
Apr
-87
Apr
-88
Apr
-89
Apr
-90
Apr
-91
Apr
-92
Apr
-94
Apr
-94
Apr
-95
Apr
-96
Apr
-97
Apr
-98
Apr
-99
Apr
-00
Apr
-01
Apr
-02
Apr
-03
Apr
-04
Apr
-05
Apr
-06
Apr
-07
Apr
-08
Apr
-09
Apr
-10
Date
Wat
er-
Lev
el E
leva
tio
n (
ft)
Anselmo Mine Kelley Mine
Figure 2-25. Anselmo Mine and Kelley Mine hydrograph, 1983-2010.
5100
5120
5140
5160
5180
5200
5220
5240
5260
5280
5300
5320
5340
Jan-
95
May
-95
Sep
-95
Jan-
96
May
-96
Sep
-96
Jan-
97
May
-97
Sep
-97
Jan-
98
May
-98
Sep
-98
Jan-
99
May
-99
Sep
-99
Jan-
00
May
-00
Sep
-00
Jan-
01
May
-01
Sep
-01
Jan-
02
May
-02
Sep
-02
Jan-
03M
ay-0
3
Sep
-03
Jan-
04
May
-04
Sep
-04
Jan-
05
May
-05
Sep
-05
Jan-
06M
ay-0
6
Sep
-06
Jan-
07
May
-07
Sep
-07
Jan-
08
May
-08
Sep
-08
Jan-
09
May
-09
Sep
-09
Jan-
10
May
-10
Sep
-10
Jan-
11
Date
Wat
er-L
evel
Ele
vati
on (
ft)
Anselmo Mine Kelley Mine
Horseshoe Bend Water Divertedto Yankee Doodle Tailings Dam
Berkeley Pit Landslide
Horseshoe Bend Water Diverted to Pit
Water Treatment Plant Comes On-Line
Figure 2-26. Anselmo Mine and Kelley Mine hydrograph, 1995-2010.

51
Figure 2-27 shows monthly water-level changes in the Berkeley Pit from 1991 through 2010. Water-level changes (increases) seen over the last 6 months of 2000, following the addition of HSB drainage water, continued through 2003. However, water-level increases were much less from 2004-2010 as a result of the decreased inflow of water into the pit.
4900
4950
5000
5050
5100
5150
5200
5250
5300
5350
Jul-9
1
Jan-
92
Jul-9
2
Jan-
93
Jul-9
3
Jan-
94
Jul-9
4
Jan-
95
Jul-9
5
Jan-
96
Jul-9
6
Jan-
97
Jul-9
7
Jan-
98
Jul-9
8
Jan-
99
Jul-9
9
Jan-
00
Jul-0
0
Jan-
01
Jul-0
1
Jan-
02
Jul-0
2
Jan-
03
Jul-0
3
Jan-
04
Jul-0
4
Jan-
05
Jul-0
5
Jan-
06
Jul-0
6
Jan-
07
Jul-0
7
Jan-
08
Jul-0
8
Jan-
09
Jul-0
9
Jan-
10
Jul-1
0
Jan-
11
Jul-1
1
Jan-
12
Date
Wat
er-
Lev
el E
leva
tio
n (
ft) Horseshoe Bend Water Diverted
to Yankee Doodle Tailings Dam
Berkeley Pit Landslide
Horseshoe Bend Water Diverted to Pit
Horseshoe Bend Water Treatment Plant On-Line
Figure 2-27. Water-level hydrograph for the Berkeley Pit, 1991-2010.
Figure 2-28 is a plot of selected mine-shaft water levels versus precipitation. There is no apparent influence on water levels in the underground mines from monthly precipitation. It is obvious that the rise in water levels is a function of historic mine-dewatering activities and the void areas in the underground mine workings and Berkeley Pit and is not a function of precipitation. Based upon volume estimates of the underground mines and December 2010 water-level elevations, 82 percent of the underground workings are flooded. Since approximately 15 percent of the underground workings are above the CWL elevation of 5410 ft, only 3 percent of the underground workings remain to be flooded.

52
0
1000
2000
3000
4000
5000
6000
Apr
-82
Apr
-83
Apr
-84
Apr
-85
Apr
-86
Apr
-87
Apr
-88
Apr
-89
Apr
-90
Apr
-91
Apr
-92
Apr
-94
Apr
-94
Apr
-95
Apr
-96
Apr
-97
Apr
-98
Apr
-99
Apr
-00
Apr
-01
Apr
-02
Apr
-03
Apr
-04
Apr
-05
Apr
-06
Apr
-07
Apr
-08
Apr
-09
Apr
-10
Date
Wat
er-L
evel
Ele
vati
on
(ft
)
0.00
1.00
2.00
3.00
4.00
5.00
6.00
Mo
nth
ly P
reci
pit
atio
n (
in)
Precip Anselmo Kelley Granite Mtn
Figure 2-28. Water level hydrograph for selected East Camp mines, with monthly precipitation.
The 1994 ROD and 2002 CD established eight points of compliance (POC) in the East Camp system, five of which are within the mine system. These points of compliance were selected to insure contaminated water was contained within the underground mine system and Berkeley Pit. The POC elevation was established at an elevation of 5,410 above sea level. Under the terms specified in the ROD and CD the water level cannot exceed the 5,410 elevation at any POC without monetary penalties being applied to the settling parties. Water levels remain highest in the sites farthest from the Berkeley Pit. The East Camp mine compliance point with the highest water level at the end of 2010 was the Pilot Butte Mine, which was at an elevation of 5,317 ft, or 93 below the action level. This continues to confirm that water is flowing towards the pit, thus keeping the pit the low point in this system.

53
Section 2.2.1 Water Quality
Earlier reports discussed the lack of appreciable change in water quality within the East Camp mines until 2002 when several of the shafts exhibited significant departure from previous trends. Data from the 2010 sampling indicate that the changes in concentration are sustained for yet another year. Again, most notable is the elevated concentration of metals, arsenic, iron, manganese, zinc and sulfate in the Kelley shaft. The Anselmo, Kelley and Steward mines were sampled during the spring 2010 sample event at depths of 100 ft and 1,000 ft below the water surface. Fall 2010 samples were collected from similar depths with the exception of the Anselmo Mine, where only the 100-ft-below water-surface sample was collected due to obstructions at depth in the mine shaft. Concentrations varied very little with sample depth. (Data shown in figures are from samples collected 100 ft below the water surface.)
Kelley: iron, sulfate, arsenic, and aluminum increased to near historic concentrations in 2003-2004, decreasing gradually in 2005-2010 (fig. 2-29). Copper concentrations increased in the 2010 samples; however, they remain very low.
Anselmo: the trend for iron concentrations remains elevated but less than 2004 concentrations; arsenic concentrations were similar to those seen in 2004; zinc concentrations remain similar to those seen in 2007 (fig. 2-30). Copper concentrations remain very low (<20 μg/L).
Steward: the iron and arsenic concentrations in the Steward shaft remain high, following the upward trend of recent years. The trend has been downward for zinc and copper (fig. 2-31); however zinc concentrations remain well above standards.

54
0
500
1,000
1,500
2,000
2,500
3,000
Jan-
83
Jan-
84
Jan-
85
Jan-
86
Jan-
87
Jan-
88
Jan-
89
Jan-
90
Jan-
91
Jan-
92
Jan-
93
Jan-
94
Jan-
95
Jan-
96
Jan-
97
Jan-
98
Jan-
99
Jan-
00
Jan-
01
Jan-
02
Jan-
03
Jan-
04
Jan-
05
Jan-
06
Jan-
07
Jan-
08
Jan-
09
Jan-
10
Jan-
11
Date
Iro
n C
on
cen
trat
ion
(m
g/L
)
0
2,000
4,000
6,000
8,000
10,000
12,000
14,000
16,000
Ars
enic
Co
nce
ntr
atio
n (
µg
/L)
Fe As
Figure 2-29. Iron and arsenic concentrations over time in the Kelley Mine.

55
0.00
10.00
20.00
30.00
40.00
50.00
60.00
Jan-
86
Jan-
87
Jan-
88
Jan-
89
Jan-
90
Jan-
91
Jan-
92
Jan-
93
Jan-
94
Jan-
95
Jan-
96
Jan-
97
Jan-
98
Jan-
99
Jan-
00
Jan-
01
Jan-
02
Jan-
03
Jan-
04
Jan-
05
Jan-
06
Jan-
07
Jan-
08
Jan-
09
Jan-
10
Jan-
11
Date
Iro
n C
on
cen
trat
ion
(m
g/L
)
0.0
50.0
100.0
150.0
200.0
250.0
300.0
350.0
Ars
enic
Co
nce
ntr
atio
n (
µg
/L)
Fe As
0.0
10.0
20.0
30.0
40.0
50.0
60.0
70.0
80.0
Jan-
86
Jan-
87
Jan-
88
Jan-
89
Jan-
90
Jan-
91
Jan-
92
Jan-
93
Jan-
94
Jan-
95
Jan-
96
Jan-
97
Jan-
98
Jan-
99
Jan-
00
Jan-
01
Jan-
02
Jan-
03
Jan-
04
Jan-
05
Jan-
06
Jan-
07
Jan-
08
Jan-
09
Jan-
10
Jan-
11
Date
Cad
miu
m C
on
cen
trat
ion
(µ
g/L
)
0
10,000
20,000
30,000
40,000
50,000
60,000
70,000
Zin
c C
on
cen
trat
ion
(µ
g/L
)
Cd Zn
Figure 2-30. Iron and arsenic concentrations (top) and cadmium and zinc concentrations (bottom) over time in the Anselmo Mine.

56
0
50
100
150
200
250
300
350
400
Jan-
83
Jan-
84
Jan-
85
Jan-
86
Jan-
87
Jan-
88
Jan-
89
Jan-
90
Jan-
91
Jan-
92
Jan-
93
Jan-
94
Jan-
95
Jan-
96
Jan-
97
Jan-
98
Jan-
99
Jan-
00
Jan-
01
Jan-
02
Jan-
03
Jan-
04
Jan-
05
Jan-
06
Jan-
07
Jan-
08
Jan-
09
Jan-
10
Jan-
11
Date
Iro
n C
on
cen
trat
ion
(m
g/L
)
0
500
1,000
1,500
2,000
2,500
3,000
3,500
4,000
4,500
Ars
enic
Co
nce
ntr
atio
n (
µg
/L)
Fe As
0
2,000
4,000
6,000
8,000
10,000
12,000
14,000
Jan-
83
Jan-
84
Jan-
85
Jan-
86
Jan-
87
Jan-
88
Jan-
89
Jan-
90
Jan-
91
Jan-
92
Jan-
93
Jan-
94
Jan-
95
Jan-
96
Jan-
97
Jan-
98
Jan-
99
Jan-
00
Jan-
01
Jan-
02
Jan-
03
Jan-
04
Jan-
05
Jan-
06
Jan-
07
Jan-
08
Jan-
09
Jan-
10
Jan-
11
Date
Co
pp
er C
on
cen
trat
ion
(u
g/L
)
0
50,000
100,000
150,000
200,000
250,000
300,000
Zin
c C
on
cen
trat
ion
(µ
g/L
)
Cu Zn
Figure 2-31. Iron and arsenic concentrations (top) and cadmium and zinc concentrations (bottom) over time in the Steward Mine.

57
Section 2.2.2 RI/FS Bedrock Monitoring Wells
Monitoring of the nine RI/FS and ROD-installed bedrock wells continued. Monitoring-well locations are shown on figure 2-23. Water levels rose in wells A, B, C, D-1, D-2, G, and J at rates similar to those in the East Camp Mine system; while water levels in wells E and F increased at lesser rates. Table 2.2.1.1 contains yearly water-level changes and figure 2-32 shows these changes graphically.
-10
0
10
20
30
40
50
1991 1992 1993 1994 1995 1996 1997 1998 1999 2000 2001 2002 2003 2004 2005 2006 2007 2008 2009 2010
Year
Wat
er-L
evel
Ch
ang
e (f
t)
Well A Well B Well C Well D-1 Well D-2 Well E Well F Well G Well H Well J
Figure 2-32. RI/FS bedrock wells annual water-level change.
Water levels in the bedrock aquifer, which had been affected by historic underground mine dewatering, are responding to the cessation of pumping and show no apparent relationship to precipitation or seasonal changes through 2010. Instead, physical changes that affect the flow of water into the Berkeley Pit and underground mines, e.g. the 1996 HSB water diversion and the 2000 addition of the HSB drainage flow, are the major influences on water-level increases. Figure 2-33 is a hydrograph for well A showing monthly water levels and monthly precipitation totals with 1996, 2000 and 2003 HSB operational changes identified. The void areas in the mines and Berkeley Pit control the annual rate of rise in this system.

58
Table 2.2.1.1 RI/FS bedrock well annual water-level change, in feet.
Year Well A Well B Well C Well D-1 Well D-2 Well E Well F Well G Well H(1) Well J(2)
1989
1990
1991 33.18 22..38 24.20 22.68 1.73
1992 39.22 8.78 26.53 27.89 25.04 0.47 -1.92
1993 27.95 8.68 21.72 24.41 24.51 -0.37 1.09
1994 25.65 7.90 23.88 25.12 25.21 0.27 0.11
1995 28.69 13.41 29.55 26.99 27.50 0.44 1.65 28.74 30.37
1996 19.31 14.56 26.22 18.77 18.92 0.48 -0.11 2.40 8.72
1997 4.44 2.35 9.25 13.62 13.68 -0.64 1.41 15.67 3.76
1998 15.96 11.30 16.68 16.41 16.39 0.44 1.03 15.56 15.44 Change Years 1-10 204.40 76.98 186.21 177.41 173.93 2.82 3.26 82.37 68.29
1999 11.21 5.11 12.44 12.18 12.03 -0.78 -1.80 12.00 P&A 1.99
2000 15.12 8.20 13.39 14.66 15.79 -2.68 -2.49 12.84 P&A 16.19
2001 18.33 9.08 16.86 19.81 18.61 -3.58 -0.61 16.56 P&A 18.81
2002 15.16 1.73 14.41 14.69 14.76 -3.37 -0.73 14.84 P&A 15.29
2003 12.75 8.70 13.20 13.69 13.72 -2.66 1.16 12.71 P&A 13.48
2004 7.60 4.46 8.71 7.90 7.83 -1.12 0.32 8.31 P&A 7.58
2005 5.82 -7.00 6.76 5.56 6.08 -2.51 -0.73 5.95 P&A 7.03
2006 7.44 5.82 6.81 3.56 3.20 -0.83 1.22 6.39 P&A 6.72
2007 7.93 10.23 7.64 17.01 16.56 0.38 0.67 8.06 P&A 7.23
2008 6.70 7.59 6.40 6.89 7.36 0.59 -0.41 5.47 P&A 6.49 Change Years 11-20 108.06 53.92 106.62 115.96 115.94 -16.56 -3.40 103.22 0.00 100.81
2009 6.79 5.18 6.41 6.37 6.34 1.14 0.39 6.90 P&A 6.70
2010 8.87 5.19 7.29 7.77 7.62 1.69 0.24 7.22 P&A 7.64 Change Years 21-30 15.66 10.37 13.70 14.14 13.96 2.83 0.63 14.12 P&A 14.34
Net Change 328.12 141.27 306.53 307.51 303.83 -10.91 0.49 199.71 68.29 115.15 (1) Well plugged and abandoned (P&A) due to integrity problems. (2) Well J was drilled as a replacement for well H.

59
Table 2.2.1.1 RI/FS bedrock well annual water-level change, in feet. (cont.)
Year DDH-1(3) DDH-2 DDH-4 DDH-5 DDH-8
1989 29.53 34.83 30.48
1990 36.24 30.99 5.44 217.61 35.96
1991 27.03 28.20 39.81 27.01 28.96
1992 28.25 26.09 37.66 21.07 26.16
1993 24.33 24.16 26.88 24.40 24.46
1994 25.00 25.65 28.34 19.78 15.97
1995 27.66 28.74 28.80 26.10 ---
1996 18.53 18.97 2.24 12.41 55.68
1997 13.33 14.09 14.32 15.89 13.38
1998 15.03 16.20 16.25 16.50 16.50
Change Years 1-10
244.93 213.09 217.74 235.60 247.55
1999 11.66 12.00 11.88 4.85 15.50
2000 14.64 16.11 14.77 P&A 10.42
2001 18.14 18.78 18.52 P&A 18.93
2002 14.63 14.80 13.14 P&A 13.64
2003 13.05 13.90 NA P&A 14.49
2004 7.08 7.89 NA P&A 7.90
2005 4.87 5.89 NA P&A 57.52
2006 6.30 6.75 NA P&A 6.03
2007 3.08 8.75 NA P&A 5.90
2008 P&A 6.58 NA P&A 4.62
Change Years 11-20
93.45 111.45 58.31 4.82 154.95
2009 P&A 6.97 NA P&A 5.15 2010 P&A 7.50 NA P&A 4.60 Change Years 21-30
0.00 14.47 0.00 0.00 9.75
Net Change 338.38 339.01 276.05 240.42 412.25
(*)Total change is the measured change. Access or obstructions prevented continuous water-level measurements at some sites. (3) Well DDH-1 plugged, no data after July 2007
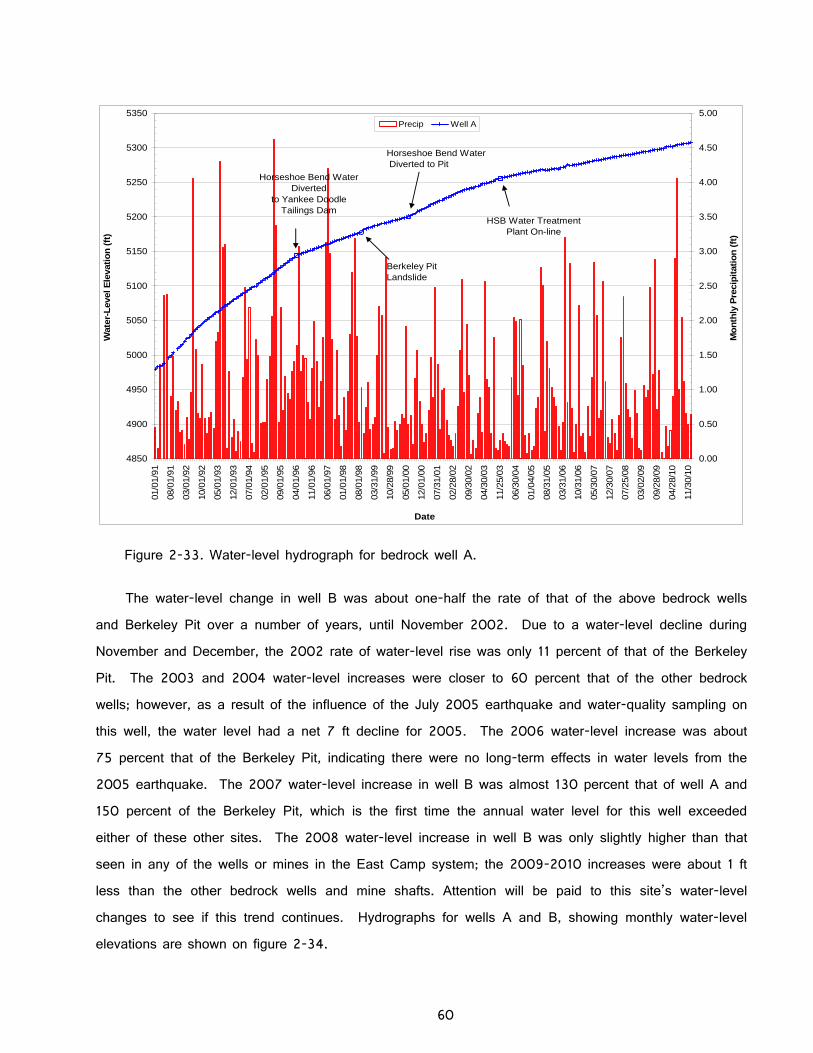
60
4850
4900
4950
5000
5050
5100
5150
5200
5250
5300
5350
01/0
1/91
08/0
1/91
03/0
1/92
10/0
1/92
05/0
1/93
12/0
1/93
07/0
1/94
02/0
1/95
09/0
1/95
04/0
1/96
11/0
1/96
06/0
1/97
01/0
1/98
08/0
1/98
03/3
1/99
10/2
8/99
05/0
1/00
12/0
1/00
07/3
1/01
02/2
8/02
09/3
0/02
04/3
0/03
11/2
5/03
06/3
0/04
01/0
4/05
08/3
1/05
03/3
1/06
10/3
1/06
05/3
0/07
12/3
0/07
07/2
5/08
03/0
2/09
09/2
8/09
04/2
8/10
11/3
0/10
Date
Wat
er-L
evel
Ele
vati
on
(ft
)
0.00
0.50
1.00
1.50
2.00
2.50
3.00
3.50
4.00
4.50
5.00
Mo
nth
ly P
reci
pit
atio
n (
ft)
Precip Well A
Horseshoe Bend Water Diverted
to Yankee Doodle Tailings Dam
Berkeley Pit Landslide
Horseshoe Bend Water Diverted to Pit
HSB Water Treatment Plant On-line
Figure 2-33. Water-level hydrograph for bedrock well A.
The water-level change in well B was about one-half the rate of that of the above bedrock wells and Berkeley Pit over a number of years, until November 2002. Due to a water-level decline during November and December, the 2002 rate of water-level rise was only 11 percent of that of the Berkeley Pit. The 2003 and 2004 water-level increases were closer to 60 percent that of the other bedrock wells; however, as a result of the influence of the July 2005 earthquake and water-quality sampling on this well, the water level had a net 7 ft decline for 2005. The 2006 water-level increase was about 75 percent that of the Berkeley Pit, indicating there were no long-term effects in water levels from the 2005 earthquake. The 2007 water-level increase in well B was almost 130 percent that of well A and 150 percent of the Berkeley Pit, which is the first time the annual water level for this well exceeded either of these other sites. The 2008 water-level increase in well B was only slightly higher than that seen in any of the wells or mines in the East Camp system; the 2009-2010 increases were about 1 ft less than the other bedrock wells and mine shafts. Attention will be paid to this site’s water-level changes to see if this trend continues. Hydrographs for wells A and B, showing monthly water-level elevations are shown on figure 2-34.

61
4900
4950
5000
5050
5100
5150
5200
5250
5300
5350
5400
Jan-
91
Jul-
91
Jan-
92
Jul-
92
Jan-
93
Jul-
93
Jan-
94
Jul-
94
Jan-
95
Jul-
95
Jan-
96
Jul-
96
Jan-
97
Jul-
97
Jan-
98
Jul-
98
Jan-
99
Jul-
99
Jan-
00
Jul-
00
Jan-
01
Jul-
01
Jan-
02
Jul-
02
Jan-
03
Jul-
03
Jan-
04
Jul-
04
Jan-
05
Jul-
05
Jan-
06
Jul-
06
Jan-
07
Jul-
07
Jan-
08
Jul-
08
Jan-
09
Jul-
09
Jan-
10
Jul-
10
Date
Wa
ter-
Lev
el
Ele
vati
on
(ft
)
Well A Well B
Dillon EarthquakeAlaska Earthquake
Figure 2-34. Water-level hydrographs for East Camp bedrock wells A and B.
Water levels in wells E and F do not follow the trends seen in the other bedrock wells (fig. 2-35). Water levels in these two wells are considerably higher than those in the other bedrock wells, indicating a lack of dewatering and interconnection to historic mining activities.

62
5360
5380
5400
5420
5440
5460
5480
Jan-
91
Jul-
91
Jan-
92
Jul-
92
Jan-
93
Jul-
93
Jan-
94
Jul-
94
Jan-
95
Jul-
95
Jan-
96
Jul-
96
Jan-
97
Jul-
97
Jan-
98
Jul-
98
Jan-
99
Jul-
99
Jan-
00
Jul-
00
Jan-
01
Jul-
01
Jan-
02
Jul-
02
Jan-
03
Jul-
03
Jan-
04
Jul-
04
Jan-
05
Jul-
05
Jan-
06
Jul-
06
Jan-
07
Jul-
07
Jan-
08
Jul-
08
Jan-
09
Jul-
09
Jan-
10
Jul-
10
Date
Wat
er-L
evel
Ele
vati
on
(ft
)
Well E Well F
Figure 2-35. Water-level hydrographs for East Camp bedrock wells E and F.
Well H was plugged and abandoned due to casing integrity problems and well J was drilled as a replacement for it in 1999. Water levels measured in well J since its completion in 1999 have been in the same range as those in other surrounding bedrock wells, and are shown on figure 2-36. Historic water levels for well H are shown on this figure with a linear projection of water levels included. Water levels for well J initially plotted very closely to those projected for well H, verifying that well J was completed in the same bedrock zone as well H. However, beginning in April 2004, the water level for well J plots below the projected water level for well H. This is a result of the filling rate slowing from the diversion and treatment of water from the HSB drainage. The projected water level for well H does not take into account the removal of HSB water from the pit.

63
4800
4900
5000
5100
5200
5300
5400
01/0
1/91
01/0
1/92
01/0
1/93
01/0
1/94
01/0
1/95
01/0
1/96
01/0
1/97
01/0
1/98
01/2
8/99
01/2
8/00
01/2
9/01
01/3
0/02
01/3
0/03
01/0
4/04
01/0
4/05
01/3
1/06
01/3
1/07
01/3
0/08
01/0
9/09
01/2
8/10
Date
Wat
er-L
evel
Ele
vati
on
(ft
)
Well G Well H Well J Linear (Well H)
HSB Water Treatment Plant On-Line
Figure 2-36. Water-level hydrographs for bedrock wells G, H, and J.
The monitoring program contained in the 2002 CD specified that water levels be monitored on a continuous basis in bedrock wells A, B, C, and G. Water-level transducers were installed in each of these wells and set to collect water-level data every hour. This detailed level of monitoring allows recording of changes in water levels not seen when only one water-level measurement is taken monthly. Figure 2-37 is a hydrograph for a selected time period where a number of different events occurred that influenced water levels in bedrock well A. The top graph (a) shows water-level data collected by a transducer and the level of detail when each different event occurred while the bottom graph (b) shows the level of detail from monthly water-level measurements. It is very apparent that the level of detail is much greater with the transducer data; the date and time a change occurs can be detected within a 1-hour time interval, and the magnitude of the change can be better determined. The increased level of monitoring allows a more accurate interpretation of water-level changes whether they are natural (i.e., earthquakes or slumps) or man-induced (i.e., pumping). Additional bedrock wells, beyond those specified in the 2002 CD, have been equipped with water-level transducers to better track water-level changes in the East Camp bedrock system in response to various mining related activities, i.e. grouting and back filling of underground mine workings, and the MERDI/MSE pumping

64
test at the Belmont Mine site. The sites with increased level of monitoring are: well D-2, well DDH-2, well J, and Parrott Park well.
Water-level monitoring continues to confirm that the flow of water in the affected bedrock aquifer is towards the Berkeley Pit. The potentiometric-surface map (fig. 2-38) for the East Camp bedrock aquifer shows the flow of water from all directions is towards the pit. While there were short-term influences on water levels in a number of these wells, the overall direction of groundwater flow did not change.

65
5250.00
5260.00
5270.00
5280.00
5290.00
5300.00
5310.00
04/0
1/05
03/2
7/06
03/2
2/07
03/1
6/08
03/1
1/09
03/0
6/10
Date
Ave
rage
Dai
ly W
ater
-Lev
el E
leva
tion (ft)
July 2005 Dillon Earthquake
December 2005-January 2006 MR
Pumping Tests
MR Backfilled Pittsmont Shaft #3
Well Pumped for Sampling
5260.00
5265.00
5270.00
5275.00
5280.00
5285.00
5290.00
5295.00
5300.00
5305.00
5310.00
04/0
1/05
05/3
1/05
07/3
0/05
09/2
8/05
11/2
7/05
01/2
6/06
03/2
7/06
05/2
6/06
07/2
5/06
09/2
3/06
11/2
2/06
01/2
1/07
03/2
2/07
05/2
1/07
07/2
0/07
09/1
8/07
11/1
7/07
01/1
6/08
03/1
6/08
05/1
5/08
07/1
4/08
09/1
2/08
11/1
1/08
01/1
0/09
03/1
1/09
05/1
0/09
07/0
9/09
09/0
7/09
11/0
6/09
01/0
5/10
03/0
6/10
05/0
5/10
07/0
4/10
09/0
2/10
11/0
1/10
12/3
1/10
Date
Wat
er-L
evel
Ele
vati
on
(ft
)
July 2005 Dillon Earthquake
December 2005 MR Pumping Test
Well Pumped for Sampling
MR Backfilled Pittsmont Shaft #3
Figure 2-37. Hydrographs for well A comparing daily average water level (top) and monthly water level (bottom) monitoring frequency.

66
Figure 2-38. Potentiometric map for the East Camp bedrock aquifer, December, 2010; arrows indicate direction of ground-water flow (contour interval is 10 feet).

67
Section 2.2.2.1 RI/FS Bedrock Well Water Quality
Water quality in the East Camp bedrock wells has shown little change in recent years. Data collected in 2010 indicate only slight change for most wells. Table 2.2.1.1.1 summarizes the water-quality trends over the past few years; as noted in previous reports, the status of well B changed with respect to MCLs due to the change in the water-quality standard of arsenic (from 18 μg/L to 10 μg/L). In most wells, there was little change in the concentration of dissolved constituents. Arsenic is the only MCL exceeded in the bedrock wells (excluding well J), while iron, manganese, zinc and sulfate are the SMCL’s most often exceeded. In addition, several wells have pH levels below recommended limits.
While a majority of sites exceed one or more secondary standards, the levels of concentrations between wells can vary considerably. Figure 2-39 shows iron and arsenic concentrations for six of the bedrock wells sampled during the spring of 2010. As can be seen on figure 2-39, iron concentrations vary from 1 mg/L to greater than 400 mg/L; while arsenic concentrations vary from 2 μg/L to greater than 1,200 μg/L.
Bedrock well J has the greatest number of water-quality exceedences. Water quality in this well has been very poor since its installation, which is not unexpected considering the close proximity of this well to the pit and the interconnection of adjacent mine workings to the pit. The well is completed approximately 40 ft above workings from the Pittsmont Mine that extend to the pit. Figure 2-40 is a comparison of selected trace metal concentrations for well A, well J and the Berkeley Pit sample collected 1-ft below the water surface. Well A is the farthest south well and concentrations are orders of magnitude less for most analytes; the water quality is similar between the pit and well J. This helps confirm the observations made by monitoring water levels that bedrock groundwater flow is towards the pit and no contamination is leaving the site. With the extremely high concentrations of copper, cadmium, and zinc in the pit water and well J, any migration of this water away from the pit would be easily detected in other well water samples.

68
Table 2.2.1.1.1 Exceedences and recent trends for East Camp bedrock wells, 1989 through 2010.
Well Name
Exceedences (1 or more)
Concentration Trend Remarks
A Y Unchanged Arsenic (MCL), iron, manganese, sulfate (SMCL).B Y Unchanged Arsenic (MCL), iron, manganese, sulfate (SMCL).
C Y Unchanged PH, iron, manganese, sulfate (SMCL). Zinc
concentrations variable, exceed SMCL occasionally.
D-1 Y Unchanged No longer sampled, replaced by well D-2
D-2 Y Unchanged Arsenic (MCL), pH, iron, manganese, sulfate, zinc
(SMCL). E Y Unchanged Sampled every two years; iron, manganese, sulfate
(SMCL). F Y Unchanged Sampled every two years, arsenic (MCL), iron,
manganese, sulfate (SMCL). G Y Unchanged PH, iron, manganese, sulfate (SMCL).
J Y Variable Very poor quality water; arsenic, cadmium, lead, uranium
(MCL); iron, manganese, sulfate, copper (downward trend) and zinc (SMCL).

69
0.1
1.0
10.0
100.0
1,000.0
10,000.0
Well A Well B Well C Well D-2 Well G Well J
Bedrock Well
Log S
cale
Iron C
once
ntr
atio
ns
(mg/L
)
0
1
10
100
1,000
10,000
Log S
cale
Ars
enic
Conce
ntr
atio
ns
(ug/L
)
Fe As
0
1
10
100
1,000
10,000
100,000
1,000,000
Arsenic Copper Zinc
2010 Sample Results
Log S
cale
Tra
ce M
etal
Conce
ntr
atio
ns
(ug/L
)
Well A Well J Berkeley Pit
Figure 2-39. Bedrock well iron and arsenic concentration comparisons, spring 2010.
Figure 2-40. Selected trace metal comparisons between bedrock wells A, J and the Berkeley Pit 1-ft depth sample.
70
Section 2.2.3 DDH Series Wells
Water-level monitoring of the DDH series wells continued. Five bedrock wells originally comprised the DDH well monitoring network; however, for various reasons this network now consists of only two wells, DDH-2 and DDH-8, as well DDH-1 is no longer suitable for monitoring. MR performed site maintenance and cleanup around the concentrator facility during 2007 and it appears this work led to the accidental plugging of the well DDH-1 borehole. For the year 2010, water levels rose 7.50 and 4.60 ft respectively, in the two remaining DDH wells. The rates of rise are consistent with those of the RI/FS bedrock wells and East Camp mine shafts. Figure 2-41 is a hydrograph for well DDH-2 showing water-level increases. Once again, precipitation does not show any effect on water-level rise. Well DDH-8 had an unexplained water-level increase during August 2005; its water level rose over 52 ft during the month. During this time the 2-inch PVC casing was removed and a submersible pump was installed to test the water for possible irrigation use. The water-level rise began prior to the well pumping and continued after its completion. Nothing out of the ordinary was noted during the pumping to account for the abnormal water-level change. During the remainder of the year water-level changes were similar to those of the other DDH series wells. The water-level rise in this well during 2010 was similar (7.50 ft) to the other bedrock wells however; the water-level elevation is over 50 ft higher than the other bedrock wells due to the unexplained 2005 increase. It is important to note that the DDH wells were not installed for monitoring purposes, they are old exploration holes that extend several thousand feet below ground surface and have various size casings installed. Due to completion uncertainties and the drilling techniques, it is not unexpected to have problems occur with these wells. In the past, another well (DDH-6) had to be plugged and abandoned due to casing integrity problems.
No water-quality samples were collected from these wells, as they are used only for water-level monitoring.

71
4800
4900
5000
5100
5200
5300Ja
n-90
Jan-
91
Jan-
92
Jan-
93
Jan-
94
Jan-
95
Jan-
96
Jan-
97
Jan-
98
Jan-
99
Jan-
00
Jan-
01
Jan-
02
Jan-
03
Jan-
04
Jan-
05
Jan-
06
Jan-
07
Jan-
08
Jan-
09
Jan-
10
Date
Wat
er-L
evel
Ele
vati
on
(ft
)
0.00
0.50
1.00
1.50
2.00
2.50
3.00
3.50
4.00
4.50
5.00
Mo
nth
ly P
reci
pit
atio
n (
in)
Precip DDH-2
Figure 2-41. Water-level hydrograph for bedrock well DDH-2.

72
Section 2.3 Berkeley Pit and Horseshoe Bend Drainage
The Berkeley Pit water-level elevation was surveyed each month to coincide with monthly water-level monitoring in wells and mine shafts. The hydrograph in figure 2-42 shows the pit’s water-level rise since 1995.
Berkeley Pit Water Level Elevations1995 to the Present
5050
5100
5150
5200
5250
5300
Jan-
95
Jul-
95
Jan-
96
Jul-
96
Jan-
97
Jul-
97
Jan-
98
Jul-
98
Jan-
99
Jul-
99
Jan-
00
Jul-
00
Jan-
01
Jul-
01
Jan-
02
Jul-
02
Jan-
03
Jul-
03
Jan-
04
Jul-
04
Jan-
05
Jul-
05
Jan-
06
Jul-
06
Jan-
07
Jul-
07
Jan-
08
Jul-
08
Jan-
09
Jul-
09
Jan-
10
Jul-
10
Jan-
11Date
Wat
er-
Lev
el E
leva
tion
(ft
)
Horseshoe Bend Water Divertedto Yankee Doodle Tailings Dam
Berkeley Pit Landslide
Horseshoe Bend Water Diverted to Pit
Horseshoe Bend Water Treatment Plant Comes On-Line
Figure 2-42. Water-level hydrograph of Berkeley Pit, 1995-2010.
The overall trend is similar to that of previous years. Four noticeable changes on figure 2-42 show the influence of physical changes on water-level rise. The first change represents a decrease in the filling rate (seen as a change in slope on the graph) when the HSB drainage diversion occurred in April of 1996; the second is an almost instantaneous water-level rise from the September 1998 landslide; the third depicts an increased filling rate (seen as a change in slope on the graph) following MR’s June 2000 suspension of mining and the subsequent inflow of water from the HSB

73
drainage to the pit; and the fourth shows the decrease in filling rate as a result of the HSB water-treatment plant coming on-line in November 2003 and the diversion of HSB drainage water away from the pit. From April 1996 through June 2000, water from the HSB drainage was diverted and incorporated into the mining and milling process. Following the June 2000 suspension of mining, water from the HSB drainage was again allowed to flow into the Berkeley Pit. The volume of water allowed to enter the pit exceeded 3.2 billion gallons from July 2000 through November 2003 when the water-treatment plant became operable. This represents an average flow of 1,820 gallons per minute (gpm) during the period of mine suspension. The overall Berkeley Pit water-level rise for 2010 was 7.32 ft, compared to 7.17 ft for 2009. Table 2.3.1 summarizes the changes in handling HSB water and other events that influenced changes in Berkeley Pit water-level filling rates.
Table 2.3.1 Summary of Events impacting Berkeley Pit Filling Rates.
Date Event ImpactJuly 1983-April 1996 Horseshoe Bend Drainage water and water from
precipitation plant ponds diverted to Berkeley Pit.Increases pit water-level filling rate.
April 1996 HSB water diverted to MR mining operations for treatment and disposal in Yankee Doodle Tailings Pond.
Slows the pit filling rate.
September 1998 Berkeley Pit southeast corner landslide 3-plus foot water-level increase.
June 2000 MR suspends mining operations; HSB water diverted to Berkeley Pit. Water from Continental Pit diverted to Berkeley Pit.
Increases pit water-level filling rate.
November 2003 MR resumes operations and HSB water-treatment plant comes on-line.
Slows the pit filling rate.
The 2002 CD contains a stipulation that the water level in the Berkeley Pit must remain below
those of other East Camp monitoring sites, referred to as the points of compliance. The CD identified four mines and four bedrock monitoring wells as the points of compliance. They are shown in Table 2.3.2 along with their December 2010 water-level elevation and the distance below the CWL. The Berkeley Pit water-level elevation is included with this table as a reference only. Based upon this information the current compliance point is the Pilot Butte Mine, which is located to the north of the pit.

74
Table 2.3.2. East Camp Points of Compliance and Depth Below CWL, December 2010.
Point of Compliance December 2010 Water-Level Elevation (ft) Depth Below CWL (ft)
Anselmo Mine 5315.93 94.07 Granite Mountain Mine(1) 5306.30 103.70 Pilot Butte Mine(1) 5317.00 93.00 Kelley Mine 5303.67 106.33 Belmont Well #2 5304.19 105.81 Well A 5307.62 102.38 Well C 5304.90 105.10 Well G 5315.75 94.25 Berkeley Pit (not a compliance point) 5292.30 117.70
(1) November 2010 water-level elevation, no access during December monitoring.
Flow monitoring of the Horseshoe Bend drainage continued throughout 2010. As discussed in previous reports, the 900 V-notch weir was relocated upstream in the HSB drainage to accommodate infrastructure changes associated with the water-treatment plant construction. Construction activities affected flow monitoring at times from April through October 2002, however, there have been no major disruptions of monitoring activities since then. Ice build-up on the holding pond and bio-fouling of the transducer used to measure flow are ongoing problems associated with monitoring at this site. However, more frequent site visits to clean the transducer and note gauge height readings have helped to minimize problems. During portions of late 2007, backwater conditions occurred periodically from a buildup of iron-hydroxide inside the influent pond inlet pipe that may have produced erroneous high flow measurements at the weir. The 2007 average daily flow rate was 3,297 gpm, an increase of almost 500 gpm from 2006 year. The 2008 average daily flow rate was 3,261 gpm, a decrease of 36 gpm, while the 2009 average daily flow rate was 3,194 gpm, a decrease of 67 gpm. The 2010 average daily flow rate was 3,111, a decrease of 83 gpm. A total of 1.72 billion gallons of water flowed through this site in 2010 for treatment in the HSB water treatment plant. Figure 2-43 shows the daily average flow rate from July 2000 through December 2010.

75
0
500
1,000
1,500
2,000
2,500
3,000
3,500
4,000
4,500
5,000
5,500
6,000
6,500
7,000
7,500
8,000
8,500
9,000
07/
01
/00
11/
01
/00
03/
01
/01
07/
01
/01
11/
01
/01
03/
01
/02
07/
01
/02
11/
01
/02
03/
01
/03
07/
01
/03
11/
01
/03
03/
01
/04
07/
01
/04
11/
01
/04
03/
01
/05
07/
01
/05
11/
01
/05
03/
01
/06
07/
01
/06
11/
01
/06
03/
01
/07
07/
01
/07
11/
01
/07
03/
01
/08
07/
01
/08
11/
01
/08
03/
01
/09
07/
01
/09
11/
01
/09
03/
01
/10
07/
01
/10
11/
01
/10
Date
Dis
ch
arg
e (g
pm
)
Mean Daily Flow Rate July 1, 2000 through December 29, 2010 - 2,402 GPM
HSB drainage construction activities begin
Weir relocated
Water treatment plant on-line,
11/25/03
Figure 2-43. Horseshoe Bend Drainage flow rate, July 2000 through December 2010.
Flows measured at the HSB Falls flume averaged 307 gpm for 2010, a decrease of 756 gpm (70percent) from the 2009 average. This flow is considerably less than recent years and the historic flow rates of 1,000 gpm or more reported by MR. Figure 2-44 shows both historic flow rates when MR operated this site and current flow rates since the MBMG began monitoring. The decreased flow from this site greatly exceeds the decreased flow seen for the entire HSB drainage; it is possible the sources that have contributed to the HSB Falls seeps are emanating at different locations since there is no corresponding significant drop in the overall flow in the HSB drainage.

76
0
500
1,000
1,500
2,000
2,500
08/0
1/97
01/3
0/98
07/3
1/98
01/2
9/99
07/3
0/99
01/2
8/00
07/2
8/00
01/2
6/01
07/2
7/01
01/2
5/02
07/2
6/02
01/2
4/03
07/2
5/03
01/2
3/04
07/2
3/04
01/2
1/05
07/2
2/05
01/2
0/06
07/2
1/06
01/1
9/07
07/2
0/07
01/1
8/08
07/1
8/08
01/1
6/09
07/1
7/09
01/1
5/10
07/1
6/10
01/1
4/11
Date
Flo
w (
gp
m)
MR Data
MR installs new flume
MR suspends mining
MR resumes mining
MBMG begins monitoring
Figure 2-44. Horseshoe Bend Falls long-term daily average flow rates, includes both MR and MBMG data.
Based upon the flow data recorded during both the 2000-2003 mine suspension and flows since then, the operation of the Yankee Doodle Tailings Dam as a disposal area for mill tailings is very important to the flow of water from the HSB drainage.
Section 2.3.1 Berkeley Pit and Horseshoe Bend Drainage Water Quality
Water-quality sampling of the Berkeley Pit typically occurs twice per year; however, only the spring sample event was completed during 2010. Mechanical problems with the boat and the onset of winter conditions that made sampling unsafe led to the cancellation of the fall event. Samples were collected at a minimum of three depths. In addition to collecting samples for inorganic analysis, a vertical profile throughout the upper portion (0–600 ft) of the water was performed that measures in-situ physical parameters. The physical parameters measured are: pH, specific conductance, temperature, oxidation-reduction potential, and dissolved oxygen. Turbidity is measured periodically.
Water-quality samples were collected monthly from the Horseshoe Bend drainage at the weir used for flow monitoring. This site is just upstream of the influent pond associated with the HSB

77
water treatment plant. Therefore, this water is representative of the water entering the plant for treatment.
Section 2.3.1.1 Berkeley Pit Water-Quality Sampling and Monitoring Overview
It took 19 months (April 1982-November 1983) for the flooding underground mine waters to reach the elevation of the bottom of the Berkeley Pit, however, water had been accumulating in the pit bottom from contaminated surface water sources that were diverted into the pit in 1982 and again in 1983 for containment. The first water samples were collected from the pit in the fall of 1984. These samples and the 1985 samples were collected using a helicopter that hovered above the water surface (figure 2-45). A point-source bailer was lowered from the helicopter into the pit water. Sampling in 1986 and 1987 used a helicopter to ferry in boats that were used for sample collection. Much more accurate sampling and vertical profiling of the pit water column were accomplished during these events. By the summer of 1991 the water level within the pit reached a point that old haul roads could safely be re-opened, allowing sample crews to drive to the water’s edge. Since that time samples have been collected from a temporarily installed stationary platform or boats, which allowed the collection of high-quality data.
MR purchased a pontoon boat in 1996 for use in their waterfowl-monitoring program and they have allowed the MBMG use of this boat for monitoring and sampling activities since (figure 2-46).

78
Figure 2-45. 1985 Berkeley Pit sampling event.
Figure 2-46. MR pontoon boat is used for Berkeley Pit sampling. Boat is docked next to pump station used for pumping pit water to precipitation plant for copper recovery. (Photo courtesy of Daryl Reed, DEQ)

79
Section 2.3.1.2 Berkeley Pit Water Chemistry
Currently the Berkeley Pit water is approximately 800 ft deep, consisting of roughly 39.7 billion gallons of low pH, high saline water. Since flooding of the Berkeley Pit commenced in 1982, the MBMG has been the primary agency that has consistently collected, analyzed, and interpreted the data. Prior to 2001, water-quality samples were collected when deemed necessary, i.e., during the RI/FS investigation, with records going back as far as November 1984. Water quality in the Berkeley Pit has been monitored on a semi-annual basis since the spring of 2001, as per terms of the 2002 CD. This report focuses primarily on the data collected since that time, as it is consistent and precise data. Data collected prior to 2001, though accurate, are not as consistent as the semi-annual monitoring which began in 2001, and for the most part are excluded from this report. Records dating back to November 1984 are published and can be found on the online MBMG Ground-Water Information Center (GWIC) website (GWIC 2010). A publication by Gammons and Duaime (2006) focuses on the long-term changes in the limnology and geochemistry of the Berkeley Pit Lake System.
Throughout the years, changes in water quality in the Berkeley Pit may be linked to a number of factors such as seasonal changes, occurrence of landslides, MR copper (Cu) recovery operations, dumping of high-density sludge into the Berkeley Pit from the HSB water treatment plant, and the diversion of HSB water into and away from the pit surface water. The following sections attempt to determine the factors associated with some of the recent water-quality changes.
Section 2.3.1.3 Physical Parameters
Physical parameters of pH, specific conductance (SC), oxidation reduction potential (ORP), and temperature were measured in-situ using Hydrolab multi-parameter sampling equipment from 0-780 ft (total depth of Pit at sampling location) during each event. Depth profiles for the 2010 sampling event is presented in figure 2-47, and long-term (2001-2010) changes can be found in figure 2-48.

80
Figure 2-47. 2010 spring depth profile for the Berkeley Pit Lake System.
Due to hazardous working conditions in October and November of 2010, the fall sampling event was cancelled and only the spring sampling event was conducted, occurring on 25-May-2010. Depth profiles for pH(A), temperature (B), specific conductance (C), and Eh (D) were similar to those observed in the fall of 2009. Other than changes observed in the surface waters (upper 50 feet) caused by wind driven effects, temperature gradients, and dissolved oxygen concentrations, Berkeley Pit depth profiles remained homogeneous below 45 feet. A chemocline was not observed at depth. Profiles collected in the fall are shown for eight years (2002, 2005, 2006, 2007, 2008, 2009, and 2010 (May 2010)) in figure 2-48. All data were collected by members of the MBMG staff. Profiles collected in 2002 represent a time when HSB water was being diverted into the Berkeley Pit, and is a representation of the three-year period when HSB water was allowed to pool in the Berkeley Pit surface water, and copper recovery operations were suspended. In November 2003, the HSB treatment plant went online, capturing and treating HSB water, and in January of 2004 Montana Resources began pumping at depth for Cu-recovery operations. Profiles shown from 2005 to 2010 represent five consecutive years of Cu-recovery.

81
Figure 2-48. Long-term changes in depth profiles for selected parameter in the Berkeley Pit Lake. All data from all years are representative of fall sampling events, and were collected by the MBMG.
Seasonal temperature profiles (figure 2-47, B) suggests that a thermocline exists in the surface waters (upper 50 feet) during the summer and winter months. During winter, colder air temperatures influence the shallow waters, creating a seasonal shallow epilimnion. Inversely, warmer air temperatures in the summer create thermal stratification with warmer waters on top of colder, creating

82
thermal stratification of the surface water. During early spring and late fall, the effects of air temperature create water temperatures in the shallow epilimnion that are constant with the metalimnion waters, and mixing between the first two zones (turnover) is possible.
Prior to fall 2009, a density stratification boundary known as the chemocline was observed at varying depths of the water column, creating a meromictic lake with two very different water qualities above and below the chemocline. The column of water above the chemocline, referred to as the mixolimnion, was distinguished from the water column below the chemocline (monimolimnion), by higher values of pH, lower specific conductivity, lower concentrations of dissolved metals, and higher oxidation-reduction potential. Since the fall of 2003, the depth of the chemocline has been increasing as a direct result of the pumping from the MR Cu-recovery operations (figure 2-49). Evidence of the increasing depth of the chemocline is noted in all depth profiles, and has been discussed in previous reports (Duaime and Tucci, 2007, Duaime and Tucci 2008, Duaime and Tucci 2010). The effects of the Cu-cementation process on the chemocline are best observed in the SC profile (figure 2-48). Prior to January 2004, the depth of the chemocline, though variable, remained less than 50 ft below water surface. Since that time, pumping (>10,000 gpm for seven years) from the Cu-recovery process has drawn down the chemocline at an average rate of 60 ft per year. This rate of decline has increased with time, as the diameter of the pit narrows with depth (figure 2-49). As of November 2009, the density stratification boundary known as the chemocline was pumped to extinction. Subsequent profile sampling in 2010 remain consistent with November 2009 profiles, where the presence of a chemocline has not been observed. The effects of the extinction of the chemocline will result in dimictic (turnover twice a year, once in spring, once in fall) lake turnover and more homogenous water quality in the Pit with respect to depth. As a result, the Pit has transitioned from a miromictic (no annual turnover) lake to a holomictic (turnover) lake. The frequency and extent of mixing will depend on seasonal affects and wind driven events on the Pit, but given the depth to surface area ratio of the pit, turnover should only occur twice a year (dimictic). As a result, the water quality of the deeper pit zone has changed drastically, as oxygen is more readily introduced at depth as a result of frequent turnover events. Ratios of Fe II/Fe III have decreased at depth, which will affect oxidation reduction potential and the solubility of many metals, including copper. The lack of a chemocline will have a positive impact on water quality at depth, but a negative impact on the efficiency of MR’s Cu-recovery process.

83
Figure 2-49 Depth of the Berkeley Pit Chemocline over time.
Additionally, depth profiles of SC (figure 2-48C) and Eh (figure 2-48D) appear to indicate homogeneous water quality conditions throughout the water column. Relatively homogeneous physical parameters with respect to depth are indicative that turnover is occurring, creating a well-mixed water column. Without thermal or density stratification, the Berkeley Pit should remain a chemically homogeneous mixture with respect to depth, experiencing one to several turnover events per year.
As a general rule, pH in the Berkeley Pit remains between 2.4 and 2.8. At depth, little change has been noted over the years. With respect to pH, the Berkeley Pit is a well buffered system. The presence of secondary iron minerals, such as schwertmannite and k-jarosite are in chemical equilibrium with respect to solid/aqueous concentrations, and the buffering capacity of aqueous sulfate are the geochemical processes which have kept the pH constant over the years.
Section 2.3.1.4 Chemical Parameters
Notable changes in the chemistry of the Berkeley Pit have occurred as a result of Cu-recovery activities and diversion of HSB water away from the Berkeley Pit since November 2003. Water-
Pit Bottom
Mixolimnion
FeIII>Fe
II
[Cu] = 60mg/L

84
quality samples for chemical analysis were collected by the MBMG at a minimum of three depths on a semi-annual basis, and results were published on the MBMG GWIC online database (GWIC 2010). This database contains a large amount of data pertaining to the water quality of the Berkeley Pit. This section discusses some of the recent water-quality changes in chemical parameters that have been observed.
The Cu-recovery process currently extracts water at a depth >700 ft below the water surface. This water is then passed over scrap iron where the copper plates onto the iron through a process known as oxidative-reductive ion exchange. Dissolved iron replaces the copper in solution, and this iron-rich, low copper-depleted water is discharged to the surface water of the pit. The chemical equation for this process is described below:
Cu2+(aq)+ Fe(s) Fe2+(aq)+ Cu(s) The chemistry of these waters are illustrated in Table 2.3.1.4.1. Influent and effluent samples
from the copper-precipitation process were taken in November of 2007, and are represented in the table as precip-in and precip-out respectively. Influent samples are consistent with the depth from which they were extracted (~ 700 ft below surface (fbs)). Effluent samples, as a result of the ion exchange process are lower in copper concentrations and higher in iron concentrations.
Table 2.3.1.4.1 Water composition that currently represents the Berkeley Pit Lake System.
pH SC Ca Mg Na K Fe Mn Al Cu Zn As SO4 Precip-in 2.57 7,400 458 546 75 10 413 255 289 67 606 0.1 8,750Precip-out 3.01 7,896 452 517 77 8 1,147 249 267 27 649 0.07 9,087BP Surface 2.63 6,670 475 530 78 6 428 253 272 59 588 0.08 6,997BP 700 fbs 2.44 7,140 447 530 78 6 428 251 281 66 591 0.09 7,187
All data shown in this table are from the November 2007 sampling event. All data are in mg/L except pH (standard units) and SC (us/cm@250C).
Currently, the Cu-recovery process is recycling deep Berkeley Pit water to the Berkeley Pit surface at an approximate rate of 11,000 gpm. This process has been in operation since 2004, and has had significant impacts on the chemistry of the Pit at all depths. The high concentrations of dissolved iron in the effluent return water from the Cu-cementation plant has significantly increased

85
the precipitation and formation of secondary iron precipitates throughout the water column. The increased formation of secondary iron precipitates (Figure 2-50), such as schwertmannite (Fe8O8(OH)6SO4) and K-jarosite (KFe3(OH)6(SO4)2), is the leading factor contributing to the changes in water quality seen in the Berkeley Pit since 2004. Since the initiation of Cu-precipitation in the Berkeley Pit (fall, 2003), roughly 150 million pounds of Fe has precipitated as secondary iron precipitates in 7 years.
Mining the Berkeley Pit water for copper has had many significant and positive impacts on water quality in the Berkeley Pit. Water quality in Precip Plant influent samples are given in table 2.3.1.4.2. Between 2001 to 2010, significant decreases have been observed for Fe (56percent), Cu (60percent), P (88percent), and As (87percent). These changes are reflected in Berkeley Pit water quality at all depths. The most significant water-quality changes attributed to the Cu-recovery process are described in Figures 2-51 through 2-54.

86
Figure 2-50. Accumulation of secondary iron precipitates in a sediment trap deployed in the Berkeley Pit for 150 days.

87
Table 2.3.1.4.2 Water quality changes to Precipitation plant influent.
Date pH SC TDS Ca Mg Na K Fe Mn Al Cu Zn P As SO4 µs/cm mg/L mg/L mg/L mg/L mg/L mg/L mg/L mg/L mg/L mg/L mg/L µg/L mg/L
8/20/2001 2.55 8,610 12,610 442 499 86 9 932 238 270 167 626 0.8 731 9,160 2/24/2003 2.40 7,645 12,490 460 511 78 8 899 244 262 156 513 0.6 750 9,250 7/8/2005 3.01 7,310 13,567 465 526 82 7 1046 254 238 182 651 0.7 303 9,980
6/25/2010 2.57 7,400 11,633 458 546 75 10 413 255 289 67 606 0.1 96 8,750 Percent
Decrease NC 14 8 NC NC NC NC 56 NC NC 60 NC 88 87 5
The effects of the MR copper cementation plant on dissolved iron are presented in figure 2-51. Decreasing trends were observed at all depths from 2004 – 2009. The most significant decreases were seen at depth. As of November 2009 sampling event, homogeneous water-quality conditions with respect to Fe were present throughout the water column, as evidenced by well-mixed Fe concentrations at all depths. These homogenous conditions were also observed in the single event collected in 2010, where Fe concentrations at all depths have appeared to stabilize around 450 mg/L.

88
Figure 2-51. Effects of MR Cu-precipitation plant on dissolved iron.
Changes in dissolved-iron speciation in the surface water and at depth are presented in figure 2-52. Significant decreases were observed in ferrous iron (Fe II) between 2006-2008 at depth. These observations do not coincide with increases observed for ferric iron, concentrations of Fe III have remained stable. These observations are consistent with changes observed by increases in the oxidation-reduction potential (figure 2-48) at depth over the same time period. As of November 2009, concentrations of Fe II < Fe III, reversing a trend (Fe II > Fe III) observed since fall 2003.
0
100
200
300
400
500
600
700
800
900
0 100 200 300 400 500 600 700 800 900 1,000 1,100
Depth (mg/L)
Fe (mg/L)
10/02
5/05
06/08
11/07
10/06
05/10 11/09
Time

89
0
100
200
300
400
500
600
700
800
900
1000
2003 2004 2005 2006 2007 2008 2009 2010
[Fe] (m
g/L)
Year
Fe(II) Surface
Fe(III) Surface
Fe(II) Bottom
Fe (III) Bottom
Figure 2-52. Effects of MR Cu-cementation process on Fe speciation.
The effects of the MR copper cementation plant on dissolved copper are presented in figure 2-53. Decreasing trends were observed at all depths from 2007 – 2009. Most significant decreases were seen at depth. The decrease in Cu is explained by the co-precipitation of copper onto secondary iron precipitates. As of November 2009, homogeneous water quality conditions with respect to Cu are present throughout the water column. Overall, concentration of Cu in the Berkeley Pit decreased 50 percent since 2002.

90
0
100
200
300
400
500
600
700
800
0 50,000 100,000 150,000 200,000 250,000
Depth (feet)
Cu (ug/L)
10/02
06/08
11/07
10/06
05/05
11/09
05/10
Time
Figure 2-53. Effects of MR Cu-precipitation plant on dissolved copper.
Arsenic concentrations, more than any other dissolved contaminant, have shown decreasing trends at all depths over time. Concentrations of As have decreased by more than an order of magnitude. Figure 2-53 portrays trends in arsenic at all depths on four sampling events. The significant decrease of As concentrations are explained by the co-precipitation of arsenic onto secondary iron precipitates, and can be directly attributed to the Cu-precipitation process. Mining the copper in the Berkeley Pit has significantly removed a major contaminant of concern. Concentrations of As have appeared to stabilize at all depths since June-2008.
Time

91
Figure 2-54. Effect of MR Cu-precipitation on dissolved As at all depths.
Arsenic concentrations reached their maximum values during the later period of mine suspension. Following the resumption of mining and the diversion of HSB water away from the pit, arsenic concentrations in the surface water began to decrease (2002 sampling event) and further decreases in arsenic concentrations at all depths are shown in later sampling events. Similarly, phosphate concentrations (PO4) show the same decreasing trends, suggesting PO4 is co-precipitating as well.
Seven years of Cu recovery by MR have resulted in the elimination of the chemocline, significant decreases in both Cu and Fe concentrations (50percent reductions), and dissolved P and As concentrations have decreased by an order of magnitude. Decreases in major trivalent and divalent cations, such as Fe and Cu, have had a positive impact on total acidity of the Berkeley Pit. Total acidity is described below:
[H+ + HSO4-] + 2[Fe2+ + Cu2+ + Zn2+ + Mn2+] + 3 [Fe3+ + Al 3+]
By this equation, it would appear that seven years of MR’s Cu recovery process have resulted in a 12.5percent decrease in total acidity in the Berkley Pit. A decrease in total acidity results in a
0
100
200
300
400
500
600
700
800
900
0 200 400 600 800 1,000
Dep
th (Feet)
As (ug/L)
10/02 5/05 10/06
11/07 06/08 11/09
05/10
10/02
5/05
11/07
Time

92
significant cost benefit, as less lime at the Horseshoe Bend Treatment Plant is needed to treat pit water with less acidity. To confirm decrease in acidity calculated from the equation above, acidity titration experiments of Pit water are planned by MBMG in the future.
Section 2.3.2 Horseshoe Bend Water Quality
Monitoring of the HSB drainage began in July 2000 following MR’s temporary suspension of mining. Similar to the changes seen in flow rates during the period of mine suspension, concentrations in a number of the trace metals decreased also. Metal concentrations began to increase in mid-2004 when flow rates increased (figure 2-55). Copper and zinc concentrations increased through early and mid-2006, respectively, before declining. Copper concentrations are currently less than one-third those seen in 2000, while zinc concentrations are similar to 2000 concentrations.
The water quality of the HSB drainage continues to be slightly better than that of the Berkeley Pit (table 2.3.2.1).
Table 2.3.2.1 Selected chemistry from Berkeley Pit and Horseshoe Bend waters.
Area
SampleDate
pH (S.U.)
SO4 (mg/L)
Al(μg/L)
Cu(μg/L)
Pb (μg/L)
Zn(μg/L)
Berkeley Surface 5/26/10 2.63 6,997 272,109 58,477 24 588,063
HSB 5/14/10 3.88 4,740 171,847 32,105 <5 227,464

93
0
50
100
150
200
250
300
350
400
450
01/0
1/00
12/3
1/00
12/3
1/01
12/3
1/02
12/3
1/03
12/3
0/04
12/3
0/05
12/3
0/06
12/3
0/07
12/2
9/08
12/2
9/09
12/2
9/10
Date
Con
centr
atio
n (m
g/L
)
0.00
1.00
2.00
3.00
4.00
5.00
6.00
7.00
8.00
9.00
pH
Iron Manganese pH
0
100,000
200,000
300,000
400,000
500,000
600,000
01/0
1/00
01/0
1/01
01/0
1/02
01/0
1/03
01/0
1/04
01/0
1/05
01/0
1/06
01/0
1/07
01/0
1/08
01/0
1/09
01/0
1/10
01/0
1/11
Date
Con
cent
ration
(ug
/L)
0
1,000
2,000
3,000
4,000
5,000
6,000
Flo
w (gp
m)
Copper Zinc Flow
Figure 2-55. Horseshoe Bend water quality comparisons of selected constituents, 2000-2010.

94
SECTION 3.0 WEST CAMP SYSTEM
Water-level monitoring continued during 2010 in the three mine shafts and six monitoring wells (fig. 3-1) that comprise the West Camp system. ARCO diverted the water pumped from the West Camp to the Lower Area One wetlands demonstration site during March 2002. Pumping occurred almost continuously throughout 2010, with pumping rates about 3 percent more than 2009. Due to the overall pumping rate being more in 2010 when compared to 2009, water levels decreased throughout the underground mine system; water levels at the end of 2010 were 13 ft below this sites’ critical water-level elevation.
Section 3.1 West Camp Underground Mines
Water levels in the West Camp Mine system continue to be controlled by pumping facilities located at the BMF-96-1D and BMF-96-1S site. ARCO had a special well drilled for dewatering (pumping) purposes in the fall of 1997, which is referred to as the West Camp Pumping Well (WCPW). Pumping activities were transferred from the Travona Mine to this site on October 23, 1998. The pump and pipeline at the Travona Mine were left intact, however, allowing it to serve as a backup pumping system.
The West Camp pumping system operated almost continuously during 2010, with the exception of several short periods for maintenance. The quantity of water pumped was similar to that for 2004-2008. A total of 253 acre-ft of water was pumped during 2010 compared to 247 acre-ft of water pumped during 2009 and 255 acre-ft pumped in 2008. Table 3.1.1 shows the annual amount of water pumped in acre-ft, the change in acre-ft from the previous year, and the percent change from 1996 (the first full year of continuous pumping). Figure 3-2 shows the amount of water pumped annually and the percent of average annual precipitation since 1982.

95
Figure 3-1. West Camp monitoring sites location map.

96
Table 3.1.1 Annual quantity of water pumped from the West Camp, in acre-feet.
Year Total AmountPumped (Acre ft)
Change From PriorYear (Acre ft)
Percent ChangeFrom 1996
1989 1990 1991 1992 1993 1994 1995 1996 1997 1998 1999 2000 2001 2002 2003 2004 2005 2006 2007 2008 2009 2010
8.50 212.54 130.16 92.82 140.18 109.31 182.54 244.56 287.70 370.72 326.56 270.20 260.37 247.66 231.43 254.70 257.82 290.33 273.96 255.16 247.03 253.49
+204.04 -82.38 -37.34 +47.36 -30.87 +73.23 +62.02 +43.14 +83.02 -44.16 -56.36 -9.83 -12.71 -16.23 +23.26 +3.12
+32.51 -16.37 -18.79 -8.13 6.46
11815213411010610195
104105119112104101104
0
50
100
150
200
250
300
350
400
1989
1990
1991
1992
1993
1994
1995
1996
1997
1998
1999
2000
2001
2002
2003
2004
2005
2006
2007
2008
2009
2010
Date
Annual
Am
ount P
um
ped
, Acr
e Fee
t
0
20
40
60
80
100
120
140
160
Per
cent of A
nnual
Pre
cipitat
ion, 1
982-
2010
Precip Acre-Feet
Figure 3-2. Annual amount of water pumped from the West Camp system.

97
All three mines had a net water-level decrease between 1.26 and 1.94 ft during 2010. Water-level changes in the West Camp mines reflect changes in pumping rates in the WCPW and precipitation amounts. Figure 3-3 shows annual water-level changes for the West Camp sites. Water levels are more than 13 ft below the West Camp action level of 5,435 ft stipulated in the 1994 ROD.
Water-level elevations for the three West Camp mines are shown on figure 3-4. Water levels in these mines are almost identical and continue to follow the trends of previous years. Pumping rates and the amount of water pumped are the most important controls on water levels.
-30.00
-20.00
-10.00
0.00
10.00
20.00
30.00
40.00
50.00
60.00
70.00
1982
1983
1984
1985
1986
1987
1988
1989
1990
1991
1992
1993
1994
1995
1996
1997
1998
1999
2000
2001
2002
2003
2004
2005
2006
2007
2008
2009
2010
Year
Annual W
ate
r-L
evel C
han
ge (ft
)
Travona Emma Ophir AMC-21 Chester Steele BMF96-1D BMF96-1S BMF96-2 BMF96-3 BMF96-4
Figure 3-3. Annual water-level changes for West Camp site

98
5000
5050
5100
5150
5200
5250
5300
5350
5400
5450
5500
MA
Y-8
2
MA
R-8
3
JAN
-84
NO
V-8
4
SE
P-8
5
JUL-8
6
MA
Y-8
7
MA
R-8
8
JAN
-89
NO
V-8
9
SE
PT-9
0
JULY
-91
MA
Y-9
2
MA
R-9
3
JAN
-94
NO
V-9
4
SE
PT-9
5
JULY
-96
MA
Y-9
7
MA
R-9
8
JAN
-99
NO
V-9
9
SE
PT-0
0
Jul-01
May-
02
Mar-
03
Jan-0
4
Nov-
04
Sep-0
5
Jul-06
May-
07
Mar-
08
Jan-0
9
Dec-
09
Sep-1
0
Date
Wat
er-L
evel
Ele
vati
on
(ft
)
0.00
0.50
1.00
1.50
2.00
2.50
3.00
3.50
4.00
4.50
5.00
Mo
nth
ly P
reci
pit
atio
n (
inch
es)
Precip Travona M ine Emma M ine Ophir M ine
Figure 3-4. Water-level hydrographs for West Camp mines.

99
Section 3.2 West Camp Monitoring Wells
Water levels increased in all five BMF96 West Camp wells during 2010. Well BMF96-1D, which was completed into the Travona Mine workings, had water-level changes (increases) similar to the West Camp mines. These changes are shown in table 3.2.1 and on figure 3-3.
Figure 3-5 contains water-level hydrographs for wells BMF96-1D, BMF96-1S and BMF96-4. Water levels in wells BMF96-1D and BMF96-4 respond similarly to one another, reflecting the influence pumping has on the system and how interconnected the wells are to the mine workings. This is an important trend since well BMF96-4 was not completed into mine workings. It is, however, in the area of the historic 1960's flooding problems that led the Anaconda Company to install well AMC-21 for control of water levels in the West Camp (fig. 3-6). (See Duaime, and others, 1998 for a greater discussion of historic flooding problems in the West Camp System). There is a lag time between the responses seen in these two wells, which is most likely due to the fact well BMF96-4 was not completed into mine workings. During periods of continued water-level change in wells BMF96-1D and BMF96-4, there appears to be a similarity in water-level change in well BMF96-1S. Well BMF96-1S is located adjacent to well BMF96-1D, but was completed at a much shallower depth in the weathered bedrock of the Missoula Gulch drainage. This well also shows a response to pumping in the WCPW. There was no change in longer term trends in any of these wells from those described in the previous reports.
Water levels in wells BMF96-2 and BMF96-3 are 20 ft to 50 ft higher than those in wells BMF96-1D and BMF96-4, and when plotted with the other BMF96 wells, initially appeared to show very little change (fig. 3-7). Since 2002, water levels in these two wells appear to follow trends similar to the other wells. When these wells are plotted separately (fig. 3-8), there is considerable variation in monthly water levels, and water levels in both wells respond similarly. Monthly precipitation is shown on this figure and water levels are seen to respond very quickly to precipitation events. Although these wells were completed at depths of 175 ft below ground surface, their water levels are less than 20 ft below ground surface. Water-level trends during 2010 in these wells for the most part were similar to those seen the previous several years. Water levels rise not only with precipitation, but with infiltration from snow melt, which is shown by the early season (March-April) water-level increases. During the last half of 2001, an unexplained

100
Table 3.2.1 Annual water-level changes for the West Camp sites, in feet.
Year Travona Emma Ophir ChesterSteele
BMF96-1D
BMF96-1S
BMF 96-2
BMF 96-3
BMF96-4
1982 1983 1984 1985 1986 1987 1988 1989 1990 1991
4.30 2.00
55.90 61.90 36.10 49.70 15.69 5.67
-18.42 13.88
14.20 6.60
-18.66 13.52
16.42 1.79
-5.77 -8.28
Change Years 1-10
226.72
15.66
4.16
1992 1993 1994 1995 1996 1997 1998 1999 2000 2001
7.21 1.01 4.24 0.98 3.72 7.29 -7.31 -0.97 5.56 1.65
6.79 0.93 4.26 -1.00 -3.76 7.28
-7.88 -0.47 5.61
-1.70
4.00 -0.96 -3.56 7.22
-7.20 -1.03 5.53 -1.52
-11.20 -1.11 5.36
12.72 6.14
14.82 -2.51 -5.37 -4.64 15.61
-1.50 7.20 -7.35 -0.82 5.70 -1.78
-5.41 7.36
-5.63 -0.61 1.45 1.70
0.00 2.13
-2.00 -1.15 -1.13 3.23
-2.85 -0.19 -0.26 -0.38 -0.07 0.10
-0.80 -5.88 -1.76 1.86 1.40
Change Years 11-20
-10.68
10.06
2.48 29.82 1.45 -1.14 1.08
-3.65 -5.18
2002 2003 2004 2005 2006 2007 2008 2009 2010
1.33 1.45
-1.06 0.39 -1.62 8.68
-8.57 5.68 -1.49
1.74 0.95
-0.72 0.22 -1.49 8.56
-8.39 0.56 -1.94
1.51 0.87
0.73** -1.30 -1.33 8.57 -8.15 1.09 -1.26
-6.35 12.94 -4.22 -11.35 4.76 -0.41 -5.41 1.26
-1.98
2.03 0.56
-0.72 0.03 -1.15 8.49 -8.71 0.91 -1.61
-0.62 0.96 1.03 -1.42 0.65 1.93
-2.65 2.05 -0.41
-2.06 -0.01 1.41
-0.23 0.59 -0.17 -0.14 0.04 0.42
-0.21 0.00 0.33 0.18
-0.31 0.13
-0.06 0.10
-0.23
-0.93 0.54 -0.31 -0.47 0.20 4.41
-4.96 1.22
-0.60Change Years 21-29
4.79
-0.51
0.73
-10.76
-0.17
1.52
-0.15
-0.07
-0.90
Net Change* 242.19 25.21 3.21 23.22 1.28 0.38 0.93 -3.72 -6.08
*Total water-level change is that measured. Access or obstructions occasionally prevent water-level measurements. **Vandalism to Ophir Mine monitoring point resulted in no water levels being obtained for the last quarter of 2004.

101
water-level increase of several feet occurred in well BMF96-2; this was not seen in other wells. This trend did not continue in 2002 or beyond; the water level in well BMF96-2 has followed that of well BMF96-3 ever since.
5400
5410
5420
5430
5440
5450
5460
09/2
4/96
11/0
6/96
01/2
2/97
04/0
2/97
06/1
8/97
09/0
3/97
10/1
5/97
12/3
1/97
03/1
8/98
06/0
3/98
08/1
9/98
11/0
4/98
01/2
0/99
03/3
1/99
06/1
6/99
09/0
1/99
11/1
7/99
02/0
2/00
04/1
9/00
07/0
5/00
09/2
0/00
12/0
6/00
02/2
1/01
05/1
0/01
07/2
5/01
10/2
4/01
02/1
3/02
08/2
9/02
07/2
9/03
06/2
9/04
05/3
1/05
05/0
4/06
03/2
8/07
02/2
7/08
01/2
9/09
12/2
2/09
12/0
1/10
Date
Wat
er-L
evel
Ele
vati
on
(ft
)
BMF96-1D BMF96-1S BMF96-4
Figure 3-5. Water-level hydrographs for West Camp wells BMF96-1D, BMF96-1S, and BMF96-4.

102
Figure 3-6. Area of the West Camp affected by basement flooding problems, 1960s. Blue hatch area outlines problem locations.

103
5400
5410
5420
5430
5440
5450
5460
5470
09/2
4/96
11/1
3/96
02/0
5/97
04/2
3/97
07/1
6/97
10/0
8/97
11/2
6/97
02/1
8/98
05/1
3/98
08/0
5/98
10/2
8/98
01/2
0/99
04/0
7/99
06/3
0/99
09/2
2/99
12/1
5/99
03/0
8/00
05/3
1/00
08/2
3/00
11/1
5/00
02/0
7/01
05/0
2/01
07/2
5/01
10/3
1/01
03/1
3/02
11/2
5/02
11/2
4/03
11/2
9/04
11/2
9/05
12/0
1/06
11/2
8/07
12/0
4/08
12/0
1/09
12/0
1/10
Date
Wat
er-L
evel
Ele
vation
(ft
)
BMF96-1D BMF96-1S BMF96-2 BMF96-3 BMF96-4
Figure 3-7. Water-level hydrographs for BMF96 series wells.
5455
5457
5459
5461
5463
5465
01/1
6/02
02/2
8/02
04/1
7/02
05/3
1/02
07/3
1/02
10/2
9/02
01/3
1/03
04/3
0/03
07/2
9/03
10/3
1/03
01/3
0/04
04/2
9/04
07/3
0/04
10/2
8/04
01/3
1/05
04/2
8/05
07/2
9/05
10/2
8/05
02/0
1/06
05/0
4/06
07/2
5/06
10/3
1/06
01/3
0/07
04/3
0/07
07/2
6/07
10/3
0/07
01/3
0/08
04/3
0/08
08/0
1/08
10/3
0/08
01/2
9/09
04/3
0/09
07/3
0/09
10/2
8/09
01/2
5/10
05/0
3/10
07/2
7/10
10/2
5/10
Date
Wat
er-L
evel
Ele
vati
on
(ft
)
0.00
1.00
2.00
3.00
4.00
5.00
Mo
nth
ly P
reci
pit
atio
n (
in)
M onthly Precipitation BM F96-2 BM F96-3
Figure 3-8. Water-level hydrographs for wells BMF96-2 and BMF96-3, 2002-2010.

104
Section 3.2.1 West Camp Mines and Monitoring Wells Water Quality
Water-quality data for the West Camp monitoring system in 2010 are again limited to well BMF96-04 and the three West Camp mines (Travona, Emma, and Ophir). These four sites were sampled during the spring sample event only.
With the exception of arsenic (100 μg/L in the Travona Mine and about 25 μg/L in the Emma Mine), the concentrations of most dissolved constituents are similar in the West Camp (fig. 3-9a and 3-9b). The concentrations of most dissolved metals in well BMF96-4 are low and continued to exhibit a slight downward trend through 2010 (fig. 3-10). Concentrations of zinc have shown variations the past seven years; however, concentrations are well below the SMCL standard. Arsenic concentrations continue to range between 3 and 7 μg/L.
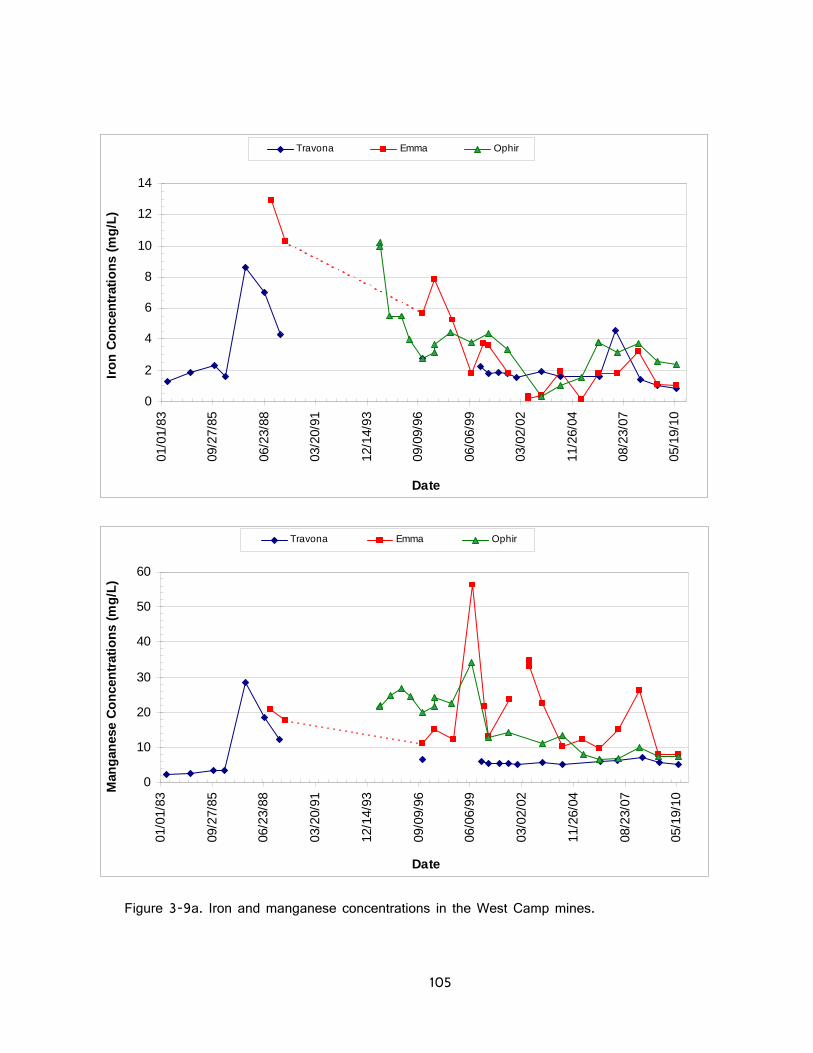
105
0
2
4
6
8
10
12
14
01/0
1/83
09/2
7/85
06/2
3/88
03/2
0/91
12/1
4/93
09/0
9/96
06/0
6/99
03/0
2/02
11/2
6/04
08/2
3/07
05/1
9/10
Date
Iro
n C
on
cen
trat
ion
s (m
g/L
)
Travona Emma Ophir
0
10
20
30
40
50
60
01/0
1/83
09/2
7/85
06/2
3/88
03/2
0/91
12/1
4/93
09/0
9/96
06/0
6/99
03/0
2/02
11/2
6/04
08/2
3/07
05/1
9/10
Date
Man
gan
ese
Co
nce
ntr
atio
ns
(mg
/L)
Travona Emma Ophir
Figure 3-9a. Iron and manganese concentrations in the West Camp mines.

106
0
50
100
150
200
25001
/01/
83
06/2
3/88
12/1
4/93
06/0
6/99
11/2
6/04
05/1
9/10
Date
Ars
enic
Co
nce
ntr
atio
ns
(µg
/L)
Travona Emma Ophir
1
10
100
1000
10000
100000
01/0
1/83
06/2
3/88
12/1
4/93
06/0
6/99
11/2
6/04
05/1
9/10
Date
Lo
g S
cale
Zin
c C
on
cen
trat
ion
s (µ
g/L
)
Travona Emma Ophir
Figure 3-9b. Arsenic and zinc concentrations in West Camp mines.

107
0.00
0.05
0.10
0.15
0.20
0.25
0.30
0.35
0.40
0.45
0.5012
/01/
97
06/0
1/98
12/0
1/98
06/0
1/99
12/0
1/99
06/0
1/00
12/0
1/00
06/0
1/01
12/0
1/01
06/0
1/02
12/0
1/02
06/0
1/03
12/0
1/03
06/0
1/04
12/0
1/04
06/0
1/05
12/0
1/05
06/0
1/06
12/0
1/06
06/0
1/07
12/0
1/07
06/0
1/08
12/0
1/08
06/0
1/09
12/0
1/09
06/0
1/10
12/0
1/10
Date
Co
nce
ntr
atio
ns
(mg
/L)
Fe Mn
0.0
3.0
6.0
9.0
12.0
15.0
18.0
12
/01
/97
06
/01
/98
12
/01
/98
06
/01
/99
12
/01
/99
06
/01
/00
12
/01
/00
06
/01
/01
12
/01
/01
06
/01
/02
12
/01
/02
06
/01
/03
12
/01
/03
06
/01
/04
12
/01
/04
06
/01
/05
12
/01
/05
06
/01
/06
12
/01
/06
06
/01
/07
12
/01
/07
06
/01
/08
12
/01
/08
06
/01
/09
12
/01
/09
06
/01
/10
12
/01
/10
Date
Ars
en
ic C
on
ce
ntr
ati
on
s (
µg
/L)
0.0
20.0
40.0
60.0
80.0
100.0
120.0
Zin
c C
on
ce
ntr
ati
on
s (
µg
/L)
As Zn
Figure 3-10. Selected water chemistry for West Camp well BMF96-4.

108
SECTION 4. OUTER CAMP SYSTEMS
The Outer Camp System consists of the Orphan Boy Mine, Marget Ann Mine, well S-4 and the Montana Tech well (fig. 4-1). It is believed that water levels in the Outer Camp System are at or near pre-mining condition, as these mines had not operated for many years prior to ARCO's suspension of underground mining. It is also believed the few interconnections that existed between these mines and other Butte Hill mines had been sealed off decades earlier by the placement of bulkheads.
Section 4.1 Outer Camp System Water Levels
Outer Camp water levels rose in 2003 for the first time in 5 years; however, water levels declined in all but one site during 2004 and at all sites in 2005. This trend reversed itself in 2006 with water levels rising at all four locations, followed by increases in three of the four sites in 2007; however, the magnitude of the rise was much less than that seen in 2006. Water levels declined at three of the four Outer Camp sites for 2008 at levels similar to or greater than the 2007 increases. Water levels increased at three of the four sites in 2009 and all four in 2010, with increases varying between 2.37 ft and 4.72 ft Table 4.1.1 contains yearly water-level change data, while figure 4-2 shows these changes graphically.
Figure 4-3 shows water levels for the Orphan Boy Mine and the Montana Tech well, along with monthly precipitation amounts. Water levels in the Montana Tech well showed a similar response to precipitation events from 2001 through 2004, rising in the spring and declining throughout the winter. However, the 2005 water-level rise was less than the previous two years although precipitation amounts were higher. The 2006 water-level response was similar in the spring, with water levels beginning to rise in April; however, a corresponding decline in the fall did not occur. Instead, water levels continued to rise into the late fall-early winter before leveling off, rising again in the spring and summer of 2007, before leveling off once more during the late fall-early winter. Water levels in 2008 and 2009 showed more of a seasonal trend, with seasonal peaks less than those of 2007. Water levels continued their seasonal downward trend through the first-half of 2010, followed by a continuous rise through the remainder of the year. Water-level changes in 2010 varied from a rise of 2.37 ft in the Marget Ann Mine to an increase of 4.72 ft in the MT Tech well.

109
Figure 4-1. Outer Camp monitoring sites location map.

110
Table 4.1.1 Annual water-level changes for the Outer Camp sites, in feet.
Year Orphan Boy Marget Ann Well S-4 MT Tech Well1987 1988 1989 1990 1991 1992 1993 1994 1995 1996
2.402.14 3.83
1.41 5.49
-0.72 5.44
-0.96
-3.56 -1.34
4.66 12.41 10.44
-3.56 -4.23
18.41
0.36 2.51 6.48 -1.47
Change Years 1-10
20.43 22.61 10.62 7.88
1997 1998 1999 2000 2001 2002 2003 2004 2005 2006
7.56-2.79 -1.94 NA NA NA NA
NA -0.56 4.51
14.50 0.59 -2.87 -4.71 -1.49 -2.99 1.09 -2.18 -3.01 8.66
16.42 2.17 -2.32 -4.08 -1.59 -3.13 2.23 -3.07 -2.85 7.18
7.76-2.72 -1.57 -4.24 -1.79 -3.64 2.76 0.23 -1.97 5.44
Change Years 11-20
6.78 7.59 10.96 0.26
2007 1.86 1.14 -0.32 1.852008 -1.05 0.56 -0.04 -1.682009 -0.27 1.09 0.60 0.992010
3.14 2.37 4.52 4.72
Change Years 21-30
3.68 5.16 4.76 5.88
Total Change* 30.89 35.36 26.34 14.02
Total water-level change is that measured. Access or obstructions occasionally prevent water-level measurements.

111
-5.00
0.00
5.00
10.00
15.00
20.00
1987 1988 1989 1990 1991 1992 1993 1994 1995 1996 1997 1998 1999 2000 2001 2002 2003 2004 2005 2006 2007 2008 2009 2010
Year
An
nu
al W
ater
-Lev
el C
han
ge
(ft)
Orphan Boy Mine Marget Ann Mine Well S-4 Tech Well
Figure 4-2. Outer Camp sites annual water-level change.
The water level in the Marget Ann Mine rose over 2.3 ft during 2010; this is the fifth year in a row that water levels increased and the sixth yearly rise in the last ten years. The water level in well S-4 increased by 4.52 ft during 2010; this is the third year out of the last five that water levels increased. Figure 4-4 shows water-level hydrographs for these two sites with monthly precipitation totals shown. Water levels from 1994 through 1998 showed a consistent increase regardless of precipitation amounts. From 1999 through 2002, water levels declined, with little apparent influence from precipitation. Water levels in the Marget Ann Mine and well S-4 increased throughout 2003. The initial 2003 water-level rise occurred shortly after a substantial amount of precipitation in the spring (April) of 2003 and continued to raise regardless of precipitation trends the remainder of the year. During 2004 and 2005, water levels declined steadily throughout the year regardless of precipitation events. This trend reversed itself in 2006 and continued throughout 2010 with water levels rising in the spring (April), before leveling off and declining in the late fall-early winter. This is the same trend observed in the MT Tech well and Orphan Boy Mine, although to a lesser degree.

112
Water levels in all four of the Outer Camp sites have a net increase since monitoring began. The increases vary from over 14 ft at the MT Tech well to over 35 ft in the Marget Ann Mine.
5540
5550
5560
5570
5580
5590
5600
01/0
7/92
08/0
3/92
03/0
4/93
10/0
4/93
05/0
3/94
11/0
1/94
06/2
8/95
01/3
0/96
08/2
9/96
03/2
5/97
10/2
9/97
05/2
8/98
12/3
0/98
07/2
8/99
02/2
9/00
09/3
0/00
04/3
0/01
11/3
0/01
06/2
6/02
01/3
0/03
08/2
8/03
03/2
6/04
11/0
8/04
05/2
7/05
12/2
8/05
07/0
6/06
02/2
8/07
09/2
7/07
04/3
0/08
12/0
5/08
06/2
8/09
01/2
8/10
08/3
1/10
Date
Wat
er-L
evel
Ele
vati
on
(ft
)
0.00
1.00
2.00
3.00
4.00
5.00
6.00
Mo
nth
ly P
reci
pit
atio
n (
in)
Monthly Precipitation Orphan Boy Tech Well
Figure 4-3. Water-level hydrograph for the Orphan Boy Mine and Montana Tech well.

113
6185
6195
6205
6215
6225
623506
/01/
88
11/2
9/88
01/3
1/89
08/0
5/89
07/9
4
01/9
5
07/9
5
01/9
6
07/3
1/96
01/2
9/97
07/2
8/97
01/3
0/98
07/2
9/98
01/2
8/99
07/2
8/99
01/2
8/00
07/3
1/00
01/2
9/01
07/3
1/01
01/2
9/02
07/3
0/02
01/3
0/03
07/2
9/03
01/2
9/04
07/2
9/04
01/2
8/05
07/2
9/05
01/3
1/06
07/0
6/06
01/3
1/07
07/2
6/07
01/3
1/08
08/0
1/08
01/2
7/09
07/3
0/09
01/2
8/10
07/2
7/10
Date
Wat
er-
Lev
el E
leva
tion (ft
)
0.0
0.5
1.0
1.5
2.0
2.5
3.0
3.5
4.0
4.5
5.0
Month
ly P
reci
pitation (in
)
Monthly Precipitation Marget Ann Mine Well S-4
Well S-4Break in data from
12/89 to 7/94
Figure 4-4. Water-level hydrograph for the Marget Ann Mine and well S-4.
Section 4.2 Outer Camp Water Quality Water-quality samples were collected from two locations within the Outer Camp System during
2010 (the Marget Ann Mine and MT Tech well are sampled every other year). The Orphan Boy Mine and Green Lake seep were sampled twice, during both the spring and fall sample events. Figures 4-5 and 4-6 show selected water chemistry for the Orphan Boy Mine. Water-quality trends have been downward or unchanged for the most part, the exception being zinc, which increased the past several years. However, these increases coincide with a change in sampling procedures at this site. The 1987 and 1988 samples were collected by bailing a sample from the shaft; samples collected since 2005 were collected by installing a pump into the shaft and pumping for several hours prior to sampling. It is possible that the change in sampling technique is responsible for the apparent water-quality changes.
Water quality in the Outer Camp is of better quality than that of either the East Camp or West Camp bedrock systems. This is most likely a combination of different geology and equilibrium being reached as a result of the workings in this area being flooded for a longer period of time.

114
0.00
0.20
0.40
0.60
0.80
1.0001
/01/
87
01/0
1/88
01/0
1/89
01/0
1/90
01/0
1/91
01/0
1/92
01/0
1/93
01/0
1/94
01/0
1/95
01/0
1/96
01/0
1/97
01/0
1/98
01/0
1/99
01/0
1/00
01/0
1/01
01/0
1/02
01/0
1/03
01/0
1/04
01/0
1/05
01/0
1/06
01/0
1/07
01/0
1/08
01/0
1/09
01/0
1/10
01/0
1/11
Date
Iro
n C
on
cen
trat
ion
s (m
g/L
)
0.0
2.0
4.0
6.0
8.0
10.0
12.0
Man
gan
ese
Co
nce
ntr
atio
ns
(mg
/L)
Fe Mn
Figure 4-5. Iron and manganese concentrations for the Orphan Boy Mine.
0.0
20.0
40.0
60.0
80.0
100.0
120.0
140.0
160.0
180.0
200.0
01/0
1/87
01/0
1/88
01/0
1/89
01/0
1/90
01/0
1/91
01/0
1/92
01/0
1/93
01/0
1/94
01/0
1/95
01/0
1/96
01/0
1/97
01/0
1/98
01/0
1/99
01/0
1/00
01/0
1/01
01/0
1/02
01/0
1/03
01/0
1/04
01/0
1/05
01/0
1/06
01/0
1/07
01/0
1/08
01/0
1/09
01/0
1/10
01/0
1/11
Date
Ars
enic
Co
nce
ntr
atio
ns
(µg
/L)
0.0
10.0
20.0
30.0
40.0
50.0
60.0
70.0
80.0
90.0
100.0
Zin
c C
on
cen
trat
ion
s (µ
g/L
)
As Zn
Figure 4-6. Arsenic and zinc concentrations for the Orphan Boy Mine.

115
SECTION 5.0 PARK WELLS
The locations of the park monitoring wells are shown on figure 5-1. The Hebgen Park and Parrot Park wells are both part of the monitoring program specified in the 2002 CD. The Belmont Well #1 has been added to this group of wells as it is also a bedrock well located within the East Camp system, and is part of the CD monitoring program.
Section 5.1 Park Wells’ Water Levels
Annual water-level changes are listed in Table 5.1.1 and shown on figure 5-2. The yearly water-level changes in Belmont Well #1 since 1997 have been much greater than those seen in the other two wells, with several exceptions when changes in the Parrot Park well have been greater. Regardless of whether the change is a rise or fall in water levels, the magnitude of the change is typically much greater in this well; water-level changes have varied anywhere from 10 to 75 ft in a year. Since monitoring began at these sites, water levels have risen between 4 ft and 8 ft in the Hebgen and Parrot Park wells, while falling more than 20 ft in Belmont Well #1.
Table 5.1.1 Annual water-level change for miscellaneous wells, in feet.
Year Hebgen(1) Parrot Belmont Well #1
Year Hebgen(1) Parrot Belmont Well #1
1983 1984 1985 1986 1987 1988 1989 1990 1991 1992
1.54 -2.18 -1.90 3.09 -1.40
1.43 0.42 5.23 -6.10 0.63
1993199419951996199719981999200020012002
6.27 -0.25
NA 2.75 4.22
-0.62 -2.93 -6.07 0.37 -0.41
1.39 5.96 2.67 -1.50 4.75
-0.33 -5.34 1.50 5.47
-3.27
-0.7415.05-15.1314.80-8.11-0.41
-24.08
Change Years 1-10
-0.85 1.61 --- Change Years 11-20
3.33 11.30 -18.62

116
Table 5.1.1 Annual water-level change for miscellaneous wells, in feet. (cont.)
Year Hebgen(1) Parrot Belmont Well #1
Year Hebgen(1) Parrot Belmont Well #1
2003 2004 2005 2006 2007 2008 2009 2010 2011 2012
1.25 -0.12 -2.19 2.86 1.40
-0.98 0.12
-0.05
3.52-1.12 6.76 6.95 2.44 11.20
-26.99 -7.59
-54.19-39.79 -5.01 35.07 -12.15 -9.45 9.83
73.75
20132014 2015 2016 2017 2018 2019 2020 2021 2022
Change Years 21-30
2.29 -4.83 -1.94
Net Change* Years 1-26 4.77 8.08 -20.56
(1) Hebgen Park Well: No data from 06-1992 to 01-1993, 01-1995 to 09-1996, and 01-1998 to 01-1999. (*)Total water-level change is that measured. Access or obstructions occasionally prevent water-level measurements.
NA- no access. P&A- well plugged and abandoned.
Water-level responses during 2010 at the Hebgen Park well (fig. 5-3) were similar to those seen in prior years. Water levels began to rise during the late spring and continue through the fall, which coincides with both summer precipitation and lawn watering of the park grass. Precipitation, or the lack of, does not appear to influence water levels once they begin to rise in the spring. Since the water-level rise extends into the fall and early winter, it is probable that a portion of the seasonal increase in water level is due to lawn watering in addition to precipitation. The water level in this well decreased 0.05 ft during 2010; since monitoring began at this site, water levels have increased 4.7 ft
The water-level hydrograph for the Parrot Park well is shown on figure 5-4, along with monthly precipitation totals. Water levels declined during most of 2002 before leveling off and rising during December of 2002. The 2003 water levels and trends were similar to those of 2000 and 2001; however 2004 water levels did not show the same level of response to precipitation. Water levels declined for most of 2004 before rising almost 3.5 ft the last two months of the year. The rise that occurred the last 2 months of 2004 is not related to either precipitation events or lawn irrigation. Water levels at this site continued to rise throughout 2005 and 2006 regardless of precipitation trends. Water levels continued to rise during the first two months of 2007 before declining for the next four months. Water levels began to rise again in July before leveling off in October and declining the remainder of the year. Water levels rose steadily throughout 2008 and the first half of

117
2009 regardless of seasonal climatic conditions. However, beginning in June water-levels began to fall and continued downward throughout the remainder of the year, declining by almost 27 ft for the year. Water levels continued to decline through July 2010 before rising slightly and then declining in December; the 2010 water-level decline was over 7.5 ft The water level at this site has risen over 8 ft since monitoring began in 1988.

118
Figure 5-1. East Camp Park monitoring wells location map.

119
-80.00
-60.00
-40.00
-20.00
0.00
20.00
40.00
60.00
80.00
1988 1989 1990 1991 1992 1993 1994 1995 1996 1997 1998 1999 2000 2001 2002 2003 2004 2005 2006 2007 2008 2009 2010
Year
Yea
rly
Wat
er-L
evel
Chan
ge
(ft)
Hebgen Parrot Belmont#1
Figure 5-2. Park wells annual water-level changes.
5470
5475
5480
5485
5490
5495
5500
08/0
1/88
04/0
3/89
11/2
8/89
07/3
1/90
04/0
4/91
12/0
9/91
08/0
1/92
04/0
5/93
11/3
0/93
07/2
8/94
03/2
9/95
11/2
9/95
07/3
1/96
03/2
6/97
11/2
6/97
08/0
5/98
03/1
9/99
11/1
2/99
06/3
0/00
02/2
7/01
10/2
9/01
06/2
7/02
02/2
7/03
10/3
0/03
06/2
9/04
02/2
8/05
11/0
1/05
06/3
0/06
02/2
8/07
10/3
0/07
07/0
1/08
03/0
2/09
10/2
8/09
06/2
9/10
Date
Wat
er- Lev
el E
leva
tion (ft
)
0.00
0.50
1.00
1.50
2.00
2.50
3.00
3.50
4.00
4.50
5.00
Month
ly P
reci
pitat
ion (in
)
Monthly Precipitation Hebgen
Data gap
6/92-1/93
Data gap
1/95-9/96
Data gap
1/98-1/99
Data gap
Data gap
Figure 5-3. Water-level hydrograph for the Hebgen Park well.

120
5360
5370
5380
5390
5400
5410
5420
5430
5440
5450
08/0
1/88
04/0
3/89
11/2
8/89
07/3
1/90
04/0
4/91
12/0
9/91
08/0
1/92
04/0
5/93
11/3
0/93
07/2
8/94
03/2
9/95
11/2
9/95
07/3
1/96
03/2
6/97
11/2
6/97
08/0
5/98
03/1
9/99
11/1
2/99
06/3
0/00
02/2
7/01
10/2
9/01
06/2
7/02
02/2
7/03
10/3
0/03
06/2
9/04
02/2
8/05
11/0
1/05
06/3
0/06
02/2
8/07
10/3
0/07
07/0
1/08
03/0
2/09
10/2
8/09
06/2
9/10
Date
Wat
er-
Lev
el E
leva
tio
n (
ft)
0.00
0.50
1.00
1.50
2.00
2.50
3.00
3.50
4.00
4.50
5.00
Mo
nth
ly P
rec
ipit
ati
on
(in
)
Monthly Precipitation Parrott Park
Figure 5-4. Water-level hydrograph for Parrot Park well.
Figure 5-5 is a water-level hydrograph, which shows the recent water-level trends for both the Parrott and Hebgen Park wells. The water-level trend increases seen in the Parrot well from 2004 through 2008 are not seen in the Hebgen well, nor is the decline that began the middle of 2009 and continued into the middle of 2010. The Hebgen Park well appears to respond more consistently with seasonal conditions (snowmelt, precipitations, and lawn irrigation); while the Parrot Park well water-level variations are not as consistent and do not follow climatic changes.

121
5370
5400
5430
5460
5490
5520
08/0
1/88
04/0
3/89
11/2
8/89
07/3
1/90
04/0
4/91
12/0
9/91
08/0
1/92
04/0
5/93
11/3
0/93
07/2
8/94
03/2
9/95
11/2
9/95
07/3
1/96
03/2
6/97
11/2
6/97
08/0
5/98
03/1
9/99
11/1
2/99
06/3
0/00
02/2
7/01
10/2
9/01
06/2
7/02
02/2
7/03
10/3
0/03
06/2
9/04
02/2
8/05
11/0
1/05
06/3
0/06
02/2
8/07
10/3
0/07
07/0
1/08
03/0
2/09
10/2
8/09
06/2
9/10
Date
Wat
er-
Lev
el E
leva
tio
n (
ft)
0.00
0.50
1.00
1.50
2.00
2.50
3.00
3.50
4.00
4.50
5.00
Mo
nth
ly P
rec
ipit
ati
on
(in
)
Monthly Precipitation Parrott Park Hebgen Park
Figure 5-5. Water-level hydrographs for Parrot Park and Hebgen Park wells.
The Belmont Well #1 was originally drilled as a replacement well for monitoring the water level in the Belmont Mine. However, during well completion a collapse in the borehole prevented the casing from being installed to the proper depth. Instead of abandoning this well after a new replacement well was drilled, it was kept as a monitoring site since its water level differed from that of the deeper bedrock (mine) system. Water-level changes in this well differ from those seen in any other bedrock well (figure 5-6). From 2002 through 2005 water levels declined more than 120 ft, before rising 35 ft in 2006; water levels declined over 12 ft in 2007 and 9 ft in 2008, while rising almost 10 ft in 2009. It initially appeared water-level changes may be in response to precipitation and or lawn irrigation when water levels and precipitation are compared during certain periods since 2003 (figure 5-6); however, when a closer look is taken of the graph the seasonal water-level increases are 10 to 20 ft or more. This well has been equipped with a pressure transducer to record more frequent water-level changes since 2003. Figure 5-7 is a hydrograph for this well from the fall of 2003 through 2010 showing daily average water levels. The seasonal water-level changes are more pronounced on this figure, allowing a closer examination of the periods of change. The magnitude of
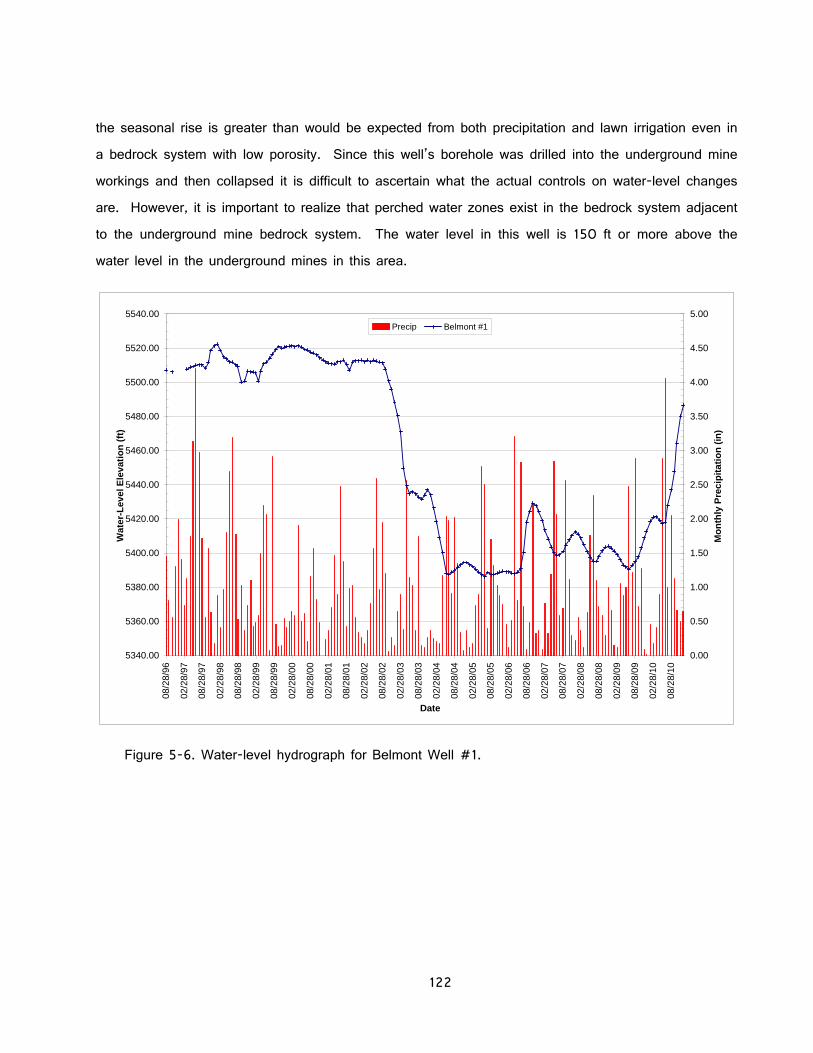
122
the seasonal rise is greater than would be expected from both precipitation and lawn irrigation even in a bedrock system with low porosity. Since this well’s borehole was drilled into the underground mine workings and then collapsed it is difficult to ascertain what the actual controls on water-level changes are. However, it is important to realize that perched water zones exist in the bedrock system adjacent to the underground mine bedrock system. The water level in this well is 150 ft or more above the water level in the underground mines in this area.
5340.00
5360.00
5380.00
5400.00
5420.00
5440.00
5460.00
5480.00
5500.00
5520.00
5540.00
08/2
8/96
02/2
8/97
08/2
8/97
02/2
8/98
08/2
8/98
02/2
8/99
08/2
8/99
02/2
8/00
08/2
8/00
02/2
8/01
08/2
8/01
02/2
8/02
08/2
8/02
02/2
8/03
08/2
8/03
02/2
8/04
08/2
8/04
02/2
8/05
08/2
8/05
02/2
8/06
08/2
8/06
02/2
8/07
08/2
8/07
02/2
8/08
08/2
8/08
02/2
8/09
08/2
8/09
02/2
8/10
08/2
8/10
Date
Wat
er-L
evel
Ele
vati
on
(ft
)
0.00
0.50
1.00
1.50
2.00
2.50
3.00
3.50
4.00
4.50
5.00
Mo
nth
ly P
rec
ipit
ati
on
(in
)
Precip Belmont #1
Figure 5-6. Water-level hydrograph for Belmont Well #1.

123
5380.00
5390.00
5400.00
5410.00
5420.00
5430.00
5440.00
5450.00
5460.00
5470.00
5480.00
09/1
9/03
11/1
9/03
01/1
9/04
03/1
9/04
05/1
9/04
07/1
9/04
09/1
9/04
11/1
9/04
01/1
9/05
03/1
9/05
05/1
9/05
07/1
9/05
09/1
9/05
11/1
9/05
01/1
9/06
03/1
9/06
05/1
9/06
07/1
9/06
09/1
9/06
11/1
9/06
01/1
9/07
03/1
9/07
05/1
9/07
07/1
9/07
09/1
9/07
11/1
9/07
01/1
9/08
03/1
9/08
05/1
9/08
07/1
9/08
09/1
9/08
11/1
9/08
01/1
9/09
03/1
9/09
05/1
9/09
07/1
9/09
09/1
9/09
11/1
9/09
01/1
9/10
03/1
9/10
05/1
9/10
07/1
9/10
09/1
9/10
11/1
9/10
01/1
9/11
Date
Ave
rag
e D
aily
Wat
er-L
evel
Ele
vati
on
(ft
)
Figure 5-7. Hydrograph showing average daily water-level elevations for the Belmont Well #1.
Section 5.2 Park Wells’ Water Quality
Water-quality samples were collected only from the Parrot Park well during 2010. Figure 5-8a shows concentration trends for cadmium and copper over time for this site, while figure 5-8b shows arsenic and zinc concentrations over time. Arsenic and cadmium concentrations exceed the MCL. Cadmium concentrations declined in 2008 to levels below the MCL; while sample results in 2009 and 2010 were well above the MCL. Concentrations increased for arsenic and cadmium while decreasing in the other two analytes shown on figures 5-8a and 5-8b for 2010.

124
0
50
100
150
200
250
300
35001
/01/
88
01/0
1/89
01/0
1/90
01/0
1/91
01/0
1/92
01/0
1/93
01/0
1/94
01/0
1/95
01/0
1/96
01/0
1/97
01/0
1/98
01/0
1/99
01/0
1/00
01/0
1/01
01/0
1/02
01/0
1/03
01/0
1/04
01/0
1/05
01/0
1/06
01/0
1/07
01/0
1/08
01/0
1/09
01/0
1/10
01/0
1/11
Date
Co
nce
ntr
atio
ns
(µg
/L)
Cd Cu
Figure 5-8a. Cadmium and copper concentrations for the Parrot Park well.
0.00
5.00
10.00
15.00
20.00
25.00
30.00
01/0
1/88
01/0
1/89
01/0
1/90
01/0
1/91
01/0
1/92
01/0
1/93
01/0
1/94
01/0
1/95
01/0
1/96
01/0
1/97
01/0
1/98
01/0
1/99
01/0
1/00
01/0
1/01
01/0
1/02
01/0
1/03
01/0
1/04
01/0
1/05
01/0
1/06
01/0
1/07
01/0
1/08
01/0
1/09
01/0
1/10
01/0
1/11
Date
Ars
enic
Co
nce
ntr
atio
ns
(µg
/L)
0
1,000
2,000
3,000
4,000
5,000
6,000
Zin
c co
nce
ntr
atio
n (
µg
/L)
As Zn
Figure 5-8b. Arsenic and zinc concentrations for the Parrot Park well.

125
SECTION 6.0 REVIEW OF THE BERKELEY PIT MODEL
The Berkeley Pit water-level model was updated based upon actual 2010 water-level measurements and HSB flows as measured at the weir upgradient of the water-treatment plant influent pond. The model incorporates monthly water-level rise information from July 1996 through December 2010.
Based upon the 2010 model update, it was projected that the critical water level (CWL) of 5,410 ft will be reached at the Anselmo Mine in February 2023, 2 months (0.16 years) later than predicted in the 2009 model (December 2022). The model update includes the surface water inputs from storm water diversions in the Kelley Mine area, the addition of sludge from the HSB water-treatment plant, and previous models infilling rates adjusted for the diversion of HSB water away from the pit. The HSB drainage water that was flowing into the pit from June 2000 through November 17, 2003 continues to be diverted to the HSB water-treatment plant for treatment and is being used in MR’s mining operations. No major changes in additions or withdrawals of water were made from the Berkeley Pit during 2010; the consistent filling rate and operational activities led to the minor adjustment in filling-rate projection. The pit contained 40.7 billion gallons of water at the end of 2010; while the projected volume of water in December 2022 is 53.4 billion gallons.
The treatment technology and plant construction time frame for Berkeley Pit water are based upon the schedule listed in the EPA 1994 ROD, and included in the 2002 CD for the Butte Mine Flooding Operable Unit (EPA, 1994). Based upon the current water-level projections, a review of the HSB treatment plant design and operation would begin in February 2019. Any necessary upgrades would have to be completed by February 2021, figure 6-1.

126
BERKELEY PIT INFILLING MODEL
4250
4350
4450
4550
4650
4750
4850
4950
5050
5150
5250
5350
5450
5550
1980 1985 1990 1995 2000 2005 2010 2015 2020 2025 2030
Date
Ele
va
tio
n (
US
GS
Da
tum
)
Actual Projection 5386 CWL 5410 milestones
ANSELMO REACHES CWL
Review
HS
B W
ater Treatm
ent Plant A
dequacy.
HS
B W
ater Treatm
ent Plant O
perational Nov 17, 2003.
Com
plete Construction of all required upgrades, if any.
BERKELEY PIT CWL
Figure 6-1. Figure showing projected Berkeley Pit filing rate and dates of treatment review and upgrades.

127
SECTION 7.0 CONCLUSIONS AND SUMMARY
Water-level trends in the alluvial monitoring system within the active mine area were similar to those of 2003 and earlier, with water levels declining in a majority of the wells north of the Pittsmont Dump. This reverses the trend observed from 2004 through 2006 of water levels increasing in a majority of the wells in this area. Water levels rose in a majority of the wells south of the Pittsmont Dump, continuing the trend that began in 2003.
Precipitation events still have little or no influence on water levels in the LP-series alluvial wells near the Berkeley Pit and leach pads. Water-level variations in these wells have a greater response to mining activities than precipitation events.
Water levels in a majority of the alluvial monitoring wells located outside the mine area show a response to seasonal precipitation events. The response time varies from immediate to a two- to three-month lag time. The decrease in annual precipitation in the Butte Basin since 1999 was considered a good explanation for the overall water-level decrease seen in a number of monitoring wells, however, water levels increased in all of these wells (AMC and GS series) in 2003 and a majority of them in 2004 before decreasing in 2005. The 2003 water-level increase occurred although precipitation levels were less than previous years. The increases were greater in wells nearest the mine site and water levels rose the most from late summer through the remainder of the year. While this period of time coincides with MR’s mine start up activities, no direct link was found between start up activities and water-level changes. However, a relationship between filling of the MR concentrator Ecology/Emergency Ponds and water-level increases in several AMC wells was apparent. Water-level increases in 2010 were consistent in the alluvial monitoring network, similar to 2006-2007and 2009 trends.
The increased water-level changes in the East Camp bedrock system are independent of precipitation, and are a result of the 1982 cessation of long-term mine dewatering activities. No notable precipitation influence was seen in any of the bedrock wells or underground mines’ water levels. However, the continued diversion of HSB drainage water away from the Berkeley Pit did have an influence on East Camp bedrock water levels. The water-level rise for 2010 (based upon wells A and G) was about 45 percent that of 2002-2003 when HSB water was flowing into the pit.
The date the East Camp system water level is predicted to reach the CWL elevation of 5,410 ft was changed from December 2022 to February 2023, or two months later than that predicted in 2009. The CWL date is assumed to be the date the 5,410-foot elevation would be reached at the

128
Anselmo Mine. The Anselmo Mine is the anticipated compliance point in order to keep the Berkeley Pit the lowest point in the East Camp bedrock-mine system. This will ensure that all water in the historic underground mine system will continue to flow towards the Berkeley Pit.
The pumping of groundwater in the West Camp System continues to control water levels in this system. The volume of water pumped during 2010 was three percent more than 2009. Since the volume of water pumped from the West Camp System was more in 2010, water levels decreased up to two feet throughout this system and water levels are about 13 ft below the maximum-allowable level.
Monitoring wells in the alluvial aquifers associated with the Mine Flooding Operable Unit continue to show a wide range of water-quality concentrations, both spatially and temporally. As is the case for the last few years, the AMC-series wells show a wide variation and few trends with respect to the concentration of dissolved constituents. The LP-series wells show a continuation of recent trends in most wells for most constituents.
In several cases, chemistry data from the East Camp mines show a strong departure from historic trends, particularly with respect to iron concentrations. It now appears that instead of a sampling or analytical problem, the departure is likely a real change in the chemistry of water in the underground workings.
Recent data from the West Camp monitoring sites generally indicate a continuation of recent trends in water quality. Although concentrations of several dissolved constituents trend upward, they are generally well below values observed during initial flooding. Data from the Emma shaft continue to show departure from recent trends and a notable difference in water quality compared to the Travona Mine.
Results of the 2010 monitoring program continue to show that the current monitoring program (water-level and water-quality) is adequate for ensuring that contaminated bedrock groundwater is flowing into the Berkeley Pit, and that West Camp water levels are being sufficiently controlled by West Camp pumping operations. These are two of the main environmental concerns associated with the flooding of Butte's historic underground mines and the Berkeley Pit.
129
ACKNOWLEDGEMENTS
The information contained in this report represents the work of many companies and agencies over the past 29 years. Numerous individuals have been responsible for actual data collection. Their dedication and creativity in monitoring and sampling of mine waters provided the information that all future work and evaluations relied upon.
The State of Montana, Department of Environmental Quality, and the U.S. Environmental Protection Agency have provided funding for the MBMG to conduct monitoring and sampling activities and preserve continuity between various studies. This support has been invaluable, as has been their realization that flexibility is needed in the monitoring program, allowing modifications in monitoring as conditions change.
The continued cooperation of Montana Resources and British Petroleum/Atlantic Richfield Company is greatly appreciated; while representatives of New Butte Mining continue to allow access to their properties for monitoring purposes. Special appreciation is extended to the property owners who allowed access to their property for the monitoring of the new alluvial monitoring wells: Gilman Construction, Continental Public Land Trust, Butte School District #1, and Race Track Volunteer Fire Department.
Special recognition is given to Matt Berzel, Garrett Smith, and Peggy Delaney, MBMG, for assisting with the preparation of this report.
Errors and omissions remain the authors’ responsibility.

130
REFERENCES
Burns, G., 1994, A Review of the Geology and Historic Production of the Butte District, Presented at the 100th Annual Northwest mining Association, Spokane, Washington, November 29-December 2, 1994.
Daly, W. B. and Berrien, C. L. 1923, Mining Methods and Installations of the Anaconda Copper
Mining Co. at Butte, Montana, 1922 Meeting, Transactions of the American Institute of mining and Metallurgical Engineers, Vol. LXVIII, 1923.
Duaime, T. E., Metesh, J. J., Kerschen, M. D., and Dunstan, C. B., 1998, The flooding of Butte’s
underground mines and Berkeley Pit: 15 Years of water-level monitoring (1982B1987): MBMG Open-File Report 376.
Duaime, T. E. and Metesh, J. J., 2000, The flooding of Butte’s underground mines and Berkeley
Pit, Butte mine flooding operable unit annual water-level update, 1998-1999: MBMG Open-File Report 410.
Duaime, T. E. and Metesh, J. J., 2001, The flooding of Butte’s underground mines and Berkeley
Pit, Butte mine flooding operable unit annual water-level update, 1999-2000: MBMG Open-File Report 435.
Duaime, T. E. and Metesh, J. J., 2003, Twenty Years of Water-Level and Water-Quality Sampling
Butte’s Underground Mines and Berkeley Pit, Butte, Montana 1982-2001: MBMG Open-File Report 473.
Duaime, T. E. and Metesh, J. J., 2004, 2002 Update of Water-Level Monitoring and Water-Quality
Sampling Butte’s Underground Mines and Berkeley Pit, Butte, Montana 1982-2002: MBMG Open-File Report 489.
Duaime, T. E. and Metesh, J. J., 2005, 2003 Update of Water-Level Monitoring and Water-Quality
Sampling Butte’s Underground Mines and Berkeley Pit, Butte, Montana 1982-2003: MBMG Open-File Report 518.
Duaime, T. E. and Metesh, J. J., 2005, 2004 Consent Decree Update Water-Level Monitoring and
Water-Quality Sampling Butte’s Underground Mines and Berkeley Pit, Butte, Montana: MBMG Open-File Report 527.
Duaime, T. E. and Metesh, J. J., 2006, 2005 Consent Decree Update Water-Level Monitoring and
Water-Quality Sampling Butte’s Underground Mines and Berkeley Pit, Butte, Montana: MBMG Open-File Report 549.
Duaime, T. E., and Tucci, N. J., 2007, History of Flooding of the Butte Underground Mines and
Berkeley Pit, Water-Level Monitoring and Water-Quality Sampling, 2006 Consent Decree Update, Butte, Montana, 1982-2006: MBMG Open File Report 566.
Duaime, T. E., and Tucci, N. J., 2008, Butte Underground Mines and Berkeley Pit, Water-Level
Monitoring and Water-Quality Sampling, 2007 Consent Decree Update, Butte, Montana, 1982-2007: MBMG Open File Report 577.

131
Duaime, T. E., and Tucci, N. J., 2009, Butte Underground Mines and Berkeley Pit, Water-Level Monitoring and Water-Quality Sampling, 2008 Consent Decree Update, Butte, Montana, 1982-2008: MBMG Open File Report 589.
Duaime, T. E., and Tucci, N. J., 2011, Butte Underground Mines and Berkeley Pit, Water-Level
Monitoring and Water-Quality Sampling, 2009 Consent Decree Update, Butte, Montana, 1982-2008: MBMG Open File Report 599.
EPA Record of Decision, 1994, Butte mine flooding operable unit, Silver Bow Creek/Butte area NPL
site, Butte, Montana, September 29, 1994, Three Volumes. EPA Consent Decree, 2002, Butte Mine Flooding Operable Unit Consent Decree-02-35-BU-SEH. Gammons, C.H. and Duaime, T.E., 2006, Long Term Changes in the Limnology and Geochemistry
of the Berkeley Pit Lake, Butte, Montana, Mine Water and the Environment, Volume 25, Number 2, June 2006.
GWIC, 2007, Montana Bureau of Mines and Geology, Ground Water Information Center, On-Line
Database, 2007. Metesh, J. J. and Duaime, T. E., 2000, The flooding of Butte’s underground mines and Berkeley
Pit, 18 years of water-quality monitoring (1982-1999): MBMG Open-File Report 409. Metesh, J. J. and Duaime, T. E., 2002, The flooding of Butte’s underground mines and Berkeley
Pit, water-quality monitoring through 2000: MBMG Open-File Report 456. Miller, R. N., 1978, Production History of the Butte District and Geological Function, Past and
Present; Guidebook for the Butte Field Meeting of Society Of Economic Geologists, August 18-21, 1973, 2nd printing.
Sales, R. H., 1914, Ore deposits at Butte, Montana, American Institute of Mining and Metallurgical
Engineers, Transactions 46:3-106. Spindler, J. C., 1977, The clean-up of Silver Bow Creek, Mining Congress Journal, June 1977.