Embed Size (px)
Citation preview
RESULTS REVIEW 4QFY18 08 MAY 2018
ICICI Bank BUY
HDFC securities Institutional Research is also available on Bloomberg HSLB <GO> & Thomson Reuters
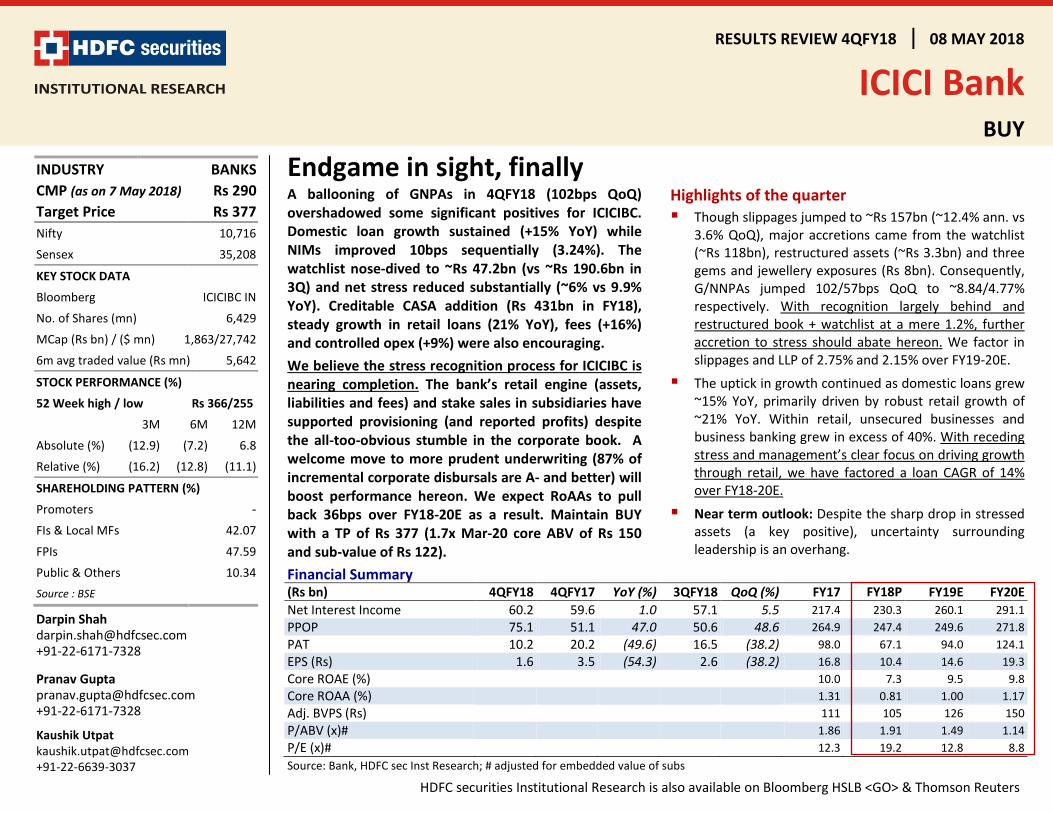
Endgame in sight, finally A ballooning of GNPAs in 4QFY18 (102bps QoQ) overshadowed some significant positives for ICICIBC. Domestic loan growth sustained (+15% YoY) while NIMs improved 10bps sequentially (3.24%). The watchlist nose-dived to ~Rs 47.2bn (vs ~Rs 190.6bn in 3Q) and net stress reduced substantially (~6% vs 9.9% YoY). Creditable CASA addition (Rs 431bn in FY18), steady growth in retail loans (21% YoY), fees (+16%) and controlled opex (+9%) were also encouraging. We believe the stress recognition process for ICICIBC is nearing completion. The bank’s retail engine (assets, liabilities and fees) and stake sales in subsidiaries have supported provisioning (and reported profits) despite the all-too-obvious stumble in the corporate book. A welcome move to more prudent underwriting (87% of incremental corporate disbursals are A- and better) will boost performance hereon. We expect RoAAs to pull back 36bps over FY18-20E as a result. Maintain BUY with a TP of Rs 377 (1.7x Mar-20 core ABV of Rs 150 and sub-value of Rs 122).
Highlights of the quarter Though slippages jumped to ~Rs 157bn (~12.4% ann. vs
3.6% QoQ), major accretions came from the watchlist (~Rs 118bn), restructured assets (~Rs 3.3bn) and three gems and jewellery exposures (Rs 8bn). Consequently, G/NNPAs jumped 102/57bps QoQ to ~8.84/4.77% respectively. With recognition largely behind and restructured book + watchlist at a mere 1.2%, further accretion to stress should abate hereon. We factor in slippages and LLP of 2.75% and 2.15% over FY19-20E.
The uptick in growth continued as domestic loans grew ~15% YoY, primarily driven by robust retail growth of ~21% YoY. Within retail, unsecured businesses and business banking grew in excess of 40%. With receding stress and management’s clear focus on driving growth through retail, we have factored a loan CAGR of 14% over FY18-20E.
Near term outlook: Despite the sharp drop in stressed assets (a key positive), uncertainty surrounding leadership is an overhang.
Financial Summary (Rs bn) 4QFY18 4QFY17 YoY (%) 3QFY18 QoQ (%) FY17 FY18P FY19E FY20E Net Interest Income 60.2 59.6 1.0 57.1 5.5 217.4 230.3 260.1 291.1 PPOP 75.1 51.1 47.0 50.6 48.6 264.9 247.4 249.6 271.8 PAT 10.2 20.2 (49.6) 16.5 (38.2) 98.0 67.1 94.0 124.1 EPS (Rs) 1.6 3.5 (54.3) 2.6 (38.2) 16.8 10.4 14.6 19.3 Core ROAE (%) 10.0 7.3 9.5 9.8 Core ROAA (%) 1.31 0.81 1.00 1.17 Adj. BVPS (Rs)
111 105 126 150 P/ABV (x)#
1.86 1.91 1.49 1.14 P/E (x)#
12.3 19.2 12.8 8.8 Source: Bank, HDFC sec Inst Research; # adjusted for embedded value of subs
INDUSTRY BANKS CMP (as on 7 May 2018) Rs 290 Target Price Rs 377 Nifty 10,716
Sensex 35,208
KEY STOCK DATA
Bloomberg ICICIBC IN
No. of Shares (mn) 6,429
MCap (Rs bn) / ($ mn) 1,863/27,742
6m avg traded value (Rs mn) 5,642
STOCK PERFORMANCE (%)
52 Week high / low Rs 366/255
3M 6M 12M
Absolute (%) (12.9) (7.2) 6.8
Relative (%) (16.2) (12.8) (11.1)
SHAREHOLDING PATTERN (%)
Promoters - FIs & Local MFs 42.07
FPIs 47.59
Public & Others 10.34 Source : BSE
Darpin Shah [email protected] +91-22-6171-7328
Pranav Gupta [email protected] +91-22-6171-7328
Kaushik Utpat [email protected] +91-22-6639-3037

ICICI BANK : RESULTS REVIEW 4QFY18
Page | 2
NPA recognition was driven by the RBI circular (dated 12th Feb) declaring all the restructuring dispensations void. Within slippages of ~Rs 157bn, ~Rs 100bn was due to this change. The bank also classified an exposure of ~Rs 8bn to three specific accounts in the gems & jewellery sector and provided ~Rs 2.9bn on the same. Further, the bank utilised Rs 5.05bn from reserves towards provisions for these exposures.
ICICIBC’s net stressed assets (incl. watchlist) continued to decline and stood at ~6% (vs. 8.3% QoQ, 9.9% YoY and 14.8% in FY16), as PCR remained steady at 60.5%.
Provisions almost doubled sequentially to ~Rs 66.2bn (5.21% of loans vs 2.89% QoQ) as NPA accretion jumped. Additionally, ICICIBC did not avail the benefit of spreading MTM provisions over the upcoming quarters. The bank has to incrementally provide ~Rs 9.7bn in 1Q to meet the PCR requirement on NCLT exposures.
Deposits grew ~15/8% YoY/QoQ largely driven by strong CASA growth of ~18/11% YoY/QoQ. CA deposits grew ~19% YoY while SA deposits grew ~17% YoY. With this, the CASA ratio improved 130bps sequentially to form ~51.7% of total deposits. On a daily avg. basis, the CASA ratio was steady at 45.6%.
The management aims to maintain CASA above 45% on a daily average basis and total retail deposits over 70%.
NIM uptick – a positive surprise: Despite elevated slippages and high interest reversals, overall NIMs improved 10bps sequentially to 3.24%. The uptick was driven by a 14bps improvement in domestic NIMs (3.67%, up 14bps QoQ) even as international NIMs were merely 4bps. Though NIMs are expected to remain under pressure in the near term, the improving share of retail loans, rationalisation of the low yielding overseas book and improving CASA ratio will provide some cushion. We have factored in NIMs of 3.2% over FY19-20E.
Growth uptick sustained: While the overall loans grew only ~10/1% YoY/QoQ, domestic loans grew ~15% YoY (87.4% of loans vs. 86% QoQ). The uptick in domestic loans was led by rapid growth in retail loans (~21/6% YoY/QoQ) and a ~15/4% YoY/QoQ rise in SME loans. Corporate growth remained tepid as domestic corporate advances dipped ~3% sequentially. Overseas loans continued to decline and stood at ~12.6% of total advances (vs. ~14% QoQ and 16.1% YoY).
Within the Retail loans, the growth is encouragingly broad-based, led by unsecured businesses like PL, CC (on a smaller base), along with business banking. The management has guided for a 20% growth in retail loans driven by a 40%+ growth in unsecured businesses and ~15% growth in mortgages
We have factored in loan CAGR of 14% over FY18-20E, led by retail and a pick-up in corp loans, even as overseas loans continue to moderate.
Watch-list Exposure Rs bn 4QFY18 QoQ Chg (%) Power 12.1 (81.5) Iron/Steel 30.3 (31.5) Mining 4.5 (92.3) Others 0.4 (89.6) Promoter entity 0.0 (100.0) Total watch-list 47.2 (75.2)
Movement in watch-list Rs bn 2QFY18 3QFY18 4QFY18
Opening 203.6 195.9 190.6
Reduction 9.6 4.9 8.3
Slippage 2.6 6.8 117.8
Upgrade 4.5 0.1 0.1
Closing 195.9 190.8 47.4
Accretion over FY18 Rs bn CA SA Total
ICICIBC 140 291 431
AXSB 86 222 308
KMB 45 240 285
IIB 32 189 221
YES 97 116 213

ICICI BANK : RESULTS REVIEW 4QFY18
Page | 3
SOTP
Rs bn Per Share Rationale
ICICI Bank 1,641 255 1.7x Mar-20E ABV of Rs 150
ICICI Life Insurance 406 63 (FY20E EV+ 25x FY20E VNB)
ICICI General Insurance 204 32 30x FY20E PAT
ICICI AMC 100 16 5% of FY20E AUM
ICICI UK 37 6 1x FY20E BV
ICICI Canada 45 7 1x FY20E BV
ICICI Housing Finance 51 8 2.0x FY20E BV
ICICI Sec 108 17 25x FY20E PAT
Others 32 5 I Ventures and others
Total Value Of Subsidiaries 982 153 Less: 20% Holdco Discount 196 31 Net Value Of Subsidiaries 785 122 Total Value 2,426 377 Current Value 1,863 290 Upside (%) 30.2 30.2 Source: HDFC sec Inst Research;

ICICI BANK : RESULTS REVIEW 4QFY18
Page | 4
Five Quarters At A Glance Rs bn 4QFY17 1QFY18 2QFY18 3QFY18 4QFY18 YoY Growth QoQ Growth Net Interest Income 59.6 55.9 57.1 57.1 60.2 1.0% 5.5% Non-interest Income 30.2 33.9 51.9 31.7 56.8 88.2% 79.3% Treasury Income 5.0 8.6 21.9 0.7 26.9 433.8% 3968.2% Operating Income 89.8 89.8 109.0 88.7 117.0 30.3% 31.9% Operating Expenses 38.7 37.9 39.1 38.1 41.9 8.2% 9.8% Pre Provision Profits (PPoP) 51.1 51.8 69.9 50.6 75.1 47.0% 48.6% Provisions And Contingencies 29.0 26.1 45.0 35.7 66.3 128.6% 85.6% PBT 22.1 25.7 24.8 14.9 8.9 -59.9% -40.3% Provision For Tax 1.9 5.3 4.3 (1.6) (1.3) -169.7% -18.7% PAT 20.2 20.5 20.6 16.5 10.2 -49.6% -38.2% Balance Sheet items/ratios Deposits 4,900 4,863 4,986 5,174 5,610 14.5% 8.4% CASA Deposits 2,468 2,380 2,469 2,606 2,899 17.5% 11.2% Advances 4,642 4,641 4,828 5,054 5,124 10.4% 1.4% CD Ratio (%) 94.7 95.4 96.8 97.7 91.3 -339 bps -634 bps CAR (%) 17.4 17.7 17.9 18.1 18.4 103 bps 32 bps Tier I (%) 14.4 14.6 14.9 15.0 15.9 156 bps 88 bps Profitability Yield On Advances (%) 8.89 8.69 8.67 8.47 7.67 -122 bps -80 bps Cost Of Funds (%) 5.15 5.16 5.04 4.90 4.93 -22 bps 3 bps NIM (%) 3.57 3.27 3.27 3.14 3.24 -33 bps 10 bps Cost-Income Ratio (%) 43.1 42.3 35.9 43.0 35.8 -729 bps -721 bps Tax Rate (%) 8.5 20.4 17.1 (10.9) (14.8) NA NA Asset quality Gross NPA (Rs bn) 425.5 431.5 444.9 460.4 540.8 27.1% 17.5% Net NPA (Rs bn) 254.5 253.1 241.3 238.1 278.9 9.6% 17.1% Gross NPAs (%) 7.89 7.99 7.87 7.82 8.84 95 bps 102 bps Net NPAs (%) 4.89 4.86 4.43 4.20 4.77 -12 bps 57 bps Delinquency ratio (%) 9.80 4.29 3.95 3.55 12.37 257 bps 882 bps Coverage Ratio (%) 40.2 41.3 45.8 48.3 48.4 825 bps 16 bps Restructuring O/s (%) 0.92 0.51 0.42 0.36 0.30 -62 bps -6 bps
Change In Estimates
(Rs bn) FY19E FY20E
Old New Change Old New Change NII 259 260 0.3% 290 291 0.3% PPOP 245 250 2.0% 271 272 0.2% PAT 95 94 -1.1% 122 124 1.6% Adj. BVPS (Rs) 125.4 125.8 0.3% 144.6 150.1 3.8%
Source: HDFC sec Inst Research
Higher vs. estimates led by better NIM performance and healthy loan growth
Driven by CASA growth of ~18/11% YoY/QoQ; CASA ratio improved to 51.7%
Uptick primarily driven by a 14bps QoQ jump in domestic NIMs to ~3.67%
Core fee growth stood at ~13% YoY with retail fees forming ~75% of total fees; treasury gains incl. Rs 34.8 towards stake sale in I- Sec
Inc. ~Rs 2.9bn towards 3 a/cs in the gems & jewellery sector; Additionally the bank has decided completely provide for MTM losses in 4Q and general provision of ~Rs 1.9bn
Domestic loan growth at ~15% YoY with retail growth of ~21% YoY
Incl. 3 accounts from the Gems & jewellery sector amounting to ~Rs 8bn; Retail NPAs were at 1.61% (vs 1.69% QoQ and 1.51% YoY)
Within total slippages, ~Rs 3.3bn were from restructure accounts while ~Rs 117.8bn were from the watchlist; The overall watchlist dipped to ~Rs 47.2bn vs ~Rs 190.6bn sequentially

ICICI BANK : RESULTS REVIEW 4QFY18
Page | 5
Advances Grew By ~10/1% YoY/QoQ Advances Mix: Retail Continues To Gain
Source: Company, HDFC sec Inst Research Source: Company, HDFC sec Inst Research
Retail Loans Break-up: Robust Growth In The Unsecured Book (%) 1QFY16 2Q FY16 3Q FY16 4Q FY16 1Q FY17 2Q FY17 3Q FY17 4Q FY17 1Q FY18 2Q FY18 3Q FY18 4QFY18 Home 54.9 55.1 54.9 54.0 54.3 54.3 54.6 53.2 53.6 53.5 52.9 52.5 Vehicle 17.9 17.9 17.7 17.4 17.4 17.1 17.2 16.9 16.7 16.5 16.4 16.5 Other secured 20.4 19.9 19.9 21.0 20.3 20.4 19.5 20.9 20.3 20.3 20.6 20.5 PL 4.4 4.6 4.8 5.0 5.2 5.4 5.7 5.9 6.1 6.4 6.8 7.1 CC & Others 2.4 2.5 2.7 2.7 2.8 2.8 3.2 3.1 3.3 3.2 3.3 3.4 Source: Company, HDFC sec Inst Research
Overseas book Continued to de-grow (down 13.6% YoY). Its share dipped ~350bps YoY to ~12.6% Domestic loans grew ~15/3% YoY/QoQ, led by Retail growth of 21/6% YoY/QoQ. The mgt expects to grow the Retail book by 18-20% in FY19 The share of Retail loans will continue to increase hereon SME loans jumped ~15% YoY The corp book grew ~4% QoQ while it degrew YoY by ~-3%
2
4
6
8
10
12
14
16
18
1,250 1,750 2,250 2,750 3,250 3,750 4,250 4,750 5,250 5,750
2QFY
153Q
FY15
4QFY
151Q
FY16
2QFY
163Q
FY16
4QFY
161Q
FY17
2QFY
173Q
FY17
4QFY
171Q
FY18
2QFY
183Q
FY18
4QFY
18
Advances (Rs bn) (LHS) Growth (YoY) (RHS)
Rs bn %
26 26 24 24 23 23 22 21 20 18 16 15 15 14 13
40 41 43 43 44 44 47 46 48 49 52 53 54 54 57
30 29 29 29 28 29 28 28 28 28 27 27 27 27 26
2QFY
15
3QFY
15
4QFY
15
1QFY
16
2QFY
16
3QFY
16
4QFY
16
1QFY
17
2QFY
17
3QFY
17
4QFY
17
1QFY
18
2QFY
18
3QFY
18
4QFY
18
Overseas Retail SME Domestic corporate%

ICICI BANK : RESULTS REVIEW 4QFY18
Page | 6
Deposits Grew ~15/8% YoY/QoQ CASA Ratio Rose 131bps Sequentially
Source: Bank, HDFC sec Inst Research Source: Bank, HDFC sec Inst Research
NIMs Improve Sequentially Fee Growth Led By Retail Fees
Source: Bank, HDFC sec Inst Research Source: Bank, HDFC sec Inst Research
CASA deposits grew ~18/11% YoY/QoQ to form ~51.7% of total deposits On an avg basis, CASA ratio deteriorated 10bps to 45.6% SA grew ~17/8% YoY/QoQ while CA grew ~19% each Overall QoQ NIMs improved by 10bps, albeit drop in YoY NIMs by -33bps. Overseas NIM dropped sharply by -97/26bps YoY/QoQ on account of higher interest reversals in subsidiaries Domestic NIMs improved QoQ by 14bps albeit 29bps YoY decline and stood at 3.67% Overall core fees grew 13/4% led by retail fees (+16%; 75% of the total fees)
0.02.04.06.08.010.012.014.016.018.0
1,500 2,000 2,500 3,000 3,500 4,000 4,500 5,000 5,500 6,000
2QFY
153Q
FY15
4QFY
151Q
FY16
2QFY
163Q
FY16
4QFY
161Q
FY17
2QFY
173Q
FY17
4QFY
171Q
FY18
2QFY
183Q
FY18
4QFY
18
Deposits (Rs bn) (LHS) Chg (YoY) (RHS)Rs bn %
38.0
40.0
42.0
44.0
46.0
48.0
50.0
52.0
54.0
-
5.0
10.0
15.0
20.0
25.0
2QFY
153Q
FY15
4QFY
151Q
FY16
2QFY
163Q
FY16
4QFY
161Q
FY17
2QFY
173Q
FY17
4QFY
171Q
FY18
2QFY
183Q
FY18
4QFY
18
CASA Chg (YoY) (RHS) CASA (%) - RHS
%%
-
2.0
4.0
6.0
8.0
10.0
12.0
14.0
-
0.5
1.0
1.5
2.0
2.5
2QFY
15
3QFY
15
4QFY
15
1QFY
16
2QFY
16
3QFY
16
4QFY
16
1QFY
17
2QFY
17
3QFY
17
4QFY
17
1QFY
18
2QFY
18
3QFY
18
4QFY
18
Fee income % loan (annu) Fee income Chg (YoY) (RHS)
%%
0.2 0.4 0.6 0.8 1.0 1.2 1.4 1.6 1.8 2.0 2.2
2.8
3.0
3.2
3.4
3.6
3.8
4.0
4.2
2QFY
15
3QFY
15
4QFY
15
1QFY
16
2QFY
16
3QFY
16
4QFY
16
1QFY
17
2QFY
17
3QFY
17
4QFY
17
1 QFY
18
2QFY
18
3QFY
18
4QFY
18
NIM Domestic NIM Foreign NIM (RHS)% %

ICICI BANK : RESULTS REVIEW 4QFY18
Page | 7
Sharp Jump In Treasury Gains Include Stake Sale In ICICI Sec Rs bn 1Q FY16 2Q FY16 3Q FY16 4Q FY16 1Q FY17 2Q FY17 3Q FY17 4Q FY17 1Q FY18 2Q FY18 3Q FY18 4QFY18 Treasury 2.1 2.2 14.4 21.9 7.7 64.1 8.9 5.0 8.6 21.9 0.7 26.9 Fees 21.1 22.4 22.6 22.1 21.6 23.6 25.0 24.5 23.8 25.7 26.4 27.6 Others 6.7 5.5 5.1 7.1 5.1 3.5 5.5 0.7 1.5 4.2 4.6 2.4 Total 29.9 30.1 42.1 51.1 34.3 91.2 39.4 30.2 33.9 51.9 31.7 56.8 % of Total 36.9 36.4 43.6 48.6 39.9 63.5 42.3 33.6 37.7 47.6 35.7 48.5 Source: Bank, HDFC sec Inst Research
Slippages Jump Led By RBI revised framework G/NNPA Jump 102/57bps Sequentially
Source : Bank, HDFC sec Inst Research Source: Bank, HDFC sec Inst Research Asset Quality Movement Rs bn 1Q FY16 2Q FY16 3Q FY16 4Q FY16 1Q FY17 2Q FY17 3QFY17 4QFY17 1QFY18 2QFY18 3QFY18 4QFY18 Opening 150.9 151.4 158.6 211.5 262.2 271.9 325.5 380.9 425.5 431.5 444.9 460.4 Additions 16.7 22.4 65.4 70.0 82.5 80.3 70.4 112.9 49.8 46.7 43.9 157.4 Recovery / Upgrade 5.4 7.1 5.0 7.8 7.9 8.0 6.3 14.1 27.8 10.3 11.1 42.3
W/O 10.8 8.1 6.9 1.5 66.2 22.4 8.8 54.1 16.1 23.0 17.2 34.8 Closing 151.4 158.6 212.1 272.2 270.6 321.8 380.9 425.5 431.5 444.9 460.5 540.6
Other income was higher by 88/79% YoY/QoQ as it includes Rs 34.8bn towards stake in I-Sec Slippages of ~Rs 157bn include ~100bn loans which were classified as std. asset as per RBI framework. Retail slippages stood at ~Rs 7.0bn vs. Rs 7.9bn QoQ NCLT exposures List 1: Fund based Rs 60.2bn, Non Fund based Rs 9.2bn and PCR of 50.3% List 2: Fund based Rs 91.8bn, Non Fund based Rs 8.4bn and PCR of 48.7% ICICIBC is required to make additional provisions of Rs 9.7bn in 1HY19
17 23 3317 22
65 70 82 80 70
113
50 47 44
157
917
1230 20
10 71 0 6
0
27 270
02Q
FY15
3QFY
15
4QFY
15
1QFY
16
2QFY
16
3QFY
16
4QFY
16
1QFY
17
2QFY
17
3QFY
17
4QFY
17
1QFY
18
2QFY
18
3QFY
18
4QFY
18
Slippages Restructured asset (incl. 5:25)
-1.0 2.0 3.0 4.0 5.0 6.0 7.0 8.0 9.0 10.0
-
100.0
200.0
300.0
400.0
500.0
600.0
2QFY
15
3QFY
15
4QFY
15
1QFY
16
2QFY
16
3QFY
16
4QFY
16
1QFY
17
2QFY
17
3QFY
17
4QFY
17
1QFY
18
2QFY
18
3QFY
18
4QFY
18
GNPA (Rs bn) NNPA (Rs bn)GNPA (%, RHS) NNPA (%, RHS)

ICICI BANK : RESULTS REVIEW 4QFY18
Page | 8
Peer Valuations
BANK Mcap (Rs bn)
CMP (Rs) Rating TP
(Rs) ABV (Rs) P/E (x) P/ABV (x) ROAE (%) ROAA (%)
FY18E FY19E FY20E FY18E FY19E FY20E FY18E FY19E FY20E FY18E FY19E FY20E FY18E FY19E FY20E KMB # 2373 1245 BUY 1371 183 207 237 46.3 35.1 27.3 5.42 4.69 3.97 12.9 13.5 14.9 1.71 1.81 1.87 ICICIBC # 1863 290 BUY 377 105 126 150 19.2 12.8 8.8 1.91 1.49 1.14 7.3 9.5 9.8 0.81 1.00 1.17 AXSB 1394 535 NEU 538 183 225 269 498.2 27.2 14.8 2.93 2.37 1.99 0.5 7.7 12.8 0.04 0.70 1.13 IIB 1124 1890 BUY 1,966 379 443 524 31.5 25.4 20.1 4.99 4.26 3.61 16.5 17.6 19.0 1.80 1.79 1.82 RBL 219 524 BUY 582 152 170 194 31.3 24.8 18.5 3.45 3.08 2.70 12.7 12.6 15.1 1.27 1.26 1.33 FB 196 101 BUY 127 57 63 71 19.6 15.7 12.2 1.78 1.61 1.43 9.5 9.9 11.6 0.80 0.85 0.93 CUB 123 186 BUY 212 56 66 77 20.2 17.7 15.3 3.33 2.82 2.42 15.8 15.5 15.5 1.64 1.63 1.58 KVB 77 105 BUY 157 63 71 79 20.5 15.4 8.7 1.68 1.49 1.34 6.6 7.8 13.3 0.57 0.68 1.08 DCBB 61 196 BUY 205 78 88 98 24.6 19.1 15.5 2.51 2.24 2.00 9.8 10.8 12.0 0.90 0.95 0.97 SBIN # 2207 247 BUY 333 80 137 175 -105.0 10.5 5.3 1.78 1.04 0.81 -0.6 5.4 10.0 -0.04 0.35 0.64 BOB 332 144 BUY 192 65 109 148 49.3 17.4 9.2 2.22 1.32 0.97 2.0 5.0 8.9 0.11 0.29 0.51
Source: Company, HDFC sec Inst Research, # Adjusted for embedded value of subs

ICICI BANK : RESULTS REVIEW 4QFY18
Page | 9
Income Statement (Rs bn) FY16 FY17 FY18P FY19E FY20E
Interest Earned 527.4 541.6 549.7 635.8 731.6
Interest Expended 315.2 324.2 319.4 375.7 440.5
Net Interest Income 212.2 217.4 230.3 260.1 291.1
Other Income 153.2 195.0 174.2 163.0 170.8
Fee Income (CEB) 74.6 80.3 86.1 97.4 111.5
Treasury Income 38.0 86.2 58.0 32.5 22.5
Total Income 365.5 412.4 404.5 423.2 461.9
Total Operating Exp 126.8 147.6 157.0 173.6 190.1
Employee Expense 50.0 57.3 59.1 64.5 70.2
PPOP 238.6 264.9 247.4 249.6 271.8
Provisions & Contingencies 116.7 152.1 173.8 139.0 114.7
Prov. For NPAs (Incl. Std Prov.) 75.1 150.3 170.8 137.0 112.7
PBT 122.0 112.8 73.7 110.6 157.0
Provision For Tax 24.7 14.8 6.6 16.6 33.0
PAT 97.3 98.0 67.1 94.0 124.1 Source: Bank, HDFC sec Inst Research
Balance Sheet (Rs bn) FY16 FY17 FY18P FY19E FY20E
SOURCES OF FUNDS Share Capital 11.6 11.7 12.9 12.9 12.9
Reserves 885.7 987.8 1,038.4 1,114.8 1,215.9
Shareholders' Funds 897.3 999.4 1,051.3 1,127.7 1,228.8
Savings 1,342.3 1,718.4 2,009.7 2,311.1 2,600.0
Current 588.7 749.8 889.6 1,023.0 1,145.8
Term Deposit 2,283.3 2,432.2 2,710.5 3,062.9 3,522.3
Total Deposits 4,214.3 4,900.4 5,609.8 6,397.0 7,268.1
Borrowings 1,748.1 1,475.6 1,828.6 2,066.2 2,335.7
Other Liabilities 347.3 342.5 302.0 332.1 365.2
Total Liabilities 7,207.0 7,717.9 8,791.6 9,922.9 11,197.8
APPLICATION OF FUNDS Cash & Bank Balance 598.7 757.1 841.7 1,161.4 1,391.9
Investments 1,604.1 1,615.1 2,029.9 2,092.8 2,208.2
G-Secs 1,106.5 1,125.1 1,487.2 1,535.3 1,635.3
Advances 4,352.6 4,642.3 5,124.0 5,831.3 6,717.0
Fixed Assets 75.8 78.1 79.0 81.0 83.0
Other Assets 575.7 625.3 717.3 756.3 797.6
Total Assets 7,207.0 7,717.9 8,791.9 9,922.9 11,197.8 Source: Bank, HDFC sec Inst Research

ICICI BANK : RESULTS REVIEW 4QFY18
Page | 10
Key Ratios
FY16 FY17 FY18P FY19E FY20E VALUATION RATIOS EPS (Rs) 16.7 16.8 10.4 14.6 19.3 Earnings Growth (%) (13.0) 0.8 (31.6) 40.2 31.9 BVPS (Rs) 154.3 171.6 163.5 175.4 191.1 Adj. BVPS (Rs) 113.0 110.6 104.8 125.8 150.1 DPS (Rs) 5.0 4.4 1.5 2.5 3.3 ROAA (%) 1.42 1.31 0.81 1.00 1.17 ROAE (%) 11.1 10.0 7.3 9.5 9.8 P/E (x) 13.5 12.3 19.2 12.8 8.8 P/ABV (x) 2.0 1.9 1.9 1.5 1.1 P/PPOP (x) 1.4 1.3 1.5 1.5 1.4 Dividend Yield (%) 1.7 1.5 0.5 0.9 1.1 PROFITABILITY Yield On Advances (%) 9.47 8.81 8.37 8.65 8.95 Yield On Investment (%) 6.67 7.07 6.35 6.50 6.50 Cost Of Funds (%) 5.58 5.26 4.62 4.73 4.88 Cost Of Deposits (%) 5.50 5.02 4.32 4.38 4.48 Core Spread (%) 3.89 3.55 3.74 3.93 4.07 NIM (%) 3.56 3.35 3.21 3.23 3.24 OPERATING EFFICIENCY Cost/Avg. Asset Ratio (%) 1.9 2.0 1.9 1.9 1.8 Cost-Income Ratio (Ex. Treasury) 38.7 45.2 45.3 44.4 43.3 BALANCE SHEET STRUCTURE Loan Growth (%) 12.3 6.7 10.4 13.8 15.2 Deposit Growth (%) 16.6 16.3 14.5 14.0 13.6 C/D Ratio (%) 103.3 94.7 91.3 91.2 92.4 Equity/Assets (%) 12.5 12.9 12.0 11.4 11.0 Equity/Advances (%) 20.6 21.5 20.5 19.3 18.3 CASA (%) 45.8 50.4 51.7 52.1 51.5 Capital Adequacy Ratio (CAR, %) 16.6 17.4 18.4 15.5 14.8 W/w Tier I CAR (%) 13.1 14.4 15.9 13.5 13.1
FY16 FY17 FY18P FY19E FY20E ASSET QUALITY Gross NPLs (Rs bn) 262.2 421.6 540.6 493.9 419.8 Net NPLs (Rs bn) 129.6 252.2 278.9 220.7 165.4 Gross NPLs (%) 5.82 7.89 8.84 8.47 6.25 Net NPLs (%) 2.98 4.20 4.77 3.78 2.46 Slippages (%) 4.06% 7.46% 5.88% 3.00% 2.50% Coverage Ratio (%) 50.6 40.2 48.4 55.3 60.6 Provision/Avg. Loans (%) 1.8 3.3 3.5 2.5 1.8 ROAA TREE Net Interest Income 3.11% 2.91% 2.79% 2.78% 2.76% Non-interest Income 2.24% 2.61% 2.11% 1.74% 1.62% Treasury Income 0.56% 1.16% 0.70% 0.35% 0.21% Operating Cost 1.86% 1.98% 1.90% 1.85% 1.80% Provisions 1.71% 2.04% 2.10% 1.49% 1.09% Provisions For NPAs 1.06% 1.97% 2.04% 1.44% 1.04% Tax 0.36% 0.20% 0.08% 0.18% 0.31% ROAA 1.42% 1.31% 0.81% 1.00% 1.17% Leverage (x) 8.03 7.87 8.05 8.59 8.96 ROAE 11.43% 10.33% 6.54% 8.63% 10.53% Source: Bank, HDFC sec Inst Research

ICICI BANK : RESULTS REVIEW 4QFY18
Page | 11
RECOMMENDATION HISTORY
Rating Definitions BUY : Where the stock is expected to deliver more than 10% returns over the next 12 month period NEUTRAL : Where the stock is expected to deliver (-)10% to 10% returns over the next 12 month period SELL : Where the stock is expected to deliver less than (-)10% returns over the next 12 month period
Date CMP Reco Target 4-May-17 273 BUY 345 10-Jul-17 290 BUY 317 28-Jul-17 309 BUY 338 9-Oct-17 272 BUY 357
28-Oct-17 302 BUY 364 9-Jan-18 313 BUY 371 1-Feb-18 353 BUY 390
10-Apr-18 289 BUY 363 8-May-18 290 BUY 377
200
250
300
350
400
May
-17
Jun-
17
Jul-1
7
Aug-
17
Sep-
17
Oct
-17
Nov-
17
Dec-
17
Jan-
18
Feb-
18
Mar
-18
Apr-
18
May
-18
ICICI Bank TP

ICICI BANK : RESULTS REVIEW 4QFY18
Page | 12
Disclosure: We, Darpin Shah, MBA & Pranav Gupta, ACA & Kaushik Utpat, ACA, authors and the names subscribed to this report, hereby certify that all of the views expressed in this research report accurately reflect our views about the subject issuer(s) or securities. HSL has no material adverse disciplinary history as on the date of publication of this report. We also certify that no part of our compensation was, is, or will be directly or indirectly related to the specific recommendation(s) or view(s) in this report. Research Analyst or his/her relative or HDFC Securities Ltd. does not have any financial interest in the subject company. Also Research Analyst or his relative or HDFC Securities Ltd. or its Associate may have beneficial ownership of 1% or more in the subject company at the end of the month immediately preceding the date of publication of the Research Report. Further Research Analyst or his relative or HDFC Securities Ltd. or its associate does not have any material conflict of interest. Any holding in stock –No HDFC Securities Limited (HSL) is a SEBI Registered Research Analyst having registration no. INH000002475. Disclaimer: This report has been prepared by HDFC Securities Ltd and is meant for sole use by the recipient and not for circulation. The information and opinions contained herein have been compiled or arrived at, based upon information obtained in good faith from sources believed to be reliable. Such information has not been independently verified and no guaranty, representation of warranty, express or implied, is made as to its accuracy, completeness or correctness. All such information and opinions are subject to change without notice. This document is for information purposes only. Descriptions of any company or companies or their securities mentioned herein are not intended to be complete and this document is not, and should not be construed as an offer or solicitation of an offer, to buy or sell any securities or other financial instruments. This report is not directed to, or intended for display, downloading, printing, reproducing or for distribution to or use by, any person or entity who is a citizen or resident or located in any locality, state, country or other jurisdiction where such distribution, publication, reproduction, availability or use would be contrary to law or regulation or what would subject HSL or its affiliates to any registration or licensing requirement within such jurisdiction. If this report is inadvertently send or has reached any individual in such country, especially, USA, the same may be ignored and brought to the attention of the sender. This document may not be reproduced, distributed or published for any purposes without prior written approval of HSL. Foreign currencies denominated securities, wherever mentioned, are subject to exchange rate fluctuations, which could have an adverse effect on their value or price, or the income derived from them. In addition, investors in securities such as ADRs, the values of which are influenced by foreign currencies effectively assume currency risk. It should not be considered to be taken as an offer to sell or a solicitation to buy any security. HSL may from time to time solicit from, or perform broking, or other services for, any company mentioned in this mail and/or its attachments. HSL and its affiliated company(ies), their directors and employees may; (a) from time to time, have a long or short position in, and buy or sell the securities of the company(ies) mentioned herein or (b) be engaged in any other transaction involving such securities and earn brokerage or other compensation or act as a market maker in the financial instruments of the company(ies) discussed herein or act as an advisor or lender/borrower to such company(ies) or may have any other potential conflict of interests with respect to any recommendation and other related information and opinions. HSL, its directors, analysts or employees do not take any responsibility, financial or otherwise, of the losses or the damages sustained due to the investments made or any action taken on basis of this report, including but not restricted to, fluctuation in the prices of shares and bonds, changes in the currency rates, diminution in the NAVs, reduction in the dividend or income, etc. HSL and other group companies, its directors, associates, employees may have various positions in any of the stocks, securities and financial instruments dealt in the report, or may make sell or purchase or other deals in these securities from time to time or may deal in other securities of the companies / organizations described in this report. HSL or its associates might have managed or co-managed public offering of securities for the subject company or might have been mandated by the subject company for any other assignment in the past twelve months. HSL or its associates might have received any compensation from the companies mentioned in the report during the period preceding twelve months from t date of this report for services in respect of managing or co-managing public offerings, corporate finance, investment banking or merchant banking, brokerage services or other advisory service in a merger or specific transaction in the normal course of business. HSL or its analysts did not receive any compensation or other benefits from the companies mentioned in the report or third party in connection with preparation of the research report. Accordingly, neither HSL nor Research Analysts have any material conflict of interest at the time of publication of this report. Compensation of our Research Analysts is not based on any specific merchant banking, investment banking or brokerage service transactions. HSL may have issued other reports that are inconsistent with and reach different conclusion from the information presented in this report. Research entity has not been engaged in market making activity for the subject company. Research analyst has not served as an officer, director or employee of the subject company. We have not received any compensation/benefits from the subject company or third party in connection with the Research Report. HDFC securities Limited, I Think Techno Campus, Building - B, "Alpha", Office Floor 8, Near Kanjurmarg Station, Opp. Crompton Greaves, Kanjurmarg (East), Mumbai 400 042 Phone: (022) 3075 3400 Fax: (022) 2496 5066 Compliance Officer: Binkle R. Oza Email: [email protected] Phone: (022) 3045 3600 HDFC Securities Limited, SEBI Reg. No.: NSE-INB/F/E 231109431, BSE-INB/F 011109437, AMFI Reg. No. ARN: 13549, PFRDA Reg. No. POP: 04102015, IRDA Corporate Agent License No.: HDF 2806925/HDF C000222657, SEBI Research Analyst Reg. No.: INH000002475, CIN - U67120MH2000PLC152193 Mutual Funds Investments are subject to market risk. Please read the offer and scheme related documents carefully before investing.

ICICI BANK : RESULTS REVIEW 4QFY18
Page | 13
HDFC securities Institutional Equities Unit No. 1602, 16th Floor, Tower A, Peninsula Business Park, Senapati Bapat Marg, Lower Parel, Mumbai - 400 013 Board : +91-22-6171 7330 www.hdfcsec.com