Embed Size (px)
Citation preview
RESULT REVIEW 3QFY18 17 JAN 2018
Multi Commodity Exchange BUY
HDFC securities Institutional Research is also available on Bloomberg HSLB <GO>& Thomson Reuters
Near term challengesMCX delivered bad set of numbers in 3QFY18, revenue was down 9.4% QoQ to Rs 610mn (our est. was Rs 615mn), led by 7.9% fall in ADTV. Options trading started in Oct-17 but the volume pick-up is very slow vs. expectation. Options ADTV stood at Rs 1.40bn (only 0.7% of futures ADTV, target is to reach 20-30% in the next six months). MCX is planning to launch four to five additional options contract in the next few months. Also, institutional participation (banks, MFs, PMS) in commodities derivatives is in advanced stages of discussion and could be reality soon. This will deepen the commodity market and can boost trading volumes significantly. SEBI allowed the universal exchange concept (effective Oct-18) in which BSE and NSE can launch commodity derivative trading. This will increase competitive intensity and will put pricing pressure to some extent. However, management doesn’t see significant erosion in market share and expects the overall market size to increase with regulatory boost.
We see value in MCX based on (1) Embedded non-linearity, (2) Favourable regulatory environment, and (3) Significant growth prospects with the start new options contracts, institutional participation and launch of indices. We estimate revenue/PAT CAGR of 14/13% over FY17-20E. Maintain BUY with a TP of Rs 1,165 implying a P/E of 35x Dec-19E EPS.
Highlights of the quarter Bullion (22% of ADTV) is under continued stress
(-29.2% QoQ and -36.7% in 9MFY18). Metals (43% of ADTV) was up +3.6% QoQ and +19.4 in 9MFY18 due to rise in global prices and high volatility.
EBITDA margin stood at 22.2%, down 917bps QoQ (vs our est. of 28.9%), led by top-line decline and high other expenses related to member engagement, option launch and India commodities day.
Near-term outlook: Futures ADTV will pick-up in 4Q and liquidity enhancement scheme will increase options volume. Margins will expand gradually with growth in the top-line. The stock is down (~20% in 6M) and factors in most of the negatives.
Financial Summary YE March (Rs mn) 3QFY18 3QFY17 YoY (%) 2QFY18 QoQ (%) FY16 FY17 FY18E FY19E FY20E Net Revenues 610 686 (11.1) 673 (9.4) 2,349 2,594 2,675 3,109 3,889 EBITDA 135 193 (29.8) 211 (35.9) 767 797 753 1,026 1,593 APAT 188 339 (44.7) 283 (33.7) 1,085 1,263 1,048 1,357 1,807 Diluted EPS (Rs) 3.7 6.7 (44.7) 5.6 (33.7) 21.3 24.8 20.5 26.6 35.4 P/B (x) 3.8 3.4 3.2 3.1 2.9 P/E (x) 42.1 36.2 43.6 33.7 25.3 EV / EBITDA (x) 45.3 45.5 47.4 34.4 21.7 RoE (%) 9.0 9.9 7.6 9.4 11.9
Source: Company, HDFC sec Inst Research
INDUSTRY EXCHANGES
CMP (as on 16 Jan 2018) Rs 896
Target Price Rs 1,165 Nifty 10,700
Sensex 34,771
KEY STOCK DATA
Bloomberg MCX IN
No. of Shares (mn) 51
MCap (Rs bn) / ($ mn) 46/713
6m avg traded value (Rs mn) 363
STOCK PERFORMANCE (%)
52 Week high / low Rs 1,259/870
3M 6M 12M
Absolute (%) (20.8) (18.3) (24.5)
Relative (%) (27.3) (26.9) (51.9)
SHAREHOLDING PATTERN (%)
Promoters 0
FIs & Local MFs 35.50
FPIs 28.77
Public & Others 35.73 Source : BSE
Amit Chandra [email protected] +91-22-6171-7345
Apurva Prasad [email protected] +91-22-6171-7327
MCX : RESULT REVIEW 3QFY18
Page | 2
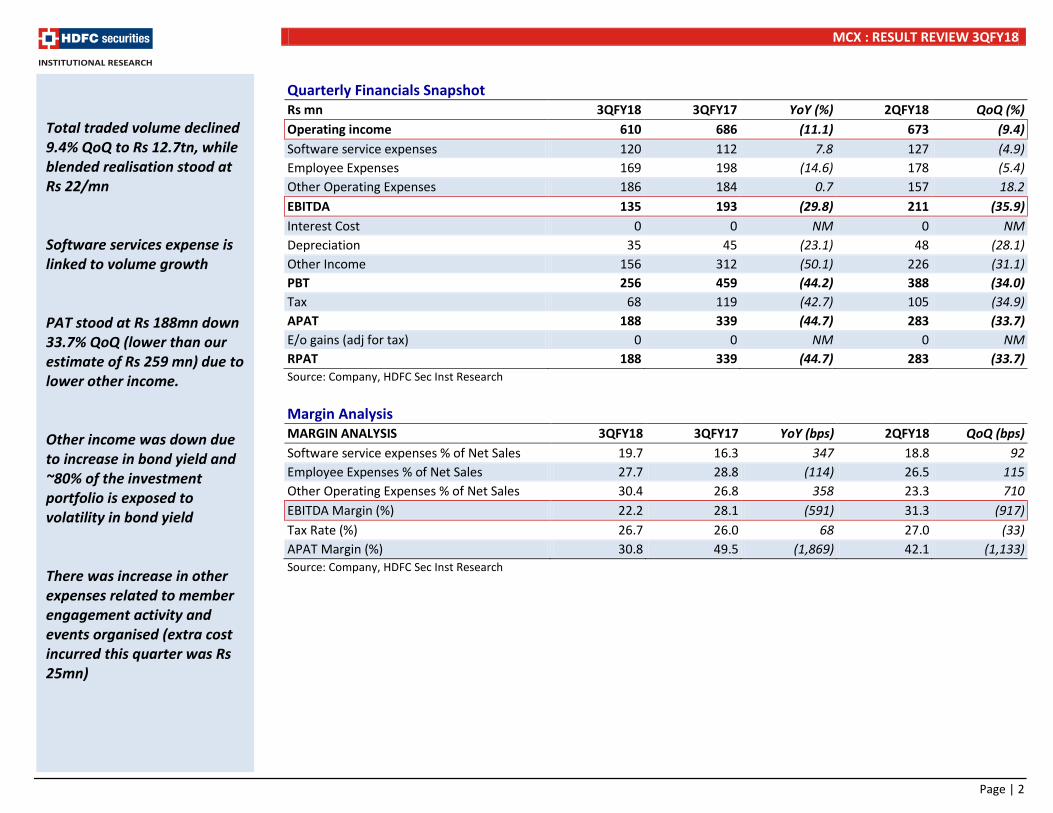
Quarterly Financials Snapshot Rs mn 3QFY18 3QFY17 YoY (%) 2QFY18 QoQ (%) Operating income 610 686 (11.1) 673 (9.4) Software service expenses 120 112 7.8 127 (4.9) Employee Expenses 169 198 (14.6) 178 (5.4) Other Operating Expenses 186 184 0.7 157 18.2 EBITDA 135 193 (29.8) 211 (35.9) Interest Cost 0 0 NM 0 NM Depreciation 35 45 (23.1) 48 (28.1) Other Income 156 312 (50.1) 226 (31.1) PBT 256 459 (44.2) 388 (34.0) Tax 68 119 (42.7) 105 (34.9) APAT 188 339 (44.7) 283 (33.7) E/o gains (adj for tax) 0 0 NM 0 NM RPAT 188 339 (44.7) 283 (33.7) Source: Company, HDFC Sec Inst Research Margin Analysis MARGIN ANALYSIS 3QFY18 3QFY17 YoY (bps) 2QFY18 QoQ (bps) Software service expenses % of Net Sales 19.7 16.3 347 18.8 92 Employee Expenses % of Net Sales 27.7 28.8 (114) 26.5 115 Other Operating Expenses % of Net Sales 30.4 26.8 358 23.3 710 EBITDA Margin (%) 22.2 28.1 (591) 31.3 (917) Tax Rate (%) 26.7 26.0 68 27.0 (33) APAT Margin (%) 30.8 49.5 (1,869) 42.1 (1,133) Source: Company, HDFC Sec Inst Research
Total traded volume declined 9.4% QoQ to Rs 12.7tn, while blended realisation stood at Rs 22/mn Software services expense is linked to volume growth PAT stood at Rs 188mn down 33.7% QoQ (lower than our estimate of Rs 259 mn) due to lower other income. Other income was down due to increase in bond yield and ~80% of the investment portfolio is exposed to volatility in bond yield There was increase in other expenses related to member engagement activity and events organised (extra cost incurred this quarter was Rs 25mn)
MCX : RESULT REVIEW 3QFY18
Page | 3
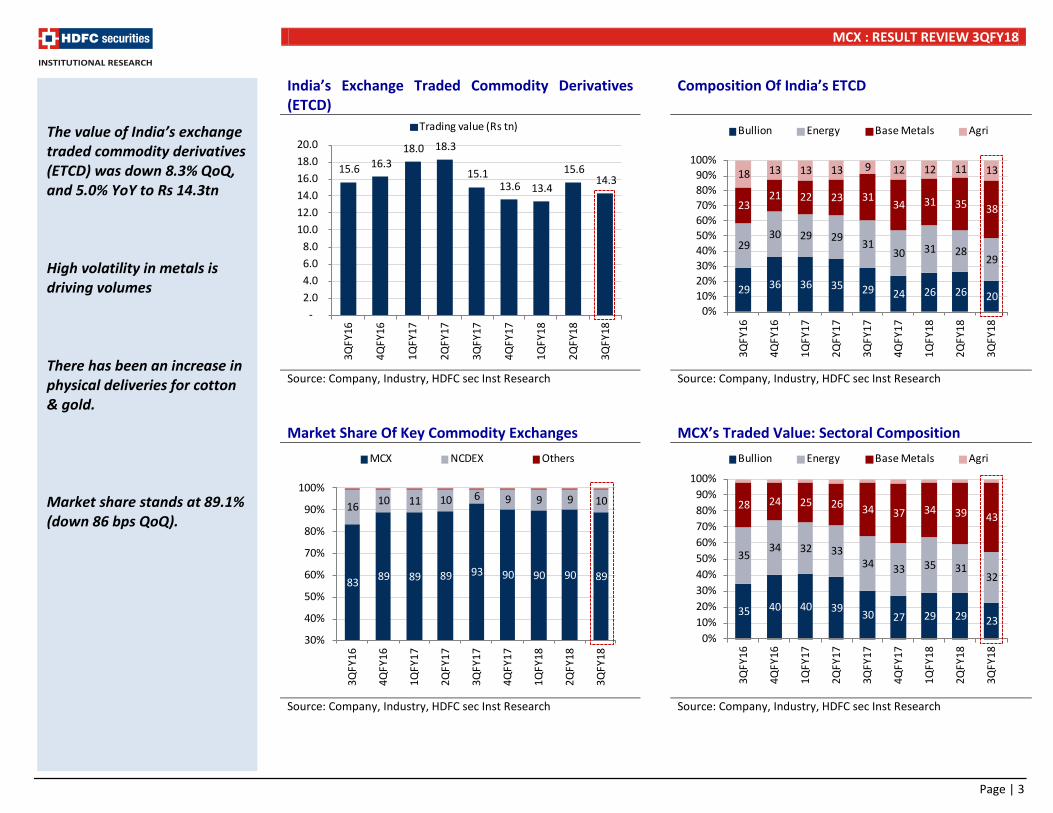
India’s Exchange Traded Commodity Derivatives (ETCD)
Composition Of India’s ETCD
Source: Company, Industry, HDFC sec Inst Research Source: Company, Industry, HDFC sec Inst Research Market Share Of Key Commodity Exchanges MCX’s Traded Value: Sectoral Composition
Source: Company, Industry, HDFC sec Inst Research Source: Company, Industry, HDFC sec Inst Research
The value of India’s exchange traded commodity derivatives (ETCD) was down 8.3% QoQ, and 5.0% YoY to Rs 14.3tn High volatility in metals is driving volumes There has been an increase in physical deliveries for cotton & gold. Market share stands at 89.1% (down 86 bps QoQ).
15.6 16.3 18.0 18.3
15.1 13.6 13.4
15.6 14.3
-2.0 4.0 6.0 8.0
10.0 12.0 14.0 16.0 18.0 20.0
3QFY
16
4QFY
16
1QFY
17
2QFY
17
3QFY
17
4QFY
17
1QFY
18
2QFY
18
3QFY
18
Trading value (Rs tn)
29 36 36 35 29 24 26 26 20
29 30 29 29 31
30 31 28 29
23 21 22 23 31
34 31 35 38
18 13 13 13 9 12 12 11 13
0%10%20%30%40%50%60%70%80%90%
100%
3QFY
16
4QFY
16
1QFY
17
2QFY
17
3QFY
17
4QFY
17
1QFY
18
2QFY
18
3QFY
18
Bullion Energy Base Metals Agri
83 89 89 89 93 90 90 90 89
16 10 11 10 6 9 9 9 10
30%
40%
50%
60%
70%
80%
90%
100%
3QFY
16
4QFY
16
1QFY
17
2QFY
17
3QFY
17
4QFY
17
1QFY
18
2QFY
18
3QFY
18
MCX NCDEX Others
35 40 40 39 30 27 29 29 23
35 34 32 33
34 33 35 31 32
28 24 25 26 34 37 34 39 43
0%10%20%30%40%50%60%70%80%90%
100%
3QFY
16
4QFY
16
1QFY
17
2QFY
17
3QFY
17
4QFY
17
1QFY
18
2QFY
18
3QFY
18
Bullion Energy Base Metals Agri
MCX : RESULT REVIEW 3QFY18
Page | 4
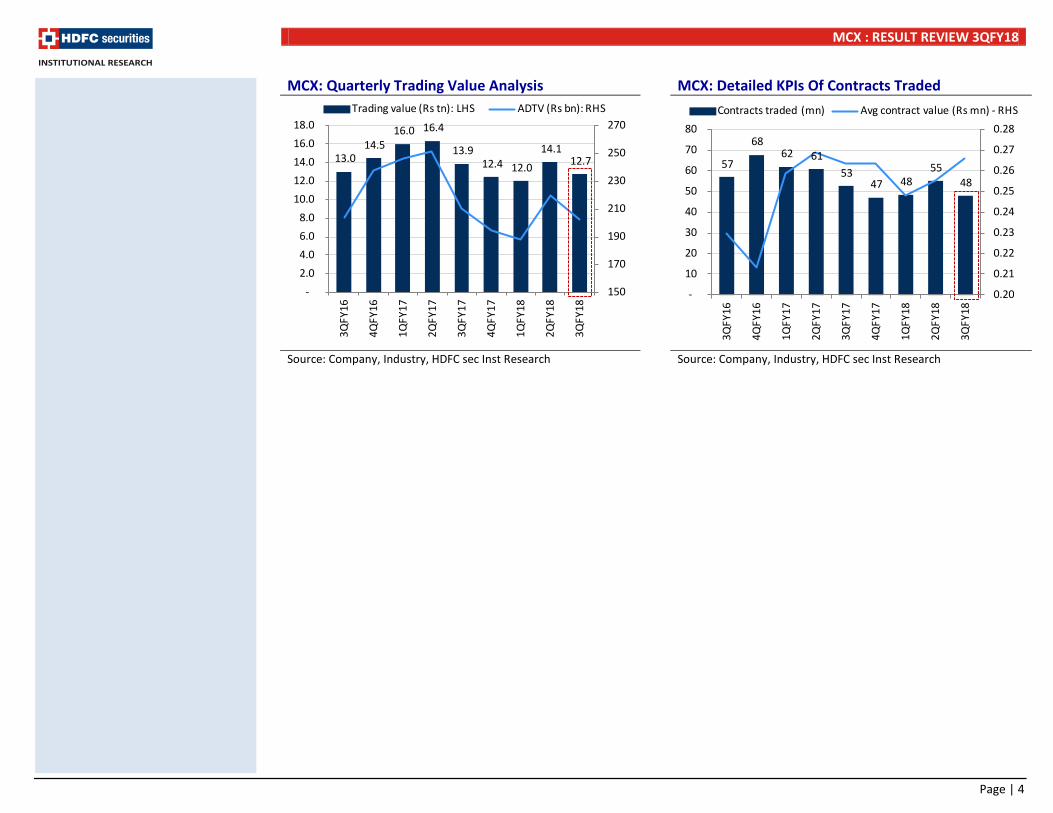
MCX: Quarterly Trading Value Analysis MCX: Detailed KPIs Of Contracts Traded
Source: Company, Industry, HDFC sec Inst Research Source: Company, Industry, HDFC sec Inst Research
13.0 14.5
16.0 16.4
13.9 12.4 12.0
14.1 12.7
150
170
190
210
230
250
270
-2.0 4.0 6.0 8.0
10.0 12.0 14.0 16.0 18.0
3QFY
16
4QFY
16
1QFY
17
2QFY
17
3QFY
17
4QFY
17
1QFY
18
2QFY
18
3QFY
18
Trading value (Rs tn): LHS ADTV (Rs bn): RHS
57
68 62 61
53 47 48
55 48
0.20
0.21
0.22
0.23
0.24
0.25
0.26
0.27
0.28
-
10
20
30
40
50
60
70
80
3QFY
16
4QFY
16
1QFY
17
2QFY
17
3QFY
17
4QFY
17
1QFY
18
2QFY
18
3QFY
18
Contracts traded (mn) Avg contract value (Rs mn) - RHS
MCX : RESULT REVIEW 3QFY18
Page | 5
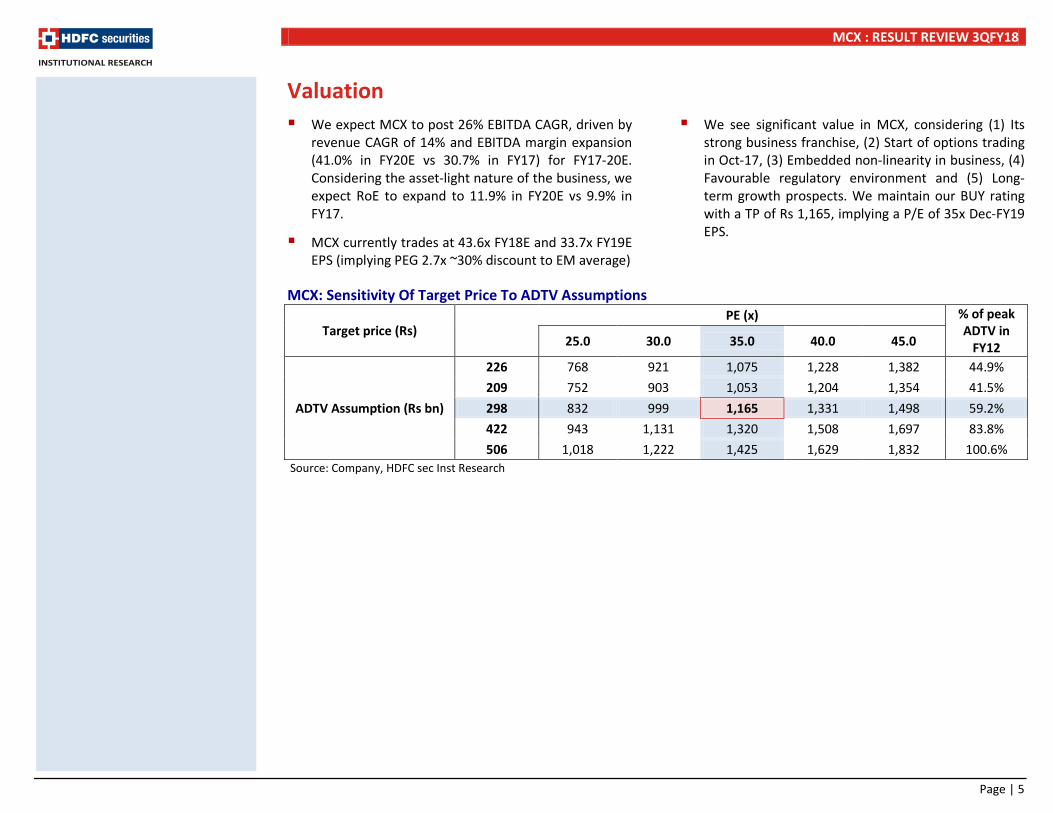
Valuation We expect MCX to post 26% EBITDA CAGR, driven by
revenue CAGR of 14% and EBITDA margin expansion (41.0% in FY20E vs 30.7% in FY17) for FY17-20E. Considering the asset-light nature of the business, we expect RoE to expand to 11.9% in FY20E vs 9.9% in FY17.
MCX currently trades at 43.6x FY18E and 33.7x FY19E EPS (implying PEG 2.7x ~30% discount to EM average)
We see significant value in MCX, considering (1) Its strong business franchise, (2) Start of options trading in Oct-17, (3) Embedded non-linearity in business, (4) Favourable regulatory environment and (5) Long-term growth prospects. We maintain our BUY rating with a TP of Rs 1,165, implying a P/E of 35x Dec-FY19 EPS.
MCX: Sensitivity Of Target Price To ADTV Assumptions
Target price (Rs)
PE (x) % of peak ADTV in
FY12 25.0 30.0 35.0 40.0 45.0
ADTV Assumption (Rs bn)
226 768 921 1,075 1,228 1,382 44.9% 209 752 903 1,053 1,204 1,354 41.5% 298 832 999 1,165 1,331 1,498 59.2% 422 943 1,131 1,320 1,508 1,697 83.8% 506 1,018 1,222 1,425 1,629 1,832 100.6%
Source: Company, HDFC sec Inst Research
MCX : RESULT REVIEW 3QFY18
Page | 6
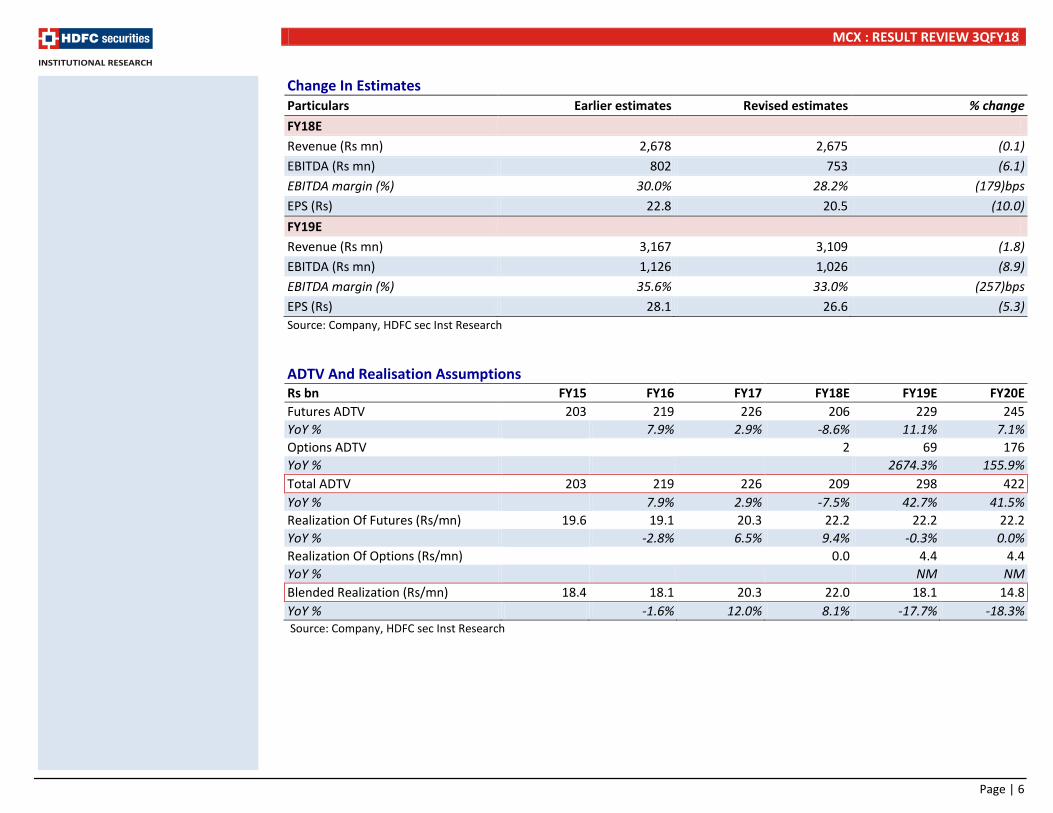
Change In Estimates Particulars Earlier estimates Revised estimates % change FY18E Revenue (Rs mn) 2,678 2,675 (0.1) EBITDA (Rs mn) 802 753 (6.1) EBITDA margin (%) 30.0% 28.2% (179)bps EPS (Rs) 22.8 20.5 (10.0) FY19E Revenue (Rs mn) 3,167 3,109 (1.8) EBITDA (Rs mn) 1,126 1,026 (8.9) EBITDA margin (%) 35.6% 33.0% (257)bps EPS (Rs) 28.1 26.6 (5.3) Source: Company, HDFC sec Inst Research
ADTV And Realisation Assumptions Rs bn FY15 FY16 FY17 FY18E FY19E FY20E Futures ADTV 203 219 226 206 229 245 YoY % 7.9% 2.9% -8.6% 11.1% 7.1% Options ADTV 2 69 176 YoY % 2674.3% 155.9% Total ADTV 203 219 226 209 298 422 YoY % 7.9% 2.9% -7.5% 42.7% 41.5% Realization Of Futures (Rs/mn) 19.6 19.1 20.3 22.2 22.2 22.2 YoY % -2.8% 6.5% 9.4% -0.3% 0.0% Realization Of Options (Rs/mn) 0.0 4.4 4.4 YoY % NM NM Blended Realization (Rs/mn) 18.4 18.1 20.3 22.0 18.1 14.8 YoY % -1.6% 12.0% 8.1% -17.7% -18.3% Source: Company, HDFC sec Inst Research
MCX : RESULT REVIEW 3QFY18
Page | 7
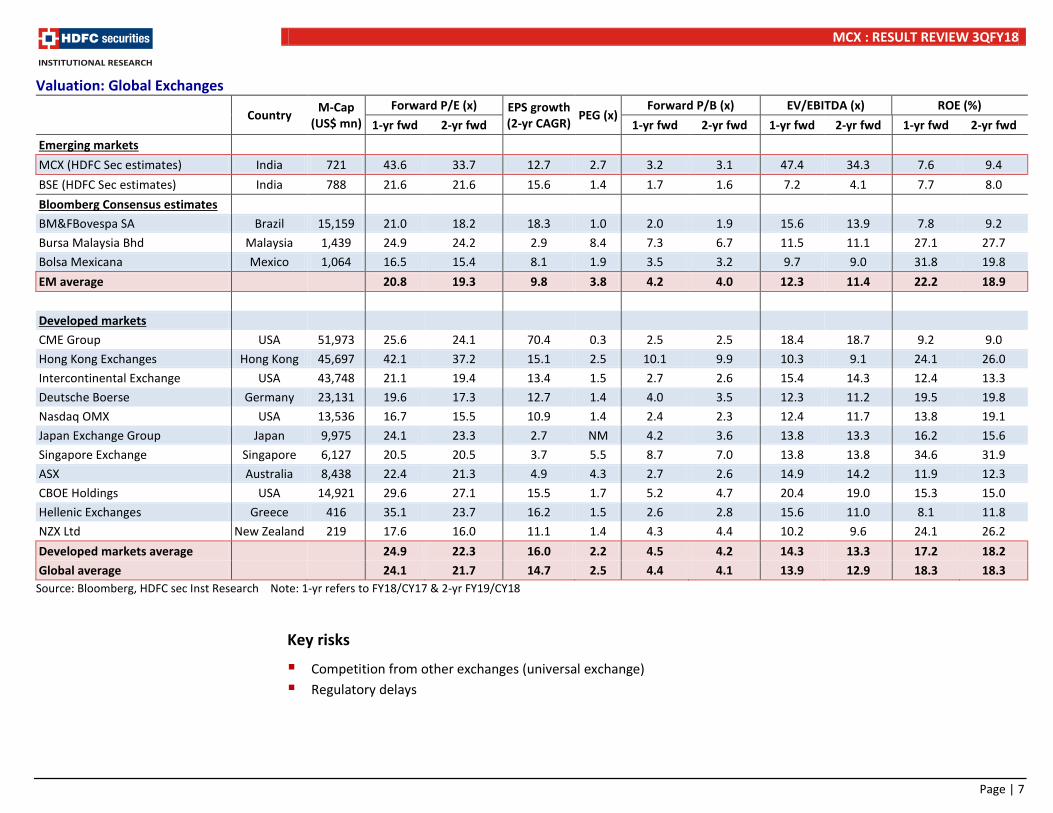
Valuation: Global Exchanges Country M-Cap
(US$ mn) Forward P/E (x) EPS growth
(2-yr CAGR) PEG (x) Forward P/B (x) EV/EBITDA (x) ROE (%)
1-yr fwd 2-yr fwd 1-yr fwd 2-yr fwd 1-yr fwd 2-yr fwd 1-yr fwd 2-yr fwd Emerging markets MCX (HDFC Sec estimates) India 721 43.6 33.7 12.7 2.7 3.2 3.1 47.4 34.3 7.6 9.4 BSE (HDFC Sec estimates) India 788 21.6 21.6 15.6 1.4 1.7 1.6 7.2 4.1 7.7 8.0 Bloomberg Consensus estimates BM&FBovespa SA Brazil 15,159 21.0 18.2 18.3 1.0 2.0 1.9 15.6 13.9 7.8 9.2 Bursa Malaysia Bhd Malaysia 1,439 24.9 24.2 2.9 8.4 7.3 6.7 11.5 11.1 27.1 27.7 Bolsa Mexicana Mexico 1,064 16.5 15.4 8.1 1.9 3.5 3.2 9.7 9.0 31.8 19.8 EM average 20.8 19.3 9.8 3.8 4.2 4.0 12.3 11.4 22.2 18.9
Developed markets CME Group USA 51,973 25.6 24.1 70.4 0.3 2.5 2.5 18.4 18.7 9.2 9.0 Hong Kong Exchanges Hong Kong 45,697 42.1 37.2 15.1 2.5 10.1 9.9 10.3 9.1 24.1 26.0 Intercontinental Exchange USA 43,748 21.1 19.4 13.4 1.5 2.7 2.6 15.4 14.3 12.4 13.3 Deutsche Boerse Germany 23,131 19.6 17.3 12.7 1.4 4.0 3.5 12.3 11.2 19.5 19.8 Nasdaq OMX USA 13,536 16.7 15.5 10.9 1.4 2.4 2.3 12.4 11.7 13.8 19.1 Japan Exchange Group Japan 9,975 24.1 23.3 2.7 NM 4.2 3.6 13.8 13.3 16.2 15.6 Singapore Exchange Singapore 6,127 20.5 20.5 3.7 5.5 8.7 7.0 13.8 13.8 34.6 31.9 ASX Australia 8,438 22.4 21.3 4.9 4.3 2.7 2.6 14.9 14.2 11.9 12.3 CBOE Holdings USA 14,921 29.6 27.1 15.5 1.7 5.2 4.7 20.4 19.0 15.3 15.0 Hellenic Exchanges Greece 416 35.1 23.7 16.2 1.5 2.6 2.8 15.6 11.0 8.1 11.8 NZX Ltd New Zealand 219 17.6 16.0 11.1 1.4 4.3 4.4 10.2 9.6 24.1 26.2 Developed markets average 24.9 22.3 16.0 2.2 4.5 4.2 14.3 13.3 17.2 18.2 Global average 24.1 21.7 14.7 2.5 4.4 4.1 13.9 12.9 18.3 18.3
Source: Bloomberg, HDFC sec Inst Research Note: 1-yr refers to FY18/CY17 & 2-yr FY19/CY18
Key risks
Competition from other exchanges (universal exchange) Regulatory delays
MCX : RESULT REVIEW 3QFY18
Page | 8
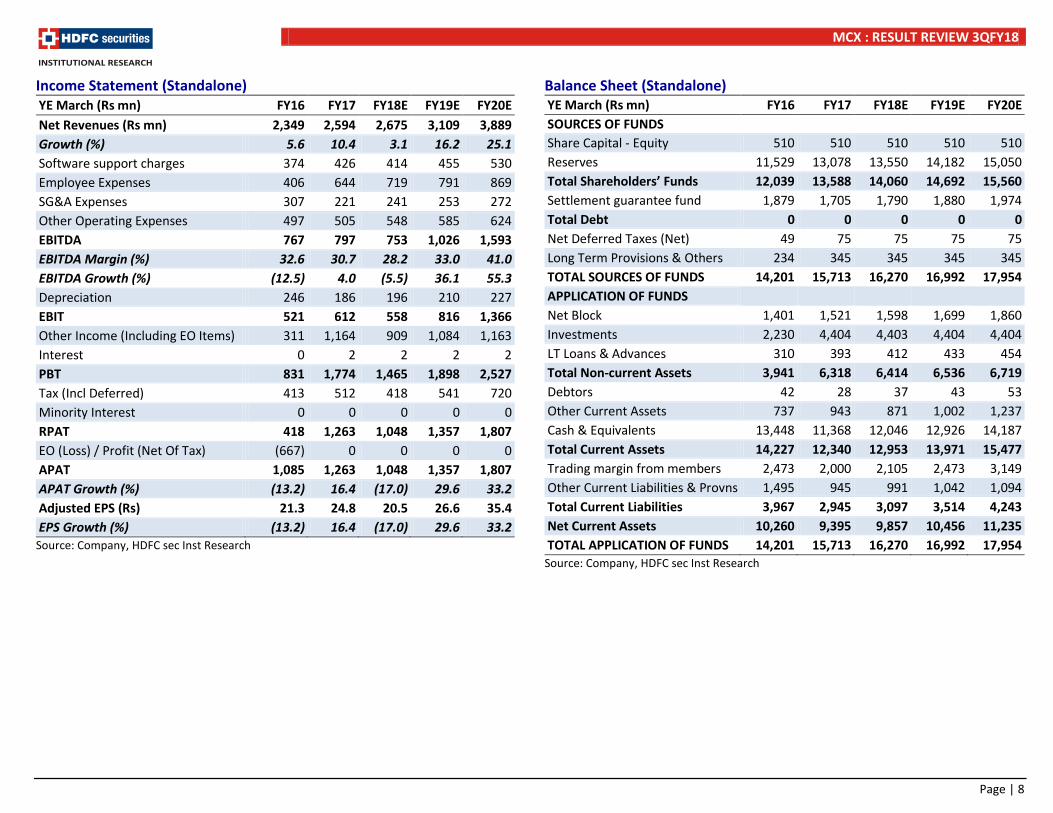
Income Statement (Standalone) YE March (Rs mn) FY16 FY17 FY18E FY19E FY20E Net Revenues (Rs mn) 2,349 2,594 2,675 3,109 3,889 Growth (%) 5.6 10.4 3.1 16.2 25.1 Software support charges 374 426 414 455 530 Employee Expenses 406 644 719 791 869 SG&A Expenses 307 221 241 253 272 Other Operating Expenses 497 505 548 585 624 EBITDA 767 797 753 1,026 1,593 EBITDA Margin (%) 32.6 30.7 28.2 33.0 41.0 EBITDA Growth (%) (12.5) 4.0 (5.5) 36.1 55.3 Depreciation 246 186 196 210 227 EBIT 521 612 558 816 1,366 Other Income (Including EO Items) 311 1,164 909 1,084 1,163 Interest 0 2 2 2 2 PBT 831 1,774 1,465 1,898 2,527 Tax (Incl Deferred) 413 512 418 541 720 Minority Interest 0 0 0 0 0 RPAT 418 1,263 1,048 1,357 1,807 EO (Loss) / Profit (Net Of Tax) (667) 0 0 0 0 APAT 1,085 1,263 1,048 1,357 1,807 APAT Growth (%) (13.2) 16.4 (17.0) 29.6 33.2 Adjusted EPS (Rs) 21.3 24.8 20.5 26.6 35.4 EPS Growth (%) (13.2) 16.4 (17.0) 29.6 33.2
Source: Company, HDFC sec Inst Research
Balance Sheet (Standalone) YE March (Rs mn) FY16 FY17 FY18E FY19E FY20E SOURCES OF FUNDS Share Capital - Equity 510 510 510 510 510 Reserves 11,529 13,078 13,550 14,182 15,050 Total Shareholders’ Funds 12,039 13,588 14,060 14,692 15,560 Settlement guarantee fund 1,879 1,705 1,790 1,880 1,974 Total Debt 0 0 0 0 0 Net Deferred Taxes (Net) 49 75 75 75 75 Long Term Provisions & Others 234 345 345 345 345 TOTAL SOURCES OF FUNDS 14,201 15,713 16,270 16,992 17,954 APPLICATION OF FUNDS Net Block 1,401 1,521 1,598 1,699 1,860 Investments 2,230 4,404 4,403 4,404 4,404 LT Loans & Advances 310 393 412 433 454 Total Non-current Assets 3,941 6,318 6,414 6,536 6,719 Debtors 42 28 37 43 53 Other Current Assets 737 943 871 1,002 1,237 Cash & Equivalents 13,448 11,368 12,046 12,926 14,187 Total Current Assets 14,227 12,340 12,953 13,971 15,477 Trading margin from members 2,473 2,000 2,105 2,473 3,149 Other Current Liabilities & Provns 1,495 945 991 1,042 1,094 Total Current Liabilities 3,967 2,945 3,097 3,514 4,243 Net Current Assets 10,260 9,395 9,857 10,456 11,235 TOTAL APPLICATION OF FUNDS 14,201 15,713 16,270 16,992 17,954
Source: Company, HDFC sec Inst Research
MCX : RESULT REVIEW 3QFY18
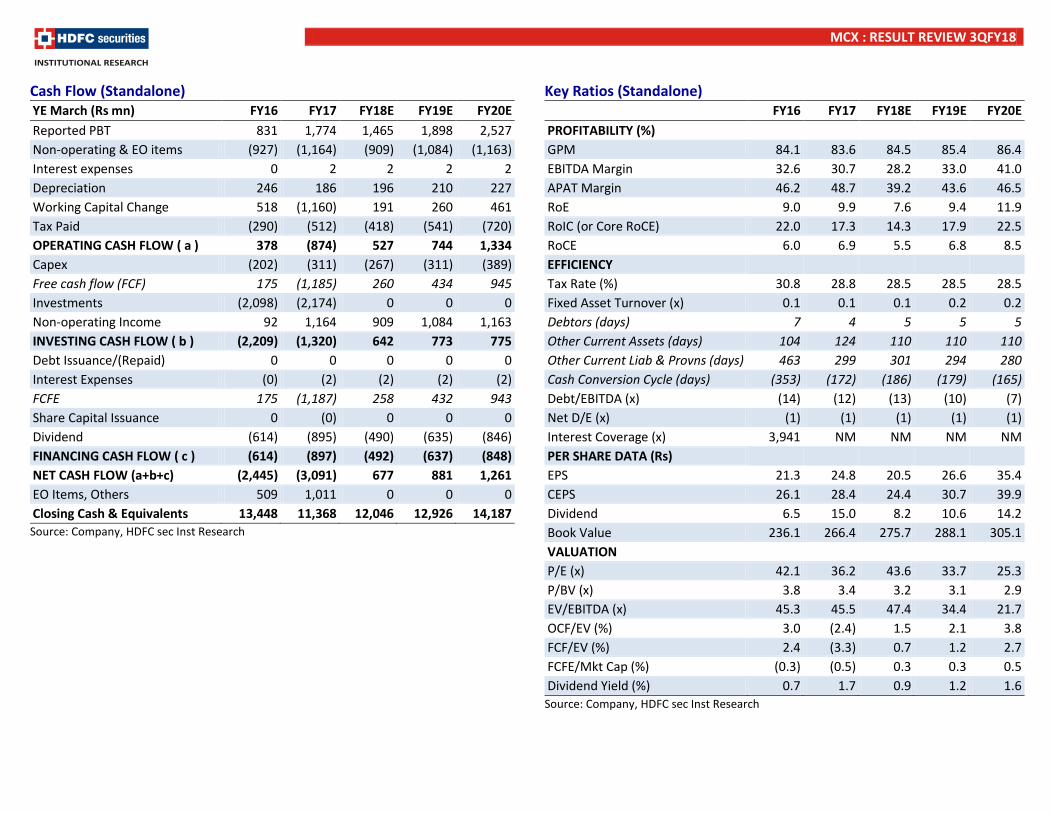
Cash Flow (Standalone) YE March (Rs mn) FY16 FY17 FY18E FY19E FY20E Reported PBT 831 1,774 1,465 1,898 2,527 Non-operating & EO items (927) (1,164) (909) (1,084) (1,163) Interest expenses 0 2 2 2 2 Depreciation 246 186 196 210 227 Working Capital Change 518 (1,160) 191 260 461 Tax Paid (290) (512) (418) (541) (720) OPERATING CASH FLOW ( a ) 378 (874) 527 744 1,334 Capex (202) (311) (267) (311) (389) Free cash flow (FCF) 175 (1,185) 260 434 945 Investments (2,098) (2,174) 0 0 0 Non-operating Income 92 1,164 909 1,084 1,163 INVESTING CASH FLOW ( b ) (2,209) (1,320) 642 773 775 Debt Issuance/(Repaid) 0 0 0 0 0 Interest Expenses (0) (2) (2) (2) (2) FCFE 175 (1,187) 258 432 943 Share Capital Issuance 0 (0) 0 0 0 Dividend (614) (895) (490) (635) (846) FINANCING CASH FLOW ( c ) (614) (897) (492) (637) (848) NET CASH FLOW (a+b+c) (2,445) (3,091) 677 881 1,261 EO Items, Others 509 1,011 0 0 0 Closing Cash & Equivalents 13,448 11,368 12,046 12,926 14,187 Source: Company, HDFC sec Inst Research
Key Ratios (Standalone) FY16 FY17 FY18E FY19E FY20E PROFITABILITY (%) GPM 84.1 83.6 84.5 85.4 86.4 EBITDA Margin 32.6 30.7 28.2 33.0 41.0 APAT Margin 46.2 48.7 39.2 43.6 46.5 RoE 9.0 9.9 7.6 9.4 11.9 RoIC (or Core RoCE) 22.0 17.3 14.3 17.9 22.5 RoCE 6.0 6.9 5.5 6.8 8.5 EFFICIENCY Tax Rate (%) 30.8 28.8 28.5 28.5 28.5 Fixed Asset Turnover (x) 0.1 0.1 0.1 0.2 0.2 Debtors (days) 7 4 5 5 5 Other Current Assets (days) 104 124 110 110 110 Other Current Liab & Provns (days) 463 299 301 294 280 Cash Conversion Cycle (days) (353) (172) (186) (179) (165) Debt/EBITDA (x) (14) (12) (13) (10) (7) Net D/E (x) (1) (1) (1) (1) (1) Interest Coverage (x) 3,941 NM NM NM NM PER SHARE DATA (Rs) EPS 21.3 24.8 20.5 26.6 35.4 CEPS 26.1 28.4 24.4 30.7 39.9 Dividend 6.5 15.0 8.2 10.6 14.2 Book Value 236.1 266.4 275.7 288.1 305.1 VALUATION P/E (x) 42.1 36.2 43.6 33.7 25.3 P/BV (x) 3.8 3.4 3.2 3.1 2.9 EV/EBITDA (x) 45.3 45.5 47.4 34.4 21.7 OCF/EV (%) 3.0 (2.4) 1.5 2.1 3.8 FCF/EV (%) 2.4 (3.3) 0.7 1.2 2.7 FCFE/Mkt Cap (%) (0.3) (0.5) 0.3 0.3 0.5 Dividend Yield (%) 0.7 1.7 0.9 1.2 1.6
Source: Company, HDFC sec Inst Research
MCX : RESULT REVIEW 3QFY18
Page | 10
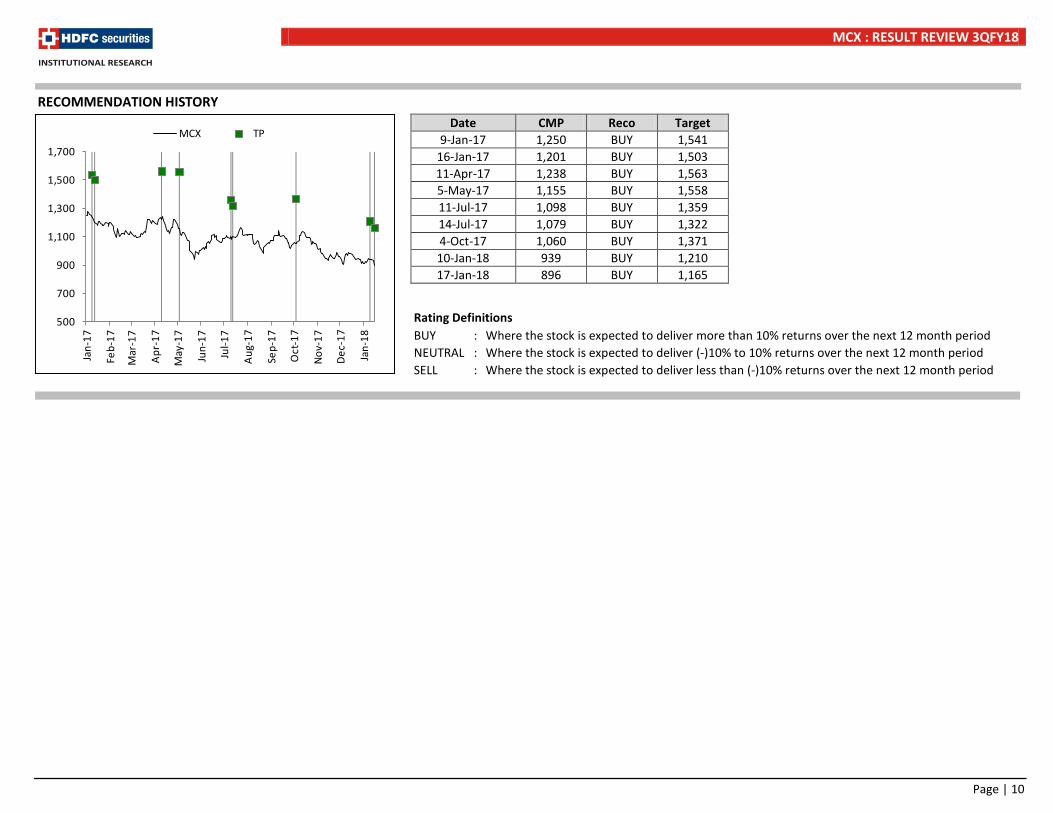
Rating Definitions BUY : Where the stock is expected to deliver more than 10% returns over the next 12 month period NEUTRAL : Where the stock is expected to deliver (-)10% to 10% returns over the next 12 month period SELL : Where the stock is expected to deliver less than (-)10% returns over the next 12 month period
Date CMP Reco Target 9-Jan-17 1,250 BUY 1,541
16-Jan-17 1,201 BUY 1,503 11-Apr-17 1,238 BUY 1,563 5-May-17 1,155 BUY 1,558 11-Jul-17 1,098 BUY 1,359 14-Jul-17 1,079 BUY 1,322 4-Oct-17 1,060 BUY 1,371 10-Jan-18 939 BUY 1,210 17-Jan-18 896 BUY 1,165
500
700
900
1,100
1,300
1,500
1,700
Jan-
17
Feb-
17
Mar
-17
Apr-
17
May
-17
Jun-
17
Jul-1
7
Aug-
17
Sep -
17
Oct
-17
Nov-
17
Dec-
17
Jan-
18
MCX TP
RECOMMENDATION HISTORY
MCX : RESULT REVIEW 3QFY18
Page | 11
Disclosure: We, Amit Chandra, MBA & Apurva Prasad, MBA, authors and the names subscribed to this report, hereby certify that all of the views expressed in this research report accurately reflect our views about the subject issuer(s) or securities. HSL has no material adverse disciplinary history as on the date of publication of this report. We also certify that no part of our compensation was, is, or will be directly or indirectly related to the specific recommendation(s) or view(s) in this report. Research Analyst or his/her relative or HDFC Securities Ltd. does not have any financial interest in the subject company. Also Research Analyst or his relative or HDFC Securities Ltd. or its Associate may have beneficial ownership of 1% or more in the subject company at the end of the month immediately preceding the date of publication of the Research Report. Further Research Analyst or his relative or HDFC Securities Ltd. or its associate does not have any material conflict of interest. Any holding in stock –No HDFC Securities Limited (HSL) is a SEBI Registered Research Analyst having registration no. INH000002475. Disclaimer: This report has been prepared by HDFC Securities Ltd and is meant for sole use by the recipient and not for circulation. The information and opinions contained herein have been compiled or arrived at, based upon information obtained in good faith from sources believed to be reliable. Such information has not been independently verified and no guaranty, representation of warranty, express or implied, is made as to its accuracy, completeness or correctness. All such information and opinions are subject to change without notice. This document is for information purposes only. Descriptions of any company or companies or their securities mentioned herein are not intended to be complete and this document is not, and should not be construed as an offer or solicitation of an offer, to buy or sell any securities or other financial instruments. This report is not directed to, or intended for display, downloading, printing, reproducing or for distribution to or use by, any person or entity who is a citizen or resident or located in any locality, state, country or other jurisdiction where such distribution, publication, reproduction, availability or use would be contrary to law or regulation or what would subject HSL or its affiliates to any registration or licensing requirement within such jurisdiction. If this report is inadvertently send or has reached any individual in such country, especially, USA, the same may be ignored and brought to the attention of the sender. This document may not be reproduced, distributed or published for any purposes without prior written approval of HSL. Foreign currencies denominated securities, wherever mentioned, are subject to exchange rate fluctuations, which could have an adverse effect on their value or price, or the income derived from them. In addition, investors in securities such as ADRs, the values of which are influenced by foreign currencies effectively assume currency risk. It should not be considered to be taken as an offer to sell or a solicitation to buy any security. HSL may from time to time solicit from, or perform broking, or other services for, any company mentioned in this mail and/or its attachments. HSL and its affiliated company(ies), their directors and employees may; (a) from time to time, have a long or short position in, and buy or sell the securities of the company(ies) mentioned herein or (b) be engaged in any other transaction involving such securities and earn brokerage or other compensation or act as a market maker in the financial instruments of the company(ies) discussed herein or act as an advisor or lender/borrower to such company(ies) or may have any other potential conflict of interests with respect to any recommendation and other related information and opinions. HSL, its directors, analysts or employees do not take any responsibility, financial or otherwise, of the losses or the damages sustained due to the investments made or any action taken on basis of this report, including but not restricted to, fluctuation in the prices of shares and bonds, changes in the currency rates, diminution in the NAVs, reduction in the dividend or income, etc. HSL and other group companies, its directors, associates, employees may have various positions in any of the stocks, securities and financial instruments dealt in the report, or may make sell or purchase or other deals in these securities from time to time or may deal in other securities of the companies / organizations described in this report. HSL or its associates might have managed or co-managed public offering of securities for the subject company or might have been mandated by the subject company for any other assignment in the past twelve months. HSL or its associates might have received any compensation from the companies mentioned in the report during the period preceding twelve months from t date of this report for services in respect of managing or co-managing public offerings, corporate finance, investment banking or merchant banking, brokerage services or other advisory service in a merger or specific transaction in the normal course of business. HSL or its analysts did not receive any compensation or other benefits from the companies mentioned in the report or third party in connection with preparation of the research report. Accordingly, neither HSL nor Research Analysts have any material conflict of interest at the time of publication of this report. Compensation of our Research Analysts is not based on any specific merchant banking, investment banking or brokerage service transactions. HSL may have issued other reports that are inconsistent with and reach different conclusion from the information presented in this report. Research entity has not been engaged in market making activity for the subject company. Research analyst has not served as an officer, director or employee of the subject company. We have not received any compensation/benefits from the subject company or third party in connection with the Research Report. HDFC securities Limited, I Think Techno Campus, Building - B, "Alpha", Office Floor 8, Near Kanjurmarg Station, Opp. Crompton Greaves, Kanjurmarg (East), Mumbai 400 042 Phone: (022) 3075 3400 Fax: (022) 2496 5066 Compliance Officer: Binkle R. Oza Email: [email protected] Phone: (022) 3045 3600 HDFC Securities Limited, SEBI Reg. No.: NSE-INB/F/E 231109431, BSE-INB/F 011109437, AMFI Reg. No. ARN: 13549, PFRDA Reg. No. POP: 04102015, IRDA Corporate Agent License No.: HDF 2806925/HDF C000222657, SEBI Research Analyst Reg. No.: INH000002475, CIN - U67120MH2000PLC152193 Mutual Funds Investments are subject to market risk. Please read the offer and scheme related documents carefully before investing.
MCX : RESULT REVIEW 3QFY18
Page | 12
HDFC securities Institutional Equities Unit No. 1602, 16th Floor, Tower A, Peninsula Business Park, Senapati Bapat Marg, Lower Parel,Mumbai - 400 013 Board : +91-22-6171 7330 www.hdfcsec.com