Embed Size (px)
Citation preview
RESULTS REVIEW 4QFY17 28 APR 2017
Kotak Mahindra Bank BUY
Countdown to growth KMB delivered yet another broad-based, strong performance with (1) Sequential loan growth of 5%, (2) Fee uptick of 24% YoY, (3) Healthy CASA expansion ~200bps, (4) Fat NIM of 4.6%, +10bps, (5) Opex growth curtailed at 2%, with C-I ratio down 220bps to ~46% and (6) Superior asset quality, despite the marginal GNPA rise. Lending subs (KMP and KMI) reported strong growth. K-Sec continued to display strong earnings momentum, while AMC profits were impacted by up-front expenses.
Post the e-VYSB integration (and demonetisation disruption), we sense KMB is at the cusp of high growth. All levers are in place : healthy Tier I (15%+, without factoring a likely fund raise), its recent mass-digital thrust, wider spread and an impeccable fix on asset quality. Consequently, RoAA will improve ~22bps to ~1.9% over FY17-19E (after the 27bps rise in FY17) led by steady NIMs, robust fee growth,
improving oplev and moderating LLP. Maintain BUY with SOTP of Rs 1,013 (4.5x FY19E core ABV of Rs 183 + subs. value of Rs 189).
Highlights of the quarter
Loan momentum continues, strong CASA growth: Broad-based loan growth was driven by Agri (+15%), CV (+12%), and business banking (+8%), while the corp loans remained stable. With improving growth trends, we have factored in 19% loan CAGR over FY17-19E. CASA (44%, +200bps) was driven by continued traction in SA (+41/8% YoY).
With improving efficiencies at e-VYSB branches and higher SA rate offerings, we believe that the robust SA growth should continue.
Near-term outlook: The stock should remain buoyant, given a consistent performance and improving growth outlook.
Financial Summary (Rs mn) 4QFY17 4QFY16 YoY (%) 3QFY17 QoQ (%) FY16 FY17P FY18E FY19E Net Interest Income 21,613 18,572 16.4% 20,503 5.4% 69,004 81,262 99,133 115,214 PPOP 17,020 11,942 42.5% 15,277 11.4% 40,411 59,848 73,226 85,586 PAT 9,765 6,958 40.3% 8,798 11.0% 20,898 34,115 43,052 51,471 EPS (Rs) 5.3 3.8 39.8% 4.8 10.8% 11.4 18.5 23.4 28.0 Core ROAE (%)
11.0 13.2 15.0 15.6
Core ROAA (%)
1.41 1.68 1.86 1.90 Core Adj. BVPS (Rs)
119.5 136.4 157.4 183.0
P/E (x)#
69.9 41.4 31.9 25.8 P/ABV (x)#
6.66 5.63 4.74 3.94
Source: Bank, HDFC sec Inst Research; Note: # adjusted for embedded value of subs.
INDUSTRY BANKS CMP (as on 27 Apr 2017) Rs 915 Target Price Rs 1,013 Nifty 9,342
Sensex 30,030
KEY STOCK DATA
Bloomberg KMB IN
No. of Shares (mn) 1,881
MCap (Rs bn) / ($ mn) 1,680/26,305
6m avg traded value (Rs mn) 1,907
STOCK PERFORMANCE (%)
52 Week high / low Rs 921/690
3M 6M 12M
Absolute (%) 16.8 13.6 28.7
Relative (%) 9.1 6.1 13.4
SHAREHOLDING PATTERN (%)
Promoters 32.1
FIs & Local MFs 5.41
FPIs 40.9
Public & Others 21.5
Source : BSE
Darpin Shah [email protected] +91-22-6171-7328 Pranav Gupta [email protected] +91-22-6171-7337
HDFC securities Institutional Research is also available on Bloomberg HSLB <GO> & Thomson Reuters
KOTAK MAHINDRA BANK : RESULTS REVIEW 4QFY17
Healthy PPOP growth: Led by a superior NIM performance (4.6%, +10bps QoQ), healthy fee growth of 24% (driven by third party distribution income), and higher recoveries and controlled opex (+2% QoQ), PPOP grew 43/11% YoY/QoQ. Oplev. was visible with C-I improvement of 220bps to 46%. A stable NIM (4.6%), steady traction in fees (17% CAGR) and controlled opex (15%) will drive efficiencies. We expect core C-I improvement of 300bps to ~47% over FY17-19E.
Low stressed assets: Managements cautious stance to recognise std. stressed SME exposures (from the e-VYSB book), led to ~13% QoQ rise in GNPA (Rs 36bn, 2.6%). However, with a 460bps drop in PCR (52%), NNPAs jumped ~25% QoQ to Rs 17bn (1.26%). Despite this, KMB’s stressed exposures remain minuscule, with a restructured book of 7bps, SMA II of 10bps and no utilisation of RBI dispensation. With no major pain in asset quality and e-VYSB, led provisions already made, we have factored in LLP of 52bps over FY17-19E vs. 66bps in FY17.
SOTP
Rs bn Per Share Rationale
Kotak Mahindra Bank - Standalone 1,516.0 823.5 4.5x Mar-19 core ABV of Rs 183 Kotak Mahindra Prime - Car Finance 198.9 108.0 3.5x FY19E core NW Kotak Mahindra Investments - LAS 44.6 24.2 3.0x FY19E core NW Kotak Securities - Broking 62.8 34.1 15x FY19E Earnings Kotak Mahindra AMC - Asset Management 56.9 30.9 5% of FY19E AUM Kotak Life - Life Insurance 46.5 25.3 20% APE CAGR FY17-19E; NBAP Margin at 15%. KMCC - Investment Banking 4.8 2.6 1.25x FY19E core NW Kotak Alternative Assets 5.1 2.8 7.5% of FY19E AUM Offshore Funds 16.0 8.7 5% of FY18E AUM Total Value of Subsidiaries 435.7 241.5
Less : 20% Holding Discount 87.1 48.3
Total SOTP Value 1,865 1,013
Current Value 1,684 915
Upside (%) 10.7 10.7 Source: HDFC sec Inst Research
Page | 2

KOTAK MAHINDRA BANK : RESULTS REVIEW 4QFY17
Five Quarters At A Glance Rs mn 4QFY16 1QFY17 2QFY17 3QFY17 4QFY17 YoY Growth QoQ Growth Net Interest Income 18,572 19,191 19,954 20,503 21,613 16.4% 5.4% Non Interest Income 6,819 7,332 8,311 9,102 10,027 47.0% 10.2% Fee Income 6,100 5,640 6,300 7,250 7,570 24.1% 4.4% Operating Income 25,392 26,523 28,265 29,605 31,640 24.6% 6.9% Operating Expenses 13,450 13,373 13,864 14,328 14,620 8.7% 2.0% Pre provision Profits 11,942 13,150 14,401 15,277 17,020 42.5% 11.4% Provisions 2,004 1,795 1,978 1,921 2,674 33.4% 39.2%
NPA Provisions 1,704 1,671 1,415 1,370 2,519 47.8% 84.0% PBT 9,937 11,355 12,423 13,356 14,346 44.4% 7.4% Provision For Tax 2,980 3,936 4,290 4,558 4,582 53.8% 0.5% PAT 6,958 7,420 8,133 8,798 9,765 40.3% 11.0% Balance Sheet items/ratios Deposits (Rs bn) 1,386 1,400 1,410 1,494 1,574 13.5% 5.4%
CASA (%) 38.1 37.4 39.0 42.0 44.0 593 bps 196 bps Advances (Rs bn) 1,187 1,208 1,260 1,293 1,361 14.7% 5.3%
CV And CE (%) 6.3 6.6 6.9 7.5 8.0 167 bps 49 bps Agri Finance (%) 15.2 13.9 14.1 12.8 13.9 -122 bps 116 bps Mortgage Loans (%) 19.4 19.4 19.4 19.4 19.2 -19 bps -18 bps PL (%) 12.6 12.2 12.6 12.2 12.8 18 bps 57 bps Business Banking (%) 15.2 14.1 13.8 12.9 13.1 -202 bps 28 bps Corp Banking (%) 29.5 31.5 30.7 32.9 30.6 118 bps -229 bps Others (%) 1.9 2.3 2.5 2.4 2.3 42 bps -2 bps
CD ratio (%) 85.6 86.2 89.3 86.5 86.4 85 bps -11 bps CAR (%) 16.3 16.34 16.8 16.0 16.8 50 bps 80 bps
Tier I (%) 15.3 15.8 15.7 14.9 15.2 -10 bps 30 bps Profitability Calc. Yield On Advances (%) 11.0 11.0 10.9 10.7 10.15 -81 bps -51 bps Calc. Cost Of Funds (%) 6.2 6.2 6.1 5.9 5.25 -96 bps -64 bps NIM (%) 4.30 4.37 4.47 4.49 4.60 30 bps 11 bps Cost-Income Ratio (%) 53.0 50.4 49.1 48.4 46.2 -676 bps -219 bps Tax Rate (%) 30.0 34.7 34.5 34.1 31.9 195 bps -219 bps Asset Quality Gross NPA (Rs bn) 28.4 30.6 31.8 31.8 35.8 26.1% 12.6% Net NPA (Rs bn) 12.6 14.7 15.2 13.8 17.2 36.1% 24.6% Gross NPAs (%) 2.4 2.5 2.5 2.4 2.6 23 bps 17 bps Net NPAs (%) 1.1 1.2 1.2 1.1 1.3 20 bps 19 bps Coverage Ratio (%) 55.5 52.0 52.3 56.6 52.0 -354 bps -461 bps Restructured Book (%) 0.26 0.13 0.12 0.11 0.07 -18 bps -4 bps Source: HDFC sec Inst Research
Slightly ahead of estimates driven by sequential NIM improvement of 10bps
Fees were driven by strong third party distribution income; recoveries were higher at ~Rs 1bn
KMB has recognised entire stress inherited from e-VYSB
Led by strong SA growth of 41% YoY and CA growth of 19% YoY
Share of CASA and TD sweep together constitutes ~50% of deposits
Led by a sharp drop in CoF; Avg SA rate at 5.5%, stable QoQ
Due to one-off tax benefits
~8% QoQ growth was a positive
We have not factored in fund raise
Lowest amongst peers, SMA II stood at a mere 10bps
Page | 3
KOTAK MAHINDRA BANK : RESULTS REVIEW 4QFY17
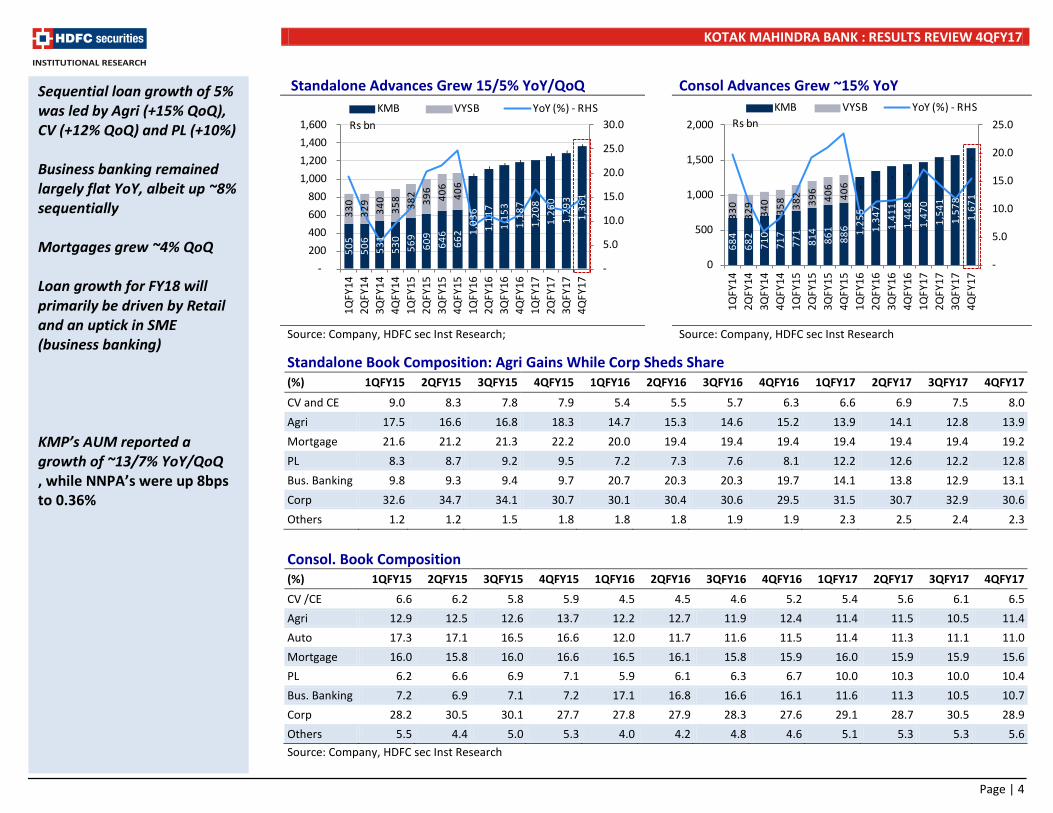
Standalone Advances Grew 15/5% YoY/QoQ Consol Advances Grew ~15% YoY
Source: Company, HDFC sec Inst Research; Source: Company, HDFC sec Inst Research
Standalone Book Composition: Agri Gains While Corp Sheds Share (%) 1QFY15 2QFY15 3QFY15 4QFY15 1QFY16 2QFY16 3QFY16 4QFY16 1QFY17 2QFY17 3QFY17 4QFY17
CV and CE 9.0 8.3 7.8 7.9 5.4 5.5 5.7 6.3 6.6 6.9 7.5 8.0
Agri 17.5 16.6 16.8 18.3 14.7 15.3 14.6 15.2 13.9 14.1 12.8 13.9
Mortgage 21.6 21.2 21.3 22.2 20.0 19.4 19.4 19.4 19.4 19.4 19.4 19.2
PL 8.3 8.7 9.2 9.5 7.2 7.3 7.6 8.1 12.2 12.6 12.2 12.8
Bus. Banking 9.8 9.3 9.4 9.7 20.7 20.3 20.3 19.7 14.1 13.8 12.9 13.1
Corp 32.6 34.7 34.1 30.7 30.1 30.4 30.6 29.5 31.5 30.7 32.9 30.6
Others 1.2 1.2 1.5 1.8 1.8 1.8 1.9 1.9 2.3 2.5 2.4 2.3
Consol. Book Composition (%) 1QFY15 2QFY15 3QFY15 4QFY15 1QFY16 2QFY16 3QFY16 4QFY16 1QFY17 2QFY17 3QFY17 4QFY17
CV /CE 6.6 6.2 5.8 5.9 4.5 4.5 4.6 5.2 5.4 5.6 6.1 6.5
Agri 12.9 12.5 12.6 13.7 12.2 12.7 11.9 12.4 11.4 11.5 10.5 11.4
Auto 17.3 17.1 16.5 16.6 12.0 11.7 11.6 11.5 11.4 11.3 11.1 11.0
Mortgage 16.0 15.8 16.0 16.6 16.5 16.1 15.8 15.9 16.0 15.9 15.9 15.6
PL 6.2 6.6 6.9 7.1 5.9 6.1 6.3 6.7 10.0 10.3 10.0 10.4
Bus. Banking 7.2 6.9 7.1 7.2 17.1 16.8 16.6 16.1 11.6 11.3 10.5 10.7
Corp 28.2 30.5 30.1 27.7 27.8 27.9 28.3 27.6 29.1 28.7 30.5 28.9
Others 5.5 4.4 5.0 5.3 4.0 4.2 4.8 4.6 5.1 5.3 5.3 5.6 Source: Company, HDFC sec Inst Research
Sequential loan growth of 5% was led by Agri (+15% QoQ), CV (+12% QoQ) and PL (+10%) Business banking remained largely flat YoY, albeit up ~8% sequentially Mortgages grew ~4% QoQ Loan growth for FY18 will primarily be driven by Retail and an uptick in SME (business banking) KMP’s AUM reported a growth of ~13/7% YoY/QoQ , while NNPA’s were up 8bps to 0.36%
505
506
531
530
569
609
646
662 1,
036
1,11
7 1,
153
1,18
7 1,
208
1,26
0 1,
293
1,36
1
330
329
340
358
382
396
406
406
-- - -
- - -
-
5.0
10.0
15.0
20.0
25.0
30.0
-
200
400
600
800
1,000
1,200
1,400
1,600
1QFY
142Q
FY14
3QFY
144Q
FY14
1QFY
152Q
FY15
3QFY
154Q
FY15
1QFY
162Q
FY16
3QFY
164Q
FY16
1QFY
172Q
FY17
3QFY
174Q
FY17
KMB VYSB YoY (%) - RHS
Rs bn
684
682
710
717
771
814
861
886 1,
255
1,34
7
1,41
1
1,44
8
1,47
0
1,54
1
1,57
8
1,67
1
330
329
340
358
382
396
406
406 -
- - -
-
-
5.0
10.0
15.0
20.0
25.0
0
500
1,000
1,500
2,000
1QFY
142Q
FY14
3QFY
144Q
FY14
1QFY
152Q
FY15
3QFY
154Q
FY15
1QFY
162Q
FY16
3QFY
164Q
FY16
1QFY
172Q
FY17
3QFY
174Q
FY17
KMB VYSB YoY (%) - RHSRs bn
Page | 4

KOTAK MAHINDRA BANK : RESULTS REVIEW 4QFY17
KMP Book: Total Advances Grew 13/7%YoY/QoQ LAS Customer Assets Continues Momemtum
Source: Bank, HDFC sec Inst Research Source: Bank, HDFC sec Inst Research
Deposits Growth Was Strong At 14% CASA Ratio Grew 31/10% YoY/QoQ Led by SA
Source: Bank, HDFC sec Inst Research; Source: Bank, HDFC sec Inst Research
Deposits Break-up (%) 1QFY15 2QFY15 3QFY15 4QFY15 1QFY16 2QFY16 3QFY16 4QFY16 1QFY17 2QFY17 3QFY17 4QFY17
CA 13.1 13.9 14.6 17.6 14.9 16.5 15.0 16.8 15.6 15.6 15.2 17.6
SA 17.9 17.2 16.9 18.7 19.5 19.8 20.3 21.3 21.8 23.4 24.2 26.4
TD 69.0 68.9 68.5 63.6 65.7 63.8 64.7 61.9 62.6 61.0 60.6 56.0 Source: Company, HDFC sec Inst Research
KMP’s car loans grew ~13% YoY, and other advances saw a string growth of ~25/13% YoY/QoQ KMI (LAS business) AUM grew 44/16% YoY/QoQ SA growth was strong at 41/8% YoY/QoQ, yielding an improved CASA ratio at 44% (+590bps YoY and 200bps QoQ) KMB to continue its higher rate offerings in SA deposits TD sweep deposits form ~6.4% vs. 7.3% QoQ of total deposits
-2.0 4.0 6.0 8.0 10.0 12.0 14.0 16.0 18.0
0
50
100
150
200
250
300
2QFY
14
3QFY
14
4QFY
14
1QFY
15
2QFY
15
3QFY
15
4QFY
15
1QFY
16
2QFY
16
3QFY
16
4QFY
16
1QFY
17
2QFY
17
3QFY
17
4QFY
17
Total Loans Car Loans
Total Loans YoY Car Loans YoY
Rs bn %
7.4 11
.7
15.6
23.8
23.6
30.2
32.7
34.3
40.2
47.6
48.0
48.7
55.3
59.6
69.1
-
10.0
20.0
30.0
40.0
50.0
60.0
70.0
80.0
2QFY
14
3QFY
14
4QFY
14
1QFY
15
2QFY
15
3QFY
15
4QFY
15
1QFY
16
2QFY
16
3QFY
16
4QFY
16
1QFY
17
2QFY
17
3QFY
17
4QFY
17
Rs bn
525
526
547
591
614
681
731
749 1,
168
1,23
2
1,30
9
1,38
6
1,40
0
1,41
0
1,49
4
1,57
4
409
400
390
412
423 44
7
460
460 0 0 0 0
0
-
5.0
10.0
15.0
20.0
25.0
30.0
35.0
40.0
0
500
1,000
1,500
2,000
1QFY
142Q
FY14
3QFY
144Q
FY14
1QFY
152Q
FY15
3QFY
154Q
FY15
1QFY
162Q
FY16
3QFY
164Q
FY16
1QFY
172Q
FY17
3QFY
174Q
FY17
KMB VYSB YoY (%) - RHS
Rs bn
151
154
163
188
190
212
231
272 40
1
447
462 52
8
524
550 62
8 693
123
130
135
138
126 14
8
146 14
6 -
- -
-
-
-
10.0
20.0
30.0
40.0
50.0
-
100
200
300
400
500
600
700
800
1QFY
142Q
FY14
3QFY
144Q
FY14
1QFY
152Q
FY15
3QFY
154Q
FY15
1QFY
162Q
FY16
3QFY
164Q
FY16
1QFY
172Q
FY17
3QFY
174Q
FY17
KMB VYSB YoY (%) - RHS
Rs bn
Page | 5
KOTAK MAHINDRA BANK : RESULTS REVIEW 4QFY17
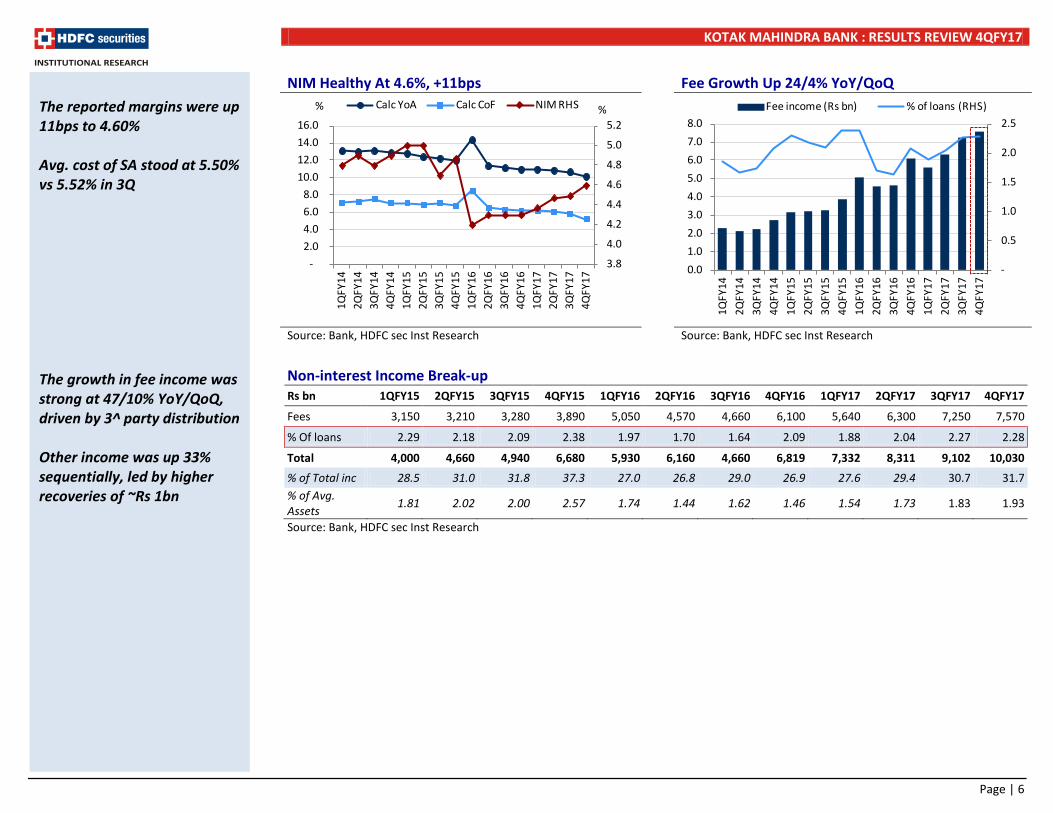
NIM Healthy At 4.6%, +11bps Fee Growth Up 24/4% YoY/QoQ
Source: Bank, HDFC sec Inst Research Source: Bank, HDFC sec Inst Research
Non-interest Income Break-up Rs bn 1QFY15 2QFY15 3QFY15 4QFY15 1QFY16 2QFY16 3QFY16 4QFY16 1QFY17 2QFY17 3QFY17 4QFY17
Fees 3,150 3,210 3,280 3,890 5,050 4,570 4,660 6,100 5,640 6,300 7,250 7,570
% Of loans 2.29 2.18 2.09 2.38 1.97 1.70 1.64 2.09 1.88 2.04 2.27 2.28
Total 4,000 4,660 4,940 6,680 5,930 6,160 4,660 6,819 7,332 8,311 9,102 10,030
% of Total inc 28.5 31.0 31.8 37.3 27.0 26.8 29.0 26.9 27.6 29.4 30.7 31.7 % of Avg. Assets
1.81 2.02 2.00 2.57 1.74 1.44 1.62 1.46 1.54 1.73 1.83 1.93
Source: Bank, HDFC sec Inst Research
The reported margins were up 11bps to 4.60% Avg. cost of SA stood at 5.50% vs 5.52% in 3Q The growth in fee income was strong at 47/10% YoY/QoQ, driven by 3^ party distribution Other income was up 33% sequentially, led by higher recoveries of ~Rs 1bn
3.8
4.0
4.2
4.4
4.6
4.8
5.0
5.2
-
2.0
4.0
6.0
8.0
10.0
12.0
14.0
16.0
1QFY
142Q
FY14
3QFY
144Q
FY14
1QFY
152Q
FY15
3QFY
154Q
FY15
1QFY
162Q
FY16
3QFY
164Q
FY16
1QFY
172Q
FY17
3QFY
174Q
FY17
Calc YoA Calc CoF NIM RHS% %
-
0.5
1.0
1.5
2.0
2.5
0.0
1.0
2.0
3.0
4.0
5.0
6.0
7.0
8.0
1QFY
14
2QFY
14
3QFY
14
4QFY
14
1QFY
15
2QFY
15
3QFY
15
4QFY
15
1QFY
16
2QFY
16
3QFY
16
4QFY
16
1QFY
17
2QFY
17
3QFY
17
4QFY
17
Fee income (Rs bn) % of loans (RHS)
Page | 6
KOTAK MAHINDRA BANK : RESULTS REVIEW 4QFY17
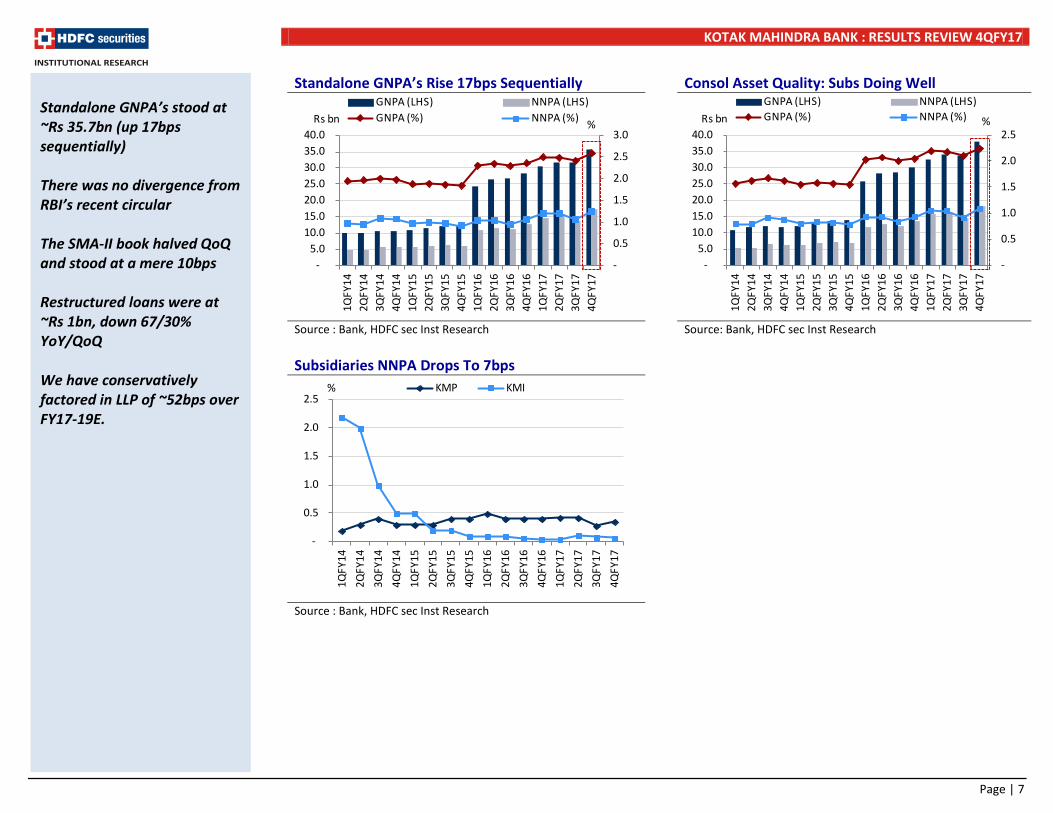
Standalone GNPA’s Rise 17bps Sequentially Consol Asset Quality: Subs Doing Well
Source : Bank, HDFC sec Inst Research Source: Bank, HDFC sec Inst Research Subsidiaries NNPA Drops To 7bps
Source : Bank, HDFC sec Inst Research
Standalone GNPA’s stood at ~Rs 35.7bn (up 17bps sequentially) There was no divergence from RBI’s recent circular The SMA-II book halved QoQ and stood at a mere 10bps Restructured loans were at ~Rs 1bn, down 67/30% YoY/QoQ We have conservatively factored in LLP of ~52bps over FY17-19E.
-
0.5
1.0
1.5
2.0
2.5
3.0
-5.0
10.0 15.0 20.0 25.0 30.0 35.0 40.0
1QFY
142Q
FY14
3QFY
144Q
FY14
1QFY
152Q
FY15
3QFY
154Q
FY15
1QFY
162Q
FY16
3QFY
164Q
FY16
1QFY
172Q
FY17
3QFY
174Q
FY17
GNPA (LHS) NNPA (LHS)GNPA (%) NNPA (%)Rs bn %
-
0.5
1.0
1.5
2.0
2.5
-5.0
10.0 15.0 20.0 25.0 30.0 35.0 40.0
1QFY
142Q
FY14
3QFY
144Q
FY14
1QFY
152Q
FY15
3QFY
154Q
FY15
1QFY
162Q
FY16
3QFY
164Q
FY16
1QFY
172Q
FY17
3QFY
174Q
FY17
GNPA (LHS) NNPA (LHS)GNPA (%) NNPA (%)Rs bn %
-
0.5
1.0
1.5
2.0
2.5
1QFY
14
2QFY
14
3QFY
14
4QFY
14
1QFY
15
2QFY
15
3QFY
15
4QFY
15
1QFY
16
2QFY
16
3QFY
16
4QFY
16
1QFY
17
2QFY
17
3QFY
17
4QFY
17
KMP KMI%
Page | 7
KOTAK MAHINDRA BANK : RESULTS REVIEW 4QFY17
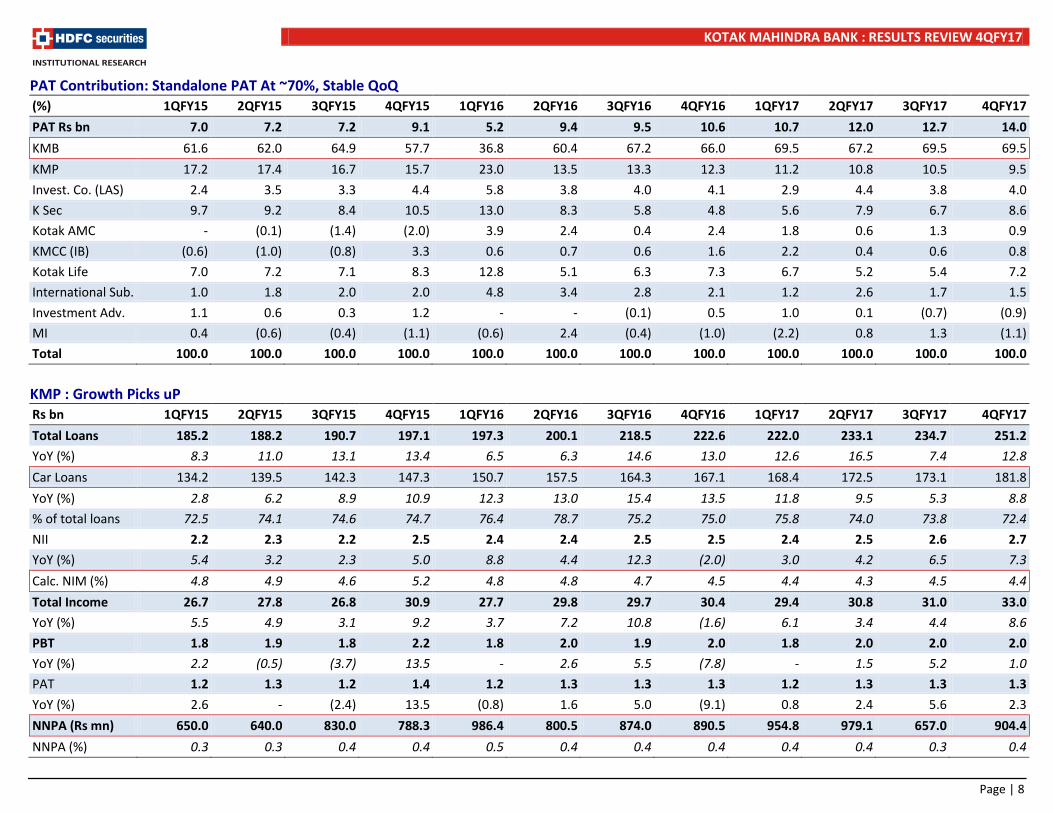
PAT Contribution: Standalone PAT At ~70%, Stable QoQ (%) 1QFY15 2QFY15 3QFY15 4QFY15 1QFY16 2QFY16 3QFY16 4QFY16 1QFY17 2QFY17 3QFY17 4QFY17
PAT Rs bn 7.0 7.2 7.2 9.1 5.2 9.4 9.5 10.6 10.7 12.0 12.7 14.0
KMB 61.6 62.0 64.9 57.7 36.8 60.4 67.2 66.0 69.5 67.2 69.5 69.5
KMP 17.2 17.4 16.7 15.7 23.0 13.5 13.3 12.3 11.2 10.8 10.5 9.5
Invest. Co. (LAS) 2.4 3.5 3.3 4.4 5.8 3.8 4.0 4.1 2.9 4.4 3.8 4.0
K Sec 9.7 9.2 8.4 10.5 13.0 8.3 5.8 4.8 5.6 7.9 6.7 8.6
Kotak AMC - (0.1) (1.4) (2.0) 3.9 2.4 0.4 2.4 1.8 0.6 1.3 0.9
KMCC (IB) (0.6) (1.0) (0.8) 3.3 0.6 0.7 0.6 1.6 2.2 0.4 0.6 0.8
Kotak Life 7.0 7.2 7.1 8.3 12.8 5.1 6.3 7.3 6.7 5.2 5.4 7.2
International Sub. 1.0 1.8 2.0 2.0 4.8 3.4 2.8 2.1 1.2 2.6 1.7 1.5
Investment Adv. 1.1 0.6 0.3 1.2 - - (0.1) 0.5 1.0 0.1 (0.7) (0.9)
MI 0.4 (0.6) (0.4) (1.1) (0.6) 2.4 (0.4) (1.0) (2.2) 0.8 1.3 (1.1)
Total 100.0 100.0 100.0 100.0 100.0 100.0 100.0 100.0 100.0 100.0 100.0 100.0
KMP : Growth Picks uP Rs bn 1QFY15 2QFY15 3QFY15 4QFY15 1QFY16 2QFY16 3QFY16 4QFY16 1QFY17 2QFY17 3QFY17 4QFY17
Total Loans 185.2 188.2 190.7 197.1 197.3 200.1 218.5 222.6 222.0 233.1 234.7 251.2
YoY (%) 8.3 11.0 13.1 13.4 6.5 6.3 14.6 13.0 12.6 16.5 7.4 12.8
Car Loans 134.2 139.5 142.3 147.3 150.7 157.5 164.3 167.1 168.4 172.5 173.1 181.8
YoY (%) 2.8 6.2 8.9 10.9 12.3 13.0 15.4 13.5 11.8 9.5 5.3 8.8
% of total loans 72.5 74.1 74.6 74.7 76.4 78.7 75.2 75.0 75.8 74.0 73.8 72.4
NII 2.2 2.3 2.2 2.5 2.4 2.4 2.5 2.5 2.4 2.5 2.6 2.7
YoY (%) 5.4 3.2 2.3 5.0 8.8 4.4 12.3 (2.0) 3.0 4.2 6.5 7.3
Calc. NIM (%) 4.8 4.9 4.6 5.2 4.8 4.8 4.7 4.5 4.4 4.3 4.5 4.4
Total Income 26.7 27.8 26.8 30.9 27.7 29.8 29.7 30.4 29.4 30.8 31.0 33.0
YoY (%) 5.5 4.9 3.1 9.2 3.7 7.2 10.8 (1.6) 6.1 3.4 4.4 8.6
PBT 1.8 1.9 1.8 2.2 1.8 2.0 1.9 2.0 1.8 2.0 2.0 2.0
YoY (%) 2.2 (0.5) (3.7) 13.5 - 2.6 5.5 (7.8) - 1.5 5.2 1.0
PAT 1.2 1.3 1.2 1.4 1.2 1.3 1.3 1.3 1.2 1.3 1.3 1.3
YoY (%) 2.6 - (2.4) 13.5 (0.8) 1.6 5.0 (9.1) 0.8 2.4 5.6 2.3
NNPA (Rs mn) 650.0 640.0 830.0 788.3 986.4 800.5 874.0 890.5 954.8 979.1 657.0 904.4
NNPA (%) 0.3 0.3 0.4 0.4 0.5 0.4 0.4 0.4 0.4 0.4 0.3 0.4
Page | 8

KOTAK MAHINDRA BANK : RESULTS REVIEW 4QFY17
Kotak Sec Snapshot: Healthy PAT Growth Rs mn. 1QFY15 2QFY15 3QFY15 4QFY15 1QFY16 2QFY16 3QFY16 4QFY16 1QFY17 2QFY17 3QFY17 4QFY17
K Sec Vol (bn) 60.53 66.21 73.78 83.72 78.13 75.93 64.81 74.03 76.72 73.29 87.43 104.34
Market Share (%) 2.9 2.7 2.8 2.9 2.7 2.7 2.7 2.3 2.4 2.3 2.2 2.2
Total Income 2230 2240 2230 2890 2500 2700 2280 2250 2380 2940 2870 3660
YoY (%) 51.7 47.4 32.7 80.6 12.1 20.5 2.2 (22.1) (4.8) 8.9 25.9 62.7
Yield (calc.) 0.06 0.06 0.05 0.06 0.05 0.06 0.06 0.05 0.05 0.07 0.05 0.06
PBT 1030 1000 910 1470 1020 1200 830 750 920 1440 1250 1820
YoY (%) 114.6 66.7 28.2 167.3 (1.0) 20.0 (8.8) (49.0) (9.8) 20.0 50.6 142.7
PAT 680 660 600 960 670 780 550 510 600 960 850 1210
YoY (%) 119.4 65.0 30.4 118.2 (1.5) 18.2 (8.3) (46.9) (10.4) 23.1 54.5 137.3
Kotak AMC Snapshot: Earnings Growth Arrested By Up Fronting Of Expenses Rs mn 1QFY15 2QFY15 3QFY15 4QFY15 1QFY16 2QFY16 3QFY16 4QFY16 1QFY17 2QFY17 3QFY17 4QFY17
AUM (Rs bn) 666 657 714 806 942 960 957 1022 1109 1207 1331 1414
Debt (%) 47.0 43.0 40.0 36.0 41.0 39.0 42.5 38.3 41.1 42.9 44.7 43.1
Equity (%) 7.0 9.0 10.0 12.0 14.0 14.0 13.7 14.3 14.5 16.0 16.8 19.6
Alt assets (%) 9.0 9.0 9.0 7.0 6.0 6.0 6.0 11.1 10.3 9.0 8.2 5.1
Offshore Funds (%) 18.0 19.0 22.0 26.0 23.0 25.0 22.1 20.7 19.0 17.3 16.5 17.4
Insurance (%) 18.0 19.0 18.0 18.0 18.0 15.0 15.4 15.2 14.6 14.2 13.0 13.7
PMS (%) 1.0 1.0 1.0 1.0 1.0 1.0 0.4 0.4 0.4 0.6 0.8 1.1
PBT 0 0 -90 -160 210 240 130 320 290 110 240 200
YoY (%) (100.0) (100.0) (150.0) (420.0) #DIV/0! #DIV/0! (244.4) (300.0) 38.1 (54.2) 84.6 (37.5)
PAT 0 -10 -10 -180 200 230 40 250 190 70 160 130
YoY (%) (100.0) (105.9) (108.3) (550.0) #DIV/0! (2,400.0) (500.0) (238.9) (5.0) (69.6) 300.0 (48.0)
Page | 9
KOTAK MAHINDRA BANK : RESULTS REVIEW 4QFY17
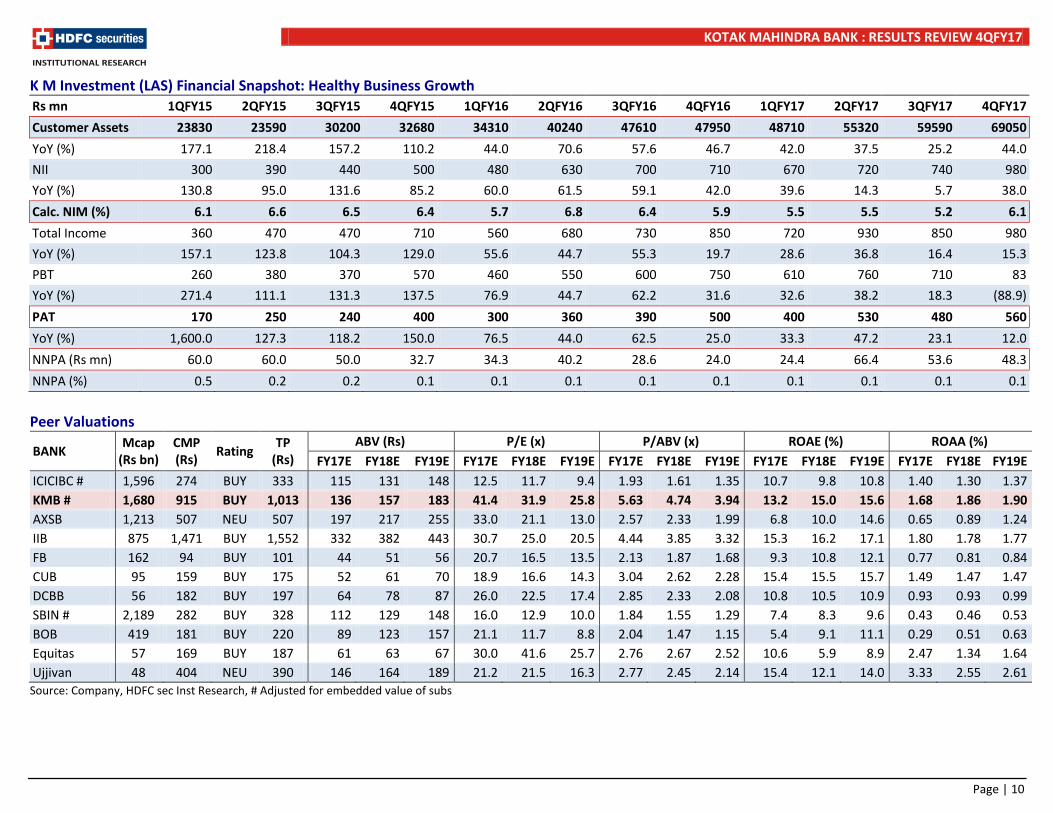
K M Investment (LAS) Financial Snapshot: Healthy Business Growth Rs mn 1QFY15 2QFY15 3QFY15 4QFY15 1QFY16 2QFY16 3QFY16 4QFY16 1QFY17 2QFY17 3QFY17 4QFY17
Customer Assets 23830 23590 30200 32680 34310 40240 47610 47950 48710 55320 59590 69050
YoY (%) 177.1 218.4 157.2 110.2 44.0 70.6 57.6 46.7 42.0 37.5 25.2 44.0
NII 300 390 440 500 480 630 700 710 670 720 740 980
YoY (%) 130.8 95.0 131.6 85.2 60.0 61.5 59.1 42.0 39.6 14.3 5.7 38.0
Calc. NIM (%) 6.1 6.6 6.5 6.4 5.7 6.8 6.4 5.9 5.5 5.5 5.2 6.1
Total Income 360 470 470 710 560 680 730 850 720 930 850 980
YoY (%) 157.1 123.8 104.3 129.0 55.6 44.7 55.3 19.7 28.6 36.8 16.4 15.3
PBT 260 380 370 570 460 550 600 750 610 760 710 83
YoY (%) 271.4 111.1 131.3 137.5 76.9 44.7 62.2 31.6 32.6 38.2 18.3 (88.9)
PAT 170 250 240 400 300 360 390 500 400 530 480 560
YoY (%) 1,600.0 127.3 118.2 150.0 76.5 44.0 62.5 25.0 33.3 47.2 23.1 12.0
NNPA (Rs mn) 60.0 60.0 50.0 32.7 34.3 40.2 28.6 24.0 24.4 66.4 53.6 48.3
NNPA (%) 0.5 0.2 0.2 0.1 0.1 0.1 0.1 0.1 0.1 0.1 0.1 0.1
Peer Valuations
BANK Mcap
(Rs bn) CMP (Rs)
Rating TP
(Rs) ABV (Rs) P/E (x) P/ABV (x) ROAE (%) ROAA (%)
FY17E FY18E FY19E FY17E FY18E FY19E FY17E FY18E FY19E FY17E FY18E FY19E FY17E FY18E FY19E ICICIBC # 1,596 274 BUY 333 115 131 148 12.5 11.7 9.4 1.93 1.61 1.35 10.7 9.8 10.8 1.40 1.30 1.37 KMB # 1,680 915 BUY 1,013 136 157 183 41.4 31.9 25.8 5.63 4.74 3.94 13.2 15.0 15.6 1.68 1.86 1.90 AXSB 1,213 507 NEU 507 197 217 255 33.0 21.1 13.0 2.57 2.33 1.99 6.8 10.0 14.6 0.65 0.89 1.24 IIB 875 1,471 BUY 1,552 332 382 443 30.7 25.0 20.5 4.44 3.85 3.32 15.3 16.2 17.1 1.80 1.78 1.77 FB 162 94 BUY 101 44 51 56 20.7 16.5 13.5 2.13 1.87 1.68 9.3 10.8 12.1 0.77 0.81 0.84 CUB 95 159 BUY 175 52 61 70 18.9 16.6 14.3 3.04 2.62 2.28 15.4 15.5 15.7 1.49 1.47 1.47 DCBB 56 182 BUY 197 64 78 87 26.0 22.5 17.4 2.85 2.33 2.08 10.8 10.5 10.9 0.93 0.93 0.99 SBIN # 2,189 282 BUY 328 112 129 148 16.0 12.9 10.0 1.84 1.55 1.29 7.4 8.3 9.6 0.43 0.46 0.53 BOB 419 181 BUY 220 89 123 157 21.1 11.7 8.8 2.04 1.47 1.15 5.4 9.1 11.1 0.29 0.51 0.63 Equitas 57 169 BUY 187 61 63 67 30.0 41.6 25.7 2.76 2.67 2.52 10.6 5.9 8.9 2.47 1.34 1.64 Ujjivan 48 404 NEU 390 146 164 189 21.2 21.5 16.3 2.77 2.45 2.14 15.4 12.1 14.0 3.33 2.55 2.61
Source: Company, HDFC sec Inst Research, # Adjusted for embedded value of subs
Page | 10
KOTAK MAHINDRA BANK : RESULTS REVIEW 4QFY17
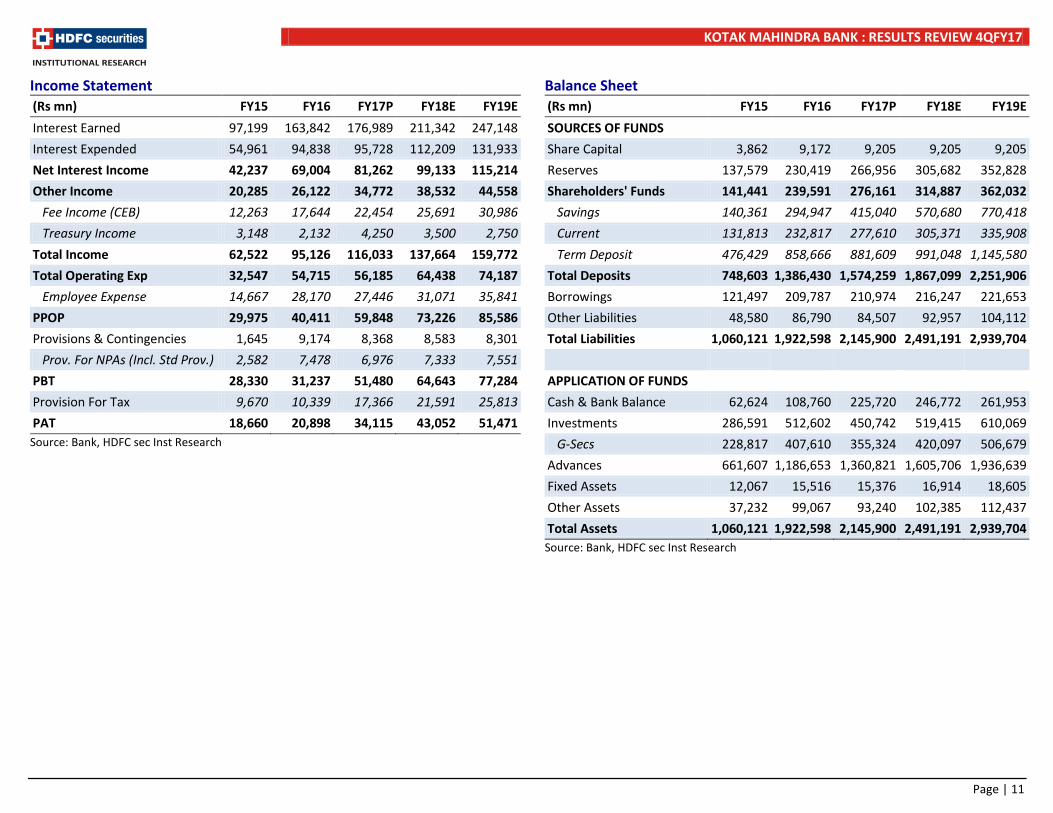
Income Statement (Rs mn) FY15 FY16 FY17P FY18E FY19E
Interest Earned 97,199 163,842 176,989 211,342 247,148
Interest Expended 54,961 94,838 95,728 112,209 131,933
Net Interest Income 42,237 69,004 81,262 99,133 115,214
Other Income 20,285 26,122 34,772 38,532 44,558
Fee Income (CEB) 12,263 17,644 22,454 25,691 30,986
Treasury Income 3,148 2,132 4,250 3,500 2,750
Total Income 62,522 95,126 116,033 137,664 159,772
Total Operating Exp 32,547 54,715 56,185 64,438 74,187
Employee Expense 14,667 28,170 27,446 31,071 35,841
PPOP 29,975 40,411 59,848 73,226 85,586
Provisions & Contingencies 1,645 9,174 8,368 8,583 8,301
Prov. For NPAs (Incl. Std Prov.) 2,582 7,478 6,976 7,333 7,551
PBT 28,330 31,237 51,480 64,643 77,284
Provision For Tax 9,670 10,339 17,366 21,591 25,813
PAT 18,660 20,898 34,115 43,052 51,471 Source: Bank, HDFC sec Inst Research
Balance Sheet (Rs mn) FY15 FY16 FY17P FY18E FY19E
SOURCES OF FUNDS
Share Capital 3,862 9,172 9,205 9,205 9,205
Reserves 137,579 230,419 266,956 305,682 352,828
Shareholders' Funds 141,441 239,591 276,161 314,887 362,032
Savings 140,361 294,947 415,040 570,680 770,418
Current 131,813 232,817 277,610 305,371 335,908
Term Deposit 476,429 858,666 881,609 991,048 1,145,580
Total Deposits 748,603 1,386,430 1,574,259 1,867,099 2,251,906
Borrowings 121,497 209,787 210,974 216,247 221,653
Other Liabilities 48,580 86,790 84,507 92,957 104,112
Total Liabilities 1,060,121 1,922,598 2,145,900 2,491,191 2,939,704
APPLICATION OF FUNDS
Cash & Bank Balance 62,624 108,760 225,720 246,772 261,953
Investments 286,591 512,602 450,742 519,415 610,069
G-Secs 228,817 407,610 355,324 420,097 506,679
Advances 661,607 1,186,653 1,360,821 1,605,706 1,936,639
Fixed Assets 12,067 15,516 15,376 16,914 18,605
Other Assets 37,232 99,067 93,240 102,385 112,437
Total Assets 1,060,121 1,922,598 2,145,900 2,491,191 2,939,704 Source: Bank, HDFC sec Inst Research
Page | 11
KOTAK MAHINDRA BANK : RESULTS REVIEW 4QFY17
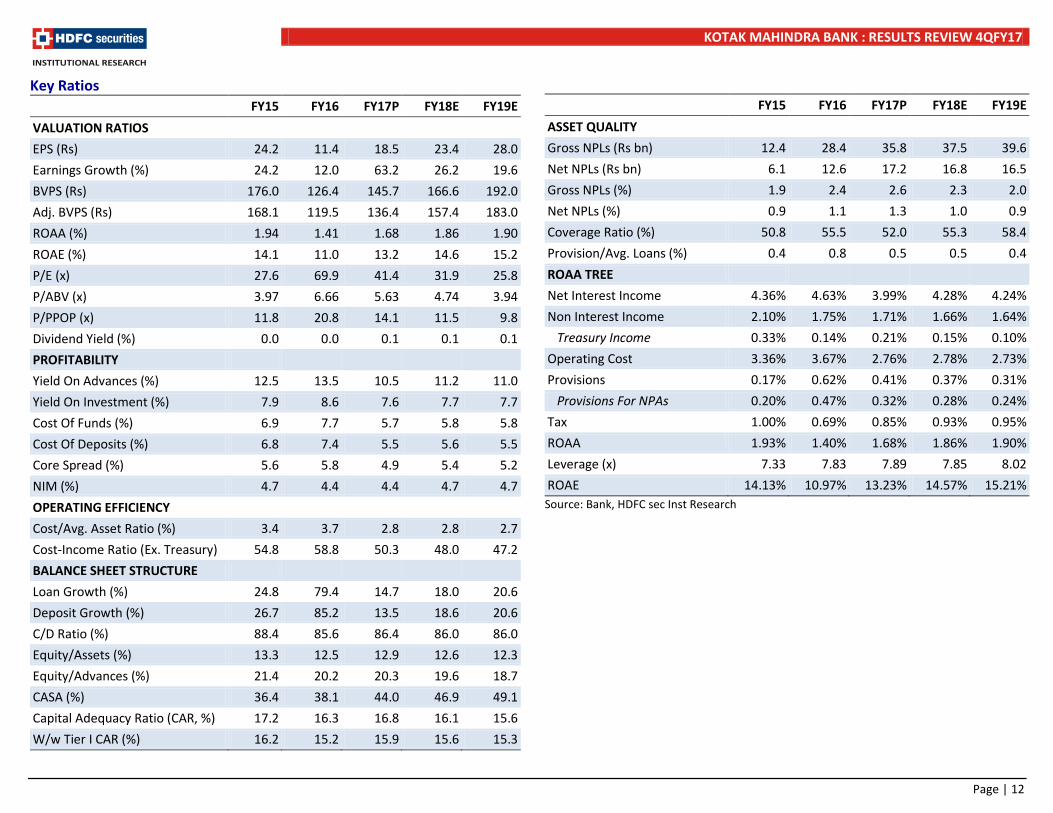
Key Ratios
FY15 FY16 FY17P FY18E FY19E
VALUATION RATIOS
EPS (Rs) 24.2 11.4 18.5 23.4 28.0
Earnings Growth (%) 24.2 12.0 63.2 26.2 19.6
BVPS (Rs) 176.0 126.4 145.7 166.6 192.0
Adj. BVPS (Rs) 168.1 119.5 136.4 157.4 183.0
ROAA (%) 1.94 1.41 1.68 1.86 1.90
ROAE (%) 14.1 11.0 13.2 14.6 15.2
P/E (x) 27.6 69.9 41.4 31.9 25.8
P/ABV (x) 3.97 6.66 5.63 4.74 3.94
P/PPOP (x) 11.8 20.8 14.1 11.5 9.8
Dividend Yield (%) 0.0 0.0 0.1 0.1 0.1
PROFITABILITY
Yield On Advances (%) 12.5 13.5 10.5 11.2 11.0
Yield On Investment (%) 7.9 8.6 7.6 7.7 7.7
Cost Of Funds (%) 6.9 7.7 5.7 5.8 5.8
Cost Of Deposits (%) 6.8 7.4 5.5 5.6 5.5
Core Spread (%) 5.6 5.8 4.9 5.4 5.2
NIM (%) 4.7 4.4 4.4 4.7 4.7
OPERATING EFFICIENCY
Cost/Avg. Asset Ratio (%) 3.4 3.7 2.8 2.8 2.7
Cost-Income Ratio (Ex. Treasury) 54.8 58.8 50.3 48.0 47.2
BALANCE SHEET STRUCTURE
Loan Growth (%) 24.8 79.4 14.7 18.0 20.6
Deposit Growth (%) 26.7 85.2 13.5 18.6 20.6
C/D Ratio (%) 88.4 85.6 86.4 86.0 86.0
Equity/Assets (%) 13.3 12.5 12.9 12.6 12.3
Equity/Advances (%) 21.4 20.2 20.3 19.6 18.7
CASA (%) 36.4 38.1 44.0 46.9 49.1
Capital Adequacy Ratio (CAR, %) 17.2 16.3 16.8 16.1 15.6
W/w Tier I CAR (%) 16.2 15.2 15.9 15.6 15.3
FY15 FY16 FY17P FY18E FY19E
ASSET QUALITY
Gross NPLs (Rs bn) 12.4 28.4 35.8 37.5 39.6
Net NPLs (Rs bn) 6.1 12.6 17.2 16.8 16.5
Gross NPLs (%) 1.9 2.4 2.6 2.3 2.0
Net NPLs (%) 0.9 1.1 1.3 1.0 0.9
Coverage Ratio (%) 50.8 55.5 52.0 55.3 58.4
Provision/Avg. Loans (%) 0.4 0.8 0.5 0.5 0.4
ROAA TREE
Net Interest Income 4.36% 4.63% 3.99% 4.28% 4.24%
Non Interest Income 2.10% 1.75% 1.71% 1.66% 1.64%
Treasury Income 0.33% 0.14% 0.21% 0.15% 0.10%
Operating Cost 3.36% 3.67% 2.76% 2.78% 2.73%
Provisions 0.17% 0.62% 0.41% 0.37% 0.31%
Provisions For NPAs 0.20% 0.47% 0.32% 0.28% 0.24%
Tax 1.00% 0.69% 0.85% 0.93% 0.95%
ROAA 1.93% 1.40% 1.68% 1.86% 1.90%
Leverage (x) 7.33 7.83 7.89 7.85 8.02
ROAE 14.13% 10.97% 13.23% 14.57% 15.21% Source: Bank, HDFC sec Inst Research
Page | 12
KOTAK MAHINDRA BANK : RESULTS REVIEW 4QFY17
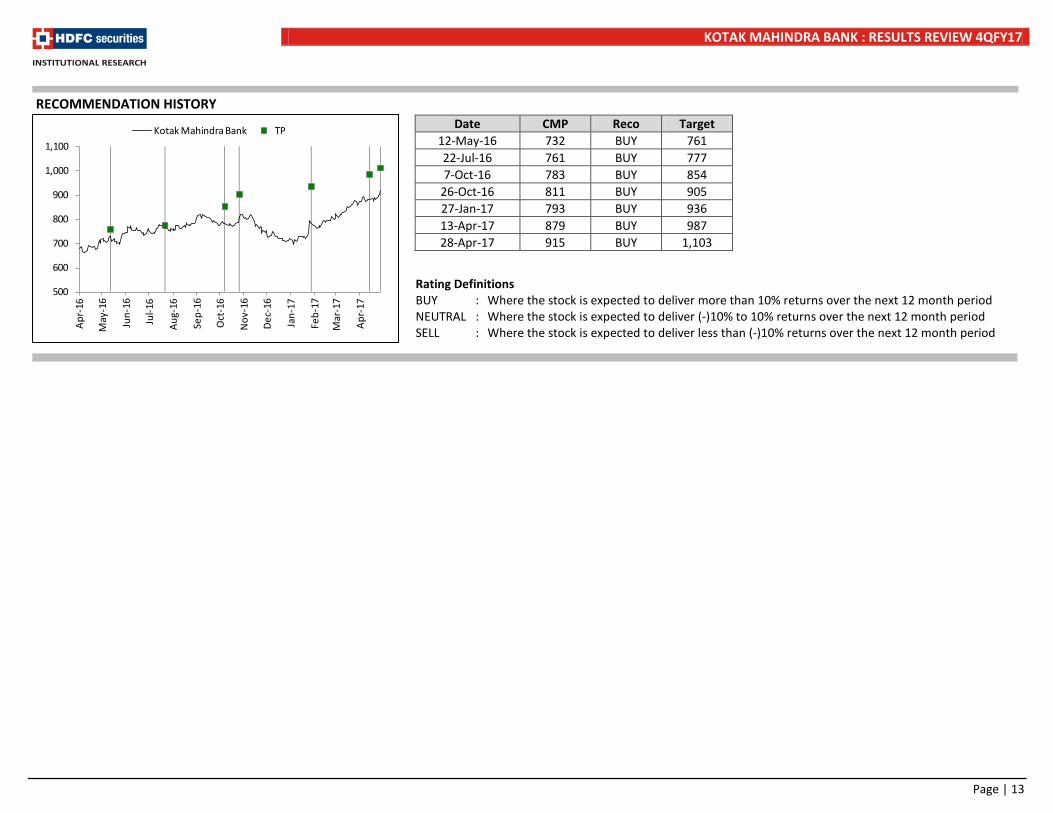
RECOMMENDATION HISTORY
Rating Definitions BUY : Where the stock is expected to deliver more than 10% returns over the next 12 month period NEUTRAL : Where the stock is expected to deliver (-)10% to 10% returns over the next 12 month period SELL : Where the stock is expected to deliver less than (-)10% returns over the next 12 month period
Date CMP Reco Target 12-May-16 732 BUY 761 22-Jul-16 761 BUY 777 7-Oct-16 783 BUY 854
26-Oct-16 811 BUY 905 27-Jan-17 793 BUY 936 13-Apr-17 879 BUY 987 28-Apr-17 915 BUY 1,103
500
600
700
800
900
1,000
1,100
Apr
-16
May
-16
Jun-
16
Jul-1
6
Aug
-16
Sep-
16
Oct
-16
Nov
-16
Dec
-16
Jan-
17
Feb-
17
Mar
-17
Apr
-17
Kotak Mahindra Bank TP
Page | 13
KOTAK MAHINDRA BANK : RESULTS REVIEW 4QFY17
Disclosure: We, Darpin Shah, MBA & Pranav Gupta, ACA authors and the names subscribed to this report, hereby certify that all of the views expressed in this research report accurately reflect our views about the subject issuer(s) or securities. We also certify that no part of our compensation was, is, or will be directly or indirectly related to the specific recommendation(s) or view(s) in this report. Research Analyst or his/her relative or HDFC Securities Ltd. does not have any financial interest in the subject company. Also Research Analyst or his relative or HDFC Securities Ltd. or its Associate may have beneficial ownership of 1% or more in the subject company at the end of the month immediately preceding the date of publication of the Research Report. Further Research Analyst or his relative or HDFC Securities Ltd. or its associate does not have any material conflict of interest. Any holding in stock – No Disclaimer: This report has been prepared by HDFC Securities Ltd and is meant for sole use by the recipient and not for circulation. The information and opinions contained herein have been compiled or arrived at, based upon information obtained in good faith from sources believed to be reliable. Such information has not been independently verified and no guaranty, representation of warranty, express or implied, is made as to its accuracy, completeness or correctness. All such information and opinions are subject to change without notice. This document is for information purposes only. Descriptions of any company or companies or their securities mentioned herein are not intended to be complete and this document is not, and should not be construed as an offer or solicitation of an offer, to buy or sell any securities or other financial instruments. This report is not directed to, or intended for display, downloading, printing, reproducing or for distribution to or use by, any person or entity who is a citizen or resident or located in any locality, state, country or other jurisdiction where such distribution, publication, reproduction, availability or use would be contrary to law or regulation or what would subject HDFC Securities Ltd or its affiliates to any registration or licensing requirement within such jurisdiction. If this report is inadvertently send or has reached any individual in such country, especially, USA, the same may be ignored and brought to the attention of the sender. This document may not be reproduced, distributed or published for any purposes without prior written approval of HDFC Securities Ltd . Foreign currencies denominated securities, wherever mentioned, are subject to exchange rate fluctuations, which could have an adverse effect on their value or price, or the income derived from them. In addition, investors in securities such as ADRs, the values of which are influenced by foreign currencies effectively assume currency risk. It should not be considered to be taken as an offer to sell or a solicitation to buy any security. HDFC Securities Ltd may from time to time solicit from, or perform broking, or other services for, any company mentioned in this mail and/or its attachments. HDFC Securities and its affiliated company(ies), their directors and employees may; (a) from time to time, have a long or short position in, and buy or sell the securities of the company(ies) mentioned herein or (b) be engaged in any other transaction involving such securities and earn brokerage or other compensation or act as a market maker in the financial instruments of the company(ies) discussed herein or act as an advisor or lender/borrower to such company(ies) or may have any other potential conflict of interests with respect to any recommendation and other related information and opinions. HDFC Securities Ltd, its directors, analysts or employees do not take any responsibility, financial or otherwise, of the losses or the damages sustained due to the investments made or any action taken on basis of this report, including but not restricted to, fluctuation in the prices of shares and bonds, changes in the currency rates, diminution in the NAVs, reduction in the dividend or income, etc. HDFC Securities Ltd and other group companies, its directors, associates, employees may have various positions in any of the stocks, securities and financial instruments dealt in the report, or may make sell or purchase or other deals in these securities from time to time or may deal in other securities of the companies / organizations described in this report. HDFC Securities or its associates might have managed or co-managed public offering of securities for the subject company or might have been mandated by the subject company for any other assignment in the past twelve months. HDFC Securities or its associates might have received any compensation from the companies mentioned in the report during the period preceding twelve months from the date of this report for services in respect of managing or co-managing public offerings, corporate finance, investment banking or merchant banking, brokerage services or other advisory service in a merger or specific transaction in the normal course of business. HDFC Securities or its analysts did not receive any compensation or other benefits from the companies mentioned in the report or third party in connection with preparation of the research report. Accordingly, neither HDFC Securities nor Research Analysts have any material conflict of interest at the time of publication of this report. Compensation of our Research Analysts is not based on any specific merchant banking, investment banking or brokerage service transactions. HDFC Securities may have issued other reports that are inconsistent with and reach different conclusion from the information presented in this report. Research entity has not been engaged in market making activity for the subject company. Research analyst has not served as an officer, director or employee of the subject company. We have not received any compensation/benefits from the subject company or third party in connection with the Research Report. HDFC Securities Ltd. is a SEBI Registered Research Analyst having registration no. INH000002475
HDFC securities Institutional Equities Unit No. 1602, 16th Floor, Tower A, Peninsula Business Park, Senapati Bapat Marg, Lower Parel, Mumbai - 400 013 Board : +91-22-6171 7330 www.hdfcsec.com
Page | 14