Embed Size (px)
Citation preview
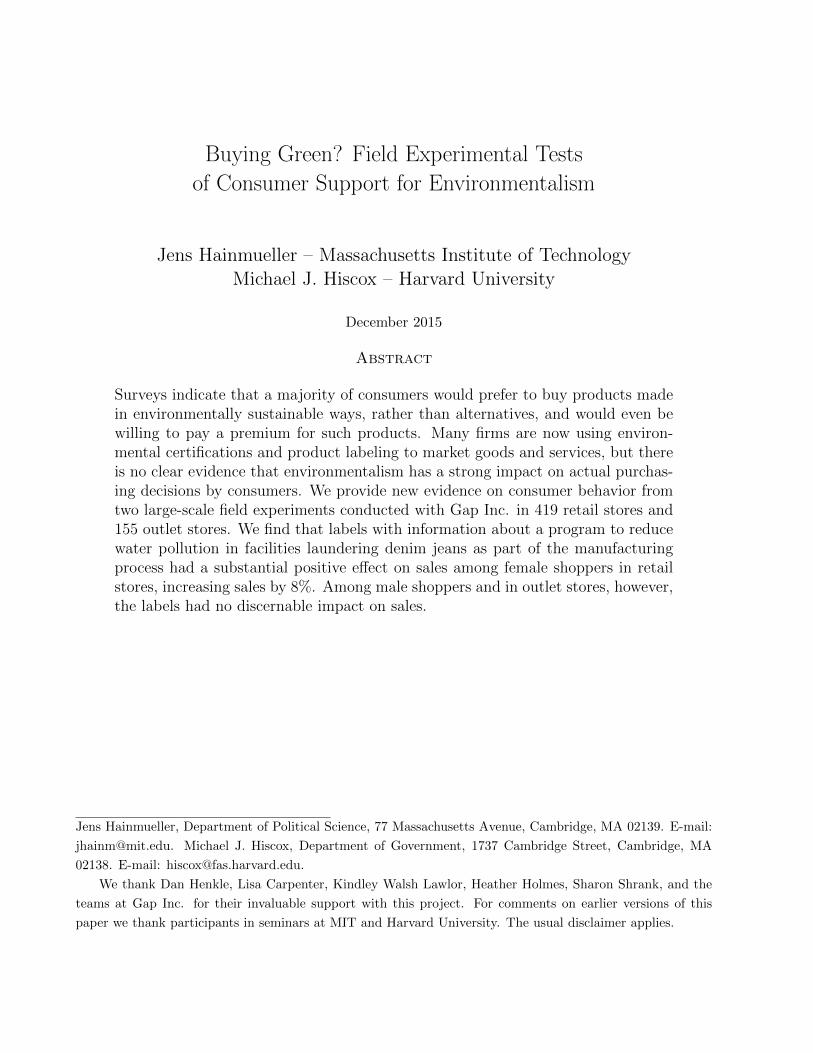
Buying Green? Field Experimental Tests
of Consumer Support for Environmentalism
Jens Hainmueller – Massachusetts Institute of TechnologyMichael J. Hiscox – Harvard University
December 2015
Abstract
Surveys indicate that a majority of consumers would prefer to buy products madein environmentally sustainable ways, rather than alternatives, and would even bewilling to pay a premium for such products. Many firms are now using environ-mental certifications and product labeling to market goods and services, but thereis no clear evidence that environmentalism has a strong impact on actual purchas-ing decisions by consumers. We provide new evidence on consumer behavior fromtwo large-scale field experiments conducted with Gap Inc. in 419 retail stores and155 outlet stores. We find that labels with information about a program to reducewater pollution in facilities laundering denim jeans as part of the manufacturingprocess had a substantial positive effect on sales among female shoppers in retailstores, increasing sales by 8%. Among male shoppers and in outlet stores, however,the labels had no discernable impact on sales.
Jens Hainmueller, Department of Political Science, 77 Massachusetts Avenue, Cambridge, MA 02139. E-mail:
[email protected]. Michael J. Hiscox, Department of Government, 1737 Cambridge Street, Cambridge, MA
02138. E-mail: [email protected].
We thank Dan Henkle, Lisa Carpenter, Kindley Walsh Lawlor, Heather Holmes, Sharon Shrank, and the
teams at Gap Inc. for their invaluable support with this project. For comments on earlier versions of this
paper we thank participants in seminars at MIT and Harvard University. The usual disclaimer applies.

I. Introduction
Many firms are using environmental certifications and product labeling to make their goods
more appealing to consumers. A growing variety of “green” labels call attention to different
aspects of the ways goods have been made and distributed: some focus on the use of recycled
materials, for example, others the application of organic standards, the use of shade-grown
techniques, or methods that limit water and carbon “footprints.” Prominent examples include
the product certifications managed by the Rainforest Alliance, the Forest Stewardship Council,
and the Marine Stewardship Council, emphasizing the use of sustainable practices in the
farming, forestry, and fishing sectors. Related types of certifications, including dolphin safe and
bird friendly labels, focus on standards that protect particular species and their habitats. The
well-known Fair Trade labeling program that supports poor farmers in developing countries also
includes a range of environmental sustainability standards. These various labels are becoming
familiar sights in cafes, restaurants, supermarkets, and home furnishing and department stores
across the United States and Europe.
Environmental product certification and labeling offers a mechanism for consumers to politi-
cize their purchasing behavior, allowing them to vote with their shopping dollars to influence
the behavior of firms and address environmental problems. The potential long-term impact
of this phenomenon depends upon the strength of consumer demand for these environment-
ally labeled products. While sales of such products are growing in several product categories
they still represent a relatively small segment of most markets. Skeptics dismiss green labeled
products as a fad, a niche market, or as cheap and empty public relations ploys by retail brands
– “greenwashing” (e.g., Vogel 2005, 2008). Others see more potential for long-term growth and
positive impacts and point to the survey evidence indicating that most consumers say they
would prefer to buy products they could identify as being made in environmentally sustainable
ways (e.g., Loureiro and Lotade 2005). But such talk is cheap. Currently there is no clear
evidence that a large segment of consumers will actually alter their purchasing decisions in
stores to support green labeled products.
The issue is important for a number of reasons. Firms need to know whether improving
environmental standards in their supply chain, quite apart from the effects on costs, is a prof-
1
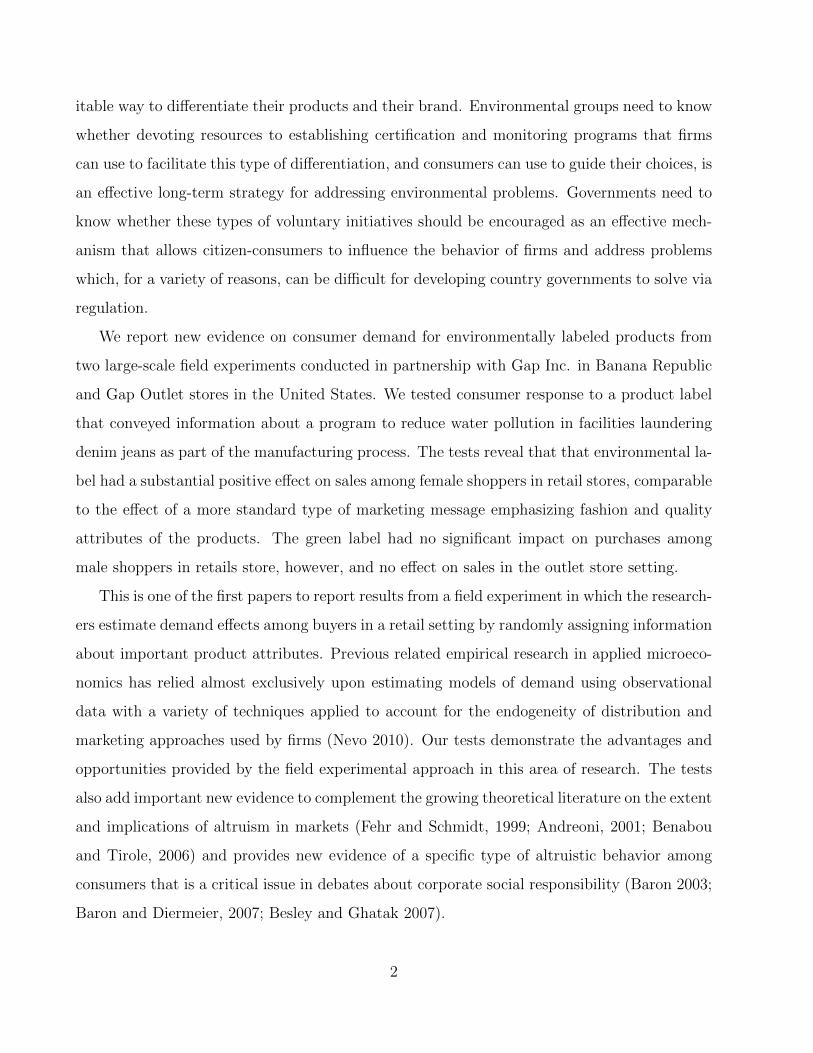
itable way to differentiate their products and their brand. Environmental groups need to know
whether devoting resources to establishing certification and monitoring programs that firms
can use to facilitate this type of differentiation, and consumers can use to guide their choices, is
an effective long-term strategy for addressing environmental problems. Governments need to
know whether these types of voluntary initiatives should be encouraged as an effective mech-
anism that allows citizen-consumers to influence the behavior of firms and address problems
which, for a variety of reasons, can be difficult for developing country governments to solve via
regulation.
We report new evidence on consumer demand for environmentally labeled products from
two large-scale field experiments conducted in partnership with Gap Inc. in Banana Republic
and Gap Outlet stores in the United States. We tested consumer response to a product label
that conveyed information about a program to reduce water pollution in facilities laundering
denim jeans as part of the manufacturing process. The tests reveal that that environmental la-
bel had a substantial positive effect on sales among female shoppers in retail stores, comparable
to the effect of a more standard type of marketing message emphasizing fashion and quality
attributes of the products. The green label had no significant impact on purchases among
male shoppers in retails store, however, and no effect on sales in the outlet store setting.
This is one of the first papers to report results from a field experiment in which the research-
ers estimate demand effects among buyers in a retail setting by randomly assigning information
about important product attributes. Previous related empirical research in applied microeco-
nomics has relied almost exclusively upon estimating models of demand using observational
data with a variety of techniques applied to account for the endogeneity of distribution and
marketing approaches used by firms (Nevo 2010). Our tests demonstrate the advantages and
opportunities provided by the field experimental approach in this area of research. The tests
also add important new evidence to complement the growing theoretical literature on the extent
and implications of altruism in markets (Fehr and Schmidt, 1999; Andreoni, 2001; Benabou
and Tirole, 2006) and provides new evidence of a specific type of altruistic behavior among
consumers that is a critical issue in debates about corporate social responsibility (Baron 2003;
Baron and Diermeier, 2007; Besley and Ghatak 2007).
2
II. Consumer Demand for Environmentally Labeled Products
There are a large and growing number of green labels covering a variety of different types of
products and services in different countries.1 The largest and most prominent environmental
certification and labeling initiatives are those managed by Rainforest Alliance, the Forest
Stewardship Council, and the Marine Stewardship Council, along with the organic certification
programs managed by government agencies. Organic standards vary to some degree across
countries, but generally prohibit the use of chemical pesticides and fertilizers on certified
farms. In the United States organic certification standards and labeling requirements are set
by the Department of Agriculture, which also accredits third-party organizations to inspect and
certify farms.2 The vast majority of certified organic products are food items and consumers
who are attracted by the label may be drawn more by perceived (personal) health and nutrition
benefits than by environmentalist concerns about effects of chemical pollutants on eco-systems.
In this sense the organic label, though well known and often connected to environmentalism,
does not provide a clear example of environmentalist consumption.
More straightforward examples of environmental labels are the Forest Stewardship Council
(FSC) and Marine Stewardship Council (MSC) labeling initiatives. Both initiatives were de-
veloped by the World Wide Fund for Nature (WWF), a non-profit, international conservation
organization. The FSC was created in 1993 to promote environmentally responsible forestry by
developing standards for the certification of products from well-managed forests. The stand-
ards require the maintenance of high conservation value forests, assessment and mitigation of
environmental impacts, environmental management plans, compliance with national laws, and
respect for rights of indigenous peoples using the forest.3 The MSC was created in 1996 and
developed a similar set of certification standards for products from well-managed fisheries in or-
der to promote responsible fishing practices. The MSC standards require maintenance of fish
populations, assessment and minimization of environmental impacts, management systems,
1The “Ecolabel Index,” a global directory of environmental labels, currently lists 377 labels covering 25sectors in 211 countries. See: http://www.ecolabelindex.com/.
2The program was initiated by the Organic Food Protection Act of 1990 and the subsequent creation of theNational Organic Program by the USDA. The program publishes a list of allowed synthetic and prohibited non-synthetic substances for production on certified farms, operates an accreditation system, and defines labelingrequirements and guidelines for imports and exports. See: http://www.ams.usda.gov/AMSv1.0/nop.
3See http://www.fsc.org/pc.html.
3
and compliance with national laws and international treaties.4 The FSC and MSC accredit
third-party organizations to inspect forests and fisheries, and license certified producers to use
the FSC or MSC label on their products to inform consumers that their products come from
well-managed and sustainable forests or fisheries. Rainforest Alliance (RA) is a non-profit,
environmental activist organization that has established a certification and labeling program
to promote forest conservation and sustainable agriculture in tropical regions. RA created the
“Smartwood” sustainable forestry certification program in 1989, as a pre-cursor to the FSC
program, which RA later helped to develop - the Smartwood program now functions as an
accredited certifier organization for the FSC standard. In 1990, RA also developed certific-
ation standards for sustainable agriculture and formed the Sustainable Agriculture Network
(SAN), a coalition of non-profit conservation organizations in Latin America that work to-
gether to promote and manage the certification program. The SAN standards require that
certified farmers develop a management system to mitigate environmental impacts, preserve
wildlife, limit the use of chemicals, water use and soil depletion, and practice responsible man-
age disposal of waste.5 Certified producers of tropical products, including coffee, tea, cocoa,
and bananas, are licensed to use the distinction green frog logo on their products, identifying
them as “Rainforest Alliance Certified.”
This type of environmental labeling has some obvious attractions. It is a voluntary, market-
based approach, so producers and retailers can opt in or out depending on whether they think
it will benefit them, and consumers can choose whether or not they wish to support any
particular environmental program by buying the labeled products.6 Green labeled goods are
an increasingly common sight in supermarkets, cafes, restaurants, and hardware and home
4See http://www.msc.org/about-us/standards/standards/msc-environmental-standard.5See: http://www.rainforest-alliance.org/agriculture/standards.6As with other types of third-party certification and labeling, green labels can be seen as a way to remove
a market inefficiency that exists due to incomplete information on the part of consumers about the mannerin which goods are produced (Elliott and Freeman 2003, 47-48). In the simplest models, lack of informationabout the ethical or environmental quality of goods leads to welfare losses as consumers who prefer goodswith high quality cannot identify (and thus adequately reward) high-quality producers, and the latter aredriven from the market by low-quality producers who face lower costs: see Bonroy and Constantatos (2003,2008). Ethical labeling has also been modeled as product differentiation that increases consumer welfare byintroducing more variety (e.g., Becchetti and Solferino 2005). Kotchen (2006) analyzes green labeling as thebundling of a private good with a public good and considers the conditions under which joint consumption maybe welfare improving when compared with voluntary contributions to the provision of environmental publicgoods unrelated to consumption of the private good.
4

furnishing stores. Many large U.S. retail chains, including Wal-Mart, Target, Whole Foods
Market, and Home Depot have made commitments to market FSC, MSC, and Rainforest
Alliance Certified products. It remains unclear, however, whether green labeling initiatives
can reach a market size large enough to have a substantial impact on environmental outcomes.
Sales of FSC-certified products amounted to around $20 billion in 2010, accounting for roughly
5% of the total world forest production (FSC 2010). MSC-certified items accounted for about
$2 billion in sales in the same year, representing 12% of the global wild harvest for human
consumption (MSC 2010). By one estimate, the total share of all green labeled goods in the
market for household products is less than 2 percent (Clifford and Martin 2011).
A large market for green labeled products may not currently exist, but this does not by
itself imply an absence of demand. Surveys indicate that a majority of consumers say that
they prefer, and are willing to pay more for, products they can identify as being made in envir-
onmentally responsible ways. In one early survey study focusing on eco-labeling, Winterhalter
and Cassens (1993) reported that 81% of respondents said they were willing to pay a premium
for certified wood products. Another much-cited survey study reported that large majorities of
respondents in the United States and Europe are willing to pay a premium of 20% or more for
eco-labeled seafood (Wessels et al. 1999). Similar findings have been reported in other survey
studies that examine consumer attitudes toward green labeled forestry and food products (e.g.,
Ozanne and Vlosky 1997, 2003; Johnston et al. 2001; Jaffrey et al. 2004; Loureiro and Lotade
2005; Johnston and Roheim 2006).
The survey results are almost certainly biased toward overestimating support for green
labeled goods. Survey respondents are being asked to state openly whether they support ef-
forts to provide a public good in a context in which voicing support is costless. The preferences
consumers reveal in a real market setting when they are actually spending their money may
be very different from the preferences they declare in surveys. What we need is direct evidence
on how consumers actually behave when they encounter environmental labels while making
real purchasing decisions. To date only a small number of empirical studies have examined
relationships between observed sales and/or prices of goods and their environmental charac-
teristics. A study by Teisl, Roe, and Hicks (2002) examined scanner data on U.S. retail sales
5

of canned tuna and found that market share (relative to other canned seafood and meat) rose
substantially after the introduction of the “dolphin-safe” label in April 1990.
Casadesus-Masanell et al (2009), examined the response of catalog customers to the in-
troduction of organic cotton sportswear by the apparel company Patagonia and found that
the change increased sales at higher price points. Nimon and Beghin (1999) compared retail
prices for apparel made with organic versus conventional cotton and reported that the organic
items were priced 30% higher on average. A similar type of study that organic baby food
was priced 16-27% higher than conventional alternatives (Maguire et al. 2004). In another
study, Galarraga and Markandya (2004) gathered data on retail prices of coffee sold in super-
markets in Britain and estimated that coffee with a “green” label (they combined Fair Trade,
organic, and shade-grown labels in this category) earned an average premium of around 11%
over alternatives.
While these studies are consistent with the claim that there is substantial consumer support
for green labeled products, because the observed outcomes reflect pricing and distribution
decisions by sellers as well as consumer behavior, it is difficult for this type of approach to
provide clear inferences about consumer responses to the labels. We are aware of only one
field experiment conducted to examine whether consumers alter actual spending behavior in
response to a green label. Anderson et al. (2005) presented shoppers at two university campus
bookstores with a choice between green labeled wood pencils and non-labeled alternatives that
were identical in all other respects. The researchers altered the size of the price premium
charged for the green labeled pencils over time. The study concluded that the label had no
effect on sales and most consumers were unwilling to pay a premium for the green label.
This experiment was restricted to a very specific retail setting and had design limitations
that made it impossible for the researchers to isolate the effects of the green label from potential
time-variant and other confounding factors. The experiment we report below was designed
specifically to overcome these problems and to gather new, direct evidence on how consumers
behave when encountering an environmental label and making real spending decisions in a
more general type of retail setting.
6

III. Research Design
A. Model of Consumer Behavior
To ground the empirical work in a theoretical model, we introduce a standard model of con-
sumer behavior in which individuals may derive utility from a variety of characteristics of goods
(Lancaster 1971; Gorman 1980). Consumers maximize their utility when choosing from of a set
of alternative products available in a particular market. Each consumer’s utility from buying
a particular good depends on the observed product characteristics, which may include labeling
that provides information about environmentally responsible standards and techniques applied
in the production of the item. In general notation, consumer i’s utility from buying the j-th
good in market t is given by:
Uijt = U(xjt, ξjt, νit; θ) (1)
where xjt is a vector of observed product characteristics, ξit indicates product characteristics
that are unobserved by the researchers, νit are unobserved differences in consumer tastes, and
θ is a vector of model parameters that includes how sensitive consumers are to each of the
observed product characteristics. Our study is designed to measure average responses among
consumers when one key product characteristic - labeling about environmental standards and
techniques - is varied experimentally for specific products.
We make no specific assumptions here about the motives of consumers willing to pay more
for environmental labels. The simplest type of assumption is that these consumers derive a
“warm glow” satisfaction from supporting a program that is helping to address environmental
problems - this type of assumption is adopted in existing models of markets for ethically labeled
goods (e.g., Richardson and Stahler 2007; Baron 2009a). However, there are other motives
that could generate a preference for purchasing green labeled products and our study is not
designed to assess the relative importance of alternative motivations (see the discussion in
Section V below).
In the theoretical literature on product labeling it has become common to refer to the stand-
ards under which a good is made as “credence” attributes. These are distinct from other types
of product characteristics in that they cannot be directly assessed by the consumer examining
7
or using the item (see Nelson 1970, 1974; Darby and Karni 1973; Roe and Sheldon 2007).
Other product characteristics, such as price, size, and color, can be evaluated by consumers
before they purchase the good and are known as “search” attributes. Still other characteristics,
including product quality, durability, and taste, can be assessed by consumers after they have
purchased the good and begun using it and are commonly termed “experience” attributes. Al-
though these experience attributes are not known to consumers at the point of purchase, they
will be revealed to them by use of the product and firms can attempt to send credible signals
about them by offering guarantees, for example, and by using advertising to establish brand
reputations. The information asymmetry problem is mitigated because consumers can punish
firms for poor quality by making no further purchases of their products (Akerlof 1970; Shapiro
1983; Palfrey and Romer, 1983). In the case of credence attributes, however, which are never
directly observed by consumers before or after purchasing the product, firms find it much more
difficult to make credible assurances. Firms that have incurred higher costs to produce goods
with these characteristics can make claims about them to consumers, but competing firms can
incur no additional costs and make similar claims.
This problem can be addressed via certification and labeling of specific credence attributes
of goods (e.g., FSC standards) by an independent third party which effectively transforms the
credence attributes into search attributes (Caswell and Mojduszka 1996). The value of these
labels to firms and consumers will depend in part on the degree to which consumers regard
the particular third party certifier as trustworthy. Our tests were not designed to assess the
importance of third-party certification, however, or the trustworthiness of different types of
certifiers and label authors in the eyes of consumers.
B. The Setting and Products
To investigate the impact of green labeling we conducted a randomized field experiment in 419
Banana Republic stores located across 45 states in the United States for a period of six weeks
between July and September 2009. Banana Republic stores are owned and operated by Gap
Inc., one of the largest apparel companies in the world and the largest apparel retailer in the
U.S. Banana Republic is one of the five brands owned by Gap Inc. - the others are Gap, Old
8
Navy, Piperlime, and Athleta. Banana Republic offers fashion apparel at higher price points
than the other, more casual company brands. The stores are mostly located in central city
locations and suburban malls. We discuss the consequences of these features of the setting for
external validity in Section V below.
The experiments focused on men’s and women’s denim jeans. The products were selected
for the tests because they were all part of a new program to reduce water pollution in facilities
laundering denim jeans as part of the manufacturing process. This “water quality program”
provided training for facilities laundering denim apparel for the company to ensure that waste
water was properly treated before being released back into local waterways. Prior to the test
the company had used no display signs or other types of marketing messages that mentioned
the water quality program. All the participating stores sold identical denim jeans collections,
with seven different lines of men’s denims and five lines of women’s denims, and prices were
uniform across the stores; the average price for jeans in both departments was $70.
C. Labeling
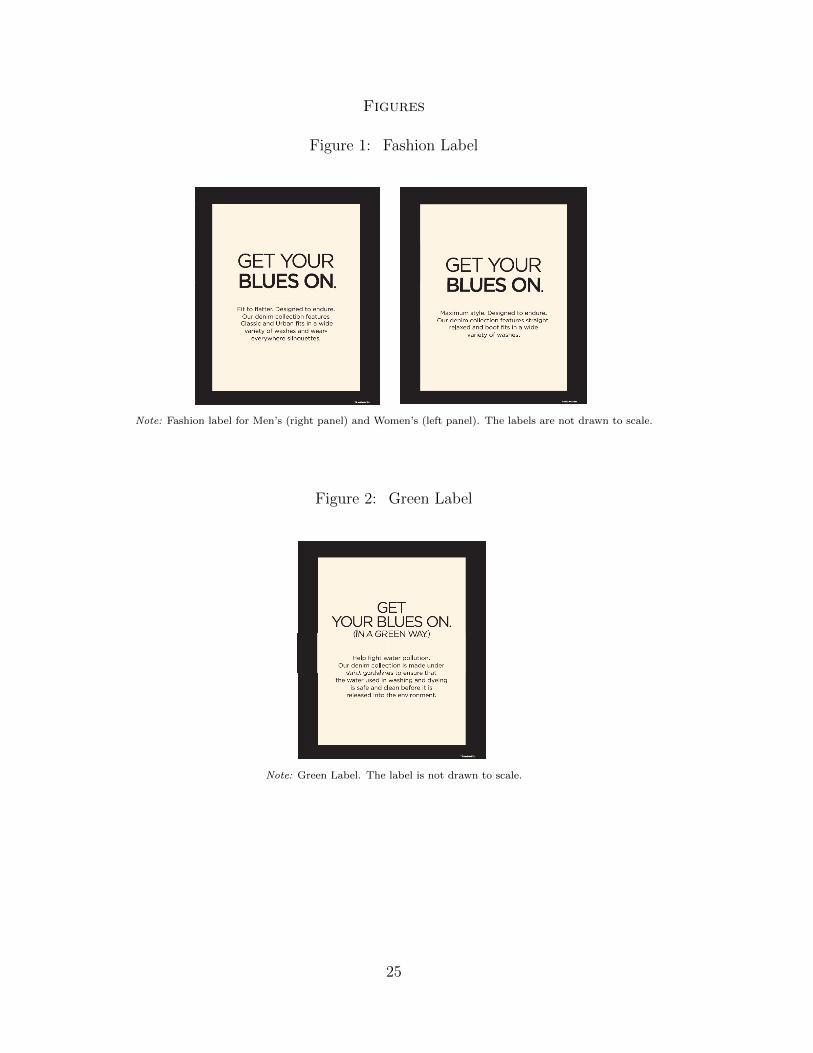
For the test, the Banana Republic marketing and Gap Inc. global responsibility teams designed
alternate versions of display signs for men’s and women’s jeans: one version of the sign carried
a message emphasizing the quality and fashion attributes of the product, the other version
conveyed a message that focused instead on the water quality program. Apart from the
difference in the content of the message, the two different versions of the signs were identical
in all respects. The display signs for men’s and women’s jeans are shown in Figures 1 and
2, respectively. (Note that here, and in the tables that follow below, we use “fashion” and
“green” as shorthand for the two different versions of the signs used in each department.) The
specific messages conveyed on text in the alternative versions of the signs were as follows:
• Fashion (Men’s Collection): “Get Your Blues On: Maximum style. Designed to endure.
Our denim collection features straight, relaxed and boot cuts in a wide variety of washes.”
• Fashion (Women’s Collection): “Get Your Blues On: Fit to flatter. Designed to endure.
Our denim collection features Classic and Urban cuts in a wide variety of washes, weights
and wear-everywhere silhouettes.”
9

• Green (Both): “Get Your Blues on (in a green way): Help fight water pollution. Our
denim collection is made under strict guidelines to ensure that the water used in washing
and dyeing is safe and clean before it is released into the environment.”
The signs, approximately 15 by 20 inches in size and double-sided, were placed on stands
on the display tables that carried the denim jeans collections in the participating stores for the
duration of the test.
The particular green label we tested may be regarded as a weak form of treatment for two
reasons. First, the information about environmental standards supplied by the label takes the
form of a statement by the company itself versus stating that it is verified or certified by an
independent third party. To the extent that customers were concerned about the company
engaging in “greenwashing” or misrepresentation to promote sales, and discounted the cred-
ibility of the claims being made, we should expect a weaker effect than would be the case if
the label carried a seal of approval from an independent, non-profit environmental group that
had inspected the facilities. Second, the information conveyed on the display signs concerns
one specific type of environmental issue - water pollution - that tends to be localized in its
effects. To the extent that customers are less responsive to specific programs with localized
effects than broader environmental programs (e.g., FSC standards) aimed at addressing global
problems (e.g., climate change), we may anticipate that the test will tend to underestimate
the effects green labeling more generally.
D. Randomization
The experiment followed a three-group, block-randomized design. We initially matched all
stores into 45 blocks based on similarities with respect to key characteristics such as the store
size and historical sales, using store-level data provided by the company. Then within each
block we randomized the assignment of each store to one of three experimental groups - one
group of stores received the signs with the fashion messages, one received the signs with the
green message, and a third group was instructed to display the product without a sign. All
stores received their signs as part of the regular centralized store communication with similar
instructions to set up the displays on the same day. The signs were left in place for six weeks
10
in total. To monitor compliance with the randomization protocol, the research team hired
observers to visit a random sub-sample of 20 stores in New England, northern California, and
in New York City during the first two weeks of the test.
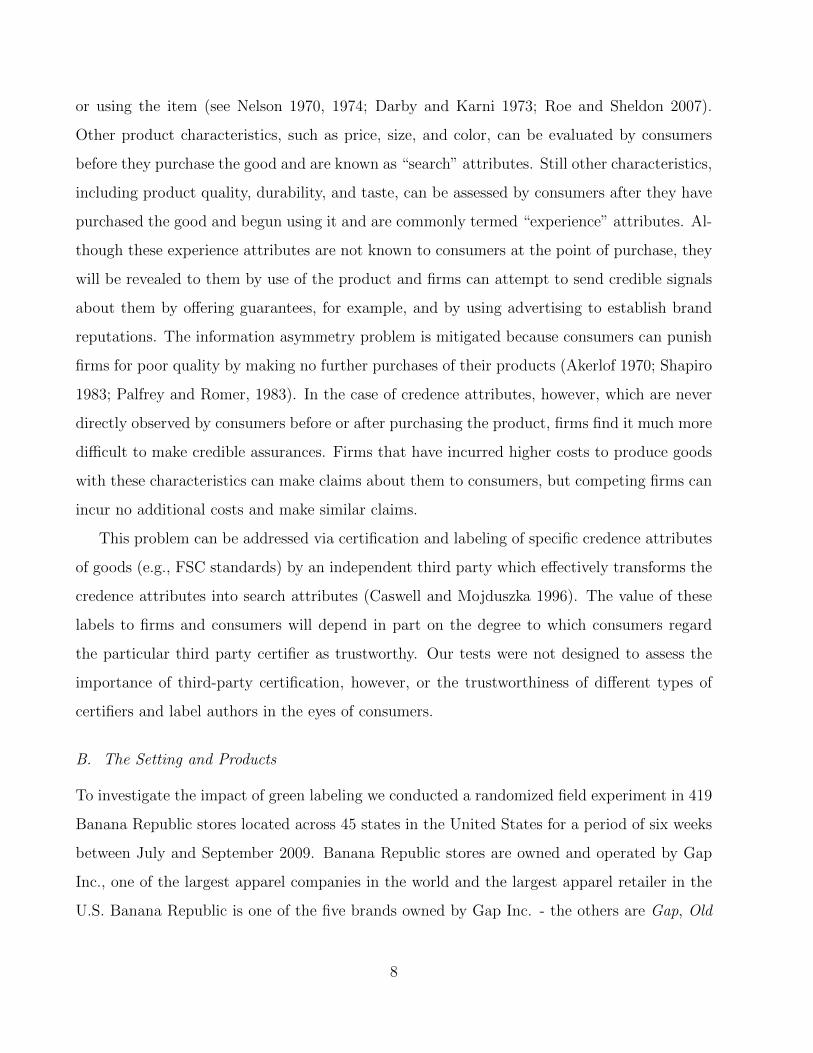
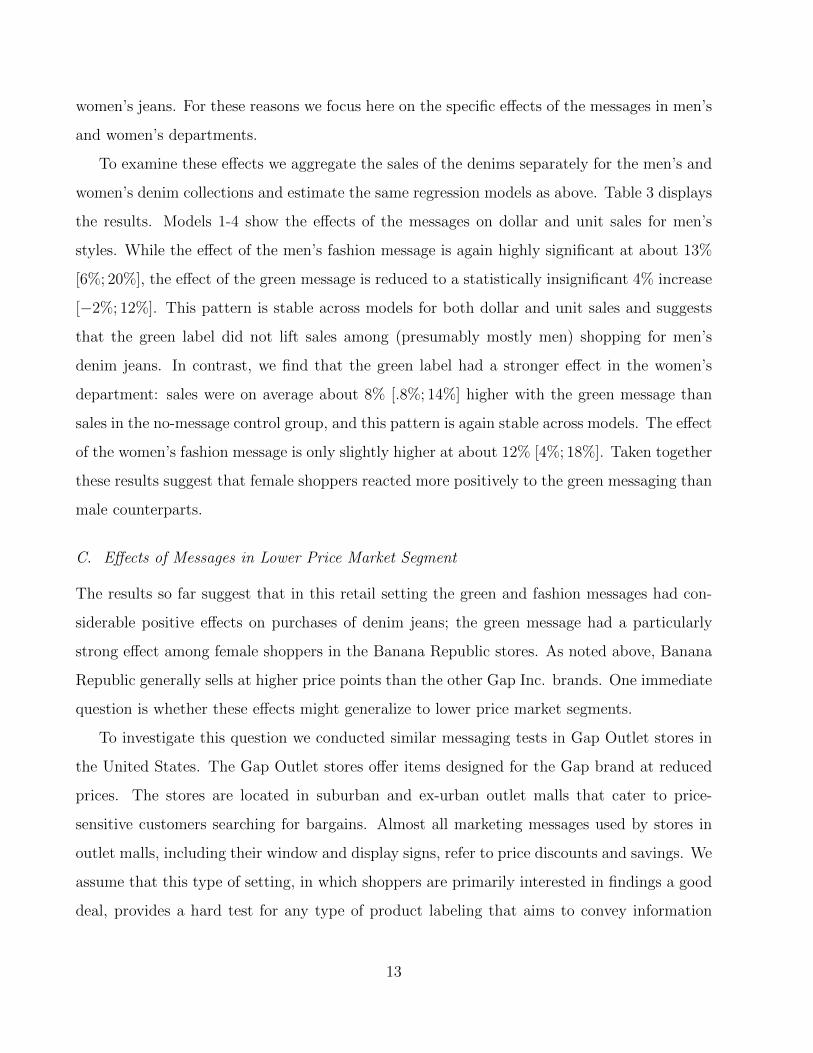
Figure 3 shows the location of the stores in our sample by experimental group. The stores
are clustered around large population centers on the two coasts. Table 1 provides summary
statistics for the store sample. We report the mean covariate values in each of the three store
groups for a range of pre-treatment characteristics. As expected given the random assignment,
the three store groups are very similar on all core characteristics including size, regional distri-
bution, as well as a set of key socio-demographic characteristics of the store catchment areas
(defined as the zip code areas of the store locations).7
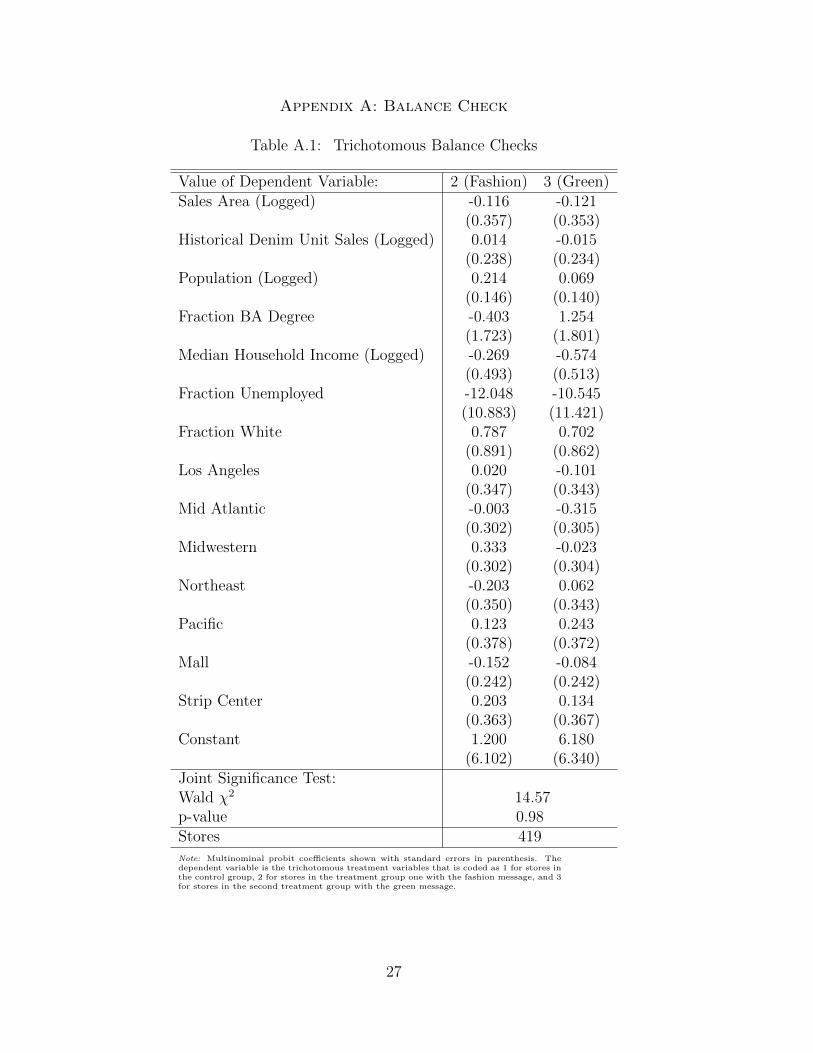
Table A.1 in appendix A contains a formal multivariate balance check where we regress a
trichotomous treatment variable that indicates the assignment to one of the three experimental
groups on the full set of covariates and show that none of the variables enter as significant and
together they are jointly insignificant (p-value=.98). Overall this suggests that the random-
ization successfully orthogonalized the store groupings with respect to confounding factors,
such that we can attribute differences in the sales during the test period to the effect of the
messages as opposed to differences in other unobserved characteristics that may affect sales.
IV. Results
A. Aggregate Effects on Sales
To formally estimate the effect of the messages on sales we estimate the following semi-elasticity
regressions:
log(si) = µ+ τ1 Greeni + τ2 Fashioni +J∑
j=2
αj + εi
where si indicates unit or dollar sales of all test denims in store i during the experimental
period, µ is an intercept, Green and Fashion are dummy variables that are coded as one for
stores in the green or fashion/quality message group respectively and zero otherwise such that
τ1 and τ2 estimate the elasticity of sales with respect to the different messages, αj are a full set
7Data for the 5-digit zip code areas for each store from the 2000 U.S. Census. Notice that data on historicaldenim sales is omitted in Table 1 for confidentiality reasons. However, historical denim sales are well balancedacross the three groups as can be seen by the balance checks in Table A.1 where this measure is included.
11
of block level fixed effects to accommodate the block level randomization, and εi is a stochastic
error term. We estimate all regressions with robust standard errors.
The regression results are shown in Table 2. The estimates in model 1 suggest that the
green message increased aggregate dollar sales of the test products (in both men’s and women’s
departments) by about 7% on average with a .90 confidence interval of [.1%; 13%] compared
to sales for the no-message control group. The fashion messages were even more effective
and raised total denims sales by about 13% [6%; 19%] compared to the control group. As
expected given the randomization, these estimates are unaffected by the inclusion of pre-
treatment covariates, except that they become slightly more precise given the reduction in
residual variance (model 2). The next two columns in Table 3 show that the estimates of the
effects of the different messages are almost identical when we examine total unit sales (models 3
and 4). The estimates suggest that the green label increases unit sales by about 7% [.6%; 13%],
while the fashion signs increased sales by about 13% [6%; 19%] (based on model 3). Taken
together the estimates suggest that both types of signs raised aggregate sales considerably
and the substantial difference in the magnitude of the two effects suggests that the fashion
messages were more influential overall - notice, however, that we cannot formally reject the
two-sided null hypothesis that the effects of the two labels are identical (using model 1 a test
of the null that τ1 = τ2 yields a p-value of 0.16).
B. Effects in Men’s and Women’s Departments
The analysis above examines the effects of messages on total sales of jeans in both men’s and
women’s departments in the Banana Republic stores. This is appropriate if we imagine that
visitors to the stores constitute a single pool of subjects who see any and all display signs for
jeans in both men’s and women’s departments and whose purchasing behavior may thus be
influenced by exposure to the combination of messages. But it seems more accurate to assume
that different segments of customers shop in men’s and women’s departments - male shoppers,
in particular, are unlikely to browse in the women’s department and read display signs there.
In addition, the fashion message was not uniform across men’s and women’s departments in
the stores assigned the fashion label: distinct fashion messages were designed for men’s and
12
women’s jeans. For these reasons we focus here on the specific effects of the messages in men’s
and women’s departments.
To examine these effects we aggregate the sales of the denims separately for the men’s and
women’s denim collections and estimate the same regression models as above. Table 3 displays
the results. Models 1-4 show the effects of the messages on dollar and unit sales for men’s
styles. While the effect of the men’s fashion message is again highly significant at about 13%
[6%; 20%], the effect of the green message is reduced to a statistically insignificant 4% increase
[−2%; 12%]. This pattern is stable across models for both dollar and unit sales and suggests
that the green label did not lift sales among (presumably mostly men) shopping for men’s
denim jeans. In contrast, we find that the green label had a stronger effect in the women’s
department: sales were on average about 8% [.8%; 14%] higher with the green message than
sales in the no-message control group, and this pattern is again stable across models. The effect
of the women’s fashion message is only slightly higher at about 12% [4%; 18%]. Taken together
these results suggest that female shoppers reacted more positively to the green messaging than
male counterparts.
C. Effects of Messages in Lower Price Market Segment
The results so far suggest that in this retail setting the green and fashion messages had con-
siderable positive effects on purchases of denim jeans; the green message had a particularly
strong effect among female shoppers in the Banana Republic stores. As noted above, Banana
Republic generally sells at higher price points than the other Gap Inc. brands. One immediate
question is whether these effects might generalize to lower price market segments.
To investigate this question we conducted similar messaging tests in Gap Outlet stores in
the United States. The Gap Outlet stores offer items designed for the Gap brand at reduced
prices. The stores are located in suburban and ex-urban outlet malls that cater to price-
sensitive customers searching for bargains. Almost all marketing messages used by stores in
outlet malls, including their window and display signs, refer to price discounts and savings. We
assume that this type of setting, in which shoppers are primarily interested in findings a good
deal, provides a hard test for any type of product labeling that aims to convey information
13

about any product attributes other than price.
We conducted the tests in all 155 of the GAP Outlet stores located across 38 states in the
U.S. for a period of four weeks between May and June 2010. We focused only on women’s
denim jeans as the Gap Outlet stores sold a line of women’s jeans made in facilities that were
part of the company’s water quality program, but did not offer a comparable line of men’s
jeans. In the Gap Outlet stores the denim jeans were priced at $40, about half the price of the
denim jeans sold in the Banana Republic stores. As before, stores were matched into triplets
based on similarities with respect to key characteristics such as the store size and historical
sales, then within each block we randomized the assignment of each store to one of the three
experimental groups - one group of stores received a sign for the women’s jeans with the fashion
message, one received a sign with a green message (referring to the water quality program),
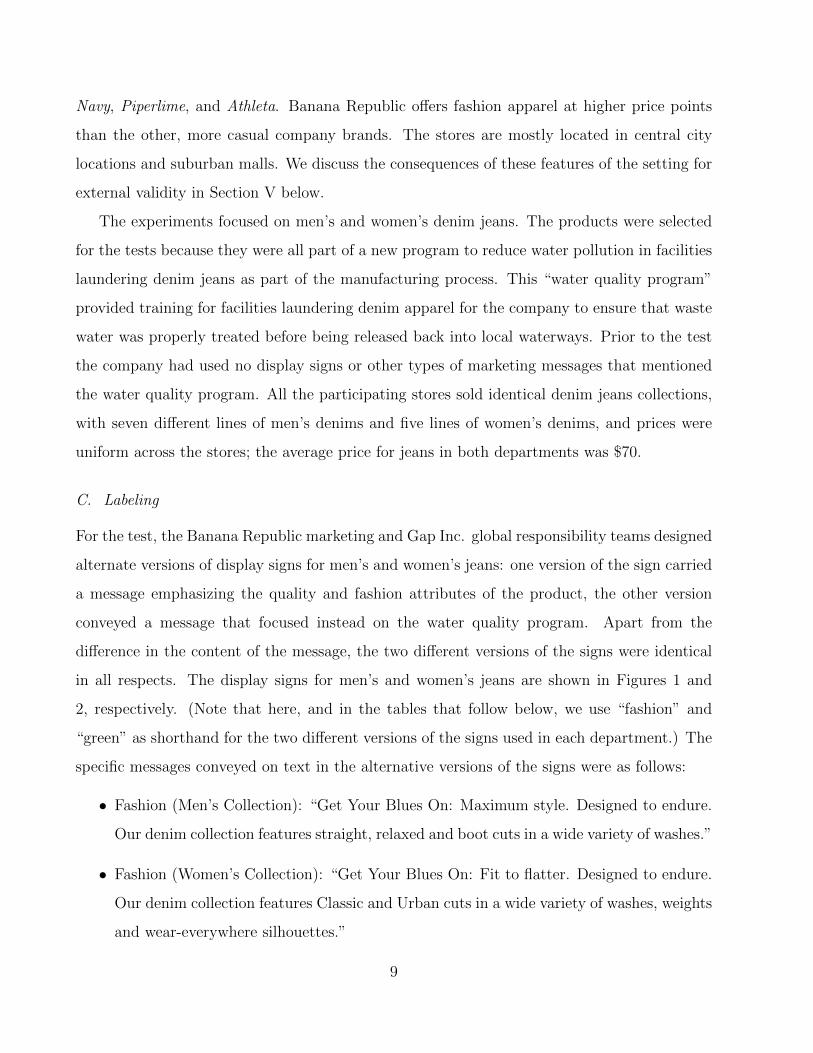
and a third group was instructed to display the product without a sign. The test messages are
displayed in Figure B.1 in appendix B. Store characteristics are displayed in Table B.1 and
which confirm that the store groups are very similar in terms of observed characteristics (when
we regress a trichotomous treatment variable on the full set of pre-treatment characteristics
we obtain a p-value of .99 for the F-test that all slope coefficients are jointly zero; none of the
individual variables enters significant at conventional levels).8
The estimates of the effects of the message on sales of the women’s jeans are reported in
Table 4 (we estimate regression models as above).9 We find that neither the green nor the
fashion message had a significant impact on sales in this setting. The treatment indicators for
both messages enter highly insignificant and the point estimates are also quite small - between
1-4% for the green message and between 5-9% for the fashion message). Overall, these results
indicate that shoppers in this price segment do not respond strongly to information about the
environmental messaging.
8As before, data for the 5-digit zip code areas for each store from the 2000 U.S. Census. Data on historicaldenim sales is omitted in Table B.1 for confidentiality reasons. However, historical denim sales are well balancedacross the three groups as can be seen by the low p-value in the balance checks were this measure is included.
9One store was dropped from the analysis because of missing sales data. Multiply imputing data for thisstore has no affect on the results.
14
V. Discussion
Firms are now offering consumers a variety of ways to advance environmental and other political
causes when they are shopping. They can make purchases that promote sustainable manage-
ment of fisheries and forests, for example, protect endangered species and encourage ethical
treatment of animals, and help to improve livelihoods for farmers in the developing world. A
growing theoretical literature has sought to address this phenomenon and explain why more
firms are voluntarily adopting socially responsible practices, including ethical and environ-
mental product certifications and labeling (see Baron 2003; 2009b; Baron and Diermeier 2007;
Besley and Ghatak 2007). The potential long-term importance of the phenomenon hinges
on the strength of consumer demand for environmentally certified and other cause-related
products, however, and on this we lack clear evidence.
To investigate underlying consumer demand for fair labor standards, specifically, we have
examined new evidence on actual consumer behavior from a large-scale field experiment in
a retail store setting. We tested consumer responses to product messages that conveyed in-
formation about a program to reduce water pollution in facilities laundering denim jeans as
part of the manufacturing process and compared these to responses to alternative and more
standard messages emphasizing fashion and quality attributes of the products. The key find-
ing is that the environmental label had a substantial positive effect on sales among female
shoppers in this setting, only slightly less than the effect of a more standard type of fashion
message. The green label had no significant impact on purchases among male shoppers, how-
ever, who were very responsive to a standard marketing message emphasizing other product
attributes. An additional test conducted in an outlet store setting revealed that neither green
labels nor alternative types of messages about product qualities (other than price) had an im-
pact on sales in this more price-sensitive market segment. Our study does not directly examine
individual-level variation in support for environmental product labels. Existing research on
determinants of support for green labeled products is based on survey data and the findings are
mixed or inconclusive as to whether and how such support is associated with age, education,
social status, and income (e.g., Ozanne and Vlosky 1997; Ozanne and Smith 1998; Loureiro
and Lotade 2005). The most robust finding to date seems to be that women are more likely
15

to report supporting and participating in environment-friendly consumption than men (e.g.,
Ozanne and Vlosky 2003; Micheletti 2003; Anderson and Hansen 2004; Jensen et al. 2004;
Aguilar and Vlosky 2007). Our findings are consistent with this claim, but do not provide
conclusive evidence. Defining the market for environmentally labeled products more clearly
in terms of socio-demographic segments is something that could be pursued in future tests
designed to capture individual-level data on purchasing behavior.
Our study also does not directly examine the motivations of consumers. Consumers who
are attracted to environmentally labeled goods may be driven by an intrinsic motivation that
reflects satisfaction from contributing to the general well-being of others, but one may distin-
guish usefully between satisfaction derived from specific outcomes (e.g., the overall benefits
provided for others) and the “warm glow” satisfaction derived simply from giving to a cause
(Andreoni 1989, 1990). The existing models of markets for ethically labeled goods typically as-
sume a simple “warm glow” motivation for consumers favoring labeled goods (e.g., Richardson
and Stahler 2007; Baron 2009a). Alternatively, individuals seeking approval and esteem from
others may give to a cause in order to demonstrate their virtue in a public way (see Hollaender
1990; Willer 2009).10 It is also possible that consumers attracted to environmentally labeled
goods may be motivated by a desire for product quality, and interpret environment-friendly
production standards as a signal that the brand will not skimp on quality (Fisman et al. 2006;
Siegel and Vitaliano 2007; Elfenbein et al. 2010). A counter-hypothesis is that consumers
seeing a green label may instead be concerned that the priority that the producer has placed
on environmental standards implies a trade-off in terms of the attention paid to other product
attributes, including quality and fashion. In this latter case, a label that combined messages
about environmental and quality or fashion attributes may be especially effective. Additional
experimental studies could examine the relative importance of the various types of motivations
by manipulating the informational context in relevant ways.
10A growing body of evidence from experimental studies indicates that people are more likely to act inpro-social ways in public settings than in private settings (see Andreoni and Petrie 2004; Ariely, Bracha, andMeier 2009; Rege and Telle 2004).
16
VI. References
Aguilar, F., and R. Vlosky. 2007. Consumer Willingness to Pay Price Premiums for Environ-mentally Certified Wood Products in the U.S. Forest Policy and Economics 9: 1100-1112.
Akerlof, G. 1970. The Market for ‘Lemons.’ Quarterly Journal of Economics 84 (3):488-500.
Anderson, R., and E. Hansen. 2004. The Impact of Environmental Certification on Pref-erences for Wood Furniture. Forest Products Journal 54 (3): 42-50.
Anderson, R., Laband, D., Hansen, E., and C. Knowles, C.D. 2005. Price Premiums in theMist. Forest Products Journal 55 (6): 19-22.
Andreoni, J. 1989. Giving with Impure Altruism: Applications to Charity and RicardianEquivalence. Journal of Political Economy 97 (December): 1447-58.
Andreoni, J. 1990. Impure Altruism and Donations to Public Goods: A Theory of Warm-Glow Giving. Economic Journal 100 (June): 464-77.
Andreoni, J. 2006. Philanthropy. In S. Kolm and J.M. Mercier (eds), Handbook of theEconomics of Giving, Altruism and Reciprocity. Amsterdam: Elsevier/North-Holland: 1201-1269.
Andreoni, J. and R. Petrie. 2004. Public Goods Experiments without Confidentiality: AGlimpse into Fund-Raising. Journal of Public Economics 88 (7-8): 1605-1623.
Ariely, D., A. Bracha, and S. Meier. 2009. Doing Good or Doing Well? Image Motivationand Monetary Incentives in Behaving Prosocially. American Economic Review 96 (5): 1652-1678.
Baron, D. 2003. Private Politics. Journal of Economics and Management Strategy 12:31-66.
Baron, D. 2009a.Clubs, Credence Standards, and Social Pressure. In, Voluntary Programs:A Club Theory Perspective, eds. M. Potoski and A. Prakash. Cambridge MA: MIT Press.
Baron, D. 2009b. A Positive Theory of Moral Management, Social Pressure, and CorporateSocial Performance. Journal of Economics and Management Strategy 18(1), 7-43.
Baron, D. and D. Diermeier. 2007. Strategic Activism and Nonmarket Strategy. Journalof Economics and Management Strategy 16 (3): 599-634.
Becchetti, L., and N. Solferino. 2005. The Dynamics of Ethical Product Differentiationand the Habit Formation of Socially Responsible Consumers. Working Paper Universita diRoma.
Benabou, R., and J. Tirole. 2006. Incentives and Prosocial Behavior. American EconomicReview 96 (5): 1652-1678.
Besley, T and M. Ghatak. 2007. Retailing Public Goods: The Economics of CorporateSocial Responsibility. Journal of Public Economics 91 (9): 1645-1663.
17
Bonroy, O. and C. Constantatos. 2003. Consumer Uncertainty about which Firm Sells theHigh Quality: On the Slow Penetration of Some Credence Goods. Working Paper UniversiteLaval.
Bonroy, O. and C. Constantatos. 2008. On the Use of Labels in CredenceGoods Markets.Journal of Regulatory Economics 33 (3): 237-52.
Casadesus-Masanell, R., M. Crooke, F. Reinhardt, and V. Vasisth. 2009. Households’Willingness to Pay for ’Green’ Goods. Journal of Economics & Management Strategy 18 (1),203-233.
Caswell, J., and E. Modjuszka. 1996. Using Informational Labeling to Influence the Marketfor Quality in Food Products. American Journal of Agricultural Economics 78 (5): 1248-53.
Darby, M., and Karni, E. 1973. Free Competition and the Optimal Amount of Fraud.Journal of Law and Economics 16 (1), 67-88.
Elliott, K. and R. Freeman. 2003. Can Labor Standards Improve Under Globalization?Washington, DC: Institute for International Economics.
Elfenbein, D., R. Fisman, and B. McManus. 2010. Reputation, Altruism, and the Benefitsof Seller Charity in an Online Marketplace. NBER working paper #15614.
Fehr E. and K. Schmidt K. 1999. A Theory of Fairness, Competition and Cooperation.Quarterly Journal of Economics 114: 817-868.
Fisman, R., G. Heal, and V. Nair. 2006. A Model of Corporate Philanthropy. ColumbiaUniversity and University of Pennsylvania.
Forest Stewardship Council (FSC). 2010. Fact Sheets. Bonn: Forest Stewardship Council.Available at: http://www.fsc.org/892.html
Galarraga, I. and A. Markandya. 2004. Economic Techniques to Estimate the Demandfor Sustainable Products: A Case Study for Fair Trade and Organic Coffee in the UnitedKingdom. Economia Agraria y Recursos Naturales 4(7), 109-134.
Gorman, W. 1980. A Possible Procedure for Analysing Quality Differentials in the EggMarket. Review of Economic Studies 47 (October): 843-56.
Hollaender, H. 1990. A Social Exchange Approach to Voluntary Cooperation. AmericanEconomic Review 80 (5): 1157-1167.
Jaffrey, S., Pickering, H., Ghulam, Y. (2004) Consumer Choices for Quality and Sustain-ability Labeled Seafood Products in the UK. Food Policy, 29, 215-228.
Jensen, K. L., Jakus, P. M., English, B. C., Menard, J. (2004). Consumers willingness topay for eco-certified wood products. Journal of Agricultural and Applied Economics 36 (3):617-626.
Johnston, R.J. and C. Roheim. 2006. A Battle of Taste and Environmental Convictions forEcolabeled Seafood: A Contingent Ranking Experiment. Journal of Agricultural and ResourceEconomics. 31 (2): 283-300.
18

Johnston, R. J., C. Roheim Wessells, H. Donath, and F. Asche. 2001. Measuring ConsumerPreferences for Ecolabeled Seafood: An International Comparison. Journal of Agricultural andResource Economics 26 (1):20-39.
Kotchen, M. 2006. Green Markets and Private Provision of Public Goods. Journal ofPolitical Economy 114: 816-834.
Lancaster, K. 1971. Consumer Demand. New York: Columbia University Press.
Loureiro, M.L. and J. Lotade. 2005. Do Fair Trade and Eco-Labels in Co?ee Wake Up theConsumer Conscience? Ecological Economics 53: 129-138.
Maguire, K.B., N. Owens, and N.B. Simon. 2004. The Price Premium for Organic Baby-food: A Hedonic Analysis. Journal of Agricultural and Resource Economics, 29(1), 132-149.
Marine Stewardship Council (MSC). 2010. Annual Report. London: Marine StewardshipCouncil. Available at: http://www.msc.org/business-support/msc-annual-report
Micheletti, M. 2003. Why More Women? Issues of Gender and Political Consumerism.In M. Micheletti, A. Follesdal and D. Stolle (eds), Politics, Products, and Markets. NewBrunswick, NJ: Transaction Press.
Nelson, P. 1970. Information and Consumer Behaviour. Journal of Political Economy78(2), 311-329.
Nelson, P. 1974. Advertising as Information. Journal of Political Economy 82: 729-754.
Nevo, A. 2010. Empirical Models of Consumer Behavior. NBER Working Paper No.16511. Cambridge MA.
Nimon, W. and J. Beghin. 1999. Are Eco-Labels Valuable? Evidence from the ApparelIndustry. American Journal of Agricultural Economics, 81(4), 801-811.
Ozanne, L., and P. Smith. 1998. Segmenting the Market for Environmentally CertifiedWood Products. Forest Science 44 (3): 379-389.
Ozanne, L.K. and Vlosky, R.P. 1997. Willingness to Pay for Environmentally CertifiedWood Products. Forest Products Journal 47 (6): 39-48.
Ozanne, L.K. and Vlosky, R.P. 2003. Certification from the U.S. Consumer Perspective.Forest Products Journal 53 (3): 13-21.
Palfrey, T. and T. Romer. 1983. Warranties, Performance, and the Resolution of Buyer-Seller Disputes.” Bell Journal of Economics, 14(1): 97-117.
Rege, M., and K. Telle. 2004. The Impact of Social Approval and Framing on Cooperationin Public Good Situations. Journal of Public Economics 88 (7-8): 1625-1644.
Richardson, M., and F. Stahler. 2007. Fair Trade. Working Paper No. 481 AustralianNational University.
Roe, R., and Sheldon, I. 2007. Credence Good Labeling: The Efficiency and DistributionalImplications of Several Policy Approaches. American Journal of Agricultural Economics 89(4),1020-1033.
19
Shapiro, C. 1983. Premiums for High Quality Products as Returns to Reputation. QuarterlyJournal of Economics 25: 659-79.
Siegel, D., and D. Vitaliano. 2007. An Empirical Analysis of the Strategic Use of CorporateSocial Responsibility. Journal of Economics and Management Strategy, 16(3): 773-792.
Teisl. M., B. Roe, and R. Hicks. 2002. Can Eco-Labels Tune a Market? Evidence fromDolphin-Safe Labeling. Journal of Environmental Economics and Management 43: 339-359.
Vogel, D. 2005. The Market for Virtue. Washington, DC: Brookings Institution Press.
Vogel, D. 2008. Private Global Business Regulation. Annual Review of Political Science11:261-82.
Wessells, C. Roheim, R.J. Johnston, and H. Donath. 1999. Assessing Consumer Preferencesfor Eco-Labeled Seafood. American Journal of Agricultural Economics, 81(5):1084-1089.
Willer, R. 2009. Groups Reward Individual Sacrifice: The Status Solution to the CollectiveAction Problem. American Sociological Review, 74: 23-43.
Winterhalter, D. and D. Cassens. 1993. Telling the Sustainable Forest from the Trees.Furniture Design and Manufacturing : 101-106.
20

Tables
Table 1: Descriptive Statistics for Store Sample
Message:Store Group: All None Green FashionStore Size (Sq Ft) 6,350 6,373 6,298 6,379Store Type:Mall 0.63 0.65 0.62 0.61Strip Center 0.14 0.12 0.14 0.15Street 0.24 0.23 0.24 0.24Region:Los Angeles 0.12 0.13 0.11 0.11Mid Atlantic 0.19 0.23 0.15 0.20Midwestern 0.19 0.16 0.18 0.24Northeast 0.16 0.16 0.18 0.14Pacific 0.10 0.09 0.12 0.10Southeastern 0.23 0.24 0.26 0.21Catchment Area:Population 305,683 292,308 298,730 325,961Fraction BA Degree 0.23 0.23 0.23 0.23Median Household Income ($) 60,027 60,376 59,861 59,842Fraction Unemployed 0.03 0.03 0.03 0.03Fraction White 0.75 0.74 0.76 0.75Stores 419 140 139 140
Note: Averages for covariates that are all measured pre-treatment. The catchment area refers to a 5 mile radiusaround the store location.
21
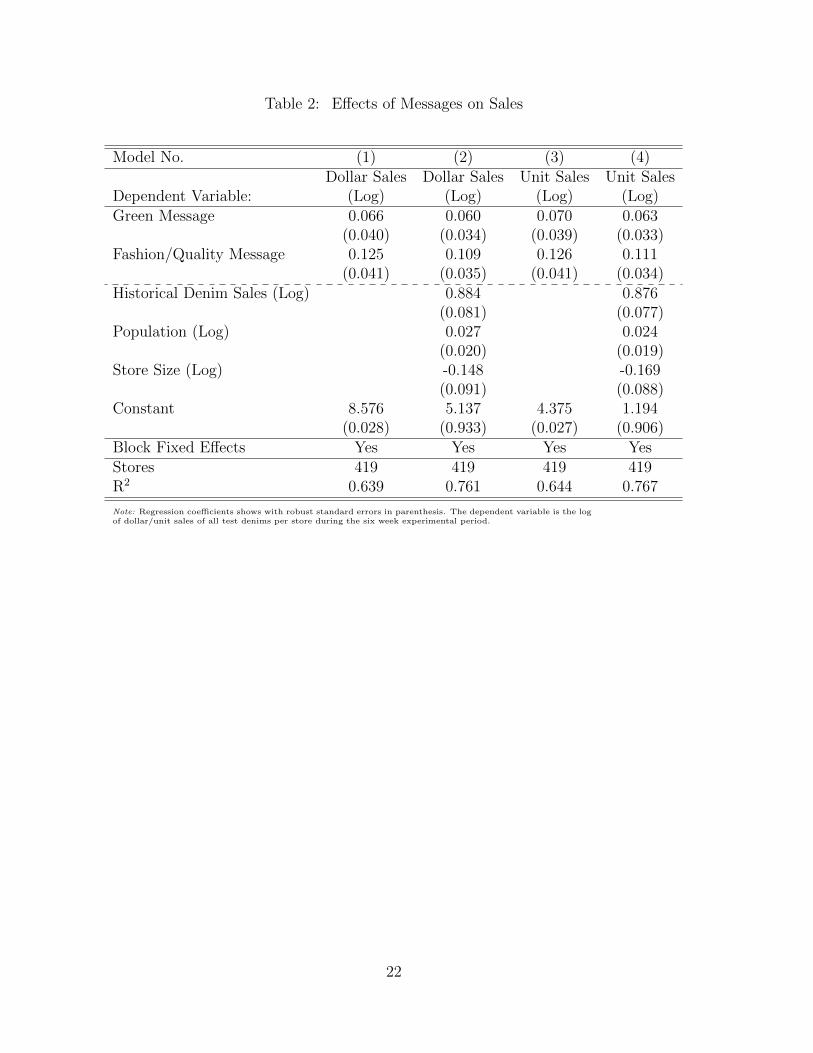
Table 2: Effects of Messages on Sales
Model No. (1) (2) (3) (4)Dollar Sales Dollar Sales Unit Sales Unit Sales
Dependent Variable: (Log) (Log) (Log) (Log)Green Message 0.066 0.060 0.070 0.063
(0.040) (0.034) (0.039) (0.033)Fashion/Quality Message 0.125 0.109 0.126 0.111
(0.041) (0.035) (0.041) (0.034)Historical Denim Sales (Log) 0.884 0.876
(0.081) (0.077)Population (Log) 0.027 0.024
(0.020) (0.019)Store Size (Log) -0.148 -0.169
(0.091) (0.088)Constant 8.576 5.137 4.375 1.194
(0.028) (0.933) (0.027) (0.906)Block Fixed Effects Yes Yes Yes YesStores 419 419 419 419R2 0.639 0.761 0.644 0.767
Note: Regression coefficients shows with robust standard errors in parenthesis. The dependent variable is the logof dollar/unit sales of all test denims per store during the six week experimental period.
22
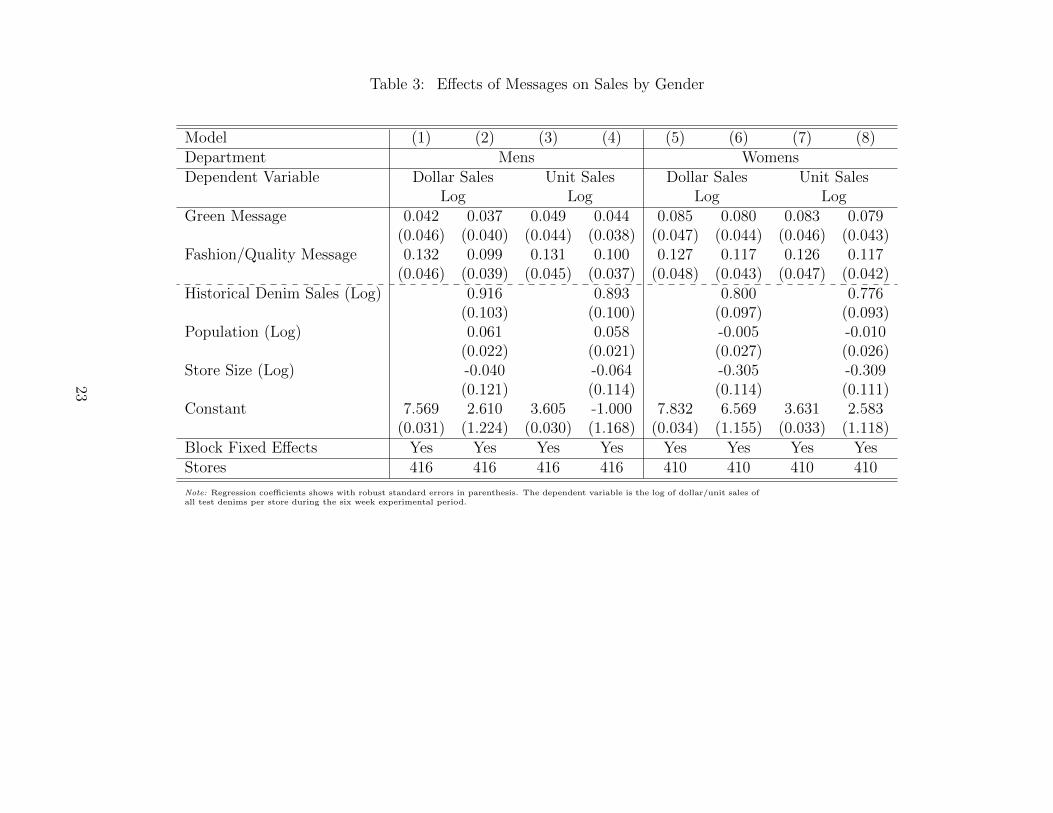
Table 3: Effects of Messages on Sales by Gender
Model (1) (2) (3) (4) (5) (6) (7) (8)Department Mens WomensDependent Variable Dollar Sales Unit Sales Dollar Sales Unit Sales
Log Log Log LogGreen Message 0.042 0.037 0.049 0.044 0.085 0.080 0.083 0.079
(0.046) (0.040) (0.044) (0.038) (0.047) (0.044) (0.046) (0.043)Fashion/Quality Message 0.132 0.099 0.131 0.100 0.127 0.117 0.126 0.117
(0.046) (0.039) (0.045) (0.037) (0.048) (0.043) (0.047) (0.042)Historical Denim Sales (Log) 0.916 0.893 0.800 0.776
(0.103) (0.100) (0.097) (0.093)Population (Log) 0.061 0.058 -0.005 -0.010
(0.022) (0.021) (0.027) (0.026)Store Size (Log) -0.040 -0.064 -0.305 -0.309
(0.121) (0.114) (0.114) (0.111)Constant 7.569 2.610 3.605 -1.000 7.832 6.569 3.631 2.583
(0.031) (1.224) (0.030) (1.168) (0.034) (1.155) (0.033) (1.118)Block Fixed Effects Yes Yes Yes Yes Yes Yes Yes YesStores 416 416 416 416 410 410 410 410
Note: Regression coefficients shows with robust standard errors in parenthesis. The dependent variable is the log of dollar/unit sales ofall test denims per store during the six week experimental period.
23

Table 4: Effects of Messages on Sales in Gap Outlet
Model No. (1) (2) (3) (4)Dollar Sales Dollar Sales Unit Sales Unit Sales
Dependent Variable: (Log) (Log) (Log) (Log)Green Message 0.01 0.03 0.03 0.04
(0.92) (0.70) (0.79) (0.66)Fashion/Quality Message 0.05 0.05 0.09 0.08
(0.69) (0.62) (0.53) (0.46)Historical Denim Sales (Log) 0.84 0.86
(0.00) (0.00)Store Size (Log) -0.62 -0.66
(0.03) (0.02)Population (Log) 0.00 0.00
(0.30) (0.33)Constant 6.15 5.37 3.34 5.38
(0.00) (0.05) (0.00) (0.05)Block Fixed Effects Yes Yes Yes YesStores 164 164 164 164R2 0.30 0.55 0.28 0.54
Note: Regression coefficients shows with robust standard errors in parenthesis. The dependent variable is the logof dollar/unit sales of all test denims per store during the six week experimental period.
24
Figures
Figure 1: Fashion Label
Quality MQuality M
Women
MessageMessage
MenNote: Fashion label for Men’s (right panel) and Women’s (left panel). The labels are not drawn to scale.
Figure 2: Green LabelGreen MGreen M
Women
MessageMessage
n & MenNote: Green Label. The label is not drawn to scale.
25
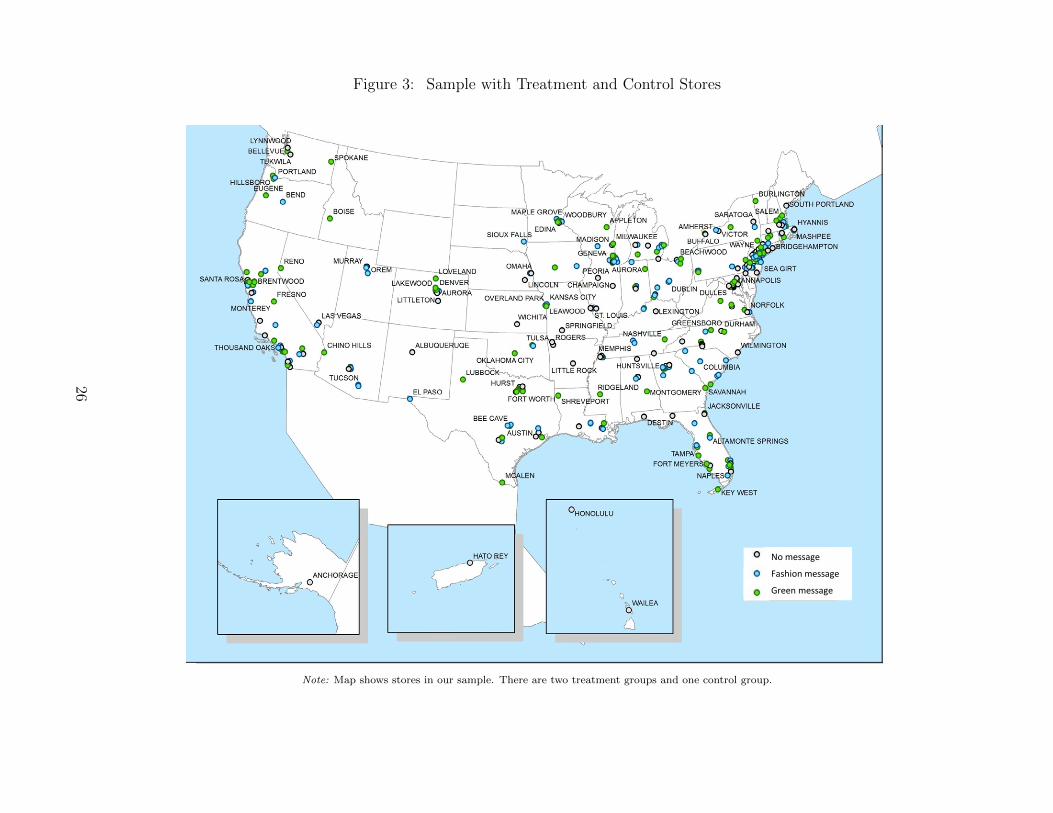
Figure 3: Sample with Treatment and Control Stores
No message
Fashion message
Green message
Note: Map shows stores in our sample. There are two treatment groups and one control group.
26
Appendix A: Balance Check
Table A.1: Trichotomous Balance Checks
Value of Dependent Variable: 2 (Fashion) 3 (Green)Sales Area (Logged) -0.116 -0.121
(0.357) (0.353)Historical Denim Unit Sales (Logged) 0.014 -0.015
(0.238) (0.234)Population (Logged) 0.214 0.069
(0.146) (0.140)Fraction BA Degree -0.403 1.254
(1.723) (1.801)Median Household Income (Logged) -0.269 -0.574
(0.493) (0.513)Fraction Unemployed -12.048 -10.545
(10.883) (11.421)Fraction White 0.787 0.702
(0.891) (0.862)Los Angeles 0.020 -0.101
(0.347) (0.343)Mid Atlantic -0.003 -0.315
(0.302) (0.305)Midwestern 0.333 -0.023
(0.302) (0.304)Northeast -0.203 0.062
(0.350) (0.343)Pacific 0.123 0.243
(0.378) (0.372)Mall -0.152 -0.084
(0.242) (0.242)Strip Center 0.203 0.134
(0.363) (0.367)Constant 1.200 6.180
(6.102) (6.340)Joint Significance Test:Wald χ2 14.57p-value 0.98Stores 419Note: Multinominal probit coefficients shown with standard errors in parenthesis. Thedependent variable is the trichotomous treatment variables that is coded as 1 for stores inthe control group, 2 for stores in the treatment group one with the fashion message, and 3for stores in the second treatment group with the green message.
27
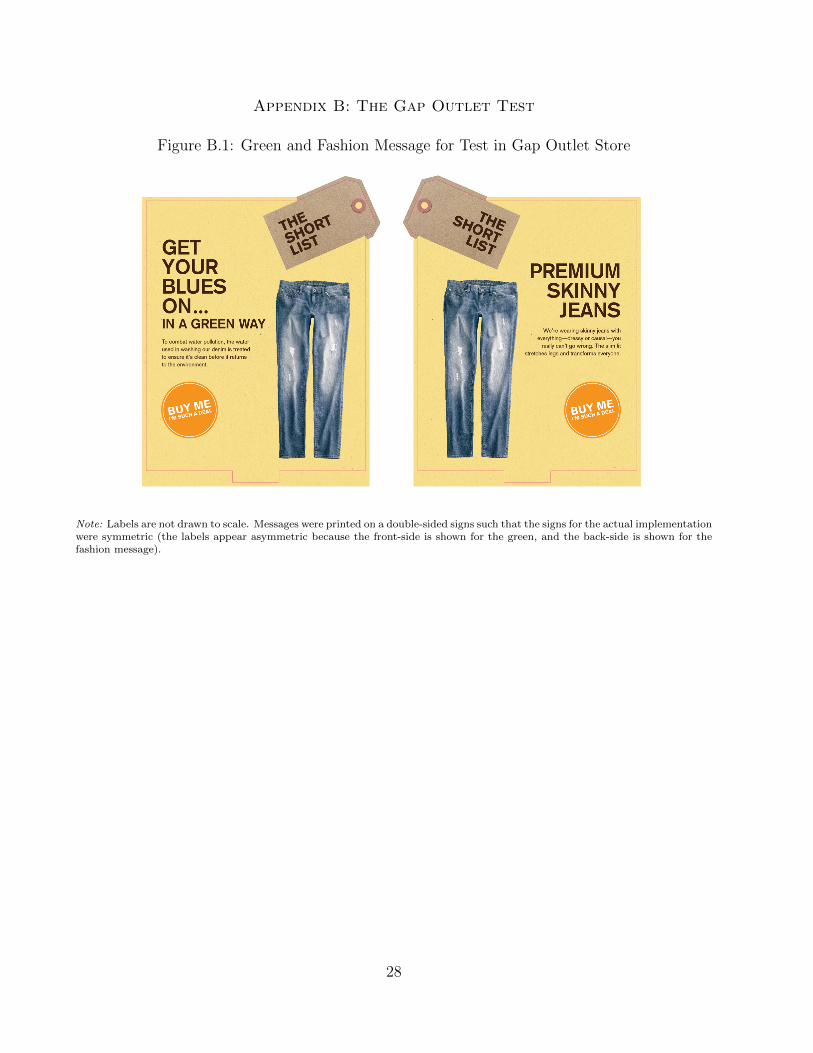
Appendix B: The Gap Outlet Test
Figure B.1: Green and Fashion Message for Test in Gap Outlet Store
Note: Labels are not drawn to scale. Messages were printed on a double-sided signs such that the signs for the actual implementationwere symmetric (the labels appear asymmetric because the front-side is shown for the green, and the back-side is shown for thefashion message).
28
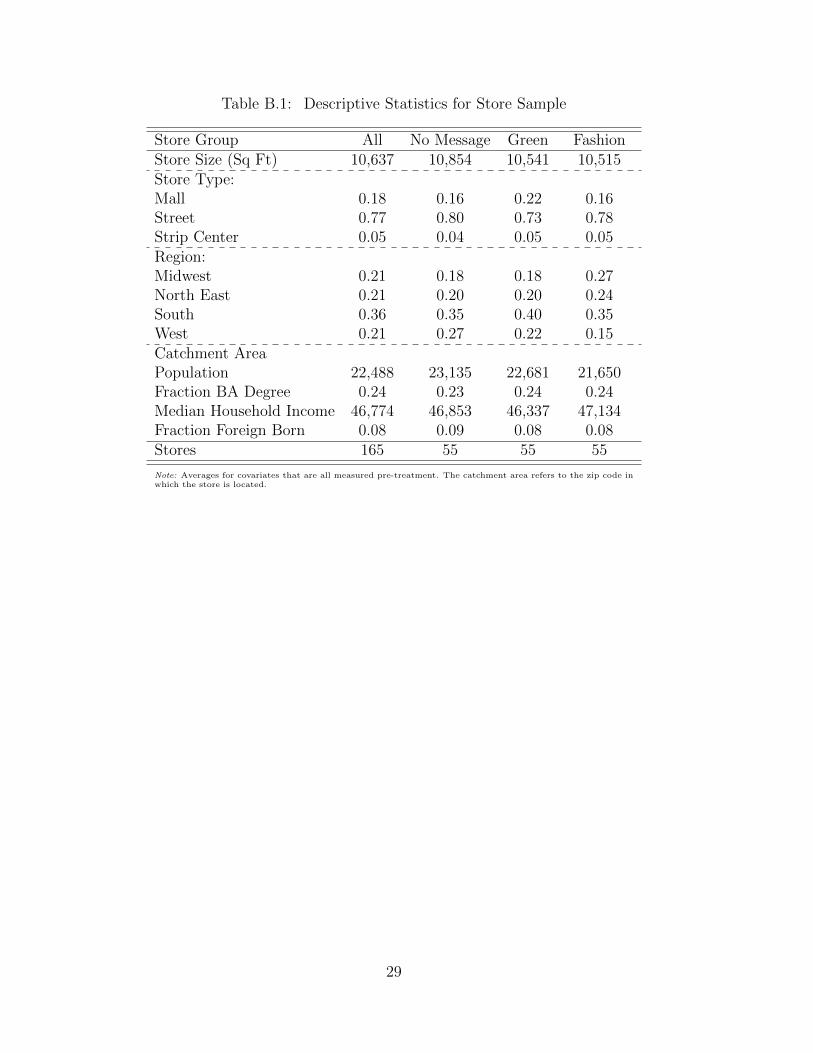
Table B.1: Descriptive Statistics for Store Sample
Store Group All No Message Green FashionStore Size (Sq Ft) 10,637 10,854 10,541 10,515Store Type:Mall 0.18 0.16 0.22 0.16Street 0.77 0.80 0.73 0.78Strip Center 0.05 0.04 0.05 0.05Region:Midwest 0.21 0.18 0.18 0.27North East 0.21 0.20 0.20 0.24South 0.36 0.35 0.40 0.35West 0.21 0.27 0.22 0.15Catchment AreaPopulation 22,488 23,135 22,681 21,650Fraction BA Degree 0.24 0.23 0.24 0.24Median Household Income 46,774 46,853 46,337 47,134Fraction Foreign Born 0.08 0.09 0.08 0.08Stores 165 55 55 55
Note: Averages for covariates that are all measured pre-treatment. The catchment area refers to the zip code inwhich the store is located.
29