Embed Size (px)
Citation preview
THE CHEMICAL AND FUNCTIONAL PROPERTIES
OF COTTONSEED OIL AS A DEEP-FAT FRYING MEDIUM
by
DARLA RACHELLE DANIEL, B.S., M.S., M.S.
A DISSERTATION
IN
FOOD AND NUTRITION
Submitted to the Graduate Faculty of Texas Tech University in
Partial Fulfillment of the Requirements for
the Degree of
DOCTOR OF PHILOSOPHY
Approved
Chairperson of the Committee
-^zr "^ Ji*"
T Accepted
Dean of the Graduate School
May, 2003

ACKNOWLEDGMENTS
Obtaining a Ph.D. is an endeavor that can only be accomplished with the help of
many people. I would like to first extend my deepest appreciation to the two people who
have been principally involved in my study, Dr. Leslie Thompson and Dr. Brent Shriver. I
have known Dr. Thompson for years, and she has always been a wonderful teacher,
advisor, and fiiend. She is a very busy professor, but was always willing to make time to
help me wdth every aspect of my research. Dr. Shriver has been a brilliant mentor and has
held my hand through the most challenging aspects of working on a Ph.D. Dr. Shriver was
available around the clock to provide guidance and support. I could not have asked for a
better major professor. In addition, it would have been very difficult to complete this
degree without the statistical help and advice of Dr. Kenny Wu. He spent many hours
helping me with the statistical component of my research and I am greatly appreciative. I
must also thank Dr. Linda Hoover for her guidance and support in the beginning of this
project. I would also like to acknowledge my other committee members. Dr. Mallory
Boylan and Dr. Helen Brittin. Their assistance and support with this project were greatly
appreciated.
I would like to thank Nina Watson and Pyco Industries for having the interest in
cottonseed oil research and for funding this project. Without them, this project may have
never existed.
I would like to extend my appreciation to Texas Tech University for financially
supporting me with scholarships and awards. In addition, for the facilities provided to

conduct this research. I would especially like to thank the staff at Wiggins Hall for
providing the space for all of my equipment during the actual data collection component
of my project. Thanks to Ambika Sridhara for her laboratory expertise and to all of the
people that worked with me on this project.
Ul

TABLE OF CONTENTS
ACKNOWLEDGMENTS ii
ABSTRACT viii
LIST OF TABLES x
LIST OF FIGURES xii
CHAPTER
L INTRODUCTION I
Objective 3
Statement of problem and significance 3
Hypothesis 3
n. REVIEW OF LITERATURE 4
History of cottonseed oil 4
Processing of cottonseed 6
Refining of cottonseed oil 7
Manufacturing of cottonseed oil 8
Frying 9
Degradation 10
Chemical degradation of lipids 14
Oil uptake 18
Lab analyses 19
IV
Total polar materials 21
Free fatty acids 21
Iodine value 22
Peroxide value 23
Totox number 24
Fatty acid profiles 24
Composition of the oils 26
Potatoes 29
Sensory properties 30
Nutritional implications 32
Hydrogenation 43
Summary 45
m. MATERIALS AM) METHODS 47
Materials 47
Fat sources 47
Food 47
Fryer 48
Experimental design 48
Lab analyses 51
Iodine value 51
Peroxide value 52
Free fatty acids 52
p-Anisidine value 53
Fatty acid profile of the oil 53
Fatty acid profile of the french fries, trans fatty acids and total polar materials 54
Statistical analyses 55
IV RESULTS AND DISCUSSION 56
Oil loss 56
French fiy cooking loss 56
Color analysis 61
Lab analyses 62
Peroxide value 62
Iodine value 64
Free fatty acids 65
p-Anisidine value 68
Totox value 70
Total polar materials 72
Fat and moisture content 74
Fatty acid composition of the fiying oils 75
Fatty acid composition of the french fries 81
Trans fatty acid content of the oil and the fench fries 86
V CONCLUSION 91
VI

REFERENCES 93
APPENDIX
A. TABLES 102
B.FRENCH FRY SPECIFICATION SHEET 113
vu

ABSTRACT
The purpose of this research study was to determine if unhydrogenated cottonseed
oil was suitable for the deep-fat fiying process and to determine the nutritional
characteristics of the cottonseed oil and the french fries cooked in the oil. Cottonseed oil,
partially hydrogenated canola oil and partially hydrogenated soybean oil were subjected to
a temperature of 177°C for 8 hours per day and 6 batches of french fries were fried per
day for 5 consecutive days. French fiies were weighed prior to frying, cooked for 5
minutes, allowed to drain, and reweighed. Oil was not replenished, filtered once per day,
and weighed daily before and after frying. Both the oil and the french fries were evaluated
to determine color, fatty acid profiles, trans fatty acids, cmde fat, and moisture. The
french fries were analyzed for total polar materials and the oil was analyzed for iodine
values, peroxide values, p-anisidine values, free fatty acids and totox values.
No significant differences were found among oil types for loss of oil during
cooking, weight of french fiies before and after cooking, color, moisture, and crude fat.
Iodine values for all three oil types were significantly different. Both canola oil and
soybean oil had significantly lower iodine values than cottonseed oil due to being partially
hydrogenated. Free fatty acid values were not significantly different for the three oil types.
Cottonseed oil, regardless of days of fiying, had higher peroxide values, p-anisidine values
and totox values compare to canola oil and soybean oil, indicating an increased presence
of primary and secondary oxidation products. However, as days of fiying increased, values
for all three oils trended closer together. There were no significant differences in total
viii
polar materials for french fries cooked in the three oils. Fatty acid profiles for both the
french fries and the oil remained relatively stable as fiying days increased. The analytical
tests indicated that none of the three oil types reached a highly deteriorated state.
Cottonseed oil was significantly lower in trans fatty acids than the other oils, as were the
french fries prepared in the oil. Cottonseed oil appeared to be as stable as canola oil and
soybean oil, however the oils would need to be stressed to a much greater degree to
confirm this. In regard to dietary components associated with potential negative health
effects, french fries cooked in cottonseed oil were slightly higher in saturated fatty acids,
but markedly lower in trans fatty acids than those cooked in canola oil and soybean oil.
IX
LIST OF TABLES
1. Changes in the composition during frying of french fries 20
2. Characteristics of cottonseed oil, canola oil and soybean oil 25
3. Typical fatty acid profile of cottonseed oil, canola oil and soybean oil 28
4. Typical composition of the principal vegetable and animal fats
and oils in the U.S 34
5. Study fat used in the diet 37
6. Per capita contribution of trans fatty acids in primary food sources 40
7. Mean oil loss for cottonseed oil, canola oil, and soybean oil on days 1-5 103
8. Mean differences in french fry cooking loss among tanks 1-3 for cottonseed oil, canola oil and soybean oil (combined) 104
9. Mean french fiy cooking loss for cottonseed oil, canola oil, and soybean oil (combined) on days 1-5 105
10. Mean peroxide values (meq peroxide/kg) of cottonseed oil, canola oil, and soybean oil on days 1-5 106
11. Mean iodine values (g halogen/100 g fat) of cottonseed oil, canola oil, and soybean oil in tanks 1-3 107
12. Mean free fatty acid values (%ooleic) of cottonseed oil, canola oil, and soybean oil on days 1-5 108
13. Mean p-anisidine values of cottonseed oil, canola oil, and soybean oil on days 1-5 109
14. Mean totox values of cottonseed oil, canola oil, and soybean oil on days 1-5 110
15. Composition of cottonseed oil, canola oil, and soybean oil on days 0, 1 and 5 I l l
16. Composition of french fries fried in cottonseed oil, canola oil, and soybean oil on days 0, 1 and 5 112
XI
LIST OF FIGURES
1. Frying oil/food quality curve 12
2. Proposed FDA food label 42
3. Oil loss for cottonseed oil, canola oil, and soybean oil (combined) on days 1-5 57
4. Differences in french fiy cooking loss among tanks 1-3 for cottonseed oil, canola oil, and soybean oil (combined) 59
5. French fiy cooking loss for cottonseed oil, canola oil, and soybean oil (combined) on days 1-5 60
6. Mean peroxide values of cottonseed oil, canola oil, and soybean oil on days 1-5 63
7. Mean iodine values of cottonseed oil, canola oil, and soybean oil in tanks 1-3 66
8. Mean free fatty acid values of cottonseed oil, canola oil, and soybean oil (combined) on days 1-5 67
9. Mean p-anisidine values of cottonseed oil, canola oil, and soybean oil on days 1-5 69
10. Mean p-anisidine values of cottonseed oil, canola oil, and soybean oil on days 1-5 of fiying 71
11. Totox values of cottonseed oil, canola oil, and soybean oil on
days 1-5 of fiying 73
12. Fatty acid profile of cottonseed oil on days 0, 1 and 5 76
13. Fatty acid profile of canola oil on days 0, I and 5 77
14. Fatty acid profile of soybean oil on days 0, 1 and 5 78
Xll

15. Fatty acid profile of french fries fried in cottonseed oil on days 0 (fresh), 1 and 5 82
16. Fatty acid profile of french fries fried in canola oil on days 0 (fresh), 1 and 5 83
17. Fatty acid profile of french fries fried in soybean oil on days 0 (fresh), I and 5 84
18. Trans fatty acid content of cottonseed oil, canola oil, and soybean oil on day 0 (fresh) and days 1 and 5 (combined) 87
19. Trans fatty acid content of french fries fried in cottonseed oil, canola oil and soybean oil on days 1 and 5 (combined) 89
Xlll
CHAPTER I
INTRODUCTION
Vegetable sources account for approximately 85%) of the fats and oils consumed in
the U.S. today (O'Brien 1998). Many vegetable oils compete in the American market
including cottonseed oil. Cottonseed oil was the preferred vegetable oil in the U.S. in the
1950's, until soybean oil overtook the market due to lower production costs. Consumers
expect that food service establishments and processors will provide them with healthy
food choices in addition to quality flavor, mouthfeel, and texture. Despite the negative
health effects, deep-fat fried snack foods remain very popular among consumers. The
unique sensory qualities found in foods that are deep-fat filed can not be duplicated by any
other cooking method. In particular, french fries remain a very popular food item in the
American diet. On average, each person in the United States consumes approximately
13.6 kg (30 pounds) of french fries every year (Ebersole 2002). Therefore, the food-
service industry has the difficult task of providing the popular french fiy in the healthiest
form possible. This task may appear to be an oxymoron, however, choosing the right oil
can be the key to providing a tasty and heahhier french fiy at a low cost.
Cottonseed oil could be a superior choice to meeting the above requirements. One
reason is that cottonseed oil enhances the flavor of foods cooked in it (Jones and BCing
1993). It is well established that cottonseed oil produces the most flavorful potato chip on
the market. Another reason is that it is not necessary to hydrogenate cottonseed oil to
increase its stability. Sheaffer (1998) compared the fiying performance of cottonseed oil
and canola oil using french fries. It was found that unhydrogenated cottonseed oil had
similar stabihty characteristics as compared to hydrogenated canola oil. Because it is not
necessary to hydrogenate cottonseed oil, it resuUs in a fried food product with a low
concentration of trans fatty acids. Trans fatty acids have been implicated in causing heart
disease. It has also been postulated (Sheaffer 1998) that foods fried in cottonseed oil
absorb less fat than foods fried in other oils.
This research will build upon previous studies by evaluating the fiying performance
of cottonseed oil using french fries and comparing it to partially hydrogenated canola oil
and partially hydrogenated soybean oil. Research conditions will simulate the food service
setting as close as possible in order to produce results that can be applied commercially.
The chemical characteristics of unhydrogenated cottonseed oil will be compared to that of
hydrogenated canola and hydrogenated soybean oil throughout the study period to assess
the nutritional value and stability characteristics of the oils. The amount of oil loss will
also be determined by physical measurement in addition to compositional evaluation. The
goal of this research will be to provide scientifically valid data in order to determine if
there are benefits to using cottonseed oil as a substitute for the partially hydrogenated oils
commonly used as a deep-fat frying medium by the restaurant industry.
Objective
The objective of this study is to provide scientifically valid data on the physical,
chemical and stability characteristics of cottonseed oil as a deep-fat fiying medium for use
by the restaurant industry.
Statement of problem and significance
To determine the attributes of cottonseed oil as a deep-fat frying medium for use in
the food service industry.
Hypotheses
The two hypotheses tested are stated below:
1. Cottonseed oil as a frying medium has stability characteristics that differ from
hydrogenated canola oil and/or hydrogenated soybean oil.
2. The composition of french fries fiied in cottonseed oil differs from french fries fried in
hydrogenated canola oil and/or hydrogenated soybean oil.

CHAPTER II
REVIEW OF LITERATURE
History of cottonseed oil
Prior to the civil war, surplus cottonseed was only utilized as feed for cattle or as
fertilizer on depleted cotton and corn fields (Wrenn 1995). Rotting cottonseed became
such a problem in the south that several states passed laws to regulate its disposal. During
the 20th century, this supposedly "worthless" cottonseed became the second most
precious cash crop in the South. This was due to the manufacture of cottonseed into
marketable commodities.
Salunkhe et al. (1992) describe the vast utilization of cottonseed. Cottonseed hulls
are used as roughage in livestock feeds and are used for a variety of other purposes such
as fiiel for oil mills, insulation material and soil conditioner. Cottonseed meal is used in
the textile industry and is also used as an adhesive. Cottonseed proteins are used as a
nutritious protein source for human consumption. The manufacture of salad and cooking
oils, shortenings and margarine comprise almost the entire market for cottonseed oil. The
remainder of the oil is used in the manufacture of non-edible items such as soap, and it is
also used to pack fish and cured meats.
Cottonseed oil was used to produce the first hydrogenated-all vegetable shortening
product for the retail trade (Wrenn 1995). Crystallized cottonseed oil (Crisco®), was
introduced in the early 1900s by Proctor & Gamble who had a patent on the
hydrogenation process (Wrenn 1995). Once hydrogenation became accessible to other
manufactiires, less expensive, lower grade oils were able to compete in the market.
Nationally, cottonseed oil competes with soybean oil, com oil, peanut oil, sunflower oil,
safflower oil, and some animal fats (NCPA 1990). Cottonseed oil must compete
internationally with coconut oil from Southeast Asia, palm oil from Malaysia, African
peanut oil, olive oil from the Meditenanean basin, European sunflower oil and Canadian
rapeseed oil (NCPA 1990). The dominant position of cottonseed oil in the early 1900's
started to decline secondary to the advent of improved processing methods
(hydrogenation and deodorization) that greatly improved not only the quality of
cottonseed oil but other oils as well. In addition, the increased use of cottonseed for cattle
feed has decreased cottonseed oil production (Jones and King 1993).
Cottonseed oil remains fifth in world production due to the competition from these
other oils (Jones and King 1993). Cottonseed oil is difficult to market because its supply
rehes on cotton production, which can be variable according to climate conditions. This is
a disadvantage to customers who rely on a stable supply of oil to support their finished
products (Jones and King 1993). During the period from the 1940's to the I960's, the
encouragement of soybean production to increase the supply of protein caused cottonseed
oil prices to be placed at a disadvantage (Smith 1962). According to the USDA (1988)
cottonseed oil is perceived as an expensive oil due to its exceptional performance
characteristics in food applications, however, it can be priced lower than soybean and
other oils. Typically, oil prices around the worid are closely related and remain
competitive with each other (NCPA 1990).
Processing of cottonseed
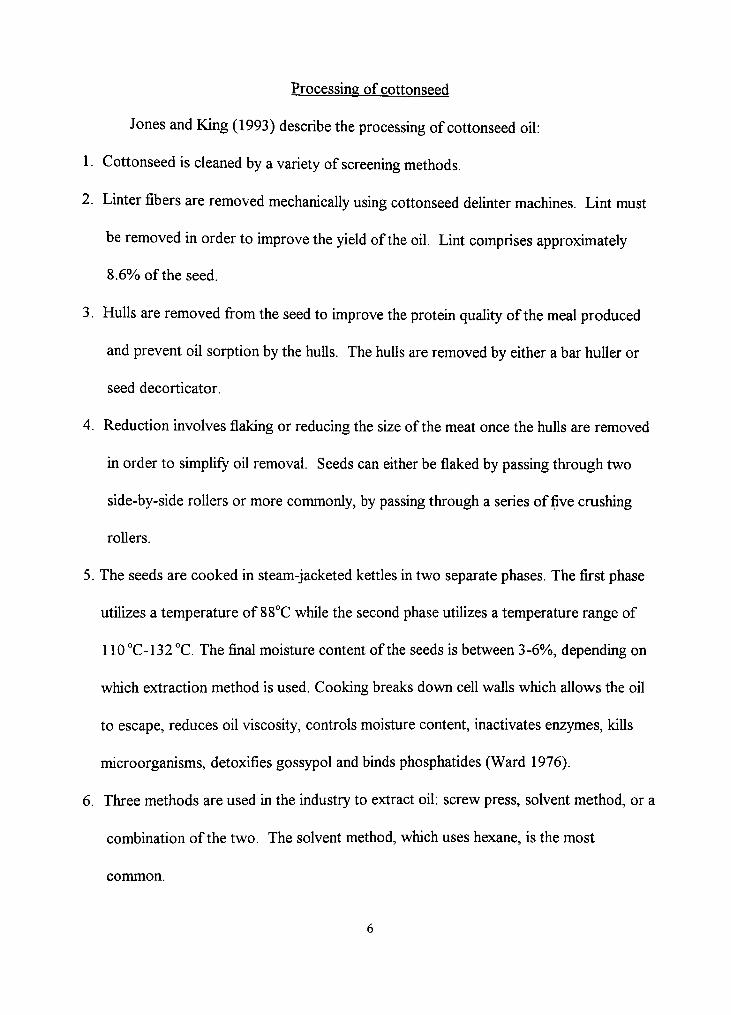
Jones and King (1993) describe the processing of cottonseed oil:
1. Cottonseed is cleaned by a variety of screening methods.
2. Linter fibers are removed mechanically using cottonseed delinter machines. Lint must
be removed in order to improve the yield of the oil. Lint comprises approximately
8.6%, of the seed.
3. Hulls are removed from the seed to improve the protein quality of the meal produced
and prevent oil sorption by the hulls. The hulls are removed by either a bar huUer or
seed decorticator.
4. Reduction involves flaking or reducing the size of the meat once the hulls are removed
in order to simplify oil removal. Seeds can either be flaked by passing through two
side-by-side rollers or more commonly, by passing through a series of five crushing
rollers.
5. The seeds are cooked in steam-jacketed kettles in two separate phases. The first phase
utilizes a temperature of 88°C while the second phase utilizes a temperature range of
110 °C-132 °C. The final moisture content of the seeds is between 3-6%i, depending on
which extraction method is used. Cooking breaks down cell walls which allows the oil
to escape, reduces oil viscosity, controls moisture content, inactivates enzymes, kills
microorganisms, detoxifies gossypol and binds phosphatides (Ward 1976).
6. Three methods are used in the industry to extract oil: screw press, solvent method, or a
combination of the two. The solvent method, which uses hexane, is the most
common.
Refining of cottonseed oil
To be utilized as a human food source raw cottonseed oil must be refined to
remove impurities, which ensures desirable flavor, color and stability characteristics.
Refining is the most important step in the purification process of oil and involves removing
the nonglyceride components such as phospholipids, color, and trace metals and free fatty
acids (Jones and BCing 1993). The process mixes alkali and oil to form soaps. The non
glyceride components contained in the soap are then removed by using centrifugation and
hot water washings (NCPA 1996). Bleaching furthers the purification process which
involves the removal of color bodies, trace metals, and soaps by using bleaching clays that
absorb the impurities (Jones and King 1993).
Deodorization is an essential step in the refining process. The process removes
volatile compounds that can produce off-odors and off-flavors, leaving the oil with a 0.01-
0.03%) free fatty acid content and a zero peroxide value (Gavin 1978). This process was
perfected by David Wesson in the twentieth century who exposed the oil to superheated
steam in a vacuum (Wrenn 1995). Along with free fatty acids, aldehydes, ketones,
alcohols and hydrocarbons associated with undesirable flavors and odors produced by
autoxidation are removed (Jones and King 1993). Cottonseed oil can be deodorized at
lower temperatures, resulting in less loss of tocopherols that are natural antioxidants that
help retard oxidation (NCPA 1996).
Manufacturing of cottonseed oil
Depending on the intended use of the oil, cottonseed oil can be winterized or
hydrogenated. Cottonseed oil must be winterized before being marketed as a salad oil to
remove the cloudiness caused by stearine (Wrenn 1995). Stearine solidifies at refrigerator
temperatures due to its saturated fat content. To produce a clear cottonseed oil, the oil is
cooled until the stearine precipitates.
Hydrogenation of oil increases the stability. This allows it to withstand high and
prolonged temperature abuse such as that which occurs in deep-fat fiying. Hydrogenation
is the process by which hydrogen is added to unsaturated double bonds in a fatty acid
chain by reacting fatty acids with hydrogen gas in the presence of a catalyst.
Hydrogenation was developed in the early 1900s to produce a less costly solid vegetable
oil product to replace lard (American Society of Clinical Nutrition 1995). The purpose of
hydrogenation is to reduce the potential for oxidative damage, increase the stability of the
oil and to solidify the oil (Nawar 1996). The process increases the melting point of oils
and helps retard oxidation and flavor deterioration (Salunkhe et al. 1992). Hydrogenation
not only adds hydrogen to the double bond, it also resuhs in migration of double bonds
and reconfiguration of some of the cis double bonds into trans double bonds. Trans fatty
acids are so named because the hydrogen atoms on the carbon atoms involved in the
double bond are on opposite sides of the carbon chain, whereas in naturally occurring
unsaturated fatty acids (cis isomers), the hydrogen atoms on the carbon atoms involved in
the double bond are on the same side of the carbon chain (Ascherio and others 1999).
Oils that require hydrogenation to increase stability are usually high in
polyunsaturated and monounsaturated fatty acids. Polyunsaturated fatty acids such as
linoleic and Unolenic acids that have a tendency to oxidize and become rancid are reduced
during hydrogenation, which prolongs storage time (Ascherio et al. 1999). Oils that are
higher in saturated fats are more stable. Oil must meet a certain quality standard in order
for hydrogenation to be effective. The requirements are that the oil contain <0.1 % free
fatty acids, <1.5 ppm soap and <0. P/o moisture (Puri 1980). In addition, it should have a
low color and a peroxide value <10 meq/kg because polar pigments and oxidized ions can
act as catalyst poisons (Puri 1980).
Frying
Frying is one of the oldest cooking methods (Varela et al. 1988). Deep-fat fiying is
commonly used by the food service industry. In the United States, the fiied food industry
increased by approximately 88%o between the years of 1979 and 1988 (Tettweiler 1991),
in spite of recommendations from organizations such as the American Heart Association
to Umit intake of fried food
Deep-fat fiying is the complete immersion of a product in heated oil. Many
complex changes occur in fats and oil during the frying process. Heat is transferred to the
food product by conduction and convection. Conductive heat transfer occurs within the
food under unsteady state conditions (Singh 1995). Convective heat transfer occurs
between the food and the sunounding oil (Singh 1995). Farkus (1994) proposed that the
fiying process occurs in four different phases:
1. The characteristic of the initial heating stage is that the surface of the product
immersed in the oil reaches the same temperature as the boiling point of the liquid.
The mode of heat transfer is convection and this last only a few seconds with no
vaporization occurring from the surface of the food.
2. The surface boiling stage is initiated by the vaporization process. Forced convection is
the mode of heat transfer due to increased turbulence in the surrounding oil. The cmst
begins to form on the surface of the food during this stage.
3. The falling rate is the stage that when the internal temperature of the food reaches the
boiling point and the most moisture leaves the internal region of the food. At this
point, the starch content of the internal region of the food begins to gelatinize and
cook. More moisture is lost and the cmst layer continues to increase in thickness,
4. The bubble end-point is the final stage in the fiying process. The moisture loss
diminishes, and no more bubbles are seen escaping from the surface of the product.
The cmst layer continues to thicken.
Degradation
The more oxidatively stable oil is, the longer it can withstand the abuse it suffers
during the deep-fat fiying process. Industry and food service operators expect highly
stable oil to reduce operation costs. The stability of the oil is directiy related to how often
it must be replenished and/or completely changed out. In order to control the quality of
the end product and the life of the oil, this degradation process, or loss of stability, must
be understood.
10
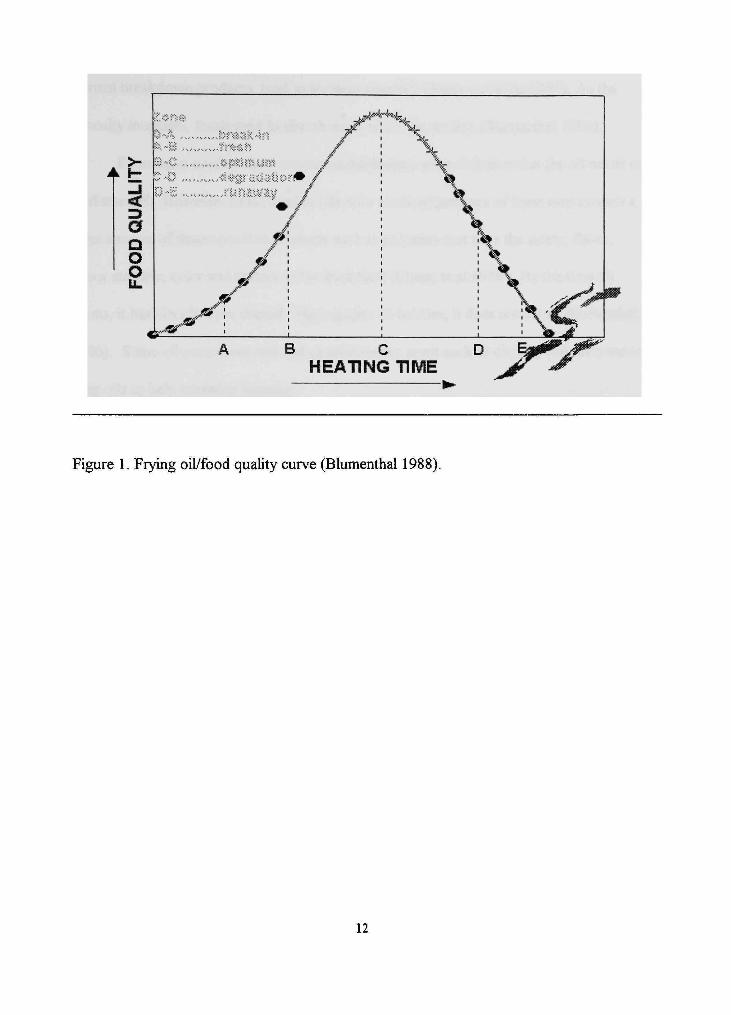
Oil degradation occurs simply through the aging process and use. The degradation
process of cooking oil is a five-phase process described by Blumenthal (1988) (Figure 1).
1. Break-in oil - white product; raw, ungelatinized starch at center of the fiy; no cooked
odors; no crisping of the surface; little oil pickup by the food.
2. Fresh oil - slight browning at the edges of the fiy; partially cooked centers; crisping of
the surface; slightly more oil absorption.
3. Optimum oil - golden-brown color; crisp, rigid surfaces; delicious potato and oil odors;
fully cooked centers (rigid, ringing gel); optimal oil absorption.
4. Degrading oil - darkened and/or spotty surfaces; excess oil pickup; product moving
toward limpness; casehardened surfaces.
5. Runaway oil - dark, case-hardened surfaces; excessively oily product; surfaces
collapsing inward; centers not fully cooked; off-odor and off-flavors (burned).
The longer an oil can stay in the optimum phase, the more useflil and cost-effective it is
for commercial food service.
Visual degradation of the oil includes decreased smoke point, increased viscosity,
darkened color, and increased foaming (Gere 1983; Perkins 1967; Rock and Roth 1967;
Tangel et al. 1977). White smoke over fiying oils is normal and is mostly steam. Blue to
gray smoke contains organics co-distilling with steam and can indicate that the oil needs to
be discarded. However, this condition cannot be used for quantification.
Viscosity is the ability of oil to resist flow. As the temperature increases, viscosity
decreases. Saturation and larger molecules, such as long chain fatty acids or polymerized
11
<
a Q O
o LL
. 'S?''
B C HEATING TIME
Figure I. Frying oil/food quality curve (Blumenthal 1988).
12
thermal breakdown products, tend to increase viscosity (Jones and King 1993). As the
viscosity increases, foods tend to absorb more oil on the surface (Blumenthal 1996).
Foaming is used by food service establishments as an indicator that the oil needs to
be discarded. However, foods fried in oils prior to the appearance of foam may contain a
large amount of decomposition products such as polymers that alter the safety, flavor,
flavor stability, color and texture of the fiied food (Chang et al 1978 ). By the time oil
foams, it has already been abused. High quality oil bubbles, it does not foam (Blumenthal
1996). Some oil processors will add an antifoaming agent such as dimethylpolysiloxane to
their oils to help minimize foaming.
The color of oil is often used as an indicator of quality, however, fresh (unused)
oils vary in color. Processing techniques and pigments such as carotene are responsible
for the differences in color between various fresh (unused) oils (Jones and King 1993).
Oils darken in color as they are heated and used for frying. This is due to the presence of
polymers and oil-soluble products from the fiied food (Blumenthal 1996). Other factors
that influence oil color include the type and amount of food being fried, batch of the oil,
completeness of filtration, temperature, and the type of fryer (Takeoka et al. 1997). Since
there are so many factors involved in the determination of oil color, it should only be used
as a marker, not as the overall determinant of oil quality.
Visual analysis of the color of oil is commonly used, but it is highly variable.
Methods for expressing color numerically were developed by the CIE (Commission
Internationale d'Eclairage), an international organization concerned with light and color
(Minolta 1993). The two most commonly used methods to express color numerically are
13
the Yxy color space, devised in 1931 by CIE, and the L*a*b* color space, devised in 1976
to provide more consistent color differences in relation to visual differences. The L*a*b*
color values of liquid oil samples can be quantified using ultraviolet-visible
sphectophotometers (Maes et al. 1997). L* indicates lightness, and a* and b* indicate
chromaticity. The a* value is positive in the red direction and negative in the green
direction while the *b value is positive in the yellow direction and negative in the blue
direction (Minolta 1993). An L* value of 100 is equal to white, and the value of 0 is equal
to black. The a* value represents the color spectmm of red to green. The redness of a
sample is represented with a positive value of 100, while the greenness of a sample is
represented with a value of-100. The b* value represents the color spectmm of yellow to
blue. The yellowness of a sample is represented with a value of positive 100, while the
blueness of a sample is represented with a value of-100 (Minolta 1993). These values
can then be converted into everyday language represented by hue, lightness, and saturation
(chroma). Hue is the classification of red, yellow, blue, etc.; lightness represents bright
and dark colors; saturation describes whether a color is dull or vivid (Minoha 1993).
Chemical degradation of lipids
Chemical degradation can occur rapidly during the deep-fat fiying process and
includes hydrolysis (lipolysis), oxidation, and polymerization (Clark and Serbia 1991).
Lipolysis involves cleavage of fatty acid chains from the glycerol molecule (hydrolysis),
resulting in release of free fatty acids. Free fatty acids can be responsible for off-odor and
off-flavor development. Lipolysis can occur enzymatically due to the reaction of lipids
14
with enzymes, or non-enymatically due to the presence of heat and water. Lipolysis is a
major problem in the deep-fat fiying of foods and is secondary to the large amounts of
water introduced from the food while fiying and the high temperatures used (Fennema
1985). Prior to harvest, the oilseed can contain large amounts of free fatty acids,
however, most of these are removed in the refining process. Free fatty acids that develop
during fiying can cause problems such as decreased smoke point and surface tension of
the oil, thus reducing the quality of the fried food (Fennema 1985).
Lipid oxidation is the primary chemical degradation process and can produce both
satisfactory and unsatisfactory flavor compounds. Excessive lipid oxidation renders edible
oils and fat-containing foods unacceptable, reduces shelf life, and decreases the nutritional
quality of the food (Fennema 1985). However, a small amount of oxidation can actually
enhance the fried flavor. Autoxidation is the predominant oxidative reaction and is
described by Ho et al. (1996).
Autoxidation is a chain reaction initiated by a free radical mechanism. The
initiation reaction usually occurs not by the reaction of unsaturated fatty acids with
oxygen, but by the decomposition of hydroperoxide. This occurs in the presence of
catalysts such as metal, heat or exposure to light, or by singlet oxygen.
Propagation is the next step in the chain reaction after free radical formation.
Hydrogen radicals are removed from the double bond position and oxygen attacks to form
peroxy radicals. Hydroperoxides are then formed from hydrogen from other substrate
groups, these substrate groups go on to react with oxygen, and the chain reaction
continues.
15
The process is terminated by the interaction between two free radicals. Many
decomposition compounds are formed and can be classified as volatile products -
hydrocarbons, aldehydes, ketones, furans, carboxylic acids; or nonvolatile products - polar
and nonpolar cyclic monomers, non-cyclic monomers, dimers, trimers, and higher
molecular weight compounds (White 1991).
"Oxidative rancidity" is the term used to describe fats and oils that have developed
objectional flavors and odors due to autoxidation. The degree of unsaturation, the
presence of antioxidants, and light affect the rate of oxidation. Hydrogenation is one
method used to retard oxidation by increasing the saturated fatty acid content of the oil.
Many oil processors add chelating agents to their oils, such as citric acid, to retard
oxidation caused by heavy metals (Institute of Shortening and Edible Oils 1999).
Cottonseed oil naturally contains tocopherol, which is an antioxidant that helps retard
oxidation (Salunkhe et al. 1992). Unprocessed cottonseed oil contains approximately 1000
ppm of tocopherols, however, up to one third can be lost during refining (Jones and King
1993). Various researchers have found levels of tocopherol in commercially refined
cottonseed oil to be between 633 ppm to 950 ppm (Sherwin 1976; List and Friedrich
1989; Slover et al. 1969). Some oil processors will add tertiary butylhydroquinone
(TBHQ) as an antioxidant. TBHQ gives oxidative stability to polyunsaturated oils
without creating problems of color or flavor stability (Fennema 1985). Processors also
protect fats and oils from light to prevent oxidation and increase shelf life.
Filtration also helps maintain the quality of oil. Reduced smoke point and increased
fat deterioration, especially an increase in free fatty acids, are associated with food
16

particles present in the fiying medium (Jones and King 1993). There are a variety of flyers
on the market, and thus vary in size, heating method, and cooking method. According to
Jacobson (1991) the most important part of the frying equipment is the filtration system.
The type and kind of filter influences the removal of "cracklings" which can min the
appearance of the fried food, darken the oil, and impose off-flavors. Use of filtering
powder polishes and neutralizes part of the free fatty acids (Jacobson I99I). Fihering
powder can be used to aid the filtering process and to improve the quality of the oil.
Filtering powder works by building up on the filter paper which traps more food debri,
improves the color of oil, and improves the stability of oil by reducing the amounts of free
fatty acids and total polar materials (Jones and King 1993). However, small amounts of
the soaps that form remain in the hot fiying oil after filtration and can cause darkening and
undesirable flavor changes in the fat and products fried in the fat (Jacobson 1991).
Morton (1977) explained the polymerization process. It involves the formation
of new carbon-carbon Hnkages in the absence of oxygen. Cyclic fatty acids are produced
if the bonds are formed within one fatty acid. Development of bonds between two fatty
acids results in dimeric acids, either within one triglyceride molecule or between two
molecules. Formation of additional cross-links between these molecules produces
polymers with high molecular weight. Oils and fats form polymers when subjected to
extreme conditions of temperature and time, and occur in insignificant amounts under
normal cooking conditions (Institute of Shortening and Edible Oils 1999).
17

Oil uptake
Americans are consuming large amounts of fats in the form of fried foods. Some
fiied foods contain excessive amounts of fat. In some cases it can reach more than 45% of
the total product (Saguy and Pinthus 1995). Industries are hard pressed to provide quality
fried foods which contain a lower amount of fat. The amount of oil uptake a food item
possesses can greatly influence the fat content of that particular food. In today's health
conscious environment, reducing the fat content of a product should greatly enhance its
acceptance. Reduced content of fat in the finished product is not the only reason to reduce
oil uptake. Studies questioning the safety of heated fats and oils are abundant in the
scientific Uterature (Clark and Serbia 1991). Oil extracted from the food contains more
polymers than the oil left in the fryer (Pokomy 1980). Excessive cooking conditions can
produce toxic compounds in fats and oils, however unacceptable sensory qualities occur
before the oil reaches this level of degradation (Clark and Serbia 1991).
Pinthus and others (1993) describe the factors reported to affect oil uptake.
These include oil quality, product and oil temperature, fiying duration, the particular
foods' shape, composition (e.g., solids, moisture, fat, protein), and porosity, pre-fiying
treatments (e.g., blanching, drying), coating, surface roughness and others. To ensure that
oil uptake is related to the nature of the oil product used in fiying food, the factors Hsted
above need to be strictly controlled.
It has been well documented that oil composition and quality influence oil uptake
(Abdel-Aal and Karara 1986; Blumenthal 1987, 1991; Pokomy 1980). When an oil
interacts with the food being fried, surfactants are formed which affect oil quality (Stier
18
and Blumenthal 1990, 1993). Surfactants affect fat absorption and heat fransfer at the oil-
food interface by reducing the surface tension of the oil (Saguy and Pinthus 1995).
However, fresh oils form very littie surfactants, while the majority of surfactants are
formed in degraded oils (Blumenthal 1991).
The type of product being fried affects oil uptake. For example, potatoes are
known to absorb more oil than meat (Min and Smouse 1989). The most notable change in
the french fiy during the fiying process is a large amount of moisture loss and an increase
in the fat content (Table 1). Since french fries are one of the top selling menu items at
every menu price level in the restaurant industry (Anon 1982 a, b), if restaurants serving
them provide the lowest fat product possible it will have a major impact on fat
consumption by consumers.
Gamble et al. (1987) suggested that there is a linear relationship between moisture
loss and oil uptake throughout the deep-fat fiying process. However, other research has
found no relationship between these two variables (Dupont et al. 1992). French fries that
are pre-dried absorb less oil, however, this type of treatment may decrease sensory quality
(Gupta et al. 2000). Freezing french fries prior to fiying will also decrease oil uptake
(Weaver etal. 1975).
Lab analyses
More than 400 different chemical compounds have been discovered in degraded,
heated oil (Gere 1982). There are many tests available to determine oil composition
throughout the various stages of decline. Sensory evaluation will remain the best
19

Table 1. Changes in the composition during fiying of french fries^
Water
Fat
Component
Reducing sugars; sucrose
Flavor
Starch
Amino acids
Proteins
Minerals
^Pokomy 1999
Character of Changes
Substantial losses
Pronounced increase (original fat is
negligible
Maillard reactions
Volatiles from Maillard reactions
Interactions with fiying oil
Gelatinization, dextrinization
Formation of heterocyclic flavor substances,
mutagens
Denaturation
Slight decrease
20
approach for determining the flavor and odor of heated oils. However, detennining oil
degradation by objective methodology is also very helpful and can be successfiilly
correlated with sensory information.
Total polar materials
Measurement of Total Polar Materials (TPM) is useful in estimating heat abuse in
fiying oils. Evaluating total polar materials has recently been characterized as one of the
best indicators of heated oil quality (Blumenthal 1991). TPM includes all
nontriacylglycerols such as free fatty acids, mono- and diacylglycerols, glycerol, and
polymers (Tan and Man 1999). TPM are those materials that are left on the silica gel
column after first elution when heated oil is tested using AOCS Official Method 20-91
(AOCS 1998). Bulk fresh oil from the factory contains approximately 96%) triglycerides
(Blumenthal 1991). As an oil is used, TPM accumulates in the oil while triglycerides
decrease in direct proportion (Blumenthal 1991). At the point it is discarded, or even
before that, an oil used at a fast food chain contained about 25%) TPM, resulting in only
about 75%o triglycerides (Blumenthal 1991). The degradation materials which are
contained within the polar fraction account for the cooking and eating qualities of the oil,
and may be toxic (Blumenthal 1991).
Free fatty acids
Free fatty acids (FFA) (AOCS 1998, Ca 5qa-40) measures fatty acid changes that
occur in oils during deep-fat fiying. Free fatty acids are pro-oxidants and contribute to the
21
decreased shelf life of oil (Frega and others 1999). In the initial stage of cooking, free fatty
acids are produced by oxidative breakdown, but in later stages, hydrolysis of the fat
caused by the presence of moisture in the food being fiied causes the increase in free fatty
acids (Blumenthal 1996). In most deep fat fiying operations, the presence of FFA
produced by hydrolysis is too small to affect the quality of the food, while the FFA formed
by oxidation will adversely affect the product (Tyagi and Vasishtha 1996). Generation of
up to 2% FFA from hydrolysis in oils that contain minute amounts of lauric acid, such as
soybean and cottonseed oil, has no adverse effect on the odor or the flavor of foods
(Tyagi and Vasishtha 1996). Oils high in lauric acid will produce a soapy flavor at ca.
0.5%) FFA content (Tyagi and Vasishtha 1996). When significant amounts of free fatty
acids are present in the oil, smoking becomes excessive and the oil must be discarded
(Blumenthal 1996). Detection of increases in FFA by titration is a poor measure of oil
quality because it does not differentiate between acids formed by oxidation and those
formed by hydrolysis. Free fatty acid levels are 0.05%) in fresh refined, bleached, and
deodorized oils (Jones and King 1993).
Iodine value
Iodine value (AOCS 1998, Cd 1-25) is a simple test used in the oil industry which
has a direct relationship to the deterioration of the quality of the oil. For the iodine value
to be of any reasonable estimate, there must be an unheated reference sample in order to
determine the change in the values (Waltking et al. 1975). The iodine value indicates the
number of unsaturated fatty acids (Jones and King 1993). The iodine value is a good
22
estimate of lipid stability because fats v^th larger proportions of saturated fatty acids are
less likely to undergo autoxidation (Jones and King 1993). The PUFA content in oils will
undergo a steady increase in saturation as fiying time increases.
Peroxide value
Peroxide value (AOCS 1998, Cd 8b-90) is a test that measures primary oxidation
in its early stage, however, it may not be a good measure of heat abuse in PUFA-rich oils.
Hydroperoxides are the initial and primary products of lipid oxidation. They are transitory
and are broken down by further reactions (Jackson 1981). Hydroperoxides can be
quantitatively measured by determining the amount of iodine liberated by their reaction
with potassium iodide (Blumenthal 1996). In PUFA-rich oils, peroxides are formed
through the oxidation of free radicals obtained from abstraction of protons from
methylene-intermpted fatty molecules (Tyagi and Vasishtha 1996). PUFA-rich oils
decompose much faster than oils with less triene by means of labile hydrogen, obtained
from the active methylene group of another molecule, which causes free radical
polymerization (Tyagi and Vasishtha 1996). Tyagi and Vasishtha (1996) concluded that
oils containing trans isomers could inhibit free radical polymerization by restricting the
decomposition of peroxides. Peroxides quickly breakdovm to non-peroxide compounds,
making their correlation with flavor variable (Jackson 1981). For a product to have
acceptable shelf life, the peroxide value should be less than 1.0 meq/kg fat at the point of
use (Blumenthal 1996).
23

Totox number
Totox number (AOCS 1998, Cd 18-90) is a test that con-elates well with oxidation
and flavor in oils. The totox value is the anisidine value + 2 times the peroxide value.
Using this combination of tests results in higher correlations with flavor than using the p-
anisidine value alone (Jackson 1981). The p-anisidine value is primarily a measure of
alpha-beta-unsaturated aldehydes (Jackson 1981). Aldehydes are secondary lipid
oxidation products and account for 50% of the volatiles produced during oxidation
(Tompkins and Perkins 1999). In particular, trans -2,trans -A decadianal (a precursor of
linoleic acid) is associated with fiied food flavor, and its correlation with p-anisidine value
is highly significant (Tompkins and Perkins 1999).
Fatty acid profiles
It is important to determine fatty acid profiles in both fresh and used oil because
the fatty acid composition in oils changes during deep-fat fiying. Thompson and Aust
(1983) and Miller and White (1988) evaluated changes in the fatty acid composition of
fiying oils after 40-100 hours of fiying. Both studies found that linoleic and Unolenic acid
levels dropped, while amounts of saturated fatty acids increased. The decrease in
unsaturation can be attributed to the destmction of double bonds by oxidation, scission,
and polymerization (Tyagi and Vasishtha 1996). The amounts and types of fatty acids
present in oil contribute to its fiinctional properties. The fatty acid profiles of commonly
used oils are listed in Table 2.
24
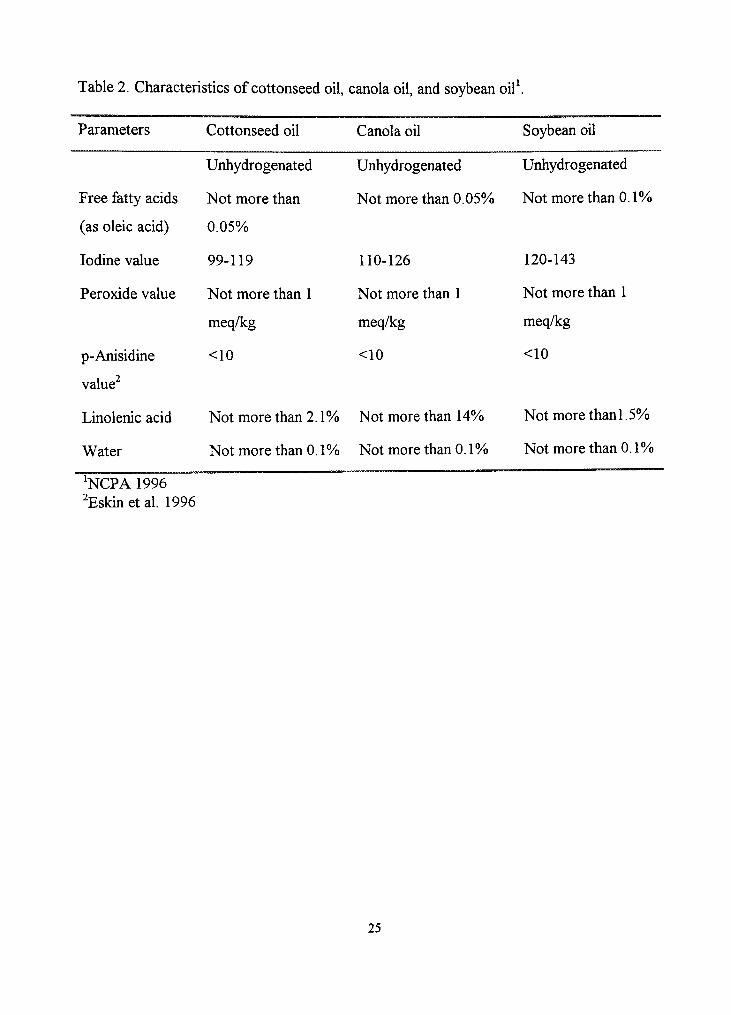
Table 2. Characteristics of cottonseed oil, canola oil, and soybean oil\
Parameters
Free fatty acids
(as oleic acid)
Iodine value
Peroxide value
p-Anisidine
value^
Linolenic acid
Water
^NCPA 1996 ^Eskinetal. 1996
Cottonseed oil
Unhydrogenated
Not more than
0.05%
99-119
Not more than 1
meq/kg
<I0
Not more than 2.1%
Not more than 0.1 %o
Canola oil
Unhydrogenated
Not more than 0.05%
110-126
Not more than I
meq/kg
<10
Not more than 14%o
Not more than 0.1%
Soybean oil
Unhydrogenated
Not more than 0.1%
120-143
Not more than 1
meq/kg
<I0
Not more than 1.5%)
Not more than 0.1 %o
25
Composition of the oils
Cottonseed oil has been the preferred oil for fiying potato chips in the southern
U.S.A. (Weiss 1983). In 1995/1996, 497 million pounds of cottonseed oil in the forni of
shortening, margarine, salad and cooking oils were used in food (Institute of Shortening
and Edible Oils 1999). Cottonseed oil contains higher proportions of saturated fatty acids
(24.6%o) as compared to soybean oil (14.7%o) and canola oil (6.1%) (Salunkhe et al. 1992).
However, the saturated fatty acid content reported for canola oil and soybean oil was
obtained from the unhydrogenated oils.
Cottonseed oil contains 40-55%) linoleic acid, 20-25% palmitic acid, 2-7% stearic
acid, 18-30%) oleic acid, and small amounts of myristic and arachidonic acids and
approximately 0.5-2%) cyclopropenoid acids (Salunkhe et al. 1992). Cottonseed oil
contains virtually no linolenic acids, which considerably strengthens its stability for fiying
(NCPA 1996).
Canola oil was developed from rapeseed varieties (Brassica napus andBrassica
rapa) and it must contain less than 2%) emcic acid according to the Canola Council of
Canada (Eskin et al. 1996). The rapeseed must undergo similar processing steps as those
applied to other vegetable oils in order to produce an edible oil product.
Hydrogenation is commonly used to improve the melting behavior and oxidative
stability of canola oil. One of the major problems encountered during the hydrogenation of
canola oil is an increase in the amount of trans fatty acids. Canola oil contains a small
amount of sulfiar compounds (Eskin et al. 1996). These sulflir compounds poison the
catalyst, which results in slightly higher trans fatty acid formations. Research is being
26

conducted to develop a tme zero glucosinate (a compound that is hydrolyzed to
isothiocyanates and other sulfur-containing compounds) oil, which is expected to eliminate
the problem (Eskin et al. 1996).
Canola oil ranks third among the oilseed crops, behind soybean and palm oil in the
production of edible oils (Salunkhe et al. 1992). In the years I995/I996, 319 miUion
pounds was used in food in the form of shortening, margarine, salad and cooking oil
(Institute of Shortening and Edible Oils 1999). Canola oil is the least saturated oil on the
market and has a naturally high content of linolenic acid content (11-12%)) (Carr 1991).
Plant breeders have been able to reduce the linolenic acid content to 2.1%), increase the
Unoleic acid from 20%) to 27%), and increase the oleic acid content from 60 to 85% with
the intent of producing a very stable oil (Eskin et al. 1996).
Soybean oil is the most widely produced oil in the U.S. and the world. In
I995/I996, 11,877 biUion pounds of oil was used in food in the form of shortening,
margarine, salad and cooking oil (Institute of Shortening and Edible Oils 1999). Because
of its high linolenic acid content (6.8%)), soybean oil must be hydrogenated to produce a
stable oil used under fiying conditions (Eskin and others 1996). In addition, linolenic acid
is responsible for the oil's flavor and odor reversion. Light hydrogenation reduces the
linolenic acid content to approximately 3% and flavor stability is improved (Ho et al.
1996). On average, unhydrogenated soybean oil contains 22.8%o oleic, 50.8%) linoleic, and
6.8%o linolenic (Eskin et al. 1996). Table 3 summarizes the fatty acid composition of
unhydrogenated cottonseed oil, canola oil and soybean oil.
27
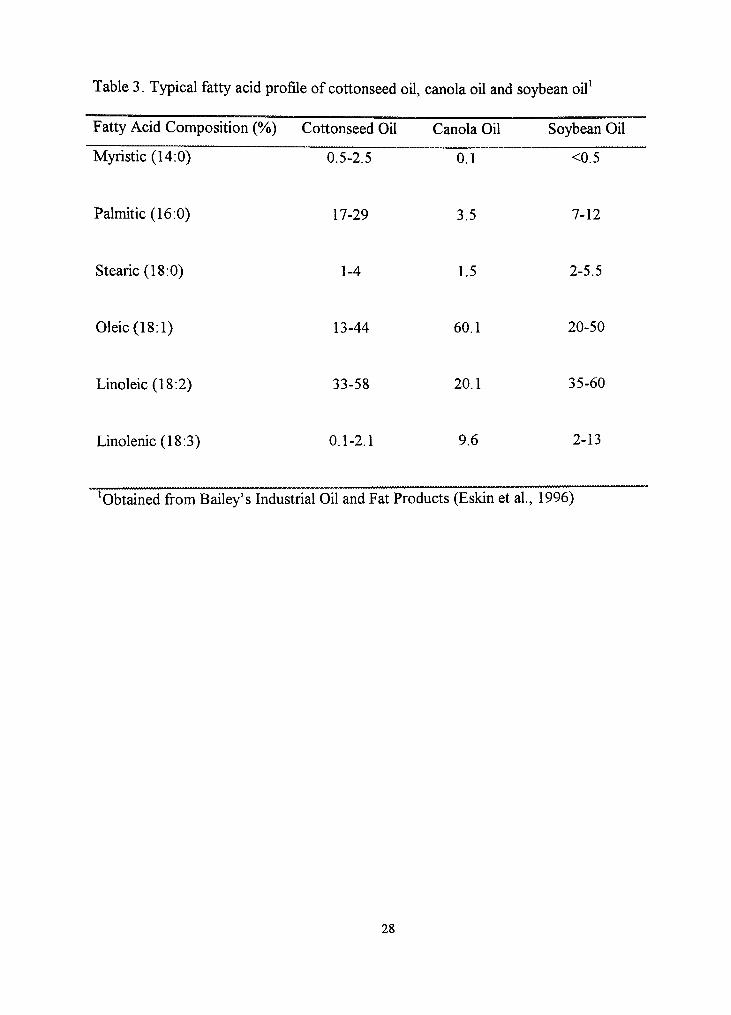
Table 3. Typical fatty acid profile of cottonseed oil, canola oil and soybean oil
Fatty Acid Composition (%) Cottonseed Oil Canola Oil Soybean Oil
Myristic (14:0) 0.5-2.5 o l < o l
Palmitic (16:0) 17-29 3.5 7-12
Stearic (18:0) 1-4 1.5 2-5.5
Oleic (18:1) 13-44 60.1 20-50
Linoleic (18:2) 33-58 20.1 35-60
Linolenic (18:3) 0.1-2.1 9.6 2-13
^Obtained from Bailey's Industrial Oil and Fat Products (Eskin et al., 1996)
28
Potatoes
Potatoes, mainly in the form of french fiies, comprise half of the vegetables
consumed by Americans (Gower 1992). There are four types of potatoes grown in the
United States: Round White, Russet, Round Red and Long White (Empire State Potato
Growers, Inc. 2000). Within this group, there are thousands of varieties that differ in days
to maturity, color, shape, storage requirements, and purpose.
The four types of potatoes are classified into three categories of consistency based
on texture. Round whites are considered all-purpose. Russet potatoes are mealy in texture
and cmmble when cooked, and Round Red and Long White are waxy which enables them
to hold their shape (Empire State Potato Growers 2000). Russet potatoes provide the best
texture and color for fiying french fries. Russet potatoes with a specific gravity between
1.102 and 1.106 produce french fries of desirable textural qualities as characterized by
mealiness, crispiness, and firmness (Jaswal 1991). The variety of the potato, grovsing
conditions and location, storage temperature and methods of cooking all effect the texture
(Jaswal 1991).
The color of a potato is determined by the amount of sugars present at the time of
cooking. French fries should be light in color with no dark pigments. High concentrations
of reducing sugars result in fried products that are dark in color and commercially
unacceptable (Burton 1989). Glucose is the sugar most closely correlated to french fiy
color. A glucose concentration of less than 1.2 mg/g"' and 1.60 mg/g'^for Shepody and
Russet Burbank, respectively, results in excellent fry quality (Pritchard and Adam 1994).
Factors that affect color are basically the same factors that affect texture.
29

Russet Burbank is the dominant potato cuhivar in North America where it
constitutes over 70% of the planted acreage (National Potato Council 1994). It is utilized
for tablestock and for processing into french fries and dehydrated products (Love et al.
1996).
Sensory properties
There are many objective analyses available to determine the decomposition
products at various stages found in oil. However, there is not an instmment available that
can replace the senses of a human being. Sensory evaluation is the scientific discipline for
the qualitative and quantitative evaluation of foods (Warner 1996). It is the supreme
method in assessing the quality and stability of fats, oils, and fat-containing foods (Warner
1996). There are two types of sensory panels-consumer and trained (analytical). Consumer
panels anticipate direction of choice and in some cases, determine whether a product is
preferred by some population (ASTM 1968). Trained sensory panelists provide a
systematic appUcation of the combined senses of taste and smell as analytical guides to the
characteristic of the products tested (ASTM 1981). Trained sensory panels are more
common in research. Trained sensory panels can either be difference or descriptive. As the
name implies, difference panels determine whether a sample is different from another
sample. Descriptive panels utilize highly trained judges that rate the product for quality or
intensity based on precise scales, with reference standards that attempt to eliminate
subjective analysis (Warner 1996). For sensory analysis to be even more effective, it can
be coupled with chemical tests such as peroxide values and color analyses. Cottonseed oil
30
is known for its "nutty" flavor and is often used as the standard for which other oils are
compared for pleasing aroma, flavor and performance (NCPA 1996). The sensory
properties of oil are affected by frying time, temperature, oil type, whether the oil is fresh
or has been replenished, fiying equipment, type of food being fried, and any additives in
the oil.
The initial flavor of oil is rather bland, and it takes some time to develop the fiied
flavor that consumers know and love. Therefore, the first stage of fiying results in
improved flavor, the flavor is maintained during the next stage, and in the last stage, the
flavor becomes gradually less acceptable (Min and Smouse 1989). It is the job of the
cook to maximize the second (or optimum stage as described above) of the fiying process.
The optimum phase can be prolonged by replenishment of fresh oil. Studies done with
french fries indicate that oil can be replenished three times within 100 hours of fiying time,
and the hydrolytic and oxidation products are diluted, thus maintaining the sensory value
of oil (Thompson and Aust 1983). It is recommended that the removal of fiying oil for
french fiying occurs when the polar compounds reach 20%), and the rejection of oil when
the polar compounds reach 25%) (Poumeyrol 1986).
Hydrogenation can affect the sensory quality of oil. Blumenthal et al. (1976) found
that the sensory quality of french fiies fried in hydrogenated soybean oil decreased as
compared to non-hydrogenated soybean oil fried under the same conditions. Each type of
oil will have its on flavor profile. Off-flavor compounds produced by polyunsaturated fats
have been characterized by consumers as "grassy," "fishy," and "rancid" (Sinram and
Hartman 1989). Min and Smouse (1989) described the two disadvantages of using
31
hydrogenated oil. One disadvantage is that hydrogenated oil has a lower linoleic acid
content, which causes less full and less pleasant flavors. Another disadvantage is that
hydrogenated oil has different oxidation products as compared to natural fats. These
peculiar products can produce unfamiliar off-flavors and odors to the oil and the product
being fiied.
In addition, appearance plays a role in the acceptance of a fiied product. French
fries are expected to be light in color, with littie browning. During fiying, Maillard (non-
enzymatic) browning can occur. This involves the reaction of sugars with free amino
acids or free amino groups of proteins and peptides (Boskou and Elmadfa 1999). To
avoid the development of dark colors while fiying, potatoes with lower sugar content are
selected.
Nutritional implications
The American Heart Association and the American Dietetic Association to name a
few, recommend diets high in whole grains, fiiaits, and vegetables, and low in total fat. It
is recommended that fat calories consumed should be less than 30%) of total calories.
Twenty years ago, the fat calories consumed was 40% of total calories, currently it has
decreased to 33%) (Inform 1999b). However, this is deceptive because fat consumption
has actually increased as total calories consumed have increased. Due to the public's
increased awareness of saturated fat and cholesterol, there has been a surge in
consumption of vegetable oils and a decline in consumption of animal fats such as lard and
butter and highly saturated vegetable oils such as palm and coconut oils. Many studies
32
have shown that saturated fatty acids appear to increase the risk of coronary heart disease
(CHD) by increasing low density lipoprotein-cholesterol (LDL-C) (with the exception of
stearic acid which has no effect). Monounsaturated fatty acids (MUFA) actually reduce
plasma cholesterol, and polyunsaturated fatty acids (PUFA) are beneficial in reducing
CHD risk by lowering blood LDL-C (omega-6 fatty acids) and/or triglyceride levels
(omega-3 fatty acids) (Nelson 1998). In a meta-analysis study, experimental diets were
designed to determine the effects of MUFA and PUFA on blood lipid profiles. It was
found that both diets elicited similar lowering effects of LDL-C levels in parallel with total
cholesterol, however MUFAs did not lower HDL-C levels whereas a slight decrease was
seen with PUFAs (Mensink and Katan 1990). The composition of various fats and oils are
summarized in Table 4.
Of course, consumers have responded to this by markedly reducing butter
consumption from their diet and replacing it with the "healthier" margarine. However,
recent studies indicate that this replacement for butter may not be so good for the heart
after all. This is due to the fact that margarine contains trans fatty acids produced during
the hydrogenation of vegetable oils.
From the 1950s to 1990s, french fries were cooked in beef tallow, which gave the
fiied food a smooth, buttery taste. Public concern about the health risk associated with the
cholesterol found in animal products prompted fast food restaurants to change to
vegetable oil for fiying (Gladwell 2001).
During 1989 and 1990, many restaurants reduced their use of saturated fats and
substituted hydrogenated vegetable oils due to consumer pressure for healthier products
33
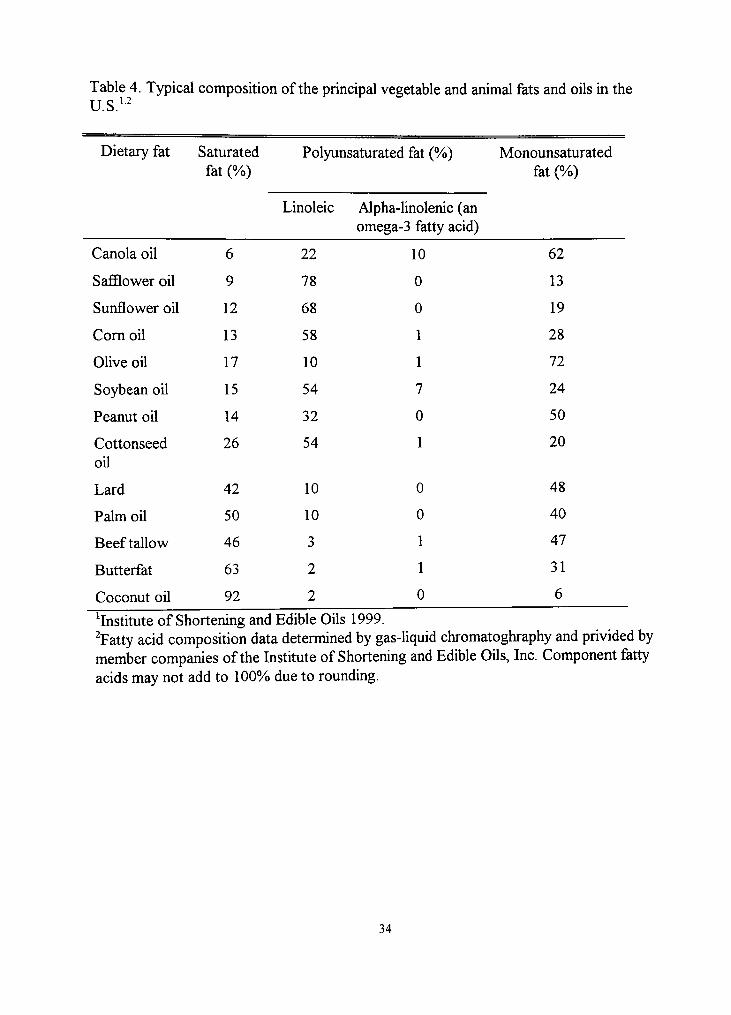
Table 4. Typical composition of the principal vegetable and animal fats and oils in the U.S.'-
Dietary fat
Canola oil
Safflower oil
Sunflower oil
Com oil
Olive oil
Soybean oil
Peanut oil
Cottonseed oU
Lard
Palm oil
Beef tallow
Butterfat
Coconut oil
Saturated fat (%)
6
9
12
13
17
15
14
26
42
50
46
63
92
Polyunsaturated fat (%))
Linoleic
22
78
68
58
10
54
32
54
10
10
3
2
2
Alpha-omega
-linolenic (an -3 fatty acid)
10
0
0
1
1
7
0
1
0
0
1
I
0
Monounsaturated fat (%)
62
13
19
28
72
24
50
20
48
40
47
31
6
^Institute of Shortening and Edible Oils 1999. ^Fatty acid composition data determined by gas-liquid chromatoghraphy and privided by member companies of the Institute of Shortening and Edible Oils, Inc. Component fatty acids may not add to 100%) due to rounding.
34
(Hunter and Applewhite 1991). Mono- and polyunsaturated fatty acids are considered
"heart healthy," however the process of hydrogenation rearranges some of the fatty acids
from the cis form to the unhealthy trans form. Partially hydrogenated vegetable oils
contain approximately 30%o trans fatty acids, whereas tallow contains approximately 3%
trans fatty acids (Hunter and Applewhite 1991).
It has been known for years that dietary fat and cholesterol influence blood
cholesterol concentrations. Extensive research has been done not only on fats as a class,
but on individual fatty acids and their effects on blood lipid levels and lipoprotein
concentration. The length of the chain and the degree of unsaturation of a particular fatty
acid molecule contribute to the ability of the fatty acid to promote or delay the
development of atherosclerosis. Scientists now agree that total dietary fat intake itself is a
poor predictor of CHD risk (Nelson 1998). Small differences in fatty acid stmctures may
have huge influences on their metabolic effect (Pederson 2001). For example, myristic acid
(14:0) and palmitic acid (16:0) are potent cholesterol increasing fatty acids, while stearic
acid (18:0) and oleic acid (cis 18:1) have no effect on semm cholesterol, and linoleic acid
(18:2) decreases semm cholesterol (Pederson 2001). Laurate, myristate, and palmitate
constitute the majority of saturated fatty acids consumed in the Westem diet (Nelson
1998). Trans fatty acids are metabolized in the same manner as saturated fatty acids. A
study by Mensink and Katan (1990) found that consumption of trans fatty acids increases
blood cholesterol levels. Other studies have shovm that saturated fatty acids and trans
fatty acids are equal in their effects on blood cholesterol.
35
Large scale epidemiological surveys and resuhs from human feeding studies all
point to the same conclusion, that an increased risk from coronary heart disease is
associated v^th dietary intake of trans fatty acids (Nelson 1998). Zock et al. (1995)
hypothesize that for every additional percentage of trans fatty acid in the diet, LDL-C is
raised by about 1.5 mg/dl and HDL cholesterol is lowered by approximately 0.5 mg/dl.
Huang and Fang (2000), randomly assigned hamsters to three different diets; trans fatty
acid diet, saturated fatty acid diet, and polyunsaturated acid diet. It was found that the
diets high in trans fatty acid and saturated fatty acid raised semm cholesterol levels as
many other previous studies have found. The saturated fat diet significantly increased
activity of hepatic acyl-CoA: cholesterol acyltransferase (AC AT) - the key enzyme in
cholesterol metabolism, with the trans fatty acid diet was a close second. They proposed
that both trans fatty acids and saturated fatty acids are preferred substrates for ACAT.
They also proposed that since there is a shared similarity in the configuration of trans fatty
acids (which are sUghtly bent at the double bond) and saturated fatty acids, this is
important in facilitating the reaction with ACAT. To complicate matters flirther, a study
by van Greevenbroek and others (1998) found that it may not be just the geometric
configuration, but also the specific chain length that effects semm lipid concentrations.
It is important to choose foods with both a low saturated fat content and a low
trans fatty acid content. A study by Lichtenstein and others (1999) fed 18 men and 18
women 6 diets in random order for 3 5-day periods. The diets contained 30%) fat and 2/3
of the fat was provided by one of six fat sources (Table 5).
36

Table 5. Study fat used in the diet.
Fat
Soybean Oil
Semi-liquid margarine
Soft margarine
Shortening
Stick margarine
Butter
Calories from trans fat
0.6
0.9
3.3
4.2
6.7
1.3
Calories from saturated fat
7.3
8.6
8.4
8.6
8.5
16.7
37
LDL cholesterol was 6%o lower with the shortening and stick margarines compared
to butter. LDL cholesterol was 7 to 10%o lower with soybean oil, semi-liquid (squeeze
bottle) margarine and soft margarine diets. The soybean oil and semi-liquid margarine
diets had the most favorable overall effects with the soft margarine diet close behind. The
butter diet was almost as low in trans fat as the soybean oil and semi liquid margarine
diets, but the saturated diet and cholesterol were higher which caused butter to have the
worst overall effect.
Nelson (1998) cautions against concluding that trans fatty acids are a major
contributor to CHD. Although there are many well-conducted studies, they are not
without error. Without the use of capillary gas chromatography, which was not routinely
done in past studies, it was difficult to assess the amount of trans fatty acids in foods
(Nelson 1998). The food supply is constantly changing and compositional data is just one
point in time (Allison et al. 1999). The two approaches used in many studies was to
measure mortahty or morbidity as endpoints or measure changes in plasma cholesterol or
lipoprotein levels, and these two approaches may not be equivalent (Nelson 1998).
Nevertheless, since consumption of trans fatty acids does not appear to be beneficial, and
the evidence strongly points to the fact that it can be detrimental, it is reasonable to
decrease their intake.
Given this new information, many restaurant chains are now considering switching
to unhydrogenated vegetable oils. Cottonseed oil contains only 3 grams of saturated fat
per teaspoon, and contains less than one tenth of one percent trans fatty acids (NCPA
1996). In addition, since cottonseed oil is naturally heat stable, it is not necessary to
38
hydrogenate the oil to increase its stability. Therefore, cottonseed oil contains fewer trans
fatty acids than hydrogenated oils, putting it into the "heart healthy" category.
AUison et al. (1999) estimated the trans fatty acid intake of Americans by using food
intake data from the 1989-1991 Continuing Survey of Food Intakes by Individuals
(CSPII) and the trans fatty acid contents of foods contained in a database compiled by the
USDA. It was found that the mean percentage of energy ingested as trans fatty acids was
2.6% and the mean percentage of total fat ingested as trans fatty acids was 7.4%o (5.3
grams of trans fatty acids per day). Of this value, only 20-25% of the trans fatty acid
intake comes from naturally occurring sources (basically animal fats), where as the
majority of the intake comes from altered fats. Since the 1960s, levels of trans fatty acids
in margarines have declined as softer margarines have arrived on the market due to health
concerns (Ascherio et al. 1999). In the mid 1980s, manufactures replaced partially
hydrogenated vegetable oils used in household salad and cooking oils with
unhydrogenated vegetable oils (ASCN 1995). The majority of trans fatty acids consumed
today come from fiied foods, margarine, snacks and baked products (Table 6). For
example, a large cake doughnut has 3 g of trans fatty acids and a large order of french
fries has 5 grams of trans fatty acids (Lichtenstein et al. 1999). Trans fatty acids should be
Umited to no more than 3 g/day (Lichtenstein et al. 1999).
The information above indicates that trans fatty acids may have detrimental effects
on health. However, it is hard to recognize foods that are high in trans fatty acids because
they are not listed on the food label. For decades, trans fatty acids have been included
39
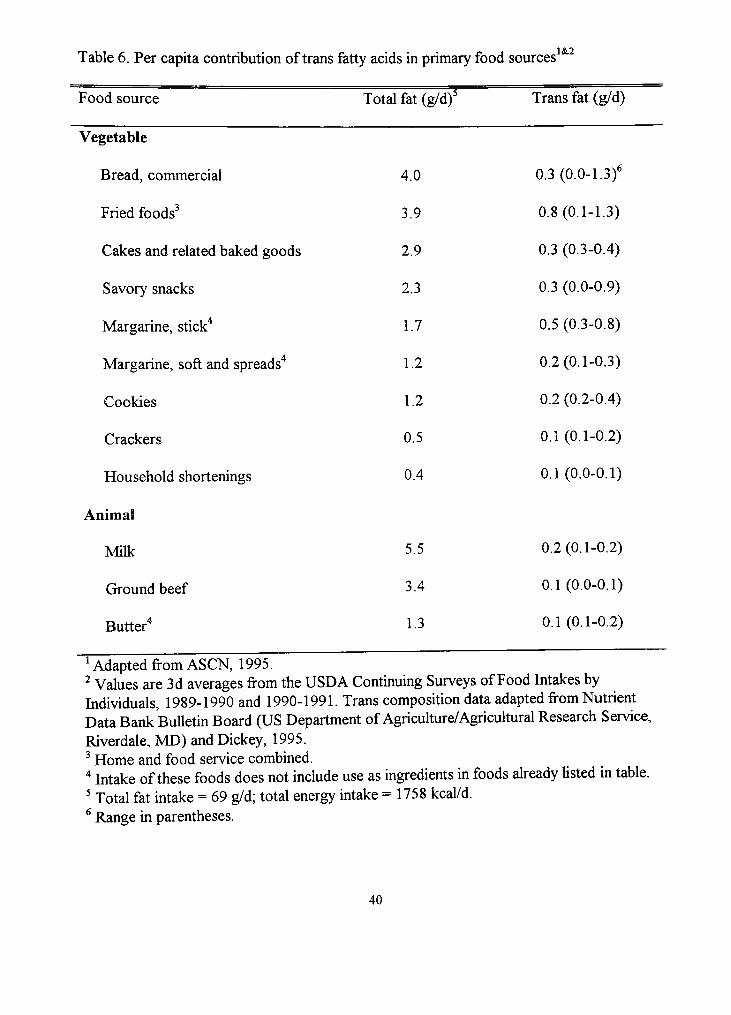
Table 6. Per capita contribution of trans fatty acids in primary food sources 1&2
Food source
Vegetable
Bread, commercial
Fried foods^
Cakes and related baked goods
Savory snacks
Margarine, stick"*
Margarine, soft and spreads'*
Cookies
Crackers
Household shortenings
Animal
Milk
Grround beef
Butter'*
Total fat (g/d)^
4.0
3.9
2.9
2.3
1.7
1.2
1.2
0.5
0.4
5.5
3.4
1.3
Trans fat (g/d)
0.3(0.0-1.3)^
0.8(0.1-1.3)
0.3 (0.3-0.4)
0.3 (0.0-0.9)
0.5 (0.3-0.8)
0.2(0.1-0.3)
0.2 (0.2-0.4)
0.1(0.1-0.2)
0.1 (0.0-0.1)
0.2(0.1-0.2)
0.1 (0.0-0.1)
0.1 (0.1-0.2)
^ Adapted from ASCN, 1995. ^ Values are 3d averages from the USDA Continuing Surveys of Food Intakes by Individuals, 1989-1990 and 1990-1991. Trans composition data adapted from Nutrient Data Bank Bulletin Board (US Department of Agriculture/Agricultural Research Service, Riverdale, MD) and Dickey, 1995. ^ Home and food service combined. ^ Intake of these foods does not include use as ingredients in foods already listed in table. ^ Total fat intake = 69 g/d; total energy intake = 1758 kcal/d. ^ Range in parentheses.
40

among the monoene fatty acids, thus giving the erroneous impression of a fairly favorable
nutritional quality (Pedersen 2001). Because trans fatty acids have become such a hot
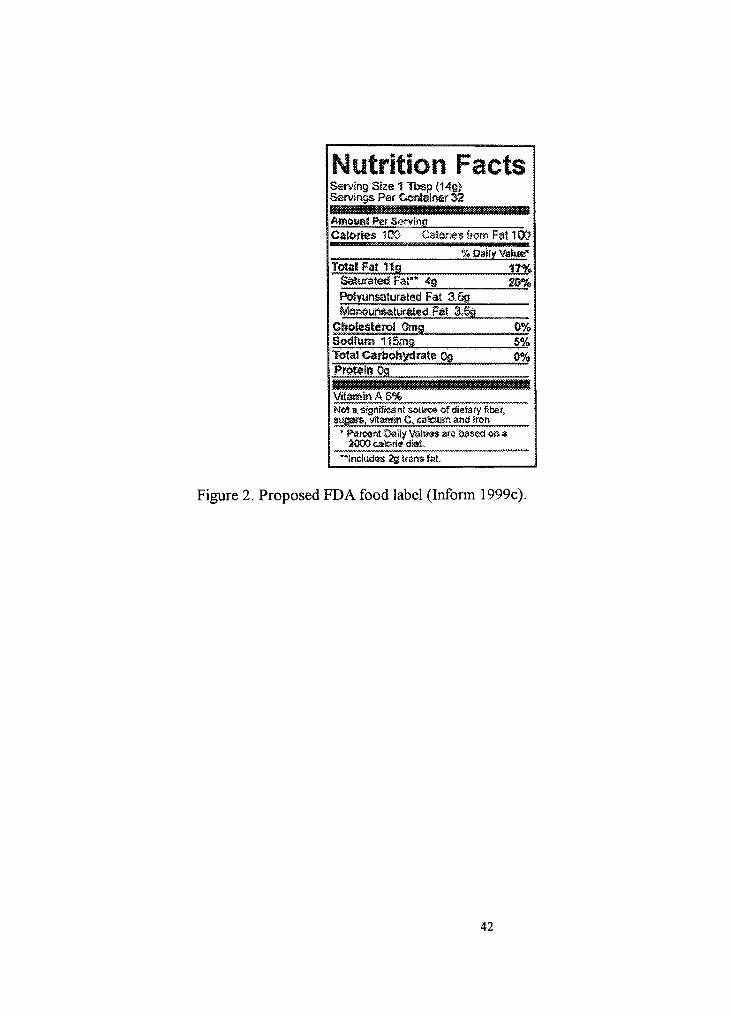
topic, the Food and Dmg Administration (FDA) is proposing that trans fatty acid content
be included on the food label. The FDA would require that trans fat be included on the
food label in the "daily value per serving" listing for saturated fat. Foods containing trans
fatty acids would have to provide a footnote by the saturated fat value with the amount of
trans fatty acid in fat grams per serving. Products containing less than 0.5 g trans fatty
acid per serving could claim "trans fat free" on their labels (Inform 1999c) (Figure 2).
This is going to cause a major stir in the foodservice industry. Companies that have been
able to claim that their products are low in saturated fat and therefore are "heart healthy,"
may be faced with huge losses in sales when they are forced to add the amount of trans
fatty acid content to their labels. This may make it possible for cottonseed oil to increase
its niche in the market and improve its reputation as a "heart healthy" oil.
The proposed labeling requirements will be very informative for those consumers
who are knowledgeable about the effects of trans fatty acids. However, the majority of
consumers do not even know what the term means. An article in Inform (1999a) cited
consumer surveys in which only 34%o of consumers could make an educated food selection
when looking at saturated fat content. Only 4% said they could make an informed
decision regarding information about trans fatty acids. Education will play an integral role
in determining whether disclosing trans fatty acids on the label will actually change
behavior patterns towards a healthier diet in the consumer.
41
Nytritlon Facts Ssrveng Ske 1 Tbsp (14.9) Ssrvtngs Per Container 32
AmotiinS Per Si>fvlyiti Cj^lOTOS 100 C§lgrfe5J?om F a n 00
% Daily Vaiiitf TotaS Fat 11g
2C% gai»ratfetS Far* 4g
j^jyunsatursted Fat 3.Sg
0% 5% 0%
Chotedlercil Cmg Sodium 1lS<mg Total Carbohydrate Cg Pr«i»(ri Og
N«t H: Sfgniffe^nt same* of dietary fibef, s t f f ys, vjtawtn C. caiciugri. and Sron
• Perc«-r>t Dally Vsltsss are &.-jsec! OB S 2000 calcriif diet
'• Includes is iransfaL
Figure 2. Proposed FDA food label (Inform 1999c).
42
The goal for the fliture is to decrease the amount of trans fatty acids in foods, in
addition to decreasing the total amount of fat consumed. The advantage of using
cottonseed oil is the fact that it does not require hydrogenation.
Hydrogenation
The hydrogenation process can be refined so that fewer trans fatty acids are
produced by refining the processing conditions (e.g., temperature, catalyst, pressure,
intensity of agitation and starting oils) and methods used (American Society of Clinical
Nutrition 1995), however, this will take time and money.
Selectivity in hydrogenation means a preference for hydrogenating one class of
unsaturated substances rather than another and maintaining this preference until the
concentration of the preferred unsaturate is greatly decreased (Patterson 1983). Another
definition of selectivity adopted by the USDA is the ratio of the reaction rates of the
hydrogenation of linoleic acid compared with the hydrogenation of oleic acid (Gray and
Russell 1979). Selectivity and isomer formation is determined by the concentration of
hydrogen adsorbed on the catalyst (Allen 1978). Temperature, catalyst, pressure, intensity
of agitation and oil type all effect hydrogen concentration, thus affecting selectivity. An
increase in temperature during hydrogenation increases the speed of the reaction and
causes a faster removal of hydrogen from the catalyst, thus increasing selectivity (Fennema
1985). Several temperature levels exist at which critical effects for the course of the
reaction are obtained (Patterson 1983). An increase in temperature will also increase trans
fatty acid formation (Puri 1980).
43
A catalyst is a substance that increases the reaction rate of a process, but is not
present in the final product. The most widely used commercial catalyst for oil
hydrogenation is nickel supported on an inert substance (Puri 1980). Nickel catalysts are
advantageous due to their wide availability, low cost and inert nature (Puri 1980).
However, the limitations of hydrogenation with nickel include selectivity, which is never
absolute, resulting in little preference for linolenic acid over linoleic acid, and large
amounts of trans-fatty acids are formed (Puri 1980). The use of Pd and Pt catalysts are not
very popular due to the formation of trans isomers and copper-chromite catalysts have
high selectivity but low activity (Puri 1980). The use of other metals such as copper,
platinum and palladium are other possibilities (Naglic et al. 1998).
Pressure indirectly affects the reaction rate of hydrogenation by speeding up the
rate of solution of hydrogen into the oil, thus increasing the hydrogen supply to the
surface (Patterson 1983). At higher pressures (500 psi), the reaction is nonselective since
di- and trisaturated glycerides are formed at about 70 iodine value, whereas at 50 psi, the
reaction becomes selective (List et al. 2000). In addition, higher pressures lead to more
trans fatty acid formation (Puri 1980).
Agitation mixes the catalyst uniformly with the oil, aids in dissolving the hydrogen
in the medium, and releases heat. Increased agitation increases the hydrogen
concentration in the oil (Pattersonl983). Low agitation results in higher selectivity but
also more trans fatty acids (Fennema 1985).
Oil type will also affect the hydrogenation process. For example, all oils vary in
types of triglycerides present and degree of saturation. Each oil will respond differentiy to
44
hydrogenation and the entire process, from cleaning prior to hydrogenation to the
temperature used are unique to that particular oil.
Selectivity allows the processor to exert considerable amount of control over the
properties of the final oil by changing the process conditions as described above (Fennema
1985). However, as selectivity of the reaction increases, so does the formation of trans
isomers (Fennema 1985).
Another processing technique that companies can use for oils that require
hydrogenation in order to increase their stability is interesterification. Interesterification
rearranges the distribution of fatty acids on the glycerol backbone without changing their
chemical composition (Liu and Lampert 1999). This produces a product with low or zero
trans fatty acids (Liu and Lampert 1999). Interesterification of liquid oils with solid fats
will Ukely increase in the fiiture once the process is well controlled and the cost can be
reduced. However, this process will also take time and money to develop.
Summary
Cottonseed oil was very popular before less saturated oils took its place in the
snack food market. Saturated fatty acids are linked to heart disease and other heaUh
related concerns. However, due to the increased mono- and polyunsaturated fatty acid
content of canola and soybean oil, they must be hydrogenated to increase the stability.
Hydrogenation changes some of the mono- and poly-unsaturated fatty acids that might be
less "heart healthy." Cottonseed oil can once again become a leader in the food industry
45

once people - both consumers and industry - are aware of the healthy and cost containing
properties of the oil.
46
CHAPTER m
MATERIALS AND METHODS
Materials
Fat sources
Cottonseed oil was obtained from Pyco Industries, Lubbock, Texas; both Extend®
(canola oil), and Mel Fry® (soybean oil) were obtained from Ventura Foods LLC, City of
Industry, CA. Canola oil and soybean oil were chosen because they are the two most
commonly used fiying oils in the restaurant industry. Cottonseed oil was not
hydrogenated, while canola and soybean oil were partially hydrogenated. All three oils
contained TBHQ and citric acid as an antioxidant and dimethylpolysiloxane as an antifoam
agent.
Food
This research was conducted using USDA grade "A" quality frozen, partially
cooked. Russet Burbank potatoes produced by Payette farms (J.R. Simplot® product),
straight cut 3/8" x 3/8" The nutritional composition of an 86 g (3 oz) serving size is 120
calories, 4 g fat, I g saturated fat, 18 g carbohydrate and 2 g protein. In addition to
potatoes, the ingredients consisted of beef tallow and/or vegetable shortening (partially
hydrogenated soybean and/or canola oil), dextrose, disodium dihydrogen pyrophosphate
(to maintain natural color). The french fries were obtained from Watson Sysco
47
Foodservice (Lubbock, TX). See Appendix B for the product information specification
sheet.
Fryer
A stainless steel, gas heated deep-fat fiyer with three 23-27 kg (50-60 pound) oil
capacity tanks (Pitco Frialator® with built in filter, model AG14S, Pitco Frialator Inc.,
Concord, NH) was used. For statistical purposes, each tank was considered a block.
Experimental design
Using a block (tank) design with a split plot (time), each of the three tanks was
filled to capacity with its designated fresh oil. The oil was placed into a container tared on
a bench scale, and approximately 24 kg (measured to 2 decimal places) was weighed.
Once the oil was weighed, it was hand poured back into the fryer. The oil residue left
adhering to the walls of the container was scraped into the tank with a large mbber
spatula. Each oil was rotated through each tank to correct for any temperature differences
between the tanks. Three repetitions were used in order to create a stronger statistical
model. One repetition was equal to 3 weeks. Oil was heated and used for 5 consecutive
days without replenishing. Although it is typical in a restaurant setting to replenish fiying
oil, for the purposes of accurately determining deterioration of the oil, the oil was not
replenished. The oil was heated for 8 hours every day for five days. This time factor was
chosen as the minimum time most restaurants heat their oil. It is typical for restaurants to
heat their oil for longer than 8 hours, however, for research purposes, it was not practical
48

to heat the oil for longer than 8 hours. After five days of heating and fiying, the used oil
was sampled and discarded and fresh oil was rotated to another tank until each oil had
been in each tank during the 3-week repetition. A fresh sample of the oil was taken prior
to the start of the study and a sample was taken at the end of each day for analysis. The
samples were flushed with nitrogen to help retard oxidation and stored frozen in brown
Nalgene containers until fiarther analysis could be performed. At the end of the day, the
oil was filtered using the built in filtering system within the Pitco Model AG14S. Prior to
draining the oil for filtering, 1 cup of filtering powder (Homestyle® Hol-N-One, Inc.
Fordyce, AR 71742) obtained from Lubbock Restaurant Supply (Lubbock, TX) was
added to the oil. This is a common practiced that is used in the food service setting to
extend the life of the oil. As the oil was draining, any food particles around the sides of the
fiyer or left in the bottom were scraped towards the drain. The oil in the last tank (farthest
from the filtering system) was fihered first, the middle tank second, and the tank closest to
the filter last. This minimized contamination of the different types of oil. Fresh filter paper
was used to filter each oil type. The filtering process was timed using a digital timer for
exactly 2 minutes. The oil was pumped back into the same tank by the fiyer s internal
pump and allowed to bubble. This signified that the retum lines had been cleared. This
pumping process was timed for exactly 2 minutes.
At the beginning of each day, the oil was pumped out of the tank using an extemal
pump fitted with plastic, clear hosing attached with screw clamps into a large container
tared on a bench scale, and weighed to the nearest 1/100* of a kg to determine oil loss.
The oil clinging to the sides and bottom of the tank that was not removed by the suction
49
of the pump, was scraped using a large mbber spatula, suctioned using a turkey baster and
emptied into the container. Once the oil had been weighed, it was hand poured back into
the fiyer. The oil residue adhering to the walls of the container was scraped into the tank
with a large mbber spatula. To prevent contamination, the spatula was cleaned before
contacting each oil type. There were 3 containers and 3 turkey basters labeled with the oil
type. All equipment was washed with hot water and dishwashing soap after each use.
After the 5-day cycle, the fiyer was cleaned first with Drano®, rinsed with water, cleaned
again with apple cidar vinegar, rinsed, and dried.
A poll was taken from restaurants in the Lubbock area and based on the results of
this poll, a temperature of 177° C was selected as the temperature that would be used to
cook the french fries. Frozen french fries were taken from the freezer and immediately
weighed to the nearest 1/1000* of a kg. Approximately 2 kg of french fries were added to
the deep-fat fiyer basket and immersed in the hot oil at a temperature of 177 ° C for
exactly 5 minutes. A digital timer was used to accurately record the time. Throughout the
day, 6 batches of fiies were cooked, yielding daily a total of 12 kg (26.4 pounds) of french
fries for each oil. Batches were fiied every 30 minutes to an hour to allow the
temperature of the oil to recover between batches. The fiies were then removed from the
oil and allowed to drain for 2 minutes. Through preliminary testing it was determined that
5 minutes was the time that produced the most consistent results (color and a cooked
product throughout). Two kg's of french fries filled the fiyer basket to half capacity, this
level allowed the french fiies to adequately cook even if the oil level was extremely low at
the end of the fifth day. Once the fiies were drained, they were weighed and colorimeter
50

values were determined for batches I, 3, and 6 using a Minolta CR 200 colorimeter.
Batch 6 was vacuum packaged (brand) and stored frozen for analysis. In addition, batches
1 and 3 were also vacuum packaged and stored frozen in case there was a trend in the
results that needed to be fiirther investigated.
Lab analyses
Iodine value, peroxide value, p-anisidine value, free fatty acids, totox value, fatty
acid profile, and trans fatty acid profile were performed in duplicate on oil samples. Cmde
fat, moisture, total polar materials, fatty acid profiles, and trans fatty acids were performed
on the french fiies.
Iodine value
Iodine value was analyzed using the AOCS Official Method (Cd 1-25; 1998) with
slight modifications. Fifteen ml of chloroform solution was added to 0.40g of filtered
canola oil and soybean oil (Iodine value of approximately 80) and 0.25g of cottonseed oil
(Iodine value of approximately 120). Twenty-five ml of WIJS solution was dispensed into
the flask containing the sample, and stored in the dark for 30 minutes. Once the flasks
were removed from storage, 20 ml of KI solution was added, followed by 100 ml of
distilled water. The solution was titrated with 0. IN sodium thiosulfate until the yellow
color ahnost disappeared. One to two ml of starch indicator was added and the titration
was discontinued when the blue color just disappeared. This same procedure was
conducted on a blank sample. The iodine value was expressed as g halogen/lOOg fat using
51
this calculation: [(ml Blank-ml Sample) x N of sodium thiosulfate x 12.69] divided by
sample weight (g).
Peroxide value
Peroxide value was analyzed using AOCS Official Methods (Cd 8-53; 1998).
Thirty ml of acetic acid/chloroform solution (3:2, v/v) was added to a flask containing five
grams of sample. Saturated potassium iodide was added (0.5 ml) to the solution and
allowed to stand for 1 minute while occasionally shaking the flask. Distilled water was
added (30 ml), and the solution was titrated with 0.012 N sodium thiosulfate until the
yellow color almost disappeared. Starch indicator (0.5 ml) was added and the titration was
continued until the blue color disappeared. The peroxide value was expressed in meq
peroxide per kg sample using this formula: (ml of sample x N sodium thiosulfate x 1,000)
divided by sample wt (g).
Free fatty acids
Free fatty acid values were analyzed using AOCS Official Methods (Ca 5a-40;
1998). Hot neutralized alcohol and 2ml of phenolphthalein was added to 28.2 g sample.
The solution was titrated with standardized sodium hydroxide, shaking until the first
permanent pink color of the same intensity as that of the neutralized alcohol. The color
had to persist for 30 seconds. Free fatty acid values were expressed as %o oleic, using this
calculation: (ml of alkali x N of NaOH x 28.2) divided by sample wt (g).
52

P-Anisidine value
p-Anisidine values were analyzed using AOCS Official Methods (Cd 18-90; 1998).
Approximately 0.5-4 g of oil was weighed into a 25 ml volumetric flask. The sample was
dissolved and diluted to volume with isooctane. The absorbance of the solution at 350 nm
was measured in a cuvette with the spectrophotometer, using the reference cuvette filled
with the solvent as a blank. Exactly 5 ml of the fat solution was pippetted into one test
tube and exactly 5 ml of solvent into a second test tube. By means of an automatic pipet,
exactly 1 ml of the p-anisidine reagent was added to each tube, and shaken. After exactly
10 min, the absorbance of the solvent was measured in a cuvette at 350 nm, using the
solution from the second test tube as a blank in the reference cuvette. The p-anisidine (p-
AV) value is given by the formula:
p-AV = 25x(1.2As-Ab) m
where As = absorbance of the fat solution after reaction with the p-anisidine
reagent; Ab = absorbance of the fat solution, m = mass of the test portion in grams.
Fatty acid profile of the oil
Fatty acid profiles on the oil samples were analyzed by Texas A&M Agricultural
Research and Extension Center. The methylation procedure is as follows:
The methylation mix consisted of 29.1 ml of 14% BF3 in MeOH (Borontriflouride in
Methanol), 20.0 ml of Toluene and 50.9 ml of MeOH (Methanol). One drop of oil was
added to a labeled Pierce Reactivial. Approximately 1.5 ml of methylation mixture was
53
added. The vial was sealed with a lid and septum and block heated at 100°C for 30
minutes (vials were shaken at the 15 minute point). Vials were allowed to cool and
approximately 1.5 ml of distilled water was added to the vials. This solution was decanted
into large labeled test tubes. The solution was extracted twice with 1.5 ml of Hexane (each
extraction was vortexed and top layer was pipetted off into small labeled test tubes). The
extractant was dried under Nitrogen gas. Residue was dissolved with 1.0 ml of
Chloroform and decanted into labeled vials. One micrometer was injected into the Hewlet
Packard Gas Chromatagraph. Gas Chromatography specifications are as follows:
Column: Supelco Supelcowax 10, 30 m x 0.53 mm, 0.50 ®m Film; Flow Rates: Helium:
22.4 ml/min. Hydrogen: 22.36 nJ/min, Air: 448.6 ml/min. Septum Purge: 4.17 nrd/min,
SpUt Vent: 70.6 ml/min. Split Ratio: 4.17; Injector Temperature: 200°C; Flame Ionization
Detector Temperature: 250°C; Oven Temperature Program: Initial 210°C, Final 240°C,
Rate of increase 4°C degrees/min; Auto Sampler: Rinse 3x hexanes. Rinse 2x chloroform,
Rinse 2x sample. Pump syringe 4x to remove bubbles. Inject I ml solution.
Fatty acid profile of the french fries, trans fatty acids and total polar materials
Fatty acid profiles of the french fiies, trans fatty acid content of the french fiies and
oil, and total polar material content of the french fries were analyzed by Analytical Food
Laboratories, 865 Greenview Drive, Grand Prairie, Texas 75050-2439, 1 (800) 242-6494.
54
Statistical analyses
A randomized block design with split-plot was used to analyze the data collected.
The tank effect was blocked out in the statistical design. The split-plot was time in days
(days 1-5). The dependant variables were weight of the french fiies, oil loss, color of the
oil, color of the french fiies, and the results of the laboratory analyses. Least Square
Differences (LSD) was used as the means separation tests. Least square means were used
instead of sample means to account for missing data in the data set. Standard error was
used to show sampling distribution, which is the standard deviation of the population
being sampled.
55
CHAPTER IV
RESULTS AND DISCUSSION
Oil loss
Oil loss was calculated by measuring the difference between the oil amount in the
tank prior to fiying and the oil left in the tank after fiying (units used were kilograms).
This calculation was done at the beginning of each day by weighing the oil prior to adding
it to the fiying tanks, and reweighing the oil after fiying. ANOVA was conducted on the
independent variables oil type, tank, day, oil type*day, and oil type'''day*tank. There were
no interactions between oil type*day and oil type*day*tank so only the main effects will
be described. LSD was used as a mean separation test. There was no statistical effect of
oil type on oil loss. Statistical differences (p<0.05) were found for days of fiying on oU
loss (Figure 3). Oil loss was greatest on day 1, with only slight differences on days 2-5.
French fry cooking loss
French fiy cooking loss was calculated as the difference between frozen french fiy
weight (approximately 2 kg) prior to frying and french fry weight after fiying (allowing a 2
minute drain time). ANOVA was conducted on the dependent variables oil type, tank, day,
oil type*day, oil type*tank, tank*day and oil type'^day*tank. LSD was used to separate
differences among means. There was an oil type*tank interaction. There was no significant
effect of oil type on french fiy cooking loss. However, there was a difference in cooking
loss for tank and day.
56

a
b | — :, b . 1
3
Days
Figure 3. Oil loss for cottonseed oil, canola oil, and soybean oil (combined) on days 1-5.
57
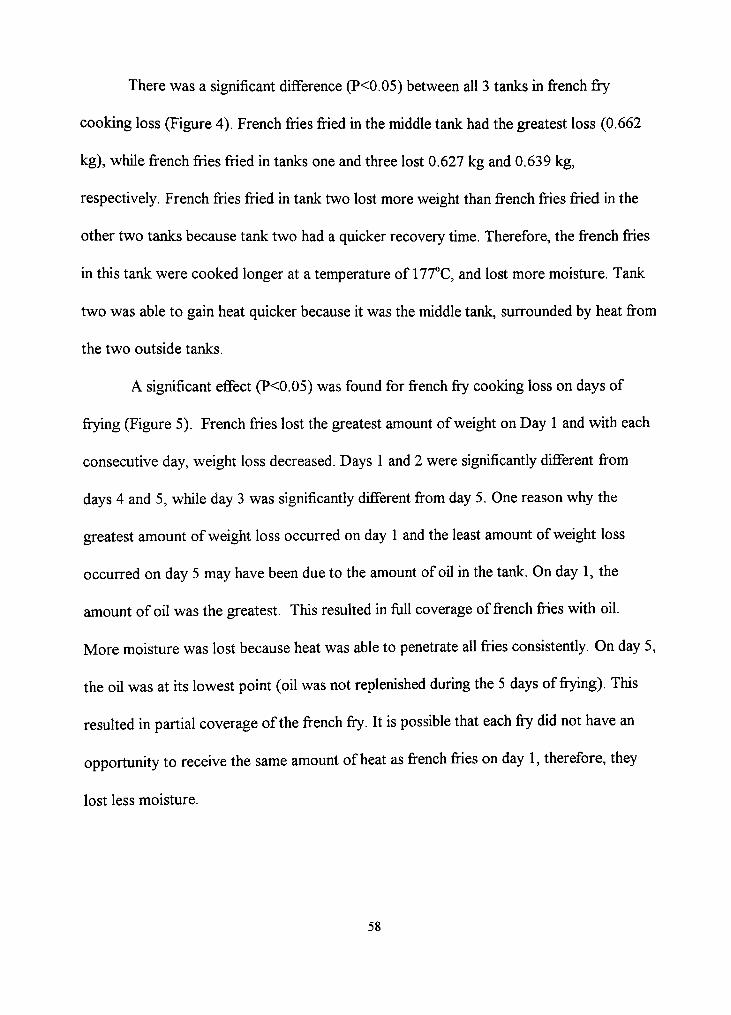
There was a significant difference (P<0.05) between all 3 tanks in french fiy
cooking loss (Figure 4). French fiies fried in the middle tank had the greatest loss (0.662
kg), while french fries fried in tanks one and three lost 0.627 kg and 0.639 kg,
respectively. French fries fried in tank two lost more weight than french fries fiied in the
other two tanks because tank two had a quicker recovery time. Therefore, the french fiies
in this tank were cooked longer at a temperature of 177''C, and lost more moisture. Tank
two was able to gain heat quicker because it was the middle tank, surrounded by heat from
the two outside tanks.
A significant effect (P<0.05) was found for french fiy cooking loss on days of
fiying (Figure 5). French fiies lost the greatest amount of weight on Day I and with each
consecutive day, weight loss decreased. Days I and 2 were significantly different from
days 4 and 5, while day 3 was significantly different from day 5. One reason why the
greatest amount of weight loss occurred on day 1 and the least amount of weight loss
occurred on day 5 may have been due to the amount of oil in the tank. On day I, the
amount of oil was the greatest. This resuhed in flill coverage of french fiies with oil.
More moisture was lost because heat was able to penetrate all fries consistently. On day 5,
the oil was at its lowest point (oil was not replenished during the 5 days of fiying). This
resulted in partial coverage of the french fiy. It is possible that each fiy did not have an
opportunity to receive the same amount of heat as french fiies on day 1, therefore, they
lost less moisture.
58
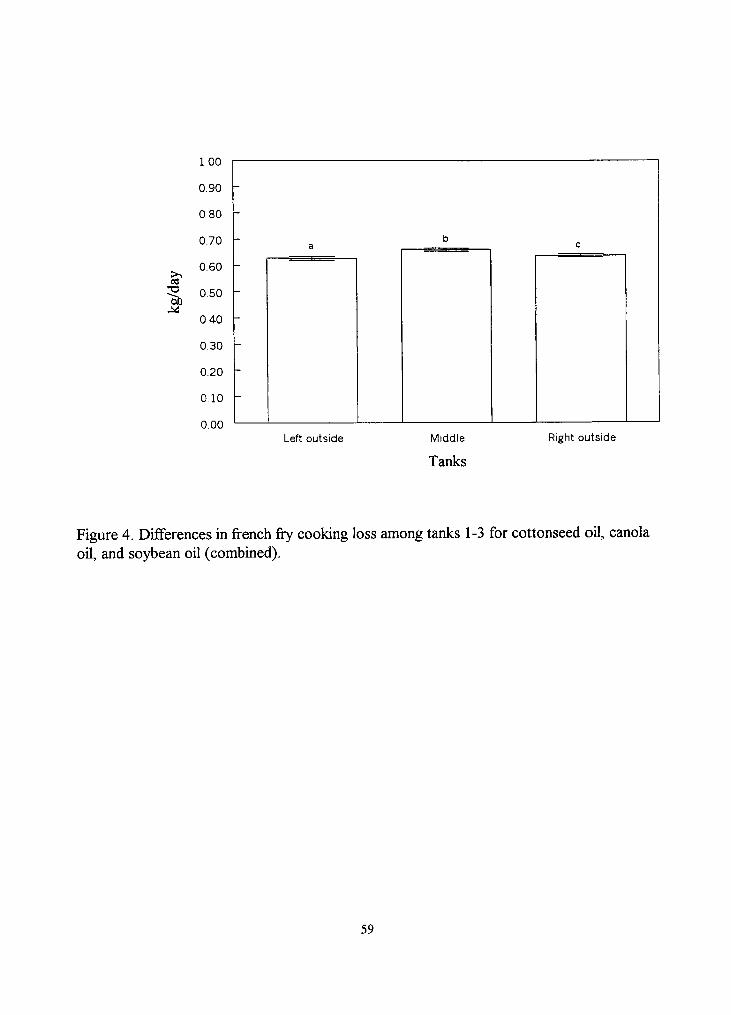
-a
1 uu
0.90
0 80
0.70
0.60
0.50
0 40
0.30
0.20
0.10
-
-
-
-
-
-
0.00
a b
c
Left outside Middle Right outside
Tanks
Figure 4. Differences in french fiy cooking loss among tanks 1-3 for cottonseed oil, canola oil, and soybean oil (combined).
59
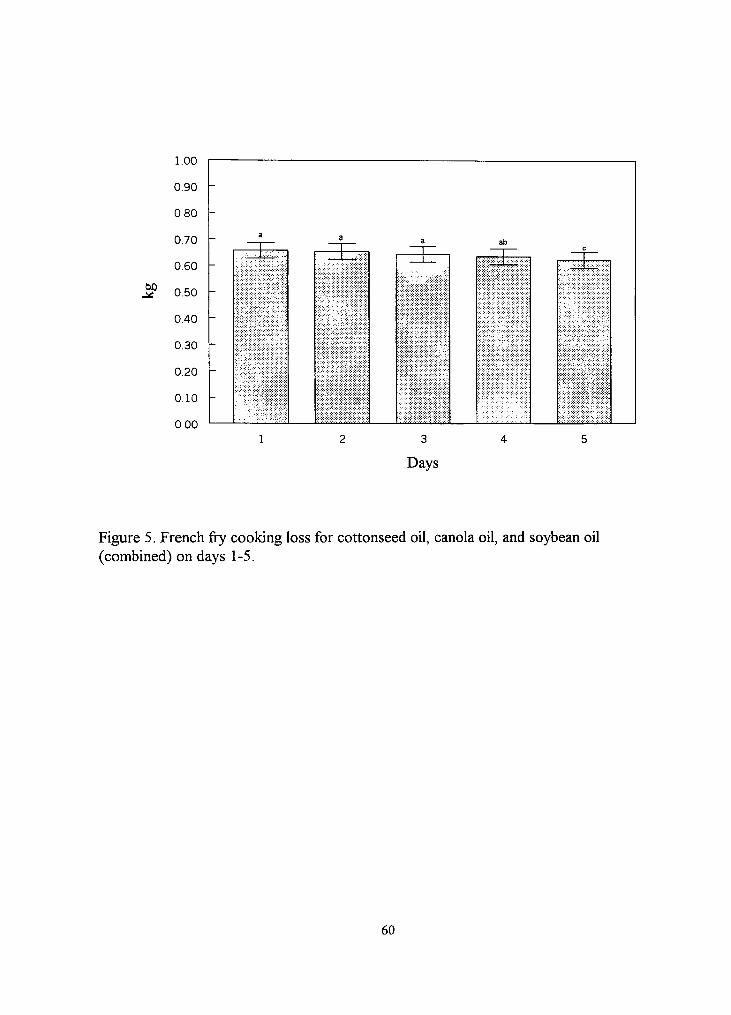
l.UU
0.90
0 80
0.70
0.60
0.50
0.40
0.30
0.20
0.10
-
-
-
-
-
-
-
-
a a
IJIIIII
a ab c
:;::;diiii
u.uu 1 2 3 4 5
Days
Figure 5. French fiy cooking loss for cottonseed oil, canola oil, and soybean oil (combined) on days 1-5.
60

Color analysis
ANOVA (p<0.05) was conducted on the independent variables oil type, tank, day,
oil type*day, oil type*tank, tank*day and oil type*day''=tank to determine any statistical
differences in the L*, a*, b* values for oil. LSD was used for mean separations.
For the value "L", there were no significant effects of oil type, tank, and day.
There were no interactions. The mean "L" value for cottonseed oil was 27.45, for canola
oil 22.79, and soybean oil 27.92.
There were no significant effects of any of the variables on hue. The mean hue
value for cottonseed oil was 61.82 degrees, for canola oil 61.61 degrees, and for soybean
oil 60.96 degrees. There was a significant difference among all oil types for chroma. The
mean chroma value for cottonseed oil, canola oil and soybean oil was 5.62, 3.06, and 4.61,
respectively. This indicates that cottonseed oil had the most vivid color, while canola oil
had the dullest color, while soybean oil was intermediate. There were no significant effects
of days of fiying on chroma. However, as the days progressed chroma changed linearly
from 3.87 on day 1 to 4.75 on day 5.
The color of the french fries was also statistically tested using L*a'^b* values. No
statistical differences were found for L* values on the french fries cooked in the three oils.
There were no effects of days of fiying or the tanks that the french fries were cooked in
and no interactions were found. The average L* value pooled for all oil types was 63.49.
Oil type and days of fiying had no significant effect on hue. However, there was a
significant difference in hue between the tanks. The mean hue value for tank 1, 2, and 3
was 90.45 degrees, 88.46 degrees and 89.41 degrees, respectively.
61
Oil type and days of fiying had no significant effect on chroma. However, like hue,
there was a significant difference between tanks. The mean chroma value for tank 1, 2,
and 3 was 21.38, 22.99 and 22.61, respectively.
Lab analyses
ANOVA was used to determine if there were any differences between oil types for
peroxide value, iodine value, free fatty acids, and p-anisidine value. LSD was used for
mean separation.
Peroxide value
The peroxide value of cottonseed oil was significantly different from the peroxide
values of canola oil and soybean oil (Figure 6). Peroxide values cited from the literature in
fresh oil should be < 1.0 meq/kg/d. All fresh samples were close to this recommended
value, however, cottonseed oil had an initially higher peroxide value (1.08 meq/kg) as
compared to canola oil (0.60 meq/kg) and soybean oil (0.42 meq/kg) (p<0.05). Peroxide
values were higher for cottonseed oil on each day than for canola oil and soybean oil. This
may have been due to the higher initial value of fresh cottonseed oil. Peroxide values
reflect the initial degradation of unsaturated fatty acid bonds into hydroperoxides. The
measurement of peroxide values may be deceptive in polyunsaturated fatty acid (PUFA)-
rich oils. A study by Tyagi and Vasishtha (1996) found that oils that contained less trienes
had less of a tendency to decompose and polymerize. Fresh, unhydrogenated cottonseed.
62
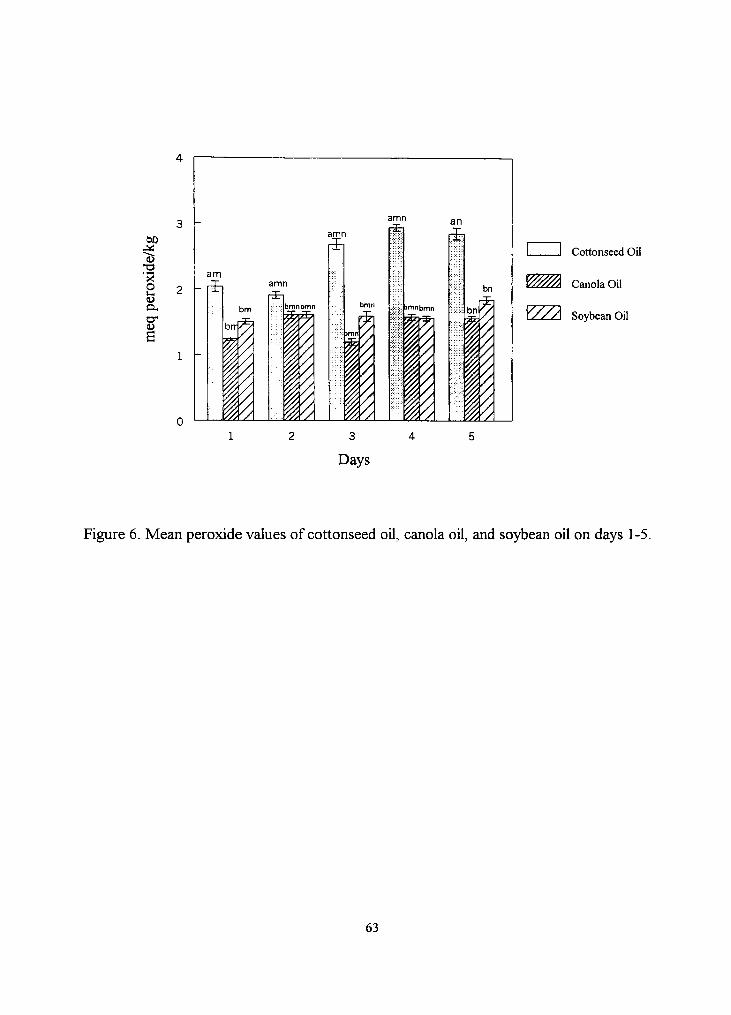
00
-o •S o u, (U O H
cr u S
amn
am
bm
fc 1 I I I
bn
%.
Cottonseed Oil
Canola Oil
y/yA Soybean Oil
3
Days
Figure 6. Mean peroxide values of cottonseed oil, canola oil, and soybean oil on days 1-5.
63
canola and soybean oil contain 54%, 32%o and 62% of PUFA. Both the canola and
soybean oil used in this study were hydrogenated, thus greatly decreasing the amount of
PUFA in the oils.
Furthermore, peroxide values for all three oils were consistently low, indicating
very little oxidation was occurring. Studies using soybean oil indicate that peroxide levels
ranging from 1.0-5.0 meq/kg signify low oxidation; 5.0-10.0 meq/kg signify moderate
oxidation; and 10.0 meq/kg and above signify high levels of oxidation (AOCS 1998). The
highest peroxide value was 2.94 meq/kg for cottonseed oil, which is still considered low
oxidation levels. None of the three oils in this study surpassed initial oxidative changes
according to the peroxide value levels. Peroxide values on day 1 were significantly
different from values on day 5. Peroxide values for day 1 for cottonseed oil, canola oil and
soybean oil were 2.04 meq/kg, 1.24 meq/kg and 1.51 meq/kg, respectively. There were no
interactions in this data set.
Iodine value
Iodine values cited in the literature for fresh cottonseed, canola and soybean oil
range from 99-119, 110-126 and 120-143 g of halogen/100 g of fat, respectively. Iodine
values obtained from fresh cottonseed, canola and soybean oil in this study were 113.36,
91.92 and 103.82 g of halogen/100 g of fat, respectively. The value for fresh cottonseed
oil fell within the range cited in the literature. Since both canola oil and soybean oil were
hydrogenated, it is expected that the iodine values would be lower than the literature
64
values, as was found. Iodine values for used cottonseed oil, canola oil, and soybean oil
were all significantly different as expected. Time had no statistical effect on iodine value.
It was expected that there would be a progressive decrease in unsaturation as days
of fiying increased. There may be two reasons to explain why the iodine value remained
stable as fiying days increased. All three oils contained antioxidants (TBHQ and citric
acid), which may have protected the oil against oxidation. In addition, 40 hours of heating
and fiying may not have caused enough stress for oxidative changes to occur.
Oil was fiied in separate tanks adjacent to each other (Figure 7). The iodine value
for tank 2 was significantly different from tank 3. In addition, there was a significant
interaction between tanks and oil type. This indicates that the oil may have acted
differently depending upon which tank it was in during fiying.
Free fatty acids
Free fatty acid (FFA) values for cottonseed, canola and soybean oil were not
significantly different. Initial free fatty acid values cited from the literature should be
<0.05-0.1% oleic acid. All fresh oils fell within this range (0.045%) oleic). Days 4 and 5
were significantly different from days 1, 2 and 3. As expected, free fatty acid values
increased toward the end of the fiying period (Figure 8). FFA values on day 1 were
0.079%, and on day 5, values increased to 0.256%. According to Fritsch (1981) FFA
values of up to 2%), did not adversely affect the odor or the flavor of foods. The practice
of using FFA as a measurement of oxidative stability is controversial. Because the
determination of FFA by titration does not distinguish between FFA formed from
65

200
O O
"^ u (50 o
X 00
100
Left outside Middle
Tanks
Right outside
Cottonseed Oil
Canola Oil
yyXA Soybean Oil
Figure 7. Mean iodine values of cottonseed oil, canola oil, and soybean oil in tanks 1-3.
66
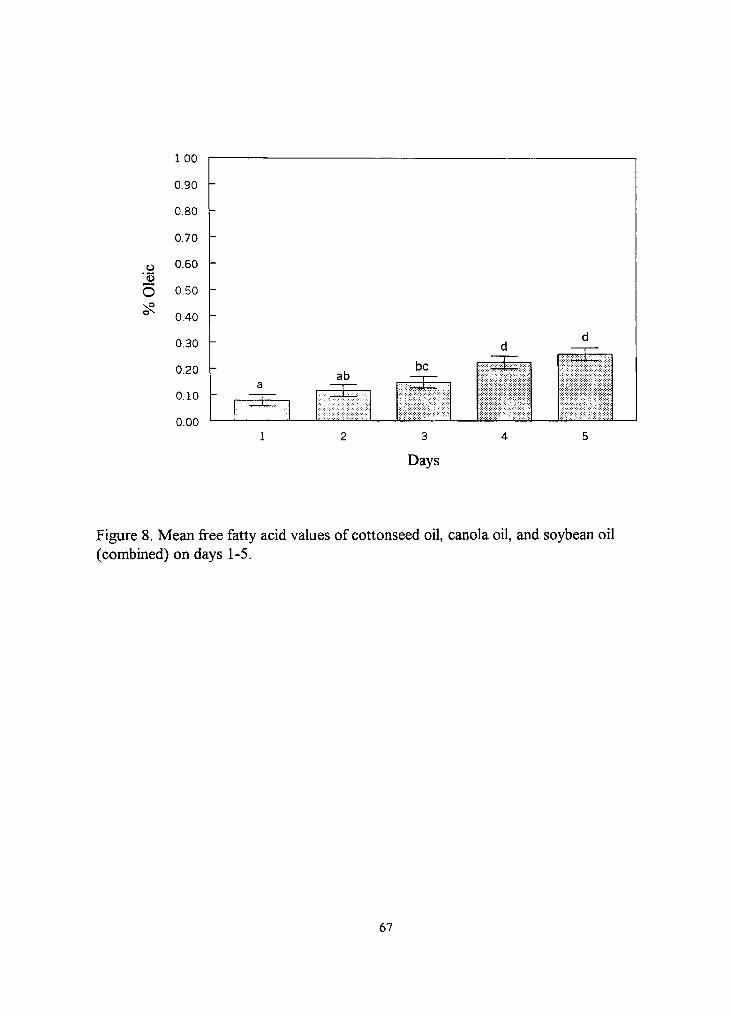
o
O
1.00
0.90 h
0.80
0.70
0.60
0.50
0.40
0.30
0.20
0.10
0.00
d
ab a 1 1
1 . . : | : . : : . . . . • ;
be 1
....! ..
1
d 1 1
3
Days
Figure 8. Mean free fatty acid values of cottonseed oil, canola oil, and soybean oil (combined) on days 1-5.
67
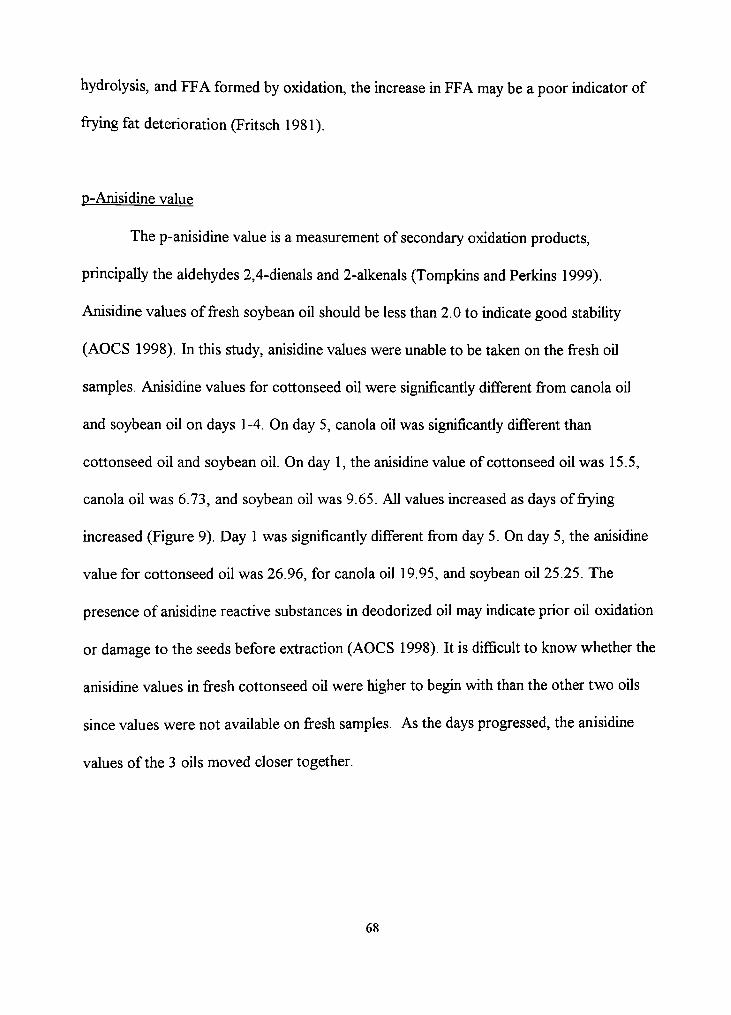
hydrolysis, and FFA formed by oxidation, the increase in FFA may be a poor indicator of
fiying fat deterioration (Fritsch 1981).
p-Anisidine value
The p-anisidine value is a measurement of secondary oxidation products,
principally the aldehydes 2,4-dienals and 2-alkenals (Tompkins and Perkins 1999).
Anisidine values of fresh soybean oil should be less than 2.0 to indicate good stability
(AOCS 1998). In this study, anisidine values were unable to be taken on the fresh oil
samples. Anisidine values for cottonseed oil were significantly different from canola oil
and soybean oil on days 1-4. On day 5, canola oil was significantly different than
cottonseed oil and soybean oil. On day 1, the anisidine value of cottonseed oil was 15.5,
canola oil was 6.73, and soybean oil was 9.65. All values increased as days of fiying
increased (Figure 9). Day 1 was significantly different from day 5. On day 5, the anisidine
value for cottonseed oil was 26.96, for canola oil 19.95, and soybean oil 25.25. The
presence of anisidine reactive substances in deodorized oil may indicate prior oil oxidation
or damage to the seeds before extraction (AOCS 1998). It is difficult to know whether the
anisidine values in fresh cottonseed oil were higher to begin with than the other two oils
since values were not available on fresh samples. As the days progressed, the anisidine
values of the 3 oils moved closer together.
68
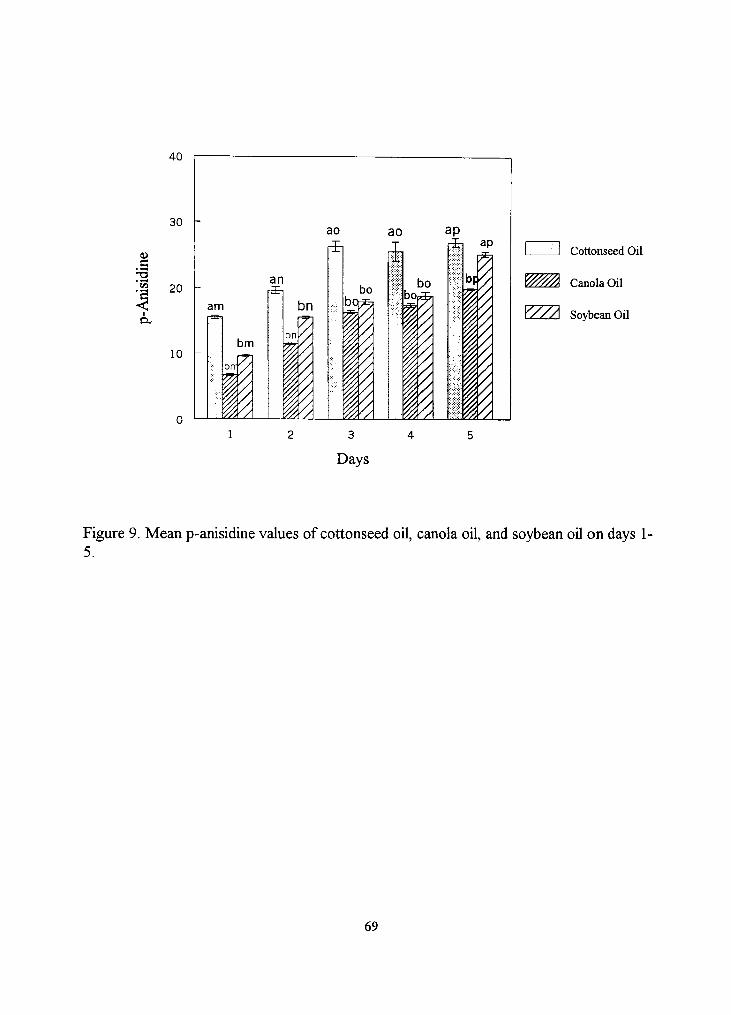
Cottonseed Oil
Canola Oil
Y//A Soybean Oil
Figure 9. Mean p-anisidine values of cottonseed oil, canola oil, and soybean oil on days 1-5.
69
Rivera-Acosta (1999) fried 9 batches of french fries, 6 hours/day in cottonseed oil and
canola oil (Extend). Para-anisidine values were taken on the fresh oil, and every day for 10
days. Para-anisidine values increased dramatically for cottonseed oil after one day of
fiying, from a mean of 4.93 for fresh oil, to 42.0 on day 1. Canola oil values were 2.60 for
fresh oil, and 12.9 on day 1. Values for cottonseed oil were inconsistent for the first 6
days, but stabilized after day 8 at 38.2. The value on day 10 was 38.1. Canola oil had
lower values until day 5. Statistically significant differences were found between oils
beginning with fresh oil and continuing through day 5. After day 6 of fiying, both oils
maintained close values up to the end of the fiying period on day 10. This study found
similar results as the Rivera-Acosta study for the first 5 days of fiying. Cottonseed oil had
a rapid increase in ansidine values up until day 3, and values started to level off on days 4
and 5. As fiying days increased, soybean oil values became closer to cottonseed oil, while
canola oil values consistently trended upwards (Figure 10). Linoleic acid is the
predominant fatty acid in cottonseed oil and decomposes quickly into secondary oxidation
products. Pentanals and hexanals (aldehydes) were the main volatiles found in the
headspace of cottonseed oil (Jones and King 1996). High levels of pentanals and hexanals
were not associated with reductions in flavor scores (Jones and King 1996).
Totox value
The use of peroxide analysis and p-anisidine analysis together gives a more
complete picture of total oxidation than each test separately (AOCS 1998). The equation
70
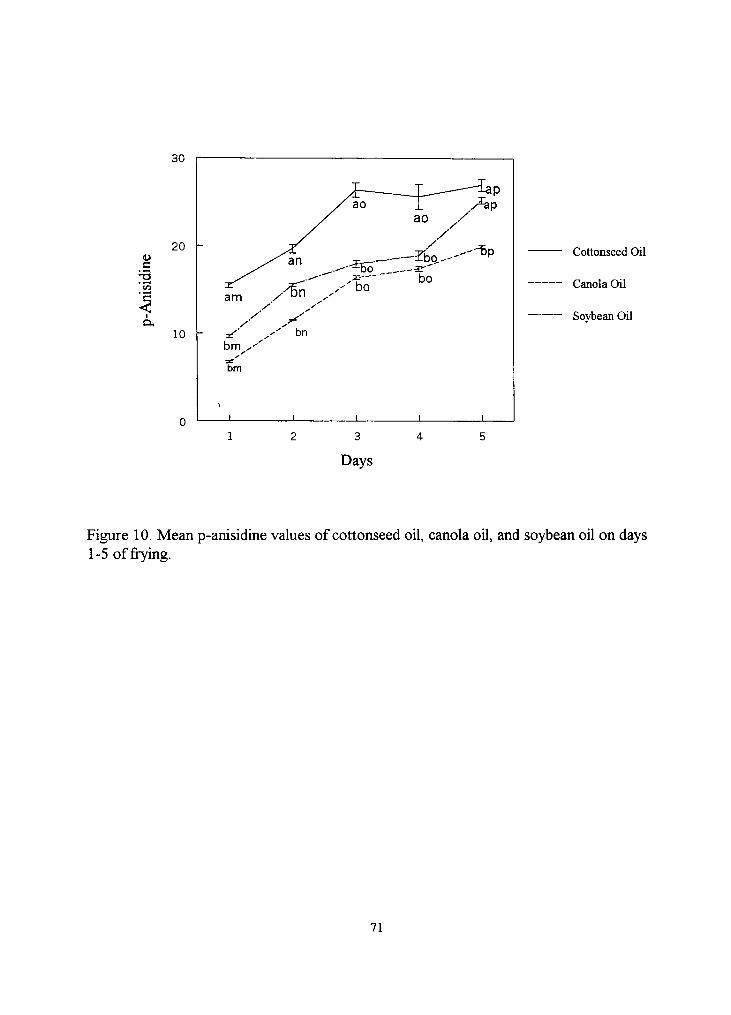
30
20 c
10
y / ao J -_^ ^ ^ P
./^P y / ao ./
y /
y ^ .-Svr ^ b ^ " ' " ^ ' '
am / °'i ^-'
y y - ^ y bn bm ^'^
•
^ =! bm
1 1 1
bo
1
Cottonseed Oil
Canola Oil
Soybean Oil
3
Days
Figure 10. Mean p-anisidine values of cottonseed oil, canola oil, and soybean oil on days 1-5 of fiying.
71
for the totox value is anisidine value + 2 (peroxide value). Since peroxide value measures
hydroperoxides (which increase and decrease) and anisidine value measures aldehydes
(decay products of hydroperoxides which continually increase), the totox value usually
rises continually during the course of Hpid oxidation (Nielson 1998). The totox value for
fresh soybean oil should be less than 4.0 to indicate good stability (AOCS 1998).
The totox values for cottonseed oil were significantiy different from those of canola oil
and soybean oil. Days I, 2 and 5 were significantly different. Totox values on day 1 for
cottonseed, canola and soybean oil were 18.58, 9.41 and 12.49, respectively (Figure II).
Totox values on day 5 for cottonseed oil, canola oil and soybean oil were 32.28, 23.39
and 29.13, respectively. For this particular test, the data indicates that cottonseed oil had
greater amounts of primary and secondary oxidative products than the other two oils.
However, since peroxide values declined as days of fiying increased and anisidine values
leveled off after 5 days of frying for cottonseed oil, this test may not be tmly indicative of
oil degradation for this study. More days of fiying and temperature abuse would need to
be conducted to accurately determine oil quality.
Total polar materials
Total polar materials (TPM) are considered the "gold standard" for measuring oil
degradation. Oil usually starts out with 95% of its composition as triglycerides, and ends
up upon discard with only 75%) of its composition consisting of triglyceride (Blumenthal
1991). Prior to, or at the point in which food service establishments discard their oil,
TPM make up approximately 25% of the oil composition (Blumenthal 1991). TPM were
72
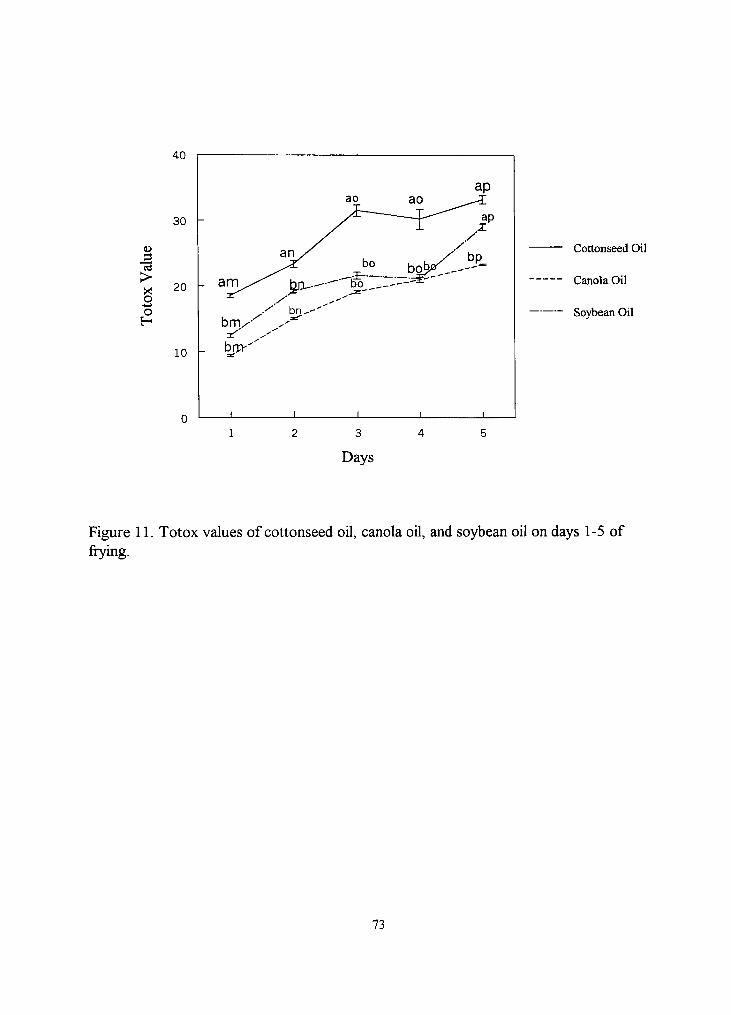
> X o o
40
30
20 -
10
-
_ a r n ^ ^
a n /
^0 "
ao
bo
-fj-r-/ • , ^ - ' '
/ bn^ ' - ' bm/-^
iT" ^^
brP'"''' =tf
1
y^i"
^
1 1
30
b o ^
1
ap
ap X
/ bt3_
1
Cottonseed Oil
Canola Oil
Soybean Oil
3
Days
Figure II. Totox values of cottonseed oil, canola oil, and soybean oil on days 1-5 of fiying.
73

tested on the oil extracted from the raw and cooked french fries. Oil extracted from food
contains more polymers than the oil left in the fiyer (Pokomy 1980). There was no
significant effect of oil type and days of frying on TPM. The average TPM was 22.40%.
Since TPM are higher in the food product, and oil is discarded at 25%o TPM, this indicates
that the oil left in the fiyer was not close to reaching the degradation point at which oil
must be discarded. The TPM for the raw pre-fiied french fries was on average 27.6%).
However, only 3 samples were tested and the range was 18.1-41.7%). It was very difficult
to extract enough fat from the raw french fries to obtain reproducible resuhs. TPM were
not performed on the oil itself.
Fat and moisture content
A significant amount of moisture was lost in the french fries during the deep-fat
fiying process. This was to be expected since fiying is actually a drying process. There
was no significant effect of oil type, days of frying (days 1, 3 and 5 were tested) or tank on
moisture content. The average moisture content of the raw french fiies was 70%), while
the average moisture content of the cooked french fries was 5I%o. Similar resuhs were
found in the study done by Filary (1999) at Texas Woman's University. Significant effects
were found for both tank and days of fiying on the actual weight of the french fiies (before
and after fiying) as discussed above. Weighing the french fiies is not as precise as
quantitatively measuring the moisture in the french fries. There may have been more ice
crystals on some of the raw french fries than others, increasing the variability of
measurements. In this case, more moisture would have been lost as vapor rather than
74
trapped within the french fiy. Vapor loss was highest in the middle tank and decreased
with increasing days, which attributed to the decreasing oil level.
There were no significant differences in percent fat content of the french fiies for
cottonseed, canola and soybean oil at any day of the frying process. The initial fat content
of raw french fries was 4.1%. The average fat content of cooked french fries was 11.4%.
This confirms the resuhs found by Filary (1999). Oil absorption is affected by many
factors. As oil deteriorates, oil absorption increases as reported by Blumenthal (1997). In
this study, the oil did not reach high enough levels of degradation for this to be seen.
Frozen french fries absorb less oil than thawed french fries. This factor was carefijUy
controlled. The french fries were immediately immersed in the oil after being removed
from the freezer and were not allowed to thaw. Variation in the french fiies can affect oil
absorption. Attempts were taken to minimize this effect by analyzing blended, random
samples of the french fiies. In food-service establishment, french fiy shaking and drain
time can account for a large percentage of the variation seen in oil absorption. In this
study, french fries were not shaken, and were allowed to drain for exactly 2 minutes.
Fatty acid composition of the fiying oils
The fatty acids analyzed in this study were palmitic, stearic, oleic, linoleic and
linolenic. Figures 12, 13 and 14 show the fatty acid profile of cottonseed, canola and
soybean oil, respectively. The fatty acid composition of fiying oils wiU continually change
as days of fiying progresses. These changes resuh from cyclization, polymerization, and
pyrolytic, hydrolytic, oxidative and other chemical reactions promoted by fiying conditions
75
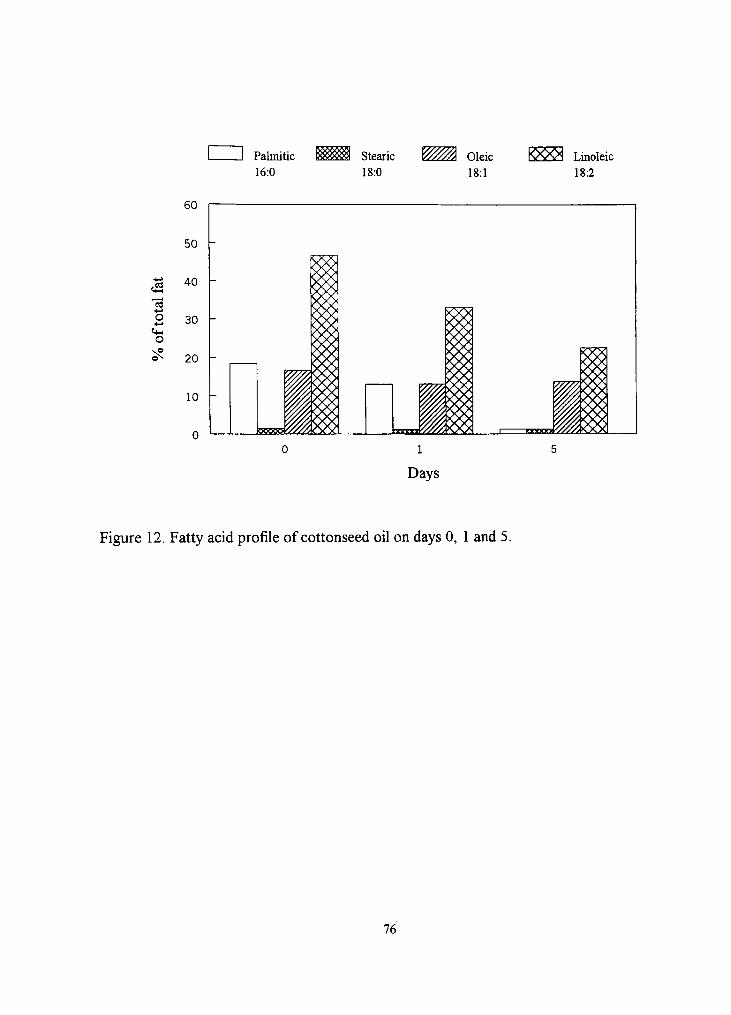
Palmitic 16:0
Stearic 18:0
Oleic rOvV^ Linoleic 18:1 18:2
Figure 12. Fatty acid profile of cottonseed oil on days 0, I and 5.
76

Palmitic 16:0
Stearic 18:0
Oleic 18:1
KXA«>^ Linoleic
18:2
40
30
"3 2 20 o
10
1
Days
Figure 13. Fatty acid profile of canola oil on days 0, 1 and 5.
77
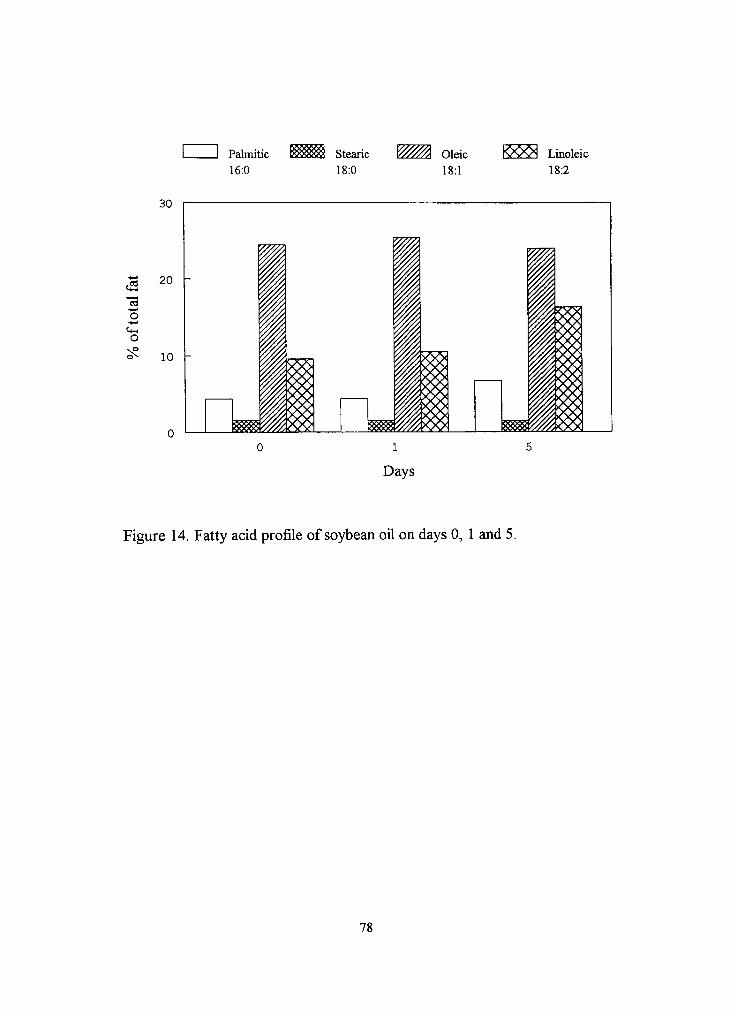
Palmitic 16:0
^ ^ Stearic 18:0
V////A OLir, 18:1
rwvH Linoleic 18:2
30
20 -
"3 o +->
o ^ 10
0 1
Days
Figure 14. Fatty acid profile of soybean oil on days 0, 1 and 5.
78

(Xu et al. 1999). In addition, the oil from the french fries will leach into the frying oil,
affecting the fatty acid profile as well.
It can be predicted from the initial fatty acid profile how oil will perform when
subjected to deep-fat frying conditions. Oil that has the highest linolenic acid content will
be more susceptible to degradation. Reducing the linolenic acid content will increase the
oxidative stabihty of the fiying oil (Warner and Mounts 1993).
Based on the mean of the combined trials (Table 15, Appendk A), the linolenic
acid content of the three fresh oils was very low. Cottonseed oil naturally has very low
levels of linolenic acid, while the hydrogenated canola oil in this study had 0.20%o linolenic
acid, and hydrogenated soybean oil had 0.64% linolenic acid. In both of the hydrogenated
oils on day 1, linolenic acid decreased by 45%) in canola oil and 7%) in soybean oil. By
fiying day 5, Unolenic acid was decreased by 87%) in canola oil and 90%) in soybean oil.
As expected, linoleic acid was the predominate PUFA in all of the oils, with
cottonseed oil having the highest concentration (47%). In the literature, hnoleic acid in
cottonseed oil ranges from 33-58%). Hydrogenated canola oil and hydrogenated soybean
oil contained 6%o and 10% linoleic acid, respectively. Linoleic acid level in deep-fat fiying
oil does not appear to be a noticeably negative factor in oil stability and sensory scores of
the fiied food (Xu et al. 1999). In fact, the presence of some degradation products from
linoleic acid enhances the deep-fat fried flavor of foods. Linoleic acid decreased in
cottonseed oil by 41% on day 1 and 108%) on day 5. Linoleic acid contents of both canola
and soybean oil actually increased by 10%o and 9%, respectively, on day I. By day 5,
79
linoleic acid decreased by S%. For soybean oil, the linoleic acid content continued to
increase and was 41%o higher by day 5.
Oleic acid content was more stable in the three oils than was linoleic acid. Oleic
acid is a mono-unsaturated fatty acid. As level of unsaturation increases, break down
increases at a faster rate. This can be attributed to the destmction of double bonds by
oxidation, scission, and polymerization (Tyagi and Vasishtha 1996). On day 0
(fresh/unused) the oleic acid content of cottonseed oil, canola oil and soybean oil was
17%o, 35%) and 25%), respectively. On days 1 and 5, the oleic acid content of cottonseed
oil and soybean oil remained very stable, only changing by 1 and 4%o, respectively. Oleic
acid in canola oil remained constant on day 1, and decreased by 24%o on day 5. In soybean
oil, oleic acid remained very constant, varying from 24%)-25%).
Palmitic acid was the predominant saturated fatty acid in the three oils. Studies
have shown, as frying time increases, the saturated fat content of oil will increase.
Contrary to what was expected, the saturated fat content of cottonseed oil actually
decreased, from 18% on day 0, to 13% on day 1 (41%) decrease), to 10%) on day 5 (92%
decrease). There were only minor changes in the palmitic acid content of canola oil. Only a
5 and S% increase was found in palmitic acid content of canola oil on days 1 and 5.
Soybean oil followed typical patterns of fiying oil in relation to the saturated fat content.
The palmitic acid content in fresh soybean oil was 4%, with only a slight 1%) increase on
day I. However, by frying day 5, palmitic acid increased by 36%) (7%)).
Stearic acid concentration was less than 2% in all three fresh oil and remained that
way through day 5. Overall, the fatty acid profile of the three oils did not follow the
80
expected results documented in the literature. As oil degrades, there is an increase in
saturated fatty acids and a decrease in unsaturated fatty acids, which is attributed to the
breakdown of mono- and polyunsaturated fatty acids. In order to have produced this resuh
in the current study, the oils would have needed to be subjected to more stress.
The french fiies used in this study were par-fried in beef tallow and/or vegetable oil
(partially hydrogenated soybean and/or canola oil). This is a common practice of frozen
potato producers for three reasons. First, it decreases final french fiy cooking time.
Secondly, the french fiy will cook evenly, without excessive browning on the outside and
undercooking on the inside. Lastly, there will be less splattering of oil during the final
cooking of the french fiy. To clearly show changes within the oil itself, the french fiy
would have needed to be par-fried (or precooked) in water. This would eliminate oil
contamination from the french fiy.
Fatty acid composition of the french fries
Fat absorption by the french fries remained constant as days of frying increased.
The fat content of the raw french fiy was 4.1%), while the cooked french fries were an
average of 11.4%). This suggests that 64%) of the fat content came from the fiying oil. This
is more complex than it sounds, because some of the oil in the french fiies may have
leached out into the frying oil during the deep fat fiying process, in addition to absorbing
fiying oil.
The fatty acid profile of the raw french fries are as follows: palmitic 15%o, stearic
12%), oleic 19%), linoleic 3% and linolenic 0.3%. Figures 15, 16 and 17 show the fatty acid
81
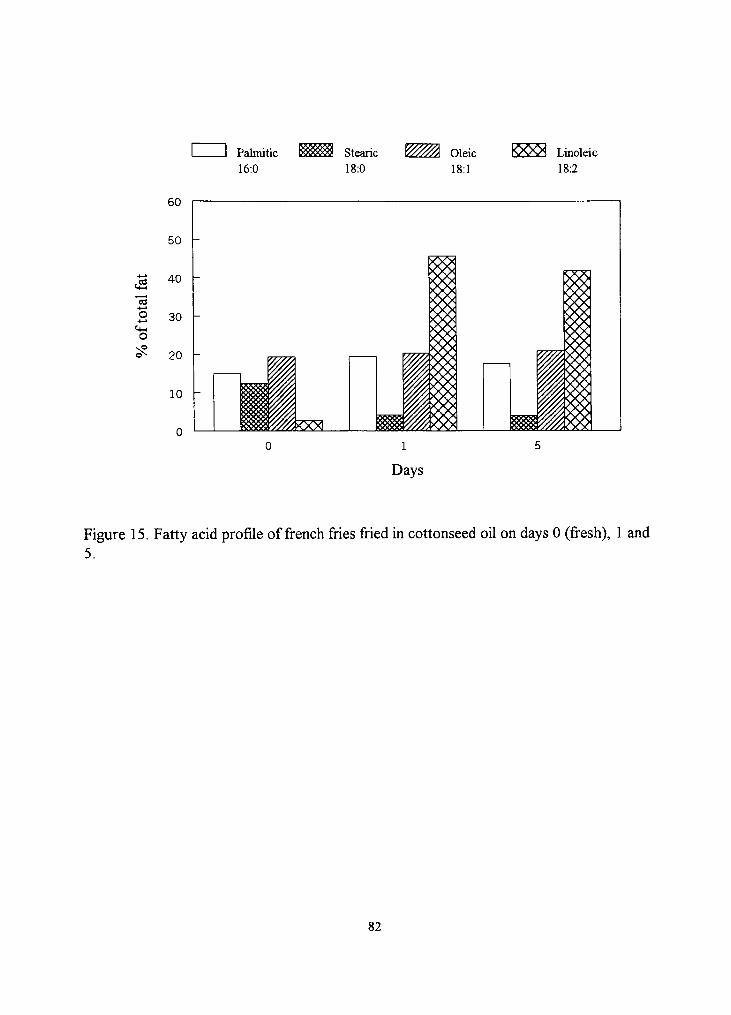
J Palmitic 16:0
Stearic K: %^ Oleic KXX I Linoleic 18:0 18:1 18:2
,<^ C3
B 30 o
Figure 15. Fatty acid profile of french fries fried in cottonseed oil on days 0 (fresh), 1 and 5.
82
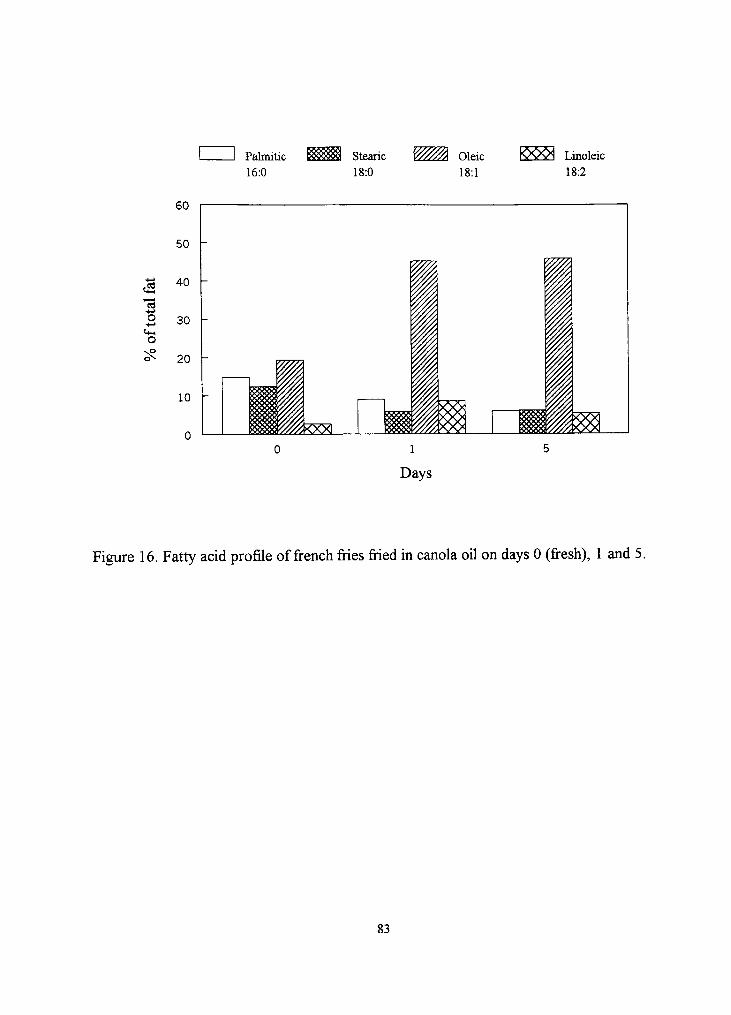
Palmitic 16:0
Stearic 18:0
Oleic IvVvH Linoleic 18:1 18:2
Figure 16. Fatty acid profile of french fries fried in canola oil on days 0 (fresh), 1 and 5.
83
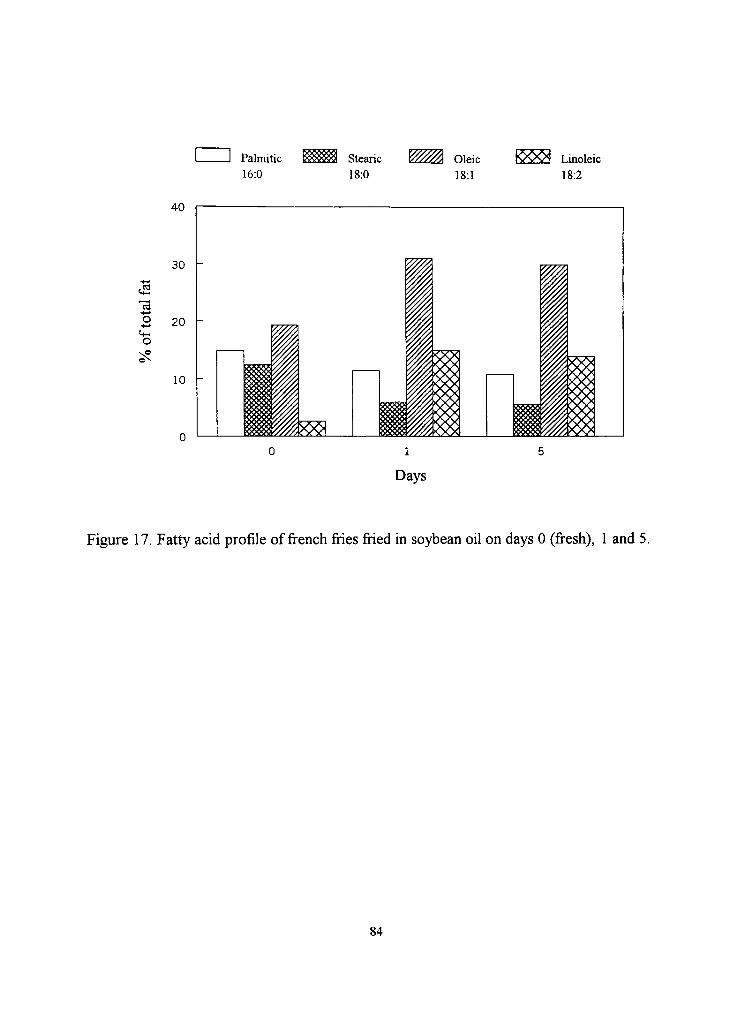
J Palmitic 16:0
Stearic 18:0
Oleic KXX!H Linoleic 18:1 18:2
40
30 -
o 20
10 -
1
Days
Figure 17. Fatty acid profile of french fiies fried in soybean oil on days 0 (fresh), 1 and 5.
84

profiles of the french fries fried in cottonseed oil, canola oil and soybean oil, respectively.
The largest change in the fatty acid profile occurred on the first day of fiying (Table 15,
Appendix A). For the remainder of the fiying time (days 1-5) the profile remained fairly
stable. Palmitic acid was the most abundant saturated fatty acid found in the three oils and
this was also the case for the french fries. Palmitic acid increased by 25%) in the french
fries fried in cottonseed oil. This may be due to absorption of palmitic acid from the fiying
oil, since this acid actually decreased in the cottonseed oil. Palmitic acid decreased by 25%)
in french fries fried in soybean oil. This may have been due to leaching of the fatty acid
from the french fries into the frying oil, since palmitic acid actually increased in the
soybean oil. French fries fiied in canola oil showed a 50% decrease in palmitic acid.
However, the fiying oil did not exhibit this large of an increase.
Stearic acid decreased by approximately 67%) in the french fries fried in cottonseed
oil, and 53%) in those fried in both the canola oil and soybean oil. Stearic acid content in
the three oils was less than 2%) in the fresh oils and remained so through day 5 as
explained in an earlier section.
Very little change was seen in oleic acid content of french fiies fiied in cottonseed
oil, or cottonseed oil. However, Oleic acid increased by 137% in french fries fiied in
canola oil and 58% in french fries fiied in soybean oil. A 25% decrease was seen in the
oleic acid content of canola oil, however, like cottonseed oil, the oleic acid content of
soybean oil remained relatively stable.
For the cottonseed oil french fries, the largest change was seen in linoleic acid.
This fatty acid started out at 2.6% in the raw french fiy, and increased to 43.84%
85
(averaged for days 1 and 5). Cottonseed oil contains approximately 47% linoleic acid.
Linoleic acid decreased in cottonseed oil on both days I and 5. The fact that the french
fiies absorbed a significant amount of this fatty acid explains some of the decrease. In
addition, some of the decrease in the linoleic content of the cottonseed oil may have been
due to degradation. On average, the linoleic acid content of canola oil french fiies and
soybean oil french fries increased slightly to 6.9% and 14.5%, respectively. The linoleic
acid content of both oils was very similar to the linoleic acid content of the french fiies
cooked in those oils. The linolenic acid content in the raw french fiies and the cooked
french fries fried in all three oils was less than P/o.
Trans fatty acid content of the oil and french fiies
The trans fatty acid content of cottonseed oil was significantly lower than the other
two oils (Figure 18). There was no significant effect of days of fiying on trans fatty acid
content. The initial trans fatty acid content of fresh cottonseed oil, canola oil and soybean
oil was 0.1%), 30. l%o and 19.1%, respectively. The trans fatty acid content of canola oil
actually declined on day 1 to 21.30%) and leveled off to 21.17%o on day 5. Soybean oil had
a very stable trans fatty acid content of approximately 20%) on days I and 5 (Table 15,
Appendix A).
The trans fatty acid content of the pre-fried, raw french fries ranged from 8%o-59%)
(average 30.3%)). This is a very large variation, and according to the lab that analyzed this
data, it was very difficult to extract enough fat to perform the test to detect trans fatty
acids. Filary (1999) found a trans fatty acid content of I.3%o, but only one sample was
86
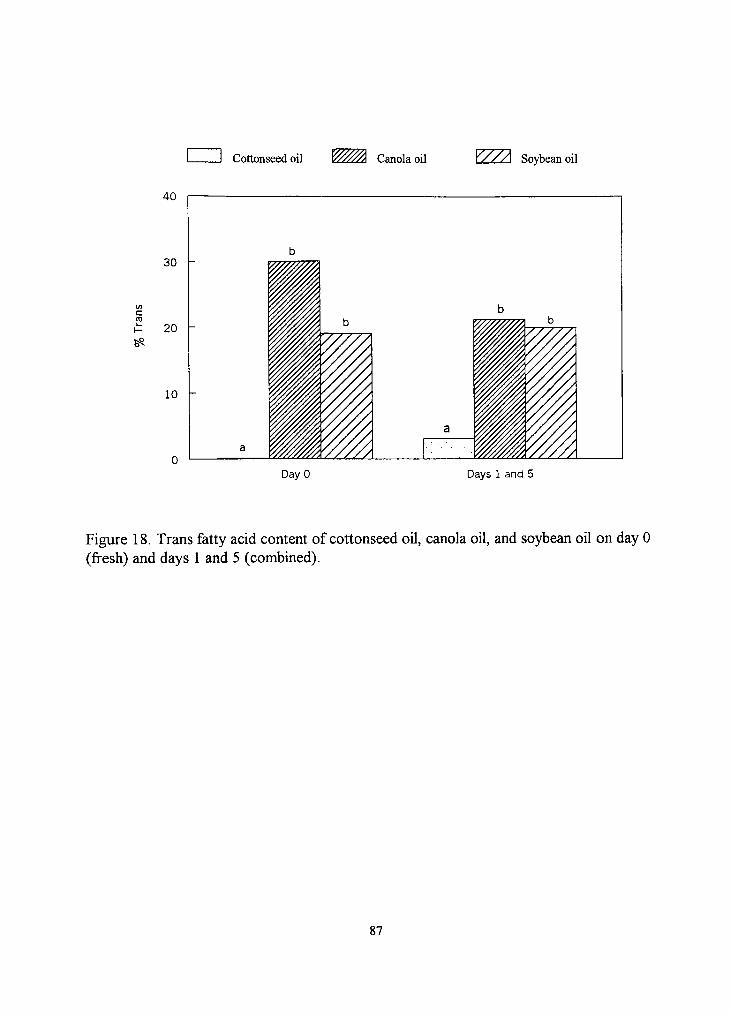
Cottonseed oil K^^^ Canola oil Y//A Soybean oil
c ra
feS
40
30
20
10 -
Day 0 Days 1 and 5
Figure 18. Trans fatty acid content of cottonseed oil, canola oil, and soybean oil on day 0 (fresh) and days 1 and 5 (combined).
87
analyzed. The trans fatty content of the french fiies cooked in cottonseed oil (4.54%) were
significantly lower than for canola oil (20.05%) and soybean oil (21.30%) (Figure 19).
There was no significant effect of days of fiying on trans fatty acid content of the french
fries. These means were very similar to the trans fatty acid content found in the frying oil.
According to research on trans fatty acids and their effect on health, gram for
gram, trans fatty acids may be associated with greater health risk than saturated fatty
acids. Trans fatty acids have been shown to not only increase LDL-cholesterol levels, but
to reduce HDL-cholesterol levels as well. Saturated fatty acids have been shown to reduce
LDL-cholesterol levels, but they have no effect on HDL-cholesterol levels. French fiies
fried in cottonseed oil were higher in saturated fatty acids and lower in trans fatty acids
compared to french fries fried in the other two oils. Currently, trans fatty acids are not
added to the saturated fatty acid content on a food label. If trans and saturated fatty acids
are added together, french fries fried in cottonseed, canola and soybean oil contain 30%,
36% and 41%), respectively, using data obtained on day 5 (Table 16, Appendix A). French
fries fried in cottonseed oil still have a lower combined total of saturated and trans fatty
acids, and more importantly the percentage of the total contributed by trans fatty acids is
lower. The percentage of the total contributed by trans fatty acids is 9%), 53%) and 55%)
for cottonseed, canola and soybean oil, respectively. If trans fatty acids, gram for gram are
more dislipidemic than saturated fatty acids, it would be wiser to choose an oil with a
lower content of trans fatty acids, even if it was higher in saturated fatty acids.
88
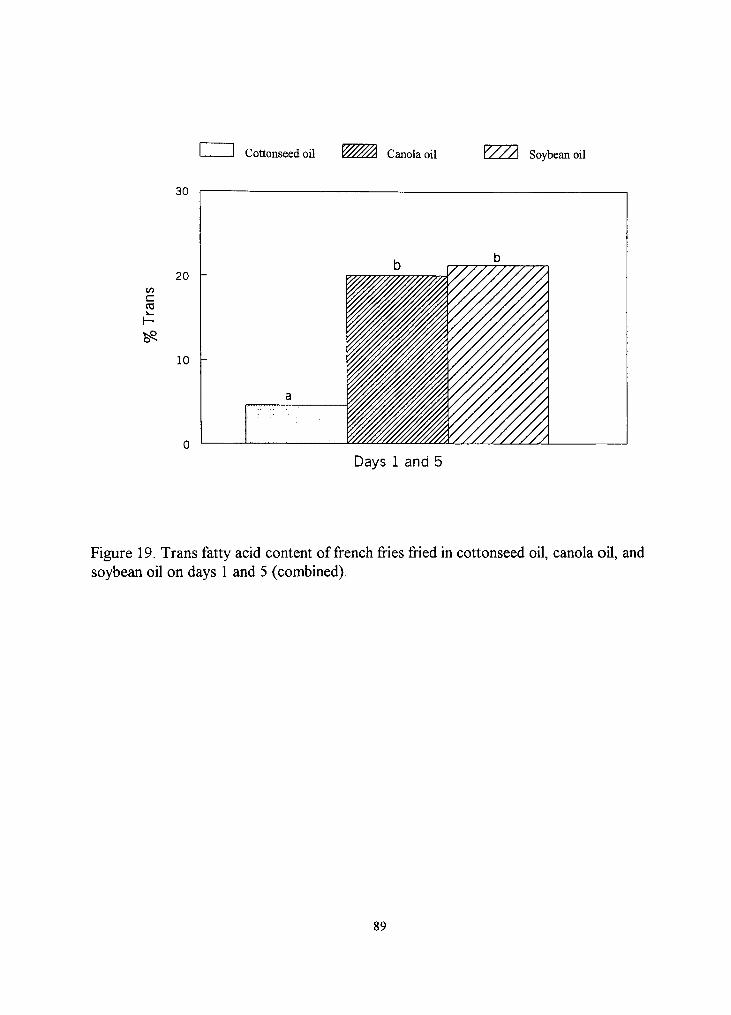
Cottonseed oil ^ ^ ^ Canola oil Y//A Soybean oil
30
20 to
ro
fe5 10
Days 1 and 5
Figure 19. Trans fatty acid content of french fries fried in cottonseed oil, canola oil, and soybean oil on days 1 and 5 (combined).
89
In terms of mono- and poly-unsaturated fatty acids and their effect on health,
studies have shown that mono-unsaturated fatty acids may reduce only LDL-cholesterol
levels, and have no effect on HDL-cholesterol levels. Poly-unsaturated fatty acids are
reported to lower both LDL- and HDL-cholesterol levels. French fries fried in both canola
and soybean oil had higher MUFA levels than those fried in cottonseed oil. Cottonseed oil
is higher in PUFA levels. More studies need to be done on the effects of the fatty acid
profile on health.
90
CHAPTER V
CONCLUSION
The purposes of this research study were to determine if unhydrogenated
cottonseed oil was suitable for the deep-fat fiying process and to determine the nutritional
characteristics and quality of cottonseed oil and the french fries cooked in the oil.
Hydrogenated canola oil and hydrogenated soybean oil were used for comparison.
Blumenthal (1991) stated that all triglyceride-based frying oils have the same
characteristics in terms of how much abuse they can withstand before becoming unfit for
producing high quality foods. This research found that cottonseed oil, hydrogenated
canola oil and hydrogenated soybean oil were comparable in terms of their stability
characteristics under the conditions used in this study. The food service industry is hard on
fiying oil due to the constant fluctuation in temperature. Temperature extremes cause oil
to degrade at a faster rate than oils heated continuously, with little fluctuation in
temperature (Perkins and Van Akkeren 1965). To effectively evaluate degradation, more
food product would need to be fiied than what was achieved in this study.
There were no significant differences in oil absorption for all three oils as
determined by laboratory and physical measurements. French fries contained
approximately 11% fat, an increase of 140%o from the raw product.
Research has shown that trans fatty acids can have detrimental effects on health.
Studies have shown that trans fatty acids not only increase LDL-cholesterol levels, they
decrease HDL-cholesterol levels as well. Trans fatty acids are considered more detrimental
91
to blood lipid levels than saturated fatty acids due to this fact. Since fried foods contribute
a large proportion of trans fatty acids consumed in the US, it is advisable to reduce the
content of trans fatty acids in the fiying oil. Hydrogenation contributes 75% of the trans
fatty acids found in food products. Cottonseed oil can be used in its unhydrogenated state.
This will become especially important when the trans fatty acid content is required to be
disclosed on a food label. Fast food chains such as McDonald's are attempting to develop
new fiying oils that will have less trans fatty acids and more poljainsaturated fatty acids.
Cottonseed oil fits this profile. It is unknown how much saturated fatty acid it takes to
offset the health benefits of using a product with a decreased amount of trans fatty acids.
Epidemiological studies would need to be performed to determine the health benefits of
using oil with higher saturated fat content but lower trans fat content.
92
REFERENCES
Abdel-Aal MH, Karara HA. 1986. Changes in corn oil during deep-fat fiying of foods. Lebens Wiss u Technol 19:323-327.
Allen RR. 1978. Principles and catalyst for hydrogenation of fats and oils. J Am Oil Chem Soc 55:792-795.
Allison DB, Egan KS, Barraj LM, Caughman C, Infante M, Heimbach JT. 1999. Estimated intakes of trans fatty and other fatty acids in the US population. Journal of the American Dietetic Association. 99(2): 166-174.
AOCS (American Oil Chemists' Society). 1998. Official methods of and recommended practices of the American oil Chemists' Society, Methods Cg 3-91, 5th ed. Champaign, Illinois: American Oil Chemists' Society.
ASCN (American Society of Clinical Nutrition). 1995. Review of trans fatty acids. Am J of ClinNutri 62:656S-705S.
ASTM (American Society for Testing and Materials). 1968. Manual on Sensory Testing Methods, ASTM 434, Philadelphia, PA.
ASTM (American Society for Testing and Materials). 1981. Guidelines for the selection and training of sensory panel members. ASTM 758, Philadelphia, PA.
Anon. 1982a. Food favorites. Restaurants & Institutions 91(11): 102.
Anon 1982b. Menu census. Restaurants & Institutions 90(7):31.
Ascherio A, Katan MB, Zock PL, Stamper MJ, Willet WC. 1999. Trans fatty acids and coronary heart disease. New England J Med 340(5): 1994-1998.
Blumenthal MM, Trout JR, Chang SS 1976. Correlation of gas chromatographic profiles and organoleptic scores of different fats and oils after simulated deep fat fiying. J Am Oil Chem Soc 53: 496-501.
Blumenthal MM. 1987. Optimum frying: Theory and practice. 2nd ed. Piscataway, N.J.: Libra Laboratories.
Blumenthal MM. 1988. Rapid test for deterioration of fiying oils. Presented at Annual Meeting of the American Oil Chemistry Society, Phoenix, Arizona, May.
93

Blumenthal MM. 1991. A new look at the chemistry and physics of deep-fat fiying. Food Tech45(2):68-71,94.
Blumenthal MM. 1996. Frying technology. In: Bailey's Industrial Oil & Fat Products. 5* edition. John Wiley & Sons, Inc. P 429-482.
Boskou D, Ehnadfa I. 1999. Frying of food. Lancaster, PA: Technomic Pub. Co., Inc.
Burton WG. 1989. The Potato. New York: John Wiley and Sons. P 742.
CarrRA. 1991. Development of deep-frying fats. Food Tech 45:95-96.
Chang SS, Peterson RJ, Ho C, 1978. Chemical reactions involved in the deep-fat fiying of foods. J Am Oil Chem Soc 55:718-727.
Clark WL, Serbia GW. I99I. Safety aspects of fiying fats and oils. Food Tech 45:84-94.
Dickey LE. 1995. Trans fatty isomer content of food sources. Inform 6:484A.
Dupont MS, Kirby AB, Smith AC. 1992. Instmmental and sensory tests of cooked frozen french fries. Inti J Food Sci Technol 27: 285-295.
Ebersole, R. 2002. Eyes on the fries. Current Science 87 (13):4-5.
Empire State Potato Growers, Inc. 2000. The Consumer and Home Gardner. Stanley, NY: Empire State Potato Growers, Inc.. Available from: www.empirepotatogrowers.com. Accessed Oct 3.
Eskin, NA, McDonald BE, Przybylski, R, Malcolmson LJ, Scarth R, Mag T, Ward K, Adolph D. 1996. Canola Oil. In: Bailey's Industrial Oil & Fat Products. 5* edition. New York: John Wiley &. Sons, Inc. P 1-95.
Fan LL, Arce JA. 1986. Preparation of fiied food products with oil containing emulsifiers. U.S. patent 4,608,264,
Farkus BE. 1994. Modeling immersion fiying as a moving boundary problem [dissertation]. Univ. of California, Davis.
Fennema OR. 1985. Food chemistry. 2nd ed. New York: Marcel Dekker, Inc.
94
Filary MJ. 1999. Evaluation of the nutritional properties of winterized cottonseed oil used as a fiying medium [dissertation]. Denton, TX: Texas Woman's University. 102 p. Available from Texas Woman's University.
Frega N, Mozzon M, Lercker G. 1999. Effects of free fatty acids on oxidative stability of vegetable oil. J Am Oil Chem Soc 76(3):325-329.
Fritsch CW 1981. Measurements of fiying fat deterioration: A brief review. J Am Oil Chem Soc 58:272-274.
Gamble MH, Rice P, Seldman JD. 1987. Relationship between oil uptake and moisture loss during fiying of potato sUces. Inti J Food Sci Technol 22:233-241.
Gavin AM. 1978. Edible oil deodorization. J Am Oil Chem Soc 55:783.
Gere A. 1982. Study of the changes in edible fats during heating and fiying. Die Nahmng 26:923-926.
Gere A. 1983. Study of some factors affecting fiying fat deterioration. Fette Seifen Anstrich 85:18.
Gladwell M. 2001. The trouble with fries: Fast food is killing us. Can it be fixed? The New Yorker. March 5, 52-57
Gower T. 1992. What's wrong with potatoes. Health 14(1):56,58,60.
Gray JI, Russell LF. 1979. Hydrogenation catalysts-Their effect on selectivity. J Am Oil Chem Soc 56:36-40.
Gupta P, Shivhare US, Bawa AS. 2000. Studies on fiying kinetics and quality of french fries. Drying Tech 18 (1&2):311-321.
Hawrysh ZJ, Erin MK, Kim S, Hardin RT. 1996. Quality and stability of potato chips fiied in canola, partially hydrogenated canola, soybean, and cottonseed oils. J Food Qual 9:107-120.
Ho CT, Chen Q, Zhou R. 1996. Flavor compounds in fats and oils. In: Bailey's Industrial Oil & Fat Products. 5* edition. New York: John Wiley & Sons, Inc. P 83-104.
Huang X, Fang C. 2000. Dietary trans fatty acids increase hepatic acyl-coA: cholesterol acyhransferase activity in hamsters. Nutrit Res 20(4):547-558.
95

Hunter JE, Applewhite TH. 1991. Reassessment of trans fatty acid availability in the US diet. Am J din Nutr 54:363-369.
Inform. 1999a. FDA trans mle expected within 60 days. Inform 10 (7): 678.
Inform. 1999b. "Trans" better known, but does it matter? Inform 10 (10):945-947.
Inform. 1999c. FDA seeking comments on proposed trans fat labeling. Inform 10(12): 1076.
Instittite of Shortening and Edible Oils. 1999. Food, Fats, & Oils, 8th ed. Washington, DC: Institute of Shortening and Edible Oils p27.
Jacobson GA. 1991. Quality control in deep-fat fiying operations. Food Tech 45:72-74.
Jackson HW. 1981. Techniques for flavor and odor evaluation of soy oil. J Am Oil Chem Soc. 58:227-231.
Jaswal AS. 1991. Texture of french fiied potato: Quantitative determinations of non-starch polysaccharides. American Potato Journal 68:161-177.
Jones LA, King CC. 1993. Cottonseed oil. Memphis, TN: National Cottonseed Products Association and The Cotton Foundation.
Jones LA, King CC. 1996. Cottonseed Oil. In Bailey's Industrial Oil and Fat Products. 5* Ed. Hui, Y.H., Ed. New York: John Wiley & Sons, Inc. P 159-227.
Lichtenstein AH, Ausman LM, Jalbert SM, Schaefer IJ. 1999. Effects of different forms of dietary hydrogenated fats on semm lipoprotein cholesterol levels. N Engl J Med 340:1933-40.
List GR, Neflf WE, HoUiday RL, King JW, Holser R. 2000. Hydrogenation of soybean oil triglycerides: Effect of pressure on selectivity. J Am Oil Chem Soc 77(3):311-314.
List GR, Friedrich JP. 1989. Oxidative stability of seed oils extracted with super critical carbon dioxide. J Am Oil Chem Soc 66:98-102.
Liu L, Lampert D. 1999. Monitoring chemical interesterification. J Am Oil Chem Soc 76(7):783-787.
Love SL, Thompson-Johns A, Wemer BK. 1996. Mutation breeding for improved intemal quality and appearance in Russet Burbank. Am Potato J 73:155-165.
96
Maes PJA, Meeussen WLJ, Sies I. 1997. Converting spectra into color indices. Inform 8(12): 1245-1252.
Mensink RP, Katan MB. 1990. Effect of dietary trans fatty acids on high-density and low-density lipoprotein cholesterol levels in healthy subjects. New England Journal of Medicine 323:439-445.
Miller LA, White PJ. 1988. High temperature stabilities of low-linoleate, high-stearate and common soybean oils. J Am Oil Chem Soc 65:1324.
Min DB, Smouse TH. 1989. Flavor chemistry of lipid foods. Champaign, IL: Am Oil Chem Soc.
Minolta. 1993. Precise color communication: Color control from feeling to instmmentation. Ramsey, NJ: Minoha Camera Co., Ltd. p 11, 18.
Morton ID. 1977. Physical, chemical, and biological changes related to different time temperature combinations. In: Hoyem T, Kuale O, editors. Physical, chemical and biological changes in food caused by thermal processing. London: AppHed Sci. Pub. Ltd. P 135.
Naglic M, Smidovnik, A, Koloini T. 1998. Kinetics of catalytic transfer hydrogenation of some vegetable oils. J Am Oil Chem Soc 75(5):629-633.
National Potato Council. 1994, Potato Statistical Yearbook. National Potato Council, Englewood, Colorado.
Nawar WW. 1996. Chemistry. In: Bailey's Industrial Oil & Fat Products. 5* edition. New York: John Wiley & Sons, Inc. P 397-425.
NCPA. 1990. Cottonseed and its products, 9th ed. Memphis, TN: NCPA, Inc. p24.
NCPA. 1996. Guide to edible oils. National Cottonseed Products Association.
Nelson GJ. 1998. Dietary fat, trans fatty acids, and risk of coronary heart disease. Nutrit Rev 56(8):250-252.
Nielson SS. 1998. Food analysis, 2"'' ed. Gaithersburg, MD: Aspen Publishers, Inc, p 227.
O'Brien RD. 1998. Fats and oils. Lancaster, PA: Technomic PubHshing Company.
97
Patterson HBW. 1983. Hydrogenation of fats and oils. New York, NY: Applied Science Publishers, pi2, 15,20.
Pederson n . 2001. More on trans fatty acids. Brit J Nutrit 85(3):249-50.
Perkins EG. 1967. Formation of non-volatile decomposition products in heated fats and oils. Food Tech 21:125-129.
Perkins EG and Van Akkeren LA. 1965. Chemical changes in fats subjected to deep fat fiying processes. J Am Oil Chem Soc 42:782.
Pinthus EJ, Weinberg P, Saguy IS. 1993. Criterion for oil uptake during deep-fat fiying. J Food Sc 48 (l):204-222.
Pokomy J. 1999. Changes of nutrients at frying temperatures. In: Boskou D, Elmadfa I, editors. Frying of food. Lancaster PA: Technomic Pub. Co. P 69-103.
Pokomy J. 1980. Effect of substrates on changes in fats and oils during fiying. LaRivista ItaHana delle Sostanze Grasse 57:222-225.
Poumeyrol G. 1986. Rev. Fr. Corps Gras 33:263.
Pritchard MK, Adam LR. 1994. Relationship between fiy color and sugar concentration in stored msset burbank and shepody potatoes. Am Potato J 71:59-68.
Puri PS. 1980, Hydrogenation of oils and fats. J Am Oil Chem Soc 57:850-854.
Rivera-Acosta A. 1999. Evaluation of quality characteristics of winterized cottonseed oil as a fiying oil [MSc thesis]. Denton, TX: Texas Woman's University. 95 p.
Rock SP, Roth H. 1967. Factors affecting the rate of deterioration in the fiying quality of fats: Type of heater and method of heating. J Am Oil Chem Soc 41:531.
Rossell JB in JC Allen and RJ Hamilton, eds. Rancidity in Foods, London, Applied Science PubHshers, 1987, pp.207-22I.
Saguy IS, Pinthus EJ. 1995. Oil uptake during deep-fat fiying: Factors and Mechanism. Food Tech 49:142-152.
Salunkhe DK, Chavan JK, Adsule RN, Kadam SS. 1992. Worid oilseeds: Chemistry, technology, and utilization. New York: Van Nostrand Reinhold.
98
Sheaffer JA.1998. Evaluation of cottonseed oil and hydrogenated canola oil in a commercial scale university food service operation [MS Thesis]. Denton, TX: Texas Woman's University.
Sherwin ER. 1976. Antioxidants for vegetable oils. J Am Oil Chem Soc 53:430.
Singh R P 1995. Heat and mass transfer in foods during deep-fat frying. Food Tech 49:134-137.
Sinram RD, Hartman GJ. 1989. Flavored vegetable oils as a substitute for beef tallow in deep-fiying appUcations. Food Tech 43(6):90-94.
Slover HT, Lehmann J, Valis. RJ. 1969. Vitamin E in foods: Determination of tocols and tocotrienols. J Am Oil Chem Soc 46:417.
Smith L. 1962. Blueprint for cotton research. Washington, DC: National Cotton Council of America 2p.
Stier RF, Blumenthal MM. 1990. Heat transfer in fiying. Baking Snack System I2:(9):I5-19.
Stier RF, Blumenthal MM. 1993. Quality control in deep-fat fiying. Baking Snack System 15(2):67-75.
Takeoka GR, Full GH, Dao LT. 1997. Effect of heating on the characteristics and chemical composition of selected fiying oils and fats. J Agrc Food Chem 45(8):3244-3249.
Tan CP, Man YB. 1999. Quantitative differential scanning colorimetric analysis for determining total polar compounds in heated oils. J Am Oil Chem Soc 76(9): 1047-1057.
Tangel FP, Leeder JG, Chang SS. 1977. Deep-fat fiying characteristics of butter oil. J Food Sci 42:1110-1115.
Tettweiler P. 1991. Snack foods worldwide. Food Tech 45(2):58-62.
Thompson LU, Aust R. 1983. Lipid changes in french fries and heated oils during commercial deep fiying and their nutritional and toxicological implications. Canad Inst Food Sci Technol J 16:246-250.
Tompkins C, Perkins EG. 1999. The evaluation of fiying oils with the p-Anisidine value. J Am Oil Chem Soc 76(8):945-947.
99
Tyagi VK, Vasishtha AK. 1996. Changes in the characteristics and composition of oils during deep-fat fiying. J Am Oil Chem Soc 73(4):499-506.
USDA. 1988. Worid oilseed situation and market highlights. FOP 7-88, July.
USDA. 1979. Agricultural Handbook No. 8-4 and Human Nutrition Information Service. Washington, DC: United States Department of Agriculture,
Van Greevenbroek MMJ, Robertus-Teumissen MG, Erkelens DW, de Bmin TWA. 1998. Lipoprotein secretion by Caco-2 cells is affected differently by trans and cis unsaturated fatty acids: Effects of carbon chain length and position of the double bond. Am J Clin Nutt 68:561-567.
Varela G, Bender AE, Morton ID. 1988. Frying of food: Principles, changes, new approaches. Chichester, England: VCH Publishers.
Waltking AE, Seery WE, Bleffert GW. 1975. Chemical analysis of polymerization products in abused fats and oils. J Am Oil Chem Soc 52:96-100.
Ward JA. 1976. Processing high oil content seeds in continuous screw presses. J Am Oil Chem Soc 53:261-266.
Warner K, Mounts TL. 1993. Oxidative stability of soybean and canola oils with modified fatty acid compositions. J Am Oil Chem Soc 70:983-998.
Warner K. 1996. Flavors and sensory evaluation. In: Bailey's Industrial Oil & Fat Products. 5* edition. New York: John Wiley & Sons, Inc. P 105-144.
Weaver ML, Nonaka M, Sayre RN. 1975. Surface-texturizing process yields crisp, extmded french fries. Food Prod Dev, Feb, pp. 50-56.
Weiss TJ. 1983. Food and oil and their uses. Westport, CT: AVI publishing Co., Inc.
Wheeler FG, Stingley DV 1963. Effect of moisture on fat absorption in cake doughnuts. Cereal Sci Today 8(4): 102-108.
White PJ. 1991. Methods for measuring changes in deep-fat fiying oils. Food Tech 45:75-80.
Wrenn LB. 1995. Cinderella of the new south. Knoxville, TN: The University of Tennessee Press.
100

Xu XQ, Tran VH, Palmer M, White K, Salisbury P. 1999. Chemical and physical analyses and sensory evaluation of six deep-fiying oils. J Am Oil Chem Soc 76 (9): 1091-1099.
Zock PL, Mensink RP, Katan MB. 1995. Dietary trans fatty acids and lipoprotein cholesterol (letter). Am J Clin Nutr 61:617.
101

APPENDIX A
TABLES
102
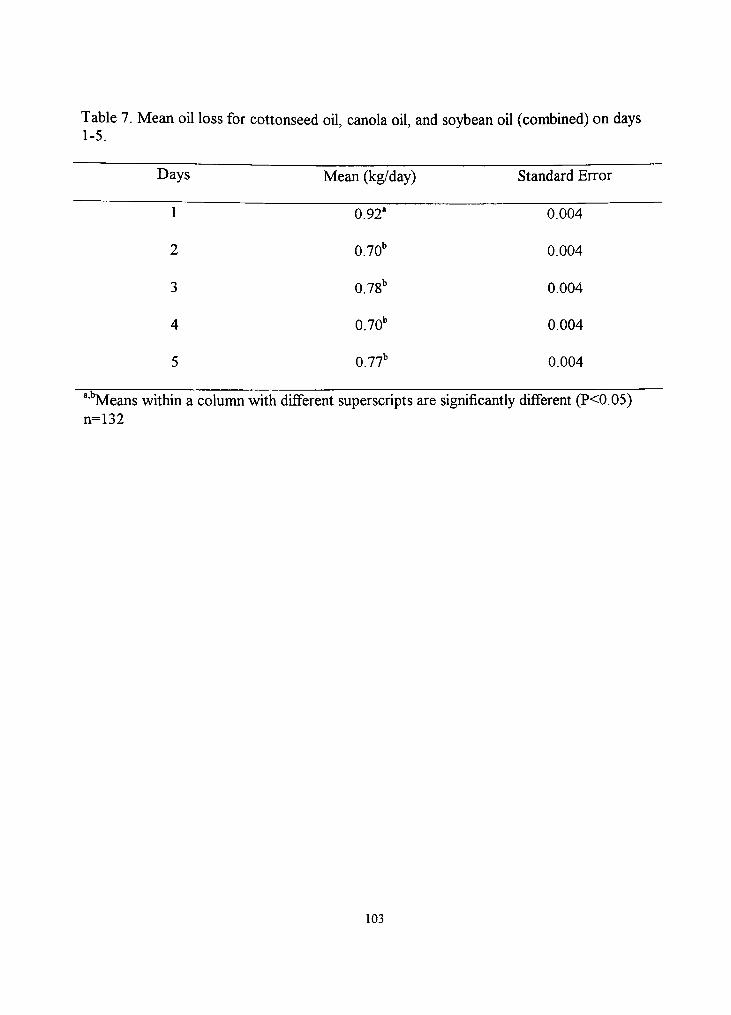
Table 7. Mean oil loss for cottonseed oil, canola oil, and soybean oil (combined) on days 1-5.
Days Mean (kg/day)
0.92"
0.70*'
0.78''
0.70*'
0.77''
Standard Error
0.004
0.004
0.004
0.004
0.004
1
2
3
4
5
"'"TVIeans within a column with different superscripts are significantly different (P<0.05) n=132
103

Table 8. Mean differences in french fry cooking loss among tanks 1-3 for cottonseed oil, canola oil, and soybean oil (combined).
Combined oil (kg/day)
Tanks Mean Std Error'
Left outside
Middle
0.627"
0.662"
0.006
0.006
Right outside 0.639' 0.006
"''''' Means within a column with different superscripts are significantly different (P<0.05) 'Std. Error = Standard Error n=807
104
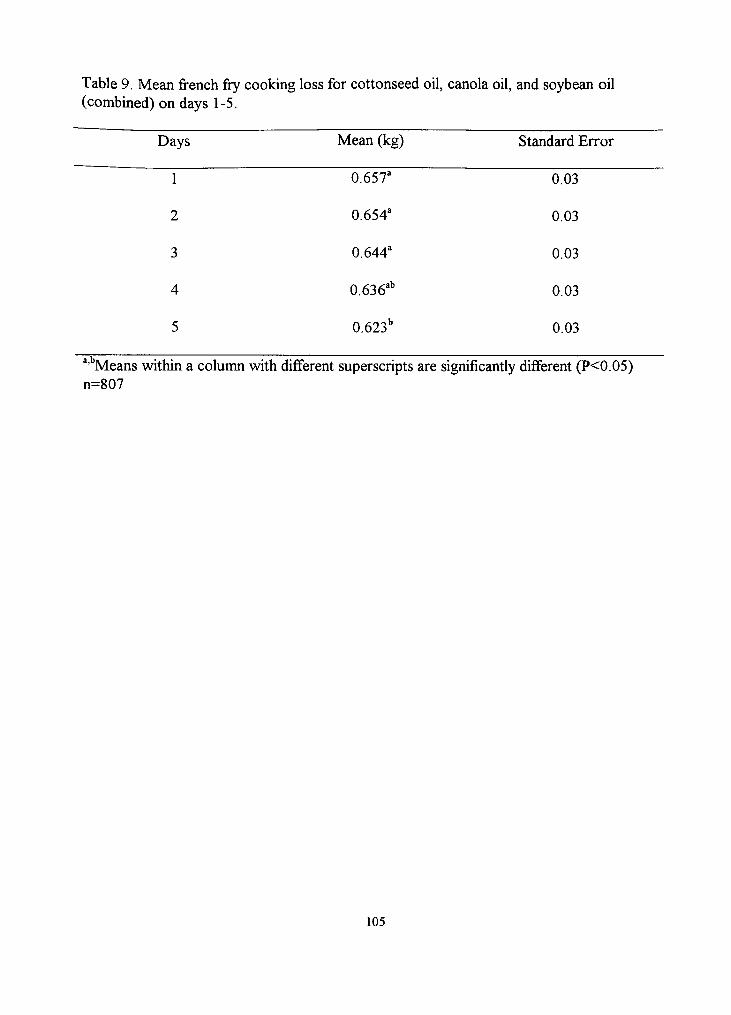
Table 9. Mean french fiy cooking loss for cottonseed oil, canola oil, and soybean oil (combined) on days 1-5.
Days Mean (kg) Standard Error
i 0.657" 003
2 0.654" 0.03
3 0.644" 0.03
4 0.636"'' 0.03
5 0.623'' 0.03
"''TVIeans within a column with different superscripts are significantly different (P<0.05) n=807
105

Table 10. Mean peroxide values (meq peroxide/kg) of cottonseed oil, canola oil, and soybean oil on days 1-5.
Days
1
2
3
4
5
Cottonseed oil
Mean
2.04""
J Qjamn
2.69"""
2.94"""
2.85""
Std Error^
0.078
0.060
0.082
0.053
0.088
Canola Oil
Mean
1.24''"'
1.61''""
1.20*'""
1.58''""
1.56""
Std Error^
0.026
0.056
0.049
0.047
0.039
Soybean Oil
Mean
1.51'™
J gjbmm
1.59*'""
1.56"""
1.84'"
Std Error^
0.044
0.046
0.075
0.038
0.056
^Means with the same letter were not significantly different at the alpha = 0.05 level. ^The letters 'a' and 'b' denote significant differences between oil types at each fiying day and the letters from 'm' and 'n' denote differences due to the effect of fiying day. ^Std Error = Standard Error n=131
106

Table II . Mean iodine values (g halogen/100 g fat) of cottonseed oil, canola oil, and soybean oil in tanks 1-3,
Tank
1
2
3
Cottonseed Oil
Mean
120,03"""
135.57"""
108.43""
Std Error^
10.18
10.18
9.74
Canola Oil
Mean
84.75''""'
83.73''"'
86.59*'"
Std Error
9.74
9.74
10.18
Soybean Oil
Mean Std Error
93.30^
98.60'
95.43=
10.18
9.74
9.74
^Means with the same letter were not significantly different at the alpha = 0.05 level. ^The letters 'a' and 'b' denote significant differences between oil types at each fiying day and the letters from 'm' and 'n' denote differences due to the effect of the tank. ^Std Error = Standard Error n=131
107
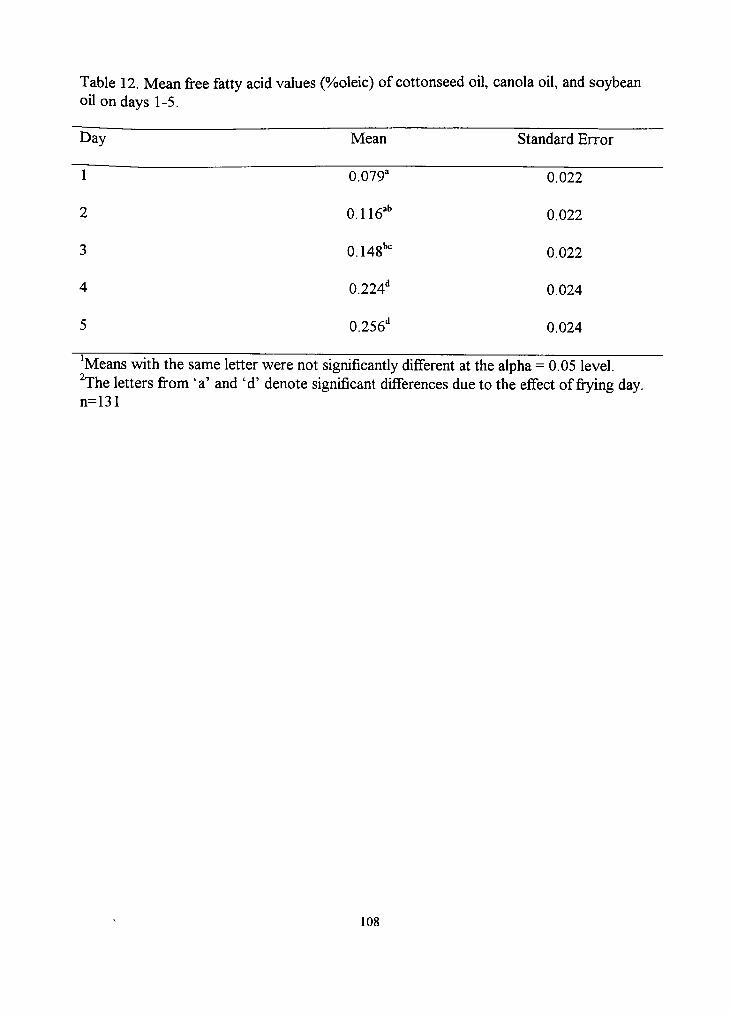
Table 12. Mean free fatty acid values (%)0leic) of cottonseed oil, canola oil, and soybean oil on days 1-5.
Day Mean Standard Error
1 ~ 0.079" 0.022
2 0.116"*" 0.022
3 0.148'"= 0.022
4 0.224'' 0.024
5 0.256'' 0.024
'Means with the same letter were not significantly different at the alpha = 0.05 level. The letters from 'a' and 'd' denote significant differences due to the effect of fiying day.
n=131
108
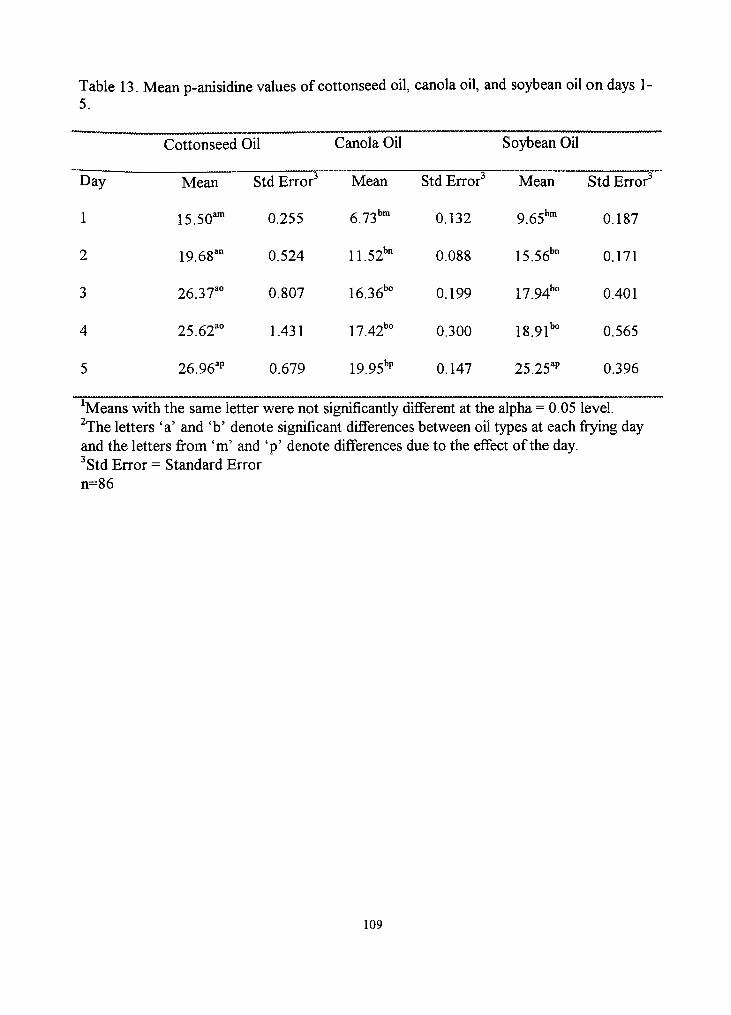
Table 13. Mean p-anisidine values of cottonseed oil, canola oil, and soybean oil on days 1-5.
Day
1
2
3
4
5
Cottonseed Oil
Mean
15.50""
19.68""
26.37"°
25.62"°
26.96""
Std Error^
0.255
0.524
0.807
1.431
0.679
Canola Oil
Mean
6.73""
11.52""
16.36"°
17.42"°
19.95"P
Std Error^
0.132
0.088
0.199
0.300
0.147
Soybean Oil
Mean
9.65""
15.56""
17.94"°
18.9l"°
25.25"P
Std Error^
0.187
0.171
0.401
0.565
0.396
'Means with the same letter were not significantly different at the alpha = 0.05 level. ^The letters 'a' and 'b' denote significant differences between oil types at each fiying day and the letters from 'm' and 'p' denote differences due to the effect of the day. ^Std Error = Standard Error n=86
109
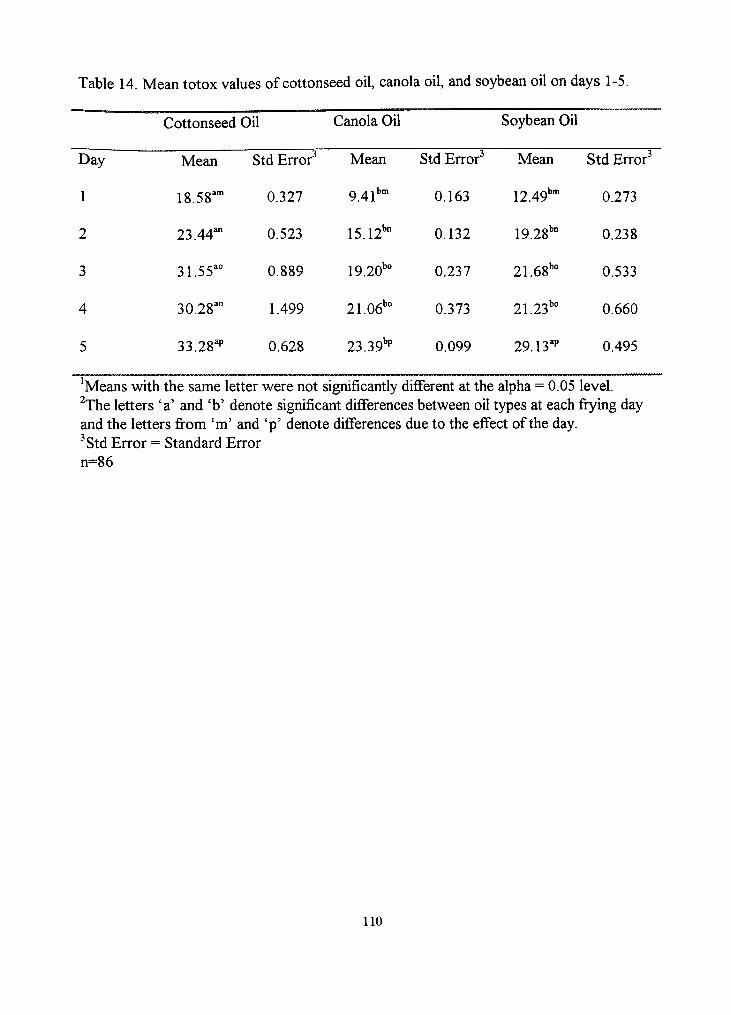
Table 14. Mean totox values of cottonseed oil, canola oil, and soybean oil on days 1-5.
Day
1
2
3
4
5
Cottonseed Oil
Mean
18.58""
23.44""
31.55"°
30.28"°
33.28"P
Std Error^
0.327
0.523
0.889
1.499
0.628
Canola Oil
Mean
9.41""
15.12""
19.20"°
21.06"°
23.39"P
Std Error^
0.163
0.132
0.237
0.373
0.099
Soybean Oil
Mean
12.49""
19.28""
21.68"°
21.23"°
29.13"''
Std Error^
0.273
0.238
0.533
0.660
0.495
'Means with the same letter were not significantly different at the alpha = 0.05 level. ^The letters 'a' and 'b' denote significant differences between oil types at each frying day and the letters from 'm' and 'p' denote differences due to the effect of the day. ^Std Error = Standard Error n=86
110
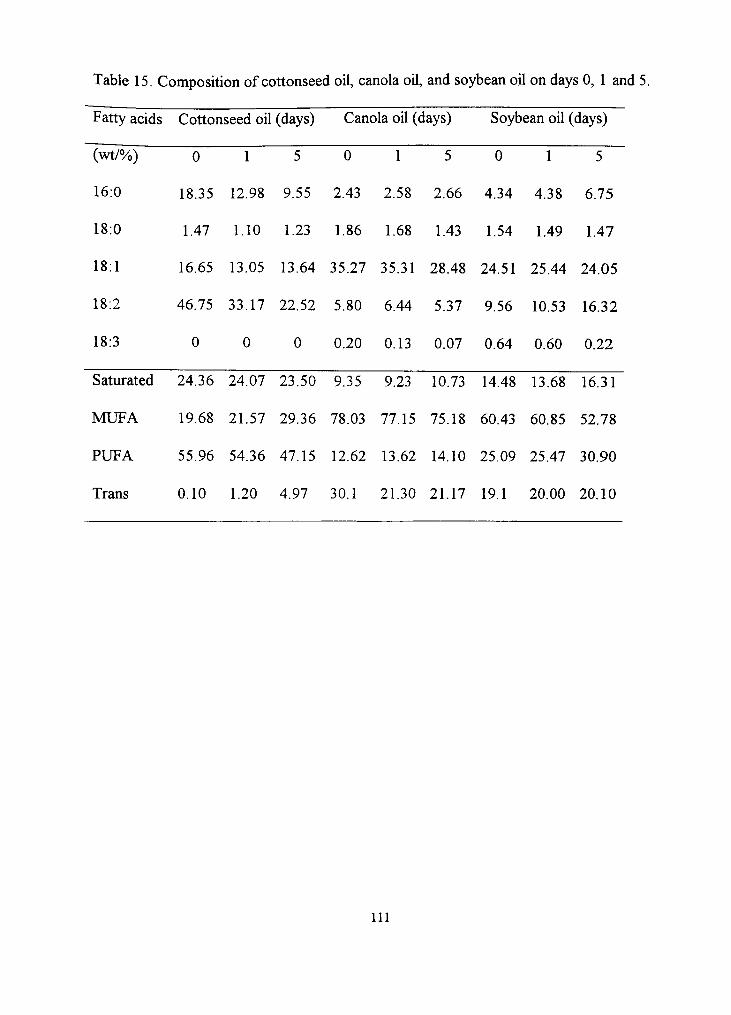
Table 15. Composition of cottonseed oil, canola oil, and soybean oil on days 0, I and 5.
Fatty acids Cottonseed oil (days) Canola oil (days) Soybean oil (days)
~(wt/%) 0 i 5 0 i 5 0 i 5
16:0 18.35 12.98 9.55 2.43 2.58 2.66 4.34 4.38 6.75
18:0 1.47 1.10 1.23 1.86 1.68 1.43 1.54 1.49 1.47
18:1 16.65 13.05 13.64 35.27 35.31 28.48 24.51 25.44 24.05
18:2 46.75 33.17 22.52 5.80 6.44 5.37 9.56 10.53 16.32
18:3 0 0 0 0.20 0.13 0.07 0.64 0.60 0.22
Saturated 24.36 24.07 23.50 935 9 23 10.73 14.48 13.68 16.31
MUFA 19.68 21.57 29.36 78.03 77.15 75.18 60.43 60.85 52.78
PUFA 55.96 54.36 47.15 12.62 13.62 14.10 25.09 25.47 30.90
Trans 0.10 1.20 4.97 30.1 21.30 21.17 19.1 20.00 20.10
111
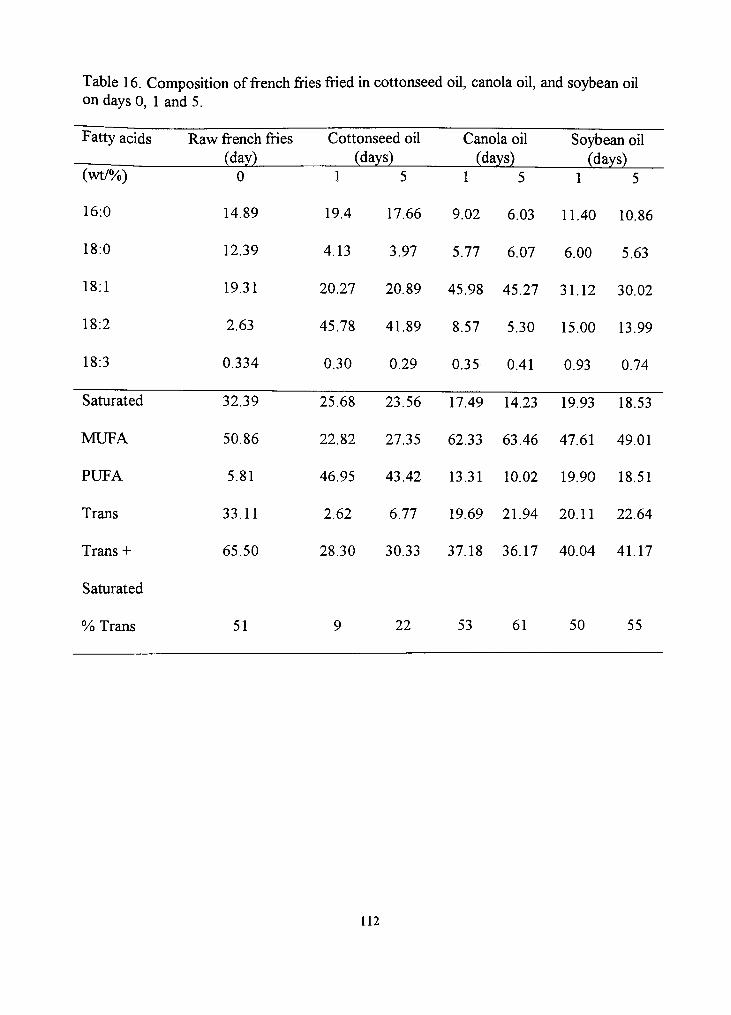
Table 16. Composition of french fries fiied in cottonseed oil, canola oil, and soybean oil on days 0, 1 and 5.
Fatty acids Raw french fiies Cottonseed oil Canola oil Soybean oil (day) (days) (days) (days)
(wt/%) 0 1 5 1 5 1
16:0 14.89 19.4 17.66 9.02 6.03 11.40 10.86
18:0 12.39 4.13 3.97 5.77 6.07 6.00 5.63
18:1 19.31 20.27 20.89 45.98 45.27 31.12 30.02
18:2 2.63 45.78 41.89 8.57 5.30 15.00 13.99
18:3 0.334 0.30 0.29 0.35 0.41 0.93 0.74
Saturated 32.39 25.68 23.56 17.49 14.23 19.93 18.53
MUFA 50.86 22.82 27.35 62.33 63.46 47.61 49.01
PUFA 5.81 46.95 43.42 13.31 10.02 19.90 18.51
Trans 33.11 2.62 6.77 19.69 21.94 20.11 22.64
Trans + 65.50 28.30 30.33 37.18 36.17 40.04 41.17
Saturated
% Trans 51 9 22 53 61 50 55
112
APPENDIX B
FRENCH FRY SPECIFICATION SHEET
113

Payette Farms Regulars
UPC: 7117922101 Product 2210159B Code:
Packaging: Case Pack - 6/5# Net Weight -30.0 lbs. Gross Weight — 32.0 lbs. Cube - 1.270 , j ^
Product Benefits:
Preparation:
Meets USDA grade "A" quality standards.
Exceeds USDA line flow spec.
Higher moisture content—texture will not hold like higher-quality fries.
Available in all popular cuts.
Priced low for the buyer looking for the least expensive product.
For best results, deep fry 1 1/2 pounds at 350°F for 4 1/4 minutes
Specifications 3/8" X 3/8" straight cut
Ingredients:
Menu Solutions:
Potatoes, beef tallow and/or vegetable shortening (partially hydrogenated soybean and/or canola oil), dextrose, disodium dihydrogen pyrophosphate (to maintain natural color).
114
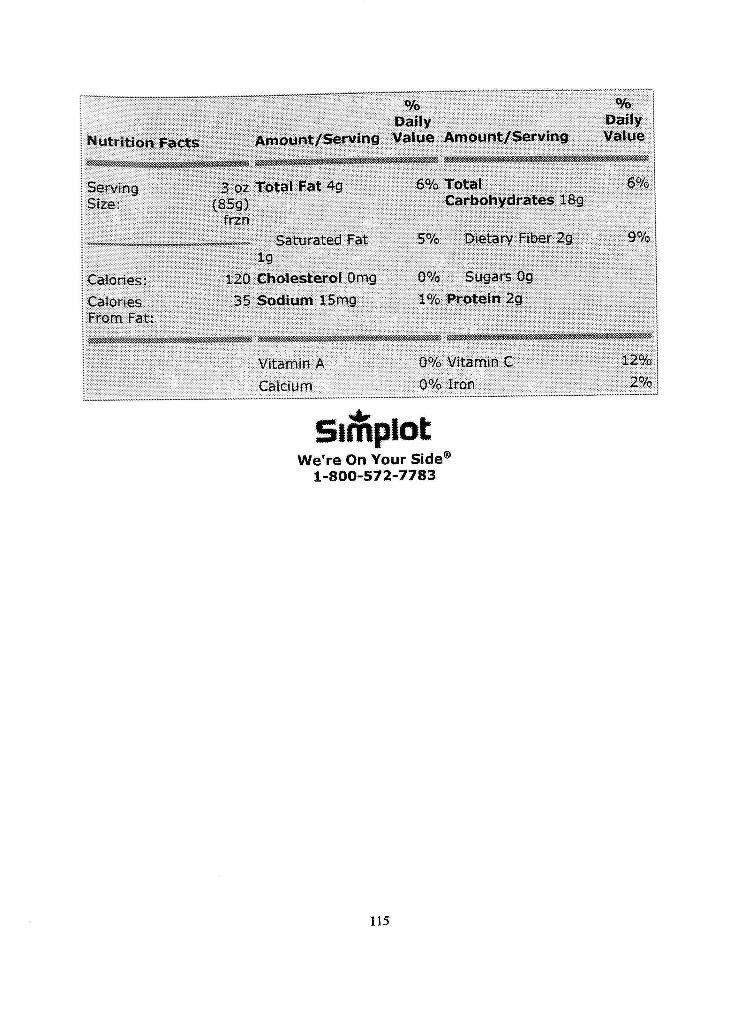
Nutrit ion ffaCtS
o/o % Daily Daily
Attjount/Serving Value Amount /Serv ing Value
Serving Si2e:
^ ••«CC«W«»«W<«'WX<«0C«tOM«W»WW
Calories:
CaJoriGS From Fat:
3 02 Total Fat 4g (85g)
frzn Saturated Fat
i g
120 Cholesterol Omg
35 Sodium I 5mg
Jj^KsfA .•A'>>.0^
Vitamin A
Calcium
6% Total Carbohydrates 18g
5% Dietary Fiber 2s
07o Sugars Og
1 % Protein 2g
0% Vitamin C
0 % Iron
6%:
9%
12% 2%
Sii^piofc We're On Your Side"^
1 -800 -572 -7783
115
![Commented [R1] - SIIT · (1) Thesis Title DISSERTATION TITLE DISSERTATION TITLE DISSERTATION TITLE DISSERTATION TITLE Author Mr. International Institute Degree Doctor of Philosophy](https://img.pdfslide.net/doc/110x75/5f15f57a7867284d112eafe5/commented-r1-siit-1-thesis-title-dissertation-title-dissertation-title-dissertation.jpg)