Embed Size (px)
Citation preview

BY
Anadelia Gonzales, Ph.D.Special Projects Coordinator
RGV LEAD
2014 RGV LEAD Regional ConferenceNovember 3rd & 4th, 2014
RGV LEAD’S 2014 REGIONAL DATA REPORT
“…participation in Tech Prep was found to have lasting influences on students…”
RGV LEAD’s 2014 Regional Data Report Texas Education Research Center
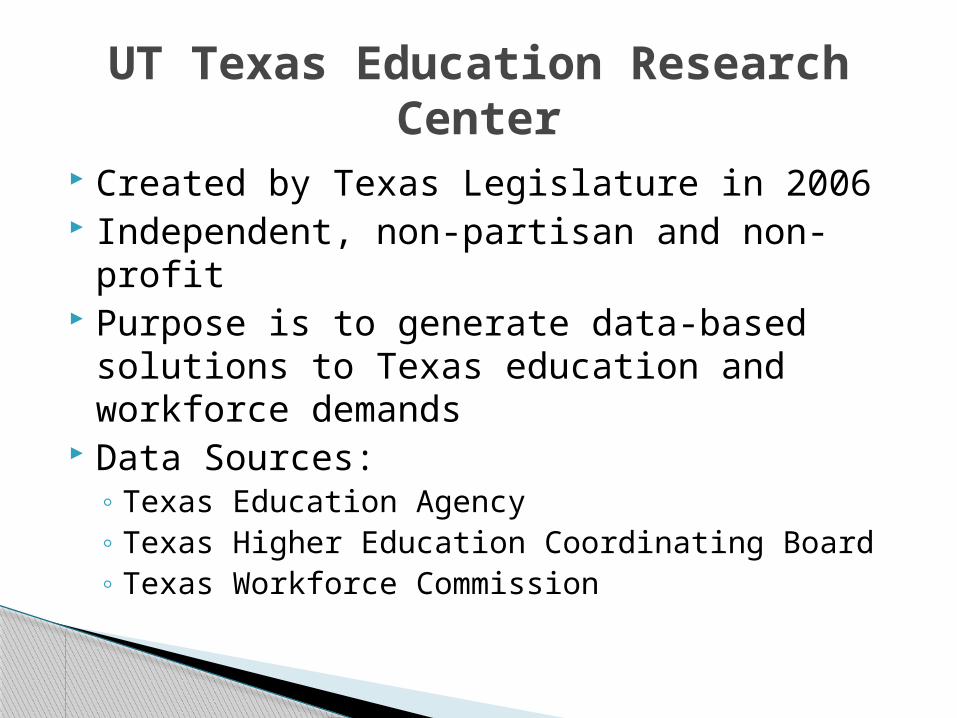
Created by Texas Legislature in 2006 Independent, non-partisan and non-profit Purpose is to generate data-based solutions
to Texas education and workforce demands Data Sources:
◦ Texas Education Agency◦ Texas Higher Education Coordinating Board◦ Texas Workforce Commission
UT Texas Education Research Center
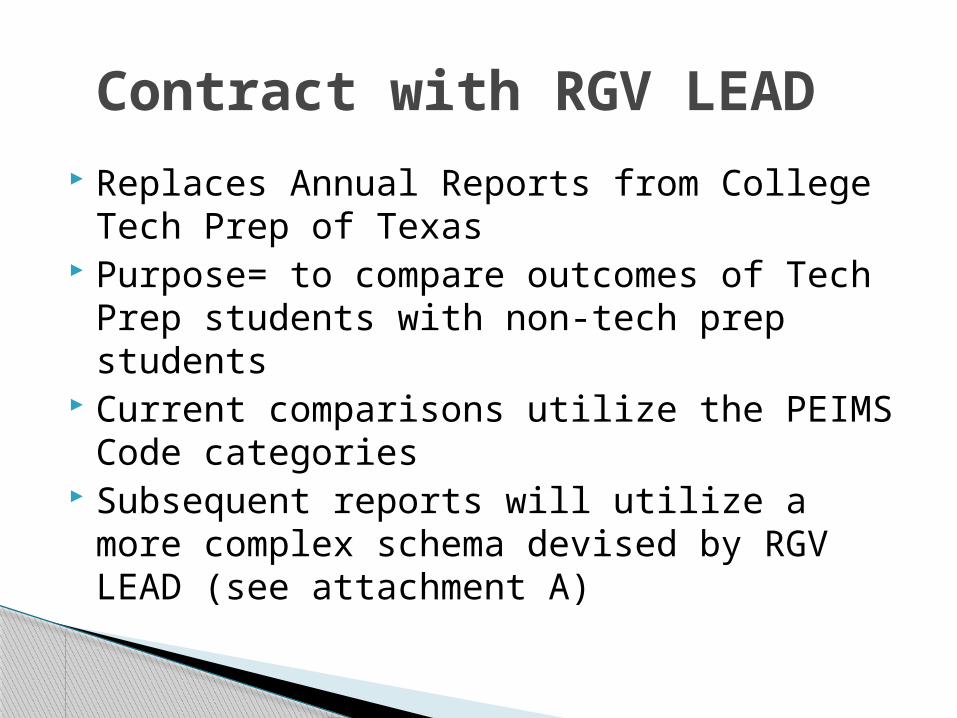
Replaces Annual Reports from College Tech Prep of Texas
Purpose= to compare outcomes of Tech Prep students with non-tech prep students
Current comparisons utilize the PEIMS Code categories
Subsequent reports will utilize a more complex schema devised by RGV LEAD (see attachment A)
Contract with RGV LEAD
Part One = High School Outcomes
Part Two = Post-Secondary and Workplace Outcomes
Summary of 2014 Report Findings
Outcomes
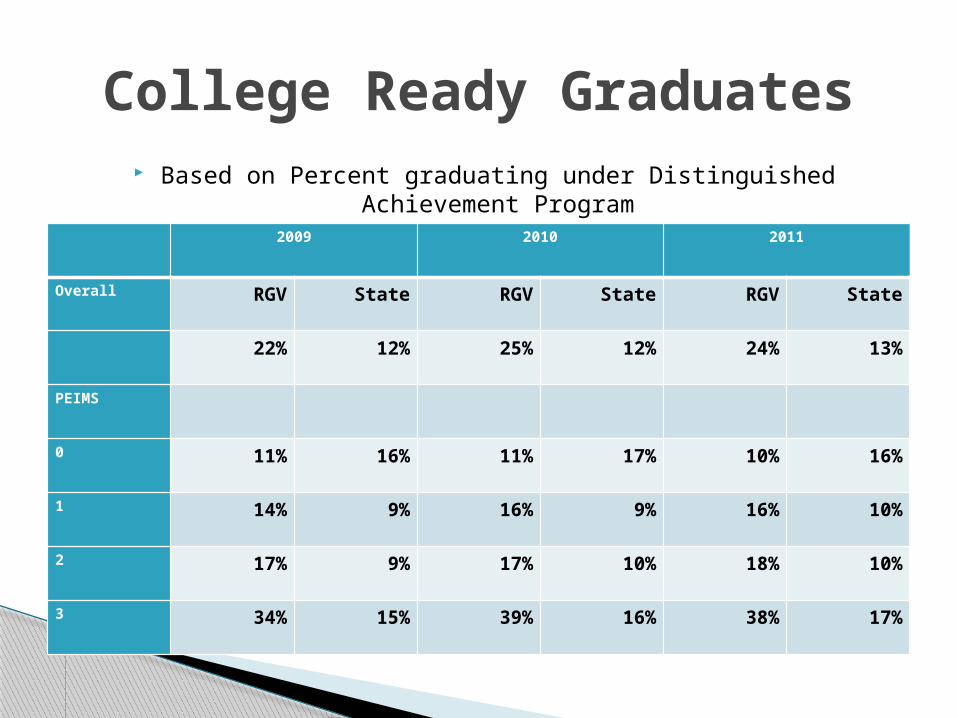
Based on Percent graduating under Distinguished Achievement Program
College Ready Graduates
2009 2010 2011
Overall RGV State RGV State RGV State
22% 12% 25% 12% 24% 13%
PEIMS
0 11% 16% 11% 17% 10% 16%
1 14% 9% 16% 9% 16% 10%
2 17% 9% 17% 10% 18% 10%
3 34% 15% 39% 16% 38% 17%
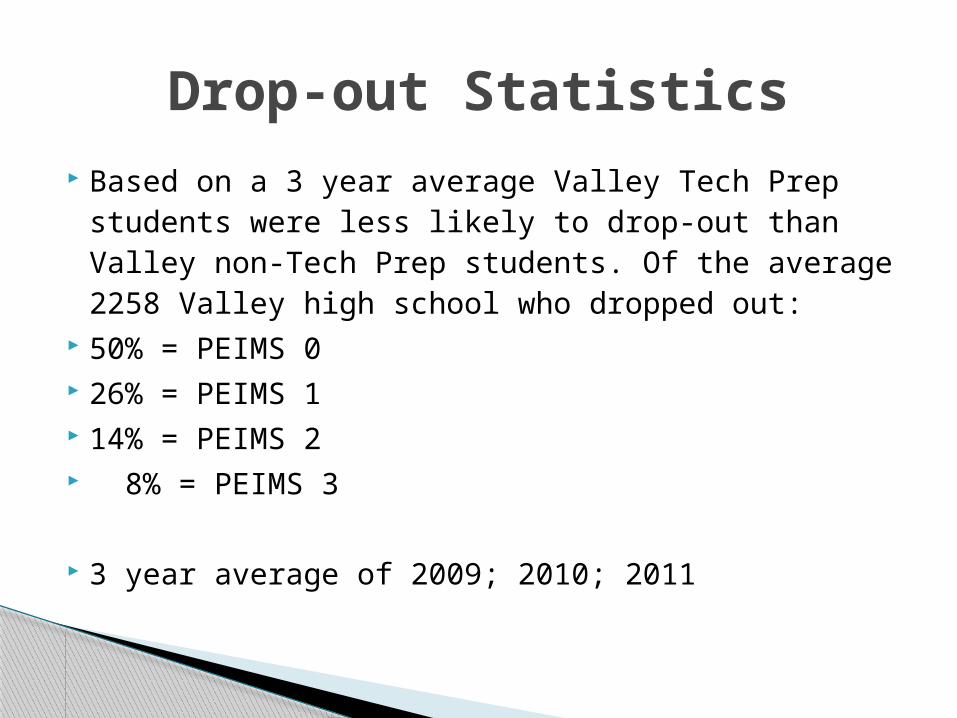
Based on a 3 year average Valley Tech Prep students were less likely to drop-out than Valley non-Tech Prep students. Of the average 2258 Valley high school who dropped out:
50% = PEIMS 0 26% = PEIMS 1 14% = PEIMS 2 8% = PEIMS 3
3 year average of 2009; 2010; 2011
Drop-out Statistics
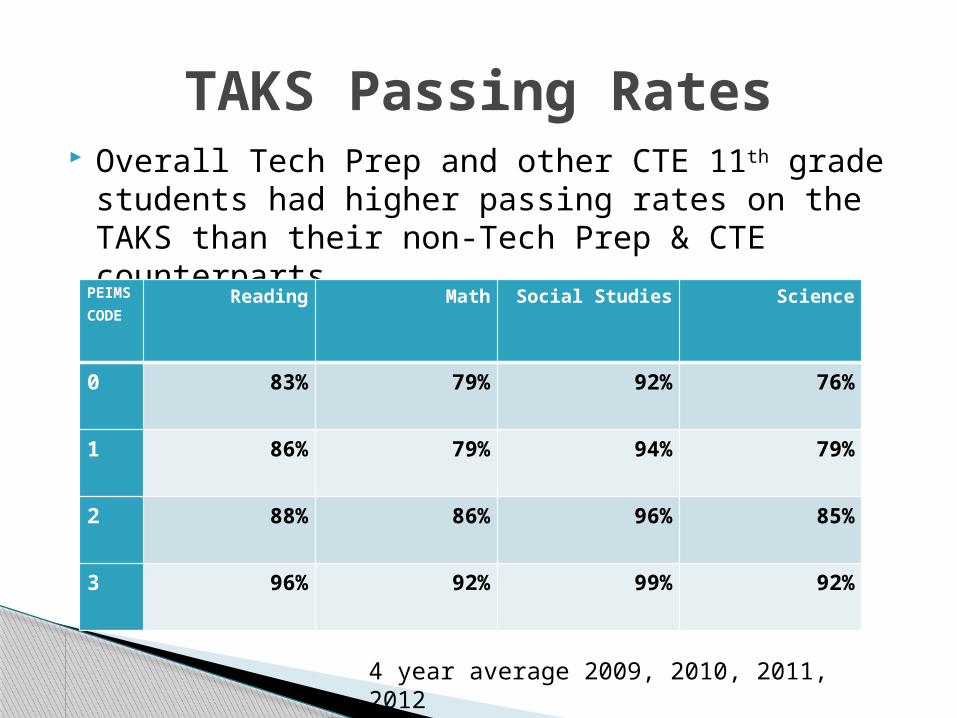
Overall Tech Prep and other CTE 11th grade students had higher passing rates on the TAKS than their non-Tech Prep & CTE counterparts.
TAKS Passing Rates
PEIMS CODE
Reading Math Social Studies Science
0 83% 79% 92% 76%
1 86% 79% 94% 79%
2 88% 86% 96% 85%
3 96% 92% 99% 92%
4 year average 2009, 2010, 2011, 2012
Outcomes
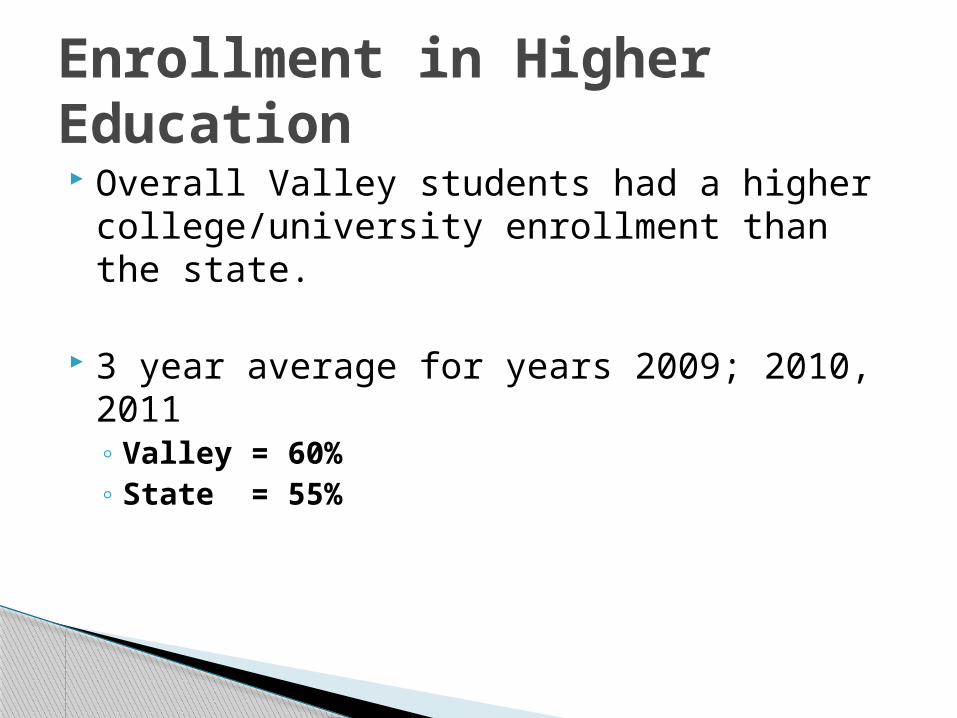
Overall Valley students had a higher college/university enrollment than the state.
3 year average for years 2009; 2010, 2011◦ Valley = 60%◦ State = 55%
Enrollment in Higher Education
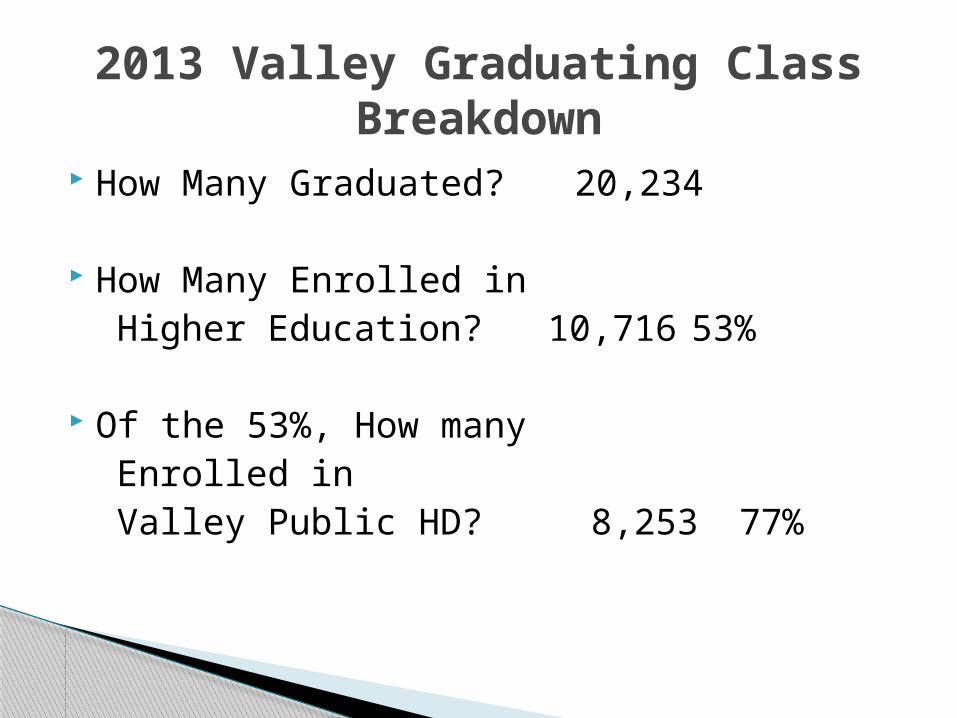
How Many Graduated? 20,234
How Many Enrolled in Higher Education? 10,716
53%
Of the 53%, How many Enrolled inValley Public HD? 8,253
77%
2013 Valley Graduating Class Breakdown
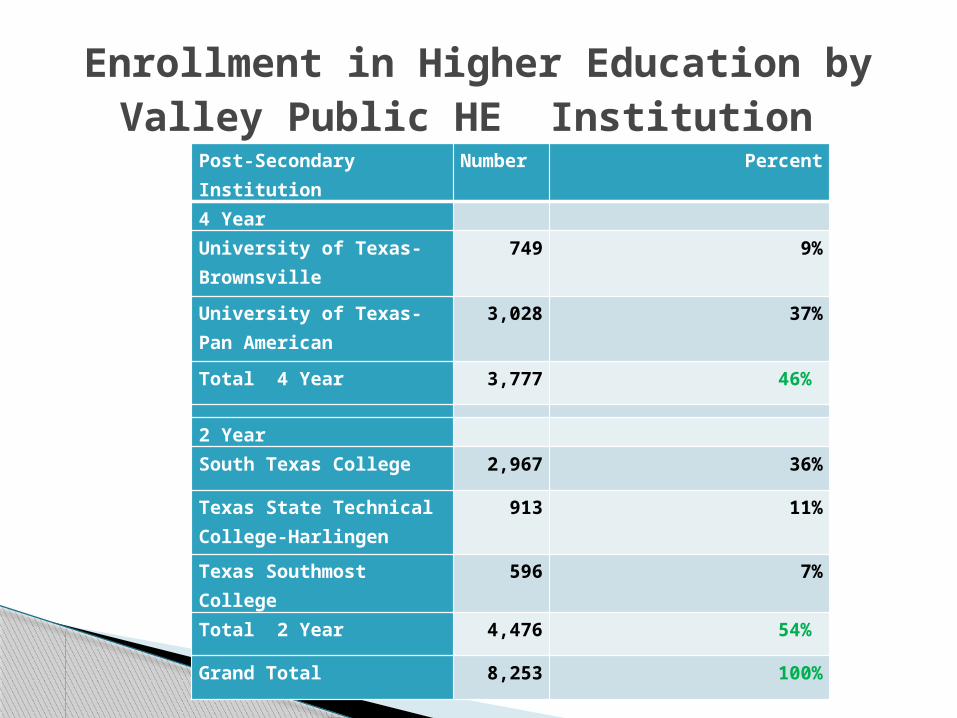
Post-Secondary Institution
Number
Percent
4 Year University of Texas-Brownsville
749 9%
University of Texas-Pan American
3,028 37%
Total 4 Year 3,777 46%
2 Year South Texas College 2,967 36%
Texas State Technical College-Harlingen
913 11%
Texas Southmost College
596 7%
Total 2 Year 4,476 54%
Grand Total 8,253 100%
Enrollment in Higher Education by Valley Public HE Institution
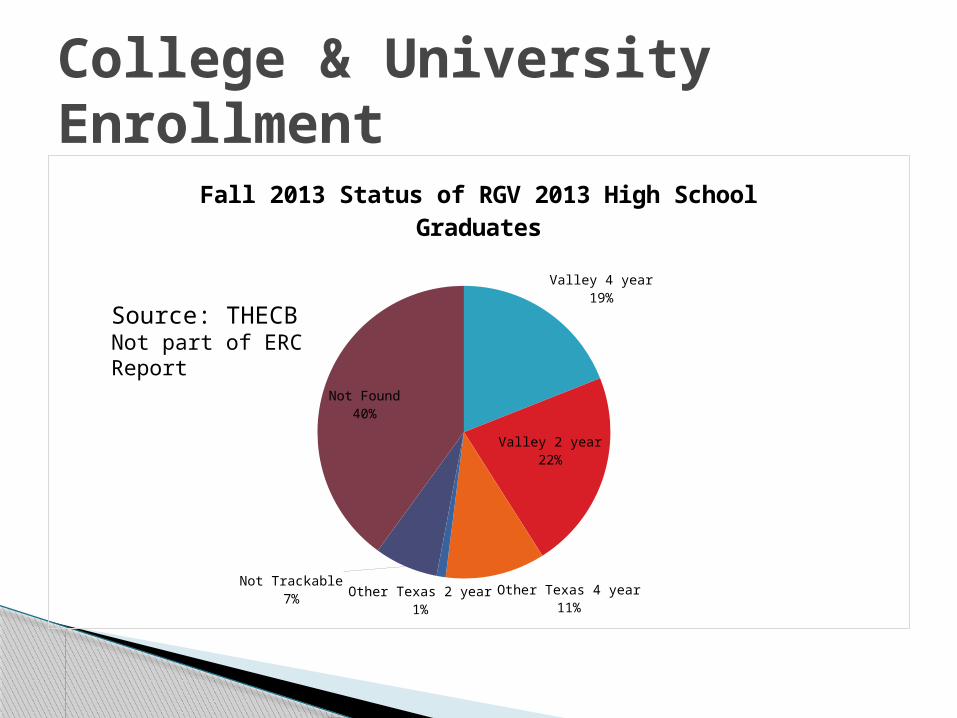
College & University Enrollment
Valley 4 year19%
Valley 2 year22%
Other Texas 4 year11%
Other Texas 2 year1%
Not Trackable7%
Not Found40%
Fall 2013 Status of RGV 2013 High School Grad-uates
Source: THECBNot part of ERCReport
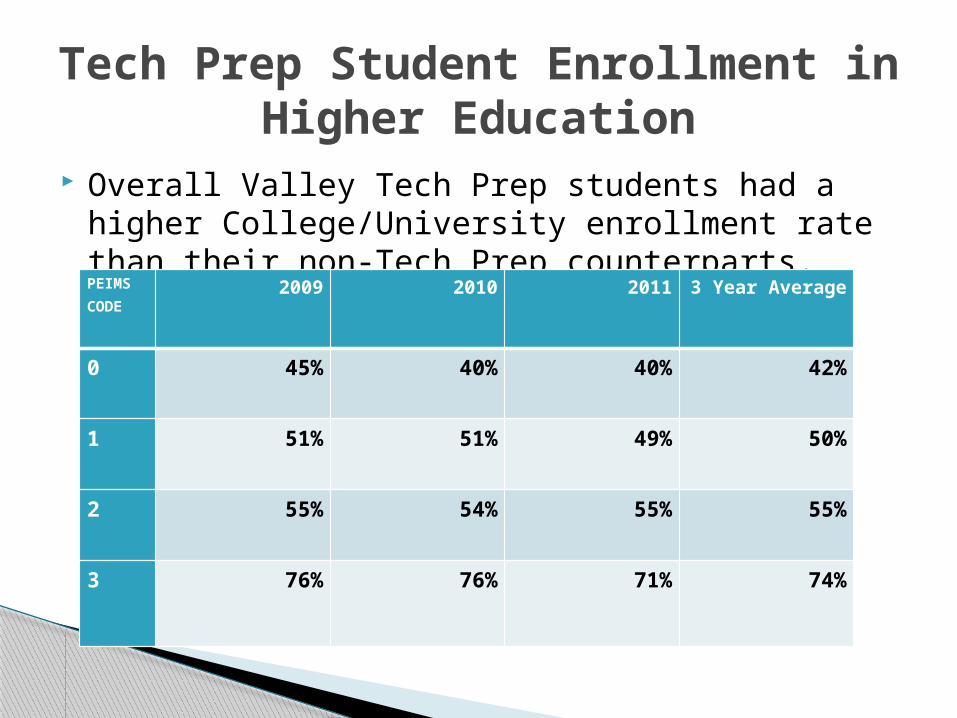
Overall Valley Tech Prep students had a higher College/University enrollment rate than their non-Tech Prep counterparts.
Tech Prep Student Enrollment in Higher Education
PEIMS CODE
2009 2010 2011 3 Year Average
0 45% 40% 40% 42%
1 51% 51% 49% 50%
2 55% 54% 55% 55%
3 76% 76% 71% 74%
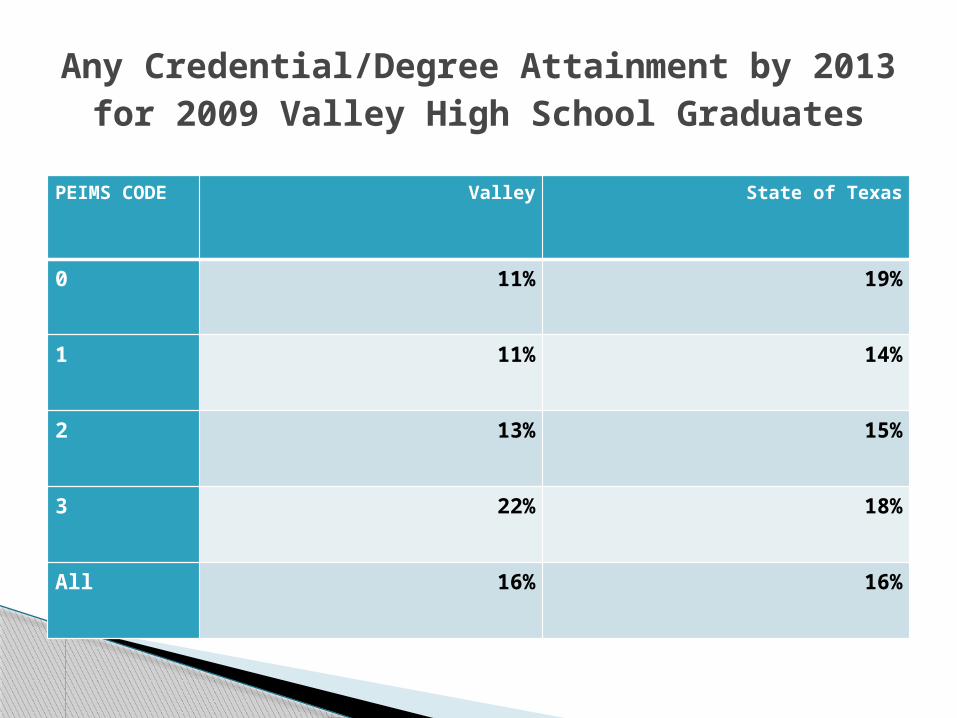
PEIMS CODE Valley State of Texas
0 11% 19%
1 11% 14%
2 13% 15%
3 22% 18%
All 16% 16%
Any Credential/Degree Attainment by 2013 for 2009 Valley High School Graduates

WorkplaceOutcomes
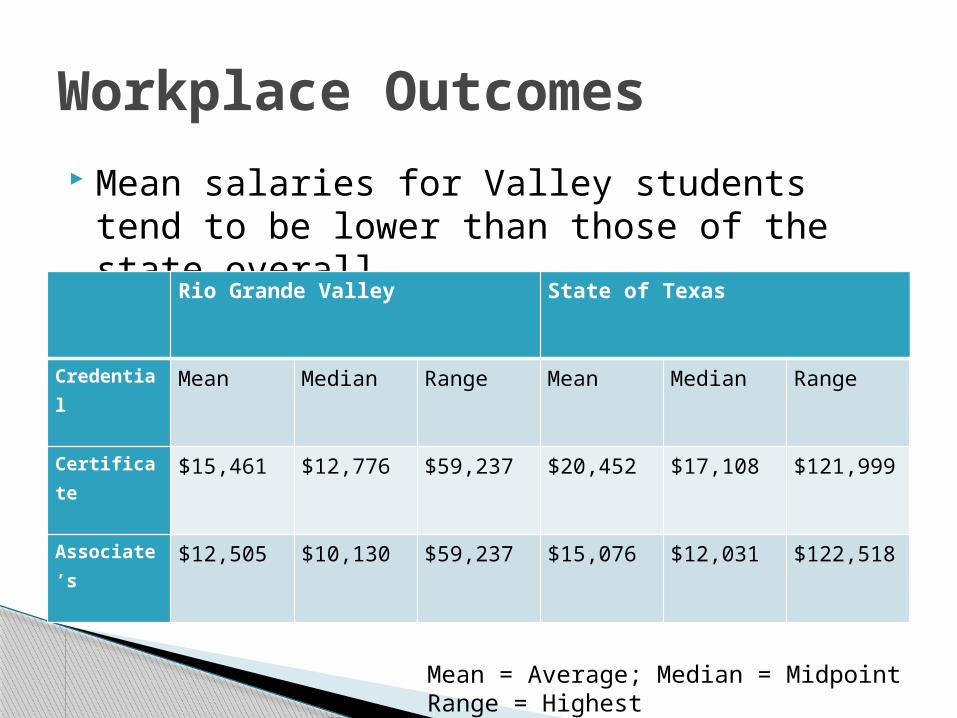
Mean salaries for Valley students tend to be lower than those of the state overall.
Workplace Outcomes
Rio Grande Valley State of Texas
Credential
Mean Median Range Mean Median Range
Certificate
$15,461 $12,776 $59,237 $20,452 $17,108 $121,999
Associate’s
$12,505 $10,130 $59,237 $15,076 $12,031 $122,518
Mean = Average; Median = MidpointRange = Highest
BY
Anadelia Gonzales, Ph.D.Special Projects Coordinator
RGV LEAD
2014 RGV LEAD Regional ConferenceNovember 3rd & 4th, 2014
RGV LEAD’S 2014 REGIONAL DATA REPORT