Embed Size (px)
Citation preview

BASELINE NUTRITION SURVEY
NTCHISI ADP - MALAWI
By:
Beatrice Mtimuni, PhD
Owen Nhkoma, MSc
Mangani Katundu, PhD
Numeri Geresomo, MSc
March 2010
This report was produced under the Regional Programme “Fisheries and HIV/AIDS in Africa: Investing in Sustainable Solutions” by the WorldFish Center and the Food and Agriculture Organization of the United Nations (FAO), with financial assistance from the Swedish International Development Cooperation Agency (Sida) and the Norwegian Ministry of Foreign Affairs.
Contents EXECUTIVE SUMMARY ................................................................................................ 2
1. INTRODUCTION .............................................................................................. 5
2. BASELINE SURVEY ........................................................................................ 7
2.1. Survey Methodology ........................................................................................... 7
2.1.1. Sampling procedure ................................................................................................... 8
2.1.2. Sampling of clusters and households ........................................................................ 9
2.1.3. Sample size ................................................................................................................ 9
2.2. The nutrition survey ............................................................................................ 9
2.3. Variables measured and precision of measurements ........................................ 10
2.3.1. Anthropometry ........................................................................................................ 10
2.3.2. Weight ..................................................................................................................... 10
2.3.3. Height ...................................................................................................................... 10
2.3.4. Mid upper arm circumference (MUAC).................................................................. 10
2.3.5. Oedema .................................................................................................................... 10
2.3.6. Other Study Variables ............................................................................................. 10
2.4. Food Insecurity and Dietary Diversity .............................................................. 11
2.5. Main Nutrition Indicators ................................................................................. 12
2.6. Data Collection, Entry and Analysis ................................................................. 13
3. RESULTS AND DISCUSSION ...................................................................... 16
3.1. Household Socio-economic Characteristics ..................................................... 16
3.2. Prevalence of malnutrition ................................................................................ 18
3.3. Acute Malnutrition by Age ............................................................................... 18
3.4. Chronic malnutrition ......................................................................................... 19
3.5. Underweight ...................................................................................................... 20
3.6. Crude and Underfive Mortality ......................................................................... 20
3.7. Child and adult morbidity ................................................................................. 21
3.8. Prevalence of dietary related non-communicable diseases ............................... 23
3.9. Infant and Young Child Feeding....................................................................... 23
3.10. Dwelling Unit, Water and Sanitation ................................................................ 27
3.11. Water and Sanitation ......................................................................................... 28
3.12. Household food security ................................................................................... 30
3.13. Household food insecurity scale and dietary diversity ..................................... 32
3.14. Household Food Insecurity Access Scale (HFIAS) .......................................... 33
3.15. Household dietary diversity score ..................................................................... 35 3.16. Interrelationships between the dietary indicators and nutritional status ........... 38
4. CONCLUSION AND RECOMMENDATIONS ............................................. 41
APPENDIX 1: BASELINE NUTRITION SURVEY IN NTCHISI – NTHONDO ADP September 2008 ................................................................................................ 44
APPENDIX 2: CREATION OF THE WEALTH INDICATOR ...................................... 56

TABLE OF TABLES
Table 1: Households characteristics of surveyed households ........................................... 16
Table 2: Age Distribution of 6 – 59 months old children ................................................. 17 Table 3: Global and severe acute malnutrition by September 2008 .................................13 Table 4: Distribution of weight for height by age group September 2008 .................... 19
Table 5: Distribution of height for age by September 2008 ............................................. 19
Table 7: Distribution of Weight for age by September 2008............................................ 20
Table 8: Twelve month retrospective mortality rates, September 2008 ........................... 20 Table 9: Causes of death in the households ...................................................................... 21
Table 10: Prevalence of selected illnesses for children 6 -59 months 2 weeks before survey ............................................................................................................... 21
Table 11: Management of diarrhoea, September 2008 ..................................................... 22
Table 12: Attendance of growth monitoring/promotion ................................................... 23
Table 13: Prevalence of selected dietary related non-communicable diseases ................. 23
Table 14: Age and sex of youngest eligible child ............................................................. 24
Table 15: Breastfeeding practices for the youngest underfive children ........................... 24
Table 16: Period complementary foods were introduced ................................................. 25 Table 17: Type of complementary foods and liquids introduced..................................... 22 Table 18: Complementary feeding practices of youngest child day before survey .......... 26
Table 19: Main materials for the dwelling house and households assets ........................ 23 Table 20: Main sources of drinking water Table 21: Waste disposal ................................................................................................. 25 Table 22: Main Source of food for households................................................................ 25 Table 23: Ownership of vegetable garden and type of vegetables grown........................ 19 Table 24: Livestock ownership Nthondo ADP ................................................................ 27 Table 25: Fish farming Activities in the ADP.................................................................. 28 Table 26: Responses to the 9 HFISA questions ............................................................... 29 Table 27: Wealth ranking by September 2008 ................................................................. 34
Table 28: Proportion of households in each DD level ..................................................... 36
Table 29: Consumption of the 12 food groups by level of diversity ................................ 36
Table 30: Typical foods consumed day before the survey by dietary diversity level ....... 36
Table 31: Dietary Diversity based on 6 and 12 food groups ............................................ 38
Table 32 HFIAS with stunted Cross tabulation ................................................................ 39

EXECUTIVE SUMMARY
The baseline survey was conducted by the Home Economics and Human Nutrition Department of
the Bunda College of Agriculture in Malawi, in Ntchisi in the Traditional Authority Nthondo area
to establish the food and nutrition situation and determine contribution of fish to diets. The area
was chosen because it is an area where World Vision Malawi has been operating for a number of
years. One of the key interventions being implemented is fish farming.
Household Socio-Economic Characteristics
The majority of respondents (73.2%) were married in monogamous families hence most
households were headed by men (776%). Most household heads could read and write
(66.9%) compared with only 48.8% of women who could read and write. The average
household size for each of the three districts was 5.2 persons whch is higher than national
average of 4.4 persons reported in the 2004 MDHS survey (NSO, ORC Macro 2005).
Farming was the main occupation (86.0% of the household heads and 90.2% of women).
Regular employment and businesses provide regular income to households, which may
ensure stability of household food supplies.
Prevalence of malnutrition
Global acute malnutrition (GAM) was 1.8% and severe acute malnutrition (SAM) was
0.4% among children 6-59 months of age. Both are low and within the acceptable range
of less than 3%. It is of concern however that 3.8% of infants and children aged 6 to 17
months and 3.3% aged 18 to 29 months were wasted (<-2 Zscore). This is a reflection of
poor weaning practices. Prevalence of chronic malnutrition (stunting) among the children
was very high 49%. Prevalence of stunting was high even among the youngest infants
and the effects appear to be cummulative so that there are no improvements even among
the older children 40.8% of 6 – 17 month old and the prevalence increased to 61.8% for
the 54 – 59 months old children
Prevalence of underweight was 17.7% overall and 3.6% were severely underweight. The
prevalence of underweight was highest among the 18 to 29 month old children (21.4%) followed
by those aged 6 to 17 months (20.4%

The results of the survey show that malaria (30.3%) was the main cause of illness
followed by diarrhoea (13.3%) . Most mothers (78.9%) consulted a health facility to
manage the diarrhoea but it is of concern that 10.5% did nothing during the diarrhoeal
episode. Diarrhoea and malaria have the effects of reducing food and nutrient intake and
at the same time increasing the body’s demand for nutrients.
The crude (0.35 per 10,000) and underfive retrospective (0.31 per 10,000) mortality rates
were both well below serious levels of concern of 1 death and 2 deaths per 10,000
persons respectively. The main causes of underfive mortality were fever and malnutrition
each accounting for 26.1%. For crude mortality, persistent cough (40%) was the main
cause of death and causes of the remaining 3 deaths were unknown. HIV/AIDS may
significantly be contributing to both mortality and morbidity in this area since all the
stipulated causes are interlinked with HIV/AIDS.
Child feeding, dietary diversity, and intra-household food distribution
The majority of the children (79%) had been put to the breast within the recommended
period of within one hour of birth 84.5% of all children received colostrum based on
mothers’ memory. The results also show that only a small proportion of mothers (6%)
ever bottle fed their children. It is however of grave concern that a significant proportion of
mothers (44.6%) had introduced complementary foods to their youngest children before the age
of six months. This is even more worrying with the possibility that those who indicated exclusive
breastfeeding may have done so not out of practice but knowledge.
Most household diets comprised of staples with considerable consumption of vegetables.
Using the dietary diversity score, the results showed that 44.1% of all households had low
dietary diversity (≤ 3 food groups out of the 12 possible food groups or ≤ 2 out of 6 food
groups bases on the Malawi food grouping of six).

At baseline, 90 households had registered to start fish farming. Most of them had
completed construction of the ponds and were waiting for fingerings. The details of their
baseline dietary practices have been reported separately.

5
1. INTRODUCTION
Malawi is a landlocked country but has vast water resources in form of lakes and
rivers. The lakes in Malawi are Lake Malawi, covering almost one third of the
country’s territory, Lake Malombe, Lake Chilwa, Lake Malombe and Lake Kazuni.
These lakes plus the numerous rivers are a source of fish resulting in a greater part of
the protein consumed in Malawi is from fish. Fish farming therefore has the potential
to substantially increase fish consumption and improve incomes of rural households
in Malawi.
Malnutrition is still a problem in many developing countries particularly in Africa. It
is estimated that 47 million under five children are stunted in the sub-Saharan Africa
whereas in the Eastern and Southern Africa 24 million under five children are stunted
(UNICEF, 2008).
In Malawi prevalence of chronic malnutrition has remained high over two decades
based on Malawi demographic surveys at 1990 (49% stunting), 2000 (49%),
2004(48%), and Mics of 2006 (46%). Among school aged children (5 – 10 years)
stunting stand at 29.8% (M o E & VT, M o H and NSO, 2006).
Micronutrient deficiencies of vitamin A, Iron and Iodine are also of public health
concern. Zinc deficiency is also likely to be highly prevalent but national studies have
not yet been conducted. Based on the National Micronutrient survey of 2001, vitamin
A deficiency ranged was 59% in preschool children, 57% in women of child bearing
age, 38% in school children and 37% in men. The highest prevalence of anemia was
found in preschool children (80%), followed by non-pregnant women (27%), school
children (22%) and men (17%). Micronutrient malnutrition is therefore a serious
public health problem that affects all groups in Malawi, particularly among pre-school
children and women of childbearing age. Consequences of these disorders include
nutritional blindness, increased susceptibility to infection, impaired growth and
development, impaired cognitive function, defects in thermoregulation, increased risk
of pregnancy complications, increased risk of low birth weight and increased
morbidity and mortality rates.

6
Short term interventions for tackling micronutrient deficiencies in Malawi include
biannual vitamin A supplementation, deworming and promotion of food production
diversity as well. Long term measures that are being pursued include fortification of
centrally processed flour, oil and salt and dietary diversification and modification.
Consumption of animal foods is relatively low based on the few localized studies that
have been done and food balance sheet (FAO 2008). In Malawi it is estimated that
fish contributes over 60% of the dietary animal protein (GOM, 2007). Fish are
valuable to any diet directly as a food that provides variety and the essential nutrient
of which fish protein is of high biological value particularly Sulphur containing amino
acids hence a good complement to cassava and cereal based diets fish are also a good
source of thiamin, niacin, riboflavin, iron and calcium. Small fish that are eaten
together with bones provide more calcium and fluorine. Fish, liver and fish oils are
rich in vitamin A and vitamin D although the amounts vary with age and species of
fish (Latham, 1997).
Fish is also valuable indirectly because it can be a source of income. The income
realized can then be used for purchase of other basic household necessities ( Kent
,1987). Because of these reasons fish farming should be encouraged wherever water is
available and people are willing to construct fish ponds.
There is general consensus that consumption of animal foods is considerably low in
rural and poor households (Kikafunda, Walker and Tumwine, 2003; Nyambose,
Kokki and Tucker, 2002). In Malawi localized studies in all the regions have also
revealed low consumption of food of animal origin (Mtimuni, Geresomo and Bello
2007; Mtimuni et al 2008; Mtimuni and Geresomo 2009). To add to the burden of
malnutrition are the high prevalence of HIV infection currently the prevalence is
pegged at around 11%. Differences however exist between rural and urban areas. The
entire country is affected and based on the sentinel sites. The link between nutrition
and HIV and AIDS is well established (Fanta). It is a two way relationship and one
worsens the other.

7
2. BASELINE SURVEY
The baseline survey was conducted to establish the food and nutrition situation and
determine contribution of fish to diets in Ntchisi in the area of Traditional Authority
Nthondo. The area was chosen because it is an area where our collaborator World
Vision Malawi is working and one of the key interventions being implemented is fish
farming. This intervention is currently being promoted to all households in Nthondo
Area Development Programme (ADP). The baseline survey had two components:
the basic nutrition survey and interactive 24 hour recall. The basic nutrition survey
was conducted to:
a) Assess nutritional status of children 6-59 months of age,
b) Estimate the rates of morbidity in children 6-59 months,
c) Estimate the mortality rate of children under 5 years of age and their causes,
d) Estimate the crude mortality rate,
e) Assess infant and young child feeding practices and;
f) Assess the household food insecurity situation
g) Assess dietary diversity at household level.
The basic nutrition survey way then followed by a more detailed interactive 24 hour
recall based on Gibson (1992). The component targeted those households where fish
farming had just been initiated by World Vision Malawi.
2.1. Survey Methodology
Prior to field work, a number of preliminary activities were undertaken which
included; development of questionnaires, checklists, selection of clusters and
recruitment of enumerators and data entry personnel. Training of the field staff for
the survey was done by the researchers at Bunda College of Agriculture for 5 days.
The training consisted of instruction in general interviewing techniques, and field
procedures; a detailed review of items on the questionnaire, instruction and practice in
weighing and measuring children, and pretesting of the instruments which was done
conducted in a village five kilometers from Bunda. After the pre-test interviews,
indepth discussions were held to find out areas that needed modification and further
clarification and these were incorporated into the survey instruments. The survey was
conducted in October and November 2008.

8
2.1.1. Sampling procedure
The current survey was conducted in the area of Traditional Authority Nthondo,
Ntchisi district. This is the area where World Vision is operating and fish farming is
one of the interventions being implemented.
A two-stage cluster sampling technique as recommended by the National Nutrition
Survey Guidelines of Malawi (2002) was employed to select households that
participated in the nutrition survey. The most up to date and detailed population data
for Nthondo ADP was used. The cumulative population from the 24 Group Village
Headmen was 4807.
Table 1: Population from sampled Group Village Headmen and villages by age group
GVH Villages <5 yrs 5-14 years 15-64 yeas >65 years Total Population
Nthondo Kandodo 39 38 74 0 151
Kaponda Mwalukira 34 36 56 2 129
Msakachalo 40 56 63 0 146
Mandwe Mandwe 39 58 69 3 169
Mndinda Mndinda 40 41 72 3 146
Gaweni 32 45 69 1 147
Liwondwe II 47 49 70 3 169
Chioza 42 55 68 0 165
Khuntho 38 39 57 3 137
Sambakusi Moto 43 52 65 3 163
Mnjale Mnjale 34 49 60 3 163
Mpanang’ombe Mpanang’ombe 32 50 65 2 149
Matalala Kanjedza 32 59 61 2 154
Chisala 35 51 71 4 161
Ngolomi Gula 32 42 67 4 145
Chapulapula Gideon 32 42 67 4 145
Ndaya Bzyobzyo 36 48 67 0 151
Chikupila Chikupila 39 40 61 4 144
Langa Langa 39 45 60 4 148
Mataya Mphanda 37 43 61 5 146
Msankhire Msankhire 41 60 81 1 183
Chituza Chinyonga 37 53 87 1 178
Mtawaila Mtawaila 40 56 60 2 158
Nguluwe Mchere 38 69 68 3 175
Khondowe Nkhondowe 37 54 71 2 164
Chifwerekete Chifwerekete I,II 32 61 62 3 160
Mtongo Mtongo 45 38 62 2 129
Mngopi II Mngopi II 45 38 67 1 151

9
Chitumbikwa Nthenda 71 98 107 7 283
Chiziko Chiziko 35 44 82 6 167
Total 1163 1505 2060 76 4807
2.1.2. Sampling of clusters and households
The selected clusters were assigned to each of the survey teams. In each selected
cluster, the first household to be interviewed was randomly selected at village level,
by spinning a pen or bottle. The direction of the pen/bottle was followed and the first
household was randomly selected among the listed households falling in the
predetermined direction. The next household was the one on the right hand side of the
main entrance of the previous household. If the number of underfive children
measured fell below 30 after visiting 30 households, then additional households were
surveyed until the minimum required number of children was reached. In households
where children were absent during the survey, the households were revisited. Each
team of enumerators had a team leader who was responsible for sampling households.
2.1.3. Sample size
For this survey a total of 30 clusters (villages) were selected The distribution of the
clusters was based on the population sizes In each cluster, a minimum of 30
households was surveyed giving a minimum total of 900 households and 900 children
aged between 6-59 months in the three areas.
2.2. The nutrition survey
Administration of questionnaire and child measurement
The household questionnaire was administered to all selected households and mothers or
caretakers were the target respondents. All children aged between 6 and 59 months in
the selected households were measured. If the household did not have 6-59 months old
children, only the household questionnaire was administered which captured, among
other information, household demographics, mortality data, social economic status, and
food security and dietary diversity information.
All children 6-59 months old were eligible for anthropometric measurements. Mid upper
arm circumference (MUAC) measurements were taken from children aged 12 months
and above.

10
2.3. Variables measured and precision of measurements
2.3.1. Anthropometry
Standard methods of taking anthropometric measurements were followed according to
Gibson (2005) and Medicines Sans Frontiers (1995).
2.3.2. Weight
Weight for children under five years of age was measured in kilogrammes (kg) using a
25kg Salter scale. The scale was hooked on a strong sturdy beam and zeroed with the
weighing pant on. The scale was hanged at eye level for the enumerator to take the
readings. The weight was recorded to the nearest 0.1kg as soon as the indicator had
stabilized.
2.3.3. Height
For infants and children under 24 month of age, recumbent length was measured to the
nearest 0.1cm using a length board. For children aged 24 months of age and older,
height was measured to the nearest 0.1cm.
2.3.4. Mid upper arm circumference (MUAC)
MUAC was measured in centimeters using children’s MUAC tapes. The measurement
was taken on the left arm at the middle point between the elbow and the shoulder, while
the arm was relaxed. MUAC was measured and recorded to the nearest 0.1 cm.
2.3.5. Oedema
Bilateral Oedema is a measure of severe protein energy malnutrition (PEM), and is one
of the signs of kwashiorkor. Thumb pressure was applied to each of the child’s feet
simultaneously for three seconds (just the time to say one thousand and one, one
thousand and two, one thousand and three). If a pit remained on release of thumbs on
both feet (bilateral pitting), the child was classified as having nutritional Oedema.
Oedema does not have any cut-off points; however it is recommended that if >2% of
children in a population have Oedema; relevant action should be taken without delay
(Medicines Sans Frantieres, 1995).
2.3.6. Other Study Variables
Morbidity: Respondents were asked whether or not their children had suffered from
any illness in the 2 weeks preceding the survey.

11
Mortality: In all households visited, the total number of persons 5 years and older,
and those aged below 5 years was recorded. The respondents were then asked if in
the 12 months preceding the survey, there were any deaths in the two categories of
people. If death had occurred, the suspected causes of death were solicited and
recorded. Determination of the mortality rates gives a good indicator of the access to
health care and the sanitary condition in the population. The following mortality rates
were determined:
• The Crude Mortality Rate (CMR) was calculated as follows; Mortality Rate = n/ [[(n+N) + N] / 2] Where n = number of deaths in the last 12 months N = number of people alive on the day of the survey CMR is expressed per 10,000 people per day: CMR = MR x 10,000/ 365 days, as mortality data was collected over the previous 12 months.
• The Under 5 Mortality Rate was determined as the CMR given above. The defined limits for mortality rates are as follows:
• Under 5 years mortality rate, (<5yrs MR), 2/10,000/day indicated an alarming situation. 4/10,000/day indicated an emergency situation.
• Crude mortality rate, (CMR), 1/10,000/day indicated an alarm situation.
2/10,000/day indicated an emergency situation.
Dependency ratio: in all households, household composition based on the following categories was determined:
• Children under five years of age = p • 5 to 14.9 years of years = r • 15 years and older = S • The chronically ill = u • The elderly unable to work = v
Dependency ratio was calculated using the following formula:
Effective dependency ratio = p + r + u + v S
2.4. Food Insecurity and Dietary Diversity
The present survey included questions designed to solicit information on household
food security and dietary diversity situation. The dietary diversity tool comprising of
17 food types including fish based on the Fanta/FAO tools, which in Malawi, were
initially pre-tested in Mangochi and Mwanza (Mtimuni and Geresomo 2006).

12
2.5. Main Nutrition Indicators
In conformity with the national guidelines for nutrition surveys (MOH, 2003), acute
malnutrition (wasting) was the main nutrition indicator used to monitor the effect of
the nutritional uptake. The following definitions of acute malnutrition (wasting)
based on measurement of weight-and-height were used:
Level Definition
Global < -2 weight-for-height z-scores of NCHS / WHO reference mean and / or bilateral pitting oedema.
Severe < -3 weight-for-height z-scores of NCHS / WHO reference mean and / or bilateral pitting oedema.
The survey also used the definitions of acute malnutrition (wasting) based on
measurement of mid-upper arm circumference (MUAC). MUAC is known to
overestimate malnutrition rates in 6 to 12 month age groups. The analysis of MUAC
data was, therefore, limited to children aged 12 months or older. Based on the current
guidelines by Ministry of Health, MUAC is more linked to morbidity and care
practices and is interpreted as follows:
� MUAC ≥ 13.5 cm: satisfactory nutritional status
� MUAC ≥12.5 cm and <13.5 cm: low risk of mortality, moderate risk of malnutrition
� MUAC ≥12.0 cm and <12.5 cm: low risk of mortality, high risk of malnutrition
� MUAC ≥11.0 cm and <12.0 cm: moderate risk of mortality and high risk of malnutrition
� MUAC <11.0 cm: severe risk of mortality and malnutrition. Height for age, which is a measure of chronic malnutrition and weight for age, an
indicator of both chronic and acute malnutrition, were also been used in the survey.
Household food insecurity access score (HFIAS) and household dietary diversity
score (HDDS) based on the 6 food groups used in Malawi and expanded 12 food
groups which isolate some special food such as vitamin A rich and iron rich foods
have been included.

13
2.6. Data Collection, Entry and Analysis
Three interviewing teams comprising of four enumerators and a supervisor carried out
the fieldwork for the survey. Data entry was done concurrently in the field as data was
being collected. Data were double entered and analysed using Epi Info version 6.04b, a
word processing, database and statistics programme for Public Health.
The results are presented as frequencies, proportions, ratios and nutrition indices. In
order to assess the correlation between socio-economic status of the households and
the rates of malnutrition, wealth indices were calculated and associations made
between these and the nutrition indices. Households were classified as poor, better
off, or rich based on asset possession.
2.7 Interactive 24 hour recall
A modified 24 hour recall methodology was utilized to collect food consumption in
all the 98 households who had registered for fish farming through the Ntchisi RDP’s
Agricultural Extension Office of Ministry of Agriculture and Food Security) for
Nthondo area. In each household, the youngest eligible child (1 – 10 years) and the
mother were targeted for the dietary study and data was collected in
October/November 2008.
The interactive dietary recall method has been developed to fill the need for a rapid,
non-invasive dietary tool, one with a low respondent burden (Gibson and Ferguson,
2008). The method is easier, faster, and less expensive to use than the weighed
method, and it is less invasive; therefore, respondent compliance is enhanced.
Requirements:
1. Local artist was commissioned to draw and label typical foods of the study area so
that a food picture chart was created for the study area (Appendix 2). These were
pre-tested before finalization using participants similar to those in Nthondo
2. A local artisan was hired to mold some food items of varying sizes that were
commonly found in the study area (bananas, sweet potatoes, cassava, mangoes,
potatoes, sugar cane, and pawpaw). Real food items of the same size were
purchased and weighed to determine weight.
3. Local utensils (bowls, cups, graduated jugs, a set of standard measuring cups and
spoons) were to enhance amounts. Cups were used to determine the volume of any

14
liquid served such as tea, sweet bear. Bowls were used to measure porridge,
relishes and other mixed dishes.
4. Samples of commonly consumed staple food (Nsima of varying sizes) were
prepared using wheat flour which was highly salted to preserve the food so that it
lasted for several days. These were utilized to enhance amounts actually
consumed.
5. Dietary recall forms
Training of enumerators Two teams were deployed comprising of 4 enumerators and a team supervisor. These
had some previous experience in well-conducted surveys and the baseline nutrition
survey that had just been conducted in TA Nthondo. In fact the ones selected were
those who had been observed to be open, personable, mature, nonjudgmental,
sensitive to people and to mix well with the community. These were adequately
trained for 7 days on how to conduct the 24 hour recall interviews and the probing
that is required to ensure accuracy of the data collected. The training included actual
pre-testing in a community similar to the study area.
Data collection
Since in each household a mother and the youngest eligible child (1 to 6 years) were
targeted, one enumerator was scheduled to conduct the interactive 24 hour recall on
one household per day only. Two visits were made to the household. On Day 1, the
enumerator explained to the mother the purpose of the 24-hour recall which aims to
document all food and drink from time they go to bed until time go to bed the
following day. The respondent was then given the two food charts (one with baby
face for the child and a plain one for the respondent) which she was asked to complete
by ticking (√) the food as it is being eaten on the study day. In addition she was asked
to use a separate bowl and plate for eating their food so that amounts eaten could be
easily recalled on the recall day. She was then informed that the enumerator would
return on third day to complete the recall interview. The respondent was therefore
given two bowls, plates, two food charts and a pencil for marking the food chart
calendar.
On day 3, the investigator visited the respondent to document the food the respondent
ate the previous 24 hours guided by food chart that the respondent had ticked. For
each food consumed the following information was determined together with the

15
respondent; time the food was consumed, ingredients for the food items, preparation
method and quantities consumed. Quantities were determined using household
measures which all the researchers moved with from one household to the next.
16
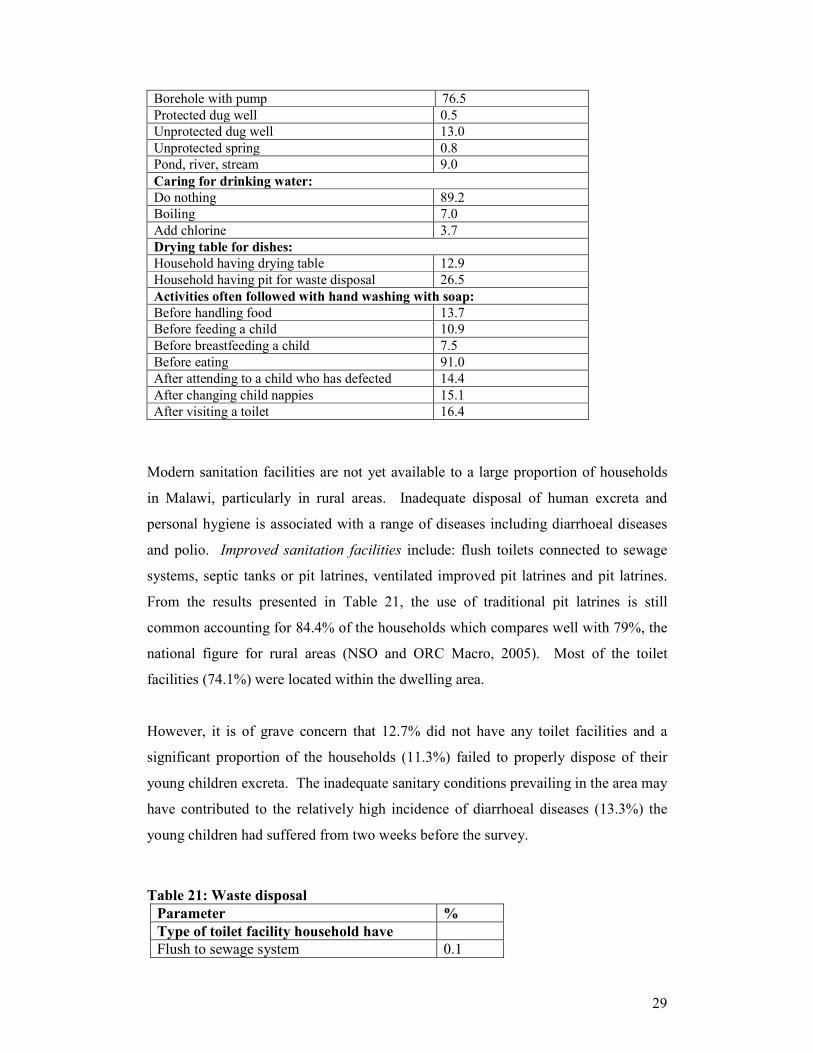
3. RESULTS AND DISCUSSION
3.1. Household Socio-economic Characteristics
The household demographic characteristics including household composition, age, sex,
marital status; educational level and main occupation of household head as well as the
average household size for the sample households are presented in Table 1.
Table 1: Households characteristics of surveyed households
Parameter Ntchisi
Sex of HH head n %
Male 699 76.6 Female 213 23.4
Marital status of respondents n=912 %
Married monogamous 668 73.2 Married polygamous 157 17.2 Widowed 40 4.4 Divorced 38 4.2 Single 9 1.0 Orphan (<18 years) 0 0
Household Composition: Age category Mean number (SD)
< 5 yrs 1.3±0.7 5-14 yrs 1.7±3.3 15-64 yrs 2.2±1.0 65+ 1.4±0.5
Mean household size 5.2±1.9 Proportion of chronically ill 1.0±0.01 Literacy rate” n %
Household heads able to read or write 610 66.9 Respondents able to read or write 445 48.8 Level of education (%) HH head
(n=699)
Respondent
(n=880)
Std 1-4 21.1 21.3 Std 5-8 36.0 30.6 Form 1-2 6.7 5.5 Form 3-4 7.9 3.4 Post secondary 0.5 0.0 Adult literacy 1.8 0.9 None 26.1 38.2
Main occupation (%) HH head
(n=699)
Respondent
(n=880)
Farmer 86.0 90.2 Business 3.3 3.6 Trades/vocational 3.6 0.3 Casual labour 3.1 2.7 Wage employment 3.2 0.1 None 0.8 3.2

17
A total of 912 households were interviewed. The majority of the respondents
(73.2%) were married in monogamous families hence most households were headed
by men (76.6%). The average household size was 5.2 persons which is higher than
the national average of 4.4 persons reported in the 2004 MDHS survey (NSO, ORC
Macro 2005).
The results further show that a higher proportion of household heads (66.9%) could
read and write while only 48.8% of respondents could read and write. Print media
therefore may not be the most effective way of disseminating change messages in
these communities.
Farming was the main occupation for the majority of the household heads (86.0%)
and respondents (90.2%). Thus very few were engaged in petty trading and regular
employment. Regular employment and businesses provide regular income to
households which may ensure stability of household food supplies.
Presented in Table 2 is the age distribution of the sampled underfive children by sex.
Categorizing of children based on age and sex helps in identification of the age groups
and sex of children that are most vulnerable to food insecurity and malnutrition.
The results show that in general, the proportion of male to female children was equal
(ratio of 1.0 for male to female children. This indicates that both sexes were
adequately represented in the sample.
Table 2: Age Distribution of 6 – 59 months old children
Age group
(months)
Boys Girls Total Ratio
n % n % n % M:F
6-17 135 51.9 125 48.1 260 25.2 1.3 18-29 128 52.7 115 47.3 243 23.5 0.9 30-41 112 48.7 118 51.3 230 22.3 1.0 42-53 122 54.7 101 45.3 223 21.6 1.2 54-59 29 38.2 47 61.8 76 7.4 0.6 Total 526 51.0 506 49.0 1032 100 1.0

18
3.2. Prevalence of malnutrition
Prevalence of malnutrition is presented by the type of manifestation that is; global
acute malnutrition (GAM) and severe acute malnutrition (SAM), based on weight for
height Z-scores. The results are presented in Table 3.
Table 3: Global and severe acute malnutrition by September 2008
Parametr %
GAM (WHZ < -2 SD) + oedema 1.8% (0.5%- 0.2%) SAM (WHZ <-3 SD)+ oedema 0.4% (0.0%- 1.0%) CI (confidence interval) was computed at 95% i.e. 95%CI
Both GAM and SAM among children 6-59 months of age were low and within the
acceptable range of less than 3% The situation however may change as the season
progresses towards January and February 2009 which are the peak lean months.
Presented in Figure 2 are the detailed prevalence of acute (wasting), chronic (stunting)
malnutrition and underweight in the area. Prevalence of stunting among the children
was 49% was the same as that reported for Kalira EPA, Ntchisi (Mtimuni, Geresomo
and Bello, 2007). This is higher than the national prevalence of 46% (Mtimuni and
Kazembe, 2008).
49
17.7
2.20.4
0
10
20
30
40
50
% of children
Stunting Underw eight Wasting GAM
Parameters
Prevalance of Malnutrition in surveyed area September 2008
%
Figure 2: Prevalence of wasting, stunting, underweight, and global acute malnutrition
3.3. Acute Malnutrition by Age
The acute malnutrition rates were low in most age groups (Table 4). It is of concern
however that among the 6 to 17 month age group, 3.9% were wasted (<-2 Zscore).
This is a reflection of poor weaning practices.

19
Table 4: Distribution of weight for height by age group September 2008
3.4. Chronic malnutrition
Prevalence of chronic malnutrition (stunting) among the children aged 6-59 months
by age group is presented in Table 5. Prevalence of stunting was high even among
the youngest infants and the effects appear to be cummulative so that there are no
improvements even among the older children. A child once stunted may never
achieve his/her genetically potential staure. The pattern is however similar to that
reported in the 2006 MICS study where 28.8% of infants (6 – 11 months) were
stunted and the prevalence increased to 50.7% for the 48 – 59 months old children
(Mtimuni and Kazembe, 2008).
Table 5: Distribution of height for age by September 2008
Age group
(months)
< -3 Z-Score
(Severely stunted)
<-2 Z-Score
(Stunted) ≥≥≥≥ -2 Z-Score
(Normal)
n % n % n %
6 to 17 30 11.5 106 40.8 154 59.2 18 to 29 54 22.2 115 47.5 128 52.7 30 to 41 42 18.3 122 53.0 108 47.0 42 to 53 46 20.6 116 52.0 107 48.0 54 to 59 19 25.0 47 61.8 29 38.2 Total 191 18.5 506 49.0 526 51.0
The possible contributory factors are early introduction of complementary foods, poor
quality complementary foods that are fed infrequently and relatively high prevalence
of morbidity as shown in Tables 11, 17, 18 and 19. Proper infant and young child
feeding should be included in all health and nutrition education cessions in Nthondo.
Age group
(months)
< -3 Z-Score
(Severely wasted)
<-2 Z-Score
(Moderately wasted) ≥≥≥≥ -2 Z-Score
(Normal)
n % n % n %
6 to 17 1 0.4 10 3.8 250 96.2 18 to 29 1 0.4 8 3.3 235 96.7 30 to 41 1 0.4 1 0.4 229 99.6 42 to 53 1 0.4 3 1.3 220 98.7 54 to 59 0 0 1 1.3 75 98.7 Total 4 0.4 23 2.2 1009 97.8

20
3.5. Underweight
Weight for age assesses prevalence of underweight, which is an indicator of both
chronic and acute malnutrition. Prevalence of underweight was 17.7% overall and
3.6% were severely underweight (Table 6).
Table 6: Distribution of Weight for age by September 2008
Age
group
(months)
< -3 Z-Score
(severely
underweight)
<-2 Z-Score
(moderately
underweight)
≥≥≥≥ -2 Z-Score
(Normal)
n % n % n %
6 to 17 14 5.4 52 20.4 208 80.0 18 to 29 13 5.3 52 21.4 191 78.6 30 to 41 4 1.7 37 16.1 193 83.9 42 to 53 5 13.5 35 15.7 188 84.3 54 to 59 1 1.3 6 7.9 70 92.1 Total 37 3.6 182 17.6 850 82.4
3.6. Crude and Underfive Mortality
Total number of underfive deaths and over-five deaths that had occurred over the
twelve month period and the corresponding mortality rates are presented in Table 7.
Determination of CMR (whole population) and UMR gives a good indicator of the
access to health care services and sanitary conditions in which the population lives.
Mortality rates were calculated as recommended by Save the Children Fund (2004).
The threshold for mortality are interpreted as follows:
Alert level = 1 death per 10,000 for CMR and 2 deaths per 10,000 for U5MR
Emergency level = 2 deaths per 10,000 for CMR and 4 deaths per 10,000 for U5MR.
The crude and underfive retrospective mortality rates were well below serious levels
of concern as shown in Table 7.
Table 8: Twelve month retrospective mortality rates, September 2008
Category Mortality rate
Under five* 0.31(0.03 – 1.11 Crude** 0.35(0.24 – 0.45)
* Total deaths/10,000 people / day) ** Deaths in children under five/10,000 children under five / day

21
The main causes of underfive mortality were fever and malnutrition each accounting
for 26.1% (Table 9). World Vision has worked in the area for some time in the areas
of food security and nutrition. This may explain the ability of respondents to recall
malnutrition as a cause of death. Among the five year olds and those older, persistent
cough (40%) was the main cause of death and causes of the remaining 3 deaths were
unknown. HIV/AIDS may significantly be contributing to both mortality and
morbidity in this area since all the stipulated causes are interlinked with HIV/AIDS.
Where causes are unknown, HIV and AIDS may play an important contributory role
since problems of disclosure and denial still exist in the entire country.
Table 9: Causes of death in the households by age grouping
Causes of death n %
Children underfive:
Diarrhoea Fever Cough with difficult breathing Malnutrition Unknown
3 6 3 6 5
13.0 26.1 13.0 26.1 21.7
5 years and above:
Diarrhoea Long illness Persistent cough Accident Unknown
1 1 4 1 3
10.0 10.0 40.0 10.0 30.0
3.7. Child and adult morbidity
Frequent infections and illnesses is one of the immediate causes of malnutrition.
During the survey, mothers and caretakers were asked if any of their children aged 6-
59 months had suffered from malaria, fever with difficult breathing (ARI) and
diarrhoea. The results are presented in Table 10.
Table 10: Prevalence of selected illnesses for children 6 -59 months 2 weeks before
survey
Type of illnesses n %
Fever 276 30.3 Fever with difficult breathing 119 13.0 Diarrhoea 121 13.3

22
From the results, fever (proxy for malaria) was the main cause of illness followed by
diarrhoea and fever with difficulty breathing. However, all these conditions have the
effects of reducing food and nutrient intake and at the same time increasing the body’s
demand for nutrients.
During growth monitoring and promotion cessions management of diarrhoea is often
covered since it is among the common problems among children. In the survey,
respondents whose children were repoted to have suffered from diarrhoeal were asked
to recall actions they had taken to manage diarrhoea. The results are presented in
Table 11.
Table 11: Management of diarrhoea, September 2008
Management n %
Continue breastfeed/ Increase food intake 5 8.8 Give salt/sugar solution 1 1.8 Go to health centre/post/hospital 45 78.9 Nothing 6 10.5
The majority of the mothers (78.9%) took their children who had diarrhoea to a
health facility. It is of concern that some respondents did nothing to manage the
diarrhoea. Proper and prompt action and management of these illnesses is critical to
ensure quick recovery so that catch-up growth can be achieved after illness. Health
education should therefore continue to be covered at every opportunity.
Table 12 presents information on attendance of growth monitoring and promotion for
children aged 6 to 59 months by district. It is of concern that 15.1% of the underfive
children have never been taken for growth monitoring and promotion (GMP). By
implication it means that they have not been immunized against the tubrclosis, polio,
pertosis, tetanus, measles which are given at GMP. In addition, such children are
denied the biannual vitamin A supplements, biannual deworming and their mothers
miss out on the health and nutrition messages expected to be included as part oo
GMP.

23
Table 12: Attendance of growth monitoring and promotion
Parameter n %
Ever visited growth monitoring clinics 774 84.9 Still attending growth monitoring clinics 698 76.5
3.8. Prevalence of dietary related non-communicable diseases
In Malawi, prevalence of dietary related non-communicable diseases is not known since no
systematic studies have been conducted. From hospital reports however, incidences seem to
be on the increase. During the survey, respondents were asked if there were any adults who
were suffering from such disorders. The results from the responses are presented in Table 13.
Table 13: Prevalence of selected dietary related non-communicable diseases
Chronic disorder
N %
High Blood pressure 16 1.8 Diabetes 2 0.2
Prevalence of high blood pressure was higher than that of diabetes mellitus. The
prevalence for each of these disorders may be higher than the rates presented here,
since the majority of the respondents may not have been tested for these disorders.
These findings are similar to those found in Kasungu, Mzimba and Phalombe
livelihood zones and reported in both the May 2008 and December 2008 MVAC
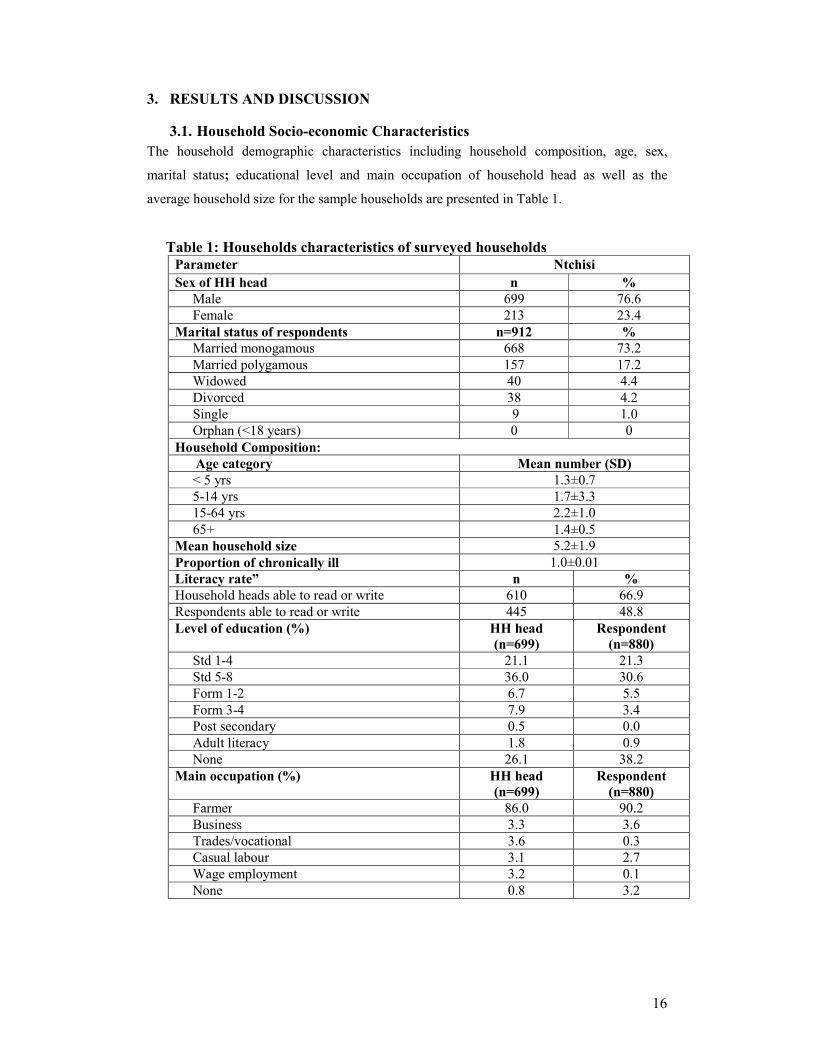
surveys (Mtimuni, Geresomo and Bello, 2008).
3.9. Infant and Young Child Feeding
Adequate nutrition is the cornerstone for survival as it is key to health and
development for current and future generations. Well-nourished children perform
better in school and grow into healthy adults. Nutrition also plays a critical role in
determining an individual's health status and ability to avert and overcome illness.
Infant and young child feeding practices were also investigated in this study.
Table 14 presents mean age and sex distribution of the eligible youngest children (6-
59 Months) that were captured during the survey. The results further show that there
was even sex distribution among children in all the three survey areas with a sex ratio
of almost 1.0. Hence both sexes were adequately represented.
24
Table 14: Age and sex of youngest eligible child
Parameter n %
Mean age (month ±SD) 25.6 (13.9) Sex of youngest eligible child
Male 526 51.0 Female 506 49.0
Information on breastfeeding practices that were followed for the youngest child is
presented in Table 15.
Table 15: Breastfeeding practices for the youngest underfive children
Parameter %
Period baby put to the breast:
Within the first hour 79.0 After the first hour 20.1 Never 0.6 Don’t know/remember 0..3 Other practices:
Child received colostrums 84.5 Child ever breastfed 84.4 Child currently breastfed 45.0 Child ever bottle fed 6.0
Breast-feeding is practically universal and this is true for Malawi, the results show
that the majority of the children had been put to the breast within the recommended
period after birth. It is pleasing to note that at least 84.5% of all children received
colostrum after birth although this is based on the mother’s recall. Colostrum is
essential for building up immunity in newly born babies to protect them from the
common childhood illnesses.
The results also show that only a small proportion of mothers (6%) ever bottle fed
their children. This practice is discouraged since it is difficult under village
conditions to keep the bottles sterile. All extension workers should be encouraged to
include appropriate infant and child feeding practices in health and nutrition sessions
so that most mothers adopt the essential nutrition actions (ENAs) when caring and
feeding their children (MOH, 2008).

25
While breast-feeding was practiced by most mothers, the results show that exclusive
breast-feeding is not universally practiced (Table 16).
Table 16: Period complementary foods were introduced
Parameter %
One month 7.3 Two months 2.6 Three months 4.7 Four months 15.1 Five months 14.9 Six months 36.8 > Six months 3.4
A significant proportion of mothers (44.6%) had introduced complementary foods to
their youngest children before the age of six months. It is of grave concern that some
of them had actually introduced other foods even within the first month of birth. Even
those who had indicated to have introduced at the correct age, this may actually be a
reflection of knowledge rather than practice. An in-depth study will have to be
conducted to establish the actual prevalence of exclusive breast feeding and unearth
the factors that motivate the current feeding practices or act as constraints to
improving feeding practices.
Presented in Table 17 are the types of foods and liquids that were introduced as
complementary foods. Vitamin and mineral supplement really refer to vitamin A
supplement that is given biannually by Ministry of Health for children age 6 months
and older. Fruit juice is likely to be the sweetened and artificially coloured drinks.
Thus most of the foods used were nutritionally inadequate.
Table 17: Type of complementary foods and liquids introduced
Type of food given since the child was
born
%
Vitamins, mineral supplements 76.3 Plain water 82.1 Sweetened /flavoured water 59.3 Tea or infusion 57.9 Fruit juice 40.6

26
Infant formula 9.5 Tinned, powdered or fresh milk 26.5 Other liquids 70.7 Porridge 75.1 Mashed food 70.7
Time of introducing complementary foods is a critical period in the lives of children
because this is a period that the children are learning to eat new types of food and at
the same time are exposed to the danger of infectious microorganisms if the weaning
foods are contaminated. Weaning foods should therefore be handled hygienically and
introduced at an appropriate time.
In addition to appropriate introduction of complementary foods, meal frequency is
equally important for adequate food and nutrient intake to ensure proper growth and
development of the children. Table 18 presents information on complementary
feeding of youngest child.
Table 18: Complementary feeding practices of youngest child day before survey
Parameter n %
Children who received food previous day 757 83.0 Meal frequency previous day: Once 64 7.0 Twice 386 42.3 Three times 289 31.7 Four times 18 2.0 Five times 2 0.2 More than 5 times 1 0.1 Type of food given to youngest child previous day: Staple (cereals, roots, tubers, plantains) 757 83.0 Fruits 79 8.7 Vegetables 642 70.4 Legumes 211 23.1 Animal/fish foods 149 16.3 Fats/sugar 235 25.8 Prepared special meals for child 305 33.4 Special meal composition (n=305):
Staple (cereals, roots, tubers, plantains) 284 31.1 Fruits 59 6.5 Vegetables 75 8.2 Legumes 56 6.1 Food from animals 38 4.2

27
Fats/sugar 122 13.4 Reasons for not preparing special meals (n=466):
Don’t know how to do 3 0.3 Lack of time 151 16.6 Lack of food 250 27.4 Child sick 6 0.7 Lack of money 52 5.7 Other 4 0.4
The results show that meal frequency was low since the majority of households fed
their children three times or less per day. This is too low for the children to get the
required nutrients from the typical bulky Malawian diet comprising of the staple eaten
with vegetables all of which have low energy and nutrient density. The National
Guidelines for complementary feeding recommend that young children should be fed
four to six times per day to meet their nutritional requirements. It is important that
children should be fed adequately all the time for proper growth and development.
Some mothers prepared special meals for their children. The majority of meals were
prepared from staples. Mothers who failed to prepare special meals for their children
indicated “lack of food” as the main reason for do so. Care givers and mothers should
be encouraged to prepare multi-mix complementary foods. These are likely to be
more nutritious than the plain staples.
Consumption of varied types of foods and meal frequency are a measure of food
availability and access as well as dietary diversity at household level. Low meal
frequency may lead to poor nutrition and deterioration of general health of household
members.
3.10. Dwelling Unit, Water and Sanitation
The type of material used for flooring of dwelling house is not only an indicator of the
economic standing of the household but is also an indicator of potential exposure to disease-
causing organisms. Overall, 98.1% of all households live in residences with floors made of
earth, sand, or dung, while only 1.9% live in houses with finished floors made of cement.

28
Table 19: Main materials for the dwelling house and households assets
Parameter %
Main materials for dwelling house Eath, sand /mud 97.7 Dung 0.4 Cement 1.9 Number of rooms for the dwelling house <2 rooms 9.0 2-3 rooms 71.8 4 rooms and above 19.1 Household assets Electricity 0.7 Radio 54.2 Television 0.7 Refrigerator 0.1 Bicycle 32.7 Motorcycle 0.2 Car or truck 0.4 Main sources of fuel household use LPG natural gas 0.1 Charcoal 0.1 Firewood 99.7
3.11. Water and Sanitation
Safe drinking water and appropriate sanitation facilities are basic necessities for good
health. Since water can be a significant carrier of diseases such as cholera, typhoid
and other diarrheal diseases. Drinking water can also be tainted with chemical,
physical and radiological contaminants with harmful effects on human health. In the
survey area, most of the households (78%) obtained drinking water from improved
water sources since they used one of the following types of supply: public tap,
borehole or protected well. However, the water is likely to be contaminated since
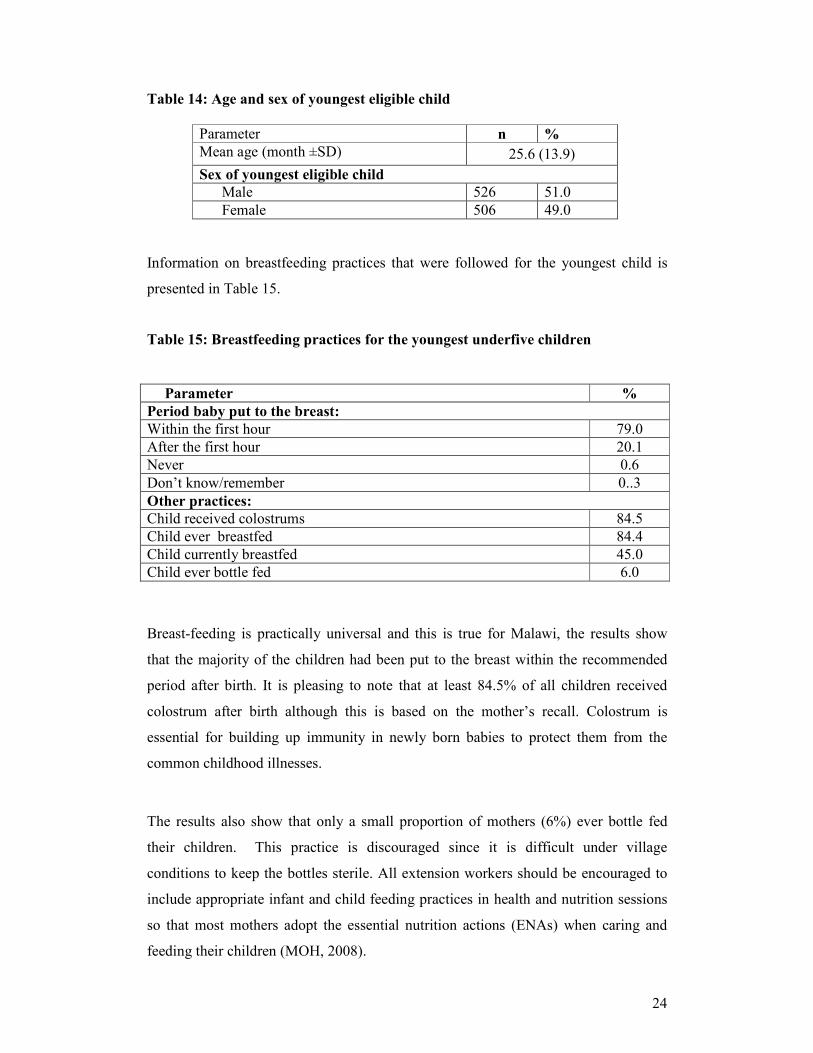
most of the households do nothing to maintain its safety while in the home (Table 20).
Table 20: Main sources of drinking water
Parameter %
Main sources of drinking water: Public tap 0.1
29
Borehole with pump 76.5 Protected dug well 0.5 Unprotected dug well 13.0 Unprotected spring 0.8 Pond, river, stream 9.0 Caring for drinking water: Do nothing 89.2 Boiling 7.0 Add chlorine 3.7 Drying table for dishes:
Household having drying table 12.9 Household having pit for waste disposal 26.5 Activities often followed with hand washing with soap: Before handling food 13.7 Before feeding a child 10.9 Before breastfeeding a child 7.5 Before eating 91.0 After attending to a child who has defected 14.4 After changing child nappies 15.1 After visiting a toilet 16.4
Modern sanitation facilities are not yet available to a large proportion of households
in Malawi, particularly in rural areas. Inadequate disposal of human excreta and
personal hygiene is associated with a range of diseases including diarrhoeal diseases
and polio. Improved sanitation facilities include: flush toilets connected to sewage
systems, septic tanks or pit latrines, ventilated improved pit latrines and pit latrines.
From the results presented in Table 21, the use of traditional pit latrines is still
common accounting for 84.4% of the households which compares well with 79%, the
national figure for rural areas (NSO and ORC Macro, 2005). Most of the toilet
facilities (74.1%) were located within the dwelling area.
However, it is of grave concern that 12.7% did not have any toilet facilities and a
significant proportion of the households (11.3%) failed to properly dispose of their
young children excreta. The inadequate sanitary conditions prevailing in the area may
have contributed to the relatively high incidence of diarrhoeal diseases (13.3%) the
young children had suffered from two weeks before the survey.
Table 21: Waste disposal
Parameter %
Type of toilet facility household have
Flush to sewage system 0.1

30
Pour flush latrine 0.1 Improved pit latrine (VIP) 1.9 Traditional pit latrine 84.4 No facilities or bush or open pit 13.5 Location of toilet : Within dwelling compound 74.1 Outside the dwelling compound 13.4 Disposal of young children (0-3 years) stools: Children always use toilet 2.0 Thrown into toilet 61.8 Thrown outside the yard 10.7 Buried in the yard 0.6 No young children in the household 24.8 Presence of hand washing facility close to
toilet
2.0
3.12. Household food security
For a household to be food secure, its members should have access to adequate and
nutritious foods all the time. Households may access food through own production or
purchasing. During the survey, respondents were asked to indicate their main sources
of food and the results are presented in Table 22.
Table 22: Main Source of food for households
Quite a significant proportion of households mainly relied on purchased food in September.
Unless household income was adequate, such households are likely to be food insecure. In
fact over one half of the households had sought Ganyu (60.7%) compared to 16.6% who had
offered Ganyu. in the last 12 months.
Vegetable production is one of the ways that households can increase incomes and
directly improve food availability and access. Table 23 presents information on
vegetable garden ownership and use of the vegetables by households. The majority of
households did not have vegetable gardens. However, it is encouraging that about
Food Source Ntchisi
n=910 %
Own food production 604 66.2 Purchased food 260 28.5 Borrowed food 1 0.1 Food gift 8 0.9 Ganyu 34 3.7 Food for work 3 0.3
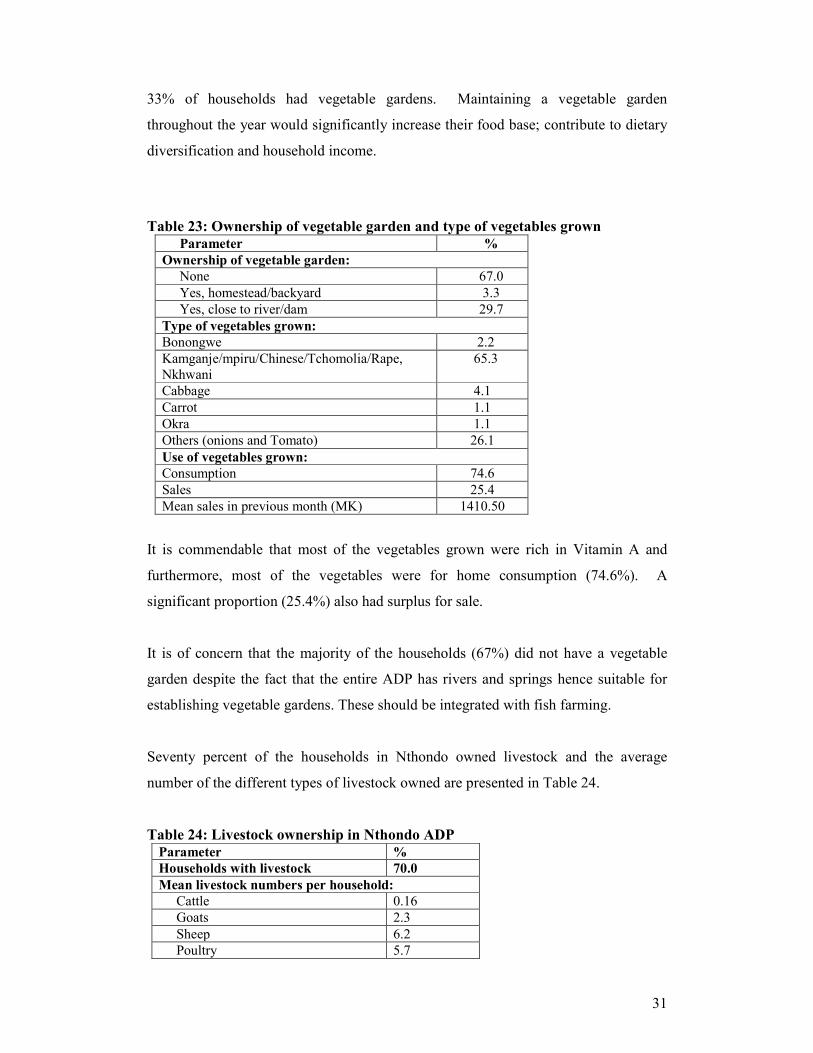
31
33% of households had vegetable gardens. Maintaining a vegetable garden
throughout the year would significantly increase their food base; contribute to dietary
diversification and household income.
Table 23: Ownership of vegetable garden and type of vegetables grown
Parameter %
Ownership of vegetable garden:
None 67.0 Yes, homestead/backyard 3.3 Yes, close to river/dam 29.7
Type of vegetables grown:
Bonongwe 2.2 Kamganje/mpiru/Chinese/Tchomolia/Rape, Nkhwani
65.3
Cabbage 4.1 Carrot 1.1 Okra 1.1 Others (onions and Tomato) 26.1 Use of vegetables grown: Consumption 74.6 Sales 25.4 Mean sales in previous month (MK) 1410.50
It is commendable that most of the vegetables grown were rich in Vitamin A and
furthermore, most of the vegetables were for home consumption (74.6%). A
significant proportion (25.4%) also had surplus for sale.
It is of concern that the majority of the households (67%) did not have a vegetable
garden despite the fact that the entire ADP has rivers and springs hence suitable for
establishing vegetable gardens. These should be integrated with fish farming.
Seventy percent of the households in Nthondo owned livestock and the average
number of the different types of livestock owned are presented in Table 24.
Table 24: Livestock ownership in Nthondo ADP
Parameter %
Households with livestock 70.0
Mean livestock numbers per household: Cattle 0.16 Goats 2.3 Sheep 6.2 Poultry 5.7

32
Pigs 0.9 Other small animals 2.2
The ADP has undulating hills and valleys with numerous springs and rivers. Therefore the
area has great potential for fish farming and vegetable growing In fact World Vision is
promoting households to engage in these activities as a feasible means of ensuring household
food security all year round. Respondents were asked whether or not they were engaged in
the two activities. Presented in Table 26 are results related to fish farming. Only 2.3% of the
respondents had functioning fish ponds which had existed for about 6 years on average.
Fish harvesting was conducted twice per year and most of the fish (69%) were sold (Table 25)
There is room for improvement in the current project activities. These include proper
management of ponds to increase fish production so that utilization of fish in the home can
also increase.
Table 25: Fish farming Activities in the ADP
Parameter Response
Households with functioning fish ponds 2.3% Mean number of fish ponds 1.6 Sources of fish fingerings: World Vision 79.2% Fellow farmers 20.8% Mean number of years fish ponds in existence 6.1 Average number of fish harvested 57. (81.1) Mean number of times fish harvested 2.0 Main use of fish products: Consumption 31.0% Sales 69.0% Mean sales in previous harvest (MK) 3337.50
3.13. Household food insecurity scale and dietary diversity
Food security is a complex and multidimensional concept therefore its assessment/
measurement is problematic, technically difficult and data collection costly. In the
current survey household food insecurity access scale (HFIAS - comprising of 9
questions) originally developed by FANTA and being promoted by FAO were used.
These had already been pre-tested in Malawi in 2006.
The tool is based on the principle that experience of food insecurity causes some
predictable reactions and responses (Coates, Swindale and Bilinsky, 2006). It is based

33
on the principle that experience of food insecurity causes predictable reactions and
responses that can easily be captured and quantified through a survey. The results can
then be summarized into the food secure and those who are food insecure. Food
insecure households can be classified as mildly, moderately or severely food insecure.
The second tool that was included is a measure of dietary diversity (DD). It refers to
the number of different food groups consumed by an individual or by any member of
a household over a 24-hour period. It is a good indicator to use because a more
diversified diet is associated with a number of positive outcomes such as child
nutritional status, birth weight. In addition a more diversified diet is highly
correlated with energy and protein adequacy, percentage of high quality protein
(animal sources) and household income (Swindale and Bilinsky, 2006). In this survey,
the household DD score is reported. However, the tool can be used to collect
information at both individual and household level.
3.14. Household Food Insecurity Access Scale (HFIAS)
Respondents were asked each of the 9 HFIAS questions (Module E) and the responses
are presented in Table 26.
Table 26: Responses to the 9 HFISA questions

34
Parameters Never Rarely Sometimes Often
% % % %
Q1 Ever worried that food not enough 45.0 35.7 16.8 2.5
Q2 Not able to eat preferred foods: 51.0 33.1 14.4 1.5
Q3 Ate limited types of food (no diverse diet):
31.9 38.0 18.6 11.4
Q4 Ate foods not preferred: 54.9 31.7 11.8 1.5
Q5 Ate smaller meal (reduced portion): 55.4 31.0 12.7 0.9
Q6 Reduce meal frequency: 52.9 37.0 9.2 1.0
Q7 Had no food at all in house: 80.6 16.9 2.2 0.3
Q8 Go to bed hungry: 82.5 15.9 1.6 0.0
Q9 Members did not eat all day: 93.1 6.4 0.5 0.0
The most critical questions are the last three which indicate vulnerability of
households to poverty and food insecurity. Table 27 presents the wealth groups
identified in the area.
Table 27: Wealth ranking by September 2008
Rank n %
1_poor 390 42.8 2_ave 360 39.5 3_rich 162 17.8 Total 912 100
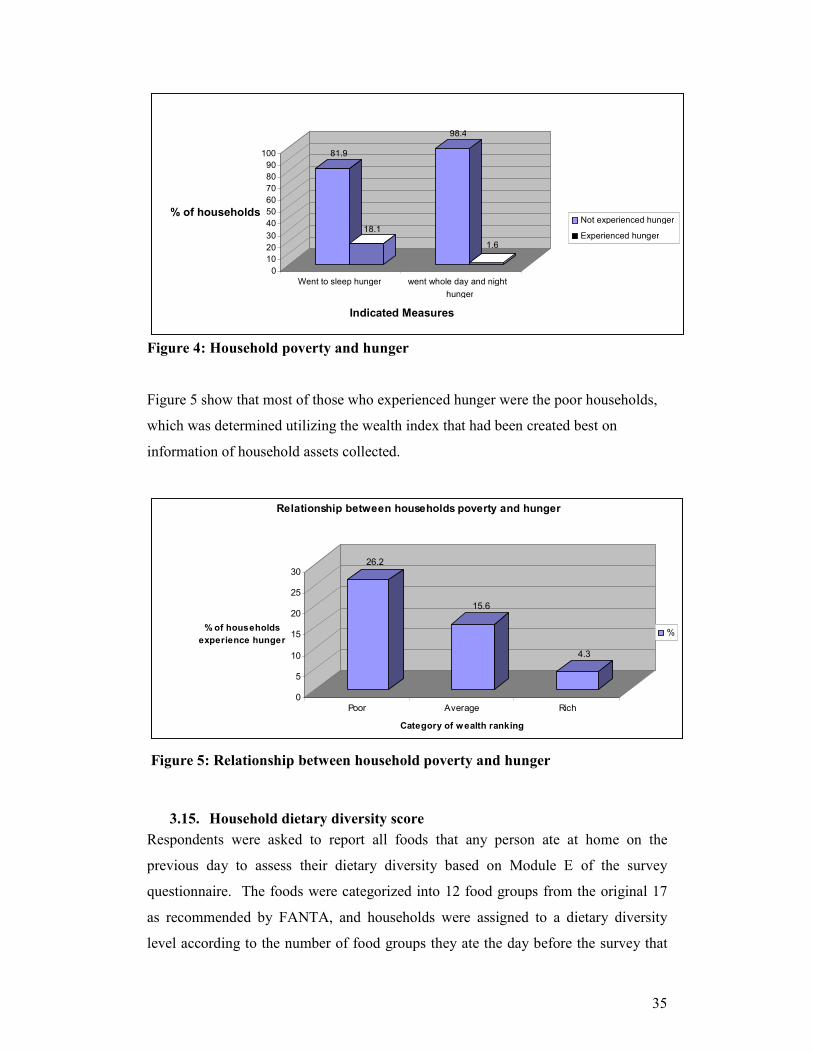
. Households seriously experiencing hunger and were the relatively poor (Table 27)
where some members stayed the whole day without eating and those who had no food
for a whole day and night. The results for the two categories are presented in Figure
4. Although the majority of the households were relatively well off at the time the
situation may change during the period extending from December to February.
35
Figure 4: Household poverty and hunger
Figure 5 show that most of those who experienced hunger were the poor households,
which was determined utilizing the wealth index that had been created best on
information of household assets collected.
26.2
15.6
4.3
0
5
10
15
20
25
30
% of households
experience hunger
Poor Average Rich
Category of wealth ranking
Relationship between households poverty and hunger
%
Figure 5: Relationship between household poverty and hunger
3.15. Household dietary diversity score
Respondents were asked to report all foods that any person ate at home on the
previous day to assess their dietary diversity based on Module E of the survey
questionnaire. The foods were categorized into 12 food groups from the original 17
as recommended by FANTA, and households were assigned to a dietary diversity
level according to the number of food groups they ate the day before the survey that
81.9
18.1
98.4
1.6
0
10
20
30
40
50
60
70
80
90
100
% of households
Went to sleep hunger went whole day and night
hunger
Indicated Measures
Not experienced hunger
Experienced hunger

36
is; low (3 or less), medium (4 or 5 food groups) and high (6 or more food groups).
Table 28 presents the proportion of households in each dietary diversity level.
Table 28: Proportion of households in each DD level
DD Level
n %
1 = Low DD 391 42.9
2= Medium DD 360 39.5 3=High DD 161 17.7 Total 912 100
The results show that the main stay of the diet is cereal since it is the main staple
eaten with vegetables particularly for households with low dietary diversity (LDD).
As dietary diversity improved, more costly foods, that is, animal foods were included
in the diet as well (Table 29).
Table 29: Consumption of the 12 food groups and beverages by level of diversity
Food group Parameters
Low DD Medium DD High DD
Cereals 99.1 100 100 Tubers 1.9 13.2 53.2 Vegetable 94.9 97.8 100 Fruit 3.7 17.6 17.2 Meat 3.3 18.1 44.8 Eggs 0.4 5.7 14.7 Fish 3.0 18.5 32.8 Legumes 25.8 58.1 58.6 Milk 0.6 4.0 39.7 Oil 1.4 31.3 78.4 Sweets 4.9 51.1 74.1 Spices 9.7 22.5 42.2 Soft beveerage (Coffe, tea) 12.1 30.8 44.0 Alcohol (beer, kachasu) 6.5 10.1 16.4
Consumption of alcoholic beverages also increased and this may be an underestimate
since some of male household members were not willing to disclose. The actual types
of foods predominately eaten by at least 40% of the households at different levels of
dietary diversity for the whole survey population are shown in Table 30.
Table 30: Typical foods consumed day before the survey by dietary diversity level

37
Lowest dietary diversity (
≤ 4 food groups out of 12)
Medium dietary diversity
(4 or 5 out of 12)
High dietary diversity (≥ 6 food
groups out of 12)
Cereals Cereals Cereals Vegetables Vegetables Vegetables
Fruit Fruit
Tubers
Oils and fats
Sweets
Spices, tea, etc
Alcoholic beverages
.
Use of 12 food groups makes it possible to measure consumption of highly nutritious
foods such as vitamin A rich foods, iron rich foods or animal foods. Figure 6 shows
the dietary diversity categories of households in the three surveys areas and compares
this to their consumption of animal source iron-rich foods.
62.4
24.9
12.7
89.6
81
21.1
89.5
0
10
20
30
40
50
60
70
80
90
Low DD Medium DD High DD Micronutrient
rich food
Iron from
animals
Iron from
vegetables
Iron from both
Veg&animal
Figure 6: Household dietary Diversity levels and consumption of iron-rich animal foods
In Malawi, food has been grouped into six groups, which the Malawi nation is
expected to use as a guide to ensure a diversified diet likely to meet energy and
nutrient requirements. The 17 food groups were therefore regrouped to the 6 food
groups, which are: Staples (cereals and roots and tubers and plantains); Legumes;
vegetables; fruits; animal foods and fats/oils. These were then categorized as follows
to measure dietary diversity; low (2 or less), medium (3 food groups) and high (4 or

38
more food groups). Presented in Table are findings based on both the 6 food groups
and the 12 food groups.
Table 32: Dietary Diversity based on 6 and 12 food groups
Dietary diversity level 6 Food groups 12 food groups
Low DD 46.5 62.4 Medium DD 35.0 24.9
High DD 18.5 12.7
The results show that use of 6 food groups overestimate dietary diversity and
underestimate those who have low dietary diversity. The six food grouping is
probably too simplistic and this may be the right time to re view the guideline.
The traditional way of obtaining the dietary diversity based on 6 food groups is to ask
respondents whether they or anyone in the household ate food the previous day from
six listed food groups (list-based approach). In contrast, the 12 food group dietary
diversity score is obtained by asking respondents to recall all foods eaten during
meals or for snacks by themselves or others in the household the previous day. When
a DD6 score was created using the recall data, the mean number of food groups (3.4)
was higher than the mean number of food groups reported using the list-based
approach (3.12). This implies that respondents reported more foods when the recall
approach was used, most likely because they were prompted about snacks and mixed-
food dishes.
3.16. Interrelationships between the dietary indicators and nutritional status
An attempt was made in the analysis of data to test existence of associations between
various indicators. The results show some positive outcomes. There are more food
secure households and fewer severely food insecure households in male-headed
households (p< 0.001) compared with female headed households. This indeed
confirms the vulnerability of female-headed households to food insecurity and
malnutrition.

39
The severely food insecure households have the lowest dietary diversity (p<0.001) and they
consume fewer iron rich foods than other households. Food secure households on the other
hand consumed both more vitamin A rich foods and iron rich foods than severely food
insecure households (<0.001). However the proportion of households who consumed iron
rich foods were practically the same among the food secure, mildly food insecure and the
moderately food insecure households.
Stunting is a chronic malnutrition indicator (long term) of poverty and malnutrition. It has
remained high in Malawi for a long time. It is the only nutrition indicator that showed
association with HFIAS as shown in Table 32 where it is clear that stunting goes up as food
security status declines (p<0.05). There were no observed relations between HFIAS and
either underweight or wasting. Likewise, a significant trend was observed of lower stunting
prevalence with increased dietary diversity (p<0.05).
Table 32: HFIAS with stunted Cross tabulation
Status Normal Stunted Total
Food Secure 50.6% 49.4 100.0% Mild Food Insecure 63.6% 36.4% 100.0% Moderate Food In secure
48.4% 51.6 100.0%
Severe Food Insecure 52.5% 47.5% 100.0% Total 51.5% 48.5% 100.0%
PART 11: DETAILED 24 HOUR INTERACTIVE RECALL
A total of 90 households had registered for fish farming activities in the study area. These
households were included in the baseline survey. Food consumption of the youngest
eligible child (1 to 6 years) and mother was collected using the interactive 24 hour recall as
described in the methodology. The food consumption data was converted to energy and
nutrient values using NutriSurvey 2007 for windows computer package. To this effect the
children were divided into two groups (1 – 3 years and 3 – 6 years) while mothers were
divided into four groups (19 – 24 years, 25 – 50 years, 51 – 65 years and >65 years). The
grouping is based on the groupings of the computer package used for analysis. Presented in
Table 33 are the details of the sample size.

40
Table 33: sample size for interactive 24-hour recall by age grouping
Age category n Mean weight Mean height
1 3 years 34 12.1 84,7 4 – 6 years 30 16.7 96.9
19 – 24 years 16 55.5 - 25 – 50 years 50 58.4 - 51 – 65 years 19 57.9 - >65 years 4 -
The details of the interactive 24 hour recall and the findings have been presented in a separate report “Contribution of fish to food and nutrition security in T/A Nthondo Ntchisi district, central Malawi “
41
4. CONCLUSION AND RECOMMENDATIONS
The findings have revealed that acute malnutrition was within the acceptable ranges
but chronic malnutrition was widespread among the underfive year old children. This
problem is serious and persistent in Malawi and any nutrition intervention should aim
at curbing the problem. The contributory factors include presence of such diseases as
diarrhoea, respiratory infections, malaria which is also endemic in Malawi, low
dietary diversity, food insecurity and poverty coupled with inadequate access to health
facilities.
It should also be noted that most of the diseases were preventable. Promotion of use
of chemically treated bed nets may reduce the prevalence of malaria while education
on importance of using safe drinking water, sanitary facilities may reduce prevalence
of diarrhoea and encouraging mothers to have their children vaccinated against the six
immunizable diseases such as measles and whooping cough may also reduce child
mortality significantly. For the entire family, promotion of appropriate health
practices and health facility seeking behaviour among household members would help
to prevent some of the diseases that caused some of these deaths.
In this regard, prevention, control and treatment of parasitic and infectious diseases
would assist to control malnutrition and improve the nutritional status of children and
other household members. Nutrition related non-communicable diseases are also
becoming common and affecting a large proportion of adults in Malawi.
Dietary and child feeding practices were inappropriate in that the foods were low in
energy and nutrient density. It is likely that poor dietary practices contributed much to
the high prevalence of malnutrition among the under five children. Providing training
to mothers and household members on appropriate dietary practices will help to
improve the situation.
The area has potential for fish farming; the initiative taken to promote fish farming is
commendable. It is likely to be successful since there are other households who have
tried it.

42
With this background in mind, it is prudent to seriously consider intensifying efforts
aimed at alleviating malnutrition, and some of the possible ways are suggested in
addition promoting fish farming to ensure that the benefits translate into improved
food and nutrition security:
a. There is need to develop an effective nutrition surveillance system that will help
to generate information that can be used for planning and implementing targeted
nutrition and food security programmes that aim at improving the nutritional
status of communities.
b. Conceited effort must be applied towards improving family food security. In this
regard, special attention should focus on the increased production and ultimate
consumption of diversified and locally grown but nutrient-dense foods.
c. Where cultivable land availability is a constraint, and the acquisition of high
technology farming systems and /or crop diversification is still elusive,
households should be assisted to diversify to off-farm income generating
activities.
d. Rigorous campaigns should be mounted towards improving hygienic and sanitary
domestic conditions, especially ownership and use of safe latrines to prevent
infectious diseases that contribute to ill health and malnutrition.
e. All extension workers should be encouraged to include appropriate infant and
child feeding practices in health and nutrition sessions so that most mothers adopt
the essential nutrition actions (ENAs) when caring and feeding their children

43
REFERENCES
1. Gibson R.S. (2005). Principles of Nutritional Assessment. Oxford University Press, Oxford.
2. Medicins Sans Frontieres (1995). Nutrition Guidelines. 1st Edition. Paris: Medicins Sans Frantieres.
3. National Economic Council (1998). Nutrition Facts for Malawian Families 2nd
edition. Lilongwe, Malawi: Inter Ministerial Food and Nutrition Committee.
4. National Statistical Office and ORC MACRO (2001). Malawi Demographic and Health Survey 2000. Zomba, Malawi: National Statistical Office.
5. National Statistical Office and ORC MACRO (2005). Malawi Demographic
and Health Survey 2004. Zomba, Malawi: National Statistical Office.
6. Save the Children UK (2004). Emergency Nutrition Assessment: Guidelines for field workers. Save the Children UK, London.

44
APPENDIX 1: BASELINE NUTRITION SURVEY IN NTCHISI – NTHONDO ADP
September 2008
MODULE A : IDENTIFICATION
A1 Day/Month/Year of Interview /____ /____ / 2008
A6 Cluster No. /___/___/
A 2 ADP Name …………………………………… A7 Household No. /___/___/___/
A3 District Name……………………………….. A8 Enumerators Name …………………………………………..
A4 TA Name………………………………………. A9 Supervisor Name ………………………Sign…………………..
A5 Village Name ………………………………………
MODULE B : HOUSEHOLD SOCIO-ECONOMIC CHARACTERISTICS
Household Composition
B1 Household Head Name (Decision maker) …………………………………………..
B2 Household Head Sex Male ………………….…1 Female ………….….…2
B3 Household Head Age (in completed years)
/___/___/
B4 Marital Status of Household Head
Currently Married – monogamous……….1 Currently Married – polygamous………...2 Widowed………………………………….………….3 Divorced………………………………….. …….…4 Single…………………………………………………..5 Orphan (under 18 years of age)………….6
In answering B5 to B10 exclude visitors (< 2 weeks)
B5 Total Number of members in this HH Total Number of people 15 to 64 Yrs
B6 Total Number of children under 5 Yrs
B7 Total Number of children 5 to 14 Yrs
B8 Total Number of people 15 to 64 Yrs
B9 Total Number of people above 65 Yrs
B10 Total Number of chronically ill in this HH (Over one month)
Education
B11 Household Head can read or write Yes ………………….…1 No….. ………….….…2

45
B12 Respondent can read or write Yes ………………….…1 No….. ………….….…2
B13 Level of Education of HH Head
Std 1-4……………….. Std 5-8…………………2 Form 1-2………………3 Form 3-4……………..4 Post secondary…….5 Adult literacy……….6 None…………………….7
B14 Level of Education of Respondent
Std 1-4………………..1 Std 5-8…………………2 Form 1-2………………3 Form 3-4……………..4 Post secondary…….5 Adult literacy……….6 None…………………….7
Household Occupation, Assets and Food Security
B15 Household Head Main Occupation
Farming……….…………….1 Business .………………….2 Trades/vocational skills………………………….3 Casual labour……………4 Wage employment……5 None………………………….6
Other (specify)………….……….
B16 Respondent main occupation
Farming……….…………….1 Business .…………………2 Trades/vocational skills………………………….3 Casual labour……………4 Wage employment……5 None…………………………6
Other (specify)………….……….
B17 Did any household member seek ganyu since last growing (last 12 months)
Yes ………………….…1 No….. ………….….…2
B18 Did this household offer ganyu to anyone since last growing season (last 12 months)
Yes ………………….…1 No….. ………….….…2
2⇒ B20
B19 How often did you offer ganyu since last growing season (last 12 months)
/_____/___/
B20 Does the household have livestock Yes………………….1 No……………………2
2⇒ B22
B21 Household livestock numbers
Cattle___/___ Goats_____/___ Sheep___/____ Poultry____/___ Pigs/____/____ Other small animals___
B22 Does the household have functioning fish ponds
Yes………………….1 No……………………2
2⇒ B29
B23 How many fish ponds does the household have
________
B24 For how long does has the household have fish ponds (Completed years)
______Years

46
B25 Where does the household get the fish fingerings?
World Vision Fisheries Department (Government) From fellow farmers Other specify_______________
B26 On average how much do you harvest (Kgs)
_______.___
B27 How many times do you harvest per year
B28 Main use of harvested fish
Consumption……………………………………1 Sales………………………………………………..2 Gift………………………………………………….3 Other specify…………………………………….
2⇒ B29
B29 Average amount of sales? /____/____/____/____./___/___MK
B30 Household vegetable garden No……………………………………..1 Yes, homestead………………….2 Yes, close to river/dam………3
1⇒⇒⇒⇒ B34
B31 Type of vegetables grown in the garden Yes………………….1; No……………….2
Bonongwe___ Tomato_____ Okra_____ Onions____ Carrots______ Kamuganje______ Tchomolia______ Rape______Mpilu_____ Cabbage_____ Chinese Cabbage____ Other specify______________________
B32 Main use of vegetable products
Consumption……………………………………1 Sales………………………………………………..2 Gift………………………………………………….3 Other specify……………………………………..
2⇒⇒⇒⇒ B33

47
B33 Amount of sales during last month /____/____/____/____./___/___MK
B34 Current household main source of food
Own Food Production……………………….…1 Purchased Food…………………………………..2 Borrowed Food…………………………………….3 Food Gift………………………………………………4 Food Aid……………………………………………….5 Ganyu ………………………………………………….6 Food for work………………………………………7 Other (specify)_____________________
B35 Main material of the dwelling floor?
Natural Floor: Earth/sand/mud …………………………………….1 Dung…………………………………………………………2 Finished Floor: Tiles………………………………………………………..3 Cement…………………………………………………….4 Carpet……………………………………………………..5
B36 Number of rooms in dwelling unit /_____/
B37
Does your household have: A. Electricity? B. A radio? C. A television? D. A refrigerator?
Yes No A. Electricity………………………………….1 2 B. Radio………………………………………….1 2 C. Television…………………………………..1 2 D. Refrigerator……………………………….1 2
B38
Does any member of your household own:
A. Bicycle B. A motorcycle C. A car or truck
Yes No A. Bicycle ……………………………………………..1 2 B. Motorcycle………………………………………..1 2 C. Car or truck………………………………………1 2
B39 What type of fuel does your household mainly use for cooking?
Electricity …………………………………………………….1 LPG/natural gas…………………………………………….2 Biogas…………………………………………………………….3 Kerosene………………………………………………………..4 Coal, lignite……………………………………………………5 Charcoal…………………………………………………………6 Firewood, straw………………………………………….…7 Dung……………………………………………………………….8 Other specify………………………………………………….
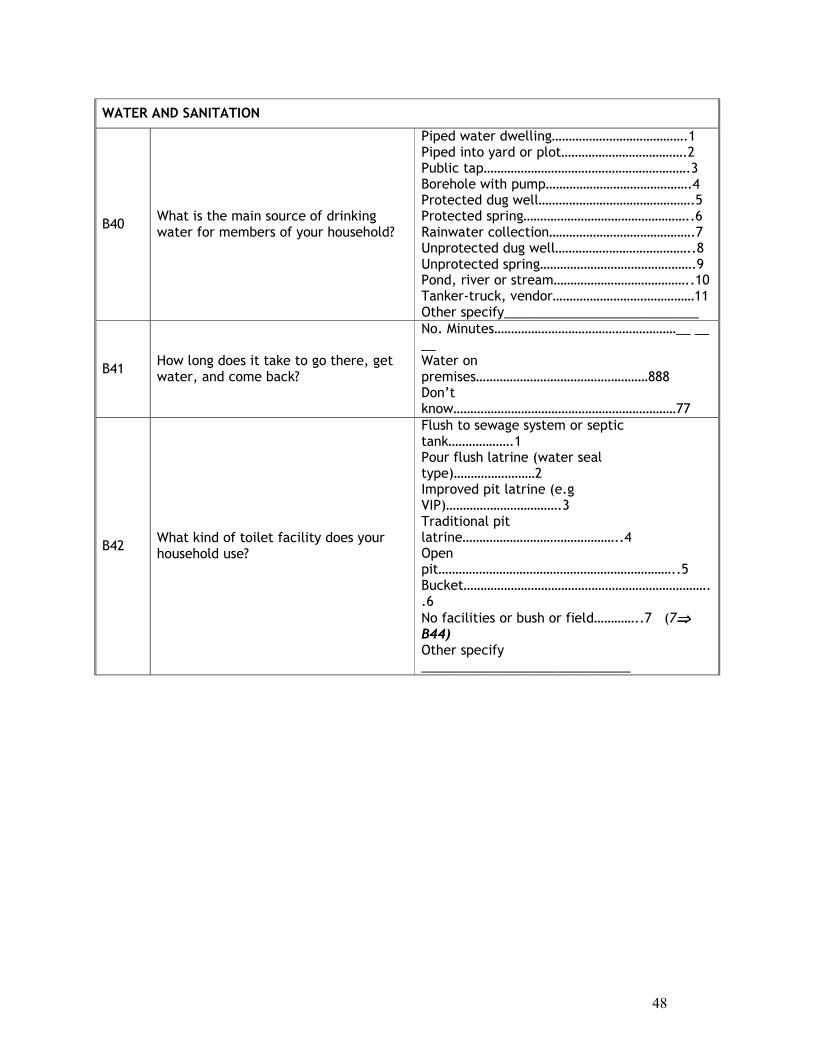
48
WATER AND SANITATION
B40 What is the main source of drinking water for members of your household?
Piped water dwelling………………………………….1 Piped into yard or plot……………………………….2 Public tap…………………………………………………….3 Borehole with pump…………………………………….4 Protected dug well……………………………………….5 Protected spring…………………………………………..6 Rainwater collection…………………………………….7 Unprotected dug well…………………………………..8 Unprotected spring……………………………………….9 Pond, river or stream…………………………………..10 Tanker-truck, vendor……………………………………11 Other specify___________________________
B41 How long does it take to go there, get water, and come back?
No. Minutes………………………………………………__ __ __ Water on premises……………………………………………888 Don’t know…………………………………………………………77
B42 What kind of toilet facility does your household use?
Flush to sewage system or septic tank……………….1 Pour flush latrine (water seal type)……………………2 Improved pit latrine (e.g VIP)…………………………….3 Traditional pit latrine………………………………………..4 Open pit……………………………………………………………..5 Bucket………………………………………………………………..6
No facilities or bush or field…………..7 (7⇒⇒⇒⇒ B44) Other specify _____________________________
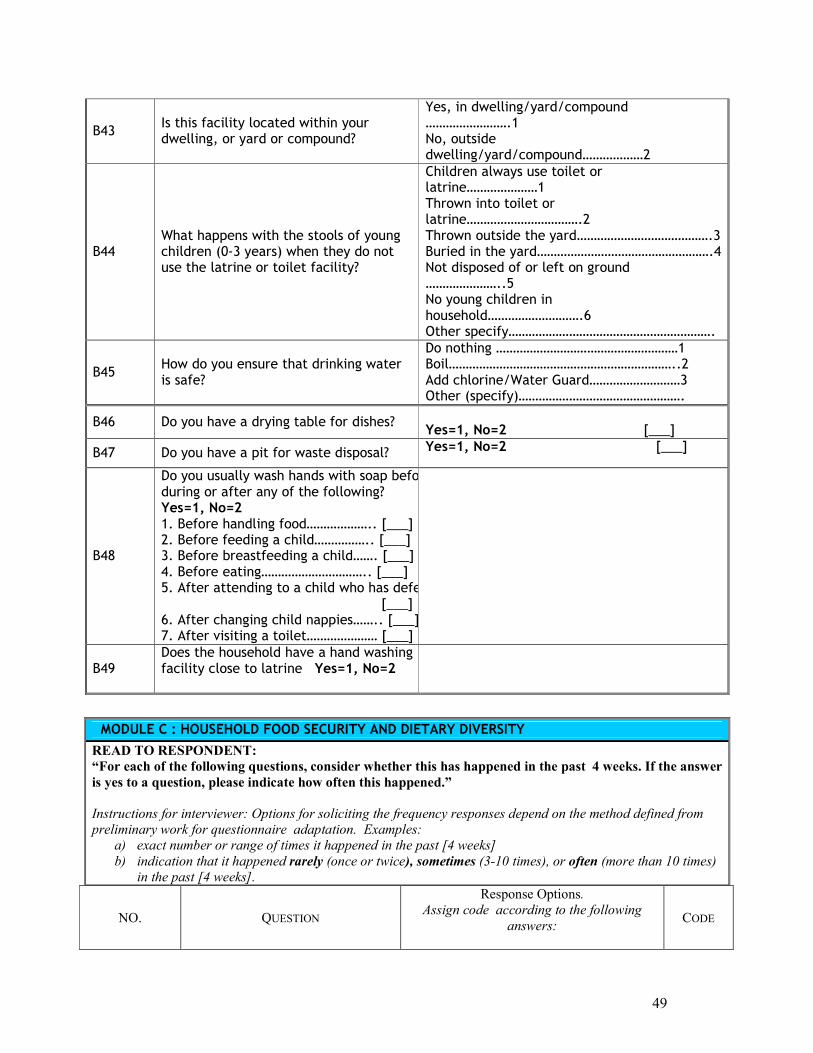
49
NO. QUESTION
Response Options. Assign code according to the following
answers:
CODE
B43 Is this facility located within your dwelling, or yard or compound?
Yes, in dwelling/yard/compound …………………….1 No, outside dwelling/yard/compound………………2
B44 What happens with the stools of young children (0-3 years) when they do not use the latrine or toilet facility?
Children always use toilet or latrine…………………1 Thrown into toilet or latrine…………………………….2 Thrown outside the yard………………………………….3 Buried in the yard…………………………………………….4 Not disposed of or left on ground …………………..5 No young children in household……………………….6 Other specify…………………………………………………….
B45 How do you ensure that drinking water is safe?
Do nothing ………………………………………………1 Boil…………………………………………………………..2 Add chlorine/Water Guard………………………3 Other (specify)………………………………………….
B46 Do you have a drying table for dishes? Yes=1, No=2 [___]
B47 Do you have a pit for waste disposal? Yes=1, No=2 [___]
B48
Do you usually wash hands with soap before, during or after any of the following? Yes=1, No=2 1. Before handling food……………….. [___] 2. Before feeding a child…………….. [___] 3. Before breastfeeding a child……. [___] 4. Before eating………………………….. [___] 5. After attending to a child who has defected [___] 6. After changing child nappies…….. [___]7. After visiting a toilet………………… [___]
B49 Does the household have a hand washing facility close to latrine Yes=1, No=2
MODULE C : HOUSEHOLD FOOD SECURITY AND DIETARY DIVERSITY
READ TO RESPONDENT:
“For each of the following questions, consider whether this has happened in the past 4 weeks. If the answer
is yes to a question, please indicate how often this happened.”
Instructions for interviewer: Options for soliciting the frequency responses depend on the method defined from
preliminary work for questionnaire adaptation. Examples:
a) exact number or range of times it happened in the past [4 weeks] b) indication that it happened rarely (once or twice), sometimes (3-10 times), or often (more than 10 times)
in the past [4 weeks].

50
(0) No = it did not happen in the past [4 weeks]
(1) Rarely = once or twice in the past [4 weeks]
(2) Sometimes = three to ten times in the past [4 weeks]
(3) Often = more than 10 times in the past [4 weeks] Or locally-defined terms of frequency corresponding to
these ranges C1. 1
In the past [4 weeks], did you worry that your household would not have enough food?
0 = No If yes: ask respondent “how often did this
happen?” 1 = Rarely (1-2 times) 2 = Sometimes (3-10 times) 3 = Often (more than 10 times)
….|___|
C1.2 In the past [4 weeks], did it happen that you or any household member were not able to eat the kinds of foods you would have preferred to eat because of lack of resources?
0 = No If yes: ask respondent “how often did this
happen?” 1 = Rarely (1-2 times) 2 = Sometimes (3-10 times) 3 = Often (more than 10 times)
….|___|
C1.3 In the past [4 weeks], did it happen that you or any household member had to eat a limited variety of foods because of lack of resources?
0 = No If yes: ask respondent “how often did this
happen?” 1 = Rarely (1-2 times) 2 = Sometimes (3-10 times) 3 = Often (more than 10 times)
….|___|
C1.4 In the past [4 weeks] did it happen that you or any household member had to eat some foods that you really did not want to eat because of lack of resources?
0 = No If yes: ask respondent “how often did this
happen?” 1 = Rarely (1-2 times) 2 = Sometimes (3-10 times) 3 = Often (more than 10 times)
….|___|
C1.5 In the past [4 weeks] did it happen that you or any household member had to eat a smaller meal than you felt you needed because there was not enough food?
0 = No If yes: ask respondent “how often did this
happen?” 1 = Rarely (1-2 times) 2 = Sometimes (3-10 times) 3 = Often (more than 10 times)
….|___|
C1.6 In the past [4 weeks] did it happen that you or any household member had to eat fewer meals in a day because there was not enough food?
0 = No If yes: ask respondent “how often did this
happen?” 1 = Rarely (1-2 times) 2 = Sometimes (3-10 times) 3 = Often (more than 10 times)
….|___|
C1.7 In the past [4 weeks] did it happen that there was no food to eat of any kind in your house, because of lack of resources to get food?
0 = No If yes: ask respondent “how often did this
happen?” 1 = Rarely (1-2 times) 2 = Sometimes (3-10 times) 3 = Often (more than 10 times)
….|___|

51
C1.8 In the past [4 weeks] did it happen that you or any household member went to sleep at night hungry because there was not enough food?
0 = No If yes: ask respondent “how often did this
happen?” 1 = Rarely (1-2 times) 2 = Sometimes (3-10 times) 3 = Often (more than 10 times)
….|___|
C1.9 “In the past [4 weeks] did it happen that you or any household member went a whole day and night without eating anything at all because there was not enough food?”
0 = No If yes: ask respondent “how often did this
happen?” 1 = Rarely (1-2 times) 2 = Sometimes (3-10 times) 3 = Often (more than 10 times)
….|___|
2.0 DIETARY DIVERSITY QUESTIONNAIRE
Please describe the foods (meals and snacks) that you ate yesterday during the day and night, whether at home or outside the home. Start with the first food eaten in the morning. [Household level: consider foods eaten by any member of the household, and exclude foods purchased and eaten outside of the home]
Question number
Food group
Examples
Yes=1 No=0
C2.1
Cereals
bread, noodles, biscuits, cookies or any other foods made from millet, sorghum, maize, rice, wheat + insert local foods e.g. nsima, porridge or pastes or other locally available grains
C2.2
Vitamin A rich vegetables and tubers
pumpkin, carrots, squash, or sweet potatoes that are orange inside + other locally available vitamin-A rich vegetables(e.g. sweet pepper)
C2.3 White tubers and roots
white potatoes, white yams, cassava, or foods made from
C2.4 Dark green leafy vegetables
dark green/leafy vegetables, including wild ones + locally available vitamin-A rich leaves such as cassava leaves etc.
C2.5 Other vegetables
other vegetables (e.g. tomato, onion, eggplant) , including wild vegetables
C2.6 Vitamin A rich fruits
ripe mangoes, cantaloupe, dried apricots, dried peaches + other locally available vitamin A-rich fruits
C2.7 Other fruits other fruits, including wild fruits
C2.8 Organ meat (iron-rich)
liver, kidney, heart or other organ meats or blood-based foods
C2.9 Flesh meats beef, pork, lamb, goat, rabbit, wild game, chicken, duck, or other birds
C2.10 Eggs
C2.11 Fish fresh or dried fish or shellfish
C2.12 Legumes, nuts and seeds
beans, peas, lentils, nuts, seeds or foods made from these
C2.13 Insects insect larvae, lake fly, ants
C2.14 Milk and milk products
milk, cheese, yogurt or other milk products

52
C2.15 Oils and fats oil, fats or butter added to food or used for cooking
C2.16 Sweets sugar, honey, sweetened soda or sugary foods such as chocolates, sweets or candies
C2.17 Spices, condiments, beverages
spices(black pepper, salt), condiments (soy sauce, hot sauce), coffee, tea, alcoholic beverages OR local examples
E2.18 Household level only
Did you or anyone in your household eat anything (meal or snack) OUTSIDE of the home yesterday? Yes=1 No=0
E 2 19
Did you receive coupons? Yes=1 No=0
MODULE D : INFANT / CHILD FEEDING
Applicable to the youngest child of the HH child mother / caretaker
D1 Youngest Eligible Child Name …………………………………………..
D2 Youngest Eligible Child Date of birth (day/month/year)
/____/____/20__/ Verified in a health document……1 Reported by mother/caretaker…..2
D3 Youngest Eligible Child Age (completed months)
/___/___/
D4 Youngest Eligible Child Sex Male ………….…1 Female …….….…2
D5 Mother / Caretaker Age (in completed years)
/___/___/
Breastfeeding
D6 How long after birth “Child Name” was first put to the breast?
Within the first hour……………………..1 After the first hour……………………….2 Never…………………………………………….3 Don’t know/don’t remember……….77
D7 Has “Child Name” received the first milk (colostrums) ?
Yes ……………1 No….. …….…2

53
D8 Has “Child Name” ever been breastfed? Yes ………………1 No……….….…2
D9
Since “Child name” was born, did you ever give him any of the following? Yes…..1; No……..2; Don’t know/don’t remember……77
Vitamins, minerals supplements /__/ Plain water /__/ Sweetened/flavoured water /__/ Tea or infusion /__/ Fruit juice /__/ Infant formula /__/ Tinned, powdered or fresh milk /__/ Other liquids /__/ Porridge /__/ Mashed or solid food /__/
D10
When did you start other food apart from breast milk?
/_____/_____ months
D11
Is “Child Name” still breastfed? Yes ………………….…1 No….. …………2
D12
Has “Child Name” ever been or is bottle-fed?
Yes ………………….…1 No…..….….…2
Complementary feeding
D13 Did “Child Name” receive food yesterday?
Yes ………….…1 No….. ………2
2 ⇒⇒⇒⇒ D16
D14 How many times “Child Name” receive food yesterday?
Once…………….1 Twice…………..2 Three times...3
Four times…………….….4 Five times…………………5 More than Five times…6
D15 What kind of food did “Child Name” receive yesterday? Yes………….1; No ………….2
Staples ……….../__ Vegetables….…/__ Fruits………….…/__
Legumes…….………../___ Food from animals../___ Sugar / Fats ……..…/__
D16 Did you prepare special meals for “Child Name” yesterday?
Yes ………1 No….. ………2 2 ⇒⇒⇒⇒D18

54
D17 Specify composition of special meal for “Child Name”? Yes……………….1 No………………………2
Staples /___/Vegetables/___/ Fruits/___/Legumes/___/ Food from animal/___/Fat/sugar/___/
D18 What prevented you to prepare “Child Name” special meals yesterday ?
Don’t know how to do………………….1 Lack of time…………………………………2 Miss food………………………………………3 Other (specify) ________________
MODULE E : MORBIDITY AND HOUSEHOLD MORTALITY
Children Recent Morbidity and Caring
E1
In the past 2 weeks, did any children between 6-59 months have any of the following illnesses?
Fever with Chills ………………………..1-Yes ; 2- No Fever with difficult breathing…….1-Yes ; 2- No Diarrhea………………………………..…….1-Yes ; 2- No
1 ⇒⇒⇒⇒ E2
E2 During this diarrhea episode, what did you do?
Continue to breastfed / increase food intake……..1 Cease breastfeeding / giving food…………………………2 Give salt for diarrhea at home………………………………3 Go to church / preacher …………………………………….. 4 Go to traditional healer…………………………………………5 Go to health center-post / hospital………………………6 Nothing……………………………………………………………… …7 Other (specify) _____________________________
E3
Have you ever visited “Growth Monitoring Clinics” with any of your children between 6-59 months?
Yes ………………….…1 No….. ………….….…2
E4
Do you still visit “Growth Monitoring Clinics” with any of your children between 6-59 months?
Yes ………………….…1 No….. ………….….…2
E5 Is any adult of this household suffering from blood pressure?
Yes ………………….…1 No….. ………….….…2
E6 Is any adult of this household suffering from diabetes?
Yes ………………….…1 No….. ………….….…2
Household mortality
E8 Has anyone (excluding visitors) died in this HH during the last 12 months (August to now)?
Yes ………………….…1 No….. ………….….…2
2 ⇒⇒⇒⇒ F1

55
MODULE F : 6-59 MONTHS CHILDREN ANTHROPOMETRY, VITAMIN A, FEEDING PROGRAMME
Child No
Sex 1=Male 2=Female
Date of Birth (dd/mm/yy)
Length /Height (cm)
Weight (Kg)
Oedema Yes=1 No=2
Deworming last 6 * months Yes=1 No=2
Measles *
Vit A *
** Child in feeding prog. last 6 mos If yes specify. No=0
**Child in feeding program now. If yes specify. No=0
1
2
3
4
5
Key: *Measles &Vitamin A: 1=Yes with health passport confirmation; 2=Yes without health confirmation; 3=No; 4=Not applicable. **Feeding program: 1=NRU; 2=SFP; 3=CTC/OTP; 4= Other specify________________ Name of Field Investigator________________Signature_______________Date____/_____/___ Name of Supervisor_________________Signature___________________Date____/___/__
E9 Number of deaths among under 5 Yrs /___/___/ Sex M [___] F [___]
E10 Number of deaths between 5-14 Yrs /___/___/ Sex M [___] F [___]
E11 Number of deaths between 15-64 Yrs /___/___/ Sex M [___] F [___]
E12 Number of deaths above 65 Yrs /___/___/ Sex M [___] F [___]
E13
Under 5 Yrs Causes of deaths (1) Diarrhoea, (2) Bloody diarrhoea, (3) Measles, (4) Fever, (5) Cough with difficult breathing, (6) Malnutrition, (7) Accident, (8) Unknown, (9) Other (specify) (88)
Death 1 Death 4
Death 2 Death 5
Death 3 Death 6
E14
Above 5 Yrs Causes of deaths (1) Diarrhoea, (2) Long illness, (3) Age, (4) Fever, (5) Persistent cough, (6) Accident, (7) Unknown, (8) Other (specify) (88)
Death 1 Death 4
Death 2
Death 5
Death 3 Death 6
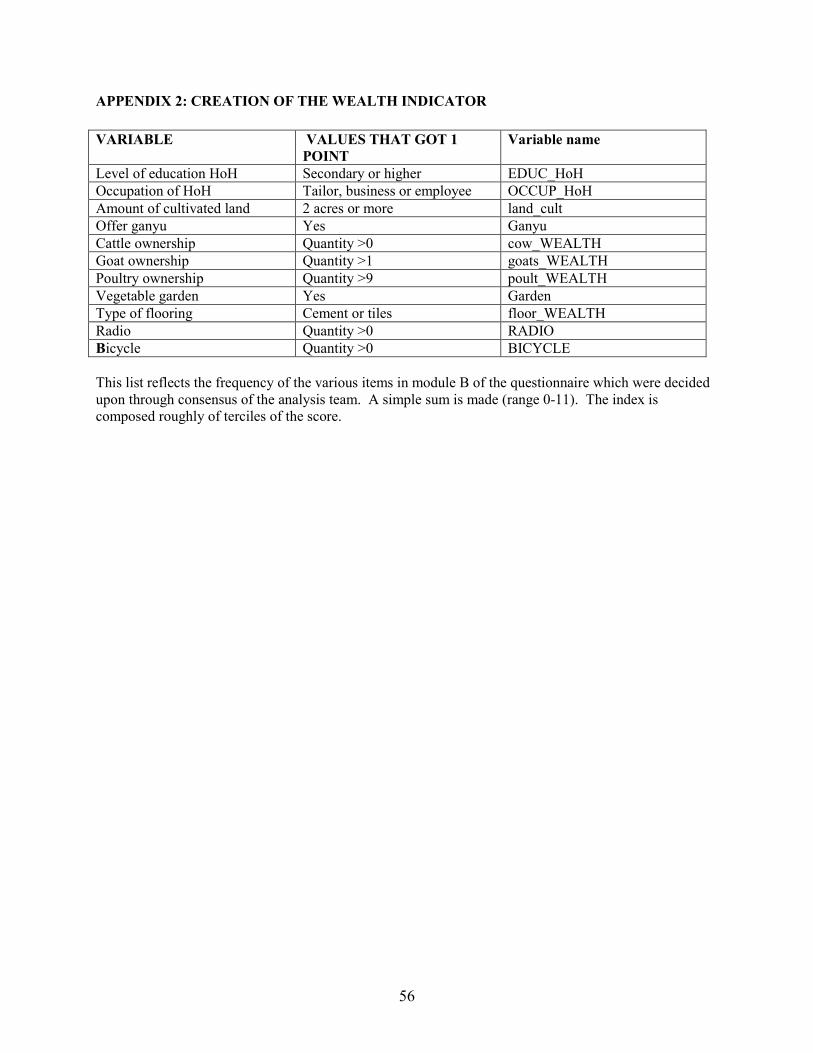
56
APPENDIX 2: CREATION OF THE WEALTH INDICATOR
VARIABLE VALUES THAT GOT 1
POINT
Variable name
Level of education HoH Secondary or higher EDUC_HoH Occupation of HoH Tailor, business or employee OCCUP_HoH Amount of cultivated land 2 acres or more land_cult Offer ganyu Yes Ganyu Cattle ownership Quantity >0 cow_WEALTH Goat ownership Quantity >1 goats_WEALTH Poultry ownership Quantity >9 poult_WEALTH Vegetable garden Yes Garden Type of flooring Cement or tiles floor_WEALTH Radio Quantity >0 RADIO Bicycle Quantity >0 BICYCLE This list reflects the frequency of the various items in module B of the questionnaire which were decided upon through consensus of the analysis team. A simple sum is made (range 0-11). The index is composed roughly of terciles of the score.