Embed Size (px)
Citation preview

By Bradley Coyne, Kushal Chukkapalli (KC), Hari Vijayan.
November 6, 2014

Agenda
Introduction
Business
Recent Financial Performance
Macroeconomic Review
Management Philosophy
Financial Analysis
Financial Valuation
Recommendation
Introduction
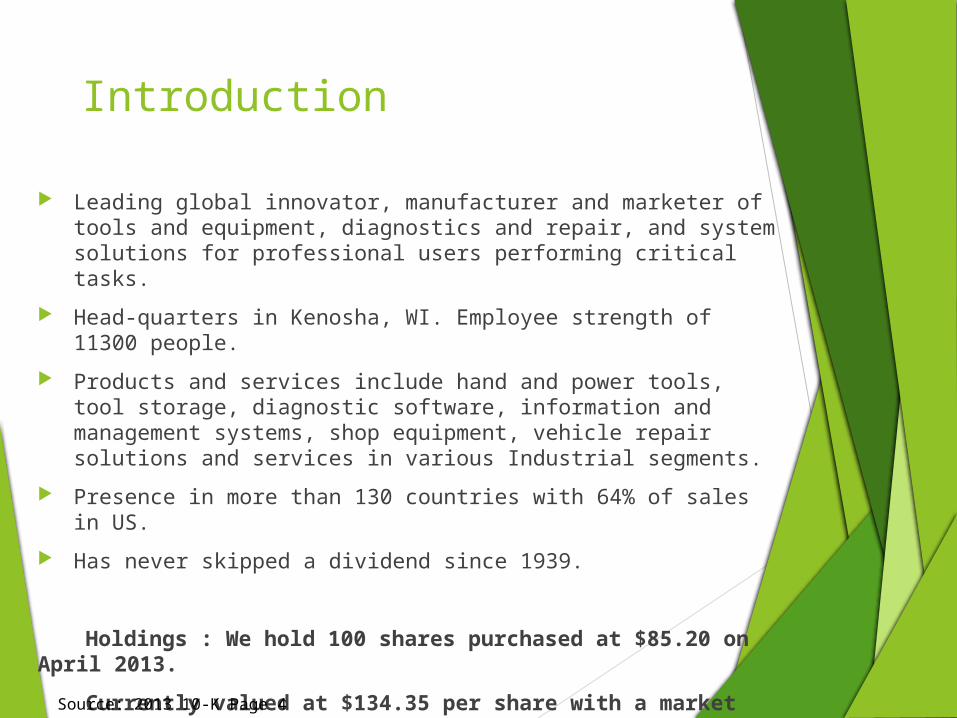
Leading global innovator, manufacturer and marketer of tools and equipment, diagnostics and repair, and system solutions for professional users performing critical tasks.
Head-quarters in Kenosha, WI. Employee strength of 11300 people.
Products and services include hand and power tools, tool storage, diagnostic software, information and management systems, shop equipment, vehicle repair solutions and services in various Industrial segments.
Presence in more than 130 countries with 64% of sales in US.
Has never skipped a dividend since 1939.
Holdings : We hold 100 shares purchased at $85.20 on April 2013.
Currently valued at $134.35 per share with a market value of $13,435 as of yesterday.
Source: 2013 10-K Page 4
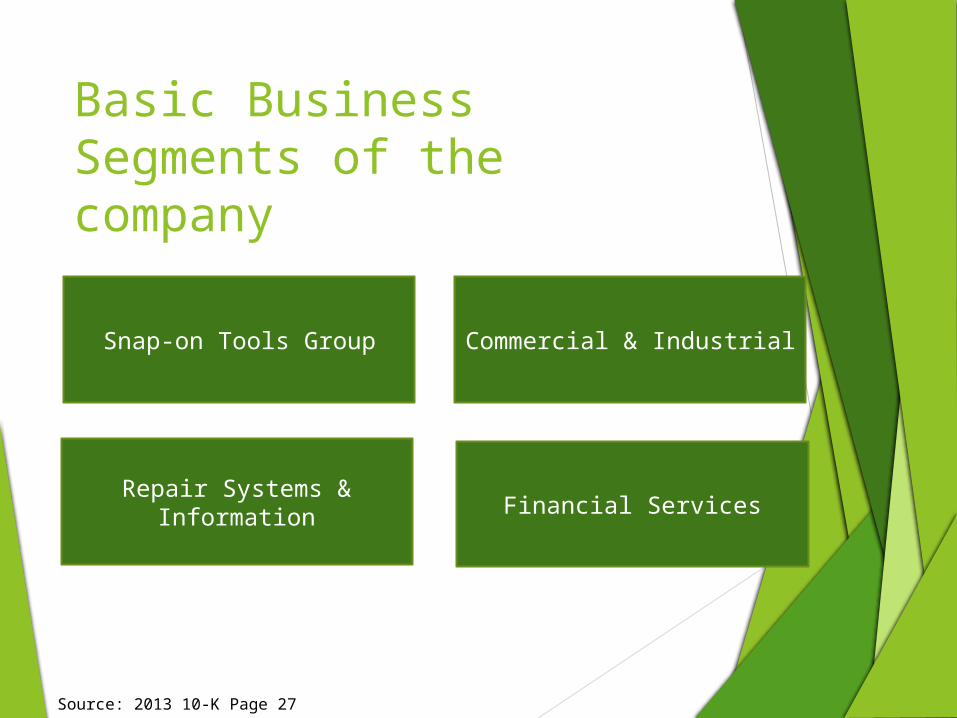
Basic Business Segments of the company
Snap-on Tools Group
Repair Systems & Information Financial Services
Commercial & Industrial
Source: 2013 10-K Page 27
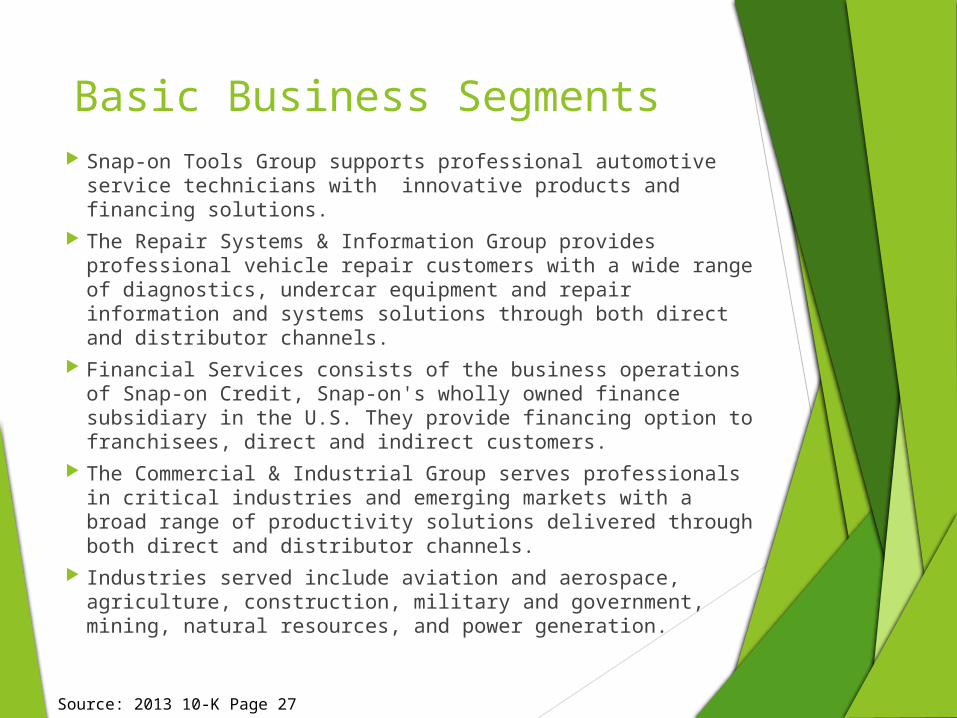
Basic Business Segments Snap-on Tools Group supports professional automotive
service technicians with innovative products and financing solutions.
The Repair Systems & Information Group provides professional vehicle repair customers with a wide range of diagnostics, undercar equipment and repair information and systems solutions through both direct and distributor channels.
Financial Services consists of the business operations of Snap-on Credit, Snap-on's wholly owned finance subsidiary in the U.S. They provide financing option to franchisees, direct and indirect customers.
The Commercial & Industrial Group serves professionals in critical industries and emerging markets with a broad range of productivity solutions delivered through both direct and distributor channels.
Industries served include aviation and aerospace, agriculture, construction, military and government, mining, natural resources, and power generation.
Source: 2013 10-K Page 27
Business
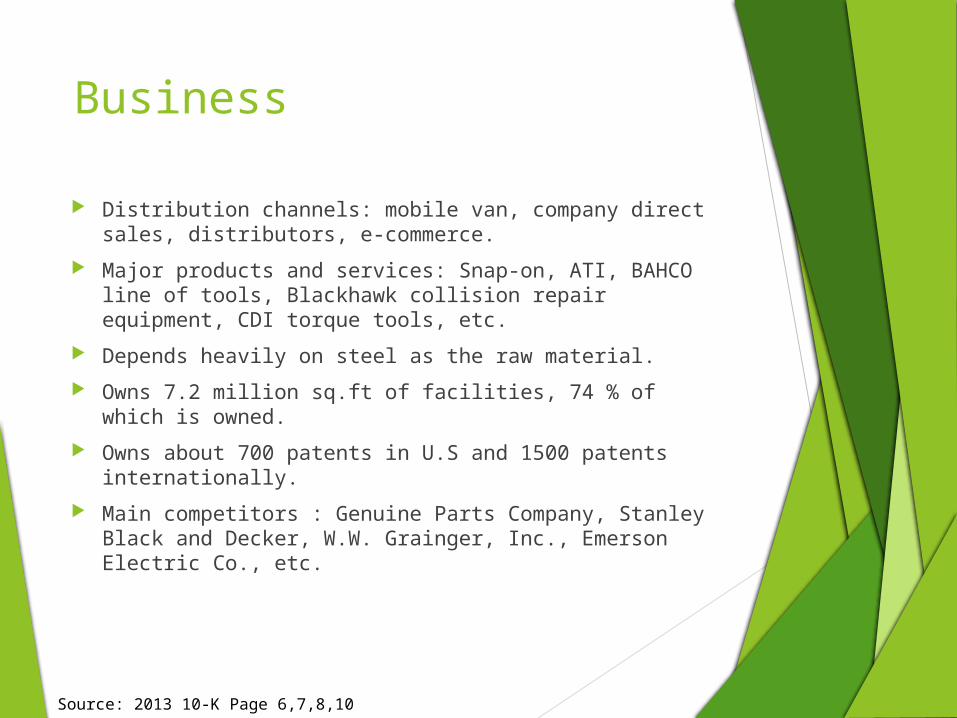
Distribution channels: mobile van, company direct sales, distributors, e-commerce.
Major products and services: Snap-on, ATI, BAHCO line of tools, Blackhawk collision repair equipment, CDI torque tools, etc.
Depends heavily on steel as the raw material.
Owns 7.2 million sq.ft of facilities, 74 % of which is owned.
Owns about 700 patents in U.S and 1500 patents internationally.
Main competitors : Genuine Parts Company, Stanley Black and Decker, W.W. Grainger, Inc., Emerson Electric Co., etc.
Source: 2013 10-K Page 6,7,8,10
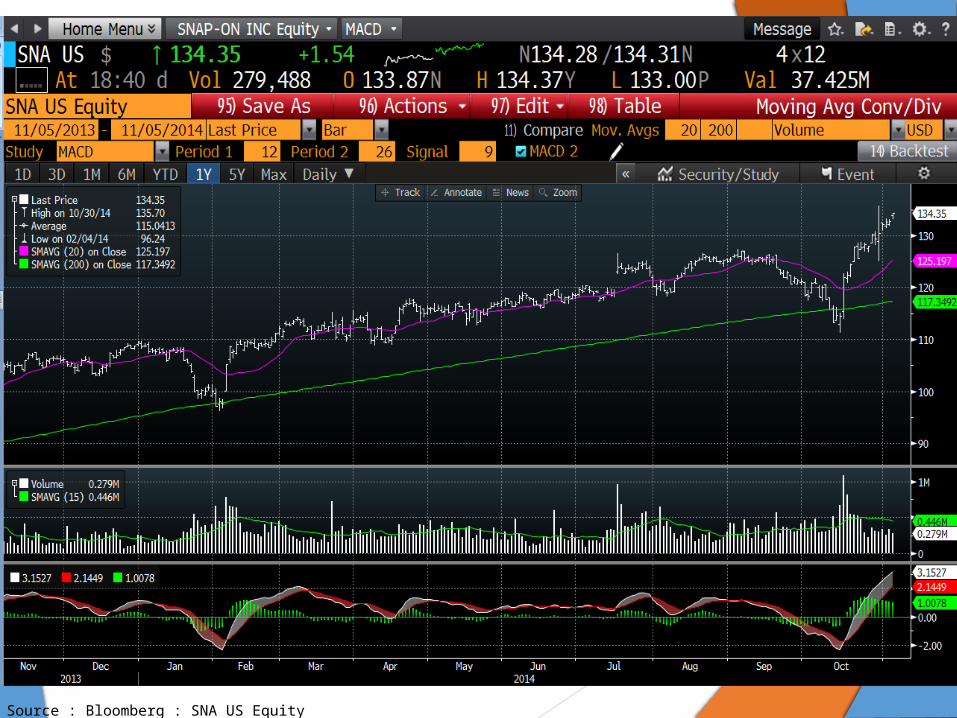
Recent Financial Performance
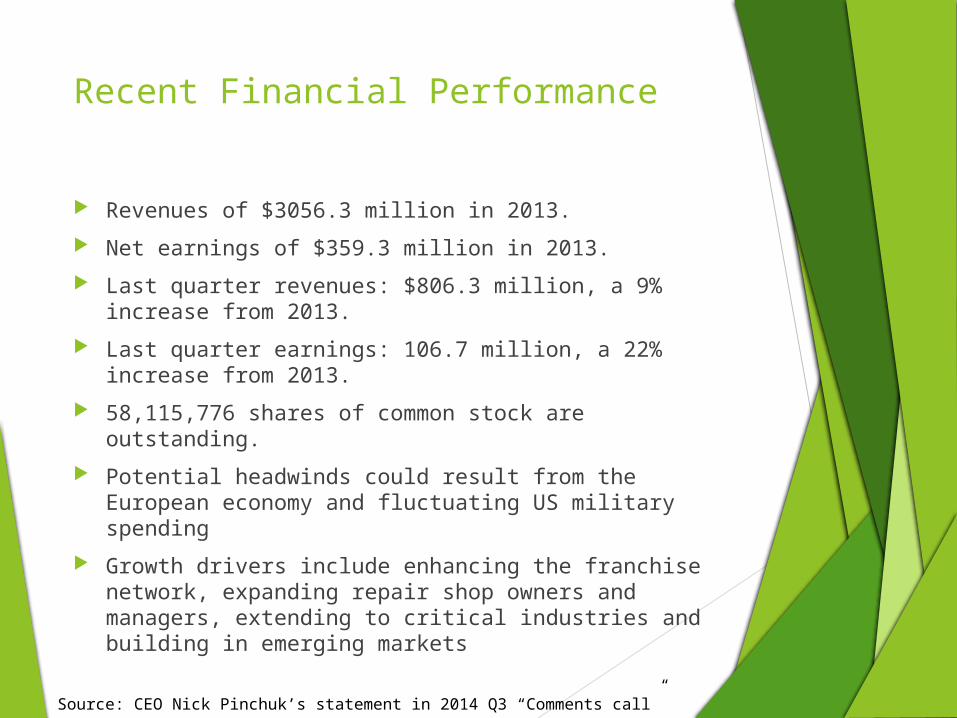
Revenues of $3056.3 million in 2013.
Net earnings of $359.3 million in 2013.
Last quarter revenues: $806.3 million, a 9% increase from 2013.
Last quarter earnings: 106.7 million, a 22% increase from 2013.
58,115,776 shares of common stock are outstanding.
Potential headwinds could result from the European economy and fluctuating US military spending
Growth drivers include enhancing the franchise network, expanding repair shop owners and managers, extending to critical industries and building in emerging markets
Source: CEO Nick Pinchuk’s statement in 2014 Q3 “Comments call”

Source : Bloomberg : SNA US Equity
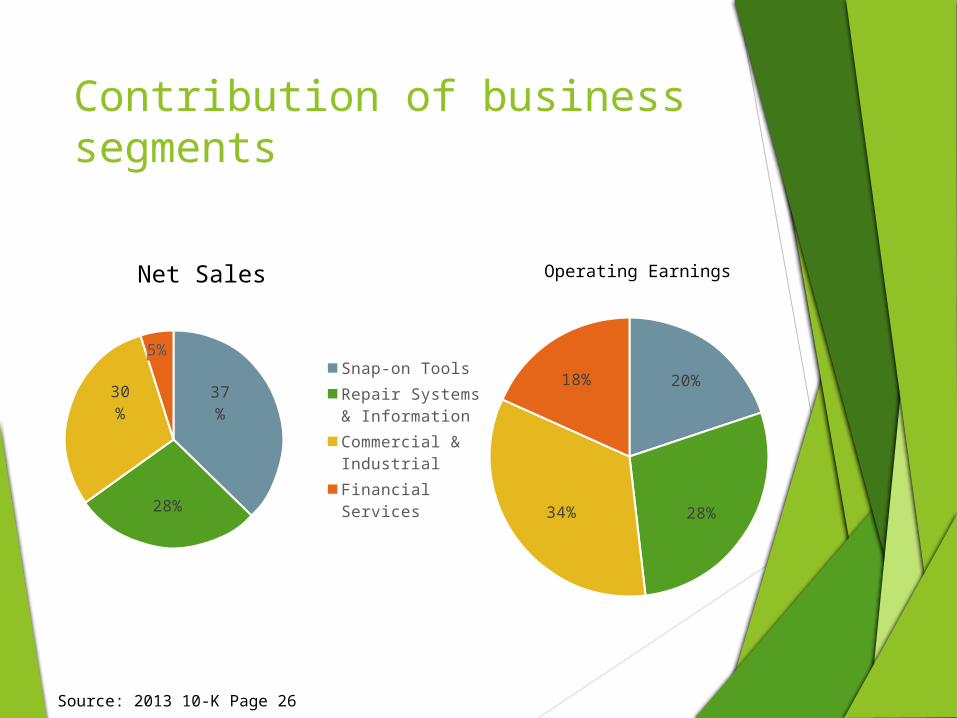
Operating Earnings
37%
28%
30%
5%Snap-on ToolsRepair Systems & InformationCommercial & IndustrialFinancial Services
20%
28%34%
18%
Contribution of business segments
Net Sales
Source: 2013 10-K Page 26
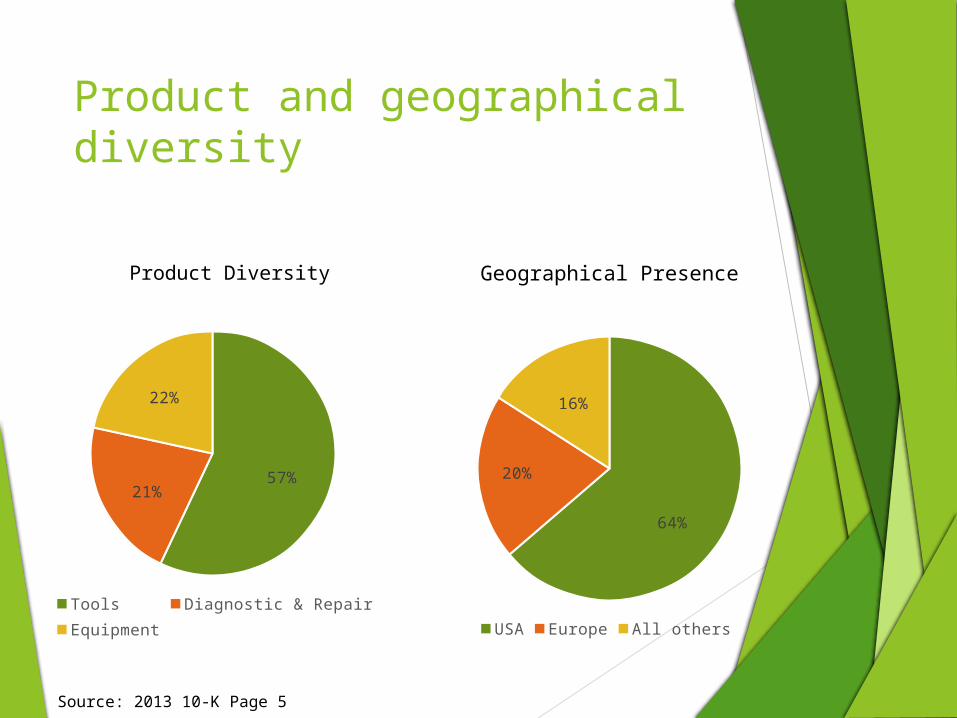
Product and geographical diversity
57%21%
22%
Tools Diagnostic & RepairEquipment
64%
20%
16%
USA Europe All others
Geographical PresenceProduct Diversity
Source: 2013 10-K Page 5
Macroeconomic review
The company has secured an ample supply of both bar and coil steel (its principle raw materials) from its suppliers, for the near future to meet with material demands.
Steel pricing and availability issues are not going to create any significant impact in 2014.
The company holds over 700 patents in US and 1500 patents internationally.
No single patent represents a significant portion of the company’s revenue.
The company does not foresee any environmental protection laws affecting it in the near future
Energy and fuel prices can significantly affect the company’s revenue generation. Higher fuel prices might slow down growth.
36% of revenues come internationally. Revenue generation can be significantly affected by the economic conditions in non-US markets.Source: 2013 10-K Page 10,11, wikiwealth.com/sna
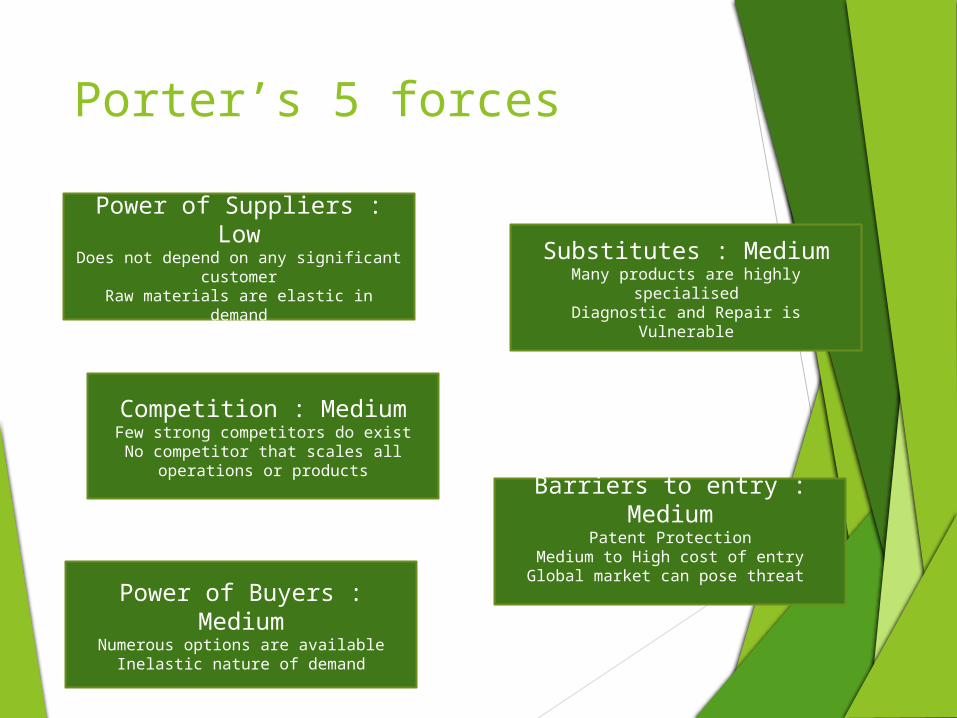
Porter’s 5 forces
Power of Suppliers : LowDoes not depend on any significant
customerRaw materials are elastic in demand
Substitutes : MediumMany products are highly specialisedDiagnostic and Repair is Vulnerable
Barriers to entry : MediumPatent Protection
Medium to High cost of entryGlobal market can pose threat
Competition : MediumFew strong competitors do exist
No competitor that scales all operations or products
Power of Buyers : MediumNumerous options are available
Inelastic nature of demand
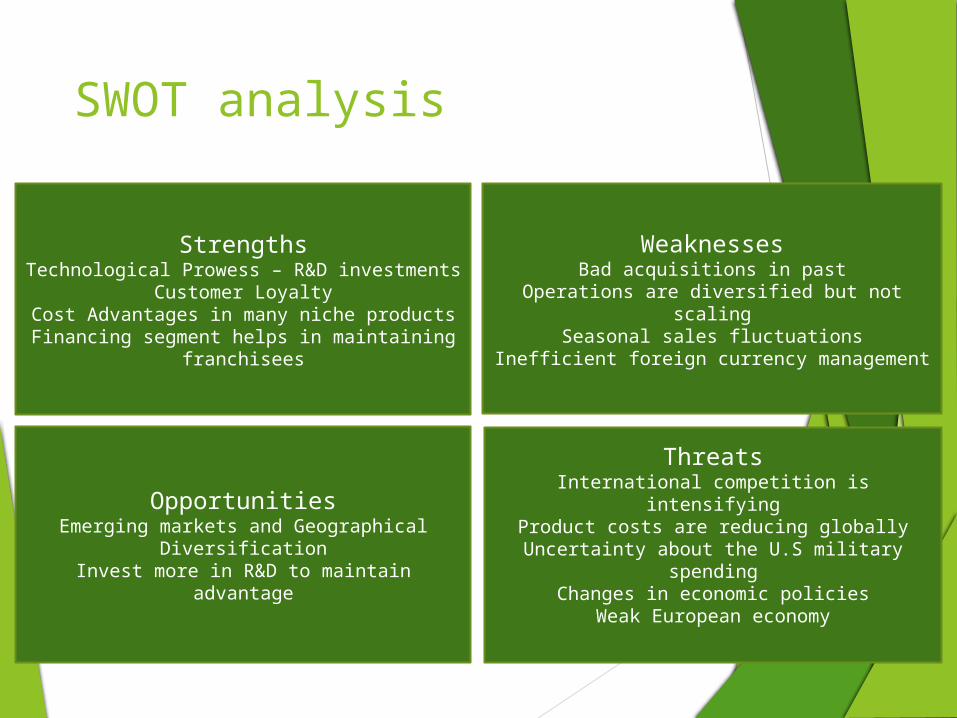
SWOT analysis
StrengthsTechnological Prowess – R&D investments
Customer LoyaltyCost Advantages in many niche productsFinancing segment helps in maintaining
franchisees
WeaknessesBad acquisitions in past
Operations are diversified but not scalingSeasonal sales fluctuations
Inefficient foreign currency management
OpportunitiesEmerging markets and Geographical
DiversificationInvest more in R&D to maintain advantage
ThreatsInternational competition is intensifying
Product costs are reducing globallyUncertainty about the U.S military spending
Changes in economic policiesWeak European economy

Management Philosophy
CEO -Nicholas T. Pinchuk
No new changes in management in the past 3 years
Implementing a value-creation process throughout the company focusing on safety, quality, customer connection, innovation and rapid continuous improvement
Executive compensation is competitive to the industry peers, with a higher percentage of pay-at-risk compensation.
Looking forward to developing and expanding customer base in adjacent markets and additional geographies.
Trying to enter new and riskier industries in future.
Source: 2014 Proxy statement Page 20,26, 2013 10-K Page 26
Expectations ForwardThe Commercial & Industrial Group
Invest in emerging market growth initiatives.
Reduce structural and operating costs through RCI and restructuring.
Tools
Improve franchisee productivity, profitability, and commercial health.
Expand market coverage and penetration;
Invest in new product innovation and Increase operational flexibility.
The Repair Systems & Information Group
Upgrade technology, expand product range, integrate solutions and increase market penetration
Financial Services
Deliver products and services that attract and sustain profitable franchisees, improve productivity levels, and maintain a healthy portfolio performance.Source: 2013 10-K Page 26,27
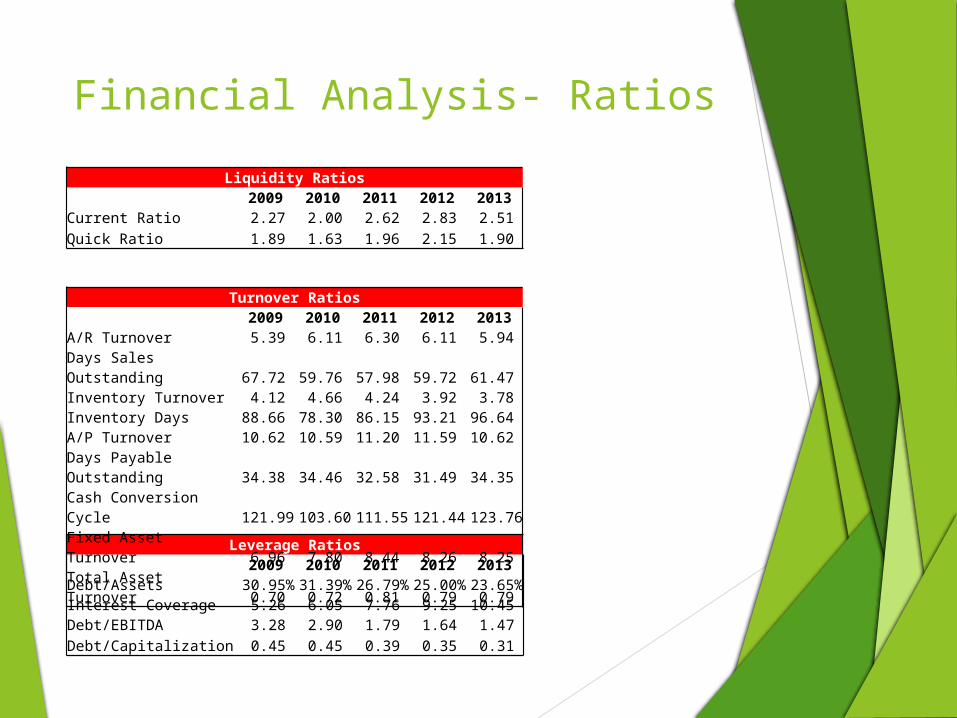
Financial Analysis- RatiosLiquidity Ratios
2009 2010 2011 2012 2013Current Ratio 2.27 2.00 2.62 2.83 2.51 Quick Ratio 1.89 1.63 1.96 2.15 1.90
Leverage Ratios 2009 2010 2011 2012 2013Debt/Assets 30.95% 31.39% 26.79% 25.00% 23.65%Interest Coverage 5.26 6.05 7.76 9.25 10.45 Debt/EBITDA 3.28 2.90 1.79 1.64 1.47 Debt/Capitalization 0.45 0.45 0.39 0.35 0.31
Turnover Ratios 2009 2010 2011 2012 2013A/R Turnover 5.39 6.11 6.30 6.11 5.94 Days Sales Outstanding 67.72 59.76 57.98 59.72 61.47 Inventory Turnover 4.12 4.66 4.24 3.92 3.78 Inventory Days 88.66 78.30 86.15 93.21 96.64 A/P Turnover 10.62 10.59 11.20 11.59 10.62 Days Payable Outstanding 34.38 34.46 32.58 31.49 34.35 Cash Conversion Cycle 121.99 103.60 111.55 121.44 123.76 Fixed Asset Turnover 6.96 7.80 8.44 8.26 8.25 Total Asset Turnover 0.70 0.72 0.81 0.79 0.79
Financial Analysis- Ratios
2009 2010 2011 2012 20130
0.05
0.1
0.15
0.2
0.25
0.3
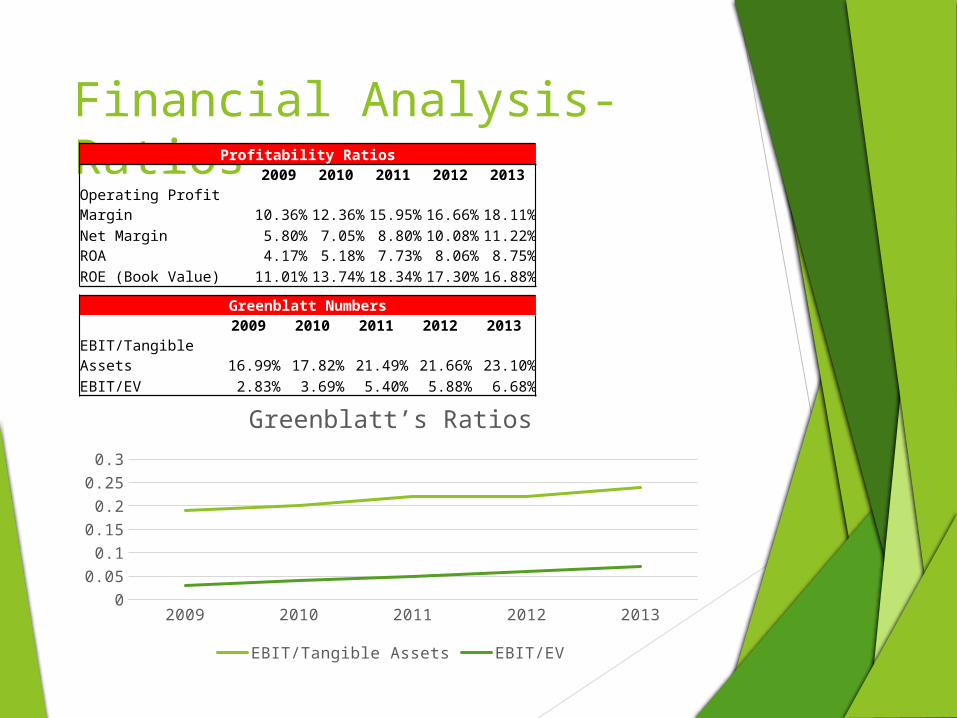
Greenblatt’s Ratios
EBIT/Tangible Assets EBIT/EV
Profitability Ratios 2009 2010 2011 2012 2013Operating Profit Margin 10.36% 12.36% 15.95% 16.66% 18.11%Net Margin 5.80% 7.05% 8.80% 10.08% 11.22%ROA 4.17% 5.18% 7.73% 8.06% 8.75%ROE (Book Value) 11.01% 13.74% 18.34% 17.30% 16.88%
Greenblatt Numbers 2009 2010 2011 2012 2013EBIT/Tangible Assets 16.99% 17.82% 21.49% 21.66% 23.10%EBIT/EV 2.83% 3.69% 5.40% 5.88% 6.68%
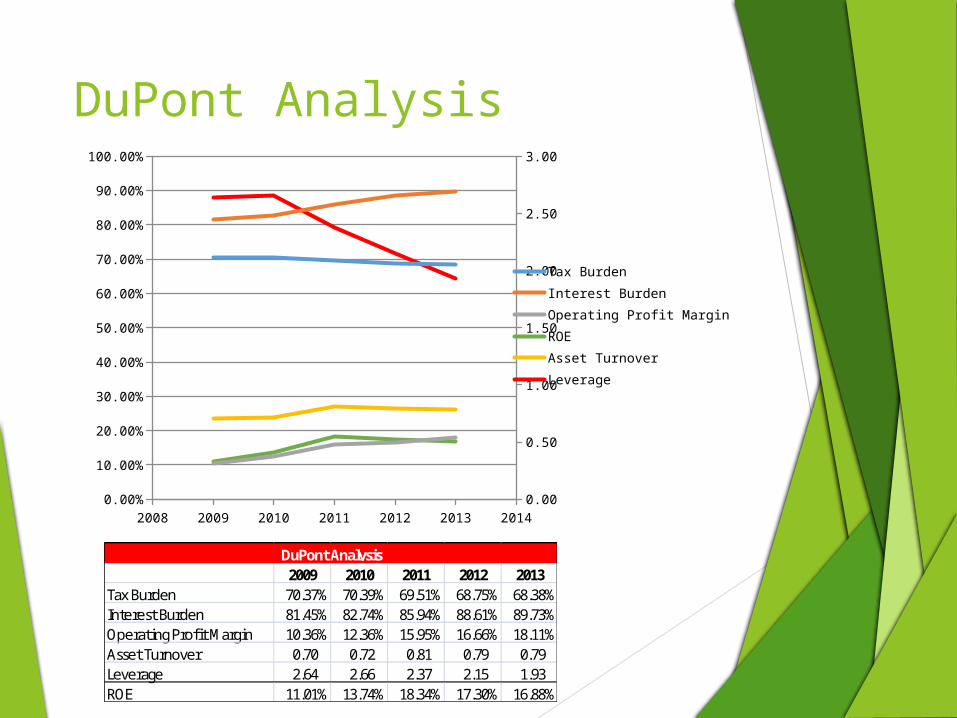
DuPont Analysis
2009 2010 2011 2012 2013Tax Burden 70.37% 70.39% 69.51% 68.75% 68.38%Interest Burden 81.45% 82.74% 85.94% 88.61% 89.73%Operating Profit Margin 10.36% 12.36% 15.95% 16.66% 18.11%Asset Turnover 0.70 0.72 0.81 0.79 0.79Leverage 2.64 2.66 2.37 2.15 1.93ROE 11.01% 13.74% 18.34% 17.30% 16.88%
DuPont Analysis
2008 2009 2010 2011 2012 2013 20140.00%
10.00%
20.00%
30.00%
40.00%
50.00%
60.00%
70.00%
80.00%
90.00%
100.00%
0.00
0.50
1.00
1.50
2.00
2.50
3.00
Tax BurdenInterest BurdenOperating Profit MarginROEAsset TurnoverLeverage
Source : Bloomberg : SNA US Equity
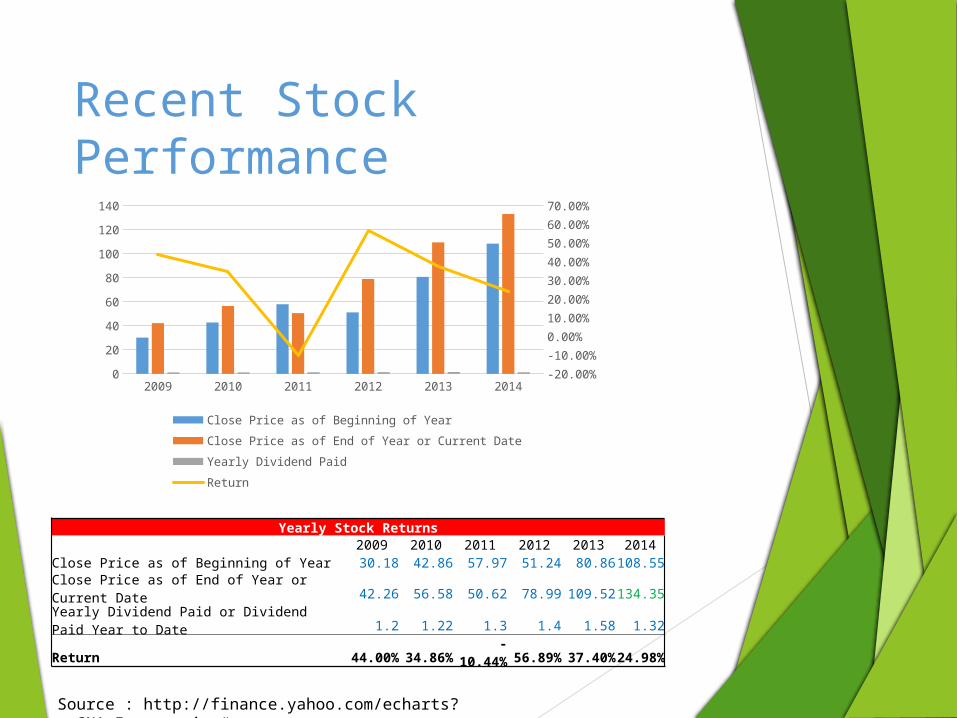
Recent Stock Performance
2009 2010 2011 2012 2013 20140
20
40
60
80
100
120
140
-20.00%
-10.00%
0.00%
10.00%
20.00%
30.00%
40.00%
50.00%
60.00%
70.00%
Close Price as of Beginning of Year
Close Price as of End of Year or Current Date
Yearly Dividend Paid
Return
Source : http://finance.yahoo.com/echarts?s=SNA+Interactive#
Yearly Stock Returns 2009 2010 2011 2012 2013 2014Close Price as of Beginning of Year 30.18 42.86 57.97 51.24 80.86 108.55Close Price as of End of Year or Current Date 42.26 56.58 50.62 78.99 109.52 134.35Yearly Dividend Paid or Dividend Paid Year to Date 1.2 1.22 1.3 1.4 1.58 1.32Return 44.00% 34.86% -10.44% 56.89% 37.40% 24.98%
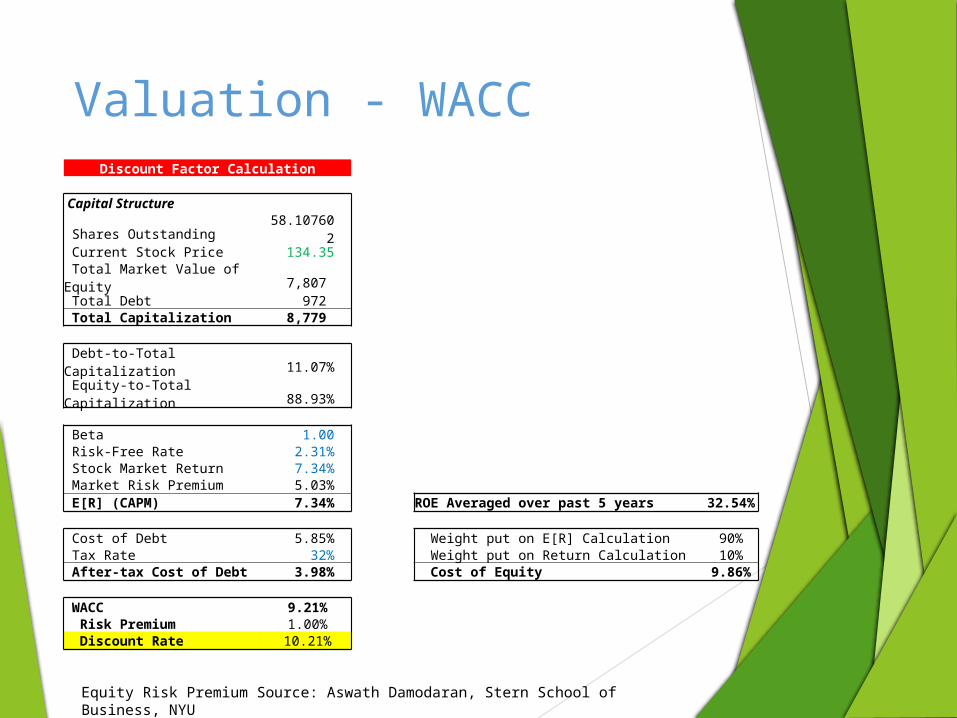
Valuation - WACC
Equity Risk Premium Source: Aswath Damodaran, Stern School of Business, NYU
Discount Factor Calculation
Capital Structure Shares Outstanding 58.107602 Current Stock Price 134.35 Total Market Value of Equity 7,807 Total Debt 972 Total Capitalization 8,779 Debt-to-Total Capitalization 11.07% Equity-to-Total Capitalization 88.93%
Beta 1.00 Risk-Free Rate 2.31% Stock Market Return 7.34% Market Risk Premium 5.03% E[R] (CAPM) 7.34% ROE Averaged over past 5 years 32.54%
Cost of Debt 5.85% Weight put on E[R] Calculation 90% Tax Rate 32% Weight put on Return Calculation 10% After-tax Cost of Debt 3.98% Cost of Equity 9.86%
WACC 9.21% Risk Premium 1.00% Discount Rate 10.21%
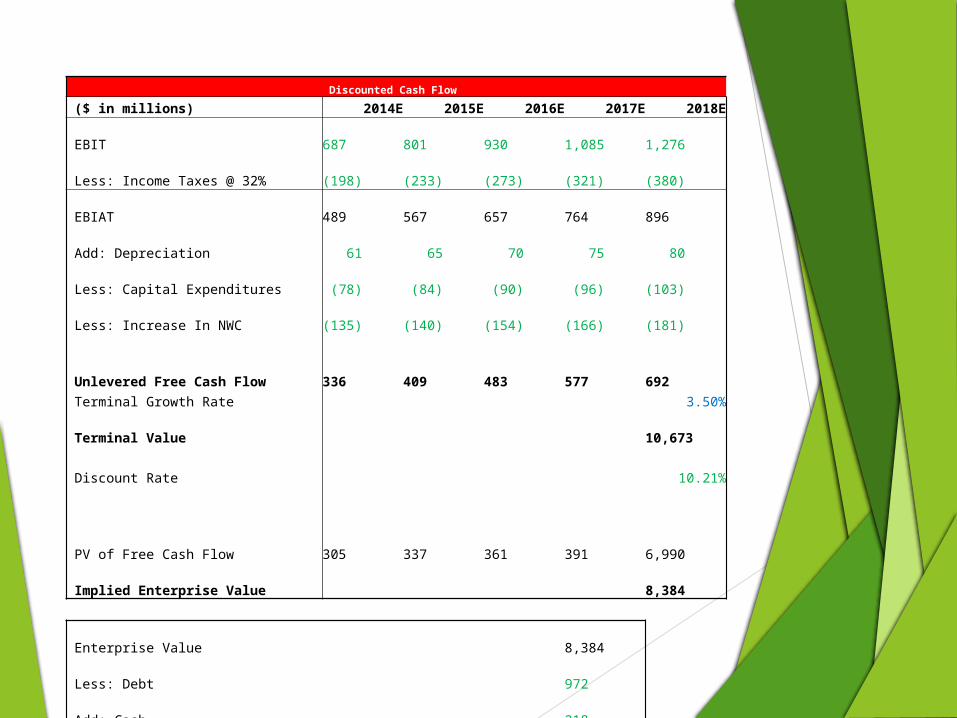
Discounted Cash Flow
($ in millions) 2014E 2015E 2016E 2017E 2018E EBIT 687 801 930 1,085 1,276 Less: Income Taxes @ 32% (198) (233) (273) (321) (380) EBIAT 489 567 657 764 896 Add: Depreciation 61 65 70 75 80 Less: Capital Expenditures (78) (84) (90) (96) (103) Less: Increase In NWC (135) (140) (154) (166) (181) Unlevered Free Cash Flow 336 409 483 577 692 Terminal Growth Rate 3.50% Terminal Value 10,673 Discount Rate 10.21% PV of Free Cash Flow 305 337 361 391 6,990
Implied Enterprise Value 8,384
Enterprise Value 8,384 Less: Debt 972 Add: Cash 218 Implied Equity Value 7,630 Shares Outstanding 58.108
Current Stock Price $134.35
Total Fair Value Stock Price $131.30
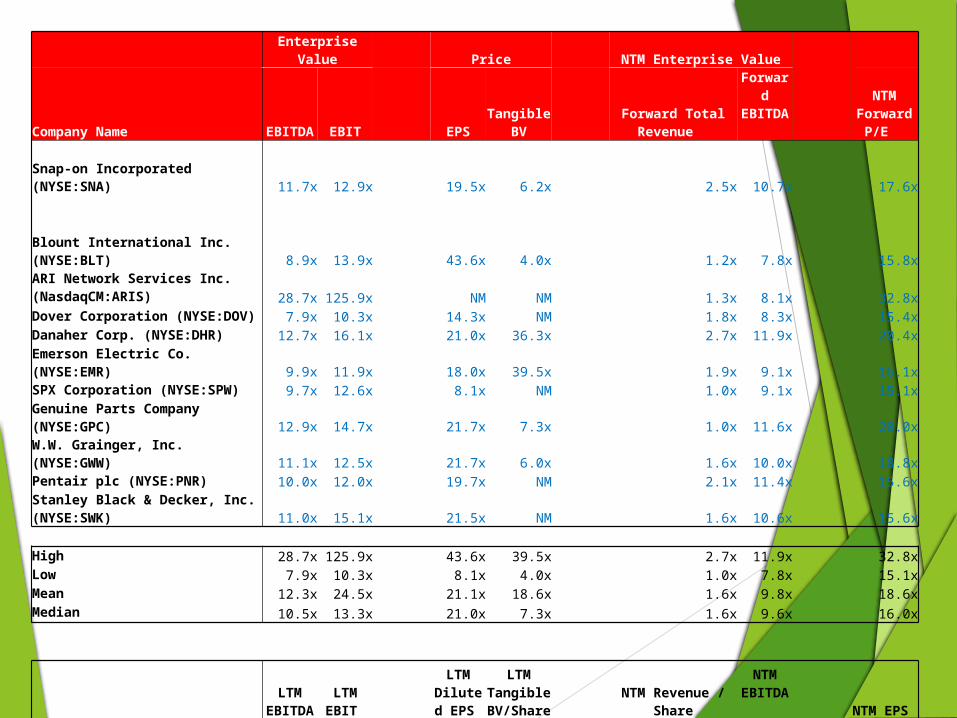
Enterprise Value Price NTM Enterprise Value
Company Name EBITDA EBIT EPS Tangible BV Forward Total Revenue
Forward EBITDA
NTM Forward P/E
Snap-on Incorporated (NYSE:SNA) 11.7x 12.9x 19.5x 6.2x 2.5x 10.7x 17.6x Blount International Inc. (NYSE:BLT) 8.9x 13.9x 43.6x 4.0x 1.2x 7.8x 15.8xARI Network Services Inc. (NasdaqCM:ARIS)
28.7x 125.9x NM NM 1.3x 8.1x 32.8xDover Corporation (NYSE:DOV) 7.9x 10.3x 14.3x NM 1.8x 8.3x 15.4xDanaher Corp. (NYSE:DHR) 12.7x 16.1x 21.0x 36.3x 2.7x 11.9x 20.4xEmerson Electric Co. (NYSE:EMR) 9.9x 11.9x 18.0x 39.5x 1.9x 9.1x 16.1xSPX Corporation (NYSE:SPW) 9.7x 12.6x 8.1x NM 1.0x 9.1x 15.1xGenuine Parts Company (NYSE:GPC) 12.9x 14.7x 21.7x 7.3x 1.0x 11.6x 20.0xW.W. Grainger, Inc. (NYSE:GWW) 11.1x 12.5x 21.7x 6.0x 1.6x 10.0x 18.8xPentair plc (NYSE:PNR) 10.0x 12.0x 19.7x NM 2.1x 11.4x 15.6xStanley Black & Decker, Inc. (NYSE:SWK) 11.0x 15.1x 21.5x NM 1.6x 10.6x 15.6x
High 28.7x 125.9x 43.6x 39.5x 2.7x 11.9x 32.8xLow 7.9x 10.3x 8.1x 4.0x 1.0x 7.8x 15.1xMean 12.3x 24.5x 21.1x 18.6x 1.6x 9.8x 18.6xMedian 10.5x 13.3x 21.0x 7.3x 1.6x 9.6x 16.0x
LTM
EBITDA LTM EBIT
LTM Diluted
EPS
LTM Tangible
BV/Share NTM Revenue / ShareNTM
EBITDA NTM EPS Snap-On Inc. (NYSE: SNA) 647.27 586.20 6.10 36.66 $56.28 748.15 7.30
Implied Price_Mean $ 136.79 $ 247.16 $ 128.41 $ 682.67 $ 90.78 $ 126.23 $ 135.36
Implied Price_Median $ 116.96 $ 133.67 $ 128.00 $ 267.64 $ 90.62 $ 123.28 $ 116.45
Implied SNA Stock Price $ 139.52
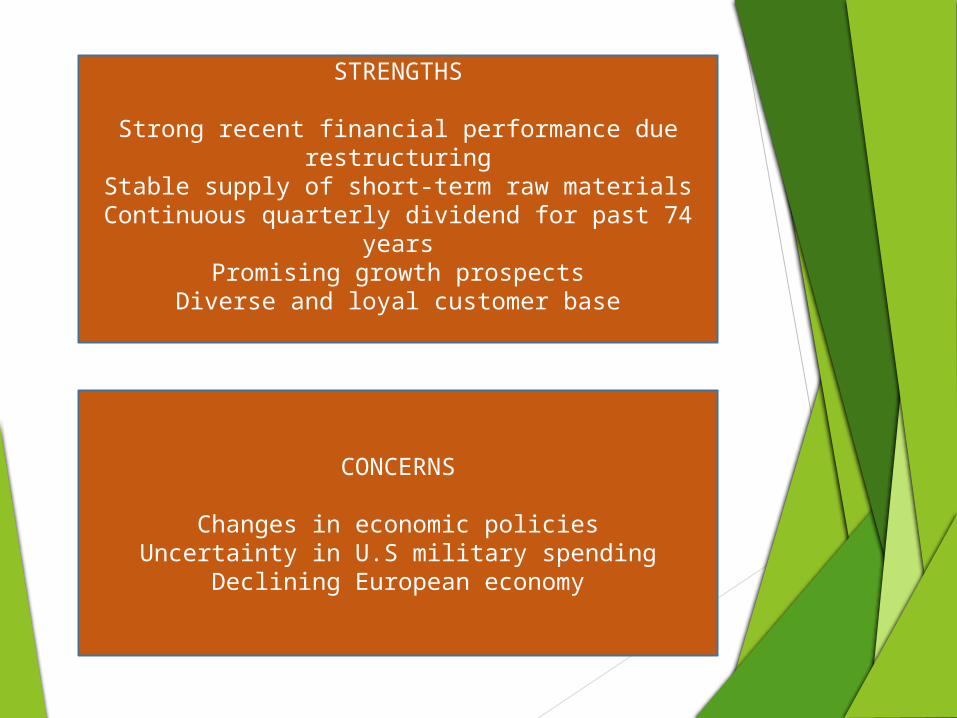
STRENGTHS
Strong recent financial performance due restructuring
Stable supply of short-term raw materialsContinuous quarterly dividend for past 74 years
Promising growth prospectsDiverse and loyal customer base
CONCERNS
Changes in economic policiesUncertainty in U.S military spending
Declining European economy
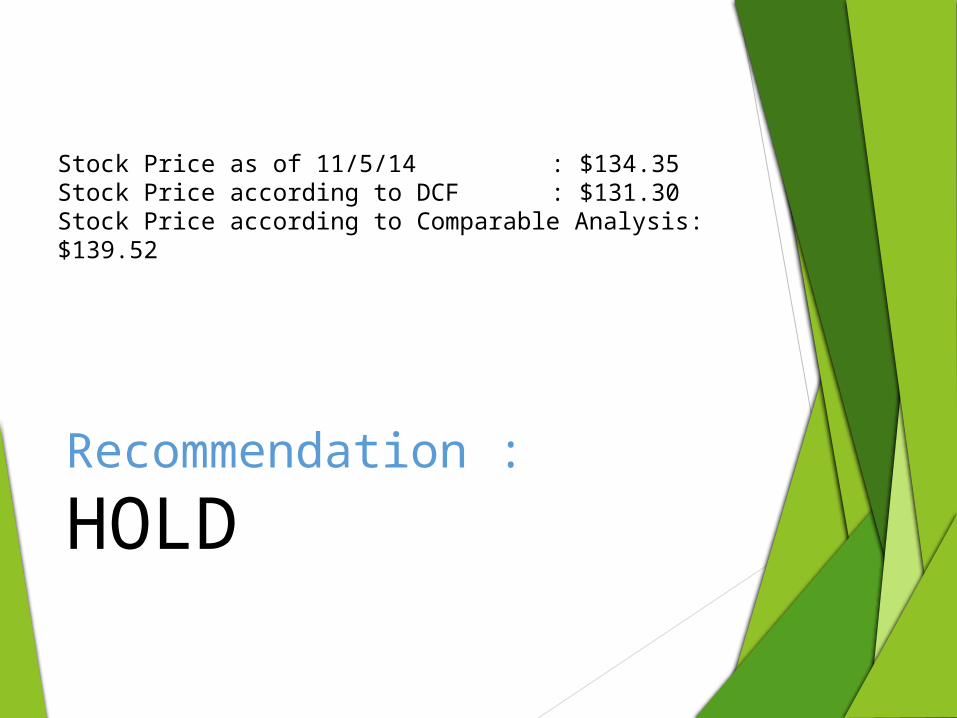
Recommendation :
HOLD
Stock Price as of 11/5/14 : $134.35Stock Price according to DCF : $131.30Stock Price according to Comparable Analysis: $139.52

Q&A