Embed Size (px)
Citation preview
NATURAL GAS
by Candace Zwick

What is natural gas?
Natural gas is a fossil fuel in the gaseous state which consists mainly of methane. Natural gas must go through a process to remove almost all its materials before it can be used as fuel.
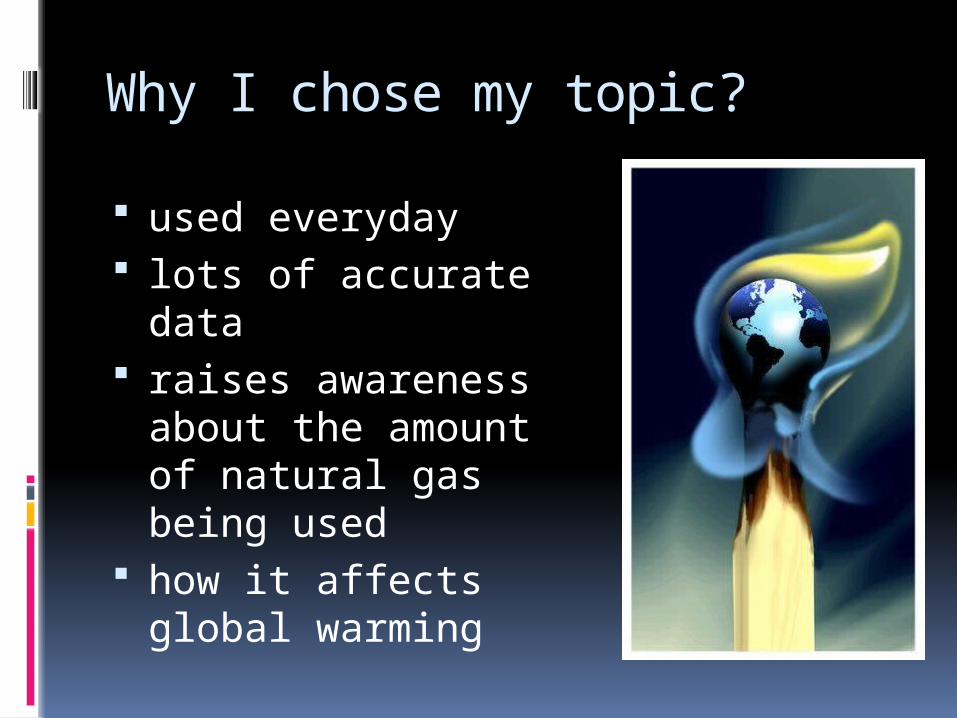
Why I chose my topic?
used everyday lots of accurate data raises awareness
about the amount of natural gas being used
how it affects global warming
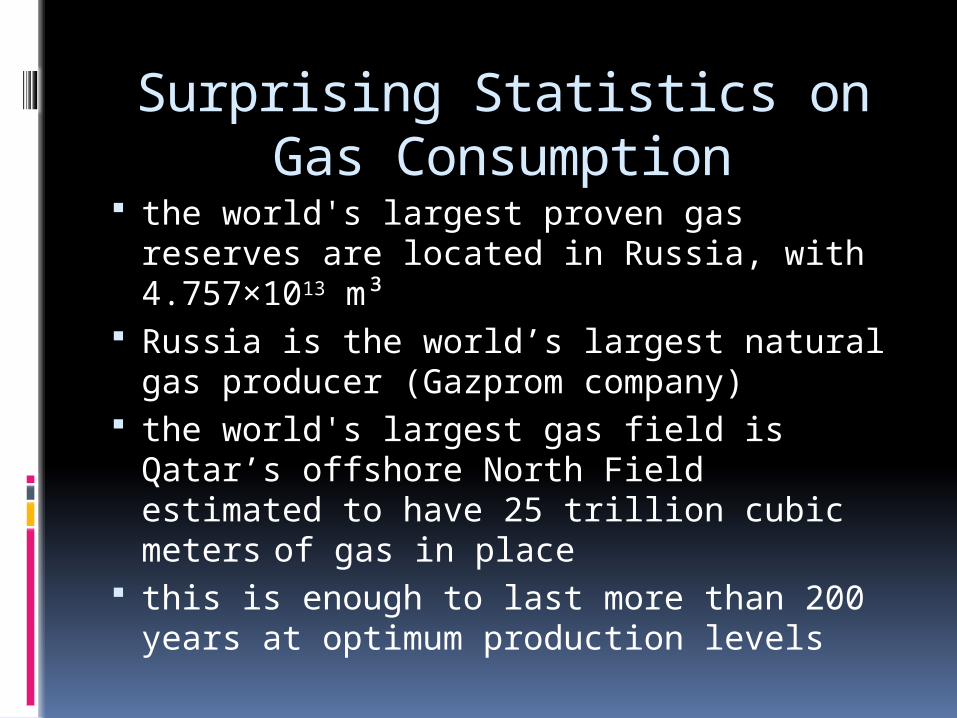
Surprising Statistics on Gas Consumption
the world's largest proven gas reserves are located in Russia, with 4.757×10¹³ m³
Russia is the world’s largest natural gas producer (Gazprom company)
the world's largest gas field is Qatar’s offshore North Field estimated to have 25 trillion cubic meters of gas in place
this is enough to last more than 200 years at optimum production levels

Question: How does the consumption of natural
gas in Canada vary throughout the months within 2007-2008?
independent variable: temperature (per month) dependent variable: natural gas consumption
(m3)

Leading up to my hypothesis:
Everyday uses of natural gases: fuel for cars
home heating cooking
clothes dryers power generators
pool heaters domestic hot water heaters

My Hypothesis is:
More natural gas will be used during the winter months than the summer months. This is because in the winter, people try to keep themselves warm by using furnaces fueled by natural gas. In the summer, the weather is warm and homes do not need to be heated.
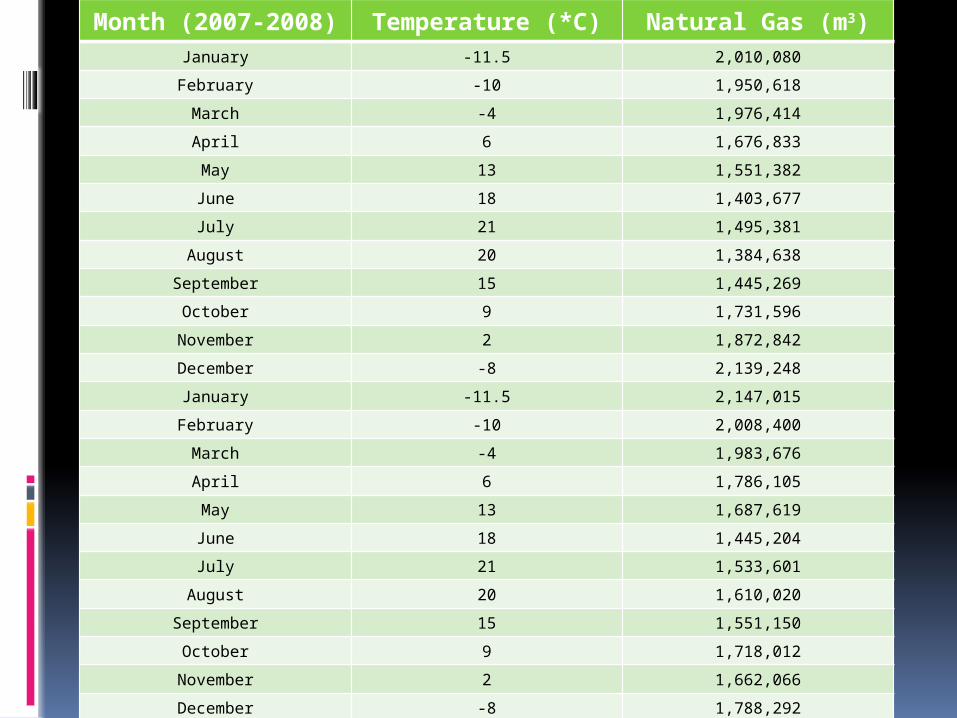
Month (2007-2008)
Temperature (*C) Natural Gas (m3)
January -11.5 2,010,080
February -10 1,950,618
March -4 1,976,414
April 6 1,676,833
May 13 1,551,382
June 18 1,403,677
July 21 1,495,381
August 20 1,384,638
September 15 1,445,269
October 9 1,731,596
November 2 1,872,842
December -8 2,139,248
January -11.5 2,147,015
February -10 2,008,400
March -4 1,983,676
April 6 1,786,105
May 13 1,687,619
June 18 1,445,204
July 21 1,533,601
August 20 1,610,020
September 15 1,551,150
October 9 1,718,012
November 2 1,662,066
December -8 1,788,292

linear regressiony= -18405x+2.0x1006
Mean 1,731,630.75m3
Median 1,702,815.5m3
-15 -10 -5 0 5 10 15 20 250
500,000
1,000,000
1,500,000
2,000,000
2,500,000
Gas Consumption vs Temperature
January
February
March
April
May
June
July
August
September
October
November
December
Temperature *C
Gas C
onsum
pti
on (
m^
3)
r= -0.8437
-1 (strong) -0.67 (moderate) -0.33 (weak) 0 (weak) 0.33 (moderate) 0.67 (strong) 1Standard Deviation
σ= 234,724.45

Year Month Natural Gas (m3)
2007
January 2,010,080
February 1,950,618
March 1,976,414
April 1,676,833
May 1,551,382
June 1,403,677
July 1,495,381
August 1,384,638
September 1,445,269
October 1,731,596
November 1,872,842
December 2,139,248
2008
January 2,147,015
February 2,008,400
March 1,983,676
April 1,786,105
May 1,687,619
June 1,445,204
July 1,533,601
August 1,610,020
September 1,551,150
October 1,718,012
November 1,662,066
December 1,788,292


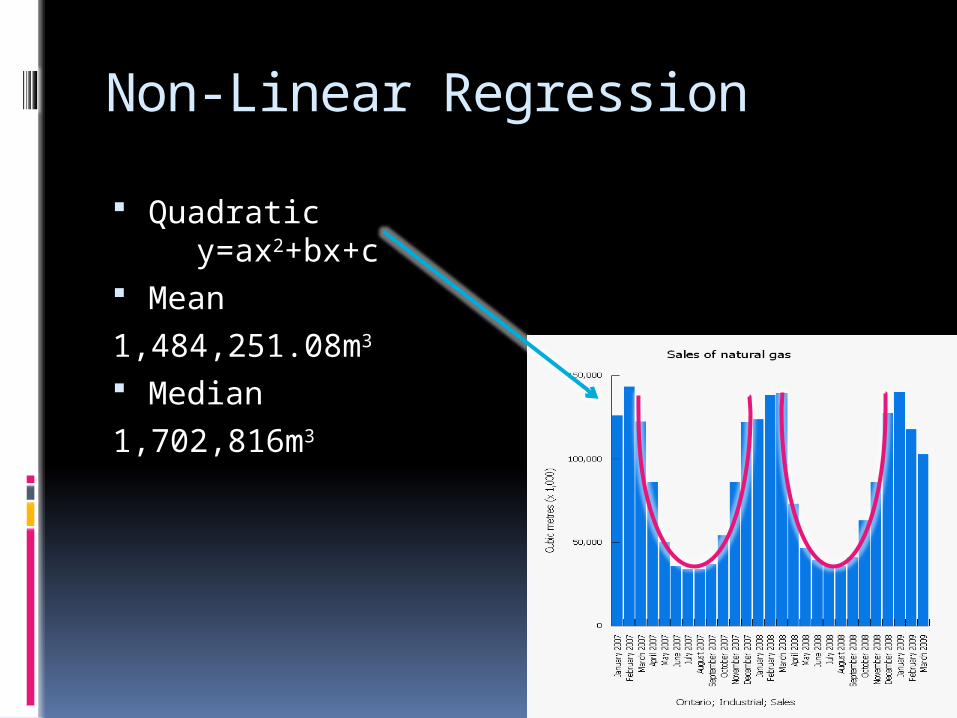
Non-Linear Regression
Quadratic
y=ax2+bx+c Mean
1,484,251.08m3
Median
1,702,816m3
Sampling Techniques Simple Random Sampling
Sampling Bias could not be identified

Why I chose Canada as opposed to other
countries around the world. Data may vary in different parts of the
world because of: climate
could be warm all year- Equatorial Areas could be cold all year- Antarctica
culture against religion- Mennonites
poverty not being able to afford natural gas- Haiti

Hidden Variables
climate change throughout Canada
income and financial state of consumers
in the future, global warming could affect the data collected

How to reduce the amount of natural gas being used? energy conservation
set thermostat to lower temperature and wear warmer clothing
close doors to unused rooms more efficient windows- use plastic film use solar energy
laundry wash laundry in cold water use clothes lines to dry clothing use electric clothes dryers
fuel use biofuels electric cars use ethanol blended fuels
Conclusion
therefore my hypothesis was correct as temperature decreases the gas
consumption increases and as temperature increases, gas consumption decreases
this results in a negative correlation
the following video further supports my hypothesis
http://www.youtube.com/watch?v=DXaVBlBrDnk&feature=related


Bibliography Energy Sources (2009). In Natural Resources Canada. Retrieved November 16,
2010, from http://www.nrcan.gc.ca/eneene/sources/natnat/2010/janjan-eng.php
Harper, D. (Actor). (2008). Natural Gas Futures [Online video]. Retrieved January 9, 2011, from http://www.youtube.com/watch?v=DXaVBlBrDnk&feature=related
Natural Gas (2010, ). In Harvest Topworth International. Retrieved January 9, 2011, from http://www.harvest-pakistan.com/naturalgas.html
Pfeiffer, D. A. (2009, March 26). Econogics. In Reducing Natural Gas Consumption. Retrieved January 9, 2011, from http://www.econogics.com/en/natgas.htm
Source: Statistics Canada. Table 129-0003 - Sales of natural gas, monthly, CANSIM (database), Using E-STAT (distributor).http://estat.statcan.gc.ca/cgi-win/cnsmcgi.exe?Lang=E&EST-Fi=EStat/English/CII_1-eng.htm
(accessed: December 6, 2010)
The British Antarctic Study. (n.d.). Natural Gas. Retrieved January 9, 2011, from http://www.solcomhouse.com/naturalgas.htm