Embed Size (px)
Citation preview
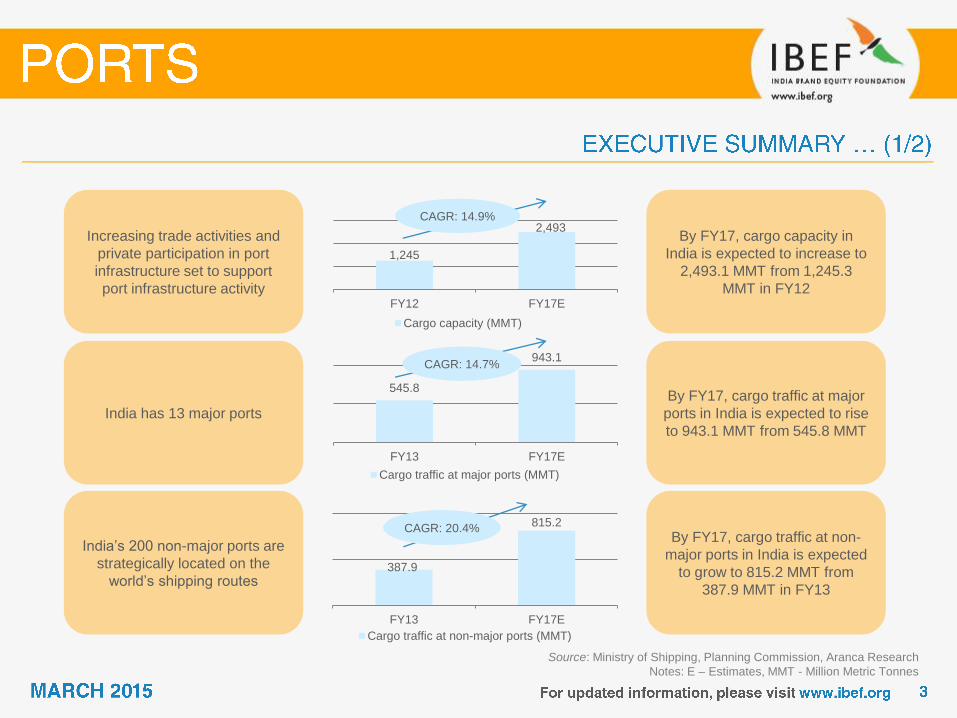
1,245
2,493
FY12 FY17E
Cargo capacity (MMT)
387.9
815.2
FY13 FY17E
Cargo traffic at non-major ports (MMT)
Source: Ministry of Shipping, Planning Commission, Aranca Research
Notes: E – Estimates, MMT - Million Metric Tonnes
By FY17, cargo capacity in
India is expected to increase to
2,493.1 MMT from 1,245.3
MMT in FY12
Increasing trade activities and
private participation in port
infrastructure set to support
port infrastructure activity
By FY17, cargo traffic at major
ports in India is expected to rise
to 943.1 MMT from 545.8 MMT
India has 13 major ports
By FY17, cargo traffic at non-
major ports in India is expected
to grow to 815.2 MMT from
387.9 MMT in FY13
India‟s 200 non-major ports are
strategically located on the
world‟s shipping routes
CAGR: 14.9%
CAGR: 20.4%
545.8
943.1
FY13 FY17E
Cargo traffic at major ports (MMT)
CAGR: 14.7%
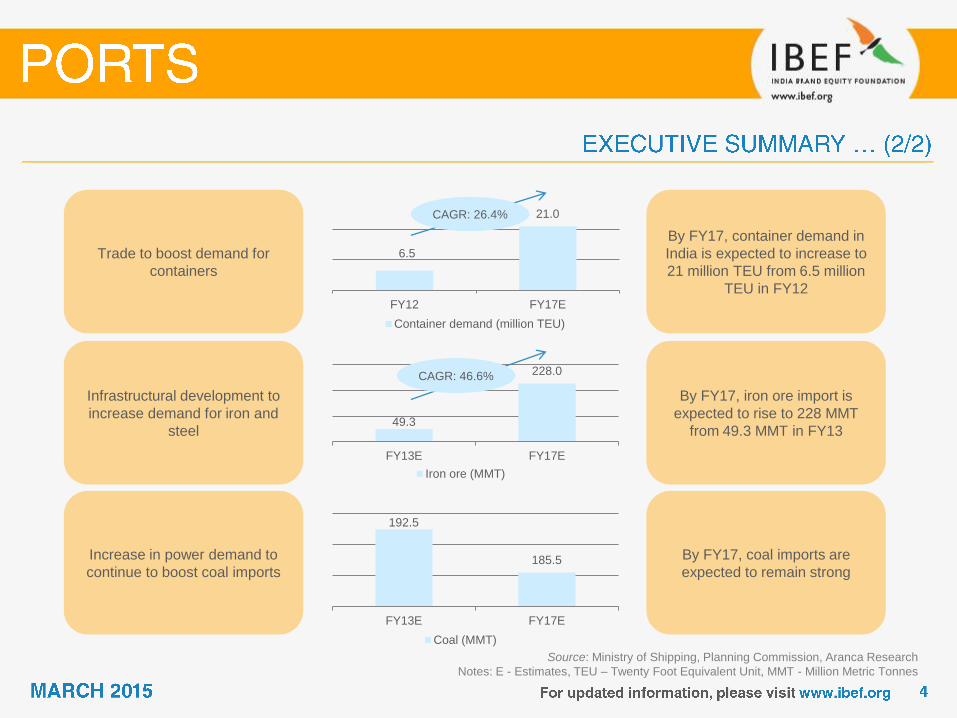
49.3
228.0
FY13E FY17E
Iron ore (MMT)
6.5
21.0
FY12 FY17E
Container demand (million TEU)
Source: Ministry of Shipping, Planning Commission, Aranca Research
Notes: E - Estimates, TEU – Twenty Foot Equivalent Unit, MMT - Million Metric Tonnes
By FY17, container demand in
India is expected to increase to
21 million TEU from 6.5 million
TEU in FY12
Trade to boost demand for
containers
By FY17, iron ore import is
expected to rise to 228 MMT
from 49.3 MMT in FY13
Infrastructural development to
increase demand for iron and
steel
By FY17, coal imports are
expected to remain strong
Increase in power demand to
continue to boost coal imports
CAGR: 46.6%
CAGR: 26.4%
192.5
185.5
FY13E FY17E
Coal (MMT)

Growing demand
Source: Report of the Task force on Financing Plan for Ports, Govt. of India, Aranca Research
Notes: FY – Indian Financial Year (April–March), NMDP – National Maritime Development Programme, FDI – Foreign Direct Investment, USD – US Dollar,
E – Estimates, MMT – Million Metric Tonnes, CAGR – Compound Annual Growth Rate
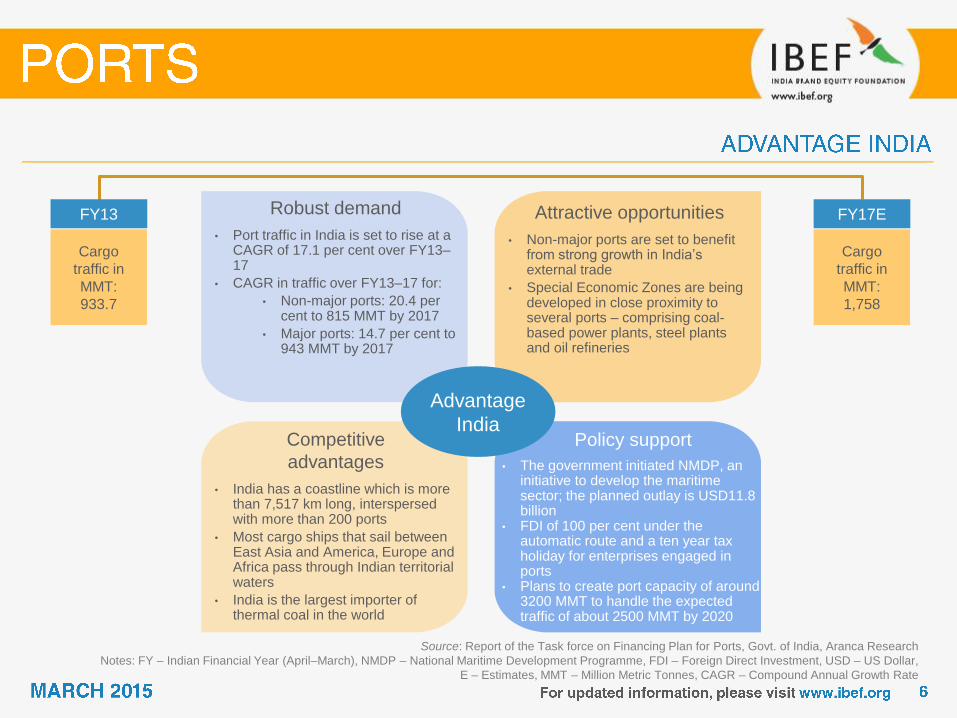
Robust demand
• Port traffic in India is set to rise at a CAGR of 17.1 per cent over FY13–17
• CAGR in traffic over FY13–17 for:
• Non-major ports: 20.4 per cent to 815 MMT by 2017
• Major ports: 14.7 per cent to 943 MMT by 2017
Attractive opportunities
• Non-major ports are set to benefit from strong growth in India‟s external trade
• Special Economic Zones are being developed in close proximity to several ports – comprising coal-based power plants, steel plants and oil refineries
Policy support
• The government initiated NMDP, an initiative to develop the maritime sector; the planned outlay is USD11.8 billion
• FDI of 100 per cent under the automatic route and a ten year tax holiday for enterprises engaged in ports
• Plans to create port capacity of around 3200 MMT to handle the expected traffic of about 2500 MMT by 2020
Competitive
advantages
• India has a coastline which is more than 7,517 km long, interspersed with more than 200 ports
• Most cargo ships that sail between East Asia and America, Europe and Africa pass through Indian territorial waters
• India is the largest importer of thermal coal in the world
FY13
Cargo
traffic in
MMT:
933.7
FY17E
Cargo
traffic in
MMT:
1,758
Advantage
India

Source: Ministry of Shipping; Aranca Research
• There are 13 major ports in
the country; 7 on the
Eastern coast and 6 on the
Western coast
• Major ports are under the
jurisdiction of the
Government of India and
are governed by the Major
Port Trusts Act 1963,
except Ennore port, which
is administered under the
Companies Act 1956
• India has about 200 non-
major ports of which one-
third are operational
• Non-major ports come
under the jurisdiction of the
respective state
Governments‟ Maritime
Boards (GMB)
Ports in India
Major Non-major (minor)
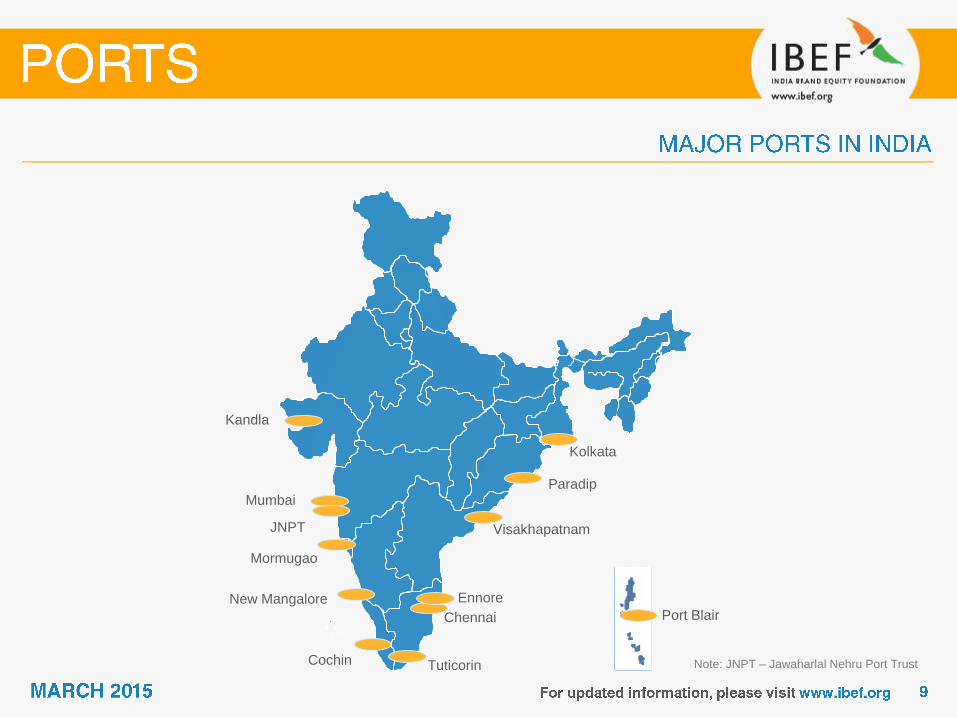
Note: JNPT – Jawaharlal Nehru Port Trust
Mumbai
JNPT
Kandla
Mormugao
New Mangalore
Cochin Tuticorin
Chennai
Ennore
Visakhapatnam
Paradip
Kolkata
Port Blair
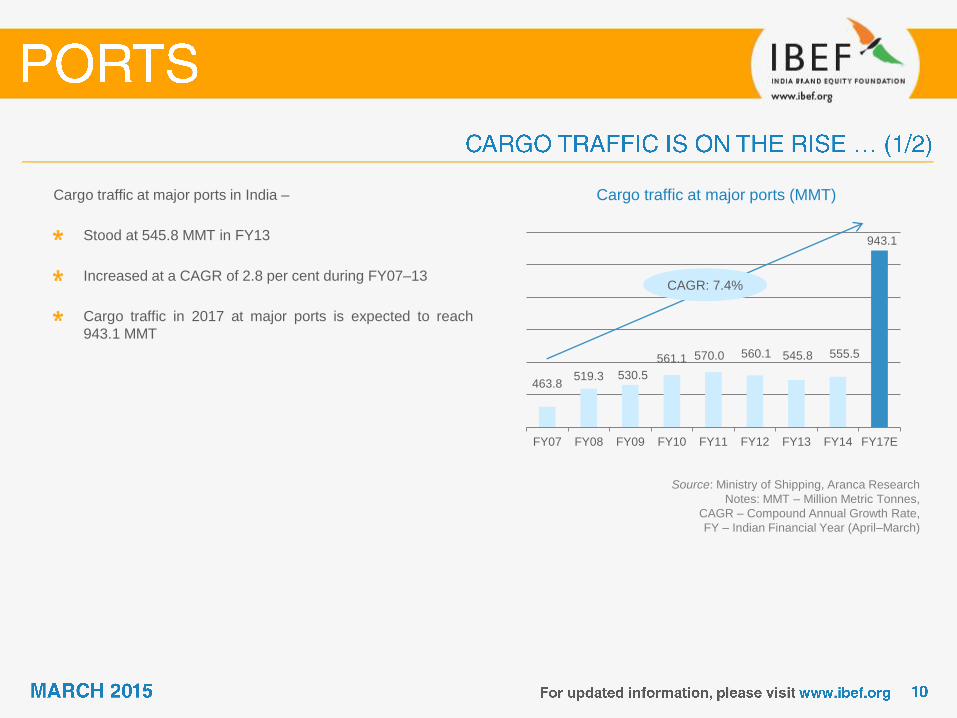
463.8 519.3 530.5
561.1 570.0 560.1 545.8 555.5
943.1
FY07 FY08 FY09 FY10 FY11 FY12 FY13 FY14 FY17E
Cargo traffic at major ports (MMT)
Source: Ministry of Shipping, Aranca Research
Notes: MMT – Million Metric Tonnes,
CAGR – Compound Annual Growth Rate,
FY – Indian Financial Year (April–March)
Cargo traffic at major ports in India –
Stood at 545.8 MMT in FY13
Increased at a CAGR of 2.8 per cent during FY07–13
Cargo traffic in 2017 at major ports is expected to reach
943.1 MMT
CAGR: 7.4%

184.9 206.3
213.2 288.8 314.8
353.7 387.9
815.2
FY07 FY08 FY09 FY10 FY11 FY12 FY13 FY17E
Percentage share of ports Non-major ports are evolving faster than major ports-
Non-major ports are gaining shares and a major chunk of
traffic has shifted from major ports to non-major ports
The contribution of non-major port‟s traffic to total traffic
rose to 44.1 per cent in FY15 from 28.6 per cent in FY07
Cargo traffic at non-major ports (MMT)
CAGR: 16.0%
Cargo traffic at non-major ports –
Estimated to have touched 387.9 MMT in FY13
Cargo traffic has expanded at a CAGR of 13.1 per cent
during FY07–13 and is expected to grow annually at 16 per
cent during FY07-17
Cargo traffic in 2017 at non-major ports is expected to reach
815.2 MMT
Source: Ministry of Shipping, Aranca Research
Notes: MMT – Million Metric Tonnes, CAGR – Compound Annual Growth Rate,
Indian Ports Association, FY – Indian Financial Year (April–March)
71
.4
71
.8
71
.3
66
.0
64
.4
61
.3
58
.5
57
.1
55
.9
28
.6
28
.2
28
.7
34
.0
35
.6
38
.7
41
.6
42
.9
44
.1
FY07 FY08 FY09 FY10 FY11 FY12 FY13 FY14 FY15E
Share of major ports Share of non-major ports
Source: Ministry of Shipping; Aranca Research
* Note: Other cargo includes Fertiliser Raw Material (dry) and food-grains
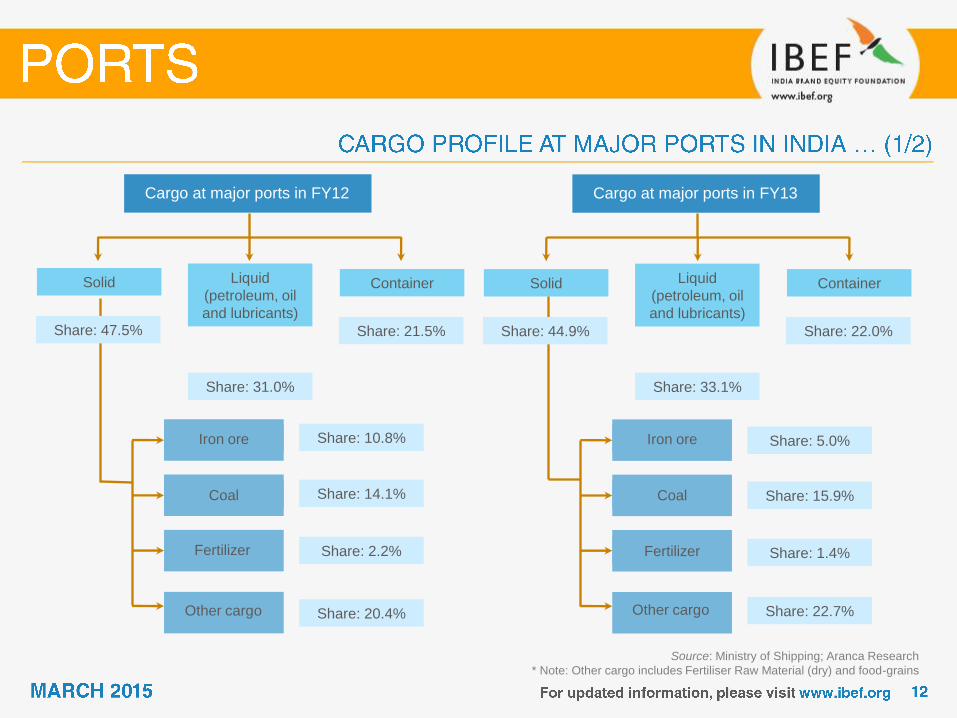
Cargo at major ports in FY12
Solid Liquid
(petroleum, oil
and lubricants)
Container
Share: 47.5%
Share: 31.0%
Share: 21.5%
Iron ore
Coal
Fertilizer
Other cargo
Share: 10.8%
Share: 14.1%
Share: 2.2%
Share: 20.4%
Cargo at major ports in FY13
Solid Liquid
(petroleum, oil
and lubricants)
Container
Share: 44.9%
Share: 33.1%
Share: 22.0%
Iron ore
Coal
Fertilizer
Other cargo
Share: 5.0%
Share: 15.9%
Share: 1.4%
Share: 22.7%
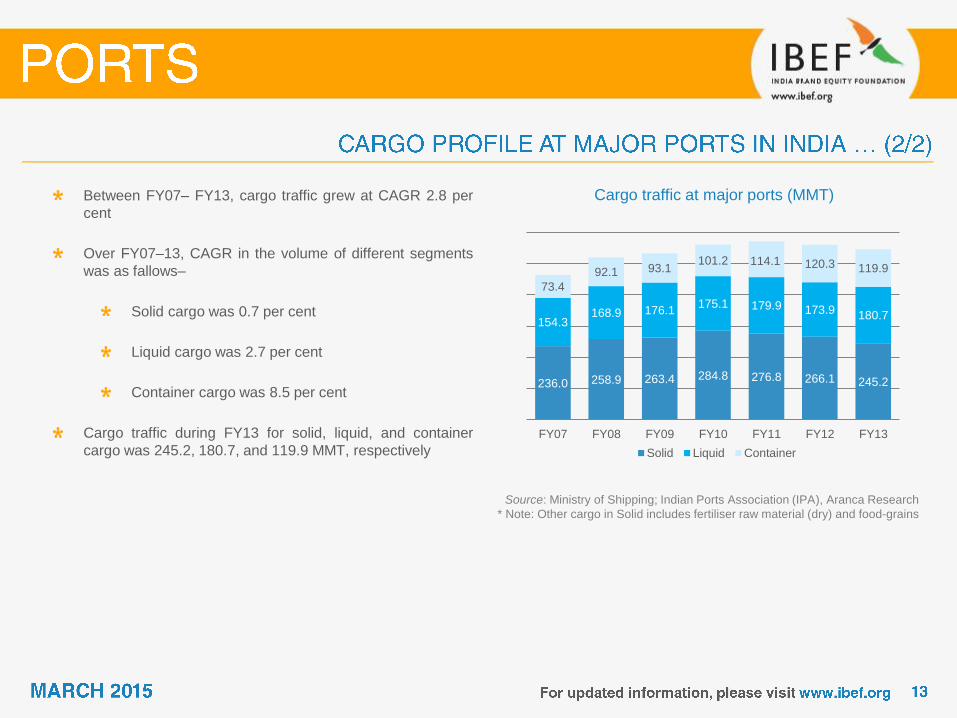
Cargo traffic at major ports (MMT)
Source: Ministry of Shipping; Indian Ports Association (IPA), Aranca Research
* Note: Other cargo in Solid includes fertiliser raw material (dry) and food-grains
Between FY07– FY13, cargo traffic grew at CAGR 2.8 per
cent
Over FY07–13, CAGR in the volume of different segments
was as fallows–
Solid cargo was 0.7 per cent
Liquid cargo was 2.7 per cent
Container cargo was 8.5 per cent
Cargo traffic during FY13 for solid, liquid, and container
cargo was 245.2, 180.7, and 119.9 MMT, respectively
236.0 258.9 263.4 284.8 276.8 266.1 245.2
154.3 168.9 176.1
175.1 179.9 173.9 180.7
73.4
92.1 93.1 101.2 114.1 120.3 119.9
FY07 FY08 FY09 FY10 FY11 FY12 FY13
Solid Liquid Container
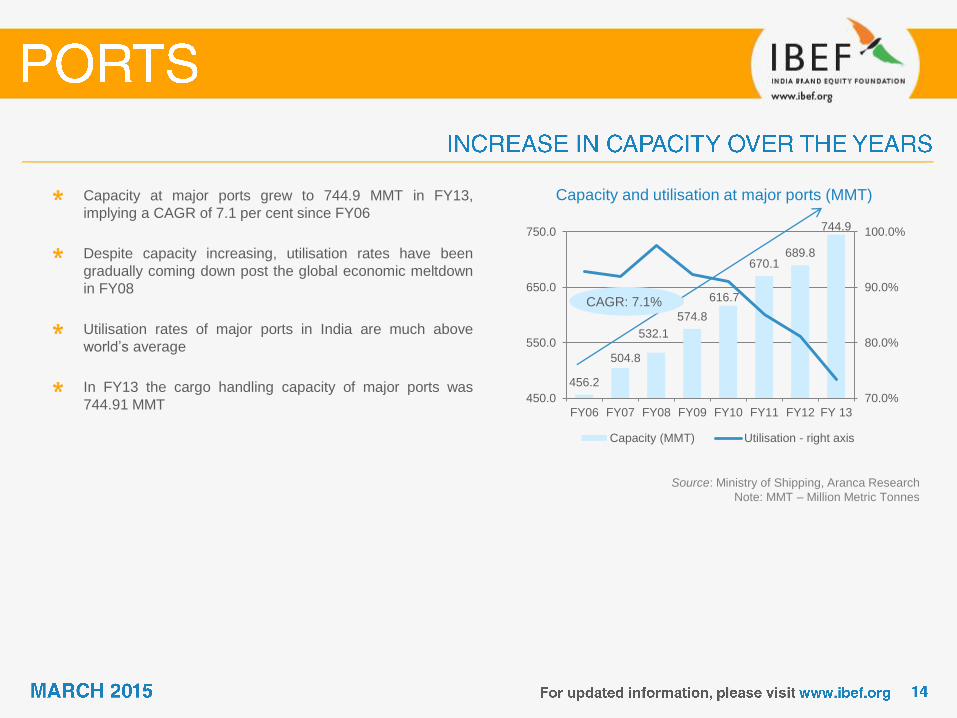
Capacity and utilisation at major ports (MMT)
Source: Ministry of Shipping, Aranca Research
Note: MMT – Million Metric Tonnes
Capacity at major ports grew to 744.9 MMT in FY13,
implying a CAGR of 7.1 per cent since FY06
Despite capacity increasing, utilisation rates have been
gradually coming down post the global economic meltdown
in FY08
Utilisation rates of major ports in India are much above
world‟s average
In FY13 the cargo handling capacity of major ports was
744.91 MMT
456.2
504.8
532.1
574.8
616.7
670.1 689.8
744.9
70.0%
80.0%
90.0%
100.0%
450.0
550.0
650.0
750.0
FY06 FY07 FY08 FY09 FY10 FY11 FY12 FY 13
Capacity (MMT) Utilisation - right axis
CAGR: 7.1%
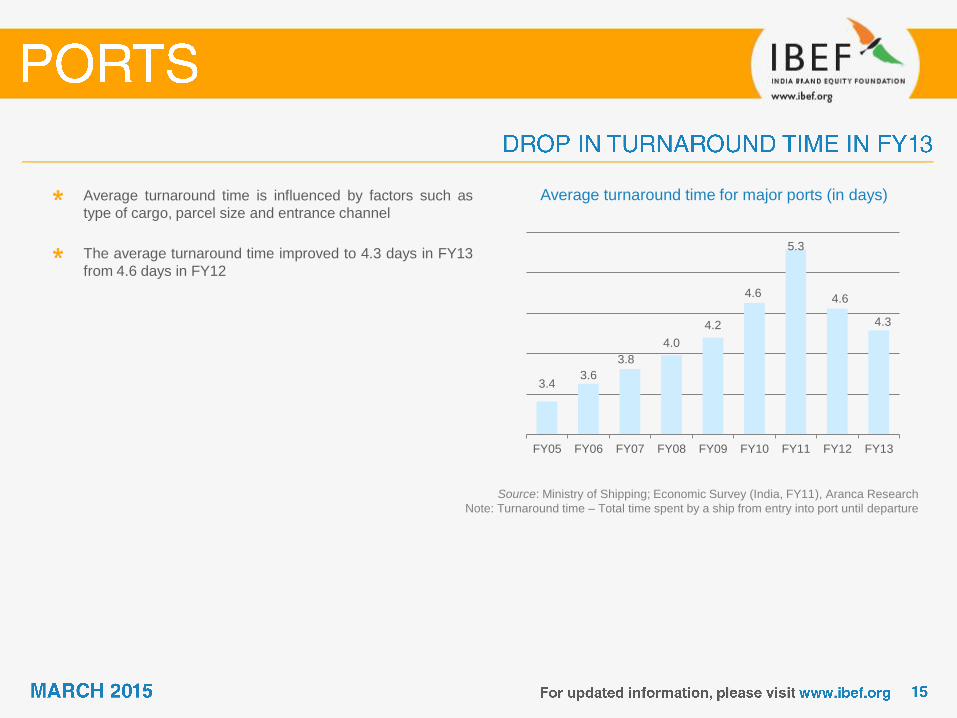
Average turnaround time for major ports (in days)
Source: Ministry of Shipping; Economic Survey (India, FY11), Aranca Research
Note: Turnaround time – Total time spent by a ship from entry into port until departure
Average turnaround time is influenced by factors such as
type of cargo, parcel size and entrance channel
The average turnaround time improved to 4.3 days in FY13
from 4.6 days in FY12
3.4 3.6
3.8
4.0
4.2
4.6
5.3
4.6
4.3
FY05 FY06 FY07 FY08 FY09 FY10 FY11 FY12 FY13
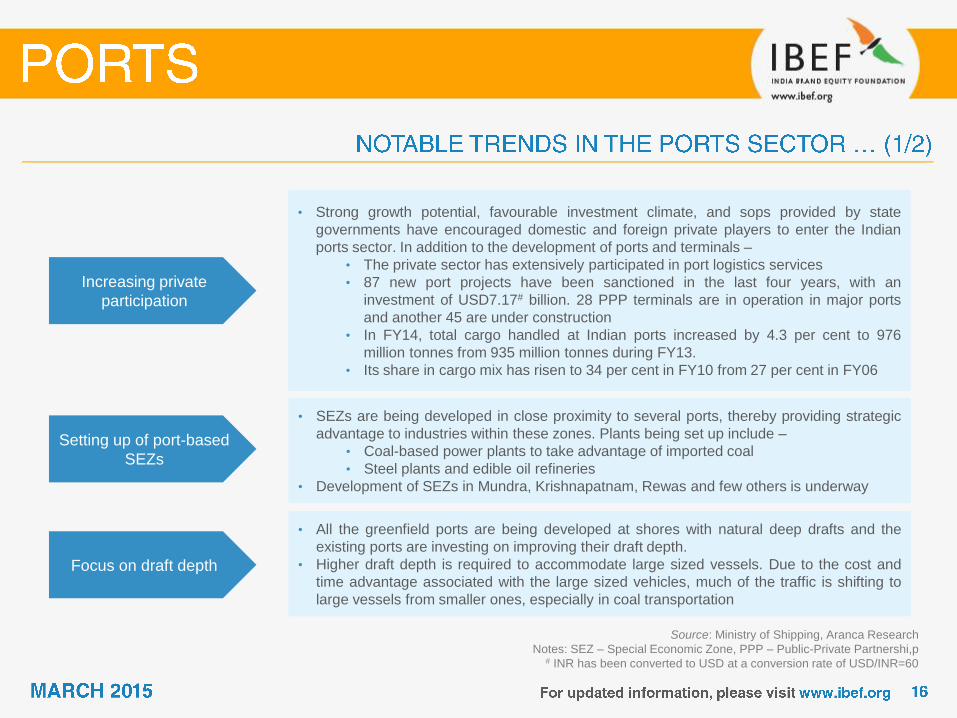
Increasing private
participation
• Strong growth potential, favourable investment climate, and sops provided by state
governments have encouraged domestic and foreign private players to enter the Indian
ports sector. In addition to the development of ports and terminals –
• The private sector has extensively participated in port logistics services
• 87 new port projects have been sanctioned in the last four years, with an
investment of USD7.17# billion. 28 PPP terminals are in operation in major ports
and another 45 are under construction
• In FY14, total cargo handled at Indian ports increased by 4.3 per cent to 976
million tonnes from 935 million tonnes during FY13.
• Its share in cargo mix has risen to 34 per cent in FY10 from 27 per cent in FY06
Setting up of port-based
SEZs
• SEZs are being developed in close proximity to several ports, thereby providing strategic
advantage to industries within these zones. Plants being set up include –
• Coal-based power plants to take advantage of imported coal
• Steel plants and edible oil refineries
• Development of SEZs in Mundra, Krishnapatnam, Rewas and few others is underway
Focus on draft depth
• All the greenfield ports are being developed at shores with natural deep drafts and the
existing ports are investing on improving their draft depth.
• Higher draft depth is required to accommodate large sized vessels. Due to the cost and
time advantage associated with the large sized vehicles, much of the traffic is shifting to
large vessels from smaller ones, especially in coal transportation
Source: Ministry of Shipping, Aranca Research
Notes: SEZ – Special Economic Zone, PPP – Public-Private Partnershi,p # INR has been converted to USD at a conversion rate of USD/INR=60
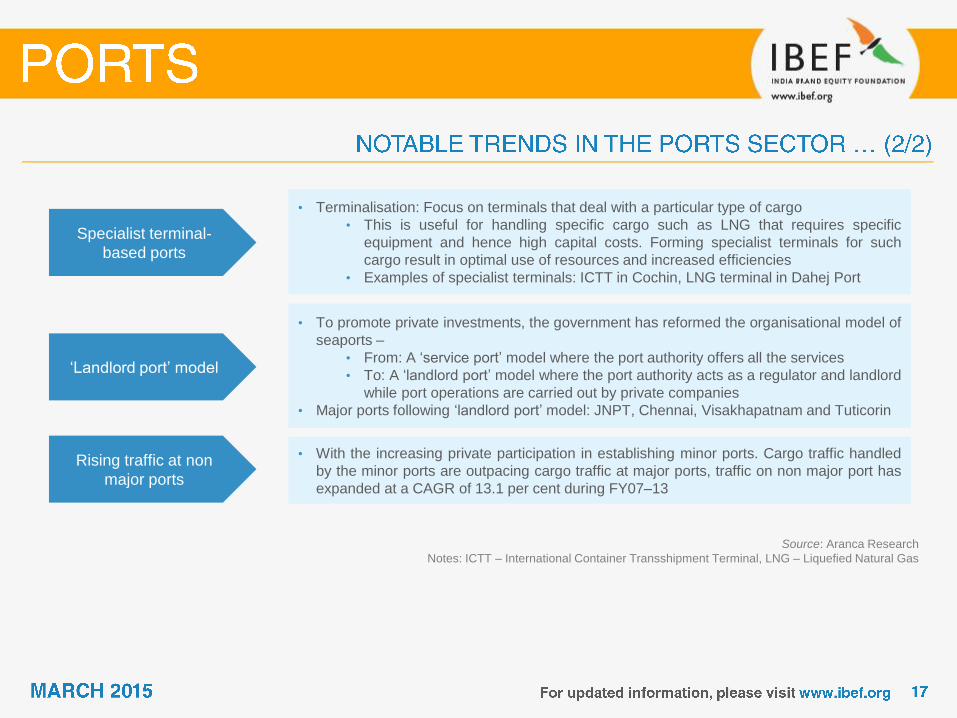
Specialist terminal-
based ports
• Terminalisation: Focus on terminals that deal with a particular type of cargo
• This is useful for handling specific cargo such as LNG that requires specific
equipment and hence high capital costs. Forming specialist terminals for such
cargo result in optimal use of resources and increased efficiencies
• Examples of specialist terminals: ICTT in Cochin, LNG terminal in Dahej Port
„Landlord port‟ model
• To promote private investments, the government has reformed the organisational model of
seaports –
• From: A „service port‟ model where the port authority offers all the services
• To: A „landlord port‟ model where the port authority acts as a regulator and landlord
while port operations are carried out by private companies
• Major ports following „landlord port‟ model: JNPT, Chennai, Visakhapatnam and Tuticorin
Rising traffic at non
major ports
• With the increasing private participation in establishing minor ports. Cargo traffic handled
by the minor ports are outpacing cargo traffic at major ports, traffic on non major port has
expanded at a CAGR of 13.1 per cent during FY07–13
Source: Aranca Research
Notes: ICTT – International Container Transshipment Terminal, LNG – Liquefied Natural Gas
Source: PricewaterhouseCoopers, Techopak, Aranca Research
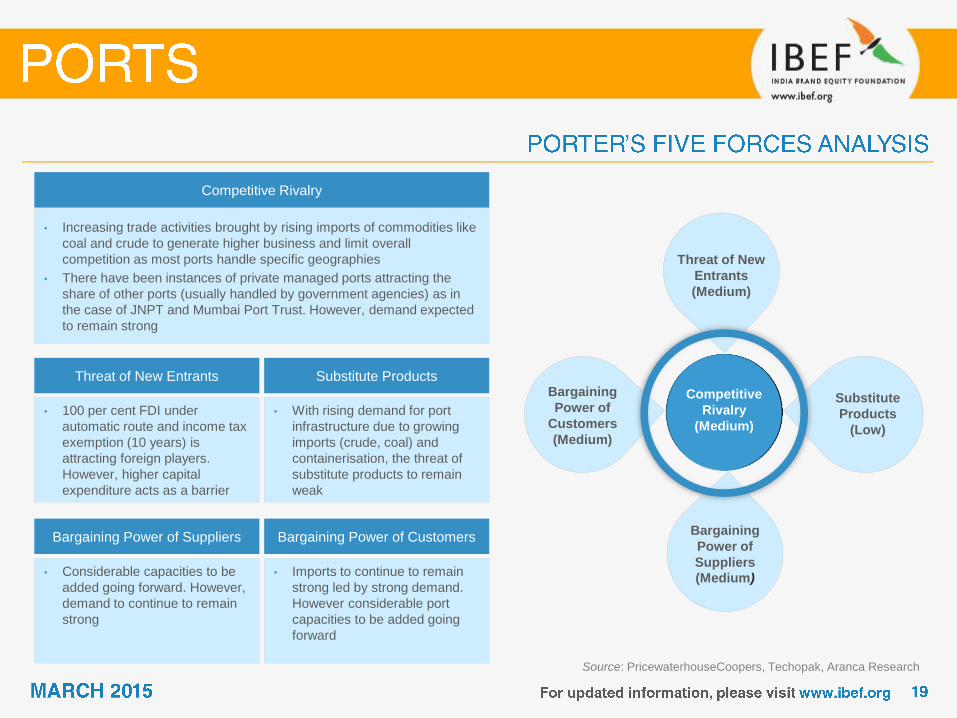
Competitive Rivalry
• Increasing trade activities brought by rising imports of commodities like
coal and crude to generate higher business and limit overall
competition as most ports handle specific geographies
• There have been instances of private managed ports attracting the
share of other ports (usually handled by government agencies) as in
the case of JNPT and Mumbai Port Trust. However, demand expected
to remain strong
Threat of New Entrants
• 100 per cent FDI under
automatic route and income tax
exemption (10 years) is
attracting foreign players.
However, higher capital
expenditure acts as a barrier
• With rising demand for port
infrastructure due to growing
imports (crude, coal) and
containerisation, the threat of
substitute products to remain
weak
Substitute Products
Bargaining Power of Suppliers
• Considerable capacities to be
added going forward. However,
demand to continue to remain
strong
Bargaining Power of Customers
• Imports to continue to remain
strong led by strong demand.
However considerable port
capacities to be added going
forward
Competitive
Rivalry
(Medium)
Threat of New
Entrants
(Medium)
Substitute
Products
(Low)
Bargaining
Power of
Customers
(Medium)
Bargaining
Power of
Suppliers
(Medium)

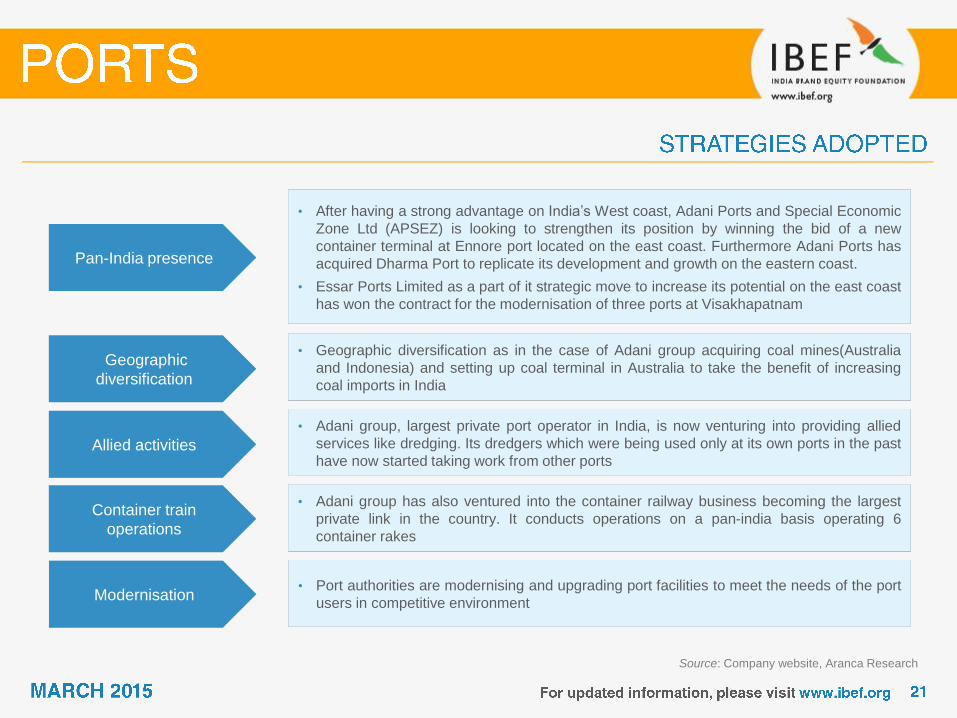
• After having a strong advantage on India‟s West coast, Adani Ports and Special Economic
Zone Ltd (APSEZ) is looking to strengthen its position by winning the bid of a new
container terminal at Ennore port located on the east coast. Furthermore Adani Ports has
acquired Dharma Port to replicate its development and growth on the eastern coast.
• Essar Ports Limited as a part of it strategic move to increase its potential on the east coast
has won the contract for the modernisation of three ports at Visakhapatnam
• Geographic diversification as in the case of Adani group acquiring coal mines(Australia
and Indonesia) and setting up coal terminal in Australia to take the benefit of increasing
coal imports in India
• Adani group, largest private port operator in India, is now venturing into providing allied
services like dredging. Its dredgers which were being used only at its own ports in the past
have now started taking work from other ports
• Adani group has also ventured into the container railway business becoming the largest
private link in the country. It conducts operations on a pan-india basis operating 6
container rakes
Pan-India presence
Geographic
diversification
Allied activities
Container train
operations
• Port authorities are modernising and upgrading port facilities to meet the needs of the port
users in competitive environment Modernisation
Source: Company website, Aranca Research
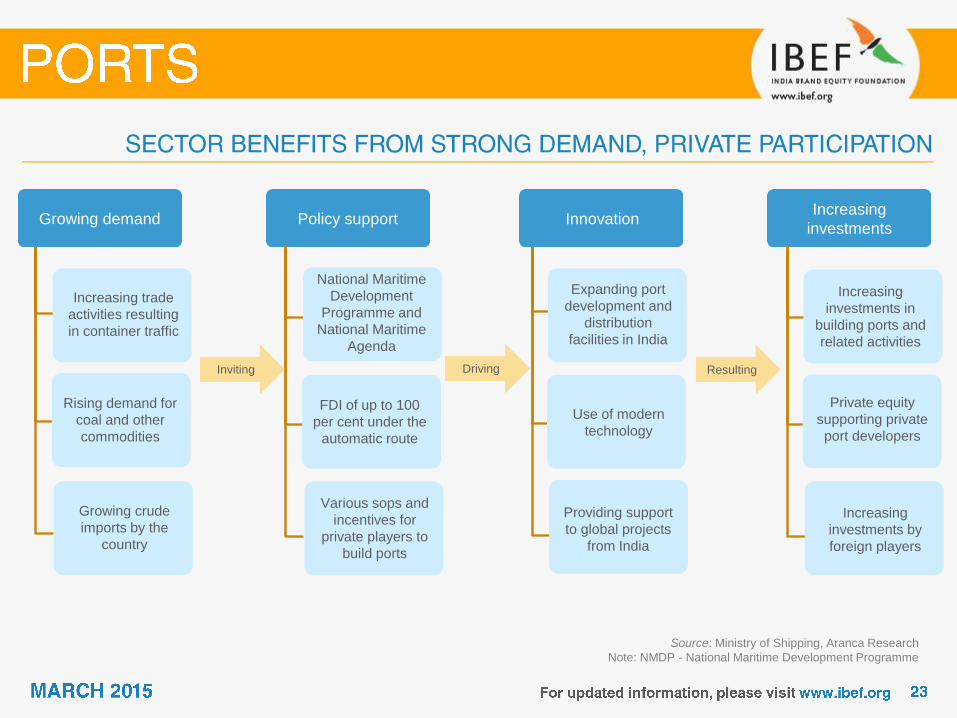
Source: Ministry of Shipping, Aranca Research
Note: NMDP - National Maritime Development Programme
Growing demand
Growing demand
Increasing trade
activities resulting
in container traffic
Rising demand for
coal and other
commodities
Growing crude
imports by the
country
Policy support
National Maritime
Development
Programme and
National Maritime
Agenda
FDI of up to 100
per cent under the
automatic route
Various sops and
incentives for
private players to
build ports
Increasing
investments
Increasing
investments in
building ports and
related activities
Private equity
supporting private
port developers
Increasing
investments by
foreign players
Innovation
Expanding port
development and
distribution
facilities in India
Use of modern
technology
Providing support
to global projects
from India
Resulting Driving Inviting
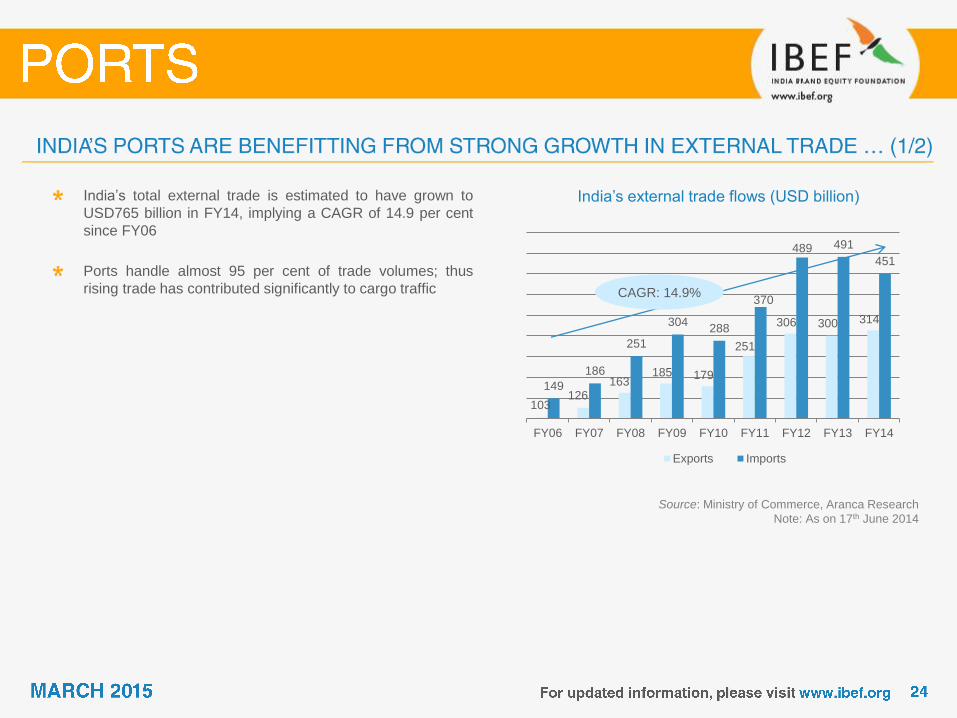
India‟s external trade flows (USD billion)
Source: Ministry of Commerce, Aranca Research
Note: As on 17th June 2014
India‟s total external trade is estimated to have grown to
USD765 billion in FY14, implying a CAGR of 14.9 per cent
since FY06
Ports handle almost 95 per cent of trade volumes; thus
rising trade has contributed significantly to cargo traffic
103 126
163 185 179
251
306 300 314
149
186
251
304 288
370
489 491
451
FY06 FY07 FY08 FY09 FY10 FY11 FY12 FY13 FY14
Exports Imports
CAGR: 14.9%
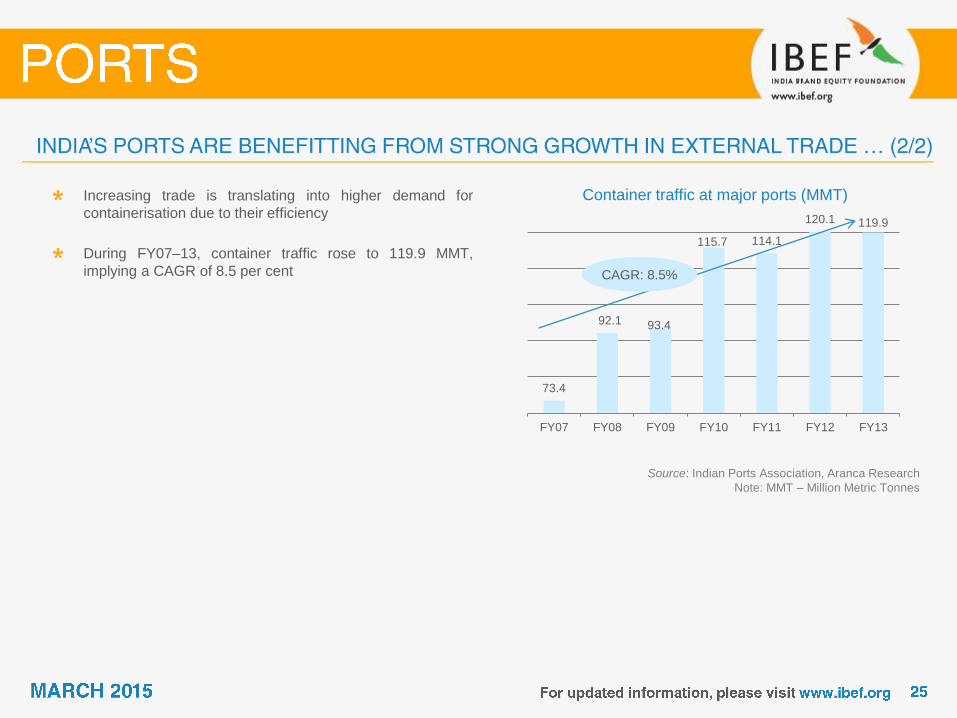
Container traffic at major ports (MMT)
Source: Indian Ports Association, Aranca Research
Note: MMT – Million Metric Tonnes
Increasing trade is translating into higher demand for
containerisation due to their efficiency
During FY07–13, container traffic rose to 119.9 MMT,
implying a CAGR of 8.5 per cent
73.4
92.1 93.4
115.7 114.1
120.1 119.9
FY07 FY08 FY09 FY10 FY11 FY12 FY13
CAGR: 8.5%
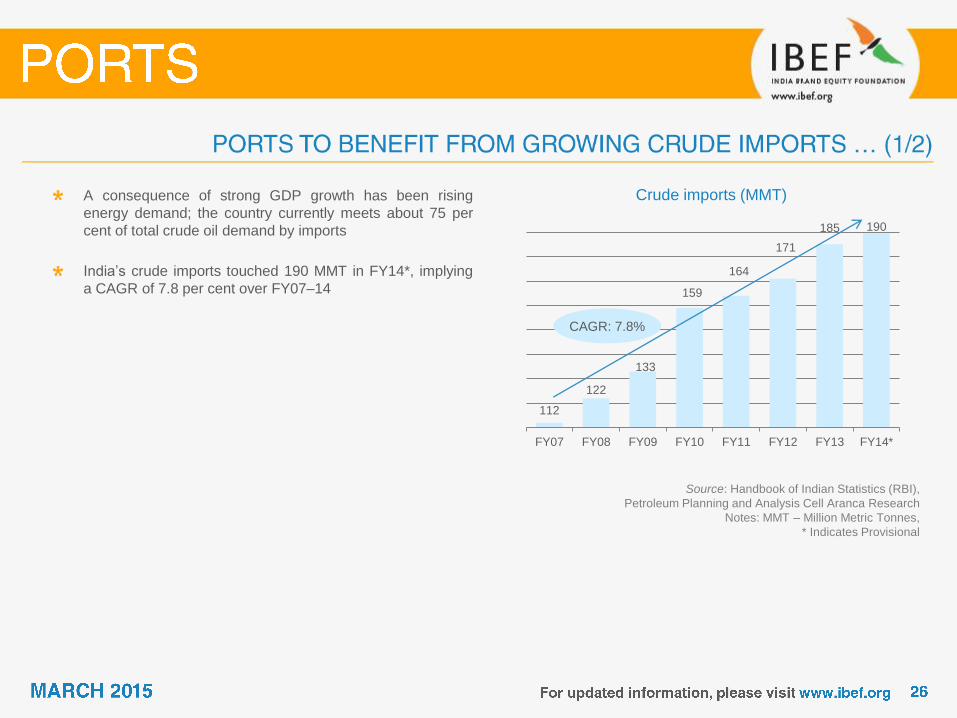
112
122
133
159
164
171
185 190
FY07 FY08 FY09 FY10 FY11 FY12 FY13 FY14*
Crude imports (MMT)
Source: Handbook of Indian Statistics (RBI),
Petroleum Planning and Analysis Cell Aranca Research
Notes: MMT – Million Metric Tonnes,
* Indicates Provisional
A consequence of strong GDP growth has been rising
energy demand; the country currently meets about 75 per
cent of total crude oil demand by imports
India‟s crude imports touched 190 MMT in FY14*, implying
a CAGR of 7.8 per cent over FY07–14
CAGR: 7.8%
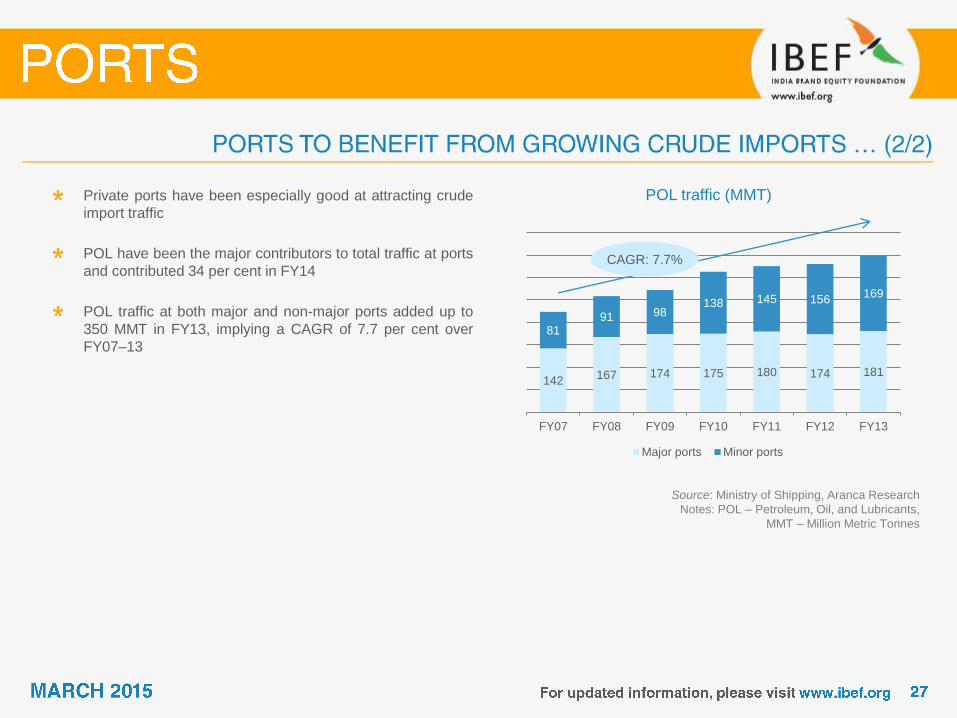
POL traffic (MMT)
Source: Ministry of Shipping, Aranca Research
Notes: POL – Petroleum, Oil, and Lubricants,
MMT – Million Metric Tonnes
Private ports have been especially good at attracting crude
import traffic
POL have been the major contributors to total traffic at ports
and contributed 34 per cent in FY14
POL traffic at both major and non-major ports added up to
350 MMT in FY13, implying a CAGR of 7.7 per cent over
FY07–13
142 167 174 175 180 174 181
81 91 98
138 145 156 169
FY07 FY08 FY09 FY10 FY11 FY12 FY13
Major ports Minor ports
CAGR: 7.7%
83.4
132.2
160.9
192.5
185.5
FY10 FY11 FY12 FY 13E FY17E
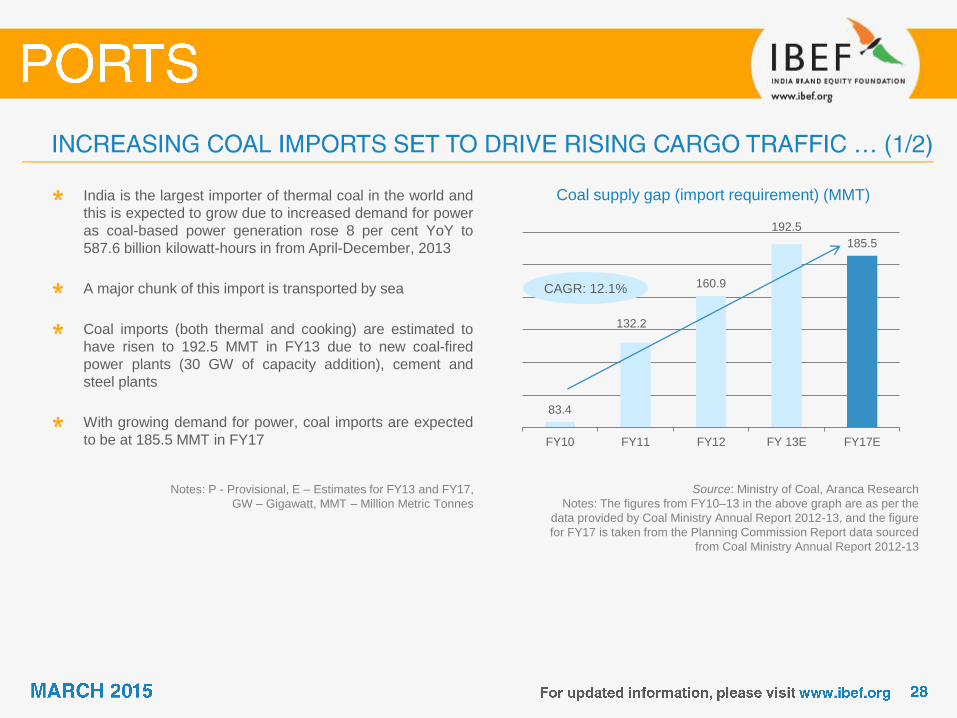
Coal supply gap (import requirement) (MMT)
Source: Ministry of Coal, Aranca Research
Notes: The figures from FY10–13 in the above graph are as per the
data provided by Coal Ministry Annual Report 2012-13, and the figure
for FY17 is taken from the Planning Commission Report data sourced
from Coal Ministry Annual Report 2012-13
India is the largest importer of thermal coal in the world and
this is expected to grow due to increased demand for power
as coal-based power generation rose 8 per cent YoY to
587.6 billion kilowatt-hours in from April-December, 2013
A major chunk of this import is transported by sea
Coal imports (both thermal and cooking) are estimated to
have risen to 192.5 MMT in FY13 due to new coal-fired
power plants (30 GW of capacity addition), cement and
steel plants
With growing demand for power, coal imports are expected
to be at 185.5 MMT in FY17
CAGR: 12.1%
Notes: P - Provisional, E – Estimates for FY13 and FY17,
GW – Gigawatt, MMT – Million Metric Tonnes
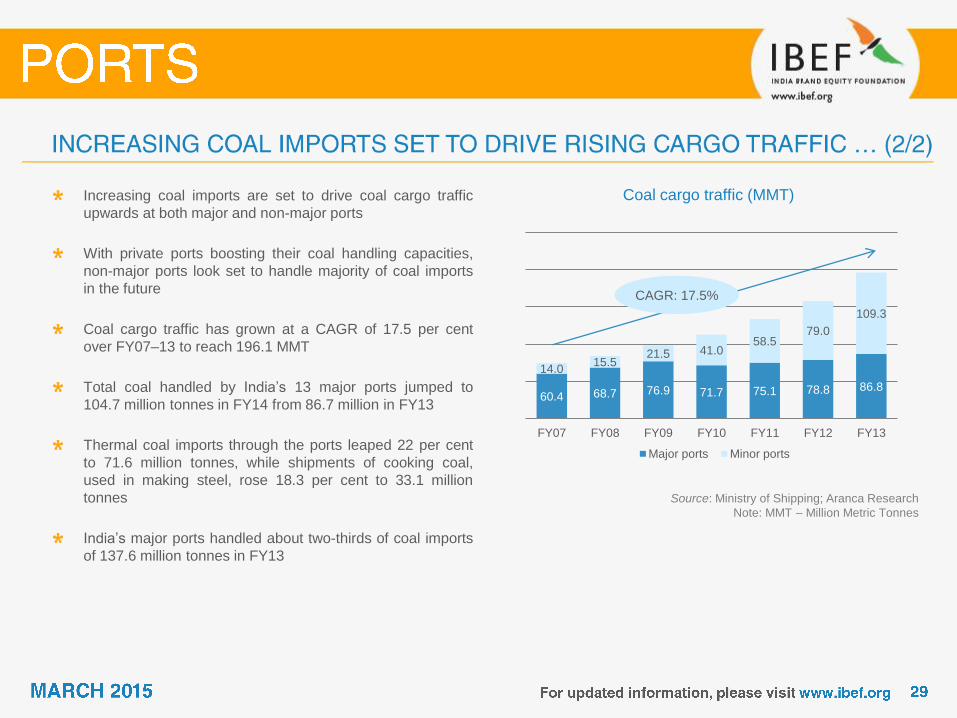
Coal cargo traffic (MMT)
Source: Ministry of Shipping; Aranca Research
Note: MMT – Million Metric Tonnes
Increasing coal imports are set to drive coal cargo traffic
upwards at both major and non-major ports
With private ports boosting their coal handling capacities,
non-major ports look set to handle majority of coal imports
in the future
Coal cargo traffic has grown at a CAGR of 17.5 per cent
over FY07–13 to reach 196.1 MMT
Total coal handled by India‟s 13 major ports jumped to
104.7 million tonnes in FY14 from 86.7 million in FY13
Thermal coal imports through the ports leaped 22 per cent
to 71.6 million tonnes, while shipments of cooking coal,
used in making steel, rose 18.3 per cent to 33.1 million
tonnes
India‟s major ports handled about two-thirds of coal imports
of 137.6 million tonnes in FY13
60.4 68.7 76.9 71.7 75.1 78.8 86.8
14.0 15.5
21.5 41.0 58.5
79.0
109.3
FY07 FY08 FY09 FY10 FY11 FY12 FY13
Major ports Minor ports
CAGR: 17.5%
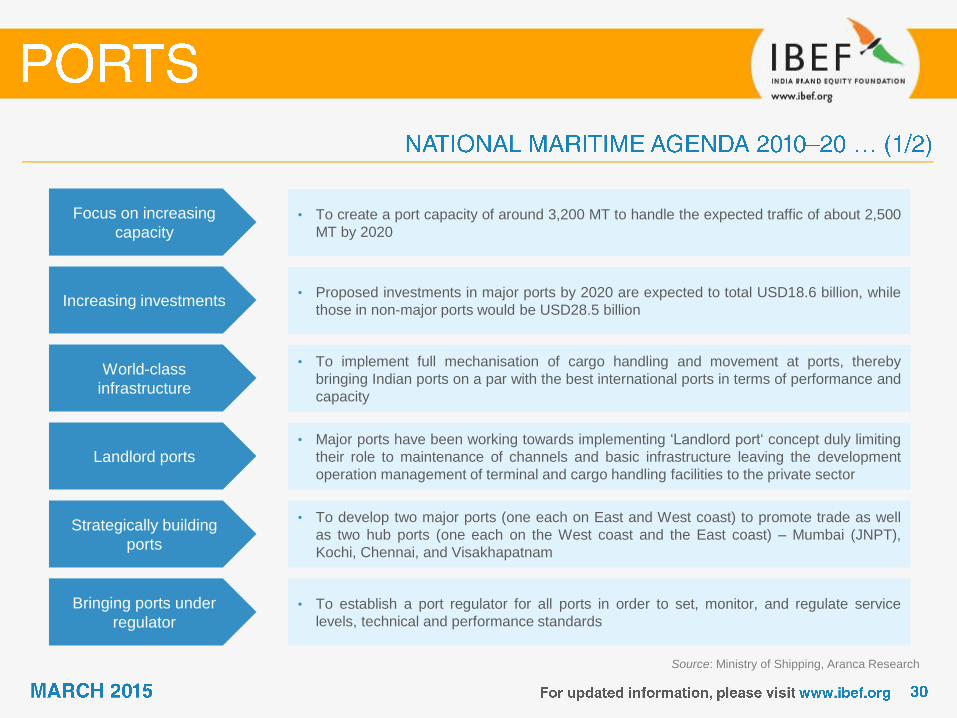
Focus on increasing
capacity • To create a port capacity of around 3,200 MT to handle the expected traffic of about 2,500
MT by 2020
Increasing investments • Proposed investments in major ports by 2020 are expected to total USD18.6 billion, while
those in non-major ports would be USD28.5 billion
World-class
infrastructure
• To implement full mechanisation of cargo handling and movement at ports, thereby
bringing Indian ports on a par with the best international ports in terms of performance and
capacity
Source: Ministry of Shipping, Aranca Research
Strategically building
ports
• To develop two major ports (one each on East and West coast) to promote trade as well
as two hub ports (one each on the West coast and the East coast) – Mumbai (JNPT),
Kochi, Chennai, and Visakhapatnam
Bringing ports under
regulator
• To establish a port regulator for all ports in order to set, monitor, and regulate service
levels, technical and performance standards
Landlord ports • Major ports have been working towards implementing „Landlord port„ concept duly limiting
their role to maintenance of channels and basic infrastructure leaving the development
operation management of terminal and cargo handling facilities to the private sector
Source: Ministry of Shipping, Aranca Research
Note: EXIM - Export-Import
National Maritime Agenda 2010–20 is aimed at the all-round development of the Indian maritime sector
22 projects, which involve capacity addition of 97.34 MTPA and investment of USD975.9 million, have been awarded as of
January 2013
Agenda involves investments in new projects at major ports of around USD18.6 billion, of which USD12.4 billion is expected
to come from private sector players and the remaining from budgetary allocation
By 2015, National Maritime Agenda aims to increase the share of Indian seafarers in the global shipping industry from 6–7
per cent to at least 9 per cent
The government, through this policy, aims to increase the tonnage under the Indian flag and Indian control as well as the
share of Indian ships in EXIM trade
The government is also working to float a specialised Maritime Finance Corporation with the equity of ports and financial
institutions to fund the Port projects
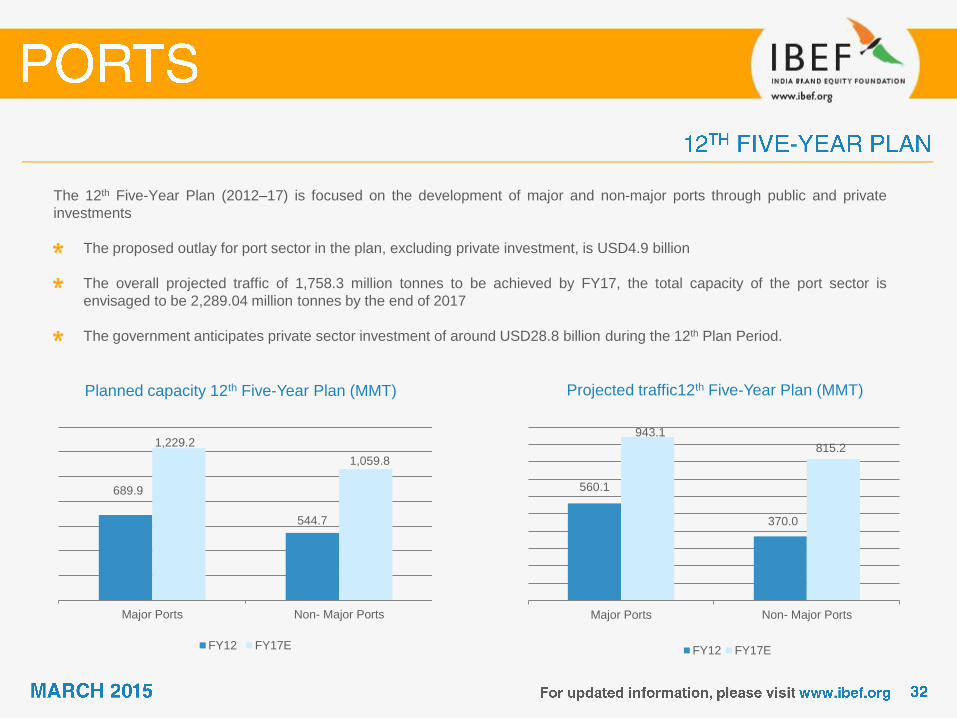
Planned capacity 12th Five-Year Plan (MMT)
The 12th Five-Year Plan (2012–17) is focused on the development of major and non-major ports through public and private
investments
The proposed outlay for port sector in the plan, excluding private investment, is USD4.9 billion
The overall projected traffic of 1,758.3 million tonnes to be achieved by FY17, the total capacity of the port sector is
envisaged to be 2,289.04 million tonnes by the end of 2017
The government anticipates private sector investment of around USD28.8 billion during the 12th Plan Period.
Projected traffic12th Five-Year Plan (MMT)
689.9
544.7
1,229.2
1,059.8
Major Ports Non- Major Ports
FY12 FY17E
560.1
370.0
943.1
815.2
Major Ports Non- Major Ports
FY12 FY17E
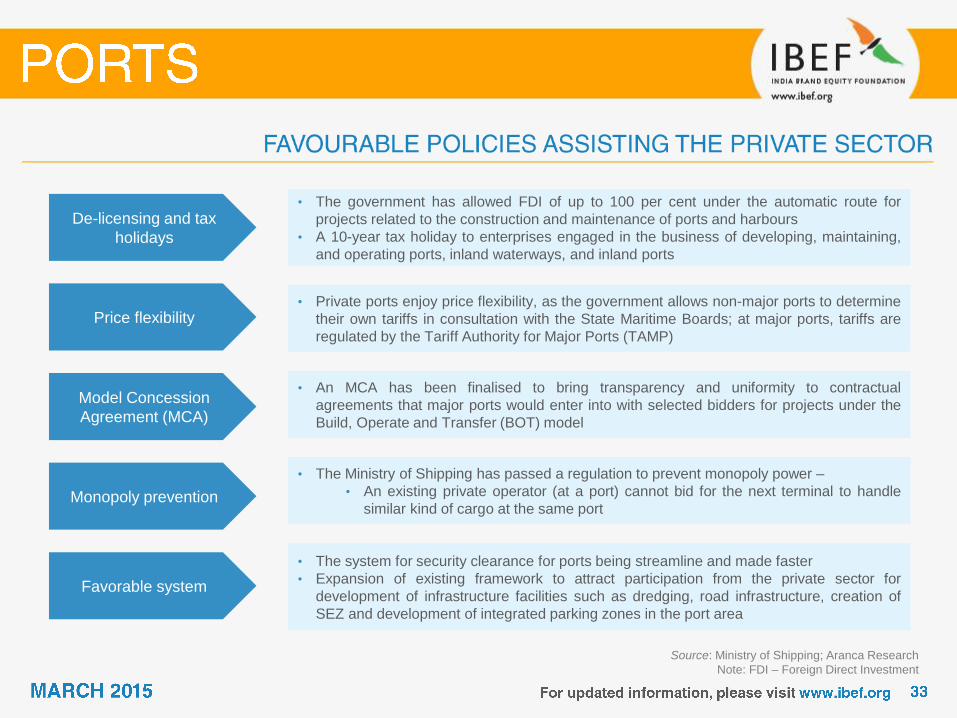
De-licensing and tax
holidays
• The government has allowed FDI of up to 100 per cent under the automatic route for
projects related to the construction and maintenance of ports and harbours
• A 10-year tax holiday to enterprises engaged in the business of developing, maintaining,
and operating ports, inland waterways, and inland ports
Source: Ministry of Shipping; Aranca Research
Note: FDI – Foreign Direct Investment
Price flexibility • Private ports enjoy price flexibility, as the government allows non-major ports to determine
their own tariffs in consultation with the State Maritime Boards; at major ports, tariffs are
regulated by the Tariff Authority for Major Ports (TAMP)
Model Concession
Agreement (MCA)
• An MCA has been finalised to bring transparency and uniformity to contractual
agreements that major ports would enter into with selected bidders for projects under the
Build, Operate and Transfer (BOT) model
Monopoly prevention
• The Ministry of Shipping has passed a regulation to prevent monopoly power –
• An existing private operator (at a port) cannot bid for the next terminal to handle
similar kind of cargo at the same port
Favorable system
• The system for security clearance for ports being streamline and made faster
• Expansion of existing framework to attract participation from the private sector for
development of infrastructure facilities such as dredging, road infrastructure, creation of
SEZ and development of integrated parking zones in the port area
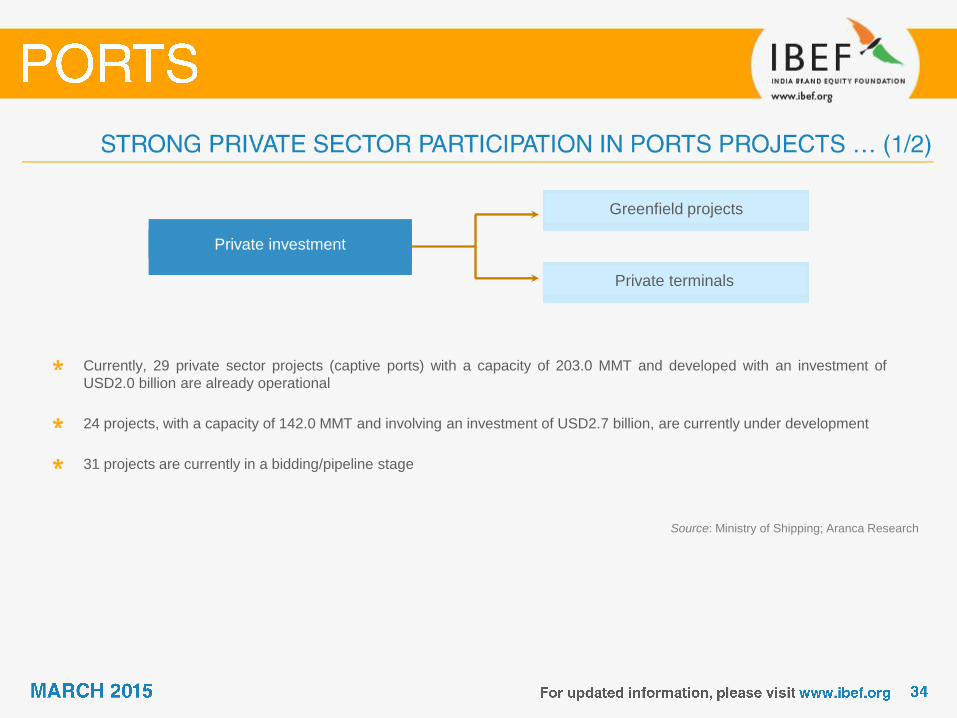
Currently, 29 private sector projects (captive ports) with a capacity of 203.0 MMT and developed with an investment of
USD2.0 billion are already operational
24 projects, with a capacity of 142.0 MMT and involving an investment of USD2.7 billion, are currently under development
31 projects are currently in a bidding/pipeline stage
Source: Ministry of Shipping; Aranca Research
Private investment
Greenfield projects
Private terminals
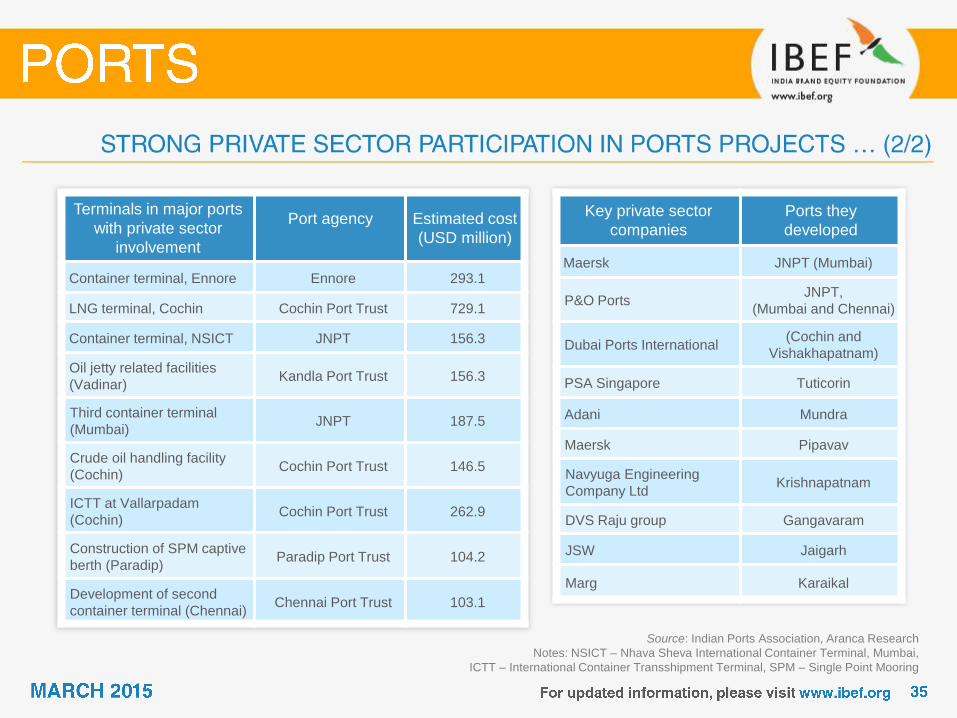
Source: Indian Ports Association, Aranca Research
Notes: NSICT – Nhava Sheva International Container Terminal, Mumbai,
ICTT – International Container Transshipment Terminal, SPM – Single Point Mooring
Terminals in major ports
with private sector
involvement
Port agency
Estimated cost
(USD million)
Container terminal, Ennore Ennore 293.1
LNG terminal, Cochin Cochin Port Trust 729.1
Container terminal, NSICT JNPT 156.3
Oil jetty related facilities
(Vadinar) Kandla Port Trust 156.3
Third container terminal
(Mumbai) JNPT 187.5
Crude oil handling facility
(Cochin) Cochin Port Trust 146.5
ICTT at Vallarpadam
(Cochin) Cochin Port Trust 262.9
Construction of SPM captive
berth (Paradip) Paradip Port Trust 104.2
Development of second
container terminal (Chennai) Chennai Port Trust 103.1
Key private sector
companies
Ports they
developed
Maersk JNPT (Mumbai)
P&O Ports JNPT,
(Mumbai and Chennai)
Dubai Ports International (Cochin and
Vishakhapatnam)
PSA Singapore Tuticorin
Adani Mundra
Maersk Pipavav
Navyuga Engineering
Company Ltd Krishnapatnam
DVS Raju group Gangavaram
JSW Jaigarh
Marg Karaikal
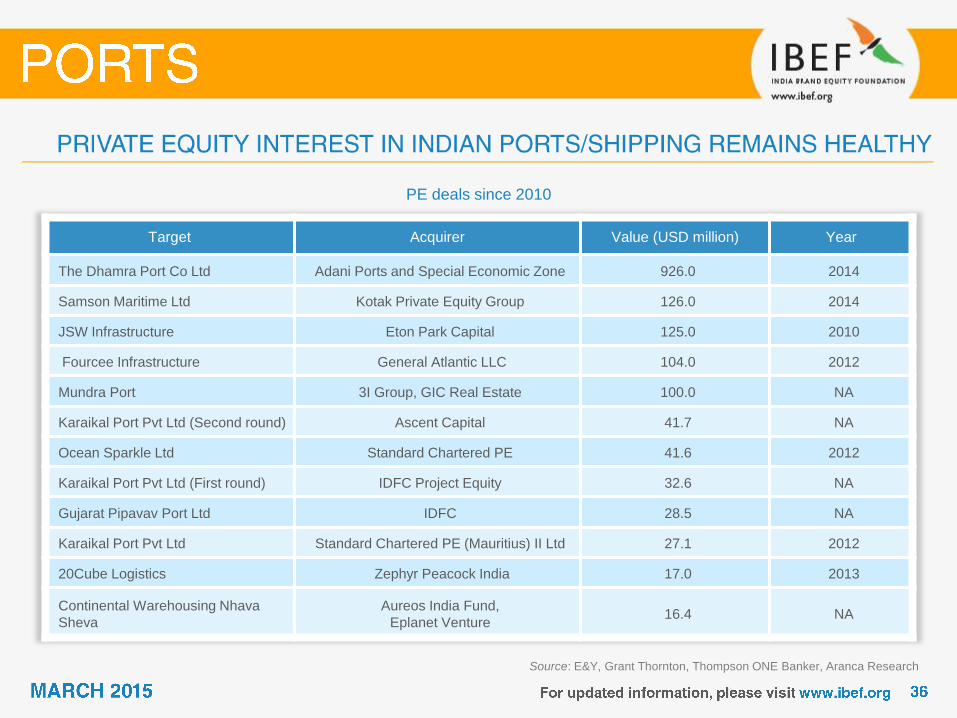
Target Acquirer Value (USD million) Year
The Dhamra Port Co Ltd Adani Ports and Special Economic Zone 926.0 2014
Samson Maritime Ltd Kotak Private Equity Group 126.0 2014
JSW Infrastructure Eton Park Capital 125.0 2010
Fourcee Infrastructure General Atlantic LLC 104.0 2012
Mundra Port 3I Group, GIC Real Estate 100.0 NA
Karaikal Port Pvt Ltd (Second round) Ascent Capital 41.7 NA
Ocean Sparkle Ltd Standard Chartered PE 41.6 2012
Karaikal Port Pvt Ltd (First round) IDFC Project Equity 32.6 NA
Gujarat Pipavav Port Ltd IDFC 28.5 NA
Karaikal Port Pvt Ltd Standard Chartered PE (Mauritius) II Ltd 27.1 2012
20Cube Logistics Zephyr Peacock India 17.0 2013
Continental Warehousing Nhava
Sheva
Aureos India Fund,
Eplanet Venture 16.4 NA
PE deals since 2010
Source: E&Y, Grant Thornton, Thompson ONE Banker, Aranca Research


Increasing scope for private ports Ship repair facilities at ports Port support services
• With rising demand for port
infrastructure due to growing imports
(crude, coal) and containerisation,
public ports (major ports) will fall short of
meeting demand
• This provides private ports with an
opportunity to serve the spill-off demand
from major ports and increase their
capacities in line with forecasted new
demand
• Dry docks are necessary to provide ship
repair facilities. Out of all major ports,
Kolkata has five dry docks, Mumbai and
Visakhapatnam have two; the rest have
one or no dock at all
• Given the positive outlook for cargo
traffic, and the resulting increase in
number of vessels visiting ports,
demand for ship repair services will go
up. This will provide opportunities to
build new dry docks and setup ancillary
repair facilities
• Operation and maintenance services
such as pilotage, dredging, harbouring
and provision of marine assets such as
barges and dredgers are expected to
increase in coming years
• Increasing investments and cargo traffic
point to a healthy outlook for port
support services
• These include Operation and
Maintenance (O&M) services like
pilotage, harbouring and provision of
marine assets like barges and dredgers
Source: Ministry of Shipping, Aranca Research
Note: O&M – Operations & Maintenance

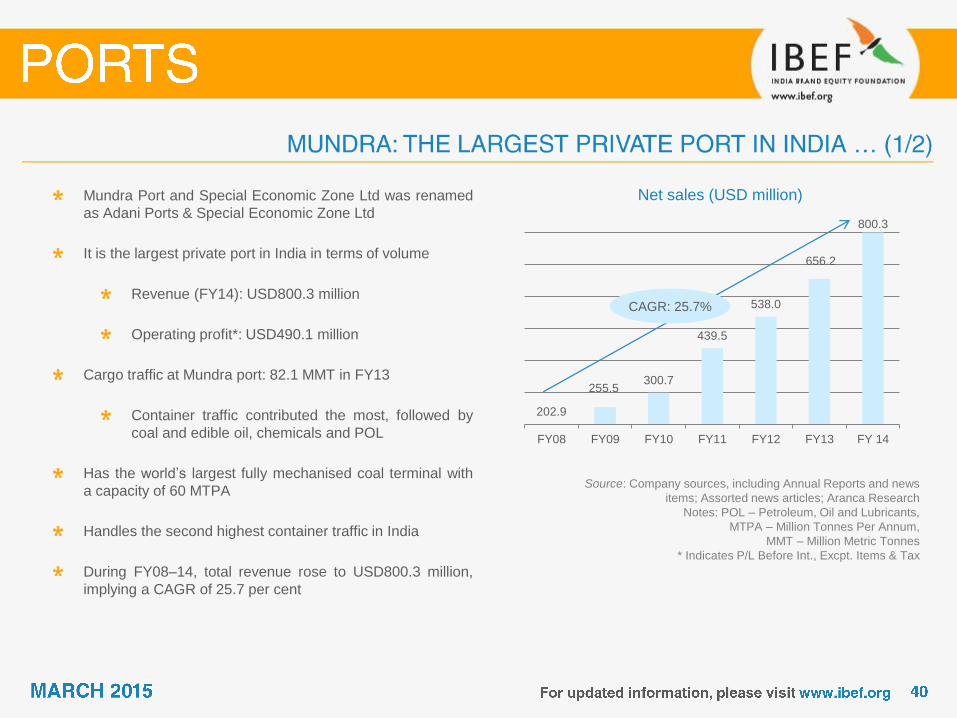
Net sales (USD million)
Source: Company sources, including Annual Reports and news
items; Assorted news articles; Aranca Research
Notes: POL – Petroleum, Oil and Lubricants,
MTPA – Million Tonnes Per Annum,
MMT – Million Metric Tonnes
* Indicates P/L Before Int., Excpt. Items & Tax
Mundra Port and Special Economic Zone Ltd was renamed
as Adani Ports & Special Economic Zone Ltd
It is the largest private port in India in terms of volume
Revenue (FY14): USD800.3 million
Operating profit*: USD490.1 million
Cargo traffic at Mundra port: 82.1 MMT in FY13
Container traffic contributed the most, followed by
coal and edible oil, chemicals and POL
Has the world‟s largest fully mechanised coal terminal with
a capacity of 60 MTPA
Handles the second highest container traffic in India
During FY08–14, total revenue rose to USD800.3 million,
implying a CAGR of 25.7 per cent
202.9
255.5 300.7
439.5
538.0
656.2
800.3
FY08 FY09 FY10 FY11 FY12 FY13 FY 14
CAGR: 25.7%
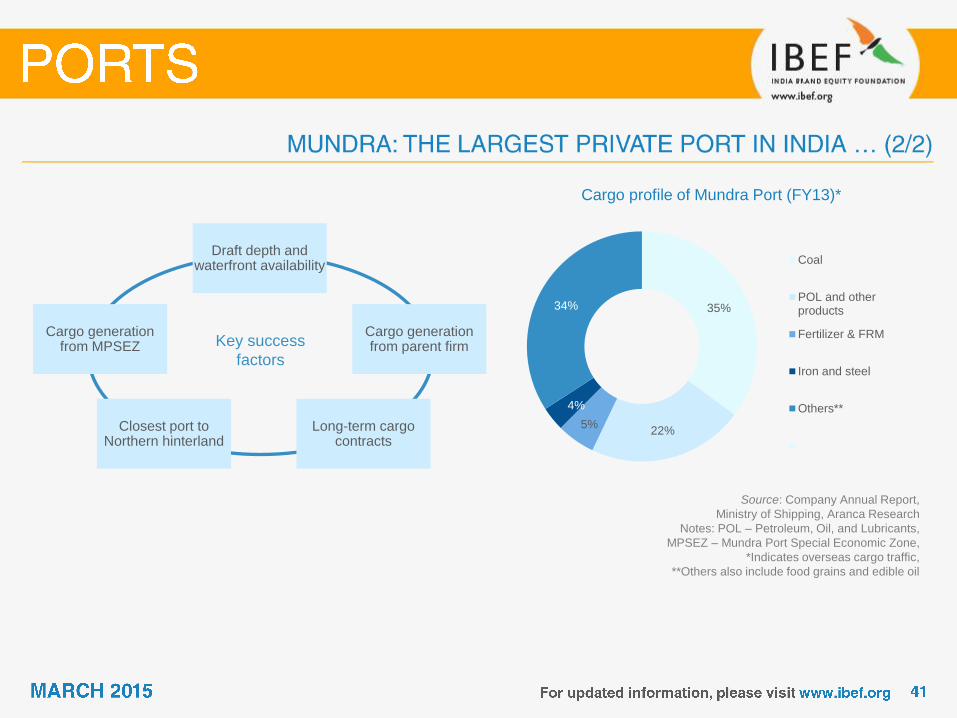
Cargo profile of Mundra Port (FY13)*
Source: Company Annual Report,
Ministry of Shipping, Aranca Research
Notes: POL – Petroleum, Oil, and Lubricants,
MPSEZ – Mundra Port Special Economic Zone,
*Indicates overseas cargo traffic,
**Others also include food grains and edible oil
35%
22% 5%
4%
34%
Coal
POL and otherproducts
Fertilizer & FRM
Iron and steel
Others**
Draft depth and waterfront availability
Cargo generation from MPSEZ
Closest port to Northern hinterland
Cargo generation from parent firm
Long-term cargo contracts
Key success
factors
Jawaharlal Nehru Port Trust (JNPT) has the third highest cargo traffic and the highest container traffic in the country
It is a container-focussed port with container traffic of 57.9 MMT in FY13
Handled 62.33 million tonnes of cargo in FY14 (including 4.16 TEU's containers)
Poised to handle 10 million TEUs of containers by the year FY16
Traffic handled at JNPT for FY13 was 64.5 MMT
Distribution of JNPT‟s container traffic for FY12 across its various terminals was as follows –
Jawaharlal Nehru Port Container Terminal (JNPCT): 1.21 million TEUs
Nhava Sheva International Container Terminal (NSICT): 1.40 MMT
APM Terminals: 1.9 MMT
Notes: TEU – Twenty-Foot Equivalent Unit,
MMT – Million Metric Tonnes
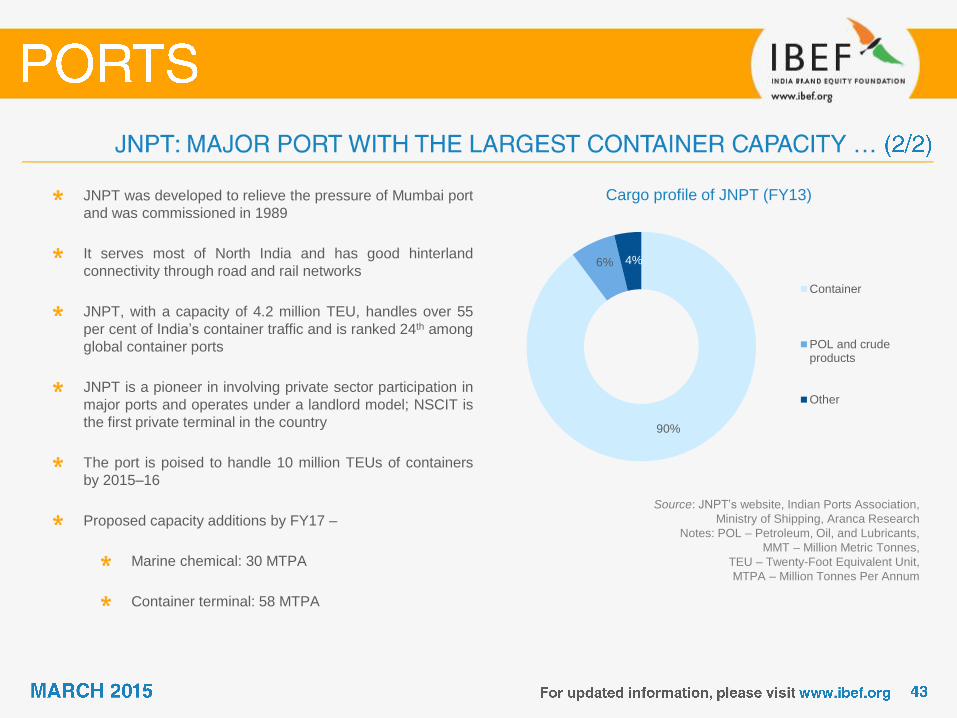
Cargo profile of JNPT (FY13)
Source: JNPT‟s website, Indian Ports Association,
Ministry of Shipping, Aranca Research
Notes: POL – Petroleum, Oil, and Lubricants,
MMT – Million Metric Tonnes,
TEU – Twenty-Foot Equivalent Unit,
MTPA – Million Tonnes Per Annum
JNPT was developed to relieve the pressure of Mumbai port
and was commissioned in 1989
It serves most of North India and has good hinterland
connectivity through road and rail networks
JNPT, with a capacity of 4.2 million TEU, handles over 55
per cent of India‟s container traffic and is ranked 24th among
global container ports
JNPT is a pioneer in involving private sector participation in
major ports and operates under a landlord model; NSCIT is
the first private terminal in the country
The port is poised to handle 10 million TEUs of containers
by 2015–16
Proposed capacity additions by FY17 –
Marine chemical: 30 MTPA
Container terminal: 58 MTPA
90%
6% 4%
Container
POL and crudeproducts
Other
53 65 72 80 82
83 94
131
151 153
206
231
259 288
FY07 FY08 FY09 FY10 FY11 FY12 FY13
Major ports Non- Major Ports
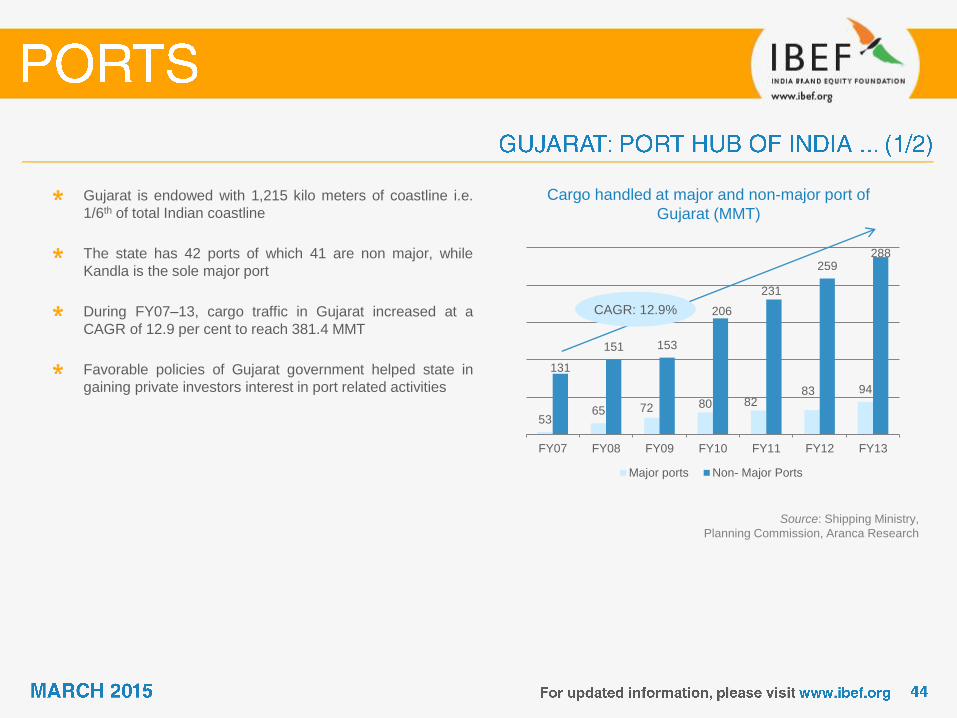
Cargo handled at major and non-major port of
Gujarat (MMT)
Source: Shipping Ministry,
Planning Commission, Aranca Research
Gujarat is endowed with 1,215 kilo meters of coastline i.e.
1/6th of total Indian coastline
The state has 42 ports of which 41 are non major, while
Kandla is the sole major port
During FY07–13, cargo traffic in Gujarat increased at a
CAGR of 12.9 per cent to reach 381.4 MMT
Favorable policies of Gujarat government helped state in
gaining private investors interest in port related activities
CAGR: 12.9%
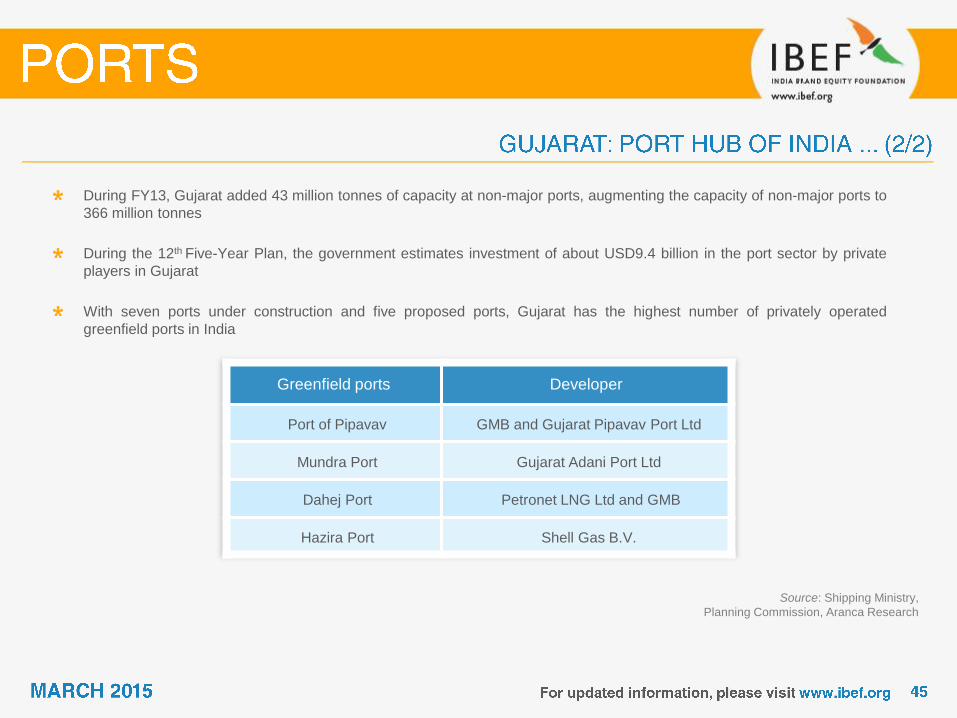
During FY13, Gujarat added 43 million tonnes of capacity at non-major ports, augmenting the capacity of non-major ports to
366 million tonnes
During the 12th Five-Year Plan, the government estimates investment of about USD9.4 billion in the port sector by private
players in Gujarat
With seven ports under construction and five proposed ports, Gujarat has the highest number of privately operated
greenfield ports in India
Source: Shipping Ministry,
Planning Commission, Aranca Research
Greenfield ports Developer
Port of Pipavav GMB and Gujarat Pipavav Port Ltd
Mundra Port Gujarat Adani Port Ltd
Dahej Port Petronet LNG Ltd and GMB
Hazira Port Shell Gas B.V.

Indian Ports Association (IPA)
1st floor, South Tower, NBCC Place
Bhishma Pitamah Marg, Lodi Road
New Delhi – 110 003
Phone: 91-11-24369061, 24369063, 24368334
Fax: 91-11-24365866
E-mail: [email protected], [email protected]
Indian Private Ports & Terminals Association
Darabshaw House, Level-1, N.M. Marg,
Ballard Estate, Mumbai 400 001, India
Tel. No: 022-22610599
Fax. No: 022-22621405
Email: [email protected]
Major and non-major ports do not have a strict association with traffic volumes. The classification has more of an
administrative significance
Cargo traffic includes both loading (export) and unloading (imports) of goods
Containerisation is the increased use of container for transporting non-bulk goods. It leads to increased efficiency (both
time and money)
Turnaround time is the total time spent by a ship from entry into port till departure
Twenty Equivalent Units (TEU) is a standard measure of containers which are 20 feet in length and 8 feet in width; the
height can vary
Draft is the vertical distance between waterline and the bottom of the ship. It determines the depth of water a ship or boat
can safely navigate. Higher capacity ships will need higher draft, hence ports with higher natural draft will attract bigger
ships
Waterfront availability is the length of the water line on the coast where ships can rest and the goods are unloaded. Longer
waterfront lengths reduce waiting time and help raise capacity
Terminals are certain sections of the ports where different types of cargo are unloaded
Single Point Mooring (SPM) is a loading buoy anchored offshore that serves as a mooring point and interconnect for
tankers loading or offloading gas or fluid product
A dry dock is a narrow basin that can be flooded to allow a ship to be floated in, then drained to allow that ship to come to
rest on a dry platform. Dry docks are used for construction, maintenance and repair of ships
FY: Indian Financial Year (April to March) – So FY11 implies April 2010 to March 2011
USD: US Dollar
FDI: Foreign Direct Investment
IPA: Indian Ports Association
NMDP: National Maritime Development Programme
POL: Petroleum, Oil & Lubricants
SEZ: Special Economic Zone
CAGR: Compounded Annual Growth Rate
ICTT: International Container Transshipment Terminal
TEU: Twenty-Foot Equivalent Unit
MMTPA: Million Metric Tonnes Per Annum
MMT: Million Metric Tonnes
GOI: Government of India
NSICT: Nhava Sheva International Container Terminal, Mumbai
O&M: Operation and Maintenance services
LNG: Liquefied Natural Gas
Wherever applicable, numbers have been rounded off to the nearest whole number

Average for the year
Year INR equivalent of one USD
2004–05 44.81
2005–06 44.14
2006–07 45.14
2007–08 40.27
2008–09 46.14
2009–10 47.42
2010–11 45.62
2011–12 46.88
2012–13 54.31
2013–14 60.28
Year INR equivalent of one USD
2005 43.98
2006 45.18
2007 41.34
2008 43.62
2009 48.42
2010 45.72
2011 46.85
2012 53.46
2013 58.44
Q12014 61.58
Q22014 59.74
Q32014 60.53
Exchange rates (Fiscal Year) Exchange rates (Calendar Year)

India Brand Equity Foundation (“IBEF”) engaged Aranca to prepare this presentation and the same has been prepared
by Aranca in consultation with IBEF.
All rights reserved. All copyright in this presentation and related works is solely and exclusively owned by IBEF. The
same may not be reproduced, wholly or in part in any material form (including photocopying or storing it in any
medium by electronic means and whether or not transiently or incidentally to some other use of this presentation),
modified or in any manner communicated to any third party except with the written approval of IBEF.
This presentation is for information purposes only. While due care has been taken during the compilation of this
presentation to ensure that the information is accurate to the best of Aranca and IBEF‟s knowledge and belief, the
content is not to be construed in any manner whatsoever as a substitute for professional advice.
Aranca and IBEF neither recommend nor endorse any specific products or services that may have been mentioned in
this presentation and nor do they assume any liability or responsibility for the outcome of decisions taken as a result of
any reliance placed on this presentation.
Neither Aranca nor IBEF shall be liable for any direct or indirect damages that may arise due to any act or omission on
the part of the user due to any reliance placed or guidance taken from any portion of this presentation.