Embed Size (px)
Citation preview

New analysis of EQAO data exposes inequities in Ontario public schools for students with dyslexia and learning disabilities
By IDA OntarioSeptember 2021

LIFTING THE CURTAIN ON EQAO SCORES
2
Executive Summary
The mission of the Education Quality and Accountability Off ice (EQAO) is to conduct assessments that provide information supporting accountability and continuous improvement of Ontario’s publicly funded school system. When curriculum, teaching approaches, and/or educational policies are failing to meet the needs of Ontario students EQAO is responsible for bringing this information to light. EQAO succeeded in this mission in recent years when declining math scores exposed the ineffectiveness of the "discovery math" curriculum. However, EQAO has failed to adequately expose the issues of systemic inequity caused by our current language curriculum and approach to teaching children to read.
When provided with appropriate instruction, more than 95% of students are cognitively capable of learning to read. In Ontario, however, we continue to see a large gap between human potential and reading outcomes. Since 2004, efforts to narrow this gap have largely focused on providing students with a larger dose of the same type of reading instruction. This has included increased funding to; reduce class sizes, expand the kindergarten program, and provide special education programs for struggling students.
During the same time, England, Australia, New Zealand, and many US states have taken a different approach. They have put pedagogy under the microscope and begun replacing long standing and often popular educational approaches with curriculum and policies that are supported by sound scientific evidence. These science-based changes include providing all students with systematic, explicit instruction in the foundational skills needed to decode or "sound out" words, implementing universal
early screening to identify students at risk for reading difficulties, and providing early intervention to all students found to be at risk. This approach aims to prevent reading difficulties from developing, rather than waiting to see if children will catch up on their own and providing intervention only after they are years below grade level.
Ontario has resisted shifting to an evidence-based preventative model of reading instruction. This has in part been due to the belief, supported by EQAO data, that our current efforts have been successful in improving student outcomes. EQAO has reported a steady increase in grade 3 and 6 reading scores over the past 15 years, however the corresponding scores on OSSLT, PISA, and PIRLS show a very different picture.
A deeper look at the EQAO data over the past 15 years has uncovered troubling trends, including:
◆ A signif icant increase in the use of assistive technology (AT) and/or scribing on the Grade 3 and 6 EQAO reading assessment. In 2019 18% of students who participated were provided these accommodations to enable them to listen to the text passages and dictate their answers, this rate is six times higher than in 2005 (<3%).
18% of students used Assistive technology and / or scribing on the 2019 EQAO Reading assessment.

LIFTING THE CURTAIN ON EQAO SCORES
3Executive Summary
literacy education would the Ontario Human Rights Commission have needed to launch the Right to Read public inquiry?
We recommend that Ontario immediately implement the following changes to improve reading outcomes and equity for students:
1. Adoption of scientific, evidence-based curriculum, instructional practices, and policies.
2. Provision of greater transparency in EQAO reporting.
3. Implementation of a universal baseline screening upon kindergarten entry to ensure early identification of risk factors associated with reading difficulties and a more equitable measure of school effectiveness.
4. Adoption of the "Phonics Screening Check" at the end of Grade 1 to support earlier identification of word reading difficulties and timely intervention.
◆ A continuously declining number of students completing (2005: 92%, 2019: 81%) and passing (2005: 68%, 2019: 58%) the Ontario Secondary School Literacy Test (OSSLT).
◆ A steady increase in the percentage of students with special education needs (excluding gifted) across all grades between 2005 (Grade 3: 11%, Grade 6: 13%, Grade 10: 17%) and 2019 (Grade 3: 19%, Grade 6: 24%, Grade 10: 29%).
◆ Little to no improvement in the unassisted pass rate for students with IEPs, in 2019 only 8% of Grade 3 students with an IEP passed the reading assessment independently compared with 10% in 2005.
◆ Increasing delays in learning disability identification through the Identification Placement and Review Committee process (IPRC-LD) for all students and substantial inequity in IPRC-LD designation for students who are classified as English Language Learners (ELL). In 2019 only 1.2% of grade 10 ELL students had an IPRC-LD designation compared to 8.6% of non-ELL students.
◆ A signif icant achievement gap between ELL students and non-ELL students. While this gap exists across all assessments it is most significant on the OSSLT where only 38% of ELL students passed the assessment compared to 60% of non-ELL students.
Our analysis also raises questions about the effectiveness, objectivity, reliability, and transparency of the assessments conducted by EQAO. We ask, had EQAO succeeded in its mission to provide accountability and continual improvement in

LIFTING THE CURTAIN ON EQAO SCORES
4
Table of Contents
Executive Summary 2Table of Contents 4List of Abbreviations 6Introduction 7
Gap between human potential and literacy outcomes in Ontario 7Impact of low literacy 7History of literacy instruction and achievement in Ontario 8
The reading wars 8Growing public concern about poor student outcomes 8Gap between evidence and practice 9Inconsistencies in reported reading scores 10Use of Assistive Technology (AT) and/or Scribing on EQAO 11Understanding reading – The Simple View 12Issues with the use of AT/Scribing on a literacy assessment 13Reporting on the rates of AT/Scribing use on EQAO assessments 13
Methodology 15Results and Discussion 16
Use of AT/Scribing over time 16EQAO reading results 18
Grade 3 18Grade 6 20
OSSLT eligibility, participation, and results 22Pass rate for students using AT/Scribing 24Concerns about reliance on Assistive Technology 25Rates and trends in identification of Learning Disabilities in Ontario 26Timing of Learning Disability identification 27Why early identification of Dyslexia is imperative to reading success 28Barriers to identification 28Rates of IPCR-LD identification of ELL students 29Achievement gap between ELL and non-ELL students 31

LIFTING THE CURTAIN ON EQAO SCORES
5Table of Contents
Recommendations 321 Adopt evidence-based curriculum, instruction, and policies 322 Provide greater transparency in EQAO reporting 333 Improve equity by implementing a baseline assessment upon kindergarten entry 334 Implement a standard assessment of decoding ability at the end of Grade One 34Conclusion 36
References 37Appendix 43

LIFTING THE CURTAIN ON EQAO SCORES
6
AT Assistive Technology
use of assistive technology and/or scribing on the EQAO assessment
Canadian Association of Chiefs of Police
Council for Ministers of Education Canada
Developmental Reading Assessment
English Language Learners
Education Quality and Accountability Office
Higher Education Quality Council of Ontario
Individualized Education Plan
Identification, Placement, and Review Committee – Learning Disability
Learning Disability
Levelled Literacy Intervention
National Reading Panel
Ontario Human Rights Commission
Ontario Secondary School Certificate
Ontario Secondary School Diploma
Ontario Secondary School Literacy Test
Programme for the International Assessment of Adult Competencies
Progress in International Reading Literacy Study
Programme for International Student Assessment
List of Abbreviations
AT/scribing
CACP
CMEC
DRA
ELL
EQAO
HEQCO
IEP
IPRC-LD
LD
LLI
NRP
OHRC
OSSC
OSSD
OSSLT
PIAAC
PIRLS
PISA

LIFTING THE CURTAIN ON EQAO SCORES
7
Results showed that 33% of incoming college students scored below the level that the HEQCO considers necessary to fully participate in the economy and society (Weingarten, 2018). This same assessment, when administered broadly to Ontarians between the age of 16 to 65, found that 47% of adults in Ontario also failed to meet this same standard (Statistics Canada, 2013).
Evidence shows that over 95% of elementary students, regardless of background, are cognitively capable of learning to read when provided with appropriate instruction (EAB Global, Inc. 2019; Moats, 2020). However, in Ontario we see a large gap between human potential and literacy outcomes. For example, in 2019, the EQAO province-wide reading assessment found that 26% of students in Grade 3 did not meet the provincial standards for reading. The results are even more concerning for students with special education needs: 53% of that group did not meet the provincial reading standards (EQAO, 2019).
Assessments of older students and adults also show poor literacy results. For example, in 2017 the Higher Education Quality Council of Ontario (HEQCO) administered the Programme for the International Assessment of Adult Competencies (PIAAC) to assess the literacy and numeracy skills of Ontario’s college and university students.
Failure in learning to read comes at a high cost to both individuals and the society. What starts out as a reading problem frequently snowballs into challenges with academic failure, mental health, and the legal system. Individuals with low literacy are:
◆ likely to have higher rates of anxiety, poor self-esteem, and depression (Canadian Council on Learning, 2009; Alexander-Passe, 2006; Boyes et al., 2016),
◆ less likely to graduate from high school and transition to post-secondary education (McCloy & DeClou, 2013; National Center for Learning Disabilities, 2017; Quinn et al., 2005),
◆ at an increased risk of issues with substance abuse (Macdonald, Deacon & Merchant, 2016; National Center on Addiction and Substance Abuse, 2000),
◆ associated with lower income (Heisz, Notten & Situ, 2016) and unemployment (OECD & Statistics Canada, 2000).
Introduction
Gap between human potential and literacy outcomes in Ontario
Impact of low literacy

LIFTING THE CURTAIN ON EQAO SCORES
8
A 2009 study published by the Canadian Association of Chiefs of Police (CACP) reported that 65% of people entering Canadian Correctional Facilities had lower than grade 8 literacy skills. The study also reported that individuals who interact with the police as suspects, victims, and witnesses tend to have lower than average literacy skills, and neighborhoods with lower literacy levels tend to have higher crime rates (CACP, 2009).
For these reasons, Canada considers access to adequate literacy instruction a basic human right. Concerned about the high number of students not meeting literacy standards, particularly those with reading disability, the Ontario Human Rights Commission launched the Right to Read public inquiry in the fall of 2019.
The debate about how to teach children to read has been raging for decades. At times it has been so contentious that it earned the nickname the "reading wars". In the early to mid-1900’s the disagreement was largely between those who believed that children should be taught the skills needed to sound out words (phonics) and those who believed that children should be taught words as whole units through memorization (whole-word) (Castles et al., 2018).
History of literacy instruction and achievement in Ontario
The reading wars
In the 1970s, the whole-language movement began to gain momentum and by the 1990s this had become the dominant philosophy of reading instruction (Willis, 1995). Proponents of this approach believed that children learn to read naturally on their own with little direct instruction required, provided they are immersed in a language rich environment and given sufficient opportunity and motivation. They also believe that skilled readers do not necessarily need to look at all the letters in a word to read it, instead the reader forms a hypothesis about what the word means by using "cues" from context, syntax or the visual features of the word such as the f irst letter or word shape. Hence, attending to each letter in the word and sounding it out is the method of last resort. This approach to instruction is often referred to as the "three-cuing method". (Castles et al., 2018, Willis, 1995).
Growing public concern about poor student outcomes
By the late 1990s, whole language was the dominant approach in many English-speaking areas including in Ontario. At this time student reading outcomes were considered very poor and public demands for change were widespread.
Introduction
Learning to read is not a frill, it is not a privilege. It is a basic and essential skill.
Learning to read is a human right.
Renu Mandhane Chief Commissioner
OHRC, 2019

LIFTING THE CURTAIN ON EQAO SCORES
9
Governments responded in a variety of ways: in Ontario, the focus was on the establishment of standardized test of reading achievement. In 1997, the Education Quality and Accountability Off ice (EQAO) was established, and in 2000 the successful completion of the Ontario Secondary School Literacy Test (OSSLT) became a requirement for high school graduation. It was believed that by measuring and reporting student outcomes, instructional practices would evolve and become more effective.
Other governments chose to put instructional practices directly under the microscope with the goal of ending the reading wars once and for all. In 1997 the United States congress convened the National Reading Panel (NRP) and tasked a group of experts with reviewing the extensive body of scientific research on reading to identify which instructional practices are most effective. In England, Sir Jim Rose was enlisted to conduct the Independent Review of the Teaching of Early Reading. His findings were published in the 2006 Rose Report. Similarly, in 2005, Australia launched the National Inquiry into the Teaching of Literacy. All of these national reviews found that the whole language method of reading instruction was not supported by evidence and that systematic-explicit instruction of foundational skills, including phonics, was the most effective way to teach students to read (National Institute of Child Health and Human Development (U.S.), 2000; Rose, 2006; Rowe, 2005).
Gap between evidence and practice
Unfortunately, in the early 2000s the whole-language philosophy was deeply ingrained in the hearts and minds of the educational establishment. While England began to adopt the recommendations contained in the Rose Report and started moving towards evidence-based reading instruction, very few other countries had the political will or leadership necessary to do so at the time.
In Ontario, the government saw the need for improvements in student outcomes, and in 2004 announced a $2.1 billion plan to boost literacy scores, setting the goal of 75% of students achieving the minimum standard on EQAO by 2007 (Sorbara, 2004). Despite the overwhelming evidence against the eff iciency and effectiveness of the whole-language instruction method, Ontario went ahead to adopt a new whole-language curriculum in 2006.
Nevertheless, since the initiation of the government literacy initiative in 2004, EQAO has reported a steady increase in grade 3 reading scores: rising from 50% in 2003 to 74% in 2019. Based on these scores, it would appear the policies which were a part of this initiative including reducing class size, expanding early learning, and focusing on special education, have been effective in achieving the goal of 75% of students reaching the minimum literacy benchmark. While we strongly argue that 1 out of 4 students failing to learn to read well should be a cause for major concern on its own, we also fear that the true scale of the failure of Ontario’s approach to literacy education is far greater than reported.
Introduction

LIFTING THE CURTAIN ON EQAO SCORES
10
(PISA) (CMEC, 2019). Additionally, the achievement gap between high and low performing students, and the proportion of low performing students increased between 2009 and 2018. (CMEC, 2019).
Similar lack of progress is evident on the Progress in International Reading Literacy Study (PIRLS) assessment of Grade 4 students. The results of this assessment show that the average reading scores for Ontario students have shown a statistically significant decline since 2000 (CMEC, 2017). (Figure 1)
Introduction
Inconsistencies in reported reading scores
While EQAO reported Grade 3 and 6 reading scores have shown improvement, there has been no corresponding increase in achievement on the Ontario Secondary School Literacy Test (OSSLT) or on Ontario student’s performance on international assessments. For example, the Council for Ministers of Education Canada (CMEC) reported no significant change in the average reading score for Ontario students between 2000 and 2018 as reported on the Programme for International Student Assessment
Percentage of students meeting Grade 3 provincial reading standard as reported by EQAO vs. average score for Ontario Students on PIRLS (Grade 4 students) as reported by CMEC
0%
10%
20%
30%
40%
50%
60%
70%
80%
90%
100%
Figure 1
500
510
520
530
540
550
560
570
580
590
600
2001
2002
2003
2004
2005
2006
2007
2008
2009
2010
2011
2012
2013
2014
2015
2016
2017
2018
2019
EQAO Grade 3 PIRLS

LIFTING THE CURTAIN ON EQAO SCORES
11
The real question is: why is the trend in scores on international assessments different from the trend in the EQAO data? When asking this question, IDA Ontario became concerned by anecdotal stories about an increasing number of students passing the EQAO reading assessment without being required to demonstrate the ability to either read or write words independently.
Use of Assistive Technology (AT) and/or Scribing on EQAO
To receive this accommodation students are not required to have an identified exceptionality, and any student who is known to have difficulty with reading can be provided this accommodation at the discretion of the school. Assistive technology allows the students to listen to the text of the reading passages and questions. Scribing allows the students to have an adult (either a teacher or volunteer) read the questions out loud to the student and write down the students’ verbal responses.
Introduction
Ontario students can use assistive technology when completing the EQAO reading assessments.
Percentage of students meeting provincial standard on OSSLT as reported by EQAO vs. average score for Ontario Students on PISA (15 year old students) as reported by CMEC
0%
10%
20%
30%
40%
50%
60%
70%
80%
90%
100%
Figure 2
500
505
510
515
520
525
530
535
540
545
550
2001
2002
2003
2004
2005
2006
2007
2008
2009
2010
2011
2012
2013
2014
2015
2016
2017
2018
2019
OSSLT PISA
2000

LIFTING THE CURTAIN ON EQAO SCORES
12
AT and scribing are examples of valid and necessary accommodations that can help students who struggle with reading and writing access the curriculum and express their understanding of subject matter knowledge. For instance, providing a student who struggles with reading the use of AT and/or scribing on the EQAO math assessment can provide a more accurate reflection of the student’s math abilities. Without these accommodations, it would be difficult to determine if an unsuccessful student was struggling due to a weakness in math or their inability to read the questions. As the goal in this case is to assess math ability, the use of AT and/or scribing is a valid and necessary accommodation.
On the other hand, when AT and/or scribing are used on the EQAO reading assessment, the results do not provide all of the information necessary to assess the students’ ability to read and write independently or evaluate the effectiveness of
Understanding reading – The Simple View
the curriculum, teaching methods and educational policies related to literacy instruction. Without understanding the full extent and impact of this practice, it is not possible to have an informed public policy discussion about the effectiveness of the current approach to reading instruction.
Comprehension is the indisputable goal of reading, and the Simple View of Reading provides a useful framework for understanding the components of reading comprehension. This widely accepted model of reading describes reading comprehension (RC) as the product of two basic components: word-level decoding ability (the ability to identify the printed word) (D) and language comprehension ability (LC) (i.e. how well one understands spoken language) as shown in Figure 2 (Gough & Tunmer, 1986; Farrell et al., 2010; Wren, 2001).
Introduction
DECODING / WORD RECOGNITION
Ability to read individual words
D
ORAL LANGUAGE COMPREHENSION
Ability to understandspoken language
LC
READING COMPREHENSION
Ability to understandprinted text
RC
X =
LIFTING THE CURTAIN ON EQAO SCORES
13
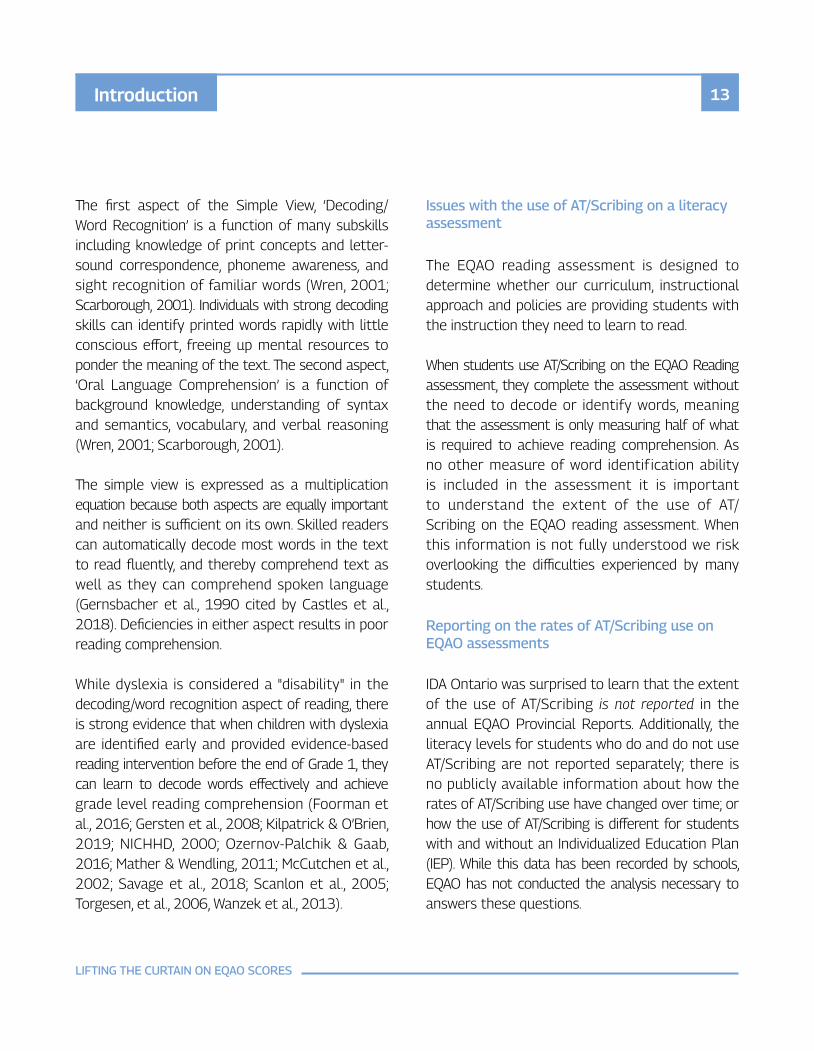
The first aspect of the Simple View, ‘Decoding/Word Recognition’ is a function of many subskills including knowledge of print concepts and letter-sound correspondence, phoneme awareness, and sight recognition of familiar words (Wren, 2001; Scarborough, 2001). Individuals with strong decoding skills can identify printed words rapidly with little conscious effort, freeing up mental resources to ponder the meaning of the text. The second aspect, ‘Oral Language Comprehension’ is a function of background knowledge, understanding of syntax and semantics, vocabulary, and verbal reasoning (Wren, 2001; Scarborough, 2001). The simple view is expressed as a multiplication equation because both aspects are equally important and neither is sufficient on its own. Skilled readers can automatically decode most words in the text to read fluently, and thereby comprehend text as well as they can comprehend spoken language (Gernsbacher et al., 1990 cited by Castles et al., 2018). Deficiencies in either aspect results in poor reading comprehension.
While dyslexia is considered a "disability" in the decoding/word recognition aspect of reading, there is strong evidence that when children with dyslexia are identified early and provided evidence-based reading intervention before the end of Grade 1, they can learn to decode words effectively and achieve grade level reading comprehension (Foorman et al., 2016; Gersten et al., 2008; Kilpatrick & O’Brien, 2019; NICHHD, 2000; Ozernov-Palchik & Gaab, 2016; Mather & Wendling, 2011; McCutchen et al., 2002; Savage et al., 2018; Scanlon et al., 2005; Torgesen, et al., 2006, Wanzek et al., 2013).
Issues with the use of AT/Scribing on a literacy assessment
The EQAO reading assessment is designed to determine whether our curriculum, instructional approach and policies are providing students with the instruction they need to learn to read.
When students use AT/Scribing on the EQAO Reading assessment, they complete the assessment without the need to decode or identify words, meaning that the assessment is only measuring half of what is required to achieve reading comprehension. As no other measure of word identif ication ability is included in the assessment it is important to understand the extent of the use of AT/Scribing on the EQAO reading assessment. When this information is not fully understood we risk overlooking the difficulties experienced by many students.
Reporting on the rates of AT/Scribing use on EQAO assessments
Introduction
IDA Ontario was surprised to learn that the extent of the use of AT/Scribing is not reported in the annual EQAO Provincial Reports. Additionally, the literacy levels for students who do and do not use AT/Scribing are not reported separately; there is no publicly available information about how the rates of AT/Scribing use have changed over time; or how the use of AT/Scribing is different for students with and without an Individualized Education Plan (IEP). While this data has been recorded by schools, EQAO has not conducted the analysis necessary to answers these questions.

LIFTING THE CURTAIN ON EQAO SCORES
14
IDA Ontario engaged the services of an EQAO-approved data partner to conduct this analysis. Data was requested from Grade 3 and Grade 6 reading assessments, and Grade 10 Ontario Secondary School Literacy Test (OSSLT) from 2005 to 2019.
Because we are concerned about equity issues, we asked that this data be compiled for all students, including those with special education needs. The analysis was also done separately for students identif ied as English Language Learners (ELL) and non-ELL. We are also very concerned about gender differences, especially given those noted in the EQAO 2019 report in both outcome and reading attitude measures (EQAO, 2019); however, our budget constraints did not allow us to carry out that analysis. Similarly, we are also concerned about the writing outcomes, but those were also beyond the scope of this project.
Introduction
This report provides results from Grade 3, Grade 6, and OSSLT (Grade 10) EQAO Reading assessments annually from 2005 to 2019, specifically:
◆ The rate of AT/Scribing use for all students, and for those with an IEP.
◆ The percentage of students who passed the test independently (unassisted) and those who passed using AT/Scribing (assisted).
◆ Participation rates.
◆ The percentage of students with an IEP and IPRC-LD.
◆ The pass rate for students who wrote the test using AT/Scribing.
◆ Discrepancy in the rates of special education support and formal learning disability (LD) identification for ELL and non-ELL students.
◆ The discrepancy between pass rates for ELL and non-ELL students.

LIFTING THE CURTAIN ON EQAO SCORES
15
Methodology
The EQAO literacy assessments are province-wide tests conducted annually involving all students in Grade 3, 6, and 10 (OSSLT).
The data used in this report was obtained from EQAO. Summary data of the provincial results for reading from the Grade 3, Grade 6, and OSSLT literacy assessments was obtained for 2005 to 2019, for English Language Learners (ELL) and non-ELL students separately.
EQAO reported a 97% participation rate in the reading assessment for Grade 3 and Grade 6 for each year from 2014/15-2018/19 (EQAO 2019).
OSSLT participation rates are reported separately for first time eligible students (93% in 2019) and previously eligible students (46 % in 2019). It should be noted that students must pass the OSSLT in order to graduate with a diploma. Students who are not successful can re-write the OSSLT in grade 11 or complete the Ontario Secondary School Literacy Course. Students who have an IEP can be allowed enroll directly in the literacy course and not participate in OSSLT at the discretion of the school principal.
For the Grade 3 and Grade 6 assessments, EQAO uses a four-level scale to report on student achievement. Level 3 is set as the provincial standard. Levels 1 and 2 are below the provincial standard, while Level 4 indicates achievement above the provincial standard (EQAO 2019).
Students with an Individual Education Plan (IEP) include students who have been formally identified by an Identif ication, Placement and Review Committee (IPRC), as well as students who have an IEP without formal IPRC identification. Students whose sole identified exceptionality was giftedness were not included in the count of or results for students with IEPs (EQAO 2019).
The number of students (and percentages) in various categories, and combinations of those categories, were tabulated:
◆ Students who used scribing, assistive technology, or both (assisted) vs not assisted.
◆ Students with and without special education needs (IEP vs no IEP).
◆ Students who achieved provincial standard for reading (i.e., Level 3 or 4).
These analyses were done for all students, and for ELL and non-ELL students separately for the Grade 3 and Grade 6 reading assessment and the Grade 10 OSSLT, for all years from 2005-2019. For 2015, due to labor issues in the public elementary schools, the EQAO results are incomplete. Hence, 2015 Grade 3 & Grade 6 data were not included in the analysis. In 2017, an online version of the OSSLT was piloted and a coding error occurred which caused students who participated in the online trial to be incorrectly recorded as having used AT/Scribing. For this reason, we removed 2017 from the OSSLT results.
LIFTING THE CURTAIN ON EQAO SCORES
16
Results and Discussion
Use of AT/Scribing over time
Appendix A includes graphs showing the percentage of students who are ELL / non-ELL and special education students by grade and year.
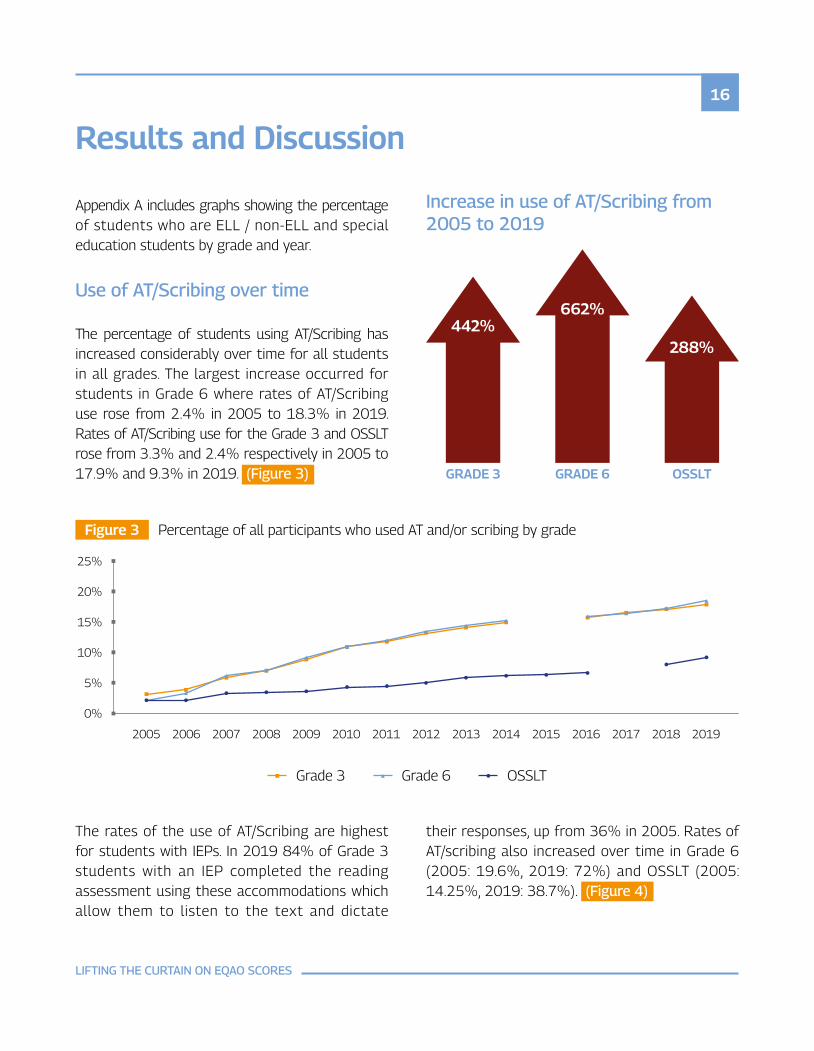
The percentage of students using AT/Scribing has increased considerably over time for all students in all grades. The largest increase occurred for students in Grade 6 where rates of AT/Scribing use rose from 2.4% in 2005 to 18.3% in 2019. Rates of AT/Scribing use for the Grade 3 and OSSLT rose from 3.3% and 2.4% respectively in 2005 to 17.9% and 9.3% in 2019. (Figure 3)
The rates of the use of AT/Scribing are highest for students with IEPs. In 2019 84% of Grade 3 students with an IEP completed the reading assessment using these accommodations which allow them to listen to the text and dictate
their responses, up from 36% in 2005. Rates of AT/scribing also increased over time in Grade 6 (2005: 19.6%, 2019: 72%) and OSSLT (2005: 14.25%, 2019: 38.7%). (Figure 4)
Increase in use of AT/Scribing from 2005 to 2019
GRADE 3 GRADE 6 OSSLT
442%662%
288%
Figure 3 Percentage of all participants who used AT and/or scribing by grade
0%
5%
10%
15%
20%
25%
2005 2006 2007 2008 2009 2010 2011 2012 2013 2014 2015 2016 2017 2018 2019
Grade 3 Grade 6 OSSLT

LIFTING THE CURTAIN ON EQAO SCORES
17Results and Discussion
While the rate of AT/Scribing use for students with IEPs has increased over time, this rate of increase (1.3 times) is substantially lower than the rate of increase (6 times) noted in the data for all students.
This can be partially explained by the increase in the percentage of students who have IEPs, as this group now forms a much larger percentage of the total student population. (Figure 5)
Percentage of participants with an IEP who used AT and/or scribing by grade
0%
10%
20%
30%
40%
50%
2005 2006 2007 2008 2009 2010 2011 2012 2013 2014 2015 2016 2017 2018 2019
60%
70%
80%
90%
100%
Figure 4
Grade 3 Grade 6 OSSLT
Percentage of students with an IEP by gradeFigure 5 Grade 3 Grade 6 OSSLT
0%
10%
20%
30%
2005 2006 2007 2008 2009 2010 2011 2012 2013 2014 2015 2016 2017 2018 2019

LIFTING THE CURTAIN ON EQAO SCORES
18
EQAO reading results Grade 3
Results and Discussion
When students who passed the reading assessment using AT/Scribing ("assisted") are separated from those who passed without using AT/Scribing ("unassisted"), we see that changes in reading achievement over time are significantly lower than the publicly reported results by EQAO across all assessments.
EQAO reported an increase in the percentage of Grade 3 students who meet the provincial standard from 59% in 2005 to 74% in 2019; however, our analysis shows that the percentage of students who met the standard unassisted was 56% in 2005 rising only slightly to 62% in 2019. (Figure 6)
Proportion of all Grade 3 students passing unassisted, passing assisted, not passing and not participating by year
0%
10%
20%
30%
40%
50%
2005 2006 2007 2008 2009 2010 2011 2012 2013 2014 2015 2016 2017 2018 2019
60%
70%
80%
90%
100%
Unassisted pass Assisted pass Level 2 or lower Didn’t participate
Figure 6

LIFTING THE CURTAIN ON EQAO SCORES
19
As noted earlier in the discussion of the simple view of reading (Figure 2) , reading comprehension is the product of word recognition / decoding ability and language comprehension. When looking at the 2019 results for Grade 3 students with an IEP, we see that only 8.5% demonstrated grade level competency in both aspects necessary for reading comprehension.
For students with IEPs (Figure 7) , the lack of improvement is even more pronounced. In 2019
Results and Discussion
The rate of participation for IEP students in Grades 3 and 6 has increased signif icantly as the use of accommodations has risen. In 2005, 33.8% of Grade 3 students with an IEP did not participate; in 2019 this rate had fallen to 9.5%. Increased inclusion may be the result of the increased availability of these accommodations.
only 8% of Grade 3 students with IEPs passed the assessment unassisted compared to 10% in 2005.
Proportion of Grade 3 students with IEPs passing unassisted, passing assisted, not passing and not participating by year
0%
10%
20%
30%
40%
50%
2005 2006 2007 2008 2009 2010 2011 2012 2013 2014 2015 2016 2017 2018 2019
60%
70%
80%
90%
100%
Unassisted pass Assisted pass Level 2 or lower Didn’t participate
Figure 7

LIFTING THE CURTAIN ON EQAO SCORES
20Results and Discussion
While word reading is not assessed when a student uses AT/Scribing to complete the assessment, the provision of these accommodations suggests that, in 2019, 85% of students with an IEP had some level of difficulty with this aspect of reading. For these students, the EQAO assessment only provides insight into the second component of reading, language comprehension ability. In 2019 only 47.7% of students with an IEP demonstrated that they likely have the language comprehension skills necessary for reading comprehension (unassisted pass: 8.5%, assisted pass: 39.2%). This raises serious concerns about the effectiveness of the
Grade 6
current curriculum and approach for teaching either aspect of reading.
The Grade 6 results show a trend similar to Grade 3 students. The use of AT/Scribing for all students has increased over time from 2.4% in 2005 to 18.3% in 2019 (Figure 3). For Grade 6 students, the unassisted pass rate has shown more improvement than it has for Grade 3 students, rising from 61.8% in 2005 to 72.23% in 2019. (Figure 8)
Proportion of all Grade 6 students passing unassisted, passing assisted, not passing and not participating by year
0%
10%
20%
30%
40%
50%
2005 2006 2007 2008 2009 2010 2011 2012 2013 2014 2015 2016 2017 2018 2019
60%
70%
80%
90%
100%
Unassisted pass Assisted pass Level 2 or lower Didn’t participate
Figure 8
LIFTING THE CURTAIN ON EQAO SCORES
21Results and Discussion
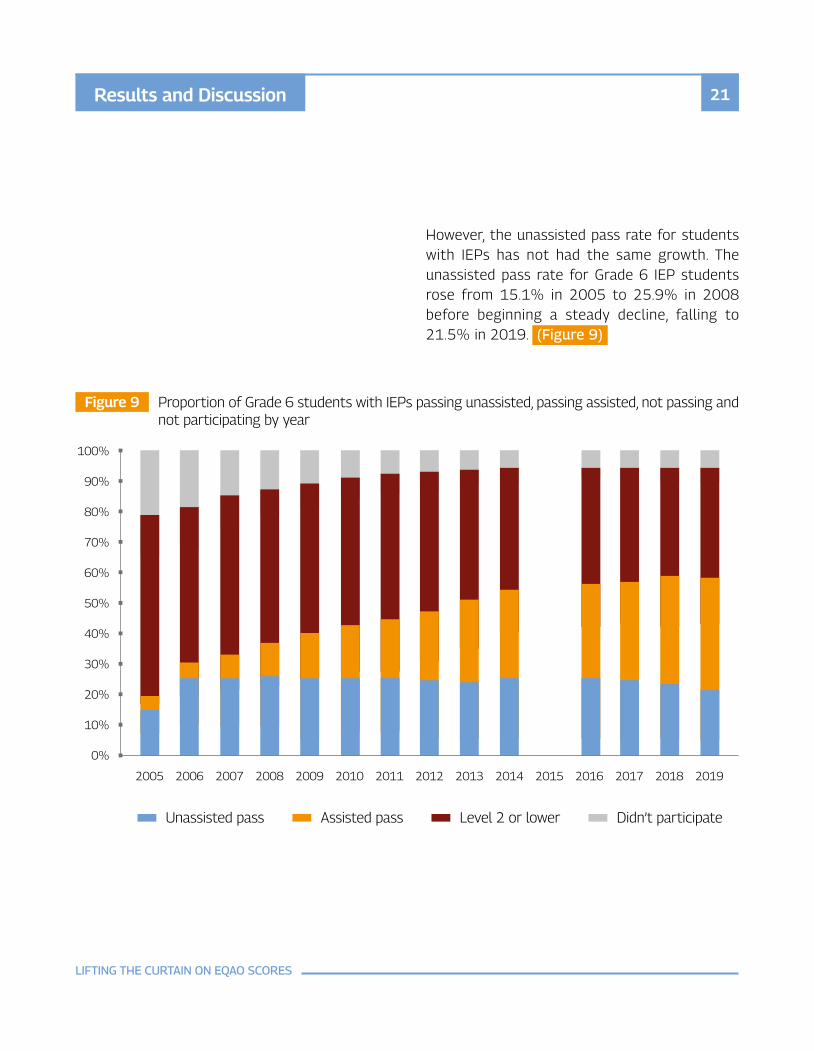
However, the unassisted pass rate for students with IEPs has not had the same growth. The unassisted pass rate for Grade 6 IEP students rose from 15.1% in 2005 to 25.9% in 2008 before beginning a steady decline, falling to 21.5% in 2019. (Figure 9)
Proportion of Grade 6 students with IEPs passing unassisted, passing assisted, not passing and not participating by year
0%
10%
20%
30%
40%
50%
2005 2006 2007 2008 2009 2010 2011 2012 2013 2014 2015 2016 2017 2018 2019
60%
70%
80%
90%
100%
Unassisted pass Assisted pass Level 2 or lower Didn’t participate
Figure 9

LIFTING THE CURTAIN ON EQAO SCORES
22
LIFTING THE CURTAIN ON EQAO SCORES
Results and Discussion
During the Ontario Human Rights Commission’s Right to Read Inquiry, many parents and students reported being streamed into programs working towards a certificate rather than a diploma (OHRC, 2020). It is often reported that these students had been placed on modified IEPs in elementary school and their reading ability was years below grade level when they entered high school.
As these students are placed in programs not working towards the OSSD, they are not considered “eligible students” and their lack of participation in the OSSLT has not been previously reported. The non-participation rate in our analysis includes all students who did not complete the OSSLT including students not working towards an OSSD, students who deferred the assessment to a later year, students who were eligible but were exempted by their school, and those who did not complete the assessment for any other reason.
OSSLT eligibility, participation, and results
EQAO publishes the OSSLT pass rate for "f irst time eligible" and "previously eligible" participants, although greater focus and media attention is typically given to the first-time eligible pass rates. EQAO defines first time eligible students as Grade 10 students who are working towards an Ontario Secondary School Diploma (OSSD). Students who are working towards the Ontario Secondary School Certificate (OSSC) are not considered eligible, and as such their literacy achievement is not reported by EQAO.
EQAO reports that the percent of successful first-time eligible students has been relatively stable over time at 82% in 2004 and 80% in 2019. (Figure 1)
The OSSC is awarded to students who receive a minimum of 14 credits before leaving school but who have not met the OSSD minimum requirement of 30 credits. Completion of the OSSD is an eligibility requirement for post-secondary education in Ontario.
In grade nine I was told that I could never get a high school diploma.
Viki
I had an IEP teacher tell me that I could not go to college.
Zora

LIFTING THE CURTAIN ON EQAO SCORES
23Results and Discussion
(65%) of eligible students who did not participate in the OSSLT did not apply to post-secondary education (Dion, 2013). Even less is known about the reading ability and future pathways of students who are not considered eligible.
Since 2005, the non-participation rate for the OSSLT has more than doubled, rising from 8.4% in 2005 to 19% in 2019 (Figure 10). While little data is available about the literacy rates of students who do not write the OSSLT, data from the Toronto District School Board indicated that the majority
Proportion of all OSSLT students passing unassisted, passing assisted, not passing and not participating by year
0%
10%
20%
30%
40%
50%
2005 2006 2007 2008 2009 2010 2011 2012 2013 2014 2015 2016 2017 2018 2019
60%
70%
80%
90%
100%
Unassisted pass Assisted pass Level 2 or lower Didn’t participate
Figure 10

LIFTING THE CURTAIN ON EQAO SCORES
24Results and Discussion
When looking at students with IEPs in 2019, 33.5% did not participate in the assessment and an additional 35.1% participated but failed.
Only 31.4% of students with an IEP passed the assessment in total, with close to one third passing using AT/scribing. (Figure 11)
Pass rate for students using AT/Scribing
In addition to looking at the rate of assistance (percentage of total students who used AT/Scribing), we also examined the assisted pass rate, which we define as the percentage of students who wrote the assessment using AT/Scribing and were successful.
While the percentage of students using assistance has increased for all grades over time (Figure 3), the assisted pass rate shows different trends for Grades 3 and 6 than it does for OSSLT. (Figure 12)
Proportion of all OSSLT students with IEP’s passing unassisted, passing assisted, not passing and not participating by year
0%
10%
20%
30%
40%
50%
2005 2006 2007 2008 2009 2010 2011 2012 2013 2014 2015 2016 2017 2018 2019
60%
70%
80%
90%
100%
Unassisted pass Assisted pass Level 2 or lower Didn’t participate
Figure 11

LIFTING THE CURTAIN ON EQAO SCORES
25Results and Discussion
The assisted pass rate for Grade 3 has risen from 28.3% in 2005 to 51.4% in 2019. We see a similar trend for Grade 6 students with the assisted pass rate increasing from 27.7% in 2005 to 52.8% in 2019. In contrast, the assisted pass rate for OSSLT has dropped significantly from 58% in 2005 to 38.7% in 2019.
Concerns about reliance on Assistive Technology
As noted, students who pass the assessment using AT/Scribing have demonstrated language comprehension ability that meets the grade level
standard set out by EQAO. Before students learn to read, language comprehension is developed through oral language. Early experiences such as the opportunity to engage in rich conversations, being read to regularly, and exposure to and participation in a variety of experiences in the wider world all contribute to early language comprehension.
However, once children transition from "learning to read" to "reading to learn", foundational components of language comprehension such as vocabulary and background knowledge begin to grow rapidly through reading.
Percentage of participants using AT/Scribing who achieved Level 3 or 4 by year
0%
10%
20%
30%
40%
50%
2005 2006 2007 2008 2009 2010 2011 2012 2013 2014 2015 2016 2017 2018 2019
60%
70%
80%
90%
100%
Figure 12
Grade 3 Grade 6 OSSLT

LIFTING THE CURTAIN ON EQAO SCORES
26
When students are not able to decode words efficiently, they are unlikely to access the same volume of written material as their peers who are proficient readers. This slows down the growth of vocabulary and background knowledge and can impair language comprehension over time. What starts out as an issue with decoding quickly evolves into an issue with both aspects of the simple view of reading (Stanovich, 1986).
IDA Ontario routinely speaks with parents of students who are struggling with word identification / decoding and are being offered assistive technology in place of systematic decoding instruction. These parents report being advised that AT can allow their child to access the curriculum and fully participate in school. However, in 2019, only 38.7% of students who use AT/Scribing were successful on OSSLT; this approach is not delivering on its promise of providing equity in education. Additionally, individuals who rely on AT experience challenges outside of school with everyday tasks like reading a menu, filling out a form at the doctor’s office or completing the test required to receive a driver’s license. We often hear from parents of young adults who report that navigating the world with word reading difficulties has had a significant negative impact on the mental health of their children. These individual stories are heartbreaking and supported by extensive population level data that clearly show individuals who have reading difficulties experience higher rates of anxiety, poor self-esteem, and depression (Canadian Council on Learning, 2009; Alexander-Passe, 2006; Boyes et al., 2016).
Given the overwhelming evidence that reading difficulties can be prevented (Foorman et al., 2016;
Gersten et al., 2008; Kilpatrick & O’Brien, 2019; NICHHD, 2000; Ozernov-Palchik & Gaab, 2016; Mather & Wendling, 2011; McCutchen et al., 2002; Savage et al., 2018; Scanlon et al., 2005; Torgesen, et al., 2006, Wanzek et al., 2013), the provision of assistive technology in place of effective instruction and intervention raises serious ethical issues which must be addressed.
Rates and trends in identification of Learning Disabilities in Ontario
Dyslexia is the most prevalent learning disability affecting almost 80% of the students with learning disabilities (Fletcher et al., 2007; Cortiella & Horowitz, 2014). Dyslexia is neuro-biological in origin; functional and structural differences are found in parts of the brain used for reading in people with dyslexia as compared to typical readers. These differences have been identified in young children before they enter kindergarten (Kearns et al., 2019; Norton et al, 2015; Ozernov-Palchik et al., 2016).
While dyslexia is considered a „disability” in the decoding aspect of reading, there is strong evidence that when children with dyslexia are identified early and provided evidence-based reading intervention before the end of Grade 1, they can learn to decode words effectively and achieve grade level reading comprehension (Foorman et al., 2016; Gersten et al., 2008; Kilpatrick & O’Brien, 2019; NICHHD, 2000; Ozernov-Palchik & Gaab, 2016; Mather & Wendling, 2011; McCutchen et al., 2002; Savage et al., 2018; Scanlon et al., 2005; Torgesen, et al., 2006, Wanzek et al., 2013). For this reason, early identification of dyslexia is imperative to student success.
Results and Discussion

LIFTING THE CURTAIN ON EQAO SCORES
27
In Ontario, students with dyslexia are identif ied through an Identification, Placement and Review Committee (IPRC) and provided with a designation of Learning Disability (IPRC-LD). The EQAO dataset
Timing of Learning Disability identification
The percentage of high school students with an IPRC-LD designation has been relatively stable over the years of study with an average of 8.3%. Every student identified with a learning disability
Results and Discussion
provides some insight into the prevalence of IPRC designations at the time of the EQAO assessments (Figure 13)
in high school had a learning disability on the day they entered kindergarten, however, on average only 1.5% of Grade 3 students and 5.1% of Grade 6 students were identified between 2005 and 2019.
Percentage of students with an IPRC-LD designation at the time of the EQAO assessment
0%
1%
2%
3%
4%
5%
2005 2006 2007 2008 2009 2010 2011 2012 2013 2014 2015 2016 2017 2018 2019
6%
7%
8%
9%
10%
Figure 13
Grade 3 Grade 6 Grade 10

LIFTING THE CURTAIN ON EQAO SCORES
28Results and Discussion
More concerning is the trend of delayed identification. As noted earlier, the Grade 10 IPRC-LD rate has been relatively stable overtime with a low of 7.8% in 2005 and a high of 9.1% in 2013. In contrast, the proportion of students with an IPRC-LD in Grade 3 and Grade 6 have been in steady decline since 2005. For Grade 3 students the proportion of students with an IPRC-LD identification was 2.5% in 2005; this fell to 0.9% in 2019.
During the Right to Read Inquiry public meetings, one barrier to identification mentioned by many parents was the inability to access a psycho-educational assessment through the school system. This type of assessment is required before a student can receive a formal identification of Learning Disability. A report by People for Education (2017) found that 64% of elementary and 55% of secondary schools reported set limits on the number of students who could be assessed each year. Due to lack of availability of assessment through school, many parents report being advised to pay for an assessment through a private psychologist, typically at a cost of between $2000 – $4000. IDA Ontario is very concerned about the issues of equity that this presents, however due to the lack of data collection the impact of socio-economic status on LD identification could not be included in this study.
Another barrier identified during the OHRC inquiry was the impact of common misperceptions about the impact of multilingualism on reading acquisition. Concerns were raised that reading challenges faced by students who are classified as English Language Learners (ELL) are often solely attributed to difficulties in the language comprehension aspect of reading, with little to no assessment of the underlying processes that result in difficulties with decoding (dyslexia). Additionally, many schools continue to have policies in place which delay assessments for ELL students until after they have had sufficient time to learn English, often 5 to 7 years (Geva, 2014). EQAO does collect data on English language status, so we were able to analyze the impact of ELL status on identification of LD and student achievement.
Why early identification of Dyslexia is imperative to reading success
Through early identif ication and intervention, it is possible to prevent reading failure and the subsequent consequences of failure to learn to read: poor academic performance, low self-esteem, behavioral issues, and other mental health problems. Additionally, the impact of decoding impairment on a child’s volume of reading experience and vocabulary development – key components of the second aspect of the simple view of reading, language comprehension, can also be avoided (Stanovich, 1986).
Early, intensive intervention is critical – it is more effective, it is easier to close the gap, it is less expensive, and the impacts on language comprehension, other academic outcomes, and mental health can be avoided (Lovett et al 2017, Hougen, 2014; Kamil et al., 2008; Moats 2004, Al Otaiba & Torgesen, 2007). Therefore, the trend towards delayed identif ication of students with learning disabilities is of great concern.
Barriers to identification

LIFTING THE CURTAIN ON EQAO SCORES
29Results and Discussion
Rates of IPCR-LD identification of ELL students
among high school students. Between 2005 and 2019, there were on average 10 non-ELL students identified with a learning disability for every ELL student identified. (Figure 14)
While ELL and non-ELL students are equally likely to have learning disabilities, significantly fewer ELL students in Ontario had an IPRC-LD compared to non-ELL students. The disparity is most shocking
Special education identification and support by language status for grade 10 students in 2019
PERCENTAGE OF NON-ELL STUDENTS
WHO HAD AN IEP
30%
PERCENTAGE OF ELL STUDENTS WHO
HAD AN IEP
8%
PERCENTAGE OF NON-ELL STUDENTS
WHO HAD AN IPRC-LD
8%
PERCENTAGE OF ELL STUDENTS WHO
HAD AN IPRC-LD
1%

LIFTING THE CURTAIN ON EQAO SCORES
30Results and Discussion
Rates of IPRC-LD identification for ELL vs Non ELLFigure 14
0%
2%
4%
6%
8%
10%
2005 2006 2007 2008 2009 2010 2011 2012 2013 2014 2015 2016 2017 2018 2019
Non ELL ELLGRADE 3
0%
2%
4%
6%
8%
10%
2005 2006 2007 2008 2009 2010 2011 2012 2013 2014 2015 2016 2017 2018 2019
Non ELL ELLGRADE 6
0%
2%
4%
6%
8%
10%
2005 2006 2007 2008 2009 2010 2011 2012 2013 2014 2015 2016 2017 2018 2019
Non ELL ELLOSSLT

LIFTING THE CURTAIN ON EQAO SCORES
31Results and Discussion
Achievement gap between ELL and non-ELL students
While ELL students face additional barriers to literacy achievement, evidence shows that with effective curriculum and timely intervention these students can learn to read as well as their non-ELL peers. For example, in the early 2000’s, Lesaux & Siegel studied the impact of early screening and intervention on the reading outcomes of a cohort of students in North Vancouver. All students in the study were screened upon entry to kindergarten for risk factors associated with reading difficulties and all students found to be at risk were provided early intervention. While more ELL students than
non-ELL students were initially identified with risk factors for reading difficulties (37.2% vs 23.8%), the provision of early intervention closed the achievement gap. By the end of grade two, ELL students slightly outperformed their non-ELL counterparts with 96.3% of ELL students and 95.8% of non-ELL students reading at benchmark (Lesaux & Siegel, 2003).
While this evidence shows us that ELL students have the same potential to achieve as non – ELL students, the Ontario EQAO data shows that a signif icant achievement gap currently exists between ELL and non-ELL students, particularly in the OSSLT assessment.
Achievement Gap: ELL vs Non ELL Students in 2019
0%
20%
40%
60%
80%
100%
Unassisted passAssisted passLevel 2 or lowerDidn’t participate
Figure 15
10%
30%
50%
70%
90%
GRADE 3ELL Non-ELL
GRADE 6ELL Non-ELL
OSSLTELL Non-ELL
4.1% 2.1%27.4% 26.1%13.1% 8.2%55.5% 63.6%
3.7% 1.6%23.5% 15.5%10.4% 9.4%62.4% 73.6%
34.6% 17.4%28.5% 21.7%0.6% 3.1%
36.3% 57.7%

LIFTING THE CURTAIN ON EQAO SCORES
32
Recommendations
1 Adopt evidence-based curriculum, instruction, and policies
Ontario can and must do a better job of ensuring that all students receive the instruction they need to learn to read well. Learning to read is a human right and ensuring that every Ontario student can realize that right is vitally important not only to the wellbeing of the individual, but also to the future economic competitiveness of Ontario.
As a part of the Right to Read Inquiry, the Ontario Human Rights Commission has identif ied f ive benchmarks of an effective systematic approach to teaching all students to read. The first of these is the use of evidence-based curriculum and teaching methods. Ontario continues to use the outdated 2006 whole-language literacy curriculum that mandates the three-cueing approach to teaching word reading (Ministry of Ontario, 2006). Overwhelming scientific-evidence clearly indicates that skilled readers do not use the three cuing strategies to read. Furthermore, several researchers have raised concerns that teaching these strategies can harm the most vulnerable students (Tunmer et al., 2002; Kilpatrick, 2015; Hempenstall, 2017; Schwarz, 2019; Seidenberg, 2017).
As three-cueing is at the heart of the reading curriculum, teachers continue to be taught this approach in university. The resources and approaches used in our classrooms, such as leveled
While some school boards do offer limited access to evidence-based intervention programs, it is typically too little and too late. The large number of students struggling because of poor initial classroom instruction, coupled with the intensity of the intervention required to replace the ineffective habits of cueing with effective decoding skills in older students, has overwhelmed special education resources. This has resulted in deep inequity in reading outcomes and a high degree of conflict between families and schools. Neither the cause nor the solution to this problem lies within special education, this is a general education problem that will only be solved through curriculum reform.
books and guided reading groups, are designed to promote the use of these word guessing strategies. Additionally, many reading intervention programs that teach the three-cueing strategies, like Reading Recovery and Levelled Literacy Intervention (LLI), continue to be used across Ontario.
The three-cueing system is the way poor readers read… And if teachers use the cueing system to teach reading, they’re not just teaching children the habits of
poor readers, they are actually impeding the orthographic mapping process…
three cueing can actually prevent the critical learning that’s necessary for a
child to become a skilled reader.
Dr David KilpatrickAt a Loss for Words 2019

LIFTING THE CURTAIN ON EQAO SCORES
33Recommendations
We call upon the Ontario government to immediately begin development of a new evidence-based curriculum based on structured literacy instruction. The curriculum should outline specific and measurable developmentally appropriate expectations for all the foundational skills of reading, writing, and spelling. Additionally, all elementary school and special education teachers should be trained in evidence-based, systematic and explicit instruction in reading and writing (structured literacy).
2 Provide greater transparency in EQAO reporting
To fulfill its mission of supporting accountability and continuous improvement of Ontario’s publicly funded school system, EQAO must have greater transparency when reporting results.
We call upon EQAO to publish the following information annually in addition to current measures:
◆ The percentage of all students who met the provincial standard independently – without the use of AT/Scribing (unassisted).
◆ The percentage of students who met provincial standard while using AT/Scribing (assisted).
◆ The percentage of participants who used AT/Scribing.
◆ The percentage of participants who used AT/Scribing and were successful (assisted pass rate).
◆ OSSLT results for all students rather than focusing attention on the results of the highest performing subset of students the "First Time Eligible participants".
◆ The percentage of grade 10 students not considered eligible for writing the OSSLT.
◆ A breakdown of all provincial, and board level results by demographic groupings including gender, race, ELL status and socio-economic status to provide a greater understanding of issues of equity in education.
3 Improve equity by implementing a baseline assessment upon kindergarten entry
One of the long-standing criticisms of EQAO is that the results are used to rank schools by student achievement without accounting for external factors that impact student performance. This has led to schools in affluent areas consistently outperforming schools in less affluent areas (Alphonso and Grant, 2013). This also undervalues the impacts of highly effective school teams who work with a higher portion of at-risk students. Measuring student progress, rather than simply reporting the number of children who reach an arbitrary minimum target at a specific point in time, would provide a more equitable measure of the effectiveness of schools.
Implementing a standard baseline screening assessment upon kindergarten entry would provide context to better understand future assessment

LIFTING THE CURTAIN ON EQAO SCORES
34Recommendations
results. After a trial that began in 2018, England implemented the national Reception Baseline Assessment in 2021 (Standards and Testing Agency, 2021). This 20-minute assessment performed by classroom teachers provides information about the language, communication, literacy and math abilities of students upon school entry. The results of the baseline assessment are not reported numerically for each student or published publicly at the school level. Instead, teachers are given narrative statements about the student’s strengths and needs to inform early instruction and the scores will be use in future to provide context for the individual student results on standard assessments. The aggregate measure of progress will be used in place of the average score in future school level reporting (Standards and Testing Agency, 2021).
We call upon the province and EQAO to implement universal early screening to identify the risk factors for reading difficulties present upon school entry. This information should be used by school teams to inform early instruction and intervention, and on a system level to provide a measure student growth to be used as a more equitable measurement of the effectiveness of school teams.
4 Implement a standard assessment of decoding ability at the end of Grade One
independently. However, given the nature of the test, it is difficult to know if these students were unsuccessful due to challenges with decoding or language comprehension or both.
Given that dyslexia (problems with decoding/word recognition) is the most prominent learning disability, one solution to both of these issues, which has been found to be practical and effective in England and more recently in Australia, is the introduction of a short standard assessment of decoding ability at the end of Grade 1, referred to as "The Phonics Screening Check". This one-on-one assessment conducted by a teacher takes between five and seven minutes per child. The student is asked to read 20 real words and 20 made up words that are presented as monster names like "osk" or "vap" (Standards and Testing Agency, 2017). These non-words are included to ensure that the student can use knowledge of letter sounds and spelling conventions to decode unfamiliar words. England implemented the Phonics Check nationally in 2012. Schools there are required to provide a phonics-based intervention to all students who are not successful on this assessment and these students are then re-assessed at the end of Grade 2. In the first year of the assessment, only 58% of students met the standard, sparking increased focus on instruction in the foundational skills necessary for decoding. This led to rapid improvement in decoding instruction and by 2019, 82% of students were successful at the end of Year 1, with 91% successful by the end of Year 2 (Department of Education, 2019).
The EQAO Grade 3 reading assessment occurs after the optimal window for reading intervention has closed. We know that 38% of students in 2019 did not meet the Grade 3 reading standard

LIFTING THE CURTAIN ON EQAO SCORES
35
The 2016 PIRLS assessment was the f irst international study that included students who participated in the Phonics Check. Unlike Ontario, England saw statistically signif icant growth in reading results across all achievement levels (Figure 16). While England saw improvements in all
Recommendations
achievement levels, the growth in the average score was fueled by a large increase in the average score of the lowest performing students. Performance on the Phonics Check was found to predict student performance on PIRLs (McGrane et al., 2017).
Seeing the success of England, Australia has made an online version of England’s phonics screening check available to all schools nationally. South Australia and New South Wales have made participation in the screening check mandatory for all schools (Baker, 2020). Introduction of this assessment was initially controversial and deemed unnecessary by many teachers who believed that it would not provide any new information. Parents also raised concerns that it would be stressful for children. However, after a trial period, public opinion shifted as children generally enjoyed the
assessment and teachers found that the results uncovered decoding issues that had been previously undetected (Buckingham and Wheldall, 2018).
We call upon the Ontario government and EQAO to implement a short standard assessment of decoding ability at the end of Grade One, similar to England’s Phonics Screening Check. This would provide useful and timely information to parents and teachers, while also providing a more proximal measure of the success of the kindergarten and Grade 1 literacy programs.
Changes in PIRLS benchmark attainment in between 2006 and 2016 in Ontario and England
Figure 16
ONTARIO
-16%
STUDENTS ACHIEVING THE HIGHEST BENCHMARK
STUDENTS ACHIEVING THE INTERMEDIATE BENCHMARK
STUDENTS NOT MEETING THE LOWEST BENCHMARK
ENGLAND
+33%
Change 2006-2016 Change 2006-2016 Change 2006-2016
ONTARIO
-5%
ENGLAND
+10%
ONTARIO
+100%
ENGLAND
-57.14%
LIFTING THE CURTAIN ON EQAO SCORES
36Recommendations
Conclusion
EQAO plays an important role in ensuring equity and accountability in education in Ontario. When the findings of the Right to Read Inquiry are released, we anticipate that the province will need to respond by initiating changes to reading instruction and assessment. This report has highlighted some key data already available through EQAO, and other data that should be collected and analyzed going forward.
EQAO must evolve to become a more effective watchdog and expand its scope to provide some of the additional information necessary to better inform changes in classroom instruction, screening and assessment, and effective reading interventions, so that the devastating outcomes associated with illiteracy can be avoided and to improve equity for both students and educators.

LIFTING THE CURTAIN ON EQAO SCORES
37
References
◆ Alexander-Passe, N. 2006. How dyslexic teenagers cope: an investigation of self-esteem, coping and depression. Dyslexia. 12(4):256-275.
◆ Alphonso, C. & Grant, T., 2013. A tale of two schools: The correlation between income and education in Toronto. Available: https://www.theglobeandmail.com/news/national/time-to-lead/a-tale-of-two-schools-the-correlation-between-income-and-education/article15463950/
◆ Baker, J., 2020. One in three schools agree to phonics reading check as critics sound alarm. Available: https://www.smh.com.au/education/one-in-three-schools-agree-to-phonics-reading-check-as-critics-sound-alarm-20200731-p55heb.html
◆ Boyes, M.E., Leitao, S., Claessen, M., Badcock, N.A. and Nayton, M., 2016. Why are reading difficulties associated with mental health problems?. Dyslexia, 22(3): 263-266.
◆ Brochu, P., K. O’Grady, T. Scerbina, Y. Tao. 2018. C PIRLS/ePIRLS 2016. Canada in Context. Canadian Results from the Progress in International Reading Literacy Study. Council of Ministers of Education, Canada. Viewed 10 April 2021 https://www.cmec.ca/Publications/Lists/Publications/Attachments/385/PIRLS2016-Report-EN.pdf
◆ Buckingham, J. and Wheldall, K., 2018. South Australia’s trial of England’s year one phonics check: why we need it. Available: https://theconversation.com/south-australias-trial-of-englands-year-one-phonics-check-shows-why-we-need-it-94411
◆ Califano, J., 2000. Substance Abuse and Learning Disabilities: Peas in a Pod or Apples and Oranges. The National Center on Addiction and Substance Abuse at Columbia University.
◆ Canadian Association of Chiefs of Police. 2009. Literacy and Policing in Canada: Target Crime with Literacy. Viewed 10 April 2021 http://en.copian.ca/library/research/police/factsheets/factsheets.pdf
◆ Canadian Council on Learning. 2009. A barrier to learning: Mental health disorders among Canadian youth. Viewed 10 April 2021 http://en.copian.ca/library/research/ccl/lessons_learning/barrier_to_learning/barrier_to_learning.pdf
◆ Castles, A., Rastle, K. and Nation, K., 2018. Ending the reading wars: Reading acquisition from novice to expert. Psychological Science in the Public Interest, 19(1), 5-51.
◆ Cortiella, C. & S.H. Horowitz. 2014. The State of Learning Disabilities. Facts, Trends and Emerging Issues. New York: National Center for Learning Disabilities.

LIFTING THE CURTAIN ON EQAO SCORES
38
◆ Crawford, C. 2002. Learning disabilities in Canada: economic costs to individuals, families and society. Prepared for the Learning Disabilities Association of Canada by The Roeher Institute.
◆ Council for Ministers of Education Canada. 2018. Measuring up: Canadian Results of the OECD PISA 2018 Study. The Performance of Canadian 15-Year-Olds in Reading, Mathematics, and Science Viewed 10 April 2021 https://cmec.ca/Publications/Lists/Publications/Attachments/396/PISA2018_PublicReport_EN.pdf
◆ Department of Education. 2019. Phonics screening check and key stage 1 assessments in England, 2019. Viewed 13 April 2021. Available: https://assets.publishing.service.gov.uk/government/uploads/system/uploads/attachment_data/file/851296/Phonics_screening_check_and_key_stage_1_assessments_in_England_2019.pdf
◆ Dion, N., & Maldonado, V. (2013). Making the Grade? Troubling Trends in Postsecondary Student Literacy. Toronto: Higher Education Quality Council of Ontario.
◆ EAB Global, Inc. 2019. Narrowing the Third-Grade Reading Gap: Embracing the science of reading, Washington, DC. Viewed 10 April 2021, https://attachment.eab.com/wp-content/uploads/2019/04/34B856A619F64FD3B8C6CEFD70C77B34-1.pdf
◆ Education Quality and Accountability Office (EQAO). 2019. Ontario Student Achievement 2018-2019. EQAO’s Provincial Elementary School Report. English-Language Students. ISBN: 978-1-4868-3743-4 (PDF).
◆ Education Quality and Accountability Office (EQAO). 2019. Ontario Student Achievement 2018-2019. EQAO’s Provincial Secondary School Report. English-Language Students. ISBN: 978-1-4868-3745-8 (PDF)
◆ Farrell, L., Davidson, M., Hunter, M., and Osenga, T. 2010. The Simple View of Reading. The Center for Development and Learning Blog. Viewed 10 April 2021 http://www.cdl.org/articles/thesimple-view-of-reading/
◆ Fletcher, J.M., Lyon, G.R., Fuchs, L.S. and Barnes, M.A., 2018. Learning disabilities: From identification to intervention. Guilford Publications.
◆ Foorman, B., Beyler, N., Borradaile, K., Coyne, M., Denton, C. A., Dimino, J., Furgeson, J., Hayes, L., Henke, J., Justice, L., Keating, B., Lewis, W., Sattar, S., Streke, A., Wagner, R., & Wissel, S. 2016. Foundational Skills to Support Reading for Understanding in Kindergarten through 3rd Grade. Washington, DC: National Center for Education Evaluation and Regional Assistance (NCEE), Institute of Education Sciences, U.S. Department of Education.
References

LIFTING THE CURTAIN ON EQAO SCORES
39
◆ Gernsbacher, M.A., Varner, K.R., Faust, M.E. 1990. Investigating differences in general comprehension skill. Journal of Experimental Psychology: Learning, Memory and Cognition. 16:430-445.
◆ Gersten, R. Compton, D., Connor, C.M., Dimino, J., Santoro, L., Linan-Thompson, S., Tilly, W.D. 2008. Assisting Students Struggling with Reading: Response to Intervention (RtI) and Multi Tier Intervention in the Primary Grades. National Center for Education Evaluation and Regional Assistance, Institute of Education Sciences, U.S. Department of Education. Viewed 10 April 2021 http://ies.ed.gov/ncee/wwc/publications/practiceguides/
◆ Geva, E. and Herbert, K., 2012. Assessment and interventions for English language learners with learning disabilities. Learning about learning disabilities, pp.271-298.
◆ Gough, P.B. and Tunmer, W.E., 1986. Decoding, reading, and reading disability. Remedial and special education, 7(1):6-10.
◆ Hempenstall, K., 2017. The three-cueing system in reading: Will it ever go away? National Institution for Direct Instruction Blog, 29.
◆ Heisz, A., G. Notten & J. Situ. 2016. The association between skills and low income. Insights on Canadian Society, Statistics Canada. Catalogue no. 75-006-X.
◆ Kearns, D.M., Hancock, R., Hoeft, F., Pugh, K.R. and S.J. Frost. 2019. The neurobiology of dyslexia. Teaching Exceptional Children. 51 (3):175-188.
◆ Kilpatrick, D.A. & S. O’Brien. 2019. Effective prevention and intervention for word-level reading difficulties. In Reading Development and Difficulties. Eds. D.A. Kilpatrick, R.M. Joshi, & R.K. Wagner. . Springer Nature Switzerland.
◆ Lerner, J.W. 1989. Educational interventions in learning disabilities. Journal of American Academy of Child and Adolescent Psychiatry. 28(3):326-331.
◆ Lovett, M. et. al. 2017. Early intervention for children at risk for reading disabilities: The impact of grade at intervention and individual differences on intervention outcomes. J Educ Psych. 109(7):889-914.
◆ Macdonald, S.J., Deacon, L. and Merchant, J., 2016. ‘Too Far Gone’: Dyslexia, Homelessness and Pathways into Drug Use and Drug Dependency. Insights on Learning Disabilities, 13(2): 117-134.
◆ Mather, N. & Wendling, B.J. 2011. Essentials of Dyslexia Assessment and Intervention. USA: John Wiley & Sons.
References

LIFTING THE CURTAIN ON EQAO SCORES
40
◆ McCloy, U. & DeClou, L. 2013. Disability in Ontario: Postsecondary education participation rates, student experience and labour market outcomes. Higher Education Quality Council of Ontario. Issue Paper No. 14, Feb. 21, 2013.
◆ McCutchen, D., Abbott, R.D., Green, L.B., Beretvas, S.N., Cox, S., Potter, N.S., Quiroga, T., Gray, A.L. 2002. Beginning literacy: links among teacher knowledge, teacher practice, and student learning. Journal of Learning Disabilities. 35(1): 69-86.
◆ McGrane, J., Stiff, J., Baird, J.A., Lenkeit, J. and Hopfenbeck, T., 2017. Progress in international reading literacy study (PIRLS): National report for England. Department for Education.
◆ Ministry of Ontario. 2006. The Ontario Curriculum. Grades 1-8. Available at: https://www.idaontario.com/wp-content/uploads/2019/09/language18currb.pdf%3E
◆ Moats, L.C., 2020. Teaching Reading” Is” Rocket Science: What Expert Teachers of Reading Should Know and Be Able to Do. American Educator, 44(2):4.
◆ National Institute of Child Health and Human Development (U.S.). 2000. Report of the National Reading Panel: Teaching Children to Read: an Evidence-Based Assessment of the Scientific Research Literature on Reading and Its Implications for Reading Instruction: Reports of the Subgroups. [Washington, D.C.]: National Institutes of Health.
◆ Horowitz, S.H., Rawe, J. and Whittaker, M.C., 2017. The state of learning disabilities: Understanding the 1 in 5. New York, NY: National Center for Learning Disabilities.
◆ Norton, E.S., Beach, S.D. and Gabrieli, J.D., 2015. Neurobiology of dyslexia. Current opinion in neurobiology, 30: 73-78.
◆ O’Grady, K. et al. 2019. Measuring Up. Canadian Results of the OECD PISA 2018 Study. The Performance of Canadian 15-Year-Olds in Reading, Mathematics, and Science. Council of Ministers of Education, Canada.
◆ Organization for Economic Co-operation and Development & Statistics Canada (OECD). 2000. Literacy in the Information Age. Final Report of the International Adult Literacy Survey. OECD, Paris & the Ministry of Industry, Canada.
◆ Ozernov‐Palchik, O. and Gaab, N., 2016. Tackling the ‘dyslexia paradox’: reading brain and behavior for early markers of developmental dyslexia. Wiley Interdisciplinary Reviews: Cognitive Science, 7(2): 156-176.
References

LIFTING THE CURTAIN ON EQAO SCORES
41
◆ People for Education. 2017. Competing Priorities (Annual Report on Ontario’s Publicly Funded Schools 2017). Toronto, ON: People for Education. Available: https://peopleforeducation.ca/wp-content/uploads/2017/08/P4E-annual-report-2017.pdf
◆ Quinn, M.M., Rutherford, R.B., Leone, P.E., Osher, D.M. and Poirier, J.M., 2005. Youth with disabilities in juvenile corrections: A national survey. Exceptional children, 71(3): 339-345.
◆ Rose, J. 2006. Independent Review of the Teaching of Early Reading : Final Report (The Rose Review). Department for Education and Skills (DfES).
◆ Rowe, K. 2005. National Inquiry into the Teaching of Literacy (Australia): Teaching Reading: Report and Recommendations. Department of Education, Science and Training.
◆ Savage, R., Georgiou, G., Parrila, R., & Maiorino, K. 2018. Preventative reading interventions teaching direct mapping of graphemes in texts and set-for-variability aid at-risk learners. Scientific Studies of Reading. 22(3):225-247.
◆ Scanlon, D. M., Vellutino, F. R., Small, S. G., Fanuele, D. P., & Sweeney, J. M. 2005. Severe reading difficulties—Can they be prevented? A comparison of prevention and intervention approaches. Exceptionality, 13(4), 209-227.
◆ Scarborough, H.S. 2001. A discussion of evidence, theory, and practice connecting early language and literacy to later reading disabilities. In Newman, S.B. & D.K. Dickinson (Eds.), Handbook of early literacy research. P. 98. Guilford Press, New York, NY.
◆ Sorbara, G. 2004. 2004. Ontario Budget: The Plan for Change (Budget Speech). Queens Printer for Ontario. ISBN 0-7794-6235-1
◆ Standards and Testing Agency, 2021. Guidance Reception baseline assessment. Available: https://www.gov.uk/guidance/reception-baseline-assessment
◆ Standards & Testing Agency. 2017. Assessment framework for the development of the Year 1 phonics screening check. Viewed 13 April 2021. Available: https://assets.publishing.service.gov.uk/government/uploads/system/uploads/attachment_data/file/628842/Y1_Phonics_assessment_framework_PDFA_V3.pdf
◆ Stanovich, K.E. 1986. Matthew effects in reading: Some consequences of individual differences in the acquisition of literacy. Reading Research Quarterly. 21:360-407.
◆ Stanovich, K. E. 2000. Progress in understanding reading: Scientific foundations and new frontiers. New York: Guilford Press.
References

LIFTING THE CURTAIN ON EQAO SCORES
42
◆ Statistics Canada. 2013. Skills in Canada: First Results from the Programme for the International Assessment of Adult Competencies (PIAAC). ISBN 978-1-100-22678-1 (PDF).
◆ Torgesen, J.K. 2006. Recent Discoveries from Research on Remedial Interventions for Children with Dyslexia. In M. Snowling and C. Hulme (Eds.). The Science of Reading: A Handbook. Oxford: Blackwell Publishers. P. 521-537.
◆ Wanzek, J. & Vaughn, S. 2007. Research-based implications from extensive early reading interventions. School Psychology Review. 36:541-461.
◆ Weingarten, H. P. & Hicks, M. 2018. On Test: Skills. Summary of Findings from HEQCO’s Skills Assessment Pilot Studies. Toronto: Higher Education Quality Council of Ontario. Available: https://heqco.ca/pub/on-test-skills-summary-of-findings-from-heqcos-skills-assessment-pilot-studies/
◆ Willis, S., 1995. Whole Language. Curriculum , Fall. Available at: http://www.ascd.org/publications/curriculum-update/fall1995/Whole-Language.aspx.
◆ Wren, S. 2001. The Cognitive Foundations of Learning to Read: A Framework. Southwest Educational Development Laboratory: Austin, TX.
References

LIFTING THE CURTAIN ON EQAO SCORES
43
Appendix
Figure 17 Percentage of students who are English Language Learners (ELL) – by Grade
0%
5%
10%
15%
20%
25%
2005 2006 2007 2008 2009 2010 2011 2012 2013 2014 2015 2016 2017 2018 2019
Grade 3 Grade 6 OSSLT
Figure 18 Percentage of students with an IEP – by ELL/Non-ELL
Non ELL ELLGRADE 3
0%
5%
10%
15%
20%
25%
2005 2006 2007 2008 2009 2010 2011 2012 2013 2014 2015 2016 2017 2018 2019
30%
35%

LIFTING THE CURTAIN ON EQAO SCORES
44Appendix
Non ELL ELLGRADE 6
0%
5%
10%
15%
20%
25%
2005 2006 2007 2008 2009 2010 2011 2012 2013 2014 2015 2016 2017 2018 2019
30%
35%
Non ELL ELLOSSLT
0%
5%
10%
15%
20%
25%
2005 2006 2007 2008 2009 2010 2011 2012 2013 2014 2015 2016 2017 2018 2019
30%
35%