Embed Size (px)
Citation preview

BY JIM PRINCE
www.GBEMembers.com

www.GBEMembers.com
No part of this publication may be reproduced, stored in a retrieval system, or transmitted in any form or by any means electronic, mechanical,
photocopying, recording, or otherwise without the prior permission of the publisher.
Published by:
The Greatest business on earth™
877 Ne 7th street
Grants Pass, OR 97526
Phone: 541-955-2885
www.gbemembers.com
© 2015 The Greatest business on earth.
All Rights Reserved.
www.GBEMembers.com
Risks of TRading You should undeRsTand
IMportant notIcEThe risk of loss in trading commodity futures contracts can be substantial. There is a high degree of leverage in futures trading because of the small margin requirements. This leverage can work against you as well as for you and can lead to large losses as well as large gains.
Past performance is not necessarily indicative of future results and examples of historic price moves or extreme market conditions are not meant to imply that such moves or conditions are common occurrences or are likely to occur.
These ResulTs aRe Based on siMulaTed oR hYPoTheTiCal PeRfoRManCe ResulTs ThaT haVe CeRTain inheRenT liMiTaTions. unlike The ResulTs shoWn in an aCTual PeRfoRManCe ReCoRd, These ResulTs do noT RePResenT aCTual TRading. also, BeCause These TRades haVe noT aCTuallY Been eXeCuTed, These ResulTs MY haVe undeR-oR oVeR-CoMPensaTed foR The iMPaCT, if anY, of CeRTain MaRkeT faCToRs, suCh as laCk of liQuidiTY. siMulaTed oR hYPoTheTiCal PRogRaMs in geneRal aRe also suBJeCT To The faCT ThaT TheY aRe designed WiTh The BenefiT of hindsighT. no RePResenTaTion is Being Made ThaT anY aCCounT Will oR is likelY To aChieVe PRofiTs oR losses siMilaR To Those shoWn.
strategies using combinations of positions, such as spread and straddle positions may be as risky as taking a simple long or short positions.
This brief statement cannot disclose all the risks and other significant aspects of the commodity markets. You should carefully study commodity trading and consider whether such trading is suitable for you in light of your circumstances and financial resources before you trade.
www.GBEMembers.com
GuIdElInEsThe Cycle Trading Strategy entails applying indicators (sometimes
referred to as studies) to price charts to help us make trading decisions. The studies i use in this methodology include three different Moving Averages plus the Keltner Channel, the MACD Oscillator/Histogram, the Slow Stochastic, and the Choppiness Index.
i don’t necessarily use these studies as they might typically be used. i use them to help me identify the trend, the momentum in the trend, and if the trend is nearing a cycle high or cycle low.
in addition, i use two of these studies to help me determine if there is divergence in the market. This is vitally important because it can alert me to a possible turning point in price before it happens!
BY JIM PRINCE
www.GBEMembers.com
BY JIM PRINCEBY JIM PRINCEStrategY
1
ChaPTeR one
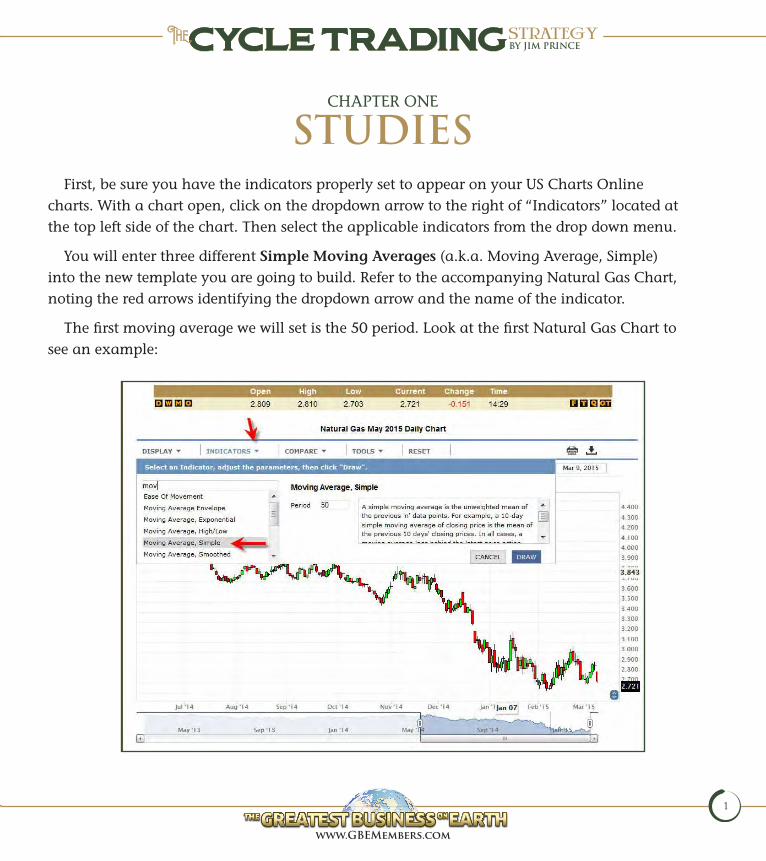
studIEsfirst, be sure you have the indicators properly set to appear on your us Charts online
charts. With a chart open, click on the dropdown arrow to the right of “indicators” located at the top left side of the chart. Then select the applicable indicators from the drop down menu.
You will enter three different Simple Moving Averages (a.k.a. Moving average, simple) into the new template you are going to build. Refer to the accompanying natural gas Chart, noting the red arrows identifying the dropdown arrow and the name of the indicator.
The first moving average we will set is the 50 period. look at the first natural gas Chart to see an example:
www.GBEMembers.com
BY JIM PRINCEBY JIM PRINCEStrategY
2
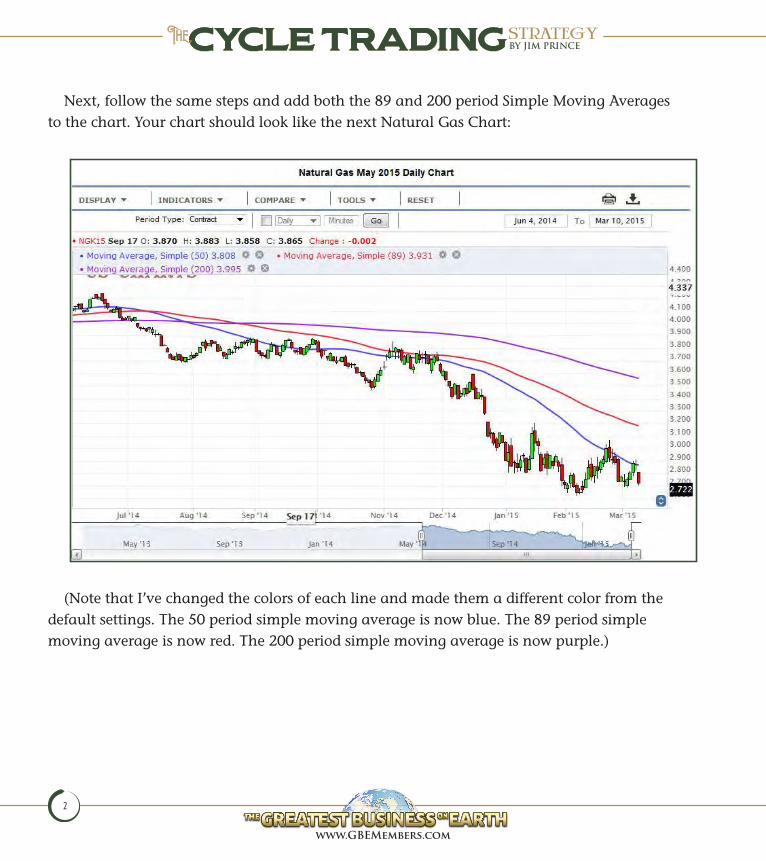
next, follow the same steps and add both the 89 and 200 period simple Moving averages to the chart. Your chart should look like the next natural gas Chart:
(note that i’ve changed the colors of each line and made them a different color from the default settings. The 50 period simple moving average is now blue. The 89 period simple moving average is now red. The 200 period simple moving average is now purple.)
www.GBEMembers.com
BY JIM PRINCEBY JIM PRINCEStrategY
3
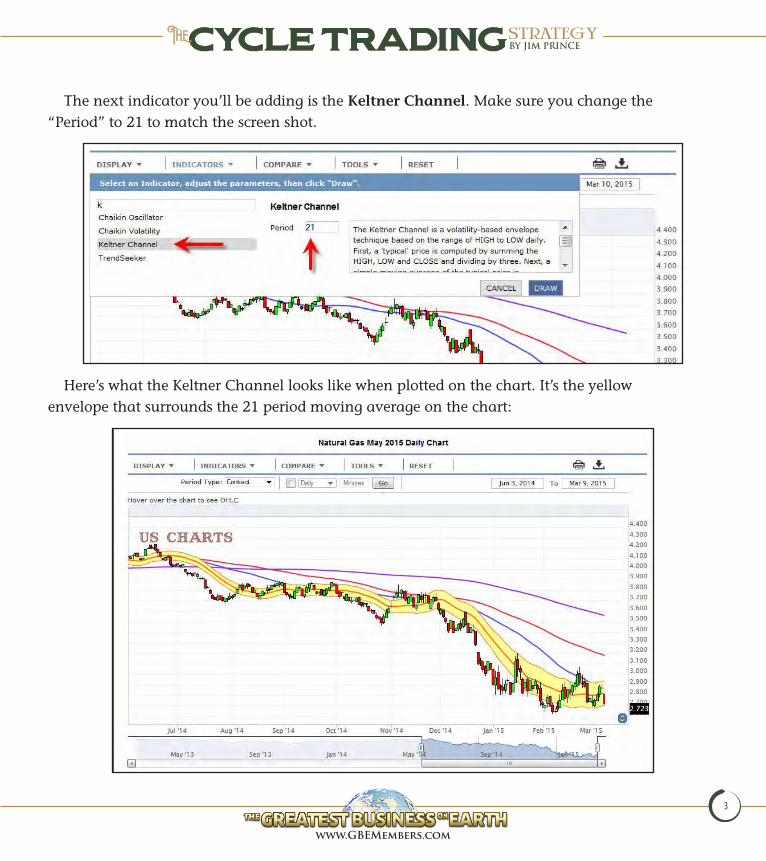
The next indicator you’ll be adding is the Keltner Channel. Make sure you change the “Period” to 21 to match the screen shot.
here’s what the keltner Channel looks like when plotted on the chart. it’s the yellow envelope that surrounds the 21 period moving average on the chart:
www.GBEMembers.com
BY JIM PRINCEBY JIM PRINCEStrategY
4
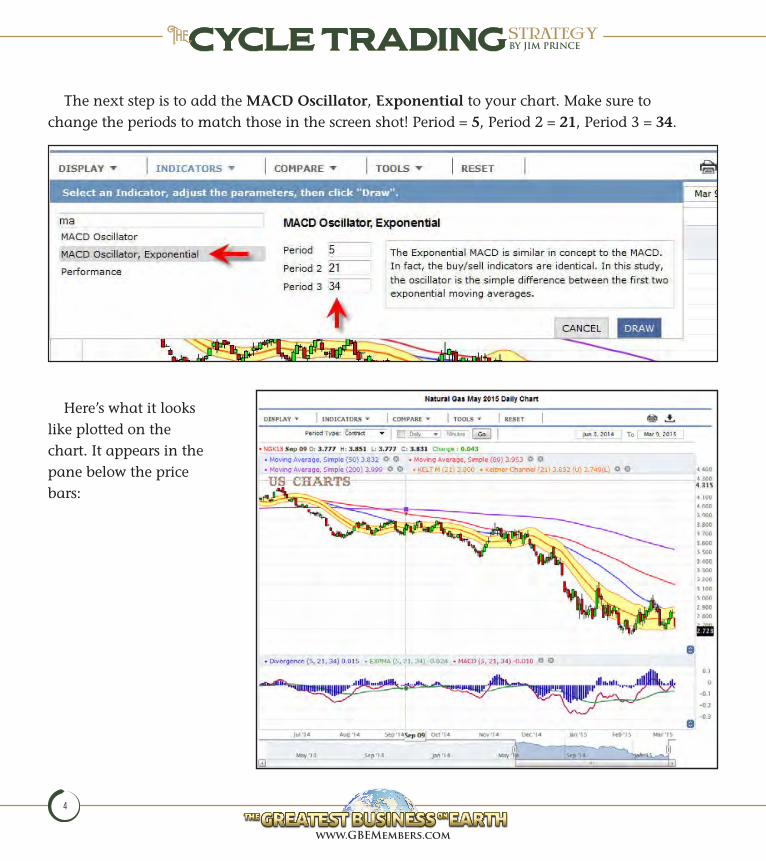
The next step is to add the MACD Oscillator, Exponential to your chart. Make sure to change the periods to match those in the screen shot! Period = 5, Period 2 = 21, Period 3 = 34.
here’s what it looks like plotted on the chart. it appears in the pane below the price bars:
www.GBEMembers.com
BY JIM PRINCEBY JIM PRINCEStrategY
5
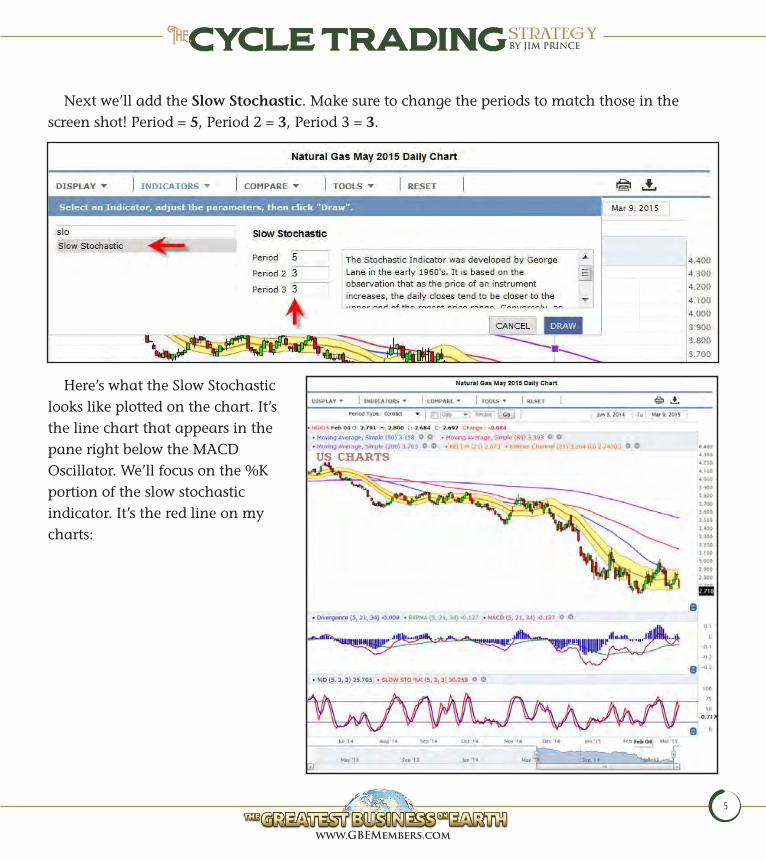
next we’ll add the Slow Stochastic. Make sure to change the periods to match those in the screen shot! Period = 5, Period 2 = 3, Period 3 = 3.
here’s what the slow stochastic looks like plotted on the chart. it’s the line chart that appears in the pane right below the MaCd oscillator. We’ll focus on the %k portion of the slow stochastic indicator. it’s the red line on my charts:
www.GBEMembers.com
BY JIM PRINCEBY JIM PRINCEStrategY
6
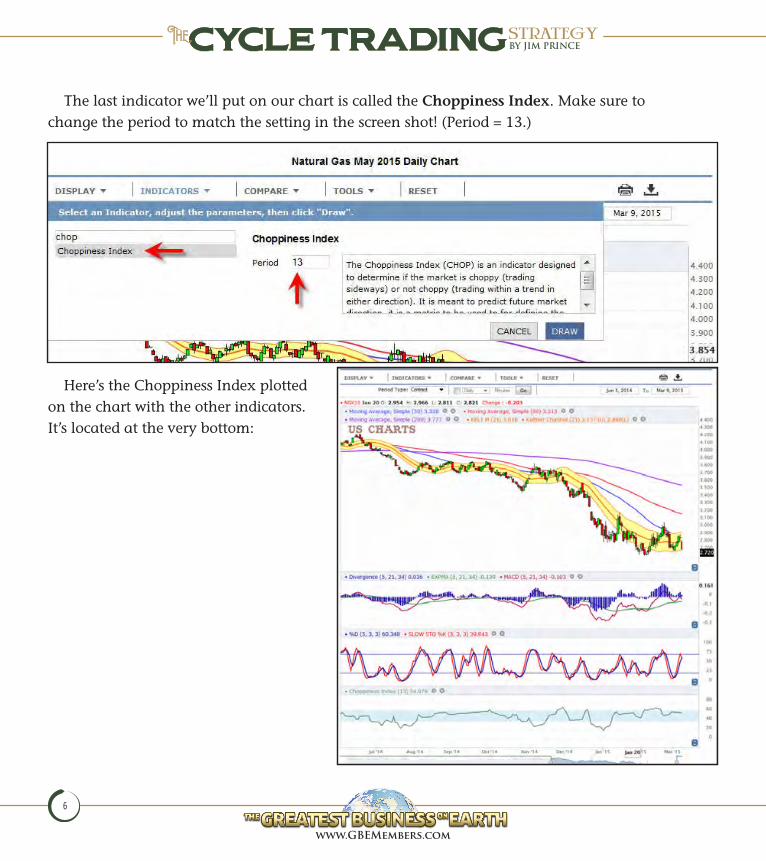
The last indicator we’ll put on our chart is called the Choppiness Index. Make sure to change the period to match the setting in the screen shot! (Period = 13.)
here’s the Choppiness index plotted on the chart with the other indicators. it’s located at the very bottom:
www.GBEMembers.com
BY JIM PRINCEBY JIM PRINCEStrategY
7
once you’ve saved the indicators on the chart you’re looking at, be sure to also save them as a template by selecting that option below the chart. By following this simple step you won’t have to build the indicators individually on each chart in the future. new charts will automatically appear with your selected indicators displayed.
as a side note. . . if you choose you can simply select my template from the dropdown arrow below the chart. Taking this step will plot my template (with my colors and the appropriate settings) on all of your charts. This saves you the time and effort of having to build the template yourself.

www.GBEMembers.com
www.GBEMembers.com
BY JIM PRINCEBY JIM PRINCEStrategY
9
ChaPTeR TWo
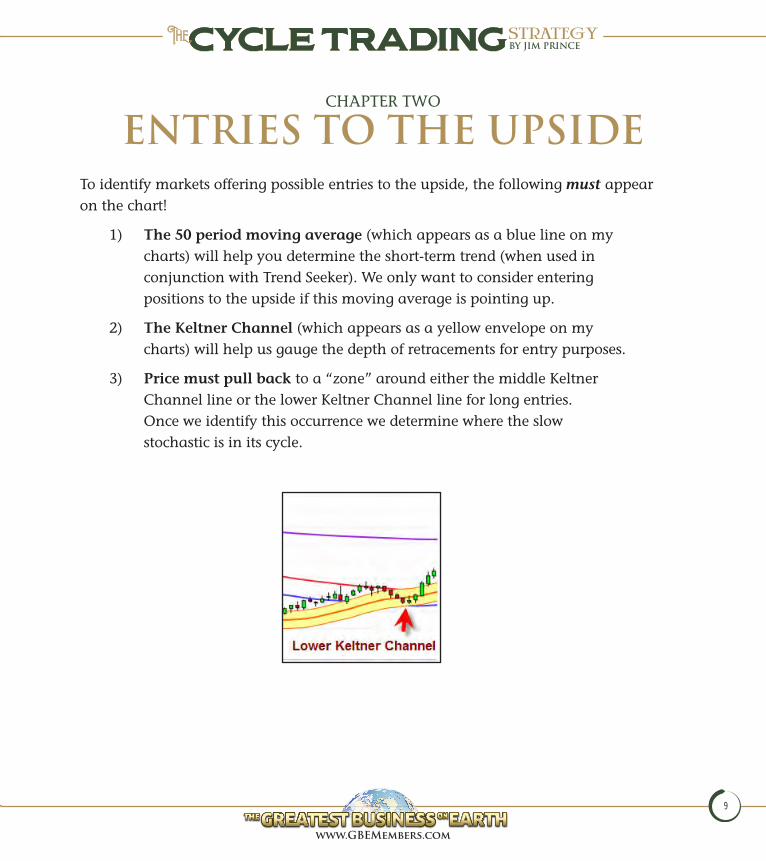
EntrIEs to thE upsIdETo identify markets offering possible entries to the upside, the following must appear on the chart!
1) The 50 period moving average (which appears as a blue line on my charts) will help you determine the short-term trend (when used in conjunction with Trend seeker). We only want to consider entering positions to the upside if this moving average is pointing up.
2) The Keltner Channel (which appears as a yellow envelope on my charts) will help us gauge the depth of retracements for entry purposes.
3) Price must pull back to a “zone” around either the middle keltner Channel line or the lower keltner Channel line for long entries. once we identify this occurrence we determine where the slow stochastic is in its cycle.
www.GBEMembers.com
BY JIM PRINCEBY JIM PRINCEStrategY
10
Slow StochaStic
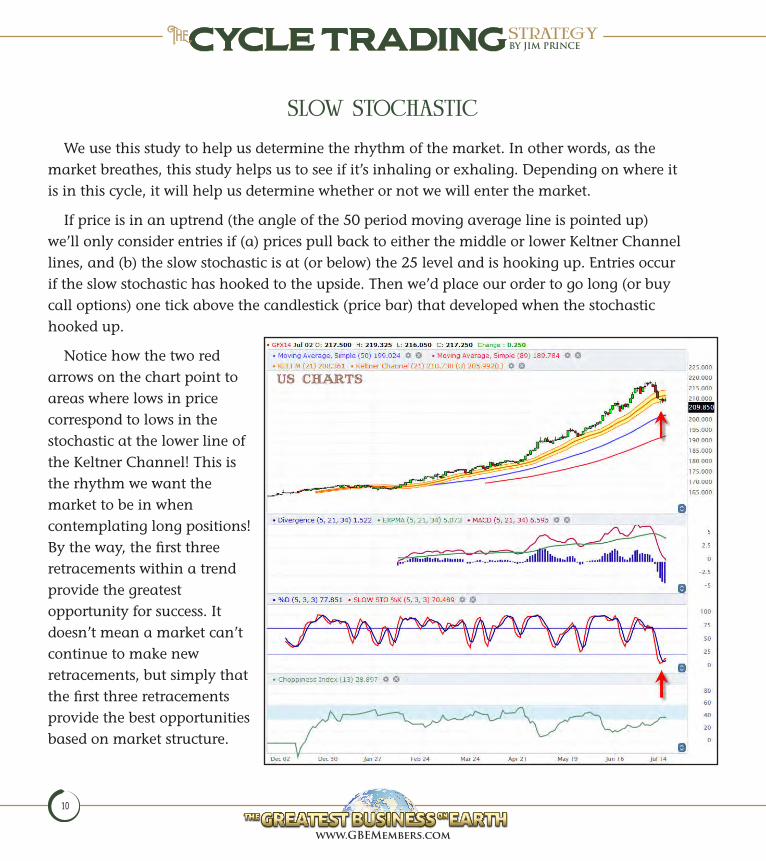
We use this study to help us determine the rhythm of the market. in other words, as the market breathes, this study helps us to see if it’s inhaling or exhaling. depending on where it is in this cycle, it will help us determine whether or not we will enter the market.
if price is in an uptrend (the angle of the 50 period moving average line is pointed up) we’ll only consider entries if (a) prices pull back to either the middle or lower keltner Channel lines, and (b) the slow stochastic is at (or below) the 25 level and is hooking up. entries occur if the slow stochastic has hooked to the upside. Then we’d place our order to go long (or buy call options) one tick above the candlestick (price bar) that developed when the stochastic hooked up.
notice how the two red arrows on the chart point to areas where lows in price correspond to lows in the stochastic at the lower line of the keltner Channel! This is the rhythm we want the market to be in when contemplating long positions! By the way, the first three retracements within a trend provide the greatest opportunity for success. it doesn’t mean a market can’t continue to make new retracements, but simply that the first three retracements provide the best opportunities based on market structure.
www.GBEMembers.com
BY JIM PRINCEBY JIM PRINCEStrategY
11
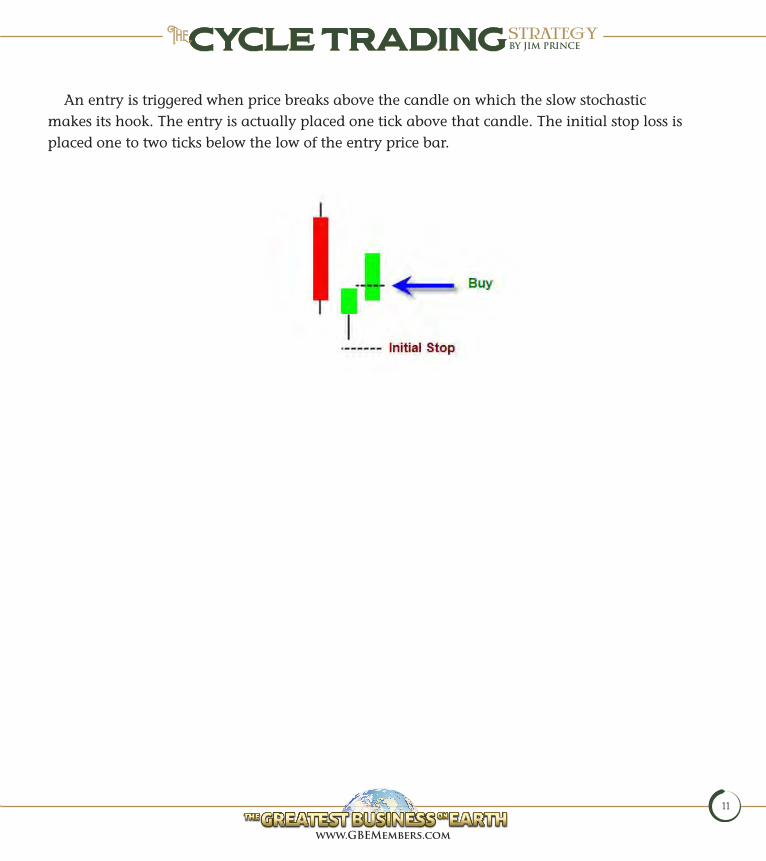
an entry is triggered when price breaks above the candle on which the slow stochastic makes its hook. The entry is actually placed one tick above that candle. The initial stop loss is placed one to two ticks below the low of the entry price bar.
www.GBEMembers.com
BY JIM PRINCEBY JIM PRINCEStrategY
12
MacD oScillator/hiStograM
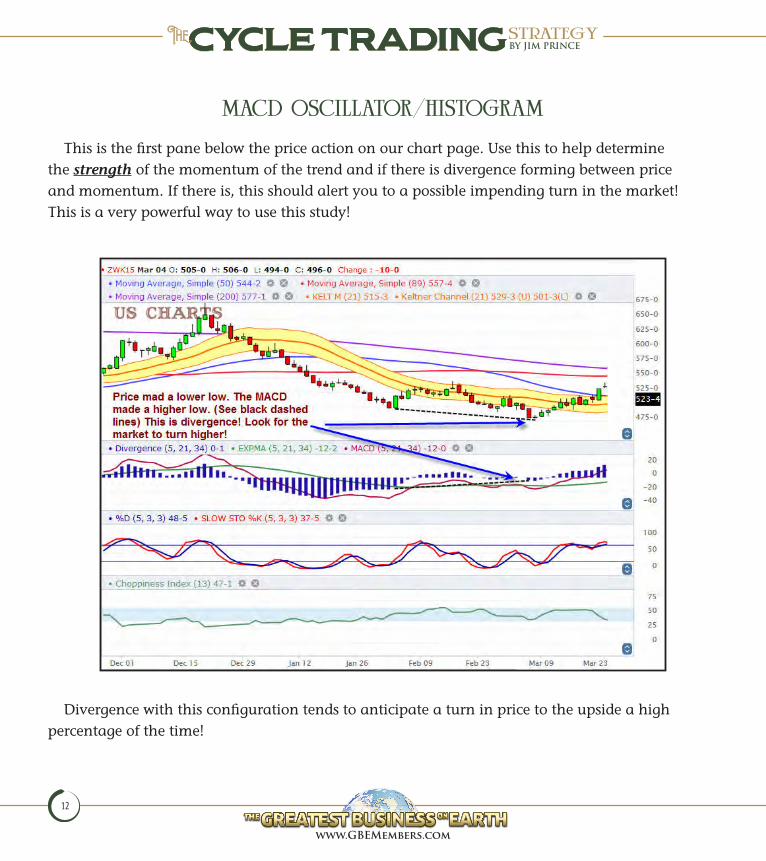
This is the first pane below the price action on our chart page. use this to help determine the strength of the momentum of the trend and if there is divergence forming between price and momentum. if there is, this should alert you to a possible impending turn in the market! This is a very powerful way to use this study!
divergence with this configuration tends to anticipate a turn in price to the upside a high percentage of the time!
www.GBEMembers.com
BY JIM PRINCEBY JIM PRINCEStrategY
13
ChaPTeR ThRee
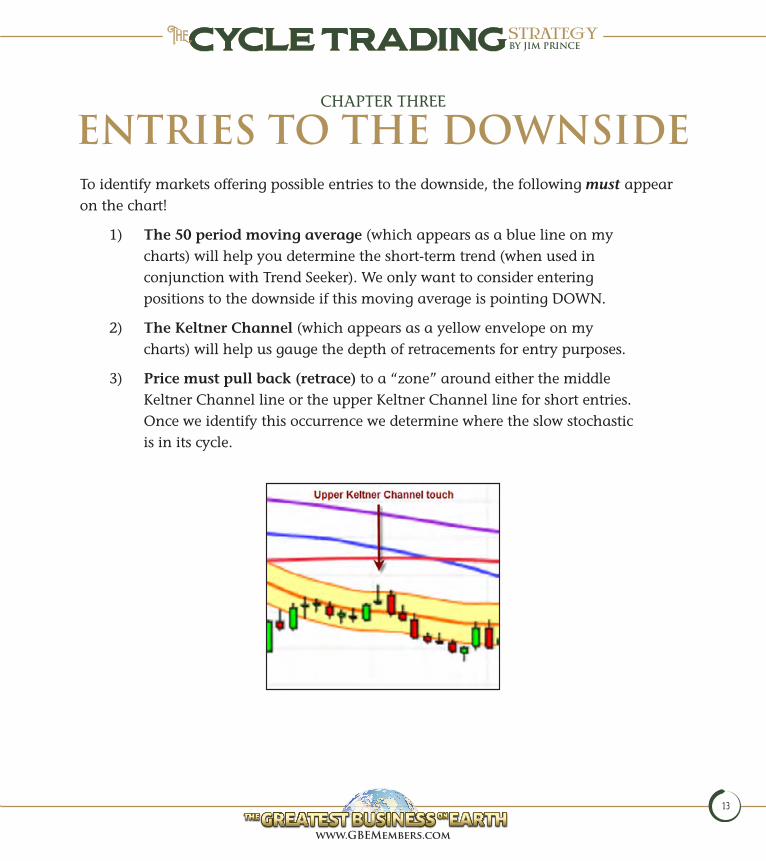
EntrIEs to thE doWnsIdETo identify markets offering possible entries to the downside, the following must appear on the chart!
1) The 50 period moving average (which appears as a blue line on my charts) will help you determine the short-term trend (when used in conjunction with Trend seeker). We only want to consider entering positions to the downside if this moving average is pointing doWn.
2) The Keltner Channel (which appears as a yellow envelope on my charts) will help us gauge the depth of retracements for entry purposes.
3) Price must pull back (retrace) to a “zone” around either the middle keltner Channel line or the upper keltner Channel line for short entries. once we identify this occurrence we determine where the slow stochastic is in its cycle.
www.GBEMembers.com
BY JIM PRINCEBY JIM PRINCEStrategY
14
Slow StochaStic
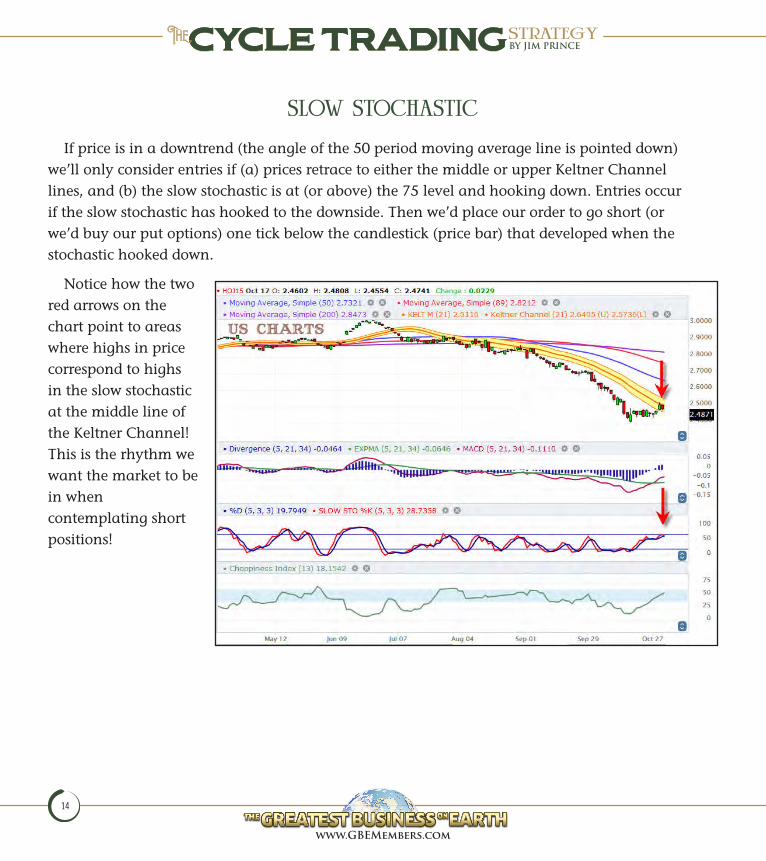
if price is in a downtrend (the angle of the 50 period moving average line is pointed down) we’ll only consider entries if (a) prices retrace to either the middle or upper keltner Channel lines, and (b) the slow stochastic is at (or above) the 75 level and hooking down. entries occur if the slow stochastic has hooked to the downside. Then we’d place our order to go short (or we’d buy our put options) one tick below the candlestick (price bar) that developed when the stochastic hooked down.
notice how the two red arrows on the chart point to areas where highs in price correspond to highs in the slow stochastic at the middle line of the keltner Channel! This is the rhythm we want the market to be in when contemplating short positions!
www.GBEMembers.com
BY JIM PRINCEBY JIM PRINCEStrategY
15
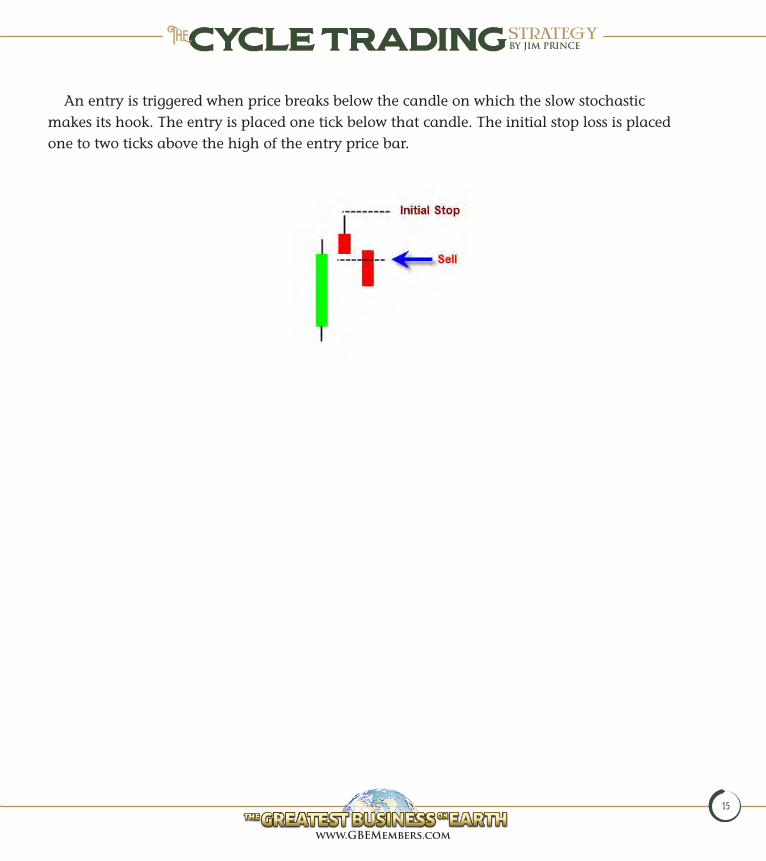
an entry is triggered when price breaks below the candle on which the slow stochastic makes its hook. The entry is placed one tick below that candle. The initial stop loss is placed one to two ticks above the high of the entry price bar.
www.GBEMembers.com
BY JIM PRINCEBY JIM PRINCEStrategY
16
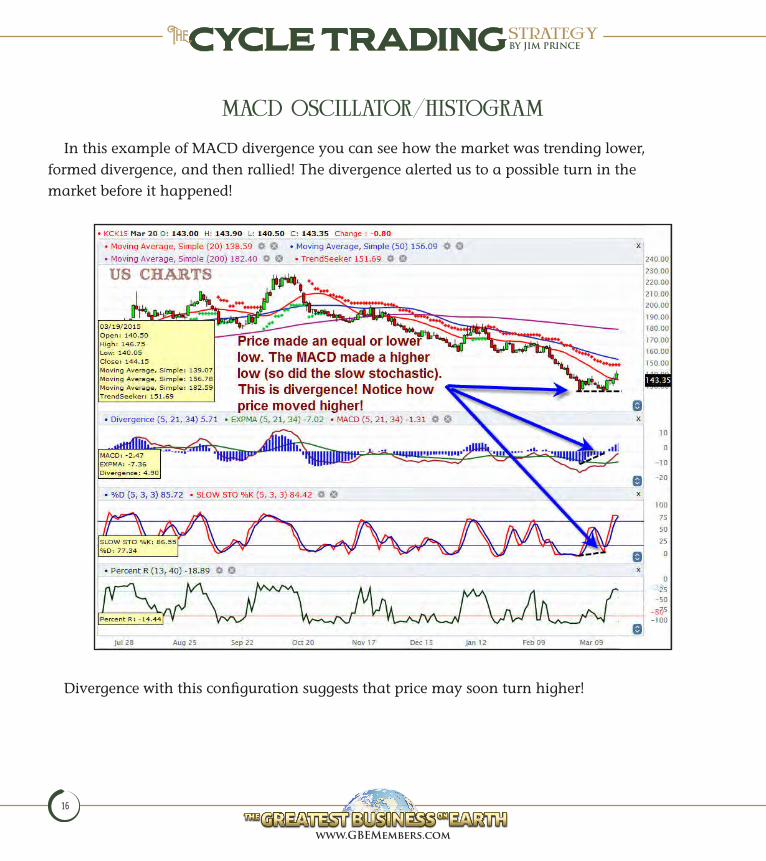
MacD oScillator/hiStograM
in this example of MaCd divergence you can see how the market was trending lower, formed divergence, and then rallied! The divergence alerted us to a possible turn in the market before it happened!
divergence with this configuration suggests that price may soon turn higher!
www.GBEMembers.com
BY JIM PRINCEBY JIM PRINCEStrategY
17
ChaPTeR fouR
addItIonal consIdEratIons
trenD Seeker
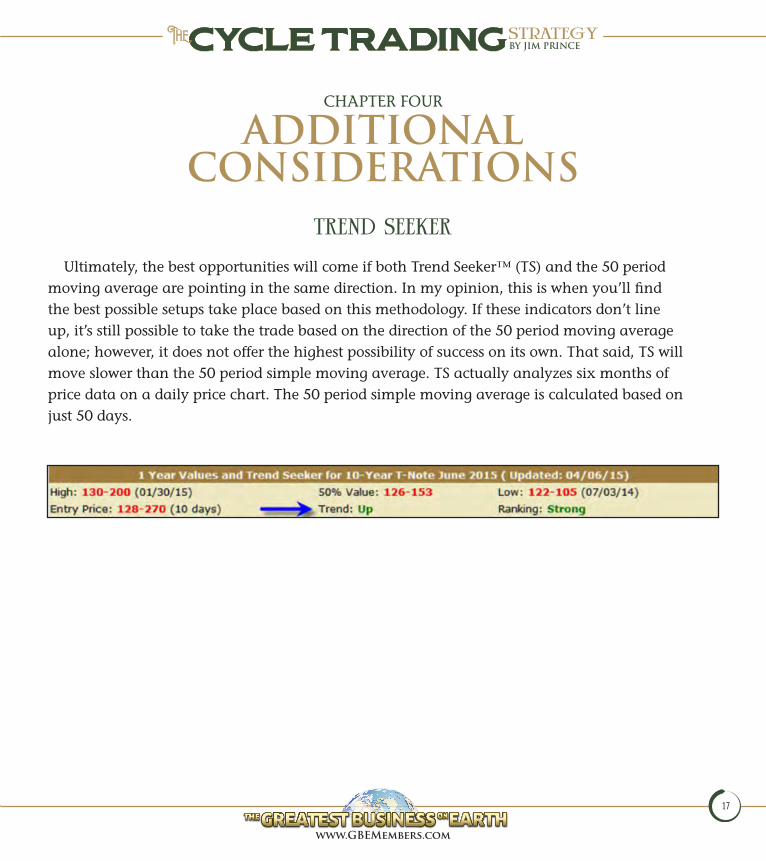
ultimately, the best opportunities will come if both Trend seeker™ (Ts) and the 50 period moving average are pointing in the same direction. in my opinion, this is when you’ll find the best possible setups take place based on this methodology. if these indicators don’t line up, it’s still possible to take the trade based on the direction of the 50 period moving average alone; however, it does not offer the highest possibility of success on its own. That said, Ts will move slower than the 50 period simple moving average. Ts actually analyzes six months of price data on a daily price chart. The 50 period simple moving average is calculated based on just 50 days.
www.GBEMembers.com
BY JIM PRINCEBY JIM PRINCEStrategY
18
the choppineSS inDex
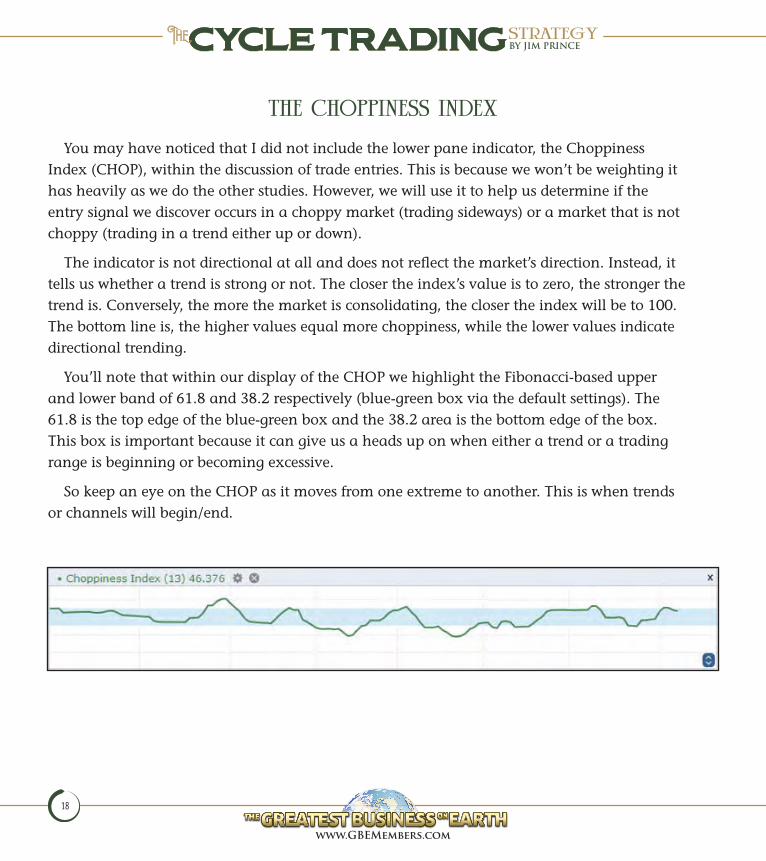
You may have noticed that i did not include the lower pane indicator, the Choppiness index (ChoP), within the discussion of trade entries. This is because we won’t be weighting it has heavily as we do the other studies. however, we will use it to help us determine if the entry signal we discover occurs in a choppy market (trading sideways) or a market that is not choppy (trading in a trend either up or down).
The indicator is not directional at all and does not reflect the market’s direction. instead, it tells us whether a trend is strong or not. The closer the index’s value is to zero, the stronger the trend is. Conversely, the more the market is consolidating, the closer the index will be to 100. The bottom line is, the higher values equal more choppiness, while the lower values indicate directional trending.
You’ll note that within our display of the ChoP we highlight the fibonacci-based upper and lower band of 61.8 and 38.2 respectively (blue-green box via the default settings). The 61.8 is the top edge of the blue-green box and the 38.2 area is the bottom edge of the box. This box is important because it can give us a heads up on when either a trend or a trading range is beginning or becoming excessive.
so keep an eye on the ChoP as it moves from one extreme to another. This is when trends or channels will begin/end.
www.GBEMembers.com
BY JIM PRINCEBY JIM PRINCEStrategY
19
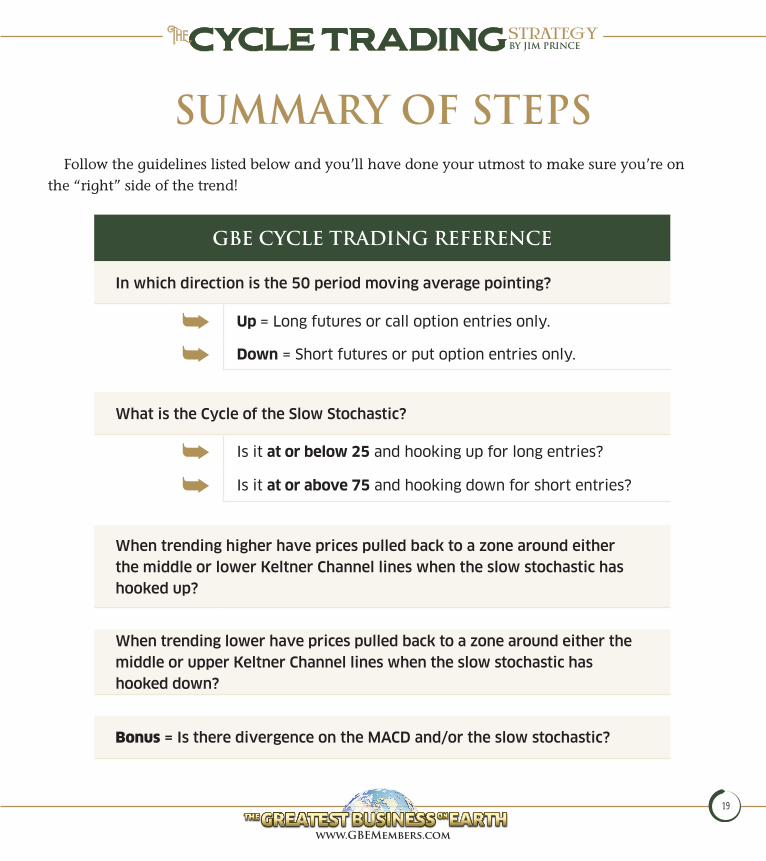
suMMarY oF stEpsfollow the guidelines listed below and you’ll have done your utmost to make sure you’re on
the “right” side of the trend!
GBE cYclE tradInG rEFErEncE
In which direction is the 50 period moving average pointing?
➥ Up = long futures or call option entries only.
➥ Down = short futures or put option entries only.
What is the Cycle of the Slow Stochastic?
➥ is it at or below 25 and hooking up for long entries?
➥ is it at or above 75 and hooking down for short entries?
When trending higher have prices pulled back to a zone around either the middle or lower Keltner Channel lines when the slow stochastic has hooked up?
When trending lower have prices pulled back to a zone around either the middle or upper Keltner Channel lines when the slow stochastic has hooked down?
Bonus = Is there divergence on the MACD and/or the slow stochastic?
877 nE 7th street · Grants pass, or 97526 phone: 541-955-2885 · www.gbemembers.com
BY JIM PRINCE