Embed Size (px)
DESCRIPTION
PRESENTATION ON Indian Power Sector GHG Reduction Strategy. by Mr. V.S. Verma Member (Planning) Central Electricity Authority. International Workshop on Carbon Capture and Storage in Power Sector 22-23 rd January 2008. INDIAN POWER SCENERIO. INSTALLED CAPACITY (AS ON 17.01.2008). - PowerPoint PPT Presentation
Citation preview

byMr. V.S. Verma
Member (Planning) Central Electricity Authority
PRESENTATION ON
Indian Power Sector GHG Reduction Strategy
International Workshop on Carbon Capture and Storage in Power Sector
22-23rd January 2008

INDIAN POWER SCENERIO

INSTALLED CAPACITY INSTALLED CAPACITY (AS ON 17.01.2008)(AS ON 17.01.2008)
Total: 140302 MW

ALL INDIA PLANT LOAD FACTOR (%) OF THERMAL POWER STATIONS
57.1
77.0
3
76.7
74.3
53.2
74.8
72.7
72.2
69.969
67.3
64.664
.7
64.4
63
60
61
55.3
53.9
56.5
55
56.5
52.4
48
53
58
63
68
73
78
19
85
-86
19
86
-87
19
87
-88
19
88
-89
19
89
-90
19
90
-91
19
91
-92
19
92
-93
19
93
-94
19
94
-95
19
95
-96
19
96
-97
19
97
-98
19
98
-99
19
99
-20
00
20
00
-01
20
00
-02
20
02
-03
20
03
-04
20
04
-05
20
05
-06
20
06
-07
20
07
-08
(De
c 0
7)
YEARS
PL
F (
%)

CAPACITY ADDITION PROPOSED FOR 11th PLAN – 78,577 MW
HYDRO, 16,553MW,
21%
THERMAL, 58,644MW,
75%
NUCLEAR, 3,380MW, 4%
Thermal – 58,644 MW( Coal – 52,905 MW, Gas- 4,289 MW, Lignite- 1,450 MW)
Additional capacity expected : New Renewables – 14,000 MW
: Captive – 12,000 MWLatest Feasible capacity : 78327MW

11TH PLAN PROGRAMME(AS ON 17.01.2008(AS ON 17.01.2008))
• 10th Plan capacity addition only 21,180 MW. About 11,000 MW slippages due to causes attributable to equipment suppliers and contractors.
• 11th Plan - 78,577 MW Proposed: Latest Total :78327MW
- 6886 MW capacity already commissioned
- 59991 MW (77%) under construction
- 11450 MW - Letter of awards yet to be placed
- Coal linkages available for 96% of coal based plants
- 92% hydro capacity under construction/commissioned
- All gas based projects under execution or gas tied up from local sources
• Additional 13,000 MW gas based projects if gas available for long term at reasonable price

NON CONVENTIONAL ENERGY PLANTS
Installed Capacity at the end of 10th Plan( as on 31.12.2007)- 10,855.3 MW.
11th Plan target- 14,000 MW
Wind Power-10,500 MW
Biomass Power,Baggasse Co-generation and Biomass Gasifiers- 2,100 MW
Small Hydro (up to 25 MW)-1400 MW
NON-CONVENTIONAL ENERGY PLANTS

India’s Position• No obligation to reduce emissions• Per capita Carbon di-oxide emission of India is amongst
the lowest in the world. Contributes around 4% of world total.
• Country wise per capita CO2 emission in 2004 (tonnes of CO2/annum)
– India 1.2– USA 20.6– U.K 9.8– China 3.8– World 4.5
Source: UNDP Human Development report 2007/08
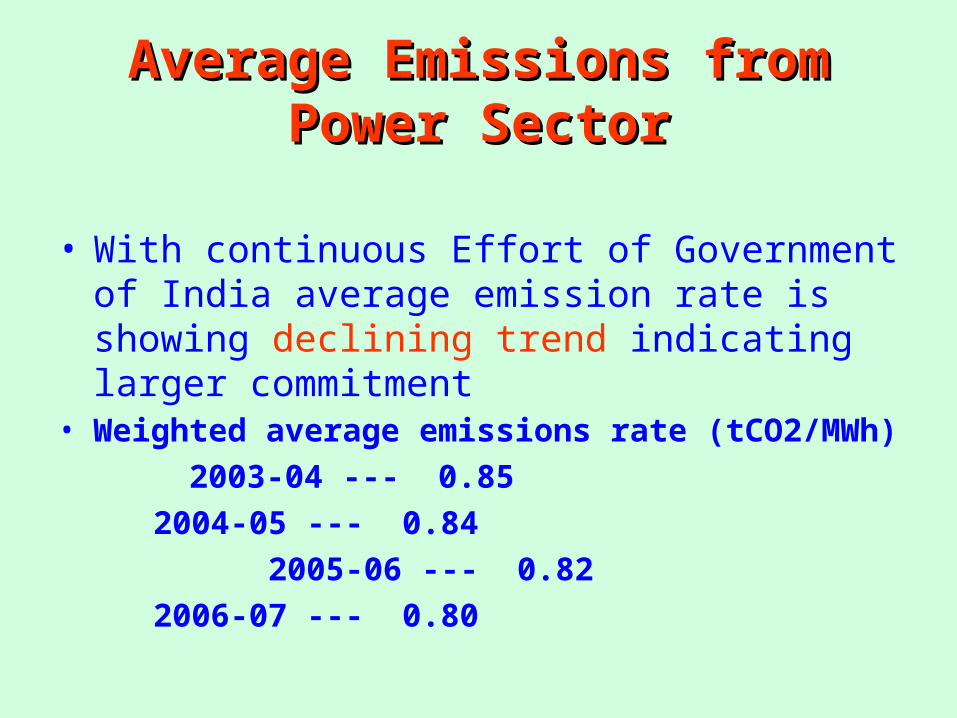
Average Emissions from Power Average Emissions from Power SectorSector
• With continuous Effort of Government of India average emission rate is showing declining trend indicating larger commitment
• Weighted average emissions rate (tCO2/MWh)
2003-04 --- 0.85
2004-05 --- 0.84
2005-06 --- 0.82
2006-07 --- 0.80

Status of Clean Development Status of Clean Development Mechanism Projects (CDM) in IndiaMechanism Projects (CDM) in India
1.National CDM Authority (NCDMA) already given Host country approvals to more than 700 Projects
2.296 Indian CDM projects already registered with CDM Executive Board out of World Total of 868 projects (35%)
3.Main Projects: Waste heat recovery, Small Hydro, Biomass based Power Generation, Wind Power and Energy Efficiency improvement in Industries like cement etc.

Indian Scenario-CDMIndian Scenario-CDM•Exists high potential of Carbon credits.
•Baseline Carbon di-oxide emissions from power sector already in place- First CDM country
•Wide spectrum of projects with different sizes
•Dynamic, Transparent & Speedy processing by Indian National CDM Authority (NCDMA) for Host Country Approval
•Vast Technical Human Resource
•Strong Industrial Base

GOVERNMENT’S GOVERNMENT’S
STRAGTEGY/INITIATIVE STRAGTEGY/INITIATIVE FOR FOR
GHG REDUCTIONGHG REDUCTION

Main Sectors of Green House Main Sectors of Green House Gases EmissionsGases Emissions
– Energy Sector– Transport Sector– Agriculture Sector– Industrial Sector
• Power sector is estimated to contribute around 50% of total CO2 Emissions

Major InitiativesMajor Initiatives• Improvement in efficiency and performance of
existing units - through renovation and Modernisation schemes
- Partnership in excellence.
- Establishment of Energy Efficiency cells at thermal power stations
• Energy Conservation through legislation
• Promotion to Renewable Energy Sources
• 50,000 MW Hydro Initiative launched

Major Initiatives Major Initiatives Cont…Cont…
Publication of Carbon di-oxide Baseline Emission database for Indian Power sector by Central Electricity Authority– Facilitate prospective project Developers for
consistent and accurate quantification of Carbon di-oxide emission by their projects thereby reducing the project development cost
– Enhance acceptability of Indian CDM projects -Would help expedite the clearance /approval process

Major Initiatives Major Initiatives Cont…Cont…
• Higher size thermal Supercritical units(660/800 MW) for improved efficiency in XIth Plan (2007-2012) and beyond
- Efficiency gain of about 2%
- 11 Nos. of 660MW (under XIth Plan)
- 1 No. of 800MW (under XIth Plan)
• 52905 MW Coal fired Units
• 16553 MW Hydro
• 3880 Nuclear

Parameters of 660/800 MW Coal fired Supercritical Units
Parameter 660MW 800MW
Main Steam Pressure Kg/cm2
247 247
Main Steam Temperature oC
535 565
Reheat Temperature oC
565 593

Major Initiatives Major Initiatives Cont…Cont…
• Participating in Asia Pacific Partnership (APP) of USAID for Clean Development and Climate
– To accelerate the development and deployment of clean energy technologies.
- US, Australia, Japan, South Korea, China and India
- MOP coordinates Power Generation and Transmission task force
-Work on Efficiency improvement of two thermal power plants namely Ropar and Kolaghat Thermal Power station already started.
Major Initiatives Major Initiatives Cont…Cont…
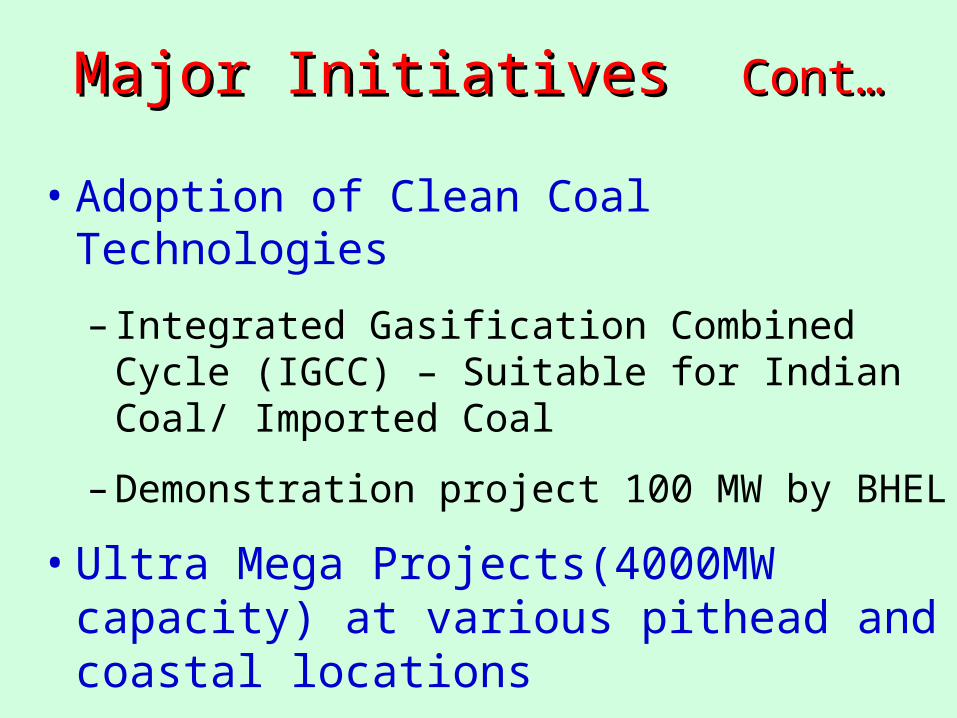
• Adoption of Clean Coal Technologies
– Integrated Gasification Combined Cycle (IGCC) – Suitable for Indian Coal/ Imported Coal
– Demonstration project 100 MW by BHEL
• Ultra Mega Projects(4000MW capacity) at various pithead and coastal locations

Major Initiatives Major Initiatives ContCont……• Promotion of CDM Projects in Pipeline
(In power sector)
- NTPC - North Karanpura (3*660MW) Supercritical technology
– NTPC – R & M of Badarpur 2* 210MW– NHPC –Nimoo Bazgo 45MW HEP– NHPC – Chutak 44 MW HEP– BBMB – Uprating of Ganguwal Power
House,Kotla Power House, Bhakra Left Bank House

Major Initiatives Major Initiatives Cont…Cont…
• Member of Carbon Sequestration Leadership Forum (CSLF)
– Development of cost effective technologies for separation and capture of CO2
• Participating in FutureGen Project of US
– 275 MW coal fired Zero Emission power plant
– India contributing US$10 Million
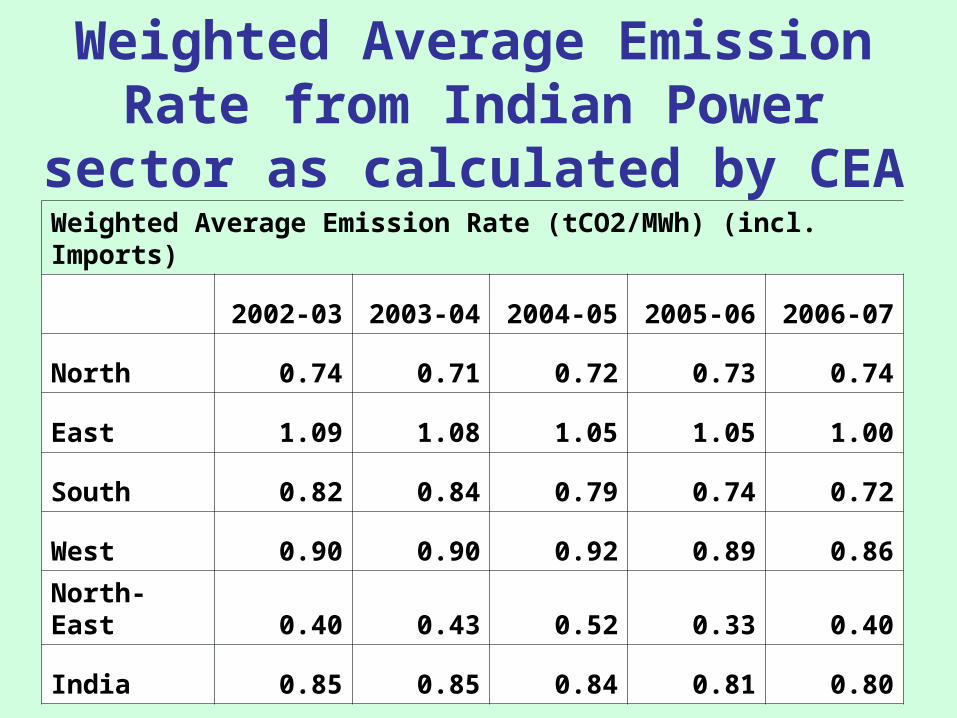
Weighted Average Emission Rate from Indian Power sector as
calculated by CEAWeighted Average Emission Rate (tCO2/MWh) (incl. Imports)
2002-03 2003-04 2004-05 2005-06 2006-07
North 0.74 0.71 0.72 0.73 0.74
East 1.09 1.08 1.05 1.05 1.00
South 0.82 0.84 0.79 0.74 0.72
West 0.90 0.90 0.92 0.89 0.86
North-East 0.40 0.43 0.52 0.33 0.40
India 0.85 0.85 0.84 0.81 0.80