Embed Size (px)
Citation preview
THE ISOLATION, FRACTIONATION AND ELECTROPHORETIC
CHARACTERIZATION OF THE GLOBULINS OF MUNG BEAN
( PHASEOLUS AUREUS)
ByStephen Sung Tsing Djang
A THESIS
Submitted to the School o f Graduate Studies of Michigan State C ollege o f A griculture and Applied Science
in p a r t ia l fu lf il lm e n t o f the requirements fo r the degree o f
DOCTOR OF PHILOSOPHY
Department o f Chemistry
1951
ProQuest Number: 10008244
All rights reserved
INFORMATION TO ALL USERS The quality of this reproduction is dependent upon the quality of the copy submitted.
In the unlikely event that the author did not send a complete manuscript and there are missing pages, these will be noted. Also, if material had to be removed,
a note will indicate the deletion.
uest.ProQuest 10008244
Published by ProQuest LLC (2016). Copyright of the Dissertation is held by the Author.
All rights reserved.This work is protected against unauthorized copying under Title 17, United States Code
Microform Edition © ProQuest LLC.
ProQuest LLC.789 East Eisenhower Parkway
P.O. Box 1346 Ann Arbor, Ml 48106- 1346
/ / - A 5 -' /. v i - "%U'A'fl '
ACKNOWLEDGMENT
To Prof* C. D. B all
Appreciation i s g ra te fu lly extended for h is stim ulating guidance
and h elp fu l c r it ic ism in the accomplishment o f th is work.
To Dr. H. A. L ille v ik
His valuable a ssista n ce and advice in th is work i s lik ew ise
deeply appreciated*
To Michigan State College
For granting the opportunity to carry out th is study the author i s
g ra te fu l.
288379
CONTENTS
PageI . INTRODUCTION............................................................................................. 1
II* HISTORICAL . .................................................................................... 5
I I I . EXPERIMENTAL................................................................................................. 15
A. M a te r ia l ............................................................ 15
B. I s o l a t i o n ............................................................................. 22
a . E x t r a c t io n ..................................................................... 22
1 . The Fundamental R elationsh ips Between the
S o lu b ility o f Mung Bean Protein and the
Nature and Concentration o f Solvents . . . 22
2 . The Study o f Some Factors which E ffec t the
P eptization o f Mung Bean P r o t e in .......................42
(a) Time and Sample-Solvent R atios MS-S-R”43
(b) P a r tic le S ize and Sample-Solvent
R a t io s .................................. 47
(c) Mechanical Shaking, H and-stirring and
Successive E x tr a c t io n s ................................5 1
(d) Temperature and O il-Free and Non-Oil
Free Condition of the Samples. . . . 56
b. P r e c ip it a t io n ...........................................................................6 l
1 . Determination o f Protein Nitrogen - Non-
Protein Nitrogen Ratio and the Albumin-
Globulin R a t io .............................................................. 62
2. Demonstration o f the E ffec t o f D ilu tion
upon the Sedimentation Time o f Globulin
Fraction ..........................................................64
3. Protein Sedimentation from 0 .4 m KaCl Ex
tra ct o f Mung Bean Meal a t Various Hydro
gen Ion Concentrations * ........................................ 68
4. Suggested Procedure fo r the I so la t io n o f
the Globulin from Mung Bean Meal . . . . . JO
5 . A Q uantitative Study o f the Procedure . . J 1
F r a c tio n a t io n .............................. 75
1 . The Construction o f a R otating Outside
Liquid D i a l y z e r ..........................................................75
2 . A pplication o f the Slow Stepwise D ilu tion
Procedure and R otating Outside Liquid
D ia ly s is for the P u rifica tio n of Mung Bean
Globulin .................................................................. 81
3* Determination of the Molar Concentration
o f Sodium Chloride a t which the Gg Fraction
P rec ip ita tes from the Extract with the In
d ir ec t , Slow, Stepwise D ilu tion Procedure. 82
4. Determination o f the Molar Concentration
o f Sodium Chloride a t which Gg P r ec ip ita te s
w ith the D irect D ilu tion M e th o d .......................83
5* F ractionation o f Gj from Gg-free D ia lysate 87
Page6* In v estig a tio n of Fraction G o f Globulin
in a Gg- and G^-free D ia ly s a t e ........................... 90
7 . A Q uantitative A pplication o f the Proce
dure fo r Fractionation o f Mung Bean
Globulins ................................... . . . . . . . 93
d...........................P u r i f i c a t i o n ............. $ 6
1 . P u r ifica tio n of the P rec ip ita te Gg . . . . 96
2. R esolution of the Gg F r a c t i o n ........................... 97
3 . Fractionation o f the Resolved Products
o f G g ............................................................................... 98
4 . Using S p ec ific Molar Concentrations o f
Sodium Chloride for P u r i f ic a t io n ....................... 99
C. A nalysis ..................................................................................102
a . E le c tr o p h o r e s is ...... 102
1. P r i n c i p l e .................................................................... 102
2. A p p a r a tu s .................................................................... 104
3* Buffer E ffec ts . . . . . ................................... 105
4 . The Preparation o f Buffers o f Desired pH
and Ionic S tr e n g th ...................................................107
5 . Operational Procedure in a Complete
E lectrophoretic A nalysis ................................... I l l
b* E lectrophoretic A nalysis o f Mung Bean
G lo b u lin .........................................................................114
IV. SUMMARY........................ AND CONCLUSION.................................................. 126
V. LITERATURE CITED......................................................................................137
PageVI. ADDENDA....................................................................................................... l 4 l
A. A New Apparatus fo r Freezing-Dehydration and Tech
nique for High Vacuum M anipu lation .................................. 142
B. A High Temperature Bath Made from Aluminum Shavings. 158
1
INTRODUCTION
Separation o f p roteins from b io lo g ic a l systems and th e ir p u r ific a
tio n as chemical substances have been the concern o f b io lo g ic a l chemists
fo r over a century ( l ) . Data are a v a ila b le on the p u r ified p ro te in s o f
many o f the common seeds o f commercial importance. I t i s surprising that
l i t t l e i s known about the p rotein s o f Mung bean, Phaseolus aureus, an
econom ically important crop in A s ia tic countries which has become an ac
knowledged crop in the United S ta te s . The object o f th is work was devo
ted to: 1) a study o f the development of a method in order to produce
and reproduce homogeneous fra c tio n or fra c tio n s , and 2) p articu lar care
o f the products to keep them as nearly as p o ss ib le in th e ir natural s ta te .
The preparation o f undenatured p roteins i s in many resp ects a sp ec ia l
a r t . The procedures when developed are gen era lly simple but the choice
o f the best conditions from among the v a r ie ty o f p o s s ib i l i t i e s i s d i f f i
c u lt , and every step involves rigorous a tten tio n to d e ta il in order to
maintain the protein in an undenatured state*
The large dimensions and unique structure o f these h igh ly organized
p rotein m olecules render them p a rticu la r ly la b i le . Exposure to h eat,
to high acid or a lk a lin e cond itions, or to conditions o f low d ie le c tr ic
constant brings about changes in the sp a tia l arrangements o f the rea ctiv e
groups which a lte r , and may com pletely destroy, n ative p rop erties. The
phenomenon ca lle d denaturation may be noted as a change in s o lu b il i ty ,
as a change in molecular shape, as a change in chemical r e a c t iv ity or o f
immunological s p e c if ic i t y . The sp a tia l r e la t io n s between free rea ctiv e
2
groups o f the n a tive protein may he d isto r ted or destroyed (2) t ( 3) , ( 4 ) .
The procedure used for the separation o f Mung hean g lo b u lin s was
ex traction of uniformly ground meal with sodium ch loride so lu tio n . The
extract was d ilu ted in conformity w ith g lob u lin preparations w ith d is
t i l l e d water and the p rec ip ita ted protein was thus obtained. Separation
o f the p rec ip ita te from the so lvent was accomplished by ordinary ce n tr i
fu gation . The exposure o f p rotein to the large a ir in ter fa c e s o f the
Sharpies cen trifu ge was avoided. The foaming produced by Sharpies cen
tr ifu g e s in d ica tes denaturation o f p ro te in . Since the Mung bean g lo b u lin s
are in so lu b le a t low concentrations of n eu tra l s a lt so lv en t, the adjust
in g o f the pH o f the extract fo r p rec ip ita tio n was not necessary . With
t h is procedure a buffer was not used for the ex traction and an a c id was
not employed fo r the adjusting o f the pH o f the extract fo r p r e c ip ita tio n .
Protein sub-types, such as g lu te lin s and g lo b u lin s , when they occur to
gether are rea d ily separated sin ce the g lob u lin s d isso lv e in d ilu te s a lt
so lu tion s whereas the g lu te lin s are in so lu b le in a l l neutral so lv en ts .
The protein which p rec ip ita ted was regarded as g lob u lin , whereas the a l
bumins remained in so lu tion ( 5) , ( 6* ) , (7)» (8) .
I t was very important to d iscover that the Mung bean g lo b u lin s have
♦Protein o f the wheat and other cereal seeds contain a s im ilar complement
o f p ro te in s , i . e . , g lu ten in , g lia d in , g lob u lin and albumin. The g lu ten in
and g lia d in make up the bulk (90$) o f the protein o f cereal seeds, where
as the seeds o f dicotyledonous p lan ts in general contain g lob u lin s as
th e ir p rin cip a l p rotein components.
3
th e ir h igh est s o lu b il i ty in 0.4-M NaCl and are in so lu b le a t the concentra
t io n o f 0.08M NaCl* This so lu b le -in so lu b le range permits a p u r ifica tio n
scheme o f the g lob u lin s by repeated d isp ersion in 0 .4 m N ad so lu tio n and
p r e c ip ita tio n a t a concentration o f 0.08M by d ilu tio n w ith d i s t i l l e d
water* The so lu b le -in so lu b le range o f protein must be determined before
fra ctio n a tio n or p u r ific a tio n can be accomplished*
The aim o f th is study was the is o la t io n o f the p rotein in a s ta te
c lo se to i t s s ta te in nature* The s ta b i l i t y and s o lu b il i ty o f p rotein
are u su a lly greater in d ilu te s a lt so lu tio n s than in water or in d ilu te
acid s or bases (9 ) , (10)* Mung bean g lo b u lin s , which were h igh ly so lu b le
in tile d ilu te NaCl so lu tio n , were a lso h igh ly protected from denatura-
t io n because the d ie le c tr ic constant o f the medium was high* That the
s t a b i l i t y o f p roteins i s greater in so lu tio n s o f greater d ie le c tr ic
constant has long been recognized (1 0 ). With th is procedure the globu
l in s are brought to a r e la t iv e ly in ert s o lid s ta te by d ilu tin g a s rapid ly
as p o ss ib le to 0.Q8M NaCl, They are maintained in so lu b le a t low tempera
tu re, and in th is s ta te rea ctiv e groups are protected from each other
(p ro tein -p rotein reaction) and from the enzymes fo r which they are the
substrate (11)*
In the course o f the study o f the p u r ifica tio n o f the iso la te d pro
te in by d ia ly s is , the need fo r a rapid method o f membrane-equilibration
d ilu tio n became apparent. A ro ta tin g 11 ou tsid e-liq u id " d ia ly s is apparatus
was constructed* The separation and p u r ifica tio n o f Mung bean g lob u lin
was undertaken w ith the membrane-equilibration procedure. With the in
d irec t slow step -w ise d ilu tio n technique the fra ctio n a tio n o f g lob u lin
k
was made p o ss ib le . Extensive e lectrop h oretic stu d ies were made fo r the
ch aracteriza tion o f the to ta l g lob u lin as w ell as the iso la te d fr a c tio n s .
5
HISTORICAL
That certa in p roteins were so lu b le in sa lin e so lu tio n s was f i r s t
observed by Denis in 1S59 (12)# This observation was la te r confirmed
by Hoppe-Seyler. Denis noted that when sodium chloride ex tracts were
made o f both animal and vegetable t is s u e s , certa in protein m ateria ls
were dissolved*
During the la s t decade o f the n ineteenth century Osborne (13) did
the greater part o f h is outstanding work on the is o la t io n o f the p roteins
o f seeds. He demonstrated a remarkable appreciation o f the fundamental
re la tio n sh ip between the s o lu b il i ty o f the p rotein and the s a lt content,
the a c id ity , and the temperature o f the solvent and brought about h is
separations o f the p rotein components o f the ex tracts from seed by w ell
conceived manipulations of these factors* In 1902 (lh ) he published
one paper on the b a sic character o f the p rotein m olecule in which he
showed that ed estin , a ty p ica l seed g lo b u lin , enters in to io n ic reaction s
w ith ac id s to form true sa lts* In 1905 (15) k® published a s o lu b il i ty
curve o f ed estin in s a lt so lu tio n s which showed both the ascending limb
o f the s a lt in g - in and the descending limb o f the sa lt in g -o u t e ffec ts*
These were pioneering attem pts to formulate the p r in c ip le s of s o lu b il i ty
upon which a l l of h is protein is o la t io n stu d ies had been predicated*
In IS96 Osborne and Canqpbell (16) studied s ix d is t in c t p roteids
(g lob u lin s) from ten d ifferen t seeds*
In IS97 Osborne and Campbell reported on stu d ies o f the p roteids o f
$
lup ine seed (1 7 ), the castor hean (IS ) , the sunflower seed (1 9 ), the
cow pea (20) and the white podded adzuki hean (21)* D ilu te s a lt solu
t io n extracted very l i t t l e g lob u lin m aterial from lu p in meal hut large
quantities; were obtained with stronger so lu tio n s . I t was suggested
that the two g lo b u lin fra c tio n s recovered by d ia ly s is and d irec t d ilu
t io n may have been the same but th at there was a probable combination
o f some sort between the g lob u lin and other con stitu en ts o f th e seed*
Comparisons o f the castor bean, sunflower seed and the hemp seed
g lo b u lin s , which show sim ilar composition and a property o f being p a rtly
in so lu b le and p artly so lu b le in a saturated so lu tio n o f sodium ch lorid e,
le d to further study o f the castor bean seed g lo b u lin s . They found
that ad d ition o f a small quantity o f a c id caused such changes in the
castor bean fra c tio n that had been so lub le in saturated s a lt so lu tio n
so that i t behaved much l ik e the in so lu b le fr a c tio n s .
I t was the opinion o f these authors that the sunflower contained
as i t s p rin cip a l protein (c a lle d proteid by them) the g lob u lin ed estin ,
but that which they recovered was mixed with helianthotannic a c id from
which they did not succeed in bringing about a complete separation.
The c h ie f p ro te in o f the cow pea was found to be a g lob u lin that
c lo se ly resembled the leguminin o f the pea and vetch . F ractional pro
cedures in volv in g r ed isso lv in g in brine and p r ec ip ita tio n by d irec t
d ilu tio n and d ia ly s is d isc lo sed a second g lob u lin which resembled p h aseo lin .
The composition o f the g lob u lin extracted from adzuki beans was
found to be id e n tic a l to that obtained from the white bean, Phaseolus
v u lg a r is .
7
Later in the same year Osborne (22) reported r e su lts o f further in -
v e s tig a tio n as to the amount and properties o f the p roteins o f the maise
k ern el. One ‘ea ter-extracted p rote in , p rec ip ita ted by d ia ly s is , he in d i
cated as a g lob u lin named may s in . Prolonged d ia ly s is y ie ld ed yet another
small fra c tio n which resembled edestin*
In 1S9S Osborne and Campbell re in v estig a ted the protein co n stitu en ts
o f the pea ( 23) and vetch (24) a fte r repeated fra c tio n a l p re c ip ita tio n
o f the g lob u lin s from the seeds o f the horse bean ( 25) and l e n t i l (26)
resu lted in two fr a c tio n s , one o f which coagulated at 100°C. When the
p reviou sly reported legumin o f the pea was separated from contaminating
v i c i l i n , they found that i t c lo se ly resembled the legumin o f vetch .
A carefu l comparison o f the reaction s and prop erties o f the p roteins
o f the pea, l e n t i l , horse bean and vetch were reported in a separate
paper (27) • Legumin i s a g lob u lin which d isso lved rea d ily in sa lin e
so lu tio n and was p rec ip ita ted therefrom e ith e r by d ia ly s is , d ilu tio n or
co o lin g . V ic ilin was a g lo b u lin they found a sso c ia ted with legumin in
the pea, l e n t i l and horse bean but none was obtained from vetch . In s a lt
so lu tio n i t was the more so lub le g lob u lin which fa c t made separation o f
the two p o ss ib le . This fr a c tio n was completely coagulated a t 100°C.
Two v a r ie t ie s o f soy beans were studied by Osborne and Campbell (2 8 ).
They named the c h ie f p rotein con stitu en t g ly c in in , a g lob u lin somewhat
sim ilar to legumin* The more so lu b le g lo b u lin , which resembled phaseolin
in com position, remained in the supernatant a f te r g ly c in in was removed.
Osborne and Harris ( 29) were the f i r s t to study pure p ro te in s in
r e la t io n to th e ir s o lu b il i ty in so lu tion s o f d ifferen t s a l t s . They
8
in v estig a te d the a ctio n o f s a lt s on the g lob u lin ed estin obtained from
hemp seed. Chlorides o f monovalent bases, sodium and potassium and
caesium, were found to have very nearly the same solvent power. The
d iva len t bases, barium, strontium, calcium and magnesium d isso lv ed approx
im ately twice as much ed estin as the monovalent ch lo r id es. The s o lu b il i ty
in general was observed to be dependent on the nature o f the m etal, the
divalen t m e ta llic ch lorides were found to have more d ispersing power.
Lithium chloride proved to be the only exception; i t s so lvent power was
much le s s than that o f the other monovalent ch lo r id es. The e f fe c t o f
su lfa te on the s o lu b il i ty o f the g lob u lin was very sim ilar to that o f
the corresponding ch lorides of the d ivalent m etals.
During the years 1916 - 1927 Jones and Johns together and with other
in v estig a to rs studied the p roteins from a number o f seed s. Two g lo b u lin s ,
canavalin and concanavalin, were iso la te d from the jack bean by Jones
and Johns (3 0 ). F ractionation o f the sodium chloride ex tracts w ith vari
ab le saturations o f ammonium su lfa te produced the two globulins*
Johns and Jones ( 31) extracted a ir -d r ied o i l - f r e e peanut meal with
a 10 percent sodium ch loride so lu tio n a t several d ifferen t temperatures
and found that the y ie ld of p rotein obtained was not apparently tempera
ture dependent. A major g lob u lin fra c tio n was obtained by p a r tia l sat
uration o f the extract with ammonium su lfa te and a minor fra c tio n by
complete saturation o f the f i l t r a t e .
The p rin cip a l p rotein was recovered from the v e lv et bean by Johns
and Finks (3 2 ). The g lob u lin was obtained by d ia ly s is o f a sodium
ch loride ex tract in parchment bags suspended in running water.
9
Johns, Finks and Gersdorff (33) reported that the p r in cip a l protein
o f the coconut endosperm was a g lob u lin . The g lob u lin was recovered hy
d ia ly s is fo r 7 10 days o f a ten percent sodium ch loride ex tra ct.
Johns and Waterman (3*0 studied the p roteins o f the Mung bean,
Phaseolus aureus Roxburgh. They found a f iv e percent sodium ch loride
so lu tio n the most e f fe c t iv e ex tractan t. Part o f the p rotein m aterial
was removed from the extract by heat coagulation a t 40°C., and two other
fr a c tio n s were p rec ip ita ted at high temperatures ( 71° C . and 100°C. respec
t iv e ly ) which ind icated an albumin and two g lob u lin fr a c tio n s . The glob
u l in fra c tio n was further separated by v a ria tion s in saturation o f ammon
ium s u lfa te .
The g lob u lin o f the cohune nut was iso la te d by Johns and Gersdorff
(35)* E xtraction experiments were made with d iffer en t concentrations o f
sodium ch loride in water, with 70 percent alcohol and with one percent
hydrochloric a c id and extractin g fo r one hour in each case . Ten percent
sodium ch loride was found to extract the maximum amount o f p rotein .
D ia ly s is o f the ex tract y ie ld ed a higher percentage o f g lob u lin than
p a r tia l saturation with ammonium s u lfa te .
The so lu b le s a lt s occurring n aturally in the lima bean seed were
found by Jones e t a l . ( 36) to be s u f f ic ie n t to d isso lv e 15*15 percent
o f the p rotein when water was the extractan t. This was p r a c t ic a lly as
much as was obtained by a three percent sodium ch loride so lu tio n which
was determined as the most e f f ic ie n t concentration o f the s a l t . Two
g lob u lin s were separated by fra c tio n a l p rec ip ita tio n .
In a study o f the p roteins of wheat bran by Jones and Gersdorff (37)
10
a g lob u lin was one o f the three recovered* Bran ground to pass a 40 mesh
s iev e was found to be as e f fe c t iv e o f extraction as that ground to pass
a 100 mesh s ie v e . Seven g lob u lin preparations were recovered from 4 per
cent sodium ch loride ex tra cts by various methods but d irect d ia ly s is aga in st
water and a c id if ic a t io n with carbon dioxide gas follow ed by d ilu te a c e t ic
a cid was productive o f the la rg est quantity o f g lo b u lin .
By d ia lyz in g or by add ition o f ammonium su lfa te to sa lin e ex tra cts
o f white r ic e f lo u r , Joses and Gersdorff (33) were able to I s o la te a pro
te in fra c tio n which con sisted of two g lob u lin s, coagulating a t 7 -° and
90°C. Ammonium su lfa te fra c tio n a tio n was not p o ss ib le sin ce both p rec ip i
ta ted too c lo se ly together so fra ctio n a l heat coagulation was the means
by which they were separated.
The p rin cip a l p rotein o f the seed of the s i lv e r maple was iso la te d
by Anderson (39) and found to be a g lo b u lin . I t was extracted with ten
percent sodium ch loride and p rec ip ita ted from the ex tract w ith saturated
ammonium s u lfa te .
Gortner, Hoffman and S in c la ir (40) were the f i r s t to emphasize the
e f fe c t o f the p a rticu la r ion o f various s a lt so lu tio n s on the p ep tiza tion
o f p ro te in s . Samples o f wheat f lo u r were studied at almost constant
hydrogen ion concentrations with d ifferen t s a lt s and a marked ly o trop ic
e f fe c t was observed. I t was evident that the hydrogen ion concentration
per se could not have been playing the major r o le , and that such peptiza
t io n d ifferen ces as they observed must be a ttr ib u ted to some other fa c to r .
They found a d e f in ite ly o tro p ic e f fe c t o f the order KF < KOI < O r < KI*
The same r e la t iv e order h eld for a l l the s a l t s stud ied . In conclusion
11
they remarked that "there i s a ly o tro p ic se r ie s o f io n ic e f f e c t s in an
aqueous systen o f p rotein and s a l t s , and that th ese e f f e c t s are due to
p rop erties o f the anion and the cation o f the s a lt and are measurable
even a t a constant hydro gen-ion concentration .N
Bishop (Hi) observed that the y ie ld o f n itrogen as s a lt so lu b le
from barley f lo u r was increased when the p a r t ic le s iz e was decreased.
Staker (4 2 ), in a study o f the p ep tiza tion o f seed p rotein , thought that
whenever p o ss ib le samples should be ground to pass through a 100 mesh
sieve*
C ry sta llin e g lob u lin was prepared from seeds o f pumpkin and squash
by Vickery e t a l . (4-3). A ir-dried meals were extracted with warm sodium
ch lorid e so lu tio n . Albumin was removed by heat coagulation . By d ilu tin g
with four volumes o f warm water (60°C.) g lob u lin p rec ip ita ted when the
so lu tio n came to room temperature. By farth er d ilu tio n with cold water
and on standing in a co ld room another fra c tio n o f g lob u lin p rec ip ita ted
in c r y s ta ls .
Quensel (44) extracted b arley meal with NaCl buffered with phosphate
to pH 7*0. Fractional p rec ip ita tio n o f the extract wa3 accomplished with
s o lid ammonium s u lfa te . The g lob u lin s were separated from the albumins,
low m olecular and poly-d isp ersed m aterial by d isp ersion o f the p recip i
ta te in NaCl so lu tio n and subsequent d ia ly s is again st d i s t i l l e d water.
The method o f ch aracterization o f the g lob u lin components was based on
the u ltra c en tr ifu g a tio n sedim entation constants, which confirmed the
presence o f four g lo b u lin s .
Vassel (45) Iso lated two globulins, l in in and con lin in , from lin seed

H7
TABLE XXXXI. ELECTROPHORETIC MOBILITY CALCULATIONS
GlobulinFraction
&r2(17)
<*2(14)
^ ( l l )
h(oi)
SunNo.
EE 1Ascending(cm)
^2Descending(cm)
4cross
sectio n area o f c e l l (cm)
kc
a t 1®C.
RR esistance of protein so lu tion in ohms
I l4 3.28 2.67 2.40 . 0 .3 .0048937 80115 3.90 2.07 1.93 0 .3 .0048937 76116 4.36 2.16 2.03 o*3 .0048937 68120 4.61 l . l 4 1.09 0 .3 .0048937 69121 7.15 0.85 0.78 0 .3 .0048937 72119 7.48 1.65 1.59 0 .3 .0048937 72.5122 7.72 2.62 2.94 0 .3 .0048937 74.5
124 3.27 2.19 2.02 0 .3 .0048937 81128 3.85 2.21 2.19 0 .3 .0048937 72.3126 4.44 1.52 1.45 0 .3 .0048937 65127 4.78 0.92 0.95 0 .3 .0048937 69.5136 7.27 1.96 1.71 0 .3 .0048937 78130 7.52 2.27 2.45 0 .3 .0048937 77129 7.75 1.69 2.14 0 .3 .0048937 62.7
97 3.34 2.91 2.60 0 .3 .0048937 62.696 3.80 2.80 2.73 0 .3 .0048937 7099 4.40 i ; 2 i 1.07 0 .3 .0048937 53.5
105 6.15 1.87 2.06 0 .3 .0048937 74104 6.63 2.77 2.85 0 .3 .0048937 78
137 3.32 2.64 2.42 0 .3 .0048937 7b.5138f 3.90 1.75 1.67 0 .3 .0048937 70.3139 4.21 1.43 l . 4 i 0 .3 .0048937 64140 4.52 1.14 1.32 0 .3 .0048937 68.5152 7.30 1.65 1.67 0 .3 .0048937 5 8 .4142 7.50 2.27 2.29 0 .3 .0048937 74.5153 7.78 1.91 1.82 0 .3 .0048937 6O.5
13
was dispersed in normal sodium a ceta te a t 4o°C ., c r y s ta ls formed as the
temperature reverted to room temperature* The i s o e le c t r ic point o f th is
fr a c tio n , pH 5*5, was determined by t itr a tio n *
C rysta llin e g lob u lin was recovered from fresh tomato Juice by Car
penter (Ug). The Juice was concentrated to a syrup (35-40 percent) by
freez in g out the water* I t was then subjected to d ia ly s is and an amor
phous p r e c ip ita te formed in the cellophane sac* The g lob u lin was d is s o l
ved in molar sodium ch loride a t *jO°C. and when f iv e volumes o f water at
50° were added, p re c ip ita tio n occurred* A fter standing at 0°G. fo r 48
hours, the g lob u lin was found to be cry sta llin e*
A carefu l study o f the l ite r a tu r e i s important in order that we
b u ild fo r the future on the broad foundation o f past experience. At
present i t i s s t i l l necessary to treat p lant p roteins as a g r o u p * The
next phase o f in v estig a tio n may reveal how they can be treated as in d i
v id u a ls , that i s , as s p e c if ic substances*
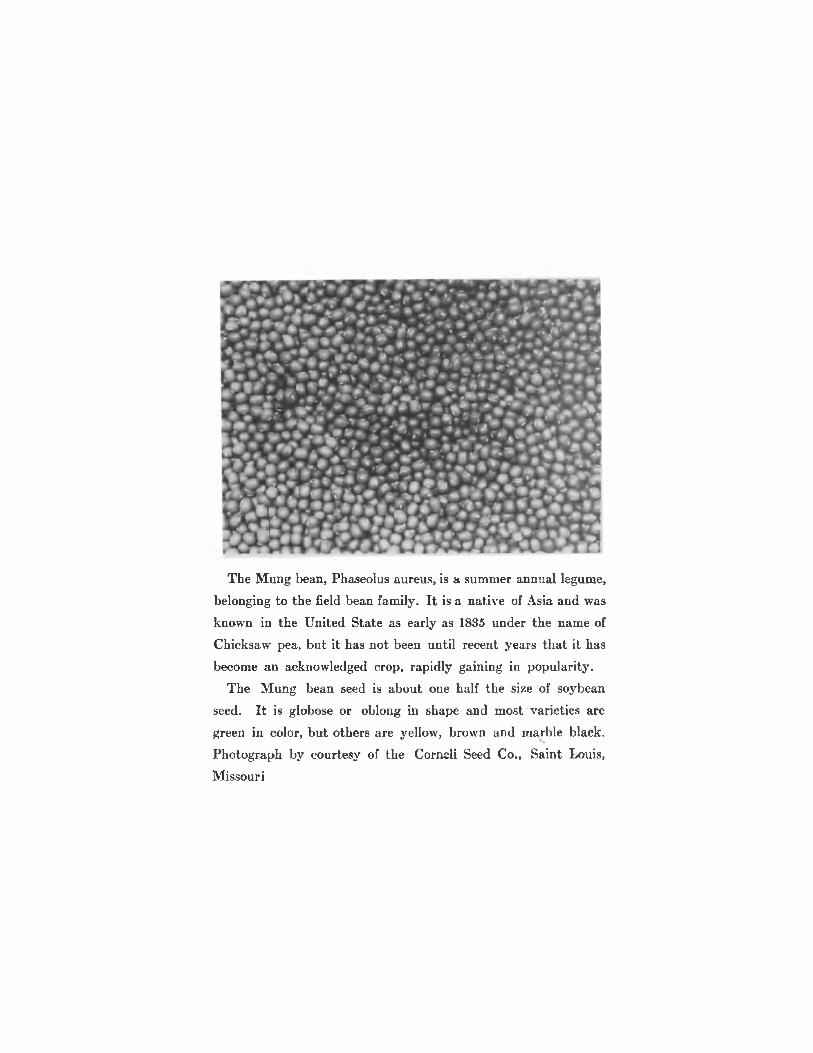
The Mung bean, Phaseolus aureus, is a summer annual legume, belonging to the field bean family. I t is a native of Asia and was
known in the United State as early as 1835 under the name of
Chicksaw pea, but it has not been until recent years tha t it has become an acknowledged crop, rapidly gaining in popularity.
The Mung bean seed is about one half the size of soybean
seed. I t is globose or oblong in shape and most varieties are green in color, but others are yellow, brown and marble black.
Photograph by courtesy of the Corncli Seed Co., Saint Louis,
Missouri
15
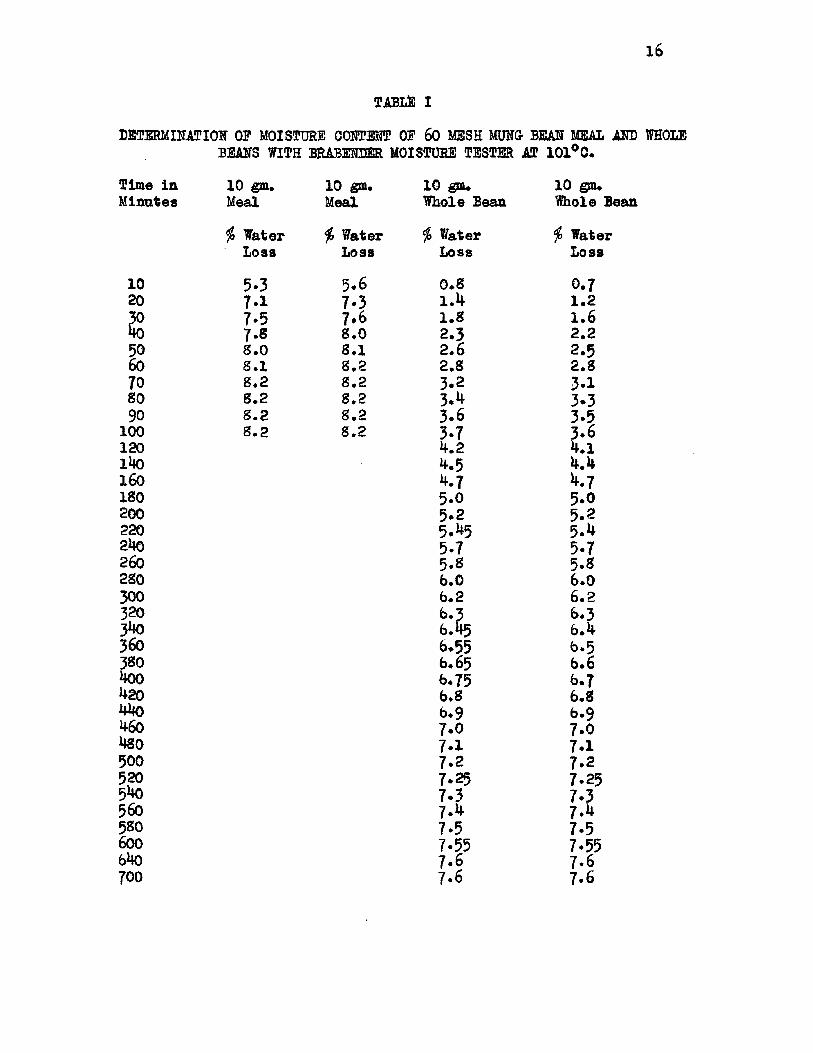
THE MATERIAL
The seeds* used in these experiments were ground to pass through
a 60 mesh sieve* A fter grinding, the meal was thoroughly mixed so that
uniform a liq u o ts could he obtained*
The meal was analyzed fo r m oisture, ash, to ta l n itrogen, l ip id e
and crude f ib e r , as described in the methods o f a n a ly sis (3 0 ), with
some m odifications as noted below*
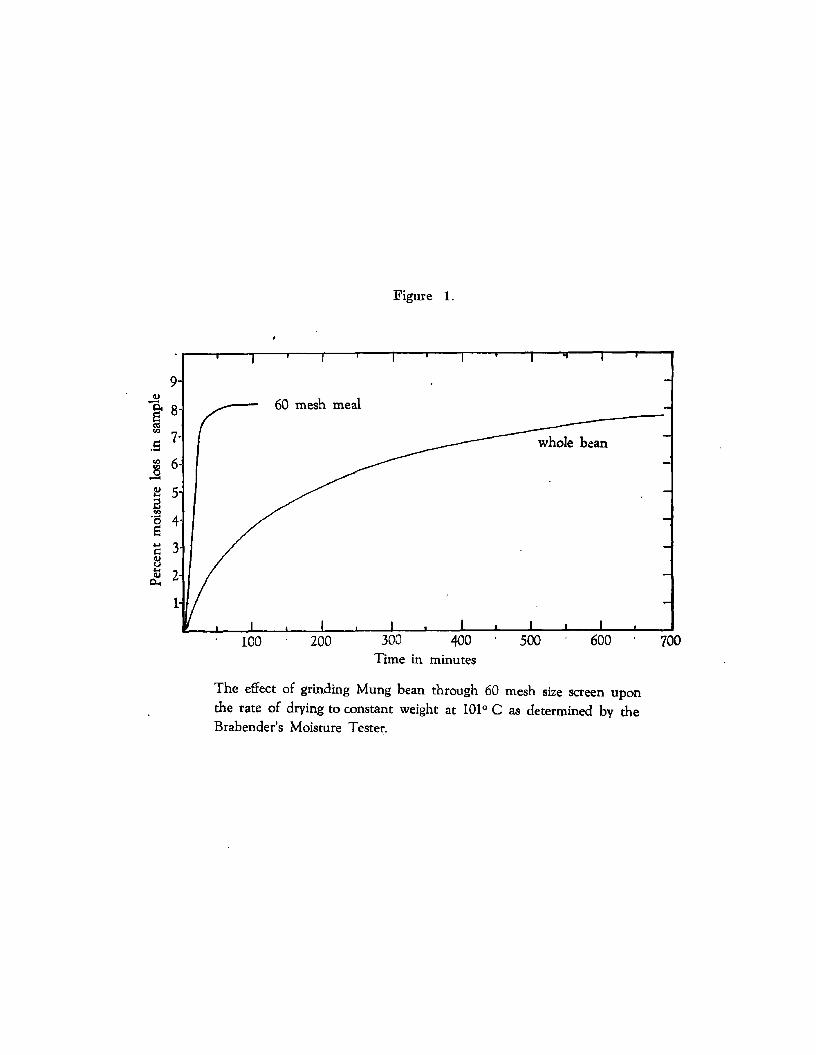
f o r the moisture determination 10 gram samples were dried a t 101°G«
to constant weight w ith a Brabender's moisture tester* I t was found that
the ground meal contained 8*20 percent water (Table 1 and f ig u re l ) .
In the determination o f the ash content (5 l)» 5*000 gram samples
o f meal were put in to each o f four weighed and marked poreela in cru c ib les .
The samples were charred over an open flame under a hood, and then trans*
ferred to an e le c t r ic furnace and heated a t 650°C. u n t i l a l l carbon was
oxidized* The cru cib les and contents were cooled in a d esiccator and
then weighed* The average ash content for the four samples was 3*098
percent (Table 2 ) .
♦The seeds were supplied by courtesy o f the Johnston Seed Company, Enid,
Oklahoma* The sample used was Johnston Jumbo type of the 19I+S crop and
had not been processed in any way and were in th e ir natural s ta te when
received* The seeds were brigh t in color and f u l ly matured*
16
TABLE I
DETERMINATION OF MOISTURE CONTENT OF 60 MESH MUNG BEAN MEAL AND TOOLE BEANS WITH BRABENEER MOISTURE TESTER AT 101°C.
Time in 10 gm. 10 gm. 10 gm. 10 gm.Minutes Meal Meal Whole Bean Whole B
$ Water $> Water $ Water $ WaterLoss Loss Loss Loss
10 5-3 5.6 0.8 0.720 7*1 7 .3 1 .4 1 .2?° 7*5 7 .6 1 .8 1 .64o 7.8 S.O 2.3 2 .250 s .o S .l 2 .6 2 .560 s . l 8 .2 2.8 2.870 8.2 8 .2 3 .2 3 .1so 8 .2 8.2 3.4 3 .390 8 .2 8.2 3 .6 3 .5
100 8 .2 8.2 3.7 3.6120 4 .2 4 .11*10 4.5 4 .4160 4.7 4 .7ISO 5 .0 5.0200 5 .2 5 .2220 5.45 5 .42*10 5.7 5.7260 5.8 5.S280 b.0 6 .0300 6 .2 6 .2320 6 .3 6.33lK) 6.45 6 .4360 6.55 6.53S0 6.65 6 .6400 fe.75 6.7420 6.8 6.844o 6.9 6.9460 7 .0 7.0480 7.1 7 .1500 7 .2 7 .2520 7.25 7.25540 7 .3 7 .3560 7 .4 7*4580 7.5 7.5600 7.55 7*5564o 7 .6 7*6700 7.6 7.6
Perc
ent
moi
sture
los
s in
Figure 1.
60 mesh meal
whole bean
300 400 600 700500200100Time in minutes
The effect of grinding Mung bean through 60 mesh size screen upon the rate of drying to constant weight at 101° C as determined by the Brabender’s Moisture Tester.
IS
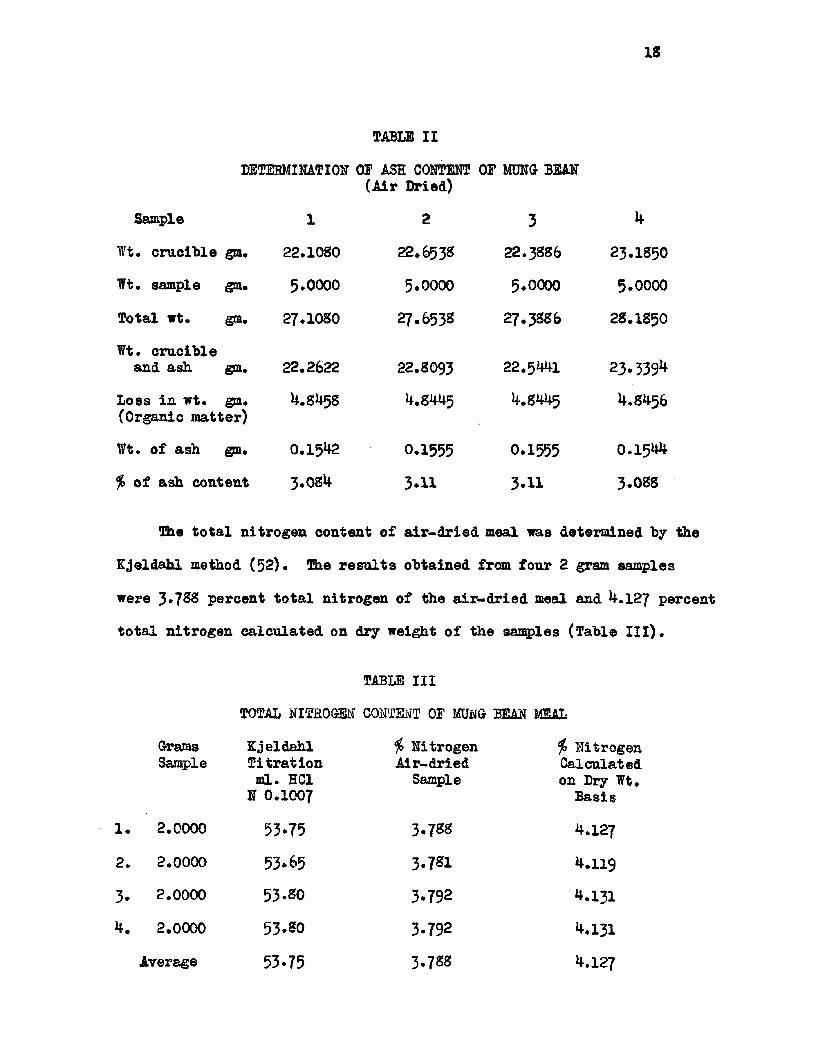
TABLE II
DETERMINATION OP ASH CONTENT OP MUNG BEAN (A ir Dried)
Sample 1 2 3 4
Wt. cru cib le gm. 22.1080 22.653S 22. 38S6 23.1850
Wt. sample gm. 5*0000 5*0000 5.0000 5.0000
Total wt. gm. 27.10S0 27.6538 27.3886 28.1850
Wt. cru cib le and ash gm. 22.2622 22.8093 22.5441 23.3394
Loss in w t. gm. (Organic matter)
4.8458 4.8445 4.8445 4.8456
Wt. o f ash gm. 0 . 15^2 0.1555 0.1555 0.1544
$ o f ash content 3*084 3*11 3*11 3.088
The to ta l n itrogen content o f a ir -d r ie d meal was determined by the
K jeldahl method (52) • The r e su lts obtained from four 2 gram samples
were 3*788 percent to ta l nitrogen of the a ir -d r ie d meal and 4.127 percent
to ta l n itrogen ca lcu lated on dry weight o f the samples (Table I I I ) .
TABLE III
TOTAL NITROGEN CONTENT OP MUNG BEAN MEAL
GramsSample
Kjeldahl T itra tio n
ml. HC1 N 0.1007
io Nitrogen A ir-dried
Sample
$ Nitrogen Calculated on Dry Wt.
B asis
1 . 2.0000 53*75 3*788 4.127
2 . 2.0000 53*65 3*781 4.119
3 . 2.0000 53*80 3*792 4.131
4 . 2.0000 53*80 3*792 4.131
Average 53*75 3*788 4.127
19
The lip id e content o f Mung bean meal was determined. Four 10 gram
samples (weighed to w ithin 0 .1 mg.) o f 60 mesh meal were extracted with
125 ml. 95$ ethanol in a Soxhlet Extractor over the aluminum shaving
bath at 100°C. This was follow ed by a 10 hour extraction with eth y l
ether and then another 10 hour extraction with 125 ml. o f 95$ ethanol.
The combined ex tra cts were evaporated to dryness and the residue was
exh au stively extracted with petroleum ether as described by D il l (53)*
Table IT shows the average value o f 0.809 percent l ip id e content.
TABLE IV
DETERMINATION OF LIPIDE CONTENT OF MUNG BEAN MEAL BY SOXHLET EXTRACTOR USING 10.0 GRAM SAMPLES
Sample 1 2 3 4
Wt. o f beaker gm. 41,8234 47.5004 45.7700 50.5056
Wt. b eak er/lip id e 41.904$ 47,5816 45.8510 50.5356gm.
Wt. o f l ip id e gm. 0.0815 0.0812 0.0810 0.0800
The f ib e r content o f Mung bean meal was determined on four 2-gram
samples o f a ir -d r ie d meal (Table T ). The procedure (5*0 i s ou tlin ed
as fo llow s:
1 . A th in layer o f asbestos was prepared in the bottom o f a Goochcru cib le connected to a f i l t e r f la s k . Water was added to thecru cib le to make a uniform and firm la y er o f a sb esto s.
2 . Two grams o f a ir -d r ie d sample were weighed on a p iece o f paper and introduced in to the cru cib le .
3* The sample was washed tw ice with 10 ml. hot 95$ ethanol to remove the m oisture and some o f the l ip id e .
h. The sample was washed once with cold ethanol to bring the temperature down to room temperature and washed again tw ice with 10 ml* eth y l ether to remove the major portion o f l ip id e .
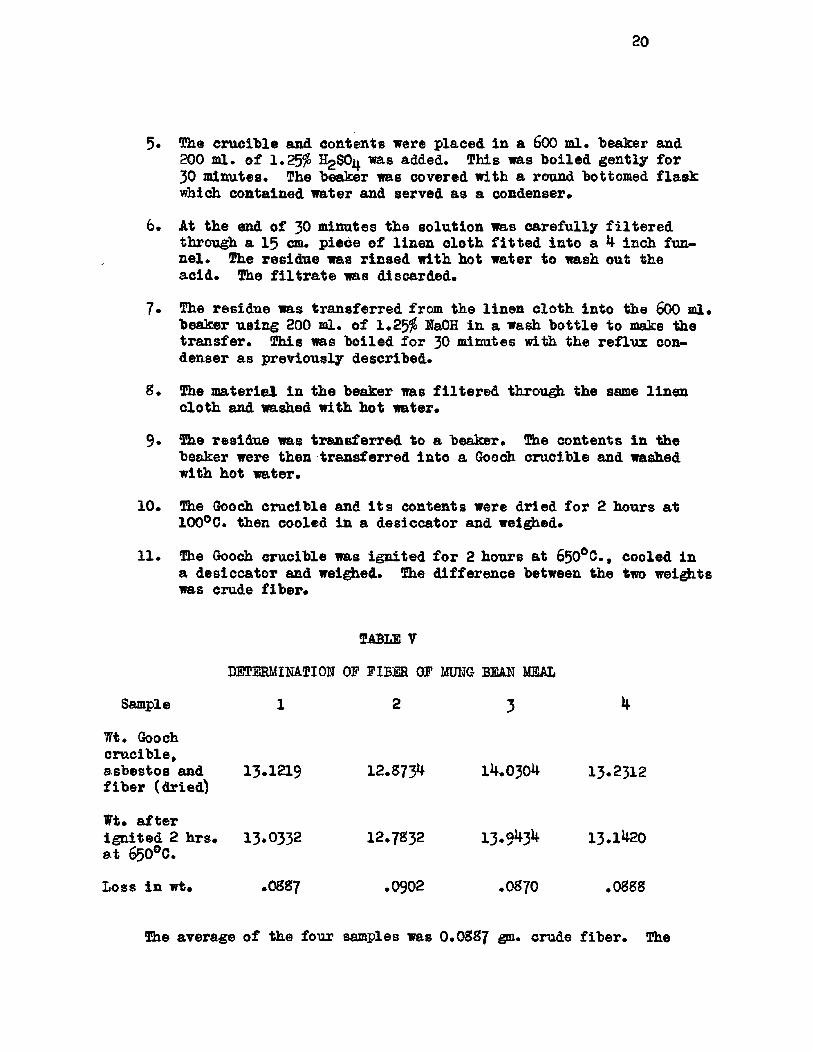
20
5 * The cru cib le and contents were placed in a 600 m l. beaker and200 ml. o f 1.25^ H2S0i|. was added. This was b o iled g en tly for 30 m inutes. The beaker was covered with a round bottomed f la s k which contained water and served as a condenser*
6. At the end o f 30 minutes the so lu tion was ca re fu lly f i l t e r e dthrough a 13 cm. p iece o f lin en c lo th f i t t e d in to a 4 inch funn e l . The residue was rin sed w ith hot water to wash out the a c id . The f i l t r a t e was discarded*
7* The residue was transferred from the lin e n c lo th in to the 600 ml*beaker u sin g 200 ml. o f 1.25$ UaGH in a wash b o tt le to make the tra n sfer . This was b o iled for 30 minutes with the re flu x condenser as previously described.
8 * The m aterial in the beaker was f i l t e r e d through the same lin enc lo th and washed with hot water*
9* The residue was transferred to a beaker. The contents in thebeaker were then transferred in to a Gooch cru cib le and washed with hot water*
10* The Gooch cru cib le and i t s contents were dried fo r 2 hours a t100°C. then cooled in a desiccator and weighed.
11. The Gooch crucib le was ig n ited fo r 2 hours at 650°C., cooled ina d esiccator and weighed. The d ifferen ce between the two weights was crude fiber*
TABLE V
DETERMIEATIOH OF FIBER OF M03JG BEAU MEAL
Sample 1 2 3 4
Wt. Gooch cru c ib le ,asb estos and 13*1219 12.8734 14.0304 13.2312f ib e r (dried)
Wt* a fte rig n ite d 2 hrs* 13*0332 12. 7S32 13*9434 13.1420a t 650°C.
Loss in wt. .0887 .0902 .0870 .0888
The average o f the four samples was O.OS87 gm. crude f ib e r . The
21
average percentage o f cru.de f ib e r on the a ir -d r ie d sample was 4.435#.
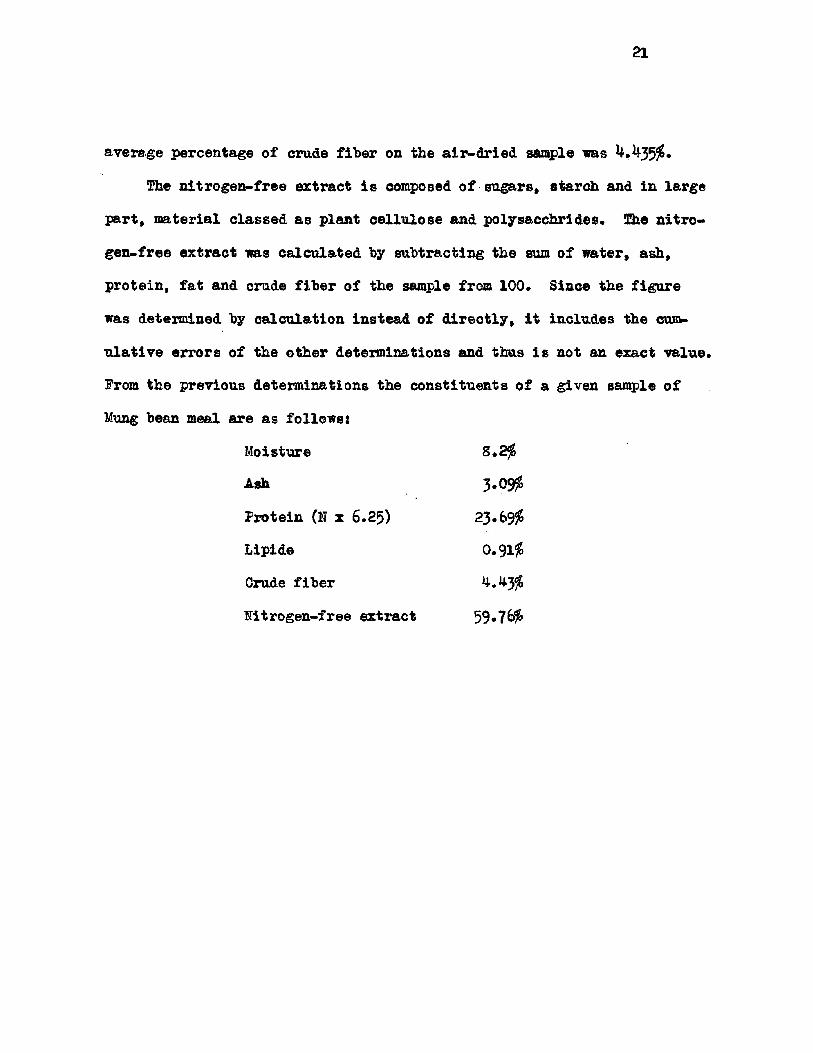
The n itro g en -free extract i s composed o f sugars, starch and in large
part, m aterial c la ssed as p lant c e llu lo se and polysacchrides. The n itro
gen -free ex tract was ca lcu la ted by subtracting the sum o f water, ash,
p rotein , fa t and crude f ib e r o f the sample from 100* Since the fig u re
was determined by ca lcu la tio n in stead o f d ir e c t ly , i t includes the cum
u la t iv e errors o f the other determ inations and thus i s not an exact value*
From the previous determ inations the con stitu en ts o f a given sample o f
Mung bean meal are as fo llow s:
Moisture 8 * 2#
Ash 3 * 0 $
Protein (N x 6 . 25) 23.69#
Lipide 0*91#
Crude f ib e r 4.^3#
N itrogen-free extract 59-76#
22
EXTRACTION
A survey o f the lite r a tu r e revealed important information ah out
the a ctio n o f certa in s a lt s on the p ep tiza tion of seed p roteins ( 29) (40)
(42) and some fa c to r s which e f fe c t p ep tiza tion ( 31) (4 l) (4 6 ). The
author's a tten tio n has been focused on a more system atic in v estig a tio n
o f th is f i e ld o f study. I t became apparent that the fundamental r e la tio n
ship between the s o lu b il i ty o f the Mung bean protein and the nature and
amount o f s a lt content o f the so lvent must f i r s t be studied in d e ta i l .
E xtraction o f the Mung bean p rotein , expressed as to ta l n itrogen ,
from (60 mesh) Mung bean meal with various concentrations o f ch lo r id es,
s u lfa te s , phosphates and carbonates o f sodium and potassium was carried
out and the r e su lts o f these ex traction s have been reported in terms o f
percent o f to ta l n itrogen extracted and have been p lo tted against -pp.,
the negative logarithm of the io n ic strength of the so lv en t.
The s a lt s c .p . used fo r ex traction are as fo llow s:
NaCl Na SOij. NagHPO NagSO^
KC1 KgSO KgHFO KgCO
One l i t e r o f a one molar so lu tio n was made o f each o f the above s a lt s
a t 25°C. as stock so lu tio n s . Molar so lu tion s o f HC1 and NaOH were a lso
made fo r purposes o f comparison. Appropriate d ilu tio n s o f these molar
so lu tio n s were made a t 25°C. to prepare M/10, M/100 and M/lGOO so lu tio n s .
METHOD.- 1 . F ive grams o f the a ir -d r ie d 60 mesh Mung bean meal previously
described was ca re fu lly weighed and introduced in to a 250 ml. cen trifu ge
23
b o ttle* Twelve g la ss beads were added as ag ita tors*
2. F if ty ml* o f the desired concentration o f so lvent were added to the
reaction b o t t le . The sam ple-solvent weigh t-volume r a tio was thus 1:10*
E xtraction con sisted o f shaking a t a low speed (120 o s c il la t io n s per min
u te) fo r exactly 30 m inutes. Six b o tt le s were placed a t one time in a
s ix -h o le wooden block mounted on the shaking machine.*
3* At the end o f 30 minutes the b o tt le s were removed from the shaker
and immediately centrifuged fo r 15 minutes a t 2000 r.p .m . The s o lid
m aterial was packed in the bottom o f the b o tt le s and the clear liq u id
ex tra c ts were poured in to Kjeldahl f la sk s fo r to ta l n itrogen determina
tio n s ( 52) .
The r e su lts obtained from the to ta l nitrogen determ ination were
ca lcu la ted in terms o f percentage o f n itrogen extracted per to ta l n itro
gen content o f sample. C alculations were reported on the dry weight
b asis* In order to determine the percentage of n itrogen extracted per
to ta l nitrogen content o f the sample, a s e r ie s o f determ inations were
made in each case on the extract and in the case o f were a lso
made on the corresponding resid u es.
A ll the ex traction s were conducted a t room temperature which was
approximately 25°C. However, the exact room temperature was recorded
on the date when the experiment was done. The so lu tio n s were made to
volume at 25°C. in a water bath.
*Cenco-Meinzer Laboratory Shaker
2h
The r e su lts o f th ese extraction are shown in Tables VI through
XIX and in Figures 2 through 4 . In the ta b les the io n ic strength i s
a lso expressed as the negative logarithm o f the io n ic strength and i s
symbolized by the expression pa*
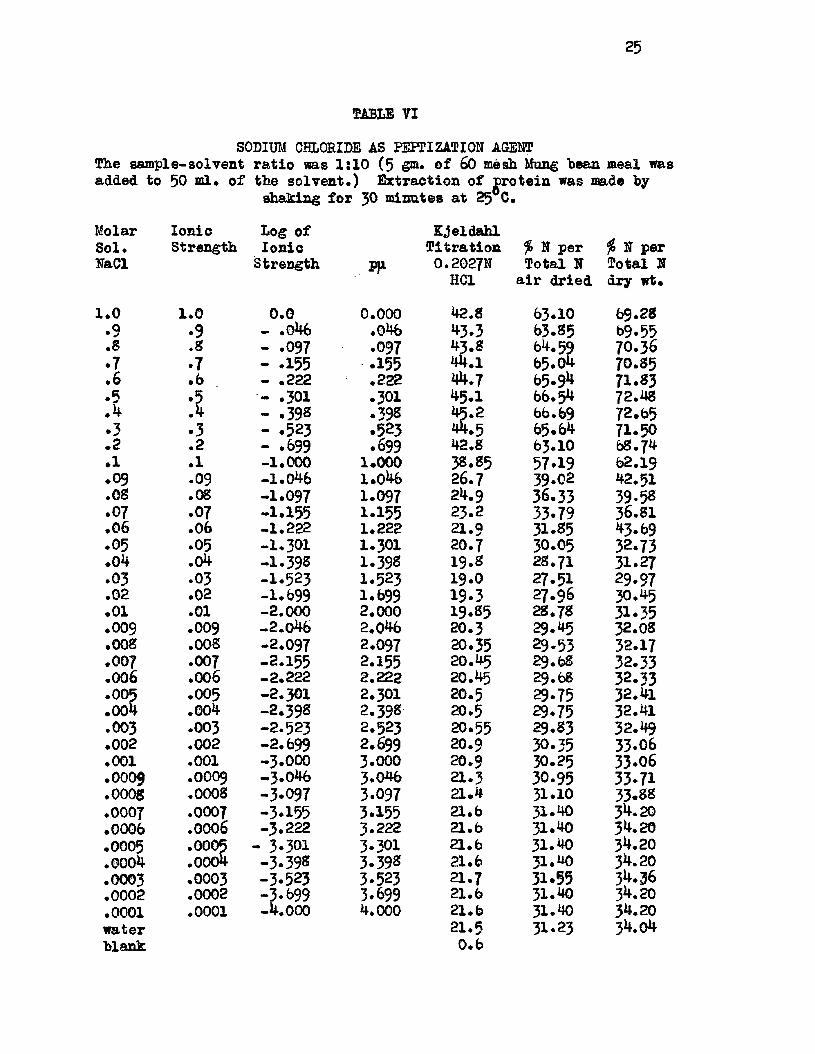
25
TABLE VI
SODIUM CHLORIDE AS PEPTIZATION AGENT The sam ple-solvent r a tio was 1:10 (5 gm. o f 60 mesh Mung bean meal was added to 50 ml* o f the so lv e n t.) E xtraction o f nrotein was made by
shaking fo r 30 minutes a t 25 C.
Molar Ion ic Log o f Kjeldahlj> N perS o l. Strength Ion ic T itra tio n % N per
NaCl Strength IP 0 . 2027NHC1
Total N a ir dried
Total N dry wt.
1 .0 1 .0 0 .0 0.000 42.8 63*10 69.28•9 •9 - .046 .046 43.3 63.85 69-55.8 .8 - .097 .097 43.8 64.59 70.36.7 .7 - .155 .155 44.1 65.04 70.85•6 • 6 - .222 .222 44.7 65*9^ 71.S3*5 .5 - .301 .301 45.1 66.54 72.4$.4 .4 - .39S • 39S 45.2 66.69 72.65*3 • 3 - .523 .523 44.5 65.64 71.50.2 .2 - .699 .699 42.8 63.10 68.74*1 .1 -1 .0 0 0 1.000 38.85 57.19 62.19*09 .09 -1 .0 4 6 1.046 26.7 39.02 42.51.08 .08 -1 .0 9 7 1.097 24.9 36.33 39.5S.07 .07 -1 .155 1.155 23.2 33.79 36.81.06 .06 -1 .2 2 2 1.222 21.9 31.35 43.69.05 .05 - 1.301 1.301 20.7 30.05 32.73.0 4 .04 -1 .39S 1.39S 19. s 28.71 31.27.03 .03 -1 .5 2 3 1.523 19.0 27.51 29.97.02 .02 -1 .699 1.699 19.3 27.96 30.45• 01 .01 -2 .0 0 0 2.000 19.S5 28.78 31.35.009 .009 -2 .0 4 6 2.046 20.3 29.45 32.08•008 .008 -2 .097 2.097 20.35 29.53 32.17.007 .007 -2 .155 2.155 20.45 29.68 32.33.006 .006 -2 .2 2 2 2.222 20.45 29.68 32.33.005 ♦005 - 2.301 2.301 20.5 29.75 32.41.004 .004 -2 .39S 2.398 20.5 29.75 32.41.003 .003 -2 .5 2 3 2.523 20.55 29.S 3 32.49.002 .002 -2 .6 9 9 2.699 20.9 30.35 33*06.001 .001 - 3.000 3.000 20.9 30.25 33.06.0009 .0009 -3 .0 4 6 3.046 21.3 30.95 33.71.000$ .0008 -3 .097 3.097 21.4 31.10 33.S8.0007 .0007 -3 .155 3.155 21.6 31.40 34.20.0006 .0006 -3 .2 2 2 3.222 21.6 31.40 34.20.0005 .0005 - 3.301 3-301 a . 6 31.40 34.20.0004 .0004 -3 .39S 3.39S 21.6 31.40 34.20.0003 .0003 -3 .5 2 3 3.523 21.7 31.55 34.36.0002 .0002 -3 .6 9 9 3.699 21.6 31.40 34.20.0001waterblank
.0001 -4 .0 0 0 4.000 21.621.5
0 .6
31.4031.23
34.20 34.04
26
TABLE VII
POTASSIUM CHLORIDE AS PEPTIZATION AGENT The sam ple-sol rent r a tio was 1:10 (5 gm* o f 60 mesh Mung bean meal was added to 50 ml. o f the so lv e n t.) E xtraction o f p rotein was made hy
shaking fo r 3° minutes a t 25°C.
Molar Ion ic Log o f Kjeldahl$ N per Total N
a ir dried
i> N per Total N dry wt.
S o l.KC1
Strength IoniaStrength
Pji T itra tio n0 . 2072N
HC1
1 .0 1 .0 0 .0 0.000 41.5 61.16 66.62•9 *9 - .046 .046 42.3 62.35 67.92. s .8 - *097 ..097 43.6 64.30 70.04.7 *7 - *155 .155 42.2 65-19 71.02.6 .6 - .222 .222 44.5 65*64 71.50.5 *5 - .301 .301 44.2 65.19 71.02.4 - .398 -.398 44.1 65.04 70.85.3 *3 - *523 .523 43.0 63.40 69.06.2 .2 - .699 *699 41.85 61.68 67*19.1 .1 -1 .0 0 0 1.000 4 i .g 61.60 68.54.09 .09 -1 .0 4 6 1.046 39.S 58.61 63. S5.o s .OS -1 .097 1.097 38.2 56.22 61.24*07 •07 -1 .1 5 5 1.155 36.1 53-08 57.S2.06 .06 -1 .2 2 2 1.222 30.2 44.26 48.21.05 .05 - 1.301 1.301 25.O 36.48 39.75.0 4 .0 4 -1 .39S 1.39S 22.8 33.19 36.16.03 .03 -1 .5 2 3 1.523 21.3 30.95 33.71.02 .02 -1 .699 1.699 19 .4 28.11 32.82.01 .01 -2 .0 0 0 2.000 18.5 26.76 29.15.009 .009 -2 .04b 2.046 I 8 .5 26.76 29.15.QOS .008 -2 .0 9 7 2.097 18.6 26.91 29.32.007 .007 -2 .1 5 5 2.155 18.8 27.24 29.64.006 .006 -2 .2 2 2 2.222 18.9 27.36 29.80.005 .005 - 2.301 2.301 19.3 27.96 30.45.00** .004 -2 .39S 2.39S 19.6 2 8 .4 l 30.94.003 .003 -2 .5 2 3 2.523 20.0 29.OO 31.59.002 .002 -2 ,699 2.699 20.4 29.60 32.24.001 .001 -3 .0 0 0 3. GOO 20.8 30.20 32.90.0009 .0009 -3 .0 4 6 3.046 21.0 30.50 33.22•OOOS .0008 -3*097 3.097 21.1 30.65 33.39.0007 .0007 -3 .1 5 5 3.155 21.1 30.65 33.39.0006 .0006 -3 .2 2 2 3.222 21.2 30.80 33.55.0005 .0005 -3 .301 3.301 a . 2 30.80 33.55.0004 .0004 -3.39S 3.39S 2 1 .3 30.95 33.71.0003 .0003 -3 .523 3.523 21.3 30.95 33.71.0002 .0002 -3 .6 9 9 3.699 21.4 31.10 33.S8.0001
water"blank
.0001 -4 .0 0 0 4.000 21.421.5 0 .6
31.1031.25
33.S834.04
27
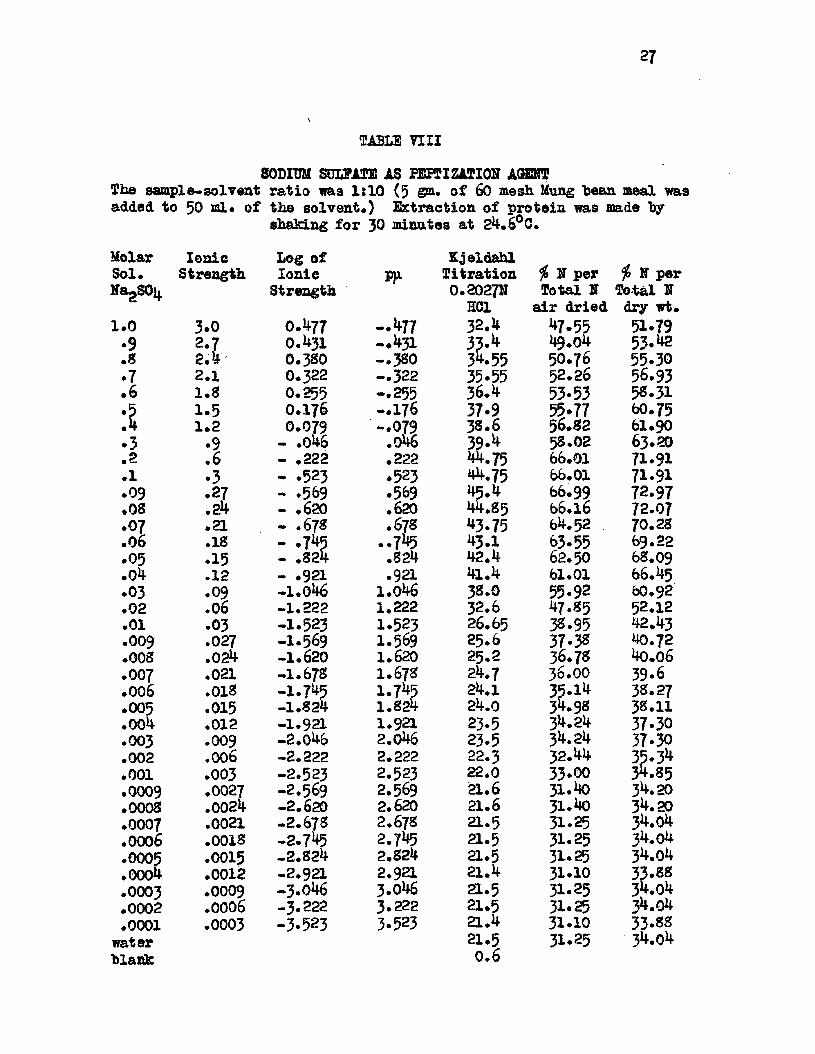
TABLE VIII
SODIUM SULFATE AS PEPTIZATION AGENT The sam ple-solvent r a tio was 1:10 (5 o f 60 mesh Mung heaa meal was added to 50 ml* o f the so lv en t.) E xtraction o f protein was made by
shaking fo r 30 minutes a t 2 4 .6 °C.
Molar Io n ic Log o f K jeldahl# N per # N perS o l. Strength Ion ic pp T itra tion
NagS0ii Strength 0.2027N Total N Total NHca a ir dried dry wt.
1 .0 3 .0 0.477 -.4 7 7 3 2 .4 47.55 51.79•9 2 - 7 0.431 -*431 33 .4 49.04 53-42.3 2 .4 0.380 — 380 34.55 50.76 55.30.7 2 .1 0.322 —322 35.55 52.26 56.93.6 1 .8 0.255 -.2 5 5 36 .4 53.53 58.31.5 1 .5 0.176 —176 37.9 55*77 60.75.4 1 .2 0.079 -.0 7 9 38.6 56.82 61*90•3 •9 - .046 .046 39 .4 58.02 63.20.2 .6 - .222 .222 44.75 66.01 71.91•1 •3 - .523 .523 44.75 66.01 71.91.09 .27 - .569 .569 45 .4 66.99 72.97.OS .2 4 - .620 .620 44.85 66.16 72.07.07 .21 - .678 .678 43.75 64.52 . 70.28•06 .18 • .7^5 ..7 4 5 43.1 63-55 69.22.05 .15 - .824 .824 42 .4 62.50 68.09.0 4 .12 - .921 .921 41.4 61.01 66.45.03 .09 -1 .0 4 6 1.046 38.0 55-92 60.92.0 2 .06 -1 .2 2 2 1.222 32.6 47.85 52.12.01 .03 -1 .523 1.523 26.65 38.95 42.43.009 .027 -1 .569 1.569 25.6 37.3S 40.72.OOS
4"CMO. -1 .6 2 0 1.620 25.2 36.73 40.06.007 .021 -1 .678 I .678 24.7 36.00 39.6.006 .018 - I .745
-1 .8 2 41.745 24.1 35.14 32.27
.005 .015 1.824 24.0 34.98 38.11
.004 .012 -1 .9 2 1 1.921 23*5 34.24 37.30
.003 .009 -2 .0 4 6 2.046 23.5 34.24 37.30
.002 .006 -2 .2 2 2 2.222 22.3 32.44 35.34
.001 .003 -2 .5 2 3 2.523 22.0 33.00 34.85
.0009 .0027 -2 .569 2.569 21.6 31.40 34.20
.oooa .0024 - 2.620 2.620 21.6 31.40 34.20
.0007 .0021 -2 .6 7 8 2.678 21.5 31.25 34.04
.0006 .0018 -2 .745 2.745 21.5 31.25 34.04
.0005 .0015 -2 .8 2 4 2.824 21.5 31.25 34.04
.0004 .0012 - 2.921 2.921 2 1 .4 31.10 33.88
.0003 .0009 -3 .0 4 6 3.046 21.5 31.25 34.04
.0002 .0006 - 3.222 3.222 21.5 31.25 34.04
.0001 .0003 -3 .5 2 3 3.523 21.4 31.10 33.88water 21.5 31.25 34.04blank 0 .6
28
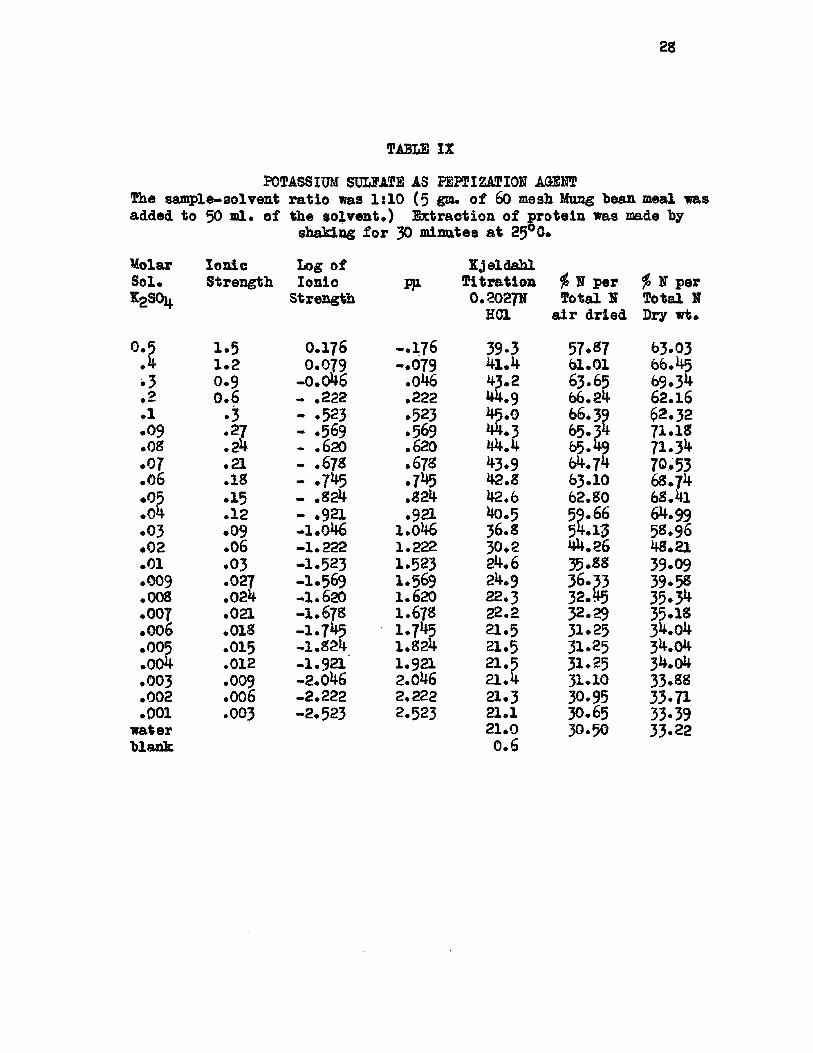
TABLE IX
POTASSIUM SULFATE AS PEPTIZATION AGENT The sam ple-3olvent ra tio was 1:10 (5 gm. o f 60 mesh Mung bean meal wasadded to
Molar
50 m l. o f the so lv e n t.) E xtraction o f p rotein was made by shaking fo r 30 minutes a t 25®C.
Io n ic Log o f K jeldahlS o l.KgSOjj,
Strength Ion icStrength
Pp. T itra tion0 . 2027N
HC1
% N per Total E
a ir dried
7> E per Total E Dry wt.
0 .5 1 .5 0.176 -.1 7 6 39.3 57.87 63.03.4 1 .2 0.079 -.0 7 9 4 1 .4 61.01 66.45.3 0 .9 -0 .0 4 6 .046 43.2 63.65 69.34.2 0 .6 - .222 .222 44.9 66.24 62.16.1 .3 - .523 .523 45 .0 66.39 62.32.0 9 .27 - .569 .569 44.3 65.34 71.18.08 .24 - .620 .620 44 .4 65.49 71.34.07 .21 - .678 .678 43.9 64.74 70.53.0 6 .18 - .745 .745 42.8 63.IO 68.74.05 .15 - .824 .824 42.6 62.80 68.41.0 4 .12 - . 9a .921 40.5 59.66 64.99.03 .09 -1 .0 4 6 1.046 36.8 54.13 58.96.0 2 .06 -1 .2 2 2 1.222 30.2 44.26 48.21.01 .03 -1 .5 2 3 1.523 24.6 35.88 39.09.009 .027 -1 .5 6 9 1.569 24.9 36.33 39.58.008 .024 - 1.620 1.620 22,3 32.45 35.34
. o o —4 .021 -1 .6 7 8 1.678 22.2 32.29 35.18.006 .018 -1 .7 4 5 i.7*<5 21.5 31.25 34.04.005 .015 -1 .8 2 4 1.824 21.5 31.25 34.04.004 .012 - 1.921 1.921 21.5 31.25 34.04.003 .009 -2 .0 4 6 2.046 21 .4 31.10 33.88.002 .006 -2 .2 2 2 2.222 a . 3 30.95 33.71.001
waterblank
.003 -2 .5 2 3 2.523 21.121.00 .6
30.6530.50
33.3933.22
29
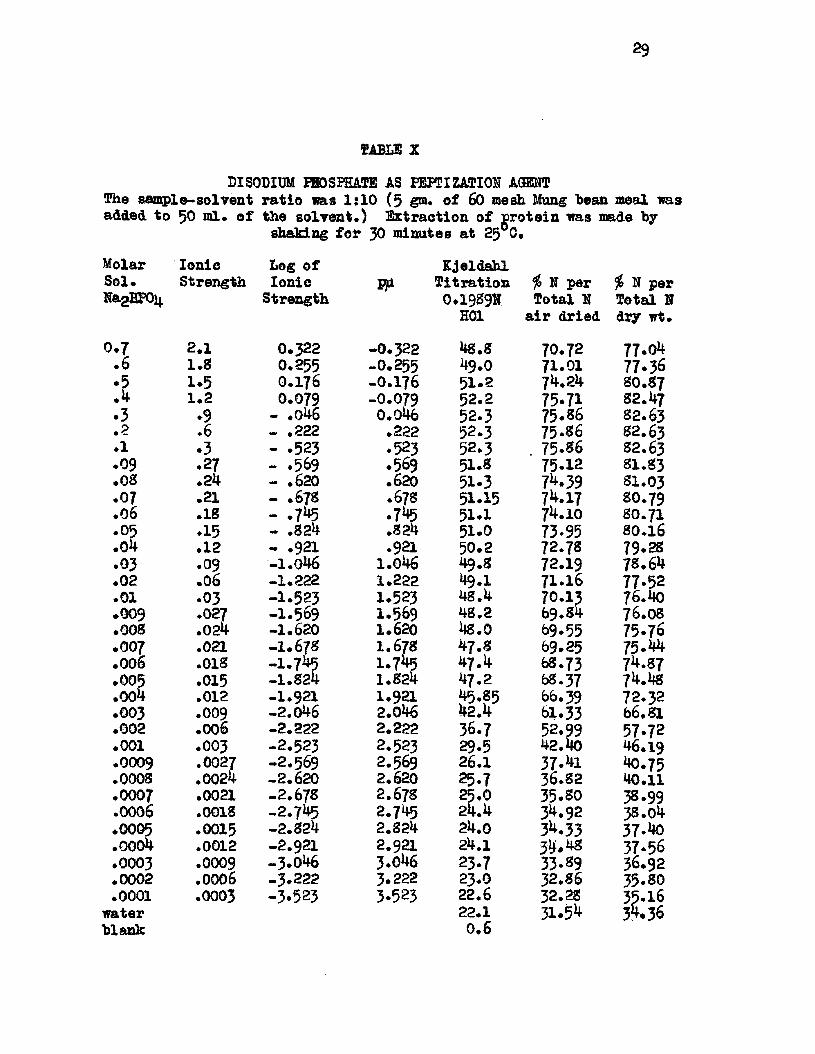
TABLE X
DISODIUM PHOSPHATE AS PEPTIZATION AGENT The sam ple-solvent ra tio was 1:10 (5 gm. o f 60 mesh Mung bean meal was added to 90 m l. o f the so lv en t.) E xtraction o f p rotein was made by
shaking fo r 30 minutes a t 25 C.
Molar Ion ic Log o f Kjeldahl$> N per Total H dry wt*
S o l.HagEPOij.
Strength IonicStrength
P4 T itra tio n0.1989II
HC1
f> N per Total H
a ir dried
0 .7 2 .1 0 .322 -0 .3 2 2 48.8 70.72 77.04• 6 1 .8 0.255 -O.255 49.0 71.01 77.36•5 1 .5 0.176 - 0.176 51 .2 74.24 80.87.4 1 .2 0.079 -0 .079 52.2 75.71 82.47.3 .9 - .046 0.046 52.3 75.86 82.63.2 .6 - .222 .222 52.3 75.86 82.63.1 .3 - .523 .523 52.3 . 75.86 82.63.09 .27 - .569 .569 51.8 75-12 81.83•OS .24 - .620 .620 51.3 74.39 81.03.07 .21 - .678 .678 51.15 74.17 8O.79.06 .18 - .745 •7**5 51.1 74.10 8O.71.05 .15 - .824 .824 51.0 73*95 80.16.0 4 • 12 - .921 .921 50.2 72.78 79.28.03 .09 -1 .0 4 6 1.046 49.8 72.19 78.64.02 •06 -1 .2 2 2 1.222 49.1 71.16 77.52.01 .03 -1 .5 2 3 1.523 48 .4 70.13 76.40.009 .027 -1 .5 6 9 1.569 48 .2 69.84 76.08.008 .024 -1 .6 2 0 1.620 48.0 69.55 75.76.007 .021 - I . 67S 1.678 47 .8 69.25 75.44.006 .018 -1 .745 1.745 4 7 .4 68.73 74.87.005 .015 -1 .8 2 4 1.824 47.2 68.37 74.48.004 .012 -1 .9 2 1 1.921 45.85 66.39 72.32.003 .009 -2 .0 4 6 2.046 42 .4 61.33 66.81.002 .006 -2 .2 2 2 2.222 36.7 52.99 57.72.001 .003 -2 .5 2 3 2.523 29*5 42.40 46.19.0009 .0027 -2 .5 6 9 2.569 26.1 37.41 40.75.0008 .0024 -2 .6 2 0 2.620 25.7 36.82 40.11.0007 .0021 -2 .6 7 8 2.678 25.0 35.80 38.99.0006 .0018 -2 .7 4 5 2.745 2 4 .4 34.92 38.04.0005 .0015 -2 .8 2 4 2.824 24.0 3M 3 37.40.0004 .0012 - 2.921 2.921 24.1 34.48 37.56.0003 .0009 -3 .0 4 6 3.046 23.7 33.89 36.92.0002 .0006 -3 .2 2 2 3.222 23.0 32.86 35.80.0001
waterblank
.0003 -3 .5 2 3 3.523 22,622.10 .6
32.2831.54
35.1634.36
30
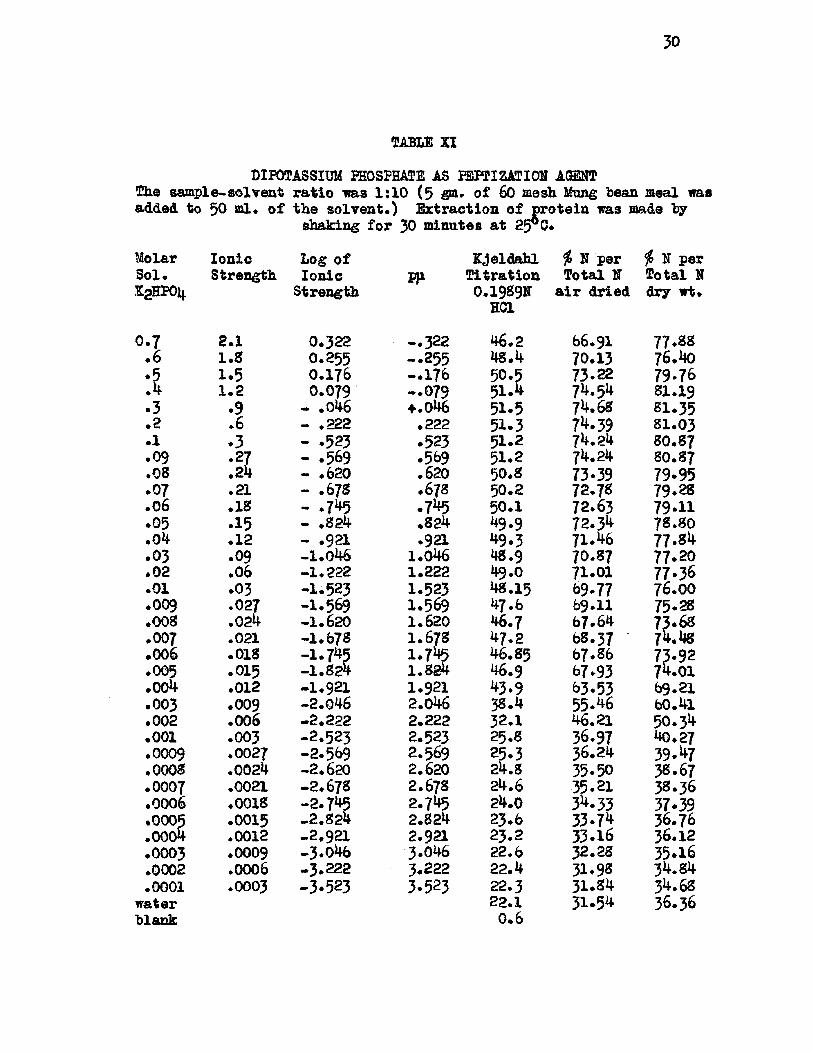
TABLE XI
DIFOTASSIUM PHOSPHATE AS PEPTIZATION AGENT The sam ple-solvent ra tio was 1:10 (5 gm* o f 60 mesh Mung bean meal was added to 50 ml. o f th e so lv en t.) E xtraction o f p rotein was made by
shaking for 30 minutes a t 25 C.
Molar Ion ic lo g o f Kjeldahl # N per N perS o l.K2HPO4
Strength Ion icStrength
P P T itra tion0 . 1989N
HOI
Total N a ir dried
Total N dry wt.
0 .7 2 .1 0.322 —322 46 .2 66.91 77.88• 6 1 .8 O.255 - .2 5 5 48 .4 70.13 76.MO.5 1 .5 0 .176 -.1 7 6 50.5 73.22 79.76.4 1 .2 0.079 -.0 7 9 51 .4 74.54 81.19.3 •9 - .046 +.046 51*5 74.68 81.35• 2 .6 - .222 .222 51*3 74.39 81.03.1 ♦3 - .523 *523 51*2 74.24 80.87.09 •27 - .569 *569 51.2 74.24 80.87.08 .24 - .620 .620 50.8 73*39 79.95.07 .21 - .678 .678 50.2 72*78 79.28.06 .18 - . 7 ^ .745 50.1 72.63 79.11.05 .15 - .824 .824 49.9 72.34 78.80.oh • 12 - .921 • 9 a 49*3 71.46 7 7 .S4.03 .09 -1 .0 4 6 1.046 MS .9 70.87 77.20.02 .06 -1 .2 2 2 1.222 49.0 71.01 77.36.01 .03 -1 .523 1.523 48.15 69-77 76.00.009 .027 -1 .569 1*569 47.6 69.U 75.28.008 .024 - 1.620 1.620 46.7 67.64 73.68.007 .021 -1 .678 1.678 47 .2 68.37 74.48.006 .018 - 1.745 1*745 46.85 67.86 73.92.005 .015 -1 .8 2 4 1.824 46.9 67*93 74.01.oo4 .012 - 1.921 1.921 43*9 63-53 69.21.003 .009 -2 .0 4 6 2.046 38.4 55.46 60.41.002 .006 -2 .2 2 2 2.222 32.1 46.21 50.34.001 .003 -2 .5 2 3 2.523 25.8 36.97 40.27.0009 .0027 -2 .569 2.569 25.3 36.24 39.47.0008 .0024 - 2.620 2.620 24.8 35.50 38.67.0007 .0021 -2 .6 7 8 2.678 24.6 35.21 3S.36.0006 .0018 -2 .7 4 5 2.745 24.0 34.33 37.39.0005 .0015 -2 .8 2 4 2.824 23.6 33.74 36.76.0004 .0012 - 2.921 2.921 23.2 33.16 36.12.0003 .0009 -3 .0 4 6 3.046 22.6 32.28 35*16.0002 .0006 -3 .2 2 2 3*222 2 2 .4 31.9S 34.84.0001
waterblank
.0003 -3*523 3.523 22.322.1
0 .6
31*8431.54
34.6836.36
31
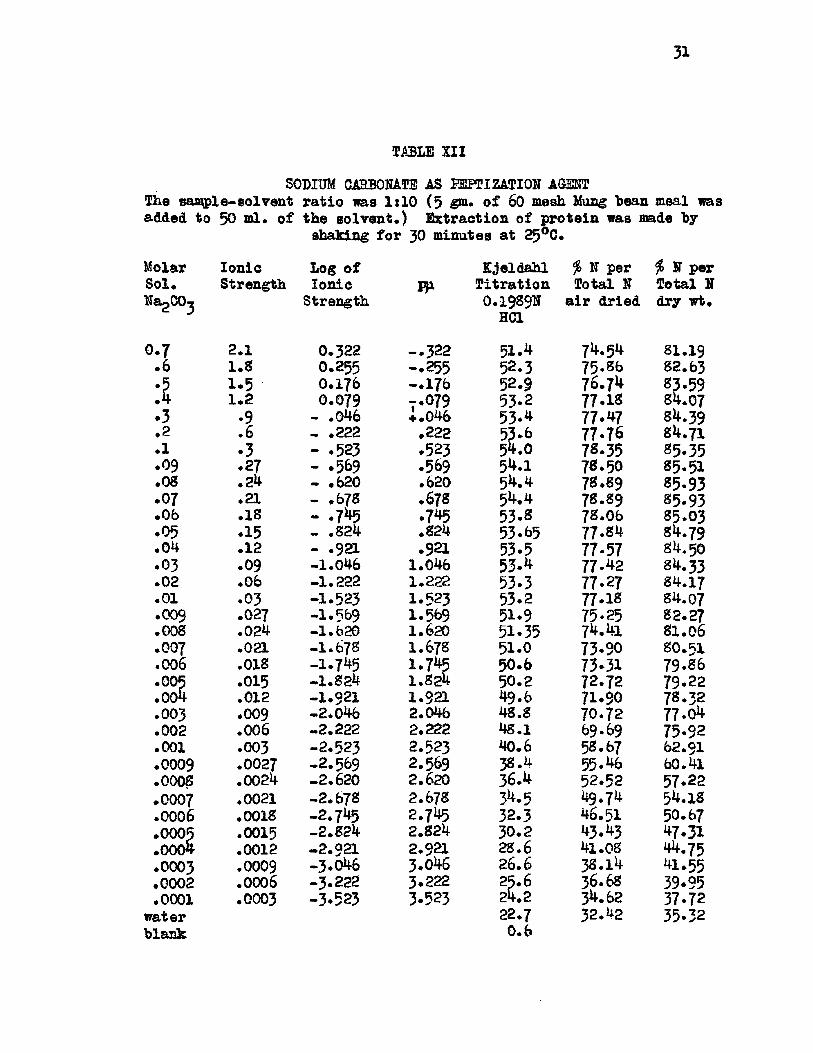
TABLE XII
SODIUM GfiHBONATE AS PEPTIZATION AGENT The sam ple-solvent ra tio was 1:10 (5 o f 60 mesh Mung Lean meal was added to 30 ml. o f the so lv en t.) E xtraction o f p rotein was made by
shaking fo r 30 minutes a t 25°C.
MolarS o l.NagCOj
Ion icStrength
Log o f Ion ic
StrengthVP
KjeldahlT itra tio n0.1989N
HC1
% N per f> N perTotal N Total N
a ir dried dry wt.
0 .7 2 .1 0.322 - .3 2 2 51.4 74.54 81.19• 6 1 .8 0.255 -.2 5 5 52.3 75.8b 82.63•5 1 .5 0.176 - .1 7 6 52.9 76.74 S3.59.4 1 .2 0.079 t .079 53.2 77.13 84.07.3 •9 - .046 i .0 4 6 53 .4 77.47 84.39*2 .6 - .222 .222 53*6 77.76 84.71.1 •3 - .523 .523 54.0 78.35 S5.35.09 .27 - .569 .569 54.1 78.50 85.51.08 .24 - .620 .620 54.4 78.89 S5.93.07 .21 - .678 .678 54.4 78.89 S5-93•Ob .18 - . 7^ .745 53.S 78.06 85.03.05 .15 - .824 .824 53.65 77.84 84.79.0 4 .12 - .921 .921 53.5 77.57 84.50.03 .09 -1 .0 4 6 1.046 53 .4 77.42 84.33.02 .06 -1 .2 2 2 1.222 53.3 77.27 84.17.01 .03 -1 .523 1.523 53.2 77.1S 84.07.009 .027 -1 .569 1.569 51.9 75.25 82.27.008 .024 -1 .6 2 0 1.620 51.35 74.41 81.06.007 .021 -1 .6 7 8 1.678 51.0 73.90 80.51.006 .018 -1 .745 1.745 50 .6 73.31 79.86.005 .015 -1 .8 2 4 1.824 50.2 72.72 79.22.004 .012 - 1.921 1.921 49.6 71.90 78.32.003 .009 -2 .0 4 6 2.046 48.8 70.72 77.04.002 .006 -2 .2 2 2 2.222 48.1 69.69 75.92.001 .003 -2 .5 2 3 2.523 40.6 58.67 62.91.0009 .0027 -2 .5 6 9 2.569 38 .4 55.46 60.41.0008 .0024 -2 .6 2 0 2.620 36.4 52.52 57.22.0007 .0021 -2 .6 7 8 2.678 3^.5 49.74 54.18.0006 .0018 -2 .745 2.745 32.3 46.51 50.67*0005 .0015 -2 .8 2 4 2.824 30 .2 43.43 47.31.0004 .0012 -2 .021 2.921 28.6 41.08 44.75.0003 .0009 -3 .0 4 6 3.046 26.6 38.14 41.55.0002 .0006 -3 .2 2 2 3.222 25.6 36.68 39.95.0001
waterblank
.0003 -3 .5 2 3 3.523 24.222.70 .6
34.6232.42
37.7235.32

32
TABLE XIII
POTASSIUM CARBONATE AS PEPTIZATION AGENT The sam ple-solvent ra tio was Is 10 (5 gm. o f 60 mesh Mung bean meal was added to 50 ®1« o f the so lv e n t.) E xtraction o f p rotein was made by-
shaking for 30 minutes a t 25° G.
Molar Ion ic Log o f Kjeldahl # N per $ N perS ol.EgCOj
Strength IonicStrength
Pp- T itra tion0 . 19S9N
HC1
Total N a ir dried
Total N dry wt.
0 .7 2 .1 0.322 —322 50.0 72.48 78.95.6 1 .8 0.255 -.2 5 5 51.5 74.68 81.35•5 1 .5 0 .176 - .1 7 6 53.0 76.88 83.76.4 1 .2 0.079 -.0 7 9 53.1 77.03 83.91•3 *9 - .046 .046 53 .4 77.47 84.39.2 .6 - .222 .222 53.5 77.62 84.55.1 .3 - .523 .523 54.0 78.35 85*35.09 .27 - .569 .569 54 .2 78.64 85.67.OS .24 - .620 .620 54 .4 78.94 85.99.07 .21 - .678 .67S 54.3 78.79 85.83.0 6 .18 - .745 .745 53.8 78.06 85.03.05 .15 - .824 .824 53*6 77-76 84.71.0 4 .12 - . 9 a .921 53.3 77.32 84.23.03 .09 -1 .0 4 6 1.046 53.0 76.88 83.75.02 .06 -1 .2 2 2 1.222 52.8 76.43 83.26.01 .03 -1 .5 2 3 1.523 52.6 76.30 83.11.009 .027 -1 .569 1.569 52.5 76.15 82.95.008 .024 -1 .6 2 0 1.620 52 .4 76.00 82.79.007 .021 -1 .67S 1.678 52.0 75.42 82.15.006 .018 -1 .745 1.745 51 .6 74.83 81.51.005 .015 -1 .8 2 4 1.824 51.0 73-95 8O.55.004 .012 -1 .921 1.921 50.1 72.63 79.11.003 .009 -2 .0 4 6 2.046 48.8 70.72 77-04.002 .006 -2 .222 2.222 47.3 68.52 74.64.001 .003 -2 .523 2.523 41.65 60.23 65.61.0009 .0027 -2 .5 6 9 2.569 39.S 57.51 64.83.0008 .0024 -2 .6 2 0 2.620 38.2 55.17 60.10.0007 .0021 -2 .67S 2.67S 36.5 52.67 57.38.0006 .0018 -2 .745 2.745
2.82433.05 47.61 51.86
.0005 .0015 -2 .8 2 4 31.25 44.97 48.98
.0004 .0012 - 2.921 2.921 30 .4 43.72 47.63
.0003 .0009 -3 .0 4 6 3.046 28.4 40.79 44.43
.0002 .0006 -3 .2 2 2 3.222 26.5 3S.00 41.39
.0001waterblank
.0003 -3 .5 2 3 3.523 24.822.7
0 .6
35.5032.42
38.6735.32
33
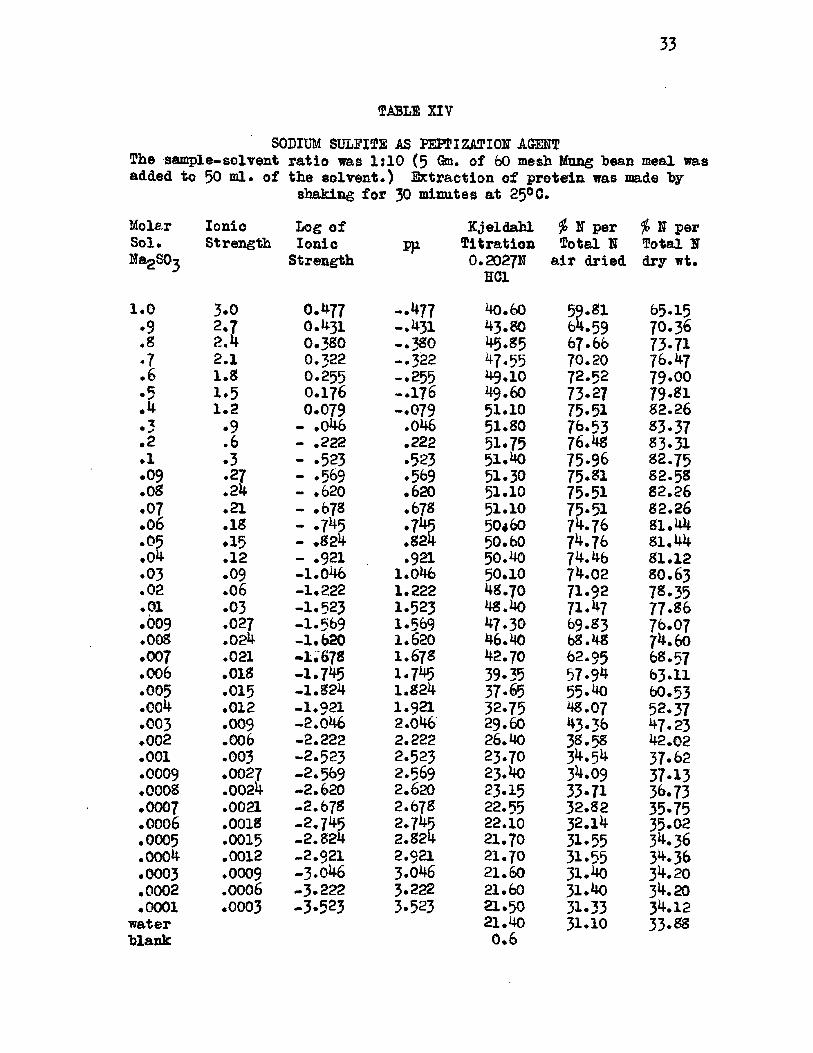
SABLE XIV
SODIUM SULFITE AS PEPTIZATION AGENT The sam ple-solvent ra tio was 1:10 (5 Gm* o f 60 mesh Mung hean meal was added to 50 ml* o f the so lv e n t.) E xtraction o f p rotein was made by
shaking fo r 30 minutes a t 25° C.
Molar Ion ic Log o f Kjeldahl $> N per io N perS o l. Nag SO
Strength Ion icStrength
pji T itra tion0 . 2027N
HC1
Total N a ir dried
Total N dry wt.
1 .0 3 .0 0.477 -.4 7 7 40.60 59.81 65.15•9 O.431 -.4 3 1 43.80 64.59 70.36.8 2 .4 0.380 -.3 8 0 45.85 67.66 73.71*7 2.1 0.322 — 322 47.55 70.20 76.47.6 1 .8 O.255 -.2 5 5 49.10 72.52 79.00•5 1 .5 O.176 -.1 7 6 49.60 73.27 79.81.4 1 .2 0.079 -.0 7 9 51.10 75.51 82.26• 3 •9 - .046 .046 51.80 76.53 83-37.2 .6 - .222 .222 51.75 76.48 83.31.1 .3 - .523 .523 51.40 75.96 82.75.09 .27 - .569 .569 51.30 75.81 82.58.08 .24 - .620 .620 51.10 75.51 82.26.07 .21 - .678 .678 51.10 75.51 82.26.06 .18 - .745 .745 50*60 74.76 81.44.05 .15 - .824 .824 50.60 74.76 81.44.04 .12 - .921 .921 50.40 74.46 81.12.03 .09 -1 .0 4 6 1.046 50.10 74.02 80.63.02 •06 - 1.222 1.222 48.70 71.92 78.35.01 .03 -1 .5 2 3 1.523 48.40 71.47 77.86.009 .027 -1 .5 6 9 1.569 47.30 69. S3 76.07.008 .024 -1 .6 2 0 1.620 46.40 68.48 74.60.007 .021 -1 .678 1.678 42.70 62.95 68.57.006 .018 -1 .745 1.745 39.35 57.94 63.11.005 .015 -1 .8 2 4 1.824 37*65 55-40 6O.53.004 .012 - 1.921 1.921 32.75 48.07 52.37.003 .009 -2 .0 4 6 2.046 29.60 43.36 47.23♦002 .006 -2 .2 2 2 2.222 26.40 38.58 42.02.001 .003 -2 .5 2 3 2.523 23.70 34.54 37.62.0009 .0027 - 2.569 2.569 23.40 34.09 37.13♦0008 .0024 -2 .6 2 0 2.620 23.15 33-71 36.73.0007 .0021 -2 .678 2.678 22.55 32.82 35.75.0006 .0018 -2 .7 4 5 2.745 22.10 32.14 35.02.0005 .0015 -2 .8 2 4 2.824 21.70 31.55 34.36.0004 .0012 -2 .0 2 1 2.921 21.70 31.55 34.36.0003 .0009 -3 .0 4 6 3.046 21.60 31.40 34.20.0002 .0006 -3 .2 2 2 3.222 21.60 31.40 34.20.0001
waterblank
.0003 -3 .5 2 3 3.523 21.5021.40
0 .6
31.3331.10
34.1233.88
34
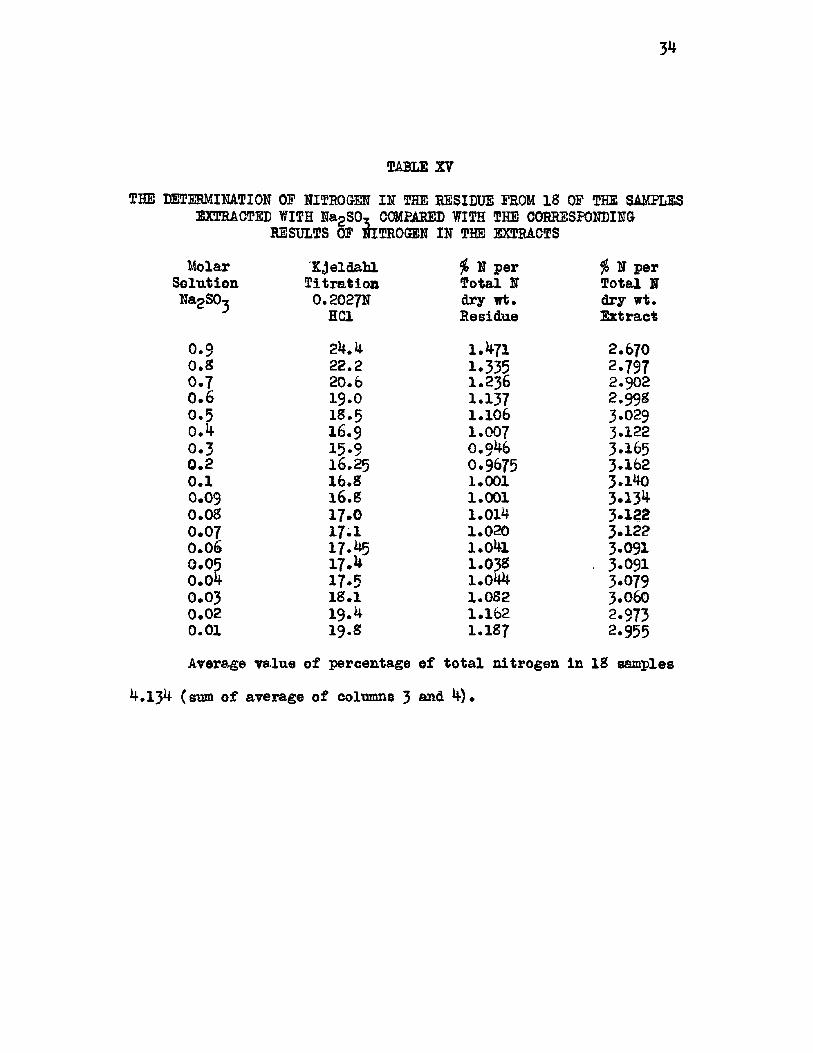
TABLE XV
THE DETERMINATION OP NITROGEN IN THE RESIDUE PROM IS OP THE SAMPLES EXTRACTED WITH Na2S0, COMPARED WITH THE CORRESPONDING
RESULTS OP NITROGEN IN THE EXTRACTS
MolarSolutionNa2S03
0 .9O.SO.T0.60 .50 .40 .30 .20 .10.090.0s0.070 .0 60.050 .0 40.030 .020.01
KjeldahlT itra tio n
0.2027NHC1
24 .4 22.2 20.6 19.01 5 .516.915*916.2516.816.817 .017.1 17.4517 .417.518.119 .419. 5
$ N per Total N dry wt. Residue
1.4711.335I .2361.1371.1061.0070.9460.96751.0011.0011.0141.0201.0411.03S1.0441.0821.1621 . I 87
$ N per Total N dry wt. Extract
2.6702.7972.9022.9983.0293.1223.1653.1623*1403*1343.1223.1223.0913.0913.0793.O6O2.9732.955
Average value o f percentage o f to ta l n itrogen in 18 samples
4 .134 (sum o f average o f columns 3 *®d. 4 ) .
Fig
ure
ocS
O
oo
oo or- \o
p3]DBj]X3 uaSoaqiu |E]0 3 jo quacusj
oiT> oOOoo
pp
(the
-log
of ion
ic st
reng
th)
The
effec
t of
vary
ing
ionic
stren
gth
as co
ntrib
uted
by
diffe
rent
sa
lts
upon
the
pe
ptiza
tion
of
prot
ein
N fro
m M
ung
bean
. Th
e ne
gativ
e log
arith
m
or pp
, is
plot
ted
vs am
ount
ex
trac
ted.
o
o
o'OpajDBXjxo uaSojjiu jbjoj _jo juaojaj
om orno
pa (th
e -lo
g of
ioni
c st
reng
th)
This
figur
e sh
ows
the
effec
t of
ionic
stren
gth
as co
ntrib
uted
by
solu
tions
of
the
salts
N
aCl,
KC1,
NaaS
Oi
and
K2S
O1
upon
pe
ptiza
tion
of M
ung
bean
pr
otein
at
25°
C.
i f
TABEE XVI
HYDROCHLORIC ACID AS PEPTIZATION AGENT The sam ple-solvent r a tio was 1:10 ( 5 gm* o f 60 mesh Mung bean meal was added to 50 ml* o f the so lv e n t .) E xtraction o f p rotein was made by
shaking fo r 30 minutes a t 25®C.
No. Molar Kjeldahl $ N per $ N perS olu tion T itra tio n Total N Total NHC1 0.19S9N
EC1a ir dried dry wt.
1 . 0 .7 36 .3 52.384 57.0632 . 0 .6 37.1 53.558 58.3423 . 0 .5 38.1 55*024 59.9394 . 0 .4 39.2 56.639 61.6985 . 0 .3 40.5 5S.547 63.7766 . 0 .2 4 2 .2 61.039 66.4917» 0 .1 43.8 63-3S7 69.0498 . 0 .09 44.3 64.122 69.84§9 . 0.08 44.0 63.682 69.37010. 0.07 43.0 62.214 67.77111. 0 .06 40.1 57.959 63.13612. 0 .05 31.2 43.431 47.31013. 0 .04 l4 .1 24.688 26.893l4 . 0 .03 6 .9 9.242 10.06715. 0 .0 2 6 .8 9.095 9.90716. 0 .01 7 .6 10.270 11.18717. 0.009 7.S 10.562 11.50518. 0.008 8 .0 10.857 11.82619. 0.007 8 .6 11.737 12.78520. 0 .006 8 .8 12.030 13.10421. 0.005 10.1 13.93S 15. I 8322. 0 .004 11.9 16.5SO 18.06123. 0.003 13*1 18.340 19.97824. 0.002 13.9 19.515 21.25825. 0.001 17.3 24.503 26.69126. 0.0009 18.0 25.503 27.78027. 0.0008 1 8 .6 26.410 28.76928. 0.0007 18.5 26.263 28.60929. 0.0006 19 .6 27.S75 30.36530. 0.0005 19.8 28.171 30.36531. 0 .0004 20.6 29.346 31.96732. 0.0003 21.1 30.078 32.76433* 0.0002 21.3 30.373 33.08634. 0.0001 22.4 31.986 34.84335. fa te r 22.9 32.721 35.64336. blank 0 .6
33
TABLE XVII
SODIUM HYDROXIDE AS PEPTIZATION AGENT The sam ple-solvent r a t io was 1:10 (5 g®. o f 60 mesh Mung bean meal was added to 50 »1 . o f the so lv e n t.) E xtraction of p rotein was made by
shaking fo r 30 minutes a t 25 C.
No. Molar Kjeldahl $ N per $> H perSolution T itra tion Total H Total HNaOE 0.1989H a ir dried dry wt.
HOI
1 . 0 .1 57 .0 82.758 90.1502. 0 .09 57.0 82.758 90.1503 . 0.08 57-0 82.75S 90.1504. 0 .07 55.9 81.143 88.3915- 0.06 55.9 81.143 88.3916. 0 .05 54.8 79.530 86.6347. 0 .04 54.7 79.333 86.473S. 0 .03 54 .6 79.235 86.2129 . 0 .02 54 .6 79.235 86.21210. 0 .01 51.7 74.980 81.67711. 0.009 51.0 73.952 30.55712. 0.008 51.0 73.952 80.55713. 0.007 51.0 73.952 80.557l4 . 0.006 50.35 72.99S 79.51315. 0.005 49.0 71.017 77*36016. 0 .004 48.5 70.285 76.56317. 0.003 46.8 67.7S7 73.84218. 0.002 39.1 56.492 61.53319. 0.001 28.1 40.351 43.91520. 0.0009 27.7 39*764 43.31621. 0.0008 26.95 38.662 42.11522. 0.0007 25.45 36.462 39.71923. 0.0006 24.85 35-582 33.76024. 0.0005 24.0 34.333 37.39925. 0.0004 23.S 34.041 37.08126. 0.0003 23*2 33.161 36.12327. 0.0002 22.55 32.207 35.08328. 0.0001 22.85 32.647 35*56329. water 21.05 30.007 32.68730. blank 0 .6
39
TABLE XVIII
HYDROCHLORIC ACID AS PEPTIZATION AGENT1.17 gm. NaCI ( f in a l concentration , 0 .4 m) added to each. 5 sample. The sam ple.solvent ra tio was 1:10 (5 gm. o f 60 mesh Mung Lean meal was added to 50 ml. o f the so lv en t.) E xtraction o f protein was made by
shaking fo r 30 minutes a t 25°C.
No. Molar pH o f pH o f Kjeldahl $ N perSolu tion
HC1HC1
SolventExtract T itra tion
O.1989NHC1
Total N dry wt.
1 . 0 .7 0*37 0.38 33.4 51.4212 . 0 .6 0 .43 0.38 34.4 54.024> 0 .5 0 .50 0 .42 35.3 55-4614 . 0 .4 0*59 0 .53 36.1 56.7385 . 0 .3 0 .70 0 .6 4 36.8 57-858b. 0 .2 0 .90 0.90 37.5 58.977T. 0 .1 1.13 I .65 37*7 59.246S. 0 .09 1 .20 1.78 37*9 59.6179 . 0 . 0s 1.23 2.00 38 .4 60.41510. 0 .07 1.33 2.38 37-5 58.97711. 0 .06 1.40 2.78 33.0 51.78512. 0 .05 1.50 3.20 30.0 46.98913. 0 .0 4 1 .64 3.67 27 .4 42.8331*1. 0 .03 1 .72 4.07 25.O 38.99915. 0 .0 2 1.87 4 .48 23.2 36.119lb . 0 .01 2.13 5.00 35*8 56.25917. 0.009 2.18 5.06 36.6 57*539IS . 0 . 00s 2.22 5.10 38.5 6O.57619. 0.007 2.29 5.20 39*8 62.65620. 0 .006 2.33 5.30 41.5 65-37221. 0.005 2.38 5.30 40.8 64.25222. 0 .004 2.50 5.42 42 .4 66.81023. 0 .003 2.63 5.50 42.5 66.97024. 0.002 2.90 5.61 43.7 68.88725. 0.001 3.15 5.71 44 .2 69.68626. 0.0009 3.23 5.7b 44.7 70.48727. 0 . 000s 3*30 5.7b 45.2 71.2842S. 0.0007 3.41 5.7b 44.8 70.64429. 0.0006 3.52 5.7b 44 .6 70.32530. 0.0005 3.68 5.76 44.5 70.16531. 0.0004 3.88 5.80 44 .4 70.00732. 0.0003 4.72 5. so 44.4 70.00733- 0.0002 5.80 5.80 44.4 70.0073*. 0.0001 6.50 5.82 44.4 70.00735. water 7.15 5.82 44.1 69.52836. blank 7.10 5.82 0 .6
4o
TABLE XIX
SODIUM HYDROXIDE AS PEPTIZATION AGENT1 .1 7 gm* NaCI ( f in a l concentration, 0 .4 m) added to each 5 g®* sample* The sample*solvent r a tio was 1:10 (5 gm. o f 60 mesh Mung Lean meal was added to 50 ml* o f the solvent*) E xtraction o f protein was made ’by-
shaking for 30 minutes at 25 C.
No. MolarS olu tionNaOH
pH o fNaOH
Solvent
pH of Extract
KjeldahlT itra tio n
0 . 19S9NHC1
$ N per Total N dry wt.
1 * 0 .1 11.5 10,60 53*4 84.3922 . 0 .09 11 .5 10.52 54.0 85.3503* 0.08 11.54 10.38 54 .0 85.3504 . 0 .07 11.54 10.20 54 .4 85*9915* 0 .0 6 11.54 10.02 53*4 84.392
83.% 36. 0 .05 11.54 9.80 52.87* 0 .0 4 11.52 9.30 52.55 83.031S . 0 .03 11.50 8 .84 52.35 82.7139 . 0 .0 2 11.40 8 .12 51*5 8I .35610. 0 .01 11.28 6*73 50.9 80.39711. 0.009 11.24 6.61 49.8 78.63812. 0.008 11.18 6.50 50.0 78.95613* 0.007 11.08 6.36 48.4 76.39914. 0.006 11.00 6.22 49*3 77*83915* 0.005 10.90 6.16 47*9 75*00116. 0 .004 10.80 6.03 4 7 .4 74.80017. 0.003 10.66 5*93 46.9 74.002IS . 0 .002 10.62 5.88 46.1 72.72219. 0.001 10.42 5*82 46.0 72.56420* 0.0009 10.3S 5*81 45 .3 71.44521. 0.0008 10.30 5*80 45.4 71.60522. 0.0007 10.20 5.80 4 5 .4 71.60523. 0.0006 10.10 5 .80 45.9 72.1J0424. 0.0005 10.00 5*77 45.9 72.4o425. 0.0004 9.88 5*74 46.1 72.72226. 0.0003 9.67 5.7** 46.1 72.72227. 0.0002 9 .20 5.7* 46.1 72.72228* 0.0001 8.20 5 .7 “» 46.1 72.72229.30.
waterblank
6.92 5 . 7^ 4 5 .40 .6
71.605
<L)U3
.SP5
o
ON
VO
ocax<u
XD.
I I I I I I I IO O O O O O O O O O s o o r - \ o v r N ' ! i - c o r ^ ' —i
p933B«X3 usgojjiu JBJO} JO 3US033J
Vario
us
conc
entr
atio
ns
of HC
1 an
d Na
OH
were
us
ed
as pe
ptiza
tion
agen
ts.
The
pH of
the
extr
act
of eac
h co
ncen
trat
ion
was
mea
sure
d an
d pl
otted
vs
the
perc
enta
ge
of to
tal
nitro
gen
extr
acte
d.
42
THE STUDY OF SOME FACTORS WHICH EFFECT THE PEPTIZATION OFMUNG- BEAN PROTEIN
A ll the neutral so lv en ts , su lfa te s and ch lorid es, employed as ex
tr a c tin g agents in th is study have p ep tiza tio n ca p a c itie s that are nearly
equal, J2 percent n itrogen per to ta l n itrogen content (Tables VI, VII,
VIII and IX)* P r a c tic a lly id e n tic a l curves were obtained from sodium
and potassium ch lorid es by p lo tt in g th e ir concentrations versus the per-
dentage o f n itrogen extracted (Figures 2 and 3 ) • I t was very in te r e s t
in g to note that with those two s a l t s the Msteep slop e11 o f the curve was
n early v e r t ic a l . The s ig n ifica n ce of the Rsteep slope" i s se lf-ex p la n
atory: that th is p rotein in such a so lvent has a very narrow s o lu b il i ty
range. Since the s o lu b i l i ty o f NaCI in aqueous so lu tio n has le s s v aria
tio n due to changes in temperature than K&* (53)» sodium ch loride a t a
concentration o f 0 .4 M was considered the more su ita b le p ep tiza tion agent
fo r the study o f Mung bean p ro te in s.
In experiments in volv in g the p ep tiza tion o f Mung bean p rotein , i t
was necessary to standardize the fo llow in g fa cto rs:
A. Time and sam ple-solvent r a t io s "S-S-R"
B. P a r tic le s iz e and sam ple-solvent r a tio s
C. Mechanical shaking, h an d -stirr in g and su ccessive ex traction s
*Gram8 s a lt in 100 grams water
NaCI 35.6 a t 0°C. or 39*6 at 100°C.
KC1 2S.5 a t 0°C. or. 5&**> a t 100°C.
43
D. Temperature and o i l - f r e e and n on -o il free condition o f the
samples
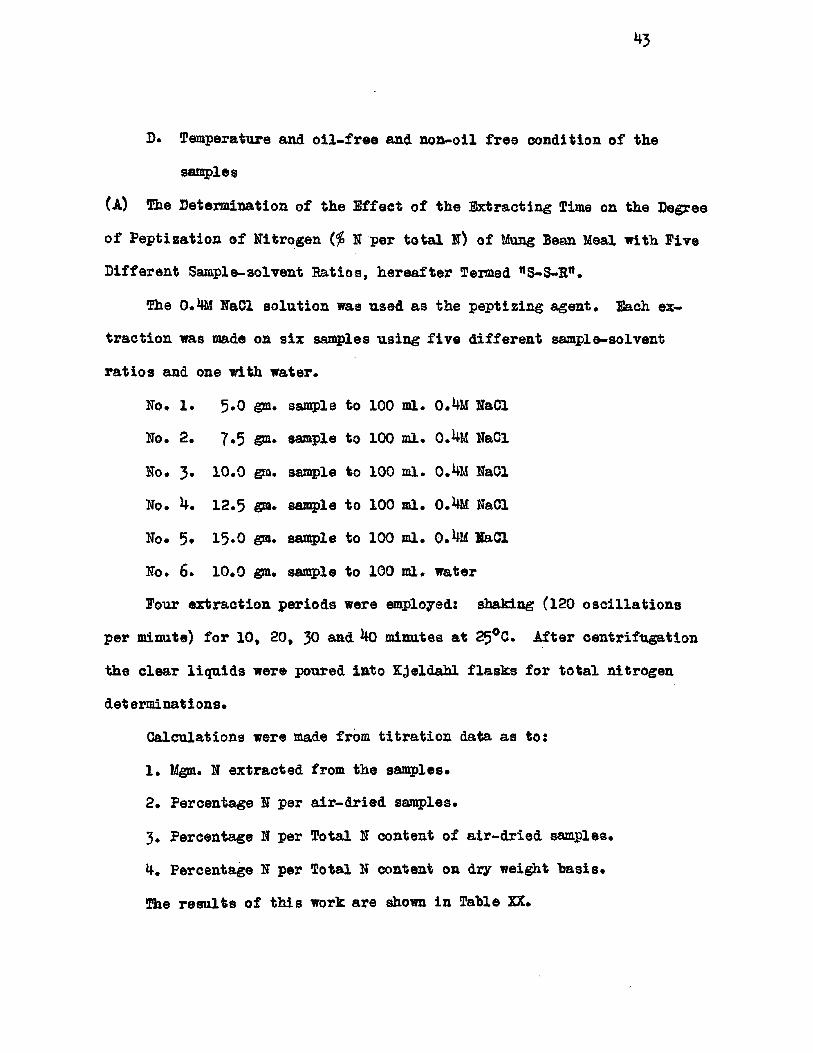
(A) The Determination o f the E ffec t o f the E xtracting Time on the Degree
o f P ep tiza tion o f N itrogen ($ N per to ta l N) o f Mung Bean Meal w ith F ive
D ifferen t Sam ple-solvent R atios, h erea fter Termed nS-S-Bn.
The 0.4M NaCI so lu tio n was used as the p ep tiz in g agent. Each ex
tr a c tio n was made on s ix samples usin g f iv e d iffe re n t sam ple-solvent
r a t io s and one with water.
NO. 1 . 5*0 gm. sample to 100 ml. 0.4M NaCI
No. 2. 7 .5 gm* sample to 100 ml. 0 .4 m NaCI
No. 3- 10 .0 gm. sample to 100 ml. 0*4m NaCI
No. 4 . 12.5 gm. sample to 100 ml. 0 .4 m NaCI
No. 5 * 15 .0 gm. sample to 100 ml. 0 .4 m SaCl
No. 6. 10.0 gm. sample to 100 ml. water
Four ex tra ctio n periods were employed: shaking (120 o s c il la t io n s
per minute) fo r 10, 20, 30 4o minutes a t 25°C. A fter cen tr ifu gation
the c lear liq u id s were poured in to E jeldahl f la s k s for to ta l n itrogen
determ inations.
C alculations were made from t it r a t io n data as to:
1 . Mgm. N extracted from the samples.
2 . Percentage N per a ir -d r ied samples.
3 . Percentage N per Total N content o f a ir -d r ie d samples.
4 . Percentage N per Total N content on dry weight h a s is .
The r e s u lts o f th is work are shown in Tahle XX.
44
TABLE XX
effect of extracting time on the degree of peptization with fiveDIFFERENT SAMPLE-SOLVENT RATIOS
With, samples 1-5 100 ml* o f 0.4M NaCl were used and w ith sample No* 6
f> N/T N dry wt. b a sis
100 ml. o f d i s t i l l e d water was used. Temperature was
No. 60 Mesh K jeldahl % N $ N/T NSample T itra tio n Mgm. N per a ir -
Grams O.19S9N Sample driedHC1
Shaking time 10 minutes
1 . 5 .0 45.8 12.763 2.55 67.262 . 7 .5 66.2 18.439 2.45 64.78
10.0 83-5 23.258 . 2 .32 61.284. 12.5 9 7 .5 27.160 2.17 57.255. 15.0 104.7 29.154 1.94 51.216. 10.0 41.35 11.519 1.15 30.35
Shaking time 20 minutes
Shaking time iJO minutes
73.2670.5666*7562.3655.7833.06
1 . 5 .0 47 .6 13.221 2 .64 69.67 75.892 . 7 .5 69.1 19.245 2 .56 67.61 73.643. 10 .0 88 .6 24.670 2.46 65.00 70.804 . 12.5 105.5 29.390 2.35 61.95 67.485 . 15 .0 118.2 32.911 2.19 57.81 62.976. 10.0 43.45 12.099 1.20 31.80 34.64
Shaking time 30 minutes
l . 5 .0 47.S5 13.255 2.66 70.22 76.492 . 7 .5 70.1 19.527 2.60 68.60 74.723 . 10.0 90 .0 25.285 2.52 66.62 72.574 . 12.5 110.05 30.647 2.45 64.60 70.375. 15.0 127.2 35.422 2.36 62.22 67*776. 10.0 44.25 12.316 1 .23 32.45 35.34
1 . 5 .0 47.9 13.345 2.66 70.32 76.602 . 7-5 70.85 19.726 2.63 69.30 75.493. 10 .0 92.9 25.865 2.58 6S.15 74.234 . 12.5 113.8 31.691 2.53 66*80 72.765 . 15 .0 133.25 31.107 2.47 65.IS 71.006 . 10.0 44.55 12.411 1 .24 32.70 35.62
*5
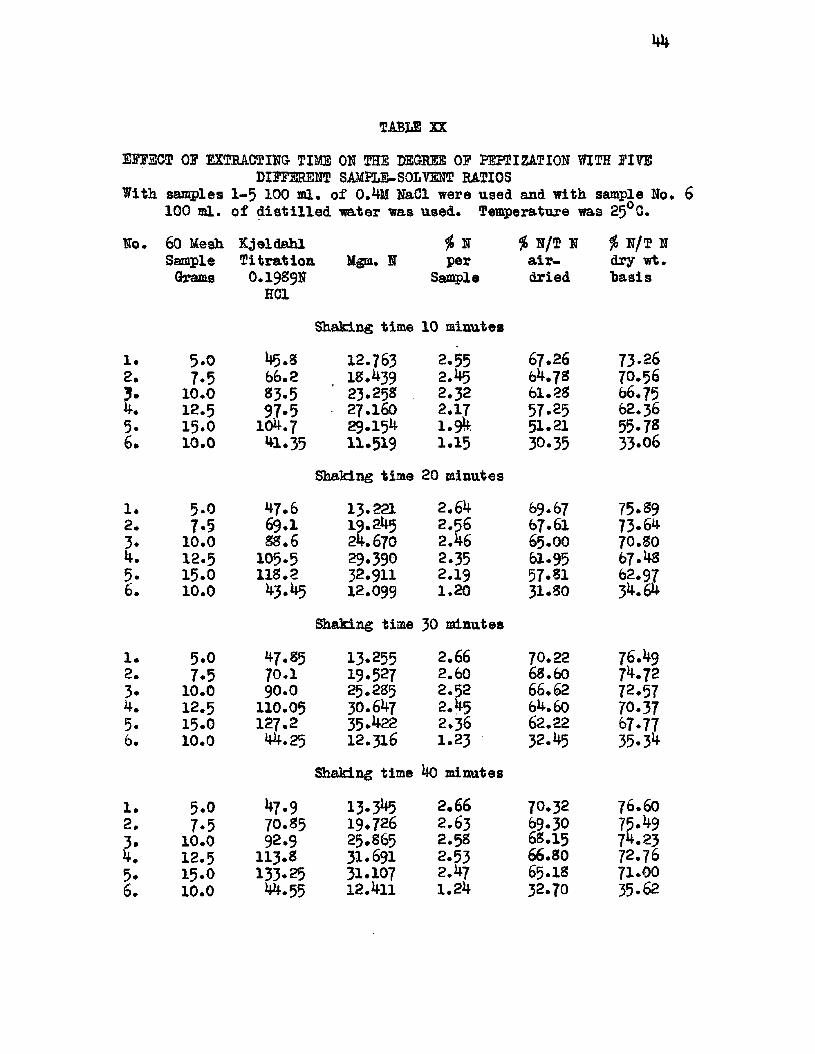
From Table XX the r e su lts have been ca lcu la ted In terms o f percent
age n itrogen per to ta l n itrogen content o f a ir -d r ie d samples (Table XXI).
TABLE XXI
PERCENTAGE NITROGEN PER TOTAL NITROGEN CONTENT OF AIR-DRIED SAMPLES
No. 1 2 3 k 5 6
Sample-so lventRatio
5:100 7*5:100 10:100* 12.5:100 15:100 10:100water
10 Min. 67.2 6U.7 61.2 57.2 5 1 .2 30.320 Min. 69.6 67.6 65.0 61.9 57.8 31.830 Min. 70 .2 68.6 66.6 64.6 62.2 32.440 Min. 70.3 69.3 68.1 66.8 65.1 32.7
These experiments demonstrate that in a l l in stan ces an increase
ex tra ctin g time in creases the amount o f to ta l n itrogen peptized from the
samples. Of the f iv e sam ple-solvent r a tio s employed, the one o f 5:100
gave the h igh est value o f p ep tiza tion and that o f 15:100 gave the lo w est.
When the S-S-R i s 5:100, time had le s s in fluence upon the p ep tiza tion
a s shown by an in crease o f only 3 percent with the increase in time from
10 minutes to 4o m inutes. On the other hand, time had a larger in flu en ce
upon the p ep tiza tion when the S-S-R i s 15:100, in which case there was
a 14 percent Increase when the same extension o f time was employed (Table
XXI and Figure 5)*
Perc
ent
of to
tal
nitro
gen
extr
acte
d
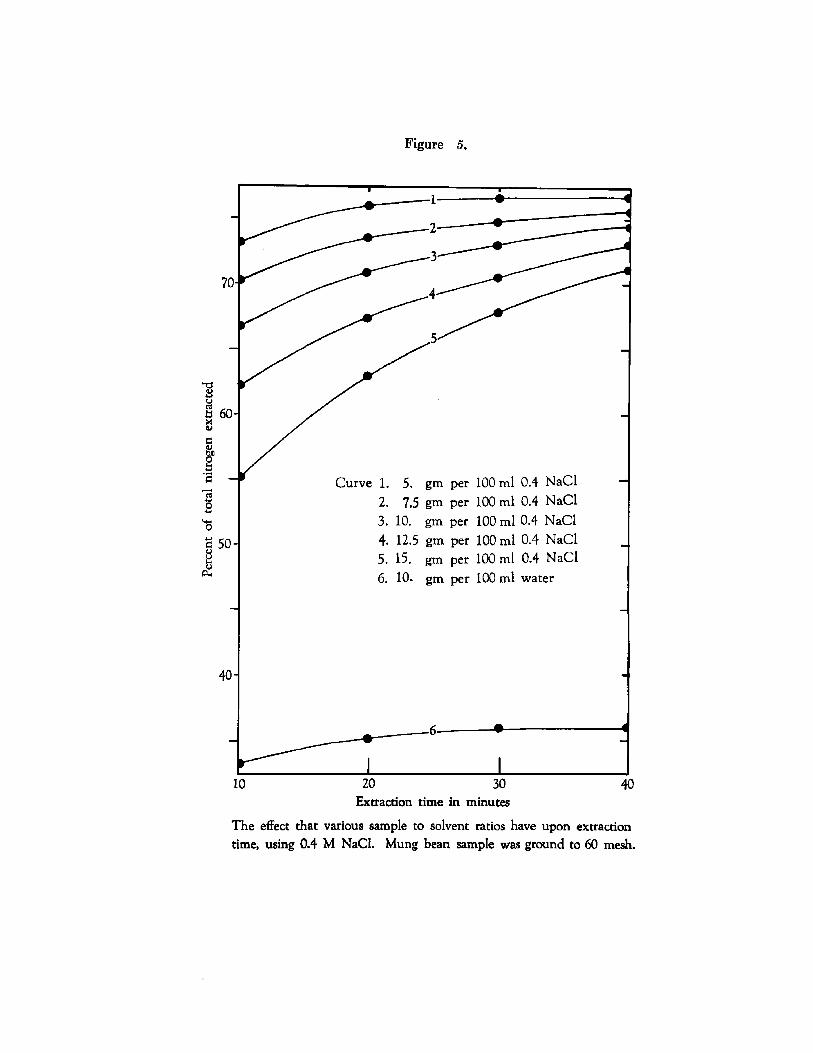
Figure 5.
60-
5. gm per 100 ml 0.4 NaCl 7.5 gm per 100 ml 0.4 NaCl
10. gm per 100 ml 0.4 NaCl 12.5 gm per 100 ml 0.4 NaCl 15. gm per 100 ml 0.4 NaCl 10. gm per 100 ml water
Curve 1.
50-
40-
6----
20 3010 40Extraction time in minutes
The effect that various sample to solvent ratios have upon extraction time, using 0.4 M NaCl. Mung bean sample was ground to 60 mesh.
47
(B) The Determination o f the E ffect o f P a r tic le S ize and Time on the
Degree o f P ep tiza tion . Twenty mesh and 40 mesh Mung bean meal samples
were used. S ix ty mesh Mung bean meal was previously determined. Each
ex tra ctio n was made by shaking (120 o s c il la t io n s per minute) 5 samples
with 0.4m EaCl a t 5 d ifferen t sam ple-solvent r a t io s (S-S-R): 5*0:100,
7*5:100, 10:100, 12.5:100 and 15*0:100 and one 10 gm. sample w ith 100 ml.
water. A fter cen tr ifu gation the clear liq u id s were used for to ta l n itro
gen determ ination. C alculations from the Kjeldahl t it r a t io n data
(Table XXII) were expressed in terms o f:
1 . Mgm. n itrogen determined from the sample.
2 . Percentage o f nitrogen per a ir -d r ied sample.
3* Percentage o f n itrogen per to ta l nitrogen content o f a ir -d r ied
sample.
4 . Percentage o f n itrogen per to ta l n itrogen content on dry
weight b a s is .
48
TABLE XXII
effect of particle size and time on the deghee of peptizationWITH FIVE DIFFERENT S-S-B
With samples 1-5 100 ml. o f 0.4M NaCl were used and w ith sample 6 100 ml. o f d i s t i l l e d water was used. Temperature was 25°C.
No* Wgt o f Kjeldahl Mgm. N f> N i> N/T N % N/T NSample T itra tion Extracted per a ir - dry wt.in Grams O .I989N HC1 Sample dried h a sis
Shaking time 20 minutes, 40 mesh Mung hean meal.1 . 5*0 30*5 8.494 1.69 44.76 48.752 . 7*5 45.1 12.556 1.67 44.11 48.053. 10 .0 59-0 16.430 1 .64 43.29 47.154. 12.5 71.8 19.996 1.59 42.15 45.915 . 15 .0 8 3 .2 23.170 1 .54 40.70 44.336. 10 .0 36.9 10.289 1 .02 27. l l 29.51Shaking time 30 m inutes, 4o mesh Mung hean meal.1 . 5 .0 31.6 8.81? I .76 4?.22 ^9.252. 7 .5 45 .4 12.644 1.68 44.42 48.383- 10*0 59*5 16.578 1.65 43.68 47.584 . 12 .5 72.8 20.286 1 .62 42.76 46.575. 15 .0 84.8 23.615 1.57 41.48 45. 1s6. 10.00 39*7 11.063 1.10 29.15 31.75Shaking time 4o m inutes, 40 mesh Mung hean meal.1 . 5*0 31*7 8.824 1.76 46.50 50.652. 7*5 47.1 13.122 1 .74 46.10 50.213. 10 .0 62.0 17.254 1.72 45.64 49.524. 12.5 76*3 21.254 1.70 44.80 48.805. 15 .0 90.25 25.135 1.67 44.15 48.096. 10.0 41 .3 11.511 1.15 30.33 33.03Shaking time 20 m inutes, 20 mesh Mung hean meal.1. 5 .0 17*5 4.873 0.97 25.68 27.972. 7*5 25.35 7.059 0 .94 24.80 27.013. 10 .0 32.05 8.926 0.89 23.52 25.624. 12.5 37*8 10.537 0 .84 22.21 24.195- 15*0 42.3 11.785 0 .7 8 20.70 22.546. 10 .0 20.9 5.818 0 .58 15.33 16.69Shaking time 30 m inutes. 20 mesh Mung hean meal.1. 5*0 17*9 4.987 0.99 26.28 28.622 . 7*5 25*9 7 ^ 3 O.96 25.34 27.603. 10 .0 33*35 9 .294 0.92 24.49 26.674 . 12.5 39*9 11.106 0.88 23.40 25.505. 15 .0 45.1 12.553 O.83 22.05 24.016. 10 .0 24.25 6.759 0.65 17.81 19.40Shaking time 40 m inutes, 20 mesh Mung hean meal*
33.021* 5 .0 20.65 5.753 1.15 30.322. 7*5 30.1 8.380 1.11 29.44 32.063* 10 .0 38.9 10.835 1.08 28.55 31.104 . 12.5 47.35 13.184 1.05 27.79 30.075 . 15 .0 53.*» 14.876 0.99 26.13 28.46b. 10 .0 33.55 9.340 0.93 24.61 26.80
49
From Table XXII we can ca lcu la te the e f fe c t o f p a r t ic le s iz e and
time o f ex traction in terms o f percentage (Table XXIII).
TABLE XXIII
EFFECT OF PARTICLE SIZE AND TIME OF EXTRACTION IN TERMS OF PERCENTAGE
No. 1 2 3 4 5 6
S-S-R 5:100 7 *5:100 10:100 12. 5:100 15:100 10:100water
E xtraction time 20 minutes
20 Mesh 25.6 24.8 23.5 22.2 20*7 15*340 Mesh 44.7 44.1 43.2 42.1 40.7 27.I60 Mesh 69.6 67*6 65*0 61*9 57.8 31. s
Extraction time 30 minutes
20 Mesh 26.2 25*3 24.5 23 .4 22.0 17.840 Mesh 45.2 44 .4 43.6 42.7 41.5 29.160 Mesh 70 .2 68.6 66.6 64.6 62*2 32*4
Extraction time 40 minutes
20 Mesh 30*3 29 .4 28.5 27.8 26.1 24.640 Mesh 46*5 46.1 45.4 44.8 44.1 30.360 Mesh 70.3 69*3 68.1 66.8 b5*l 32*7
This work involved three variab les: l ) the p a r t ic le s iz e , 2) the
sam ple-solvent r a tio and 3) extraction tim e. I t i s evident that the
p a r t ic le s iz e a f fe c t s the degree o f p ep tization to a greater extent than
e ith er the S-S-R or the extraction tim e.
The 60 mesh s iz e gave about 20 percent greater y ie ld o f nitrogen
over the 4o mesh s iz e which in turn gave about 20 percent greater y ie ld
o f n itrogen over the 20 mesh s iz e .
When u sin g 3:100 as the low est S-S-R, there was a decrease in y ie ld
of n itrogen when the S-S-R was increased*
An in crease in ex tractin g time produced a s lig h t increase in the
y ie ld o f n itrogen . The r e s u lts are p lo tted in Figure 6.
Perc
ent
of to
tal
nitr
ogen
ex
trac
ted
30-
20-
403020Extraction time in minutes
Figure 6.
This figure shows the effect of the particle size, time and sample - solvent ratio on the degree of peptization of Mung
bean meal in 0.4 M NaCl. Sample sizes are indicated by:
O for 60 mesh □ for 40 mesh O for 20 mesh
Curves in each case numbered 1, 2, 3, 4 and 5 represent 5, 7.5, 10, 12.5, and 15 grams respectively of sample per 100 ml 0.4 M NaCl. All curves numbered 6 represent 10 grams of sample per 100 ml water.
51
(0) Comparative E ffe c ts o f Mechanical Shaking and Hand S tirr in g on the
Amount o f N itrogen Peptized from Mung Bean Meal.
Mung hean meal (60 mesh) was extracted with O.hM NaCl a t f iv e sample-
so lven t r a t io s (see Tahle XXII). Sample No. 6 was 10 gm. o f meal to 100 ml.
o f d i s t i l l e d water. S ix samples were extracted a t one time fo r 30 minutes
at 25°C.
A fter the f i r s t ex traction was made from the s ix samples, the c lear
liq u id s were poured in to E jeldahl f la sk s fo r n itrogen determ ination. The
residu es were saved fo r a second ex traction , f iv e 100 ml. portions o f
O.^M NaCl were added to the residu es o f Nos. 1 -5 , and 100 ml. o f d i s t i l l e d
water was added to the No. 6 residue for the second ex tra ctio n . A th ird
ex traction was conducted in the same manner.
The n itrogen content o f a l l ex tracts was determined and reported in
terms o f percent o f n itrogen per to ta l n itrogen on a ir -d r ie d h a sis and
shown in Tahle XXIV, XXV, XXVI and fig u re 7*
52
TABLE XXIV
DETERMINATION OP NITROGEN CONTENT OP THREE SUCCESSIVE EXTRACTIONSOP MUNG BEAN MEAL SAMPLES
(A) With Mechanical Shaking fo r 30 minutes a t 25°C.
No* Sample Solvent K jeldahl Mgm. N $ N $ N/T 160 100 ml. T itra tio n per a ir -
Mesh 0.1969N Sample driedHC1
1 st E xtraction1 * 5*0 *4m NaCl 49.1 13.672 2.73 64.542 . 7*5 N u 70 .2 19.547 2.60 61.523. 10*0 II n 92.25 25.6SS 2.56 60.624 .5 .
12*515*0
II
wnn
116.113S.0
32.32938.427
2.582.56
61.04 60.1*5
6* 10 .0 water 44 .0 12.252 1 .22 28.91
2nd E xtraction1 . 5*0 *4m NaCl S . l 2.255 0 .45 10.642. 7*5 n H 11.5 3.202 0 .42 10.083. 10.00 N n l4 .0 3.926 0.39 9.254* 12*5 II n I S .2 5.067 0.1*0 9 .565. 15*0 H n 21.1 5.875 0.39 9.236* 10 .0 water 30.4 8.465 0 .8 4 19*97
3rd E xtraction1 . 5*0 •4m NaCl 2 .0 0.557 0.11 2.622 . 7*5 ii n 3 .5 0 .974 0 .12 3 .043 . 10 .0 n H 4.S 1.336 0.13 3*134 . 12*5 it H 6 .0 1.670 0.13 3.135* 15*0 it ii 7*1 1.977 0 .13 3.096. 10 .0 water 17.O 4.733 0.47 11.16
Residuesl . 5 .0 16.9 9.705 0 .94 22.212. 7 .5 28.95 8.061 1.0? 25.353 . 10 .0 41.0 11.416 1 .14 26.934 . 12.5 49.9 13.895 1.11 26.225 . 15 .0 62.1 17.292 1.15 27.196. 10 .0 60.8 16.930 1 .69 39.96
53
TABLE XXV
DETERMINATION OP NITROGEN CONTENT OF THREE SUCCESSIVE EXTRACTIONSOP MUNG SEAN MEAL SAMPLES
(B) With Hand S tirr in g O ccasionally for 30 m inutes. Temperature 25°C.
No. Sample Solvent Kjeldahl Mgm. N # N N/T I60 100 ml. T itra tion per a ir -
Mesh 0.1989N Sample driedHC1
1 s t . E xtraction1 . 5 .0 .4M NaCl 48.7 13.561 2.71 63-992 . 7-5 « n 70.2 19.547 2.60 61.493. 10 .0 n 11 9 2 .4 25.729 2.57 60.694 . 12.5 11 it 112.4 31.298 2.50 59*065 . 15 .0 n 11 133.5 37.174 2.47 58.^70. 10 .0 water 43.5 12.113 1.21 28.57
2nd. E xtraction1 . 5 .0 .4 m NaCl 6 .2 1.726 0 .34 8 . i42 . 7 .5 11 11 10.8 3.007 0.40 9.^33 . 10 .0 it ti 16.0 4.455 0 .44 10.504 . 12 .5 n it 23.2 6.460 0.51 12.175 . 15 .0 H It 29.3 S. 158 0 .54 12.816. 10 .0 water 29.O 8.075 0.80 19.04
3rd. E xtraction1 . 5 .0 •4m NaCl O.919 0.18 4.312 . 7-5 i» n 4 .3 1.197 0.15 3.753 . 10 .0 it ti 5 .9 1.643 0.16 3.874 . 12 .5 11 ii 8 .2 2.283 0.18 4.295 . 15 .0 It R 9 .2 2. 56I 0.17 4.016. 10 .0 water 14 .6 4.065 0.40 9.58
Residues1 . 5 .0 17.9 4.984 0.99 23.502. 7-5 28.85 s . 033 1.07 25.273. 10 .0 37.9 10.553 1.05 24.894. 12 .5 46 .4 12.920 1.03 24.375. 15 .0 56.3 15.677 1.04 24.656. 10 .0 65*1 18.127 1.81 42.75
<4 iH
cvt ir
o w
r-f oo itaoo
54
TABLE XXVI
DETERMINATION OE NITROGEN CONTENT OE THREE SUCCESSIVE EXTRACTIONSOE MONO BEAN MEAL SAMPLES
No* S -S - l 1 s t Ext* 2nd Ext. 3rd Ext. Residue RecoveryN % N % N N f N
A. With Mechanical Shaking fo r 30 minutes a t 25°C.1. 5:100 64.54* 10.64* 2.62* 22.21 100.012 . 7*5:100 61.52 10.08 3.04 25.35 99.993. 10:100 60.62 9.25 3.13 26.93 99.934. 12. 5*100 61.04 9.56 3.13 26.22 99.955. 15:100 60.45 9.23 3.09 27.19 99.366. 10:100 28.91 19.97 11.16 39.96 100.00
B. With Hand S tirr in g O ccasionally for 30 minutes at 25° C.99.941. 5:100 63-99 8 .14 4.31 23.50
2 . 7*5:100 61.49 9.43 3.75 25.27 99.943. 10:100 60.69 10.50 3.37 24.89 99.954. 12. 5:100 59.06 12.17 4.29 24.37 99.395. 15:100 53.47 12.81 4.01 24.65 99.946. 10:100 28.57 19.04 9*53 42.72 99.91
* A ll N va lu es are reported as $ N o f to ta l N (a ir -d r ie d sam ples).
N itrogen determ ination was made on a l l residues*
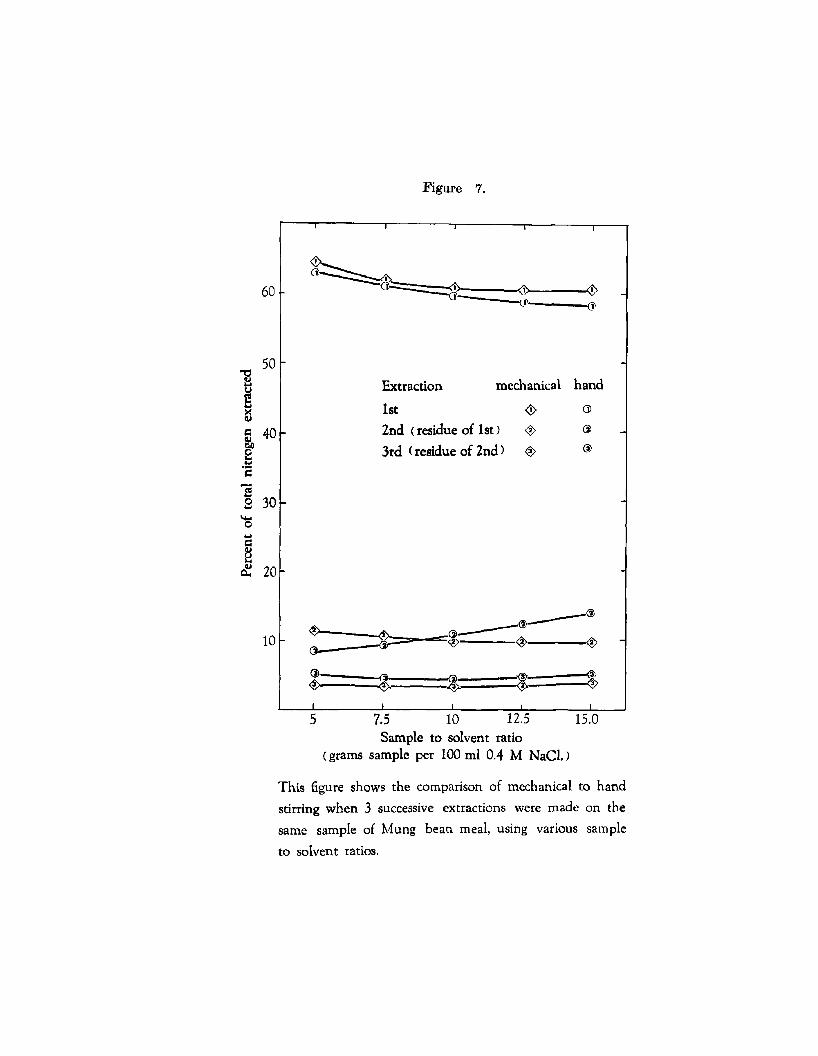
Figure 7.
*T3Qi w UESgc*
(So
c§<U
CU
60
50mechanical handExtraction
2nd (residue of 1st) < $>
3rd (residue of 2nd) <§>40
30
20
10
12.55 7.5 15.010Sample to solvent ratio
(grams sample per 100 ml 0.4 M NaCl.)
This figure shows the comparison of mechanical to hand stirring when 3 successive extractions were made on the same sample of Mung bean meal, using various sample
to solvent ratios.
56
(D) The E ffec t o f Temperature on the Degree o f P ep tiza tion o f "Oil Free11
and "Non-Oil Free" Mung Bean Meals.
Three " o il free" and three "non-oil free" samples (60 mesh) were
extracted a t one tim e. The sam ple-solvent r a t io s (S-S-R) were 1:10 ,
thus 100 ml. o f 3 d iffe re n t concentrations (O.h, 0 .1 and 0.Q5M) of NaCl
so lu tio n s were added to the three 10 gram "non-oil free" samples (Nos.
1, 2, 3) an& to the three 9»S2 gram " o il free" samples (Nos. 3* 6 ) .
The o i l content o f Mung hean meal (n on -o il free) was 0 .8 percent as pre
v io u sly determined.
Determinations were made in water haths at four d iffer en t tempera
tures (25°C ., 35°C», *J-5°C.. and 55°C.)» Each ex traction period was 30
minutes with occasional hand s t ir r in g with a g la s s rod.
A fter cen tr ifu g a tio n the n itrogen content o f the c lea r ex tra cts
were determined by Kjeldahl-Gunning method. The r e s u lts o f the Kjeldahl
determ inations were ca lcu la ted in terms o f:
1 . Mgm. N from the sample.
2. Percentage o f N per to ta l N content o f a ir -d r ie d sample.
3 . Percentage of N per to ta l N content on dry weight b a s is .
The e f fe c t o f temperature upon the degree o f p ep tiza tion from o i l
fr e e and n o n -o il fr e e samples i s d i f f i c u l t to in ter p r e t. The o i l fr e e
samples appeared* generally* to have y ie ld ed higher values than the non
o i l fr e e samples except th a t with 0.1M NaCl so lu tio n a t 55°0* &ncL with
0.05M NaCl so lu tio n a t and 55°C. reverse r e s u lts were observed.
That temperature has an in flu en ce upon p ep tiza tion was shown by the
fa c t that the degree o f p ep tiza tio n was decreased 8 percent in o i l free
57
samples (w ith O.Mii NaCl so lu tion ) when the temperature was increased from
25°C. to 55°c . Using n on -o il free samples the temperature o f ex traction
was shown to have l i t t l e or no in flu en ce upon the degree o f p ep tiza tion
below H5°C. Above U5°C. there was a decrease in the degree o f peptiza
t io n in both samples* When 0.1M and 0.05M NaCl so lu tio n s were used as
so lv en ts , an in crease in temperature resu lted in a greater degree o f pep
t iz a t io n u n t i l the maximum degree was reached (see Table XXVI and Figure J)
and then decreased with in creasing temperature. When using more d ilu te
s a lt so lu tio n s fo r ex traction , i t was noted that n on -o il free samples
y ie ld ed lower values fo r the amount o f n itrogen peptized than o i l free
samples u n t i l h igher temperatures were reached when o i l free samples gave
lower values* The general f a l l in g o f f o f the curves in a l l in stan ces
above 4^°C. may be due to the heat coagulation o f the p rotein m aterial*
A greater decrease occurred when the h ighest s a lt concentration was used
(Q.4M NaCl)• The removal o f o i l from samples to be used fo r the peptiza
t io n o f g lo b u lin i s not a safe p ra ctice . Osborne (56) found that the
p roteins o f ground f la x seed which had been freed from o i l when extracted
with NaCl so lu tio n s became a water so lub le product whereas natural glob
u lin should not be so lu b le in water*
I t i s in te r e st in g to note that when a n on -o il free sample was# ex
tracted with 0 . ^ NaCl so lu tion albumin i s apt to be coagulated to a
greater degree at 55°C. than when the concentration o f NaCl so lu tio n i s
lowered to 0.05M. I t may be p o ss ib le that proteins are protected from
coagulation by heat (55°C.) by the presence of o i l in the sample (57)
(5 S ).
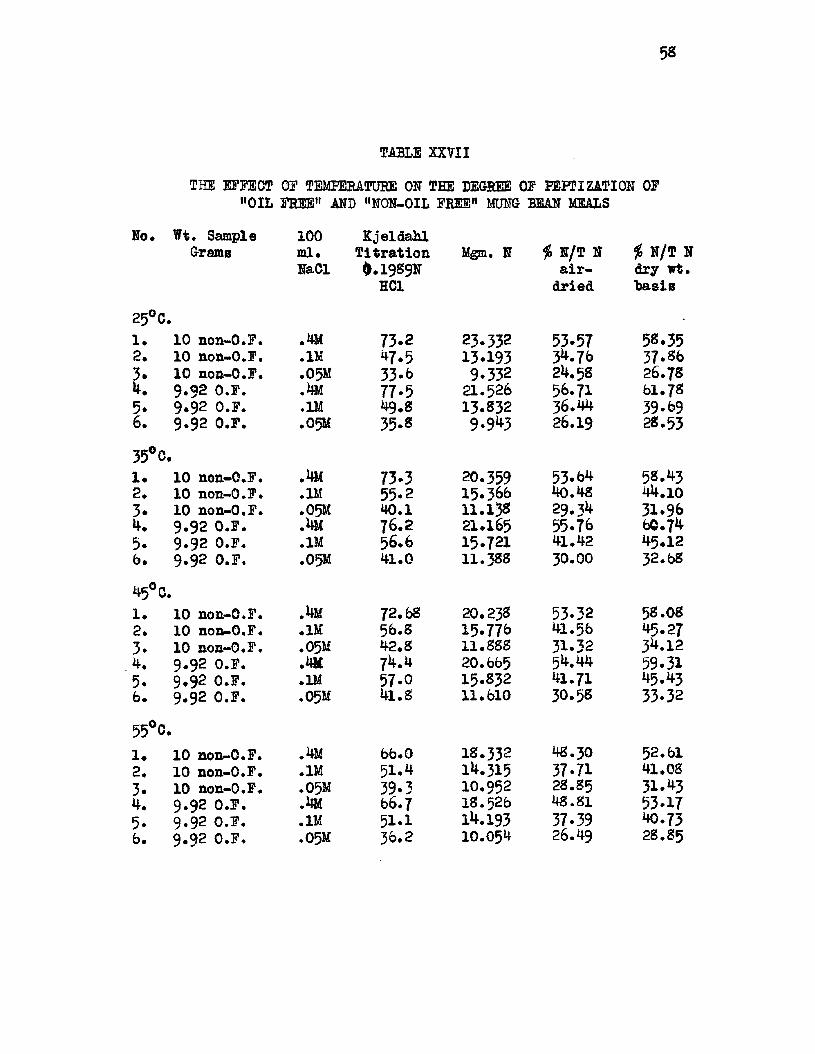
58
M L S XXVII
THE EFFECT OF TEMPERATURE ON THE DECREE OF PEPTIZATION OF "OIL FREE" AND "NON-OIL FREE" MUNG BEAN MEALS
No. Wt. Sample 100 KjeldaHL$> N/TGrams ml. T itra tio n Mgm. N # N/T N
NaCl 0.1989N a ir - dry wtHC1 dried 'basis
25°C,f1 . 10 non-O.F. .MM 73.2 23.332 53.57 58.352. 10 non-O.F. .1M *7*5 13*193 3M.76 37.863 . 10 non-O.F. .05M 33-6 9.332 2M.5S 26.78M. 9.Q2 O.F. .Mm 77.5 a . 526 56.71 61.785* 9*92 O.F. .1M M9.S 13.832 36.MM 39-696. 9 .92 O.F. . 05M 35.8 9 . 9M3 26.19 28.53
35° 0,I . 10 non-O.F. .Mm 73*3 20.359 5 3 .6M 5S.M32. 10 non-O.F. .1M 55.2 i5.3&> M0.M8 MM.103* 10 non-O.F. .05M 40.1 11.138 29. 3M 31.96M. 9 .9 2 O.F. .Mm 76.2 21.165 55.76 6 0 .7M5. 9 .9 2 O.F. .1M 56.6 15.721 Ml. M2 M5.126. 9 .92 O.F. •05M M1.0 11.388 30.00 32.68
45°C »1 . 10 non-O.F. .Mm 72. 68 20.23s 53.32 58.082. 10 non-O.F. .1M 5b.S 15.776 Ml.5b 45.273 . 10 non-O.F. .05M M2.S 11.888 31.32 3M.12M. 9.92 O.F. .MM 7M.M 20.665 5M.MM 59.315. 9 .92 O.F. .1M 57.0 15.832 Ml. 71 M5-M3b. 9 .92 O.F. .05M Ml.S 11.610 30.58 33.32
55°C<ft
l . 10 non-O.F. .Mm bb.O 18.332 M8.30 52.612. 10 non-O.F. .1M 51. M lM.315 37.71 Ml. 083. 10 non-O.F. . 05M 39.3 10.952 28.85 31.M3
9.92 O.F. .Mm b6.7 18.526 MS.81 53.175 . 9 .92 O.F. .1M 51.1 1^.193 37.39 M0.73b. 9 .92 O.F. .05M 36.2 10.05M 26. M9 28.85
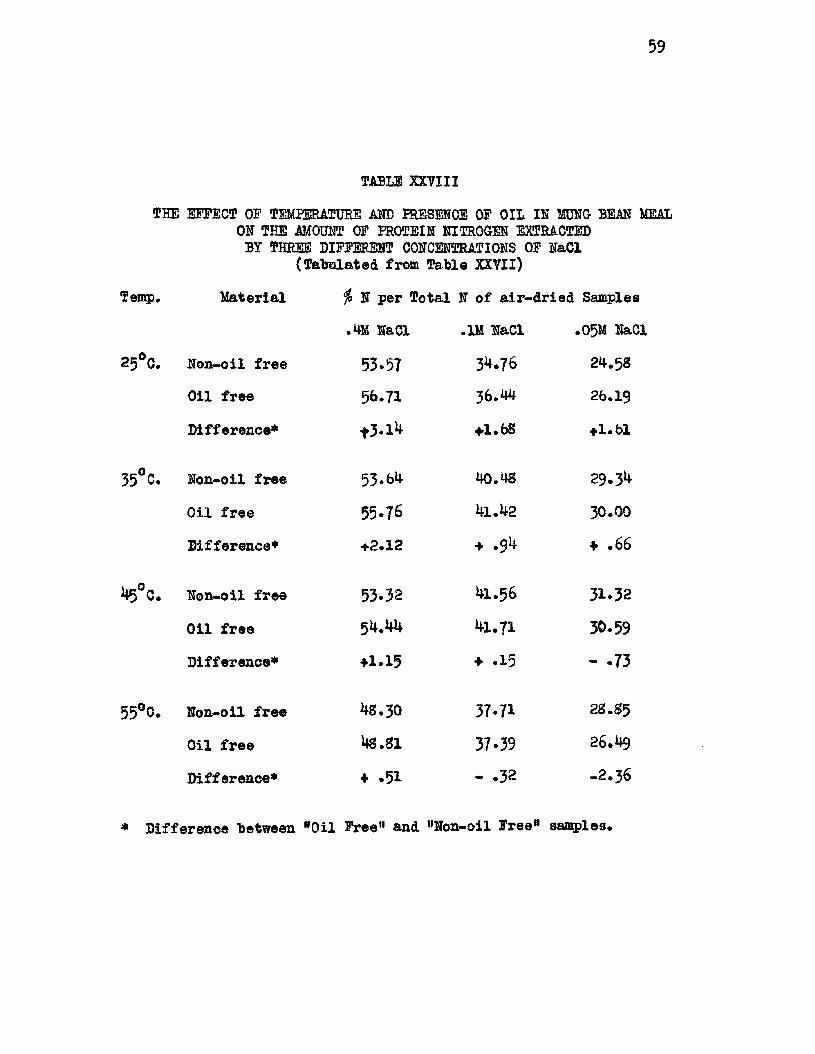
59
TABLE XXVIII
THE EFFECT OF TEMPERATURE AMD PRESENCE OF OIL IK MUNG BEAM MEAL OK THE AMOUNT OF PROTEIN NITROGEN EXTRACTED
BY THREE DIFFERENT CONCENTRATIONS OF NaCl (Tabulated from Table XXVII)
Temp, M aterial $ N per Total N o f a ir -d r ied Samples
.MM NaCl .1M NaCl . 05M NaCl
25°C. N on-oil free 53-57 34.76 24.58
O il free 56*71 36.44 26.19
D ifference* f 3 . l 4 +1.65 ♦1.61
35°C. N on-oil free 53*64 40.48 29.34
O il free 55*76 41.42 30.00
D ifference* ♦2.12 ♦ . $ k ■f .66
45°c. N on-oil free 53*32 41.56 31.32
O il fr e e 54,41* 41.71 30.59
D ifference* +1*15 ♦ .15 - .73
55°0. N on-oil free 48.30 37.71 28.85
O il fr e e 48.81 37.39 26.49
D ifference* 4- .51 - .32 - 2 .36
* D ifference between "Oil Free" and "Non-oil Free" samples.
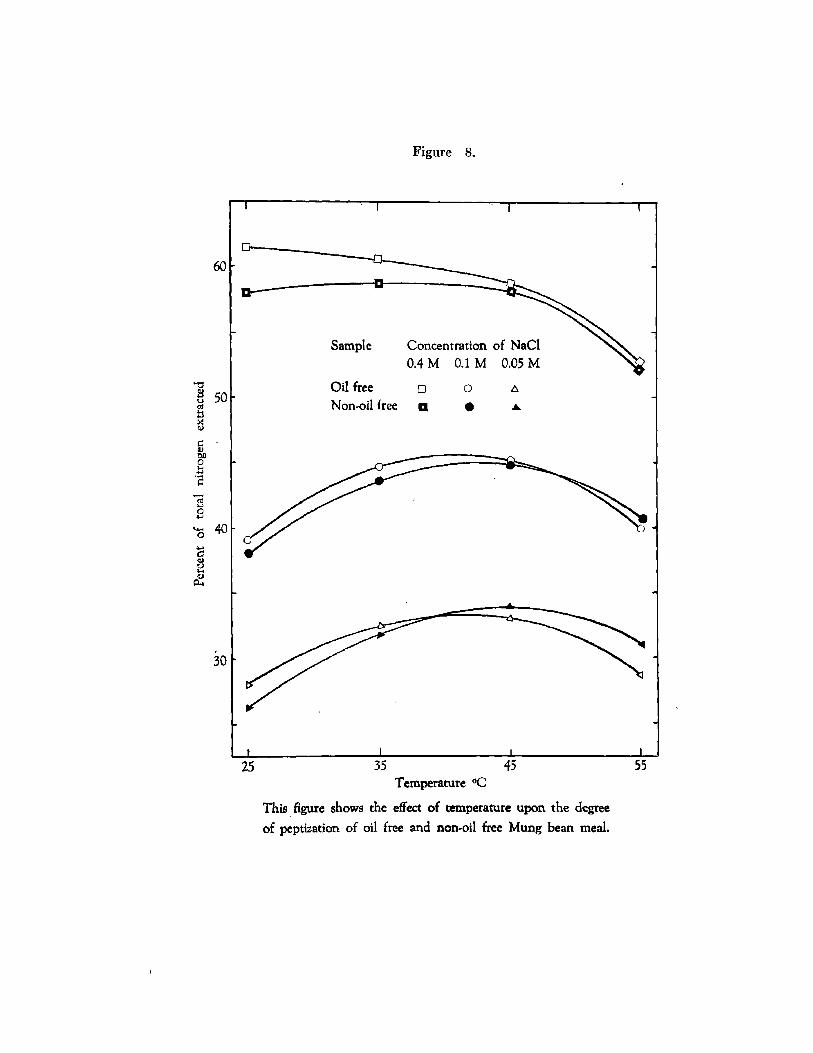
Figure 8.
60
Sample Concentration of NaCl 0.4 M 0.1 M 0.05 M
Oil free Non-oil free50
40
eu
30
45 553525Temperature °C
This figure shows the effect of temperature upon the degree of peptization of oil free and non-oil free Mung bean meal.
I
6l
PRECIPITATION
I t was observed in the previous experiment that Mung hean p rotein
extracted w ith sodium ch loride or potassium ch loride gave a very narrow
s o lu b i l i t y range as shown by the "steep slope" curves (Figures 2 and 3)*
In other words i t was obvious that the protein which was h igh ly so lub le
a t 0.4i! NaCl would be in so lu b le or p rec ip ita b le by d ilu tio n with a small
volume of water.
According to the d e f in it io n g lob u lins are in so lu b le in water but
so lu b le in d ilu te s a lt so lu tio n s o f the s a lt s o f strong ac id s and bases
(5 9 ) . Gortner et a l reported (40) experiments in which wheat f lo u r was
extracted w ith 5 percent potassium su lfa te so lu tion and with 10 percent
sodium ch lorid e so lu tio n and they found that the amount and nature of
the p rotein m aterial d isso lv ed by these two reagents were markedly d if
fe r e n t . According to the d e f in it io n of g lo b u lin , the two so lu tio n s
should have y ie ld ed id e n tic a l fr a c tio n s . They studied the question fur
ther and asked "of what s a lt s and what concentrations?", but ignored the
d e f in it io n o f g lo b u lin . Sim ilar questions were a lso ra ised by Ferry,
Cohn and Newman (60) "how soluble? or how insoluble?"
For p ra c tica l purposes the "soluble-insoluble" range o f Mung bean
g lo b u lin must be measured and confirmed. In order to so lve th is problem
a scheme for th is determination was devised for p rec ip ita tio n of the glob
u l in from a 0.4M NaCl extract by the d ilu tio n procedure. This procedure
served to rep lace the sa lt in g out method fo r p rec ip ita tin g g lo b u lin s .
The determ inations were carried out a s fo llow s:
62
A. Determination o f p rotein n itrogen - non-protein n itrogen r a tio
and the album in-globulin r a t io .
B. Demonstration o f the e f fe c t o f d ilu tio n upon the sedim entation
time o f g lo b u lin fr a c tio n .
C. Protein sedim entation from 0 .4 m NaCl extract o f Mung bean meal
a t various hydrogen ion concentrations.
D. Suggested procedure fo r the is o la t io n of the g lob u lin from
Mung bean meal.
IS. A q u a n tita tiv e study o f the procedure.
(A) Determination o f Protein Nitrogen - Non-protein Nitrogen Patio
and Albumin-Globulin R atio .
Procedures Twenty grams o f Mung bean meal (60 mesh) were extracted
with 200 ml. o f O.lfM NaCl so lu tio n fo r 30 minutes with occasional hand
s t ir r in g . The c lear extract was separated from the residue by cen tr i
fu gation and the extract was used for the fo llow in g experiments:
1 . T r ip lica te 10 ml. portions o f the extract were p ip etted in to
separate K jeldahl f la s k s for the to ta l n itrogen determ ination.
2. Ten ml. o f the extract were p ip etted in to a $ 0 ml. cen trifu ge
tube and tea ml. o f 20 percent tr ich lo r o a c e tic acid were added. The
p rotein m atter p rec ip ita ted immediately and was separated from the super
natant by cen tr ifu g a tio n . The p rec ip ita te (w ith the a id of 0.4m NaCl)
was transferred to a Kjeldahl f la s k for protein nitrogen determ ination.
3 . The c lea r liq u id separated by the above tr ic h lo r o a c e tic acid
p r e c ip ita t io n was used fo r non-protein nitrogen determination.
4 . Three blanks were a lso determined: to one an ad d ition a l 50 ml.
63
o f d i s t i l l e d water were added, to the second 100 ml* and to th ird 150 ml*
5* A s e r ie s o f ten 100 ml. graduate cy lin d ers were arranged. The
cy lin d ers were marked as fo llow s: the f i r s t cylinder on the l e f t 1 - 1 ,
the second 1 - 2 , the th ird 1 - 3 8°^ so on u n t i l the one a t the r ig h t
end was 1 - 10. To each o f the ten cy lin d ers 10 ml. o f the ex tract was
introduced by a p ip ette* Then to the f i r s t cylinder 10 ml. o f d i s t i l l e d
water were added to make a 1:1 d ilu tio n ; to the second 20 m l. o f d i s t i l l e d
water; to the th ird 30 ml* and so on u n t i l the 10 cy lin d ers were d ilu ted
w ith d i s t i l l e d water accordingly*
a . Determination o f Globulin Nitrogen fraction* A fter standing
fo r one hour the protein matter (g lobulin*) was p rec ip ita ted and had
s e t t le d to the bottom o f the cylinders by g ra v ita tio n . The p rec ip ita te
was separated from the liq u id by cen tr ifu gation . The liq u id was poured
in to a c lean cy linder marked to correspond to the above s e r ie s . The
p r e c ip ita te was tran sferred to a KJeldahl f la s k fo r g lob u lin determina
tion*
b . Determination o f albumin nitrogen fr a c tio n . An equal volume
o f 20 percent tr ic h lo r o a c e tic a c id was added to each of the 10 cylinders
which contained the c lea r liq u id separated from the g lob u lin p ro te in .
P rec ip ita tio n occurred immediately. The p rec ip ita te was separated from
the liq u id by cen tr ifu g a tio n . The nitrogen content o f the liq u id and
* By the term g lo b u lin i s meant the fra c tio n which i s so lub le in neutral
s a lt so lu tio n (O.UM NaCl) and i s in so lu b le when d ilu ted w ith water (59)*
the p r e c ip ita te were determined and recorded as non-protein n itrogen
and albumin nitrogen*, re sp e c tiv e ly .
The blank determ ination was substracted from a l l the Kjeldahl t i t r a
tions* R esu lts are expressed in terms o f percentage o f: ( l ) to ta l n i
trogen (TN) as 100 percent, (2) protein n itrogen (PN), (3) g lob u lin n i
trogen (GST), (4) albumin n itrogen (AN), and (5) non-protein nitrogen
(NPN) and are given in Tables XXIX and XXX and Figure 9*
(B) Demonstration o f the E ffec t o f D ilu tion Upon the Sedimentation Time
o f Globulin Fraction*
Ten ml. portions o f 0 .4 m NaCl extract o f Mung bean meal were in tro
duced in to each o f ten 100 ml. graduated cylinders* Ten ml. o f d i s t i l l e d
water were added to the No. 1 cylinder making a 1:1 d ilu tio n ; 20 ml. o f
d i s t i l l e d water were added to the No. 2 cylinder making a 1:2 d ilu tio n
and 30 ml. were added to the No. 3 cylinder making a 1:3 d ilu tio n and so
on up to the No. 10 cylinder to which 100 nil. o f d i s t i l l e d water were
added making a 1:10 d ilu tio n (Figure 1 0 ).
The photographs were taken 15, 45 a^d 75 minutes re sp ec tiv e ly a f te r
d ilu tio n s were made and show that the 1:4 and 1:5 d ilu tio n s were fa s te r
in p re c ip ita tio n and sedim entation of the to ta l p rotein , whereas No. 6
through No. 10 showed slower s e t t l in g than Nos. 4 and 5* This rate o f
s e t t l in g may be due to the larger volume o f d ilu tio n which apparently
slows down the ra te o f sedim entation. With the 1:1 d ilu tio n no precip
ita t io n occurred and the p rotein was s t i l l in so lu tio n . With the 1:2
* By the term albumin i s meant the fra c tio n which i s so lub le in water
and in neutral s a lt so lu tio n (59)*
65
TABLE XXIX
THE DETERMINATION OE PROTEIN-NITROGEN, NON-PROTEIN-NITROGEN, GLOBULIN-NITROGEN AND ALBUMIN-NITROGEN FROM 0.4M laC l
SOLUTION EXTRACT OE MUNG BEAN MEAL
Determin T itra tio n sa tio n o f m l. 0.1002N Mgm. N* % N/T N
HC1
1 . T N 20.5 2S.056 100.002 . T N 20.55 28.126
T N 20.45 27.9584 . P N 1S.5 25.255 89.995 . P N IS . 5 25.256. P N 15.55 25.3207 . NPN 2.5 2.805 9.97S. NPN 2.5 2.8059* NPN 2.5 2.805
10. G N 1-1** 1.5 1.402 5.0011. G N 1-2 5 .2 6.593 23.5012. G N 1-3 S .2 10.940 38.9913. G N 1-4 10.6 14.168 50.50l4 . G N 1-5 11.5 15.^30 55.0015. G N 1-6 l l . S 15.851 56.0016. G N 1-7 12.0 16.132 57.5017. G N 1-S 12.1 16.272 58.00IS . G N 1-9 12.1 16.272 58.0019. G N 1-10 12.0 16.132 57*5020. A N 1-1 17 .0 23.146 82.5021. A N 1-2 13.25 17.SS5 63. 7^22 . A N 1-3 10 .2 13.607 48.502? ‘ A N 1-4 7.85 10.310 36.7524. A N 1-5 7 .0 9.118 32.5025. A N 1-6 6 .7 8.697 31.0026. A N 1-7 6.45 8.3*+6 29.7527- A N 1-S 6.35 8.206 29.2528. A N 1-9 6 .4 8.276 29.5029. A N 1-10 6 .5 8 .4 i 6 30.0030. NPN 1-1 3 .0 3.507 12.5031. NPN 1-2 3 .0 3.507 12.5032. NPN 1-3 3 .0 3.507 12.503?* NPN 1 -4 3 .0 3.507 12.5034. NPN 1-5 3 .0 3.507 12.5035. NPN 1-6 3 .0 3.507 12.5036. NPN 1-7 3 .0 3.507 12.5037* NPN 1-S 3 .0 3.507 12.5038. NPN 1-9 3 .0 3.507 12.5039. NPN 1-10 3.0 3.507 12.50
* Mgm. N values were ca lcu la ted from t itr a t io n s minus blanks.
** D ilu tio n volume, e . g . , (1 -2) fo r one volume o f extract two volumes of water were added*
66
TABLE XXX
THE GLOBULIN -ALBUMIN RATIO G/A AND PROTEIN NITROGEN AND NON-PROTEIN NITROGEN RATIO PN/NPN OP MUNG BEAN PROTEIN
Dilutio n
M olarity Log M # GN # AN $ NPN Total G/A PN/NPN
1:1 0 .2 -0 .699 5 .0 82.0 12.5 100.0 0.06 7.00
1:2 0.133 -O .S76 23.5 e>3-7 12.5 99.7 0 .36 6,97
1:3 0 .1 -1 .0 0 0 3S.9 48.5 12.5 99-9 0.80 6.99
1:4 0.08 - 1.097 50.5 36.7 12.5 99.7 1.37 6.97
1:5 0.066 -1 .1 7 4 55.0 32.5 12.5 100.0 1.69 7.00
1:6 0.057 -1 .2 4 4 56.0 31.5 12.5 100.0 1 .72 6.96
1:7 0.05 -1 .3 0 1 57.5 29.7 12.5 99.7 1*93 6.97
1:8 0.044 -1 .35S 58.0 29.2 12.5 99.7 1 .98 6.97
1:9 o .o 4 -1 .39S 58.0 29.5 12.5 100.0 1 .96 7.00
1:10 0.036 -1 .4 4 4 57.5 30.0 12.5 100.0 1.85 6.84
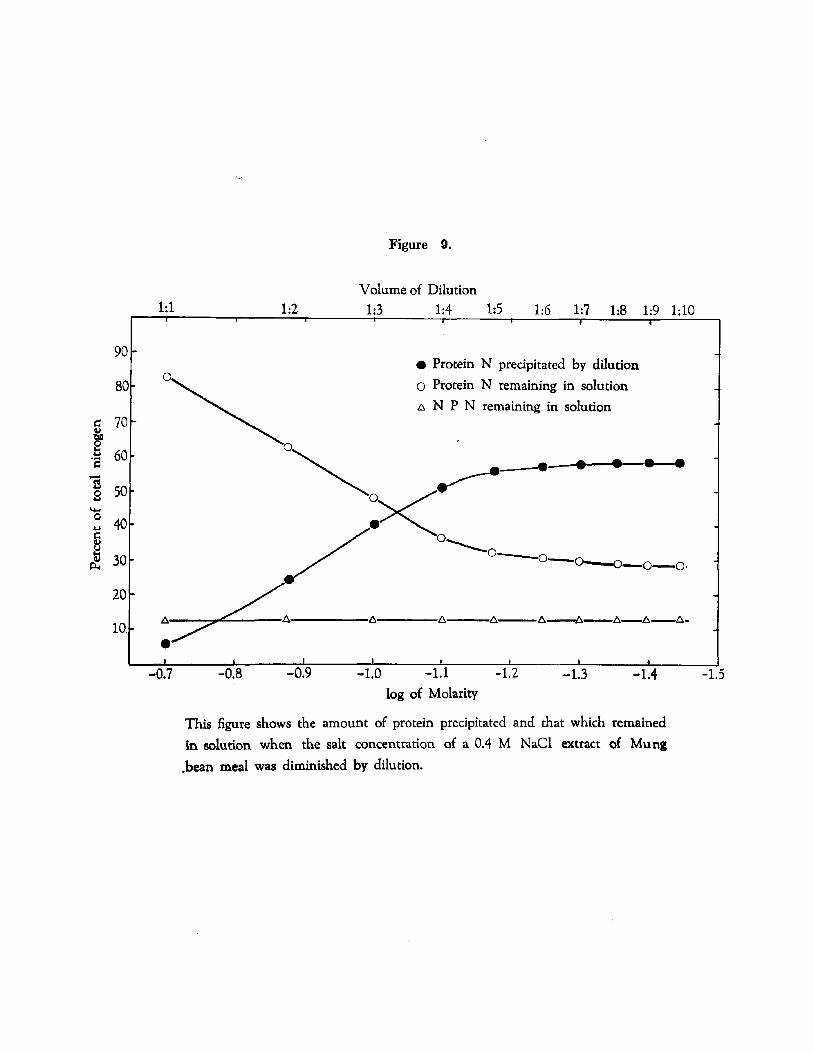
Perc
ent
of to
tal
nitr
ogen
Figure 9.
Volume of Dilution1:5
• Protein N precipitated by dilution O Protein N remaining in solution a N P N remaining in solution
1 O O'
.A.
-0.9 - 1.1- 0.8 - 1.2-0.7 - 1.0 -1.4 -1.5-1.3log of Molarity
This figure shows the amount of protein precipitated and that which remained in solution when the salt concentration of a 0.4 M NaCl extract of Mung
.bean meal was diminished by dilution.
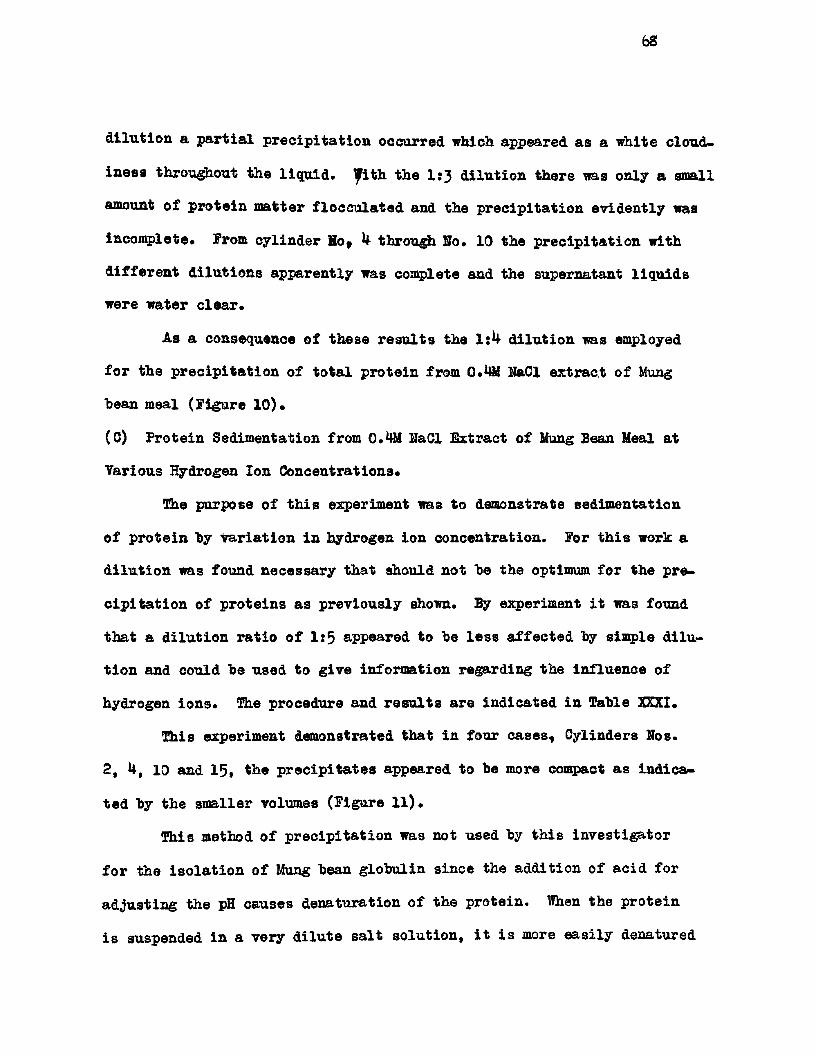
62
d ilu tio n a p a r t ia l p r ec ip ita tio n occurred which appeared as a white cloud,
in ees throughout the liqu id* TJith the 1:3 d ilu tio n there was only a small
amount o f p ro te in m atter f lo c c u la ted and the p rec ip ita tio n ev id en tly was
incomplete* Prom cy linder Xoy 4 through No* 10 the p rec ip ita tio n with
d iffe r e n t d ilu tio n s apparently was complete and the supernatant liq u id s
were water clear*
As a consequence o f these r e su lts the 1 :4 d ilu tio n was employed
fo r the p re c ip ita tio n o f to ta l p rotein from 0* 11 NaCl extract o f Mung
hean meal (Figure 1 0 ).
(C) Protein Sedimentation from 0.4M NaCl Extract o f Mung Bean Meal a t
Various Hydrogen Ion Concentrations*
The purpose o f th is experiment was to demonstrate sedim entation
o f p rotein by v a r ia tio n in hydrogen ion concentration. For th is work a
d ilu tio n was found necessary that should not he the optimum for the pre
c ip ita t io n o f p roteins as previously shown. By experiment i t was found
th at a d ilu tio n r a tio o f 1:5 appeared to he le s s a ffec te d hy simple d ilu
t io n and could he used to g ive information regarding the in flu en ce o f
hydrogen ions* The procedure and r e s u lts are ind icated in Tahle XXXI*
This experiment demonstrated that in four cases* Cylinders Nos.
2 , 4 , 10 and 15 , the p r e c ip ita te s appeared to he more compact as in d ica
ted hy the sm aller volumes (Figure 11)*
This method o f p rec ip ita tio n was not used hy th is in v estig a to r
fo r the is o la t io n o f Mung hean g lob u lin sin ce the ad d ition o f a c id for
ad ju stin g the pH causes denaturation o f the p rotein . When the p rotein
i s suspended in a very d ilu te s a lt so lu tio n , i t i s more e a s ily denatured
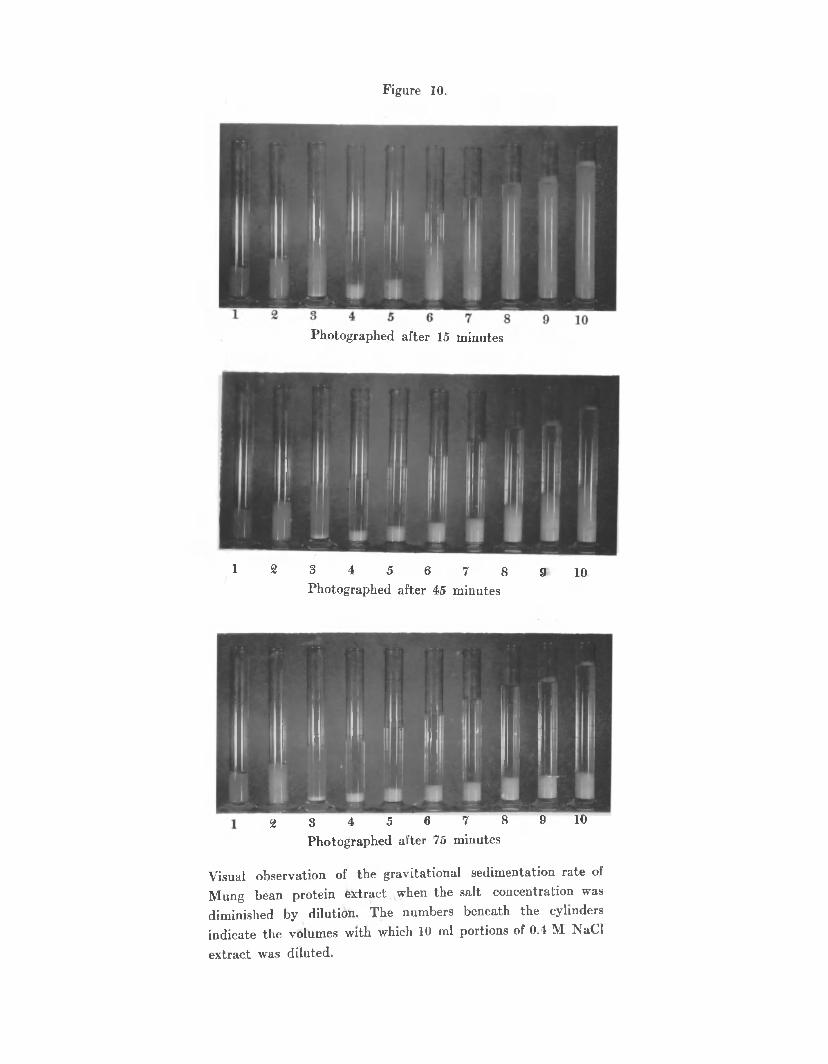
Figure 10.
Photographed after 15 minutes
1 2 3 4 5 6 7 8 9 10Photographed after 45 minutes
2 3 4 5 6 7 8 9 10Photographed after 75 minutes
Visual observation of the gravitational sedimentation rate of Mung bean protein extract when the salt concentration was diminished by dilution. The numbers beneath the cylinders indicate the volumes with which 10 ml portions of 0.4 M NaCl extract was diluted.
Figure 11.
Visual observation of the effect of H-ion concentration (pH) on the manner of precipitation from a 0.4 M NaCl extract of Mung bean protein diluted to 0.06 M. The numbers beneath the cylinders identify the data in the preceding table.
70
by a very small amount o f acid than when dispersed in a concentrated
s a lt so lu tion ( 6 l ) .
TABLE XXXI
SEDIMENTATION OP PROTEIN BY VARIATION OP HYDROGEN ION CONCENTARATION
S eries o f ml. Water ml. Extract Reading in Pinal100 ml* pH with pH ( 0 .MM NaCl) ml. o f Ppt. pHCylinders Adjusted added a fte r 12 hrs.
1 . 6 .2 55 10 46 6.172 . 6 .0 55 10 20 5.8S3 . 5.8 55 10 54 5*7^4. 5*6 55 10 5.845 . 5*^ 55 10 49 5.756. 5*2 55 10 53 5*747- 5 .0 55 10 52 5.7^S. 4.S 55 10 51 5.739 . 4 .6 55 10 50 5 .74
10. 4 .4 55 10 44 5.8211. 4 .2 55 10 53 5.7^12. 4 .0 55 10 52 5-721?* 3 .8 55 10 52 5.72i 4 . 3 .6 55 10 5.5815* 3 .* 55 10 46 5.5216. 3 .2 55 10 ^7 5.3017* 3-0 55 10 52 4.S2IS . 2.S 55 10 0 4.3119. 2 .6 55 10 0 3.6420. 2 .4 55 10 0 3.06
(D) Suggested Procedure for the Iso la tio n of the Globulin from Mung
lean Meal*
Prom the r e su lts o f the previous experiments have shown the follow
ing necessary procedure:
1 . The so lv en t. A 0.4M NaCl so lu tion was used*
2. S o lid -so lv en t ra tio (S-S-R) 1:10.
3* Three successive extraction s were employed*
4 . E xtraction tim e. The most sa tis fa c to ry r e su lts were obtained
71
with one h oar's extraction at 25°C. with occasional hand s t ir r in g .
5* The removal o f the resid u es. The residue was removed by cen
tr ifu g a tio n fo r 15 minutes a t 2000 r .p .m ..
b. The p rec ip ita tio n of protein from extract with 1:4 d ilu tio n .
Tor each volume o f extract four volumes o f water were added and the to ta l
protein p rec ip ita ted .
Trom previous a n a ly sis Mung bean p rotein p recip ita ted with 1:4 d iliu
t io n showed:
50.50 percent nitrogen per extractab le n itrogen as globulin n itrogen
37*00 percent n itrogen per extractab le nitrogen as albumin nitrogen
12.50 percent nitrogen per extractab le n itrogen as N P N.
(E) A Qa&ntative Study o f the Procedure Involved.
A qualitative study o f the procedure ju st outlined was carried out.
a . E xtraction. A mixture of 100 grams of Mung bean meal (SO mesh)«t>
and 1000 ml. o f 0.4M NaCl so lu tio n (S-S-R 1:10) were extracted for one
hour at 25°C. with occasional hand s t ir r in g . The extract was centrifuged
fo r 15 minutes to remove the residue. The residue (I*) was re~extracted
tw ice and a l l the ex tra cts (II ) were combined.
ml. added ml. Centrifugate O .tyL NaCl C ollected
P ir s t E xtraction 1000 860
Second E xtraction (residue o f 1 s t) 860 850
Third E xtraction (residue o f 2nd) 850 SbO
A volume o f 860 ml. o f cen trifu gate were c o lle c ted from the f i r s t
ex tra ctio n so 860 ml. o f 0.4M NaCl were added to the residue fo r the
* See Plow Sheet - Pigure 12.
72
second ex tra ctio n , g iv in g 850 ml, o f centrifugate c o llec ted from th is
second ex traction and 850 ml* o f 0.4M NaCl were then added to the r e s i
due fo r the th ird extraction from which 860 ml, were co lle c te d . Thus
the so lid -so lv en t ra tio was kept in each case a t is 10,
b. P rec ip ita tio n o f p rotein . The combined centrifugate (I I ) ( in
0 .4 m N&Cl) was d ilu ted with four volumes o f d i s t i l l e d water (1 :4 ratio*)*
The f in a l concentration o f the d ilu ted extract was 0.08M NaCl* The pre
c ip ita t io n o f p rotein occurred in sta n tly . The p rec ip ita te was allowed
to stand fo r a few hours, u su a lly over n ight, to allow a more complete
p r ec ip ita tio n , and was then separated from the liq u id by cen trifu gation .
c . P u r ifica tio n . The p rec ip ita te (I I I ) was d isso lved in 0 .4m NaCl
a t 25°C. With g en tle hand s t i t r in g , ten minutes were needed to completely
d isso lv e the p r e c ip ita te . The dispersed protein so lu tio n was then cen
tr ifu g ed . The residue was designated as (V) and the centrifugate as (V I).
A large quantity o f in so lu b le m aterial separated by cen trifu gation , in d i
cating a globulin-bound (G-b) (V) substance, or protein matter which i s
not d ispersab le in d ilu te neutral s a l t . The c lear centrifugate (VI) was
d ilu ted with four volumes o f d i s t i l l e d water and p rec ip ita tio n occurred
* The ad d ition of water to the extract was conducted with a large funnel
with the stem extended by g la ss tubing. The lower end o f the tube was
immersed under the surface o f the ex tract. The time required for sedi
mentation o f the p rotein was three to four hours at 6°C*
73
in stan tly* A fter standing for four hours, the p rec ip ita te (VII) was
separated from the supernatant (VIII) by cen trifu gation . The process
o f p u r ific a tio n ( c .) was repeated u n t il no more Gb substance could be
removed*
The amount o f g lob u lin obtained from 100 grams of 60 mesh Mung
bean meal by three successive extractions with 0.4M NaCl and p rec ip ita
ted by 1 :4 d ilu tio n was then determined. The p rec ip ita te (VII) which
was freed from globulin-bound substance and albumin was f i r s t d isso lved
in 300 ml. o f 0.4M NaCl so lu tion and two 10 ml. a liq u ots were taken for
K jeldahl n itrogen determination. The to ta l g lobu lin nitrogen from 100 gm.
of Mung bean meal (a ir -d r ied ) was found to be 1.405b gm. This weight
represented 37»01 percent o f the to ta l n itrogen content o f 100 gm. o f
Mung bean meal or 49.45 percent o f the to ta l extractab le n itrogen.
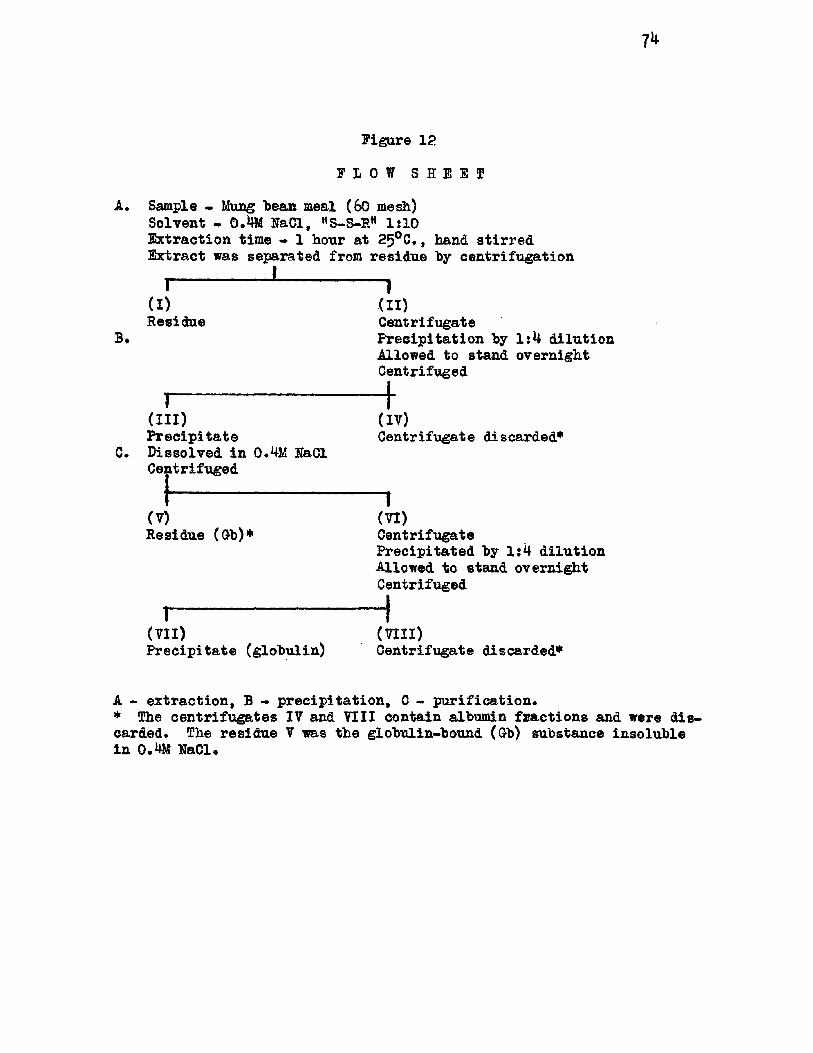
7*
Figure 12
F L O S H E E T
Sample - Mung beam meal (60 mesh)Solvent - O. M NaCl, MS-S-BM 1:10E xtraction time - 1 hour at 25°C ., hand s tir re dExtract was separated from residue by cen trifu gation
1 1(I)Residue
1-------------------------------------( I I I )P r ec ip ita te
C. D issolved in 0.4M N ad Cen trifuged____________
(V)Residue (Gb)*
r ~ ----------------------------(VII)P rec ip ita te (g lobu lin )
(II )CentrifugateP rec ip ita tio n by 1:4 d ilu tio n Allowed to stand overnight Centrifuged
(IV)Centrifugate discarded*
~ l(VI)CentrifugateP recip itated by 1:4 d ilu tio n Allowed to stand overnight Centrifuged
( n n )Centrifugate discarded*
A - ex traction , B - p re c ip ita tio n , C - p u r ifica tio n .* The cen tr ifu gates IV and VIII contain albumin fra ctio n s and were d iscarded. The residue V was the globulin-bound (Gb) substance in so lu b le in 0.4M NaCl.
75
FRACTIONATI ON AND FURTHER PURIFICATION OF GLOBULIN
In the previous experiments the pur i f i cation procedure was carried
out "by repeated p ep tiza tion in 0.4M NaCl and p rec ip ita tio n hy d irec t
d ilu tio n a t a 1:4 r a t io . The resu ltin g product was white hut amorphous
in form. Since the substance obtained was not c r y s ta llin e in form, other
means than simple r e c r y s ta lliz a t io n had to be employed fo r p u r ifica tio n
and p o ss ib le fra c tio n a tio n .
I t was observed that when 100 ml. o f protein so lu tion (0.4M NaCl)
were d ir e c t ly d ilu ted with 400 ml. d i s t i l l e d water dropwise from a bur
e t t e , then allowed to stand fo r 12 hours at b°C., f in e cry sta ls formed
as noted by examination under a microscope. Thus, slow d ilu tio n , as
might be expected, encouraged the formation o f crystals*
An e f fe c t iv e d ia lyzin g apparatus fo r p rec ip ita tio n and p u r ifica tio n
of protein m aterial was constructed in th is laboratory and i s shown in
Figure 13* A g la ss tank o f seven l i t e r s capacity (IS in . x 6 in .) was
placed in an aluminum tray which was centered and fastened by screws to
a p u lley s ix inches in diameter. The p u lley was secured to the ax le o f
the stand of a cork boring machine by two set screws. Drive fo r the
system was obtained from a fra c tio n a l horsepower H.P.) motor coupled
to the a x le by means o f p u lley s . Round lea th er b e lts in . diameter)
were used to connect the p u lle y s . A four p u lley arrangement served to
reduce the motor speed from 1750 r.p.m . to 35 r.p .m . a t the a x le .
The d ia lyzin g membrane was three inch f la t width cellophane tubing
IS inches in len gth . The top o f the tube was fastened to a ring 1 J> fk inches
76
In diameter* The "base o f the tube was secured to an open-mouthy f la t -
bottomed g la ss b o tt le 1 3 f b inches a t top and 2 inches in depth* The
top ring rested in an E-shaped metal frame which was attached to the
rin g stand*
The apparatus was designed fo r slow, step -w ise, in d irect d ilu tio n
in order to obtain the desired p recip ita ted and c r y s ta llin e forms o f the
globulins* The amount o f d i s t i l l e d water added to the tank from a res
ervoir p laced above the tank was controlled by a stopcock. The appara
tus a lso could be used to remove the en tire sa lt content from a protein
so lu tio n by continuous addition o f water to the tank from the reservoir
and removal from the tank by siphoning u n t il the d ia lysin g water was
free o f ch loride io n s. And further, th is apparatus could be employed
to reduce a so lu tio n o f a known concentration to a lower desired concen
tra tio n . C alculations showing the reduction of concentration are shown
in Tables XXXII and XXXIII.
I t i s w ell known that p rotein so lu tion s that are rapid ly d ilu ted
d ir e c t ly by d i s t i l l e d water produce an amorphous form o f p rec ip ita te
which adsorbs many im p u rities. Slow d irect d ilu tio n produced cry sta ls
but the process was d if f ic u l t to con tro l. The slow in d irect d ilu tio n
device ju st described overcame these d i f f i c u l t ie s . The protein so lu tion
in the membrane was suspended in the tank containing s a lt so lu tio n o f
the same concentration as the so lu tion in the membrane. The slow addi
tio n o f d i s t i l l e d water to the d ia lyzing liq u id in the tank prevented
d irec t contact o f d i s t i l l e d water to the membrane. The membrane i t s e l f
gave the proper ra te o f d ilu tio n . Best r e su lts were obtained when the
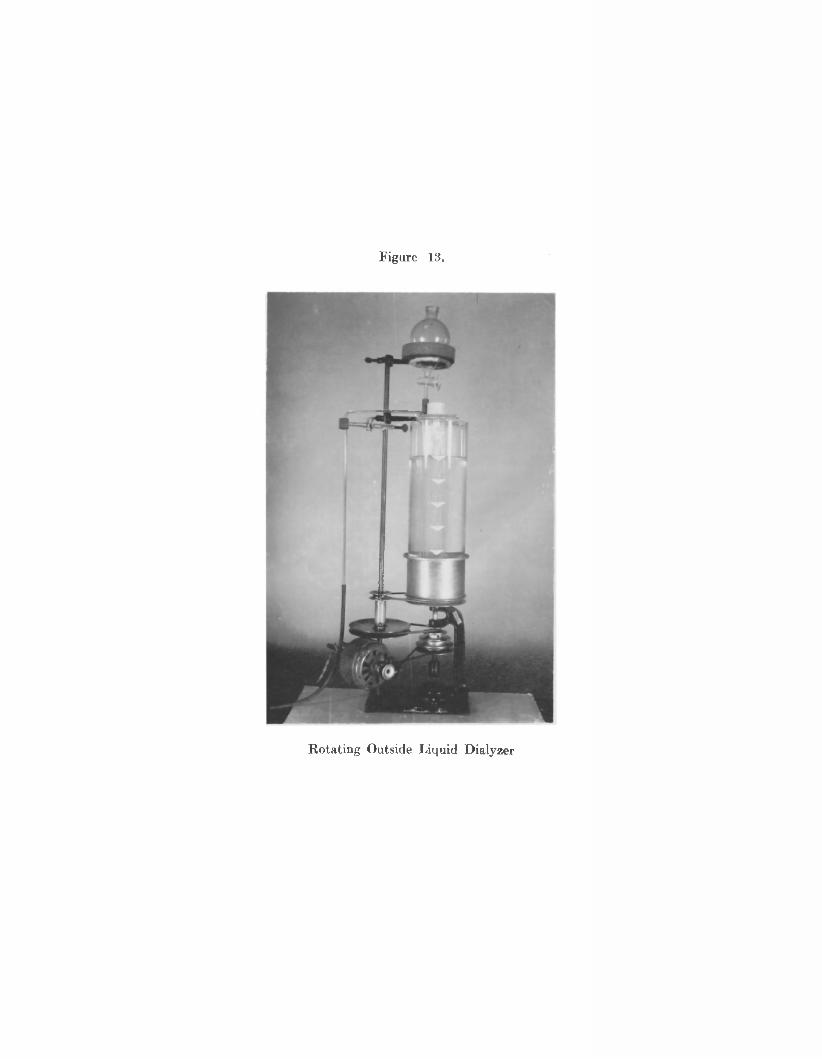
Figure 13.
Rotating Outside Liquid Dialyzer
ml.s o l .
10001000100010001000100010001000100010001000100010001000100010001000100010001000100010001000100010001000100010001000100010001000100010001000
i s
TABLE XXXII
DILUTION TABLE "1000"
ml. o f f in a lj la r ity Water Total Volume Cone.
Added
0 .4 142.8 1142.8 0.350.35 29 .4 1029.4 0 .340 .3 4 30.3 1030.3 0.330 .33 31.2 1031.2 0 .320 .32 32.2 1032.2 0.310.31 33.3 1033.3 0 .300 .30 34.4 1034.4 0 .290 .29 35.7 1035.7 0.280 . 2S 37.0 1037.0 0.270.27 38.4 1038.4 0 .260 .26 40.0 1040.0 0.250.25 41.6 104 l.b 0 .240 .2 4 43.4 1043.4 0.230 .23 45 .4 1045.4 0 .220 .22 47.6 1047.b 0.210.21 50.0 1050.0 0 .200.20 52.6 1052.6 0 .190.19 55-5 1055.5 0.180 .18 58.8 1058.8 0.170.17 b2.5 1062.5 0 .160 .16 66.6 1066.6 0.150.15 71.4 1071.4 0 . l40 .1 4 76.9 1076.9 0.130.13 83.3 IO83.3 0 .120 .12 90.9 1090.9 0.110 .11 100.0 1100.0 0.100 .10 111.1 1111.1 0.090.09 125.0 1125.0 0.080.08 142.8 1142.8 0.070.07 16b. 6 1166.6 0 .060 .06 200.0 1200.0 0.050.05 250.0 1250.0 0 .040 .0 4 333.3 1333.3 0.030.03 500.0 1500.0 0.020 .02 1000.0 2000.0 0.01
79
TABLE XXXIII
DILUTION TABLE "lOOOx"
Ml. Sol to be D ilu ted M olarity
Ml. o fWaterAdded Total Volume
FinalGone.
1000 0 .4 142.8 1142.8 0.351142.8 0 .35 33*6 1176.4 0 .341176.4 0 .34 35.7 1212.1 0.331212.1 0.33 37.8 1250.0 0 .321250.0 0 .32 40.3 1290.3 0.311290.3 0.31 43.0 1333.3 0.301333.3 0 .30 46.0 1379.3
1428.50.29
1379.3 0.29 49.2 0.281428.5 0.28 52.9 1481.4 0.271481.4 O.27 57.0 1538.4 0.26153S .4 0 .2 6 61.6 1600.0 O.251600.0 0 .25 66.6 1666.6 0 .241666.6 0 .2 4 72 .4 1739.0 0.231739.0 0 .23 79.0 1818.0 0 .221818.0 0 .2 2 86.8 1904.8 0.211904.8 0 .21 95.2 2000.0 0.202000.0 0.20 105.2 2105.2 0.192105.2 0.19 117.0 2222.2 0.182222.2 0.18 130.7 2352.9 0.172352.9 0.17 147.1 2500.0 0.162500.0 0 .16 166.6 2666.6 0.152666.6 0.15 190.5 2857.1 0 . l42857.1 0 . l4 219.8 3076.9 0.133076.9 0.13 256.4 3333.3 0.123333.3 0.12 303.0 3636.3 0.113636.3 0.11 363.7 4000.0 0.104ooo.o 0.10 444.4 4444.4 0.094444.4 0.09 555.6 5000.0 0.085000.0 0.08 714.3 5714.3 0.07571^.3 0.07 952.4 6666*7 0.066666.7 0 .0 6 1333.3 8000.0 0.058000.0 0.05 2000.0 10000.0 0 .04
so
p o s it io n of the membrane was eccen tr ic , thus creating a gen tle a g ita tio n
o f the d ia ly z in g water when the tank was rota ted . Another important point
was to f i l l the membrane no more than three-fourths f u l l . When immersed
in the tank, the so lu tio n in the membrane rose to the le v e l o f the out
sid e d ia ly z in g water. Ehis increased the in ter fa ce between so lu tio n and
the cellophane membrane. When the tank was rotated , both the d ia lyzin g
water and the so lu tion were gen tly a g ita ted . I f the membrane was com pletely
f i l l e d , there was l i t t l e or no movement in sid e the membrane. Movement
in sid e the membrane aided in esta b lish in g an equilibrium more promptly
w hile s t i l l m aintaining the proper rate o f d ia ly s is .
SI
APPLICATION OP THE SLOW STEPWISE DILUTION PROCEDURE AND ROTATING OUTSIDE LIQUID DIALYSIS FOR THE PURIFICATION OF MUNG BEAN GLOBULIN
A 300 ml. portion o f a preparation o f Mung "bean p rotein extracted
with 0 .4 m NaCl, p rec ip ita ted By 1 :4 d ilu tio n and red isso lved in O.Uil
NaCl was placed in cellophane tubing. The d ia lyzer was suspended in the
d ia ly z in g tank which was a lso h a lf f u l l o f O.lJM NaCl so lu tio n . The le v e l
o f the so lu tio n in the tank was then adjusted to the le v e l o f the protein
so lu tio n in the cellophane tube*
The in d ir e c t , slow, step-w ise d ilu tio n was begun by introducing d is
t i l l e d water from the reservo ir in to the d ia lyzin g tank by means of g la ss
tubing. The flow was con tro lled by a stopcock to that o f 500 ml. per
hour. The water le v e l o f the tank slow ly rose to the s ix l i t e r mark.
The d ia ly z in g water le v e l was maintained at the s ix l i t e r mark by means
o f siphoning. The d ia ly z in g water le v e l could be adjusted to any height
by regu lating the len gth o f the siphon tube.
The d ia ly s is o f the 300 ml. protein so lu tio n , covered w ith toluene,
was allowed to proceed overnight. At that time two d is t in c t la y ers o f
p re c ip ita te were observed in the bottom of the cellophane membrane. The
lower fra c tio n was fa in t yellow ish in co lor and the upper portion was a
snowy white* f lu f f y m ateria l. T en tative ly the symbol G j was assigned
to the m aterial in the upper layer and Gg to that o f the lower la y er .
The two portions were separated by pouring the contents o f the c e llo
phane tube in to a beaker. The upper layer or G poured out but the lower
la y er o f Gg was gela tin ou s m aterial and firm ly packed in the bottom of
82
the tube.
To further p u rify the Gg fra c tio n the gelatin ou s m aterial was red is
solved in 300 ml* o f 0.*(M NaCl so lu tion . The so lu tion was centrifuged
to remove any in so lu b le m ateria l. The so lu tio n was of b lu ish opalescence.
The c la r i f ie d p rotein so lu tion was placed in the d ia lyzin g cellophane
tube and d ia ly s is proceeded as previously described. When an equal
amount o f water had been added to the tank, Gg was rep recip ita ted . At
th is point the approximate NaCl concentration was 0.2M. I t was observed
that the d ia ly sa te appeared cloudy with white f lu f f y m aterial suspended
throughout.
DETERMINATION OF THE MOLAR CONCENTRATION OE SODIUM CHLORIDE AT WHICH THE Gg FRACTION PRECIPITATES FROM THE EXTRACT
A fresh 0.4M NaCl extract was prepared according to the previously
described standardized procedure. The cen trifu gate was d ilu ted with four
volumes o f d ia t i l le d water and allowed to stand four hours u n t i l the pre
c ip ita t io n was complete. The p rec ip ita tio n was separated by centrifuga
t io n . The p re c ip ita te was redispersed with 0.4M NaCl, s t ir r in g u n t i l
i t was com pletely d isso lv ed . The m aterial was centrifuged to remove the
in so lu b le m aterial or globulin-bound substance (Gb). The c la r if ie d solu
t io n in 0.4M NaCl contained the to ta l g lobu lin and was used fo r the deter
m ination o f the molar concentration at which Gg p r e c ip ita te s .
The molar concentration o f NaCl at which Gg p rec ip ita ted from the
so lu tio n containing to ta l g lob u lin s was determined by in d ire c t, slow,
step -w ise d ilu tio n procedure with the d ia lyzin g apparatus. For th is
work a 350 ml. portion o f 0.4M NaCl so lu tio n containing the to ta l g lob u lin s
83
was placed in the cellophane tube and 2650 ml. o f 0.4M NaCl so lu tion
were placed in the tank. The protein so lu tio n was covered with a th in
f ilm o f to lu en e . There was, th erefore, a to ta l o f 3000 ml. o f 0.414 NaCl
so lu tio n i f both the so lu tion in sid e and that outside the cellophane
tube were considered.
The in d ir e c t , slow, step -w ise d ilu tio n procedure was carried out
by adding to the tank from a separatory funnel a measured volume o f water
a t a speed o f 100 ml. per hour while the tank was ro ta tin g . The f i r s t
measured volume o f water added was 482.6 m l.. This volume was used so
that the f in a l ca lcu la ted concentration o f NaCl in the tank and tube would
be 0.35M. A fter the 4-82.6 ml. were added, the tank and tube were rotated
fo r a period o f time to allow the m aterial on both s id es of the membrane
to reach equilibrium . I t was noted that there was no sign o f p rec ip ita
t io n . Therefore a second measured volume of water was added. This vo l
ume o f 100.8 ml. brought the f in a l concentration to 0.34-M. Time was a l
lowed for equilibrium to be reached. Since there was not sign o f precip
i ta t io n , further d ilu tio n with water was continued in measured volumes
w ith time allow ed to e s ta b lish equilibrium a fte r each ad d ition . Notation
o f the tank was continuous throughout the en tire procedure. The r e su lts
showing each ad d ition , the f in a l concentration o f NaCl and v isu a l obser
vation made during the experiment were recorded in Table XXXIV.
I t was observed that the dialysat.e began to cloud when the ca lcu l
a ted concentration was O.23M NaCl and mass p rec ip ita tio n occurred at .22M.
Since the cloudiness o f the d ia ly sa te not only p ers is ted but increased
a t lower concentrations, i t was somewhat confusing as to what d e f in ite
84
s a lt concentration Gg com pletely precip itated* Farther means were
sought for determ ination of the p recise NaCl concentration at which Gg
p recip itated*
TABLE XXXIV
DETERMINATION OF THE MOLAR CONCENTRATION OF NaCl AT WHICH Gg PRECIPITATES
( in d ir e c t , slow, step -w ise d ilu tio n )
Total Vol.o f So l. in M olarity ml. Water Total Final VisualTank and Tube
o f NaCl Added Volume Cone. Observation
3000 0 .4 482.6 3428.6 0.35 no ppt.3428.6 O.35 100.8 3529.^ 0.34 no ppt.3529.4 0.34 106.9 3636.3 0.33 no ppt.3636.3 0*33 113.6 3750.0 0 .32 no ppt.3750.© 0*32 121.0 3371.0 0.31 no ppt.3871.0 0*31 129.0 4000.0 0.30 no ppt.4000.0 0*30 137*9 4137-9 0.29 no ppt.4137*9 0.29 147.8 4285.7 0.28 no ppt.4285.7 0.28 158.7 4444.4 0.27 no ppt.4444.4 0.27 170.9 4615.4 0 .26 no ppt.4615.4 0 .26 184.6 4800.0 0.25 no ppt.4800.0 0.25 200.0 5000.0 0 .24 no ppt.5000.0 0 .24 217.3 5217.4 0.23 s lig h t clouding5217.4 0.23 237.1 5454.5 0.22 ppt. occurred5454.5 0.22 259.7 571^.3 0.21 cloudiness5714.3 0.21 285.7 6000.0 0.20 F loccu la tion
complete
This further study o f the proper molar concentration was conducted with
a new batch o f g lob u lin preparation from which the globulin-bound sub
stance was removed. The d ir e c t , slow, step-w ise d ilu tio n method was
again employed* To each o f the fo llow in g ser ie s o f nine 100 ml* grad
uated cy lin d ers a 50 ml. portion o f g lob u lin so lu tion in 0.4M NaCl was
added. Varied volumes o f d i s t i l l e d water were added to each cylinder
from a burette dropwise u n t i l the desired approximate concentration was
reached in each in sta n ce . The so lu tion s were gen tly s tirred and stored
85
a t 6°0. for 12 hoars* The r e su lts as recorded in Table XXXV were observed*
TABLE XXXV
DETERMINATION OF THE MOLAR CONCENTRATION 0? NaCl AT WHICH &2 PRECIPITATES (D irect D ilu tion Method)
rlinder Ml. Globulin in 0.4M
NaCl
Ml. Water Final Added M olarity
Approximate Amt* in Ml. a fte r 12 hr s . a t 6°C*
1 . 50 12.5 0.32 no ppt*2 . 50 16.65 0.30 no ppt.3. 50 21.43 0.28 no ppt.4 . 50 26.9 0 .26 no ppt.5 . 50 33.3 0 .24 incomplete ppt.6 . 50 40.9 0*22 2.87 . 50 50.0 0.20 3 .08 . 50 61.1 0.18 4 .0■9. 50 75.0 0 .16 10.0
The ch a r a c te r is t ic s o f the system in each o f the nine cylinders
are described below*
Cylinders Nos. 1 through 4 were a lik e in having no sign o f p r ec ip i.
ta tio n or cloudiness*
In cy lin d er No* 5 there was incomplete p rec ip ita tio n . There was
no sharp d iv id in g l in e or boundary between p rec ip ita tio n and supernatant.
In cy lin d er No. 6 dense p rec ip ita tio n occurred which appeared as
a fa in t yellow , opalescent m aterial* The volume o f p rec ip ita te waso
about 2 .8 ml. a f te r standing 12 hours a t 6 C.
In cy lin d er No. 7 p rec ip ita tio n appeared, somewhat whiter than
in No. 6.
Cylinder No. 8 produced a p rec ip ita te which appeared w hiter than
No. 7 and was la rg er in volume. I t was further noticed that there was
a very small amount o f white f lu f f y p rec ip ita tio n on top o f the p rin cip al
86
p r e c ip ita te . This did not occur in No. 7*
In cy lin d er No. 9 p rec ip ita tio n was complete and was uniformly
w h itish . I t had the la rg es t volume (10 m l.) and was id iiter than No* 7*
The supernatant was the c le a r e s t o f any in the s e t .
The in d ica tio n s from th is study of the molar concentration at which
Gg p re c ip ita te s could he summarized in the fo llow in g manner. The p rec ip i
ta te in cy linder No. 6 a t the concentration o f 0.22M which exh ib ited
fa in t yellow colored, opalescent m aterial was Gg which had been iso la te d
by slow, step -w ise continuous d ilu tio n . The volume, 2 .8 m l., was small
but apparently dense. Cylinder No. 9 at m olarity o f 0.1b had the la rg est
volume o f p r e c ip ita te but e n tir e ly lo s t the Gg ch a ra c ter istic appearance.
Therefore, 0.16M NaCl did not seem advisable fo r fra ctio n a tio n o f Gg.
In both cylinder No. 7 8114 No. 8 the p rec ip ita tio n s were probably com
posed o f Gg fra c tio n but they had been contaminated with other globulin
fr a c tio n s . Nrom the above observations, i t appeared that Gg in pure
fra c tio n p rec ip ita ted b est at 0 .22 molar concentration o f NaCl.
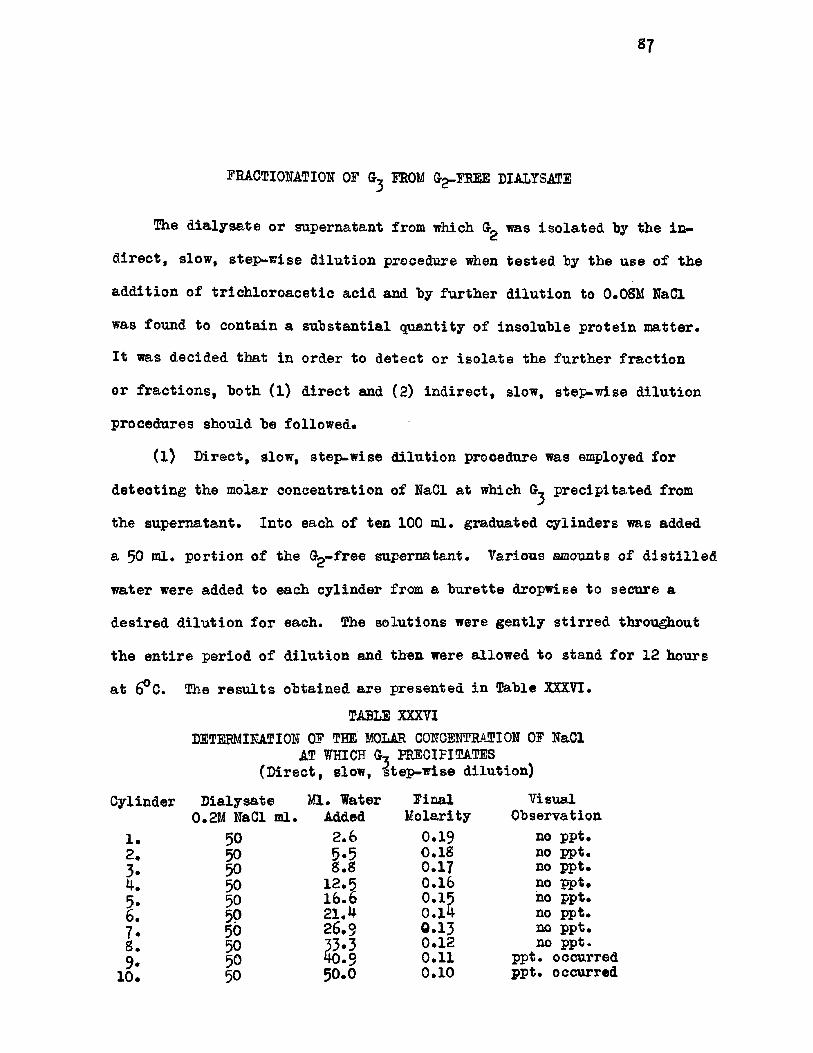
87
FRACTIONATION OF G FROM G -FREE DIALYSATE
The d ia ly sa te or supernatant from which G was iso la te d by the in
d ir ec t , slow, step -w ise d ilu tio n procedure when tested by the use o f the
ad d ition o f tr ic h lo r o a ce tic acid and by further d ilu tio n to 0.08M NaCl
was found to contain a su b stan tia l quantity o f in so lu b le p rotein m atter.
I t was decided that in order to detect or is o la te the further fra c tio n
or fr a c tio n s , both (1) d irect and (2) in d ire c t, slow, step-w ise d ilu tio n
procedures should be fo llow ed.
( l ) D irect, slow, step-w ise d ilu tio n procedure was employed for
d etectin g the molar concentration of NaCl at which G p recip ita ted from
the supernatant. Into each of ten 100 ml. graduated cylinders was added
a 50 oil* portion o f the G^-free supernatant. Various amounts o f d i s t i l l e d
water were added to each cylinder from a burette dropwise to secure a
desired d ilu tio n for each. The so lu tion s were g en tly s tirred throughout
the en tire period o f d ilu tio n and then were allowed to stand fo r 12 hours
a t 6°C. The r e s u lts obtained are presented in Table XXXVI.
TABLE XXXVIDETERMINATION OF THE MOLAR CONCENTRATION OF NaCl
AT WHICH G-z ERECIFITATES (D irec t, slow, itep -w ise d ilu tion )
Cylinder D ialysate Ml. Water 0.2M NaCl ml. Added
1. 50 2.62. 50 5*53. 50 8.S4 . 50 12 .55. 50 16.66. 50 21 .47* 50 26. SS. 50 33*39. 50 40-9
10. 50 50.0
Final VisualM olarity Observation
0.19 no ppt.0.1S no ppt.0.17 no ppt.0 .16 no ppt.0.15 ho ppt.0 .14 no ppt.0 .13 no ppt.0 .12 no ppt.0.11 ppt. occurred0.10 ppt. occurred
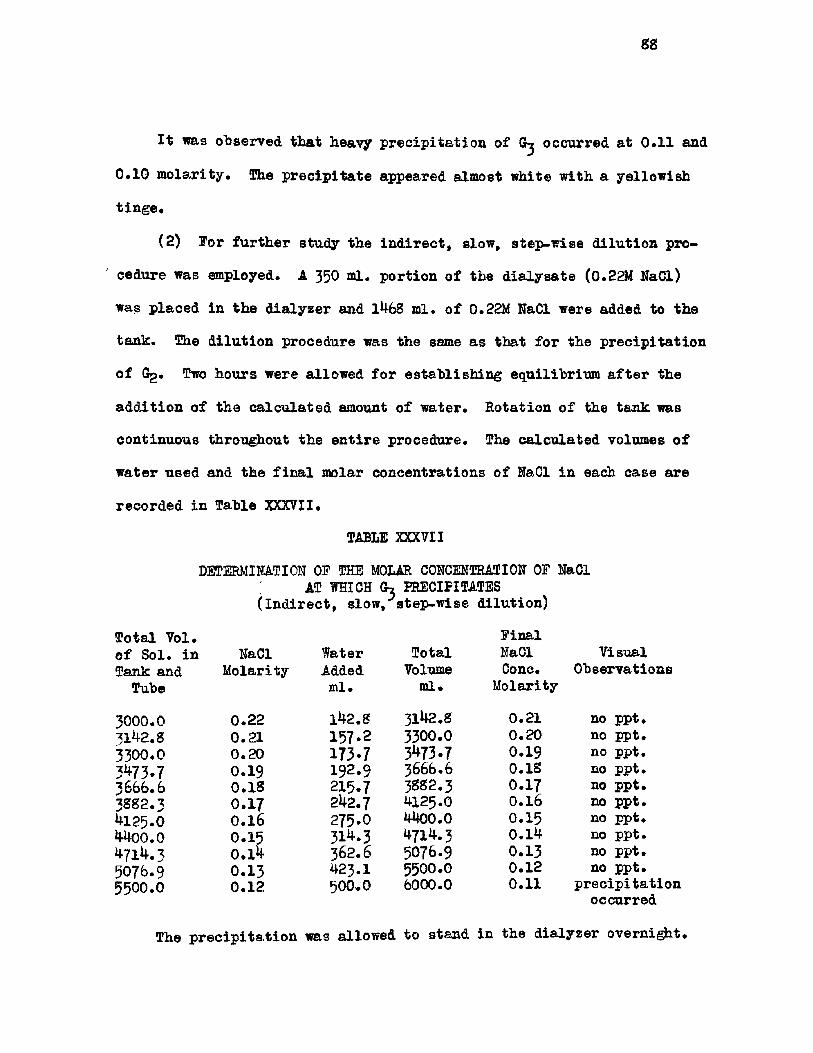
sg
I t was observed that heavy p rec ip ita tio n of G-j occurred at 0»11 and
0 .10 m olarity . The p rec ip ita te appeared almost white with a yellow ish
t in g e .
(2) For further study the in d ire c t, slow, step-w ise d ilu tio n pro
cedure was employed. A 350 ml. portion o f the d ia ly sa te (0.22M NaCl)
was placed in the d ia lyzer and 1468 ml. o f 0.22M NaCl were added to the
tank. The d ilu tio n procedure was the same as that for the p rec ip ita tio n
o f Gg. Two hours were allowed fo r esta b lish in g equilibrium a f te r the
a d d ition o f the ca lcu la ted amount o f water. Rotation o f the tank was
continuous throughout the en tire procedure. The calcu lated volumes o f
water used and the f in a l molar concentrations o f NaCl in each case are
recorded in Table XXXVII*
TABLE XXXVII
DETERMINATION OE THE MOLAR CONCENTRATION OF NaCl ; AT WHICH 0 , PRECIPITATES (In d ir ec t , slow, step -w ise d ilu tion )
Total Vol. F inalo f Sol. in NaCl Water Total NaCl VisualTank and M olarity Added Volume Cone. Observations
Tube ml. ml. Molarity
3000.0 0 .22 142.8 3142.8 0.21 no ppt.3142.g 0.21 157.2 3300.0 0.20 no ppt.3300.0 0 .20 173.7 3^73.7 0.19 no ppt.3473.7 0.19 192.9 3666.6 0.18 no ppt.3666.6 0 .18 215.7 3882.3 0.17 no ppt.3SS2.3 0.17 242.7 4125.0 0.16 no ppt.4125.0 0 .1 6 275.0 4400.0 0.15 no ppt.4400.0 0.15 31*. 3 4714.3 0 .14 no ppt.4714.3 0 . l4 362.6 5076.9 0.13 no ppt.5076.9 0 .13 423.1 5500.0 0 .12 no ppt.5500.0 0 .12 500.0 6000.0 0.11 p rec ip ita tio n
occurred
The p re c ip ita tio n was allowed to stand in the d ia lyzer overnight.
89
At the end o f t h is period the p rec ip ita tio n was complete.
The p r ec ip ita te was very easy to separate from the supernatant as
i t was packed in the hot tom o f the d ia ly ser and remained there when the
supernatant was poured off* The p rec ip ita te was very so lu b le in 0.4M
NaCl and gave a c lear so lu tio n without stirrin g* From the above data
i t may be concluded that the NaCl molar concentration a t which pre
c ip ita te s i s 0.11*
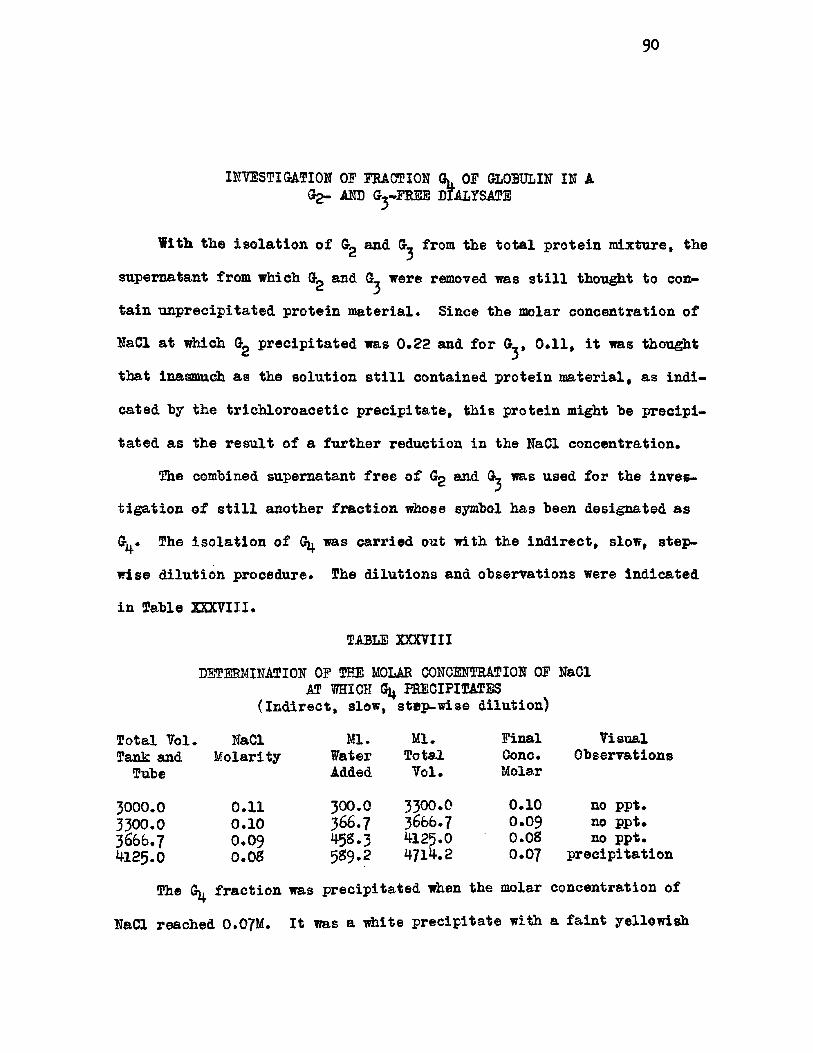
90
INVESTIGATION OF FRACTION \ OF GLOBULIN IN A Gg- AND G,-FRSE DIALYSATE
V Itli. the is o la t io n o f Gg and G from the to ta l protein mixture, the
supernatant from which Gg and G were removed was s t i l l thought to con
ta in unp recip itated protein m ateria l. Since the molar concentration o f
NaCl a t which Gg p recip ita ted was 0 .22 and fo r G , 0*11, i t was thought
that inasmuch as the so lu tion s t i l l contained protein m ateria l, as in d i
cated by the tr ic h lo r o a c e tic p r e c ip ita te , th is protein might be p recip i
ta ted as the re su lt o f a further reduction in the NaCl concentration.
The combined supernatant free o f Gg and G was used fo r the inves
t ig a t io n o f s t i l l another fra c tio n whose symbol has been designated as
G . The is o la t io n o f G was carried out with the in d ir e c t, slow, step
w ise d ilu tio n procedure. The d ilu tio n s and observations were ind icated
in Table XXXVIII.
TABLE XXXVIII
DETERMINATION OF THE MOLAR CONCENTRATION OF NaCl AT WHICH PRECIPITATES
(In d irec t, slow, stepuwise d ilu tion )
Total Vol. NaCl Ml. Ml. Final VisualTank and M olarity Water Total Cone. Observations
Tube Added Vol. Molar
3000.0 0.11 300.0 3300.0 0.10 no ppt.3300.0 0.10 366.7 3666.7 0.09 no ppt.3666*7 0.09 458.3 4125.0 0.08 no ppt.4125.0 0 .0s 589.2 471^.2 0.07 p rec ip ita tio n
The G fr a c tio n was p recip ita ted when the molar concentration of
NaCl reached 0.07M. I t was a white p rec ip ita te with a fa in t yellow ish
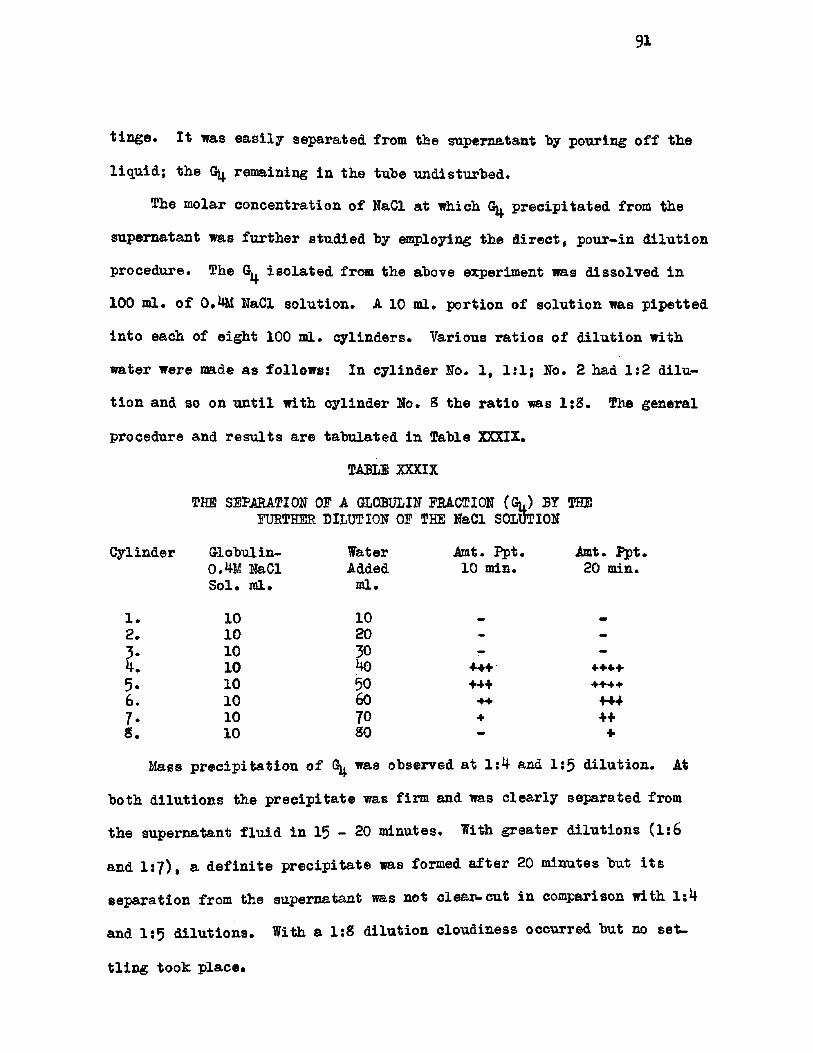
91
t in g e . I t was e a s ily separated from the supernatant "by pouring o f f the
liq u id ; the Gjj, remaining in the tube undisturbed.
The molar concentration o f NaCl at which p rec ip ita ted from the
supernatant was further studied by employing the d ir e c t , pour-in d ilu tio n
procedure. The G iso la te d from the above experiment was d isso lved in
100 ml. o f O.Mji NaCl so lu tio n . A 10 ml. portion o f so lu tio n was p ip etted
in to each of e igh t 100 ml. cy lin d ers. Various r a tio s o f d ilu tio n with
water were made as fo llow s: In cylinder No. 1, 1:1; No. 2 had 1:2 d ilu
t io n and so on u n t i l with cylinder No. 8 the ra tio was 1 :8 . The general
procedure and r e su lts are tabulated in Table XXXIX.
TABLE XXXIX
THE SEPARATION OF A GLOBULIN FRACTION (GO BY THE FURTHER DILUTION OF THE NaCl SOLUTION
Cylinder Globulin- Water Amt. Ppt. Amt. Ppt.0.4M NaCl Added 10 min. 20 min.S o l. ml. ml.
1 . 10 10 _
2. 10 20 — -
3* 10 30 - -4 . 10 40 +4+ 44+45- 10 50 44+ 44446. 10 6o +4 +4+7* 10 70 4 ++8 . 10 80 - 4
Mass p re c ip ita tio n o f G was observed at 1 :4 and 1:5 d ilu tio n . At
both d ilu tio n s the p rec ip ita te was firm and was c lea r ly separated from
the supernatant f lu id in 15 - 20 minutes. With greater d ilu tio n s (1 :6
and 1 :7 ) , a d e f in ite p rec ip ita te was formed a fte r 20 minutes but i t s
separation from the supernatant was not c lear-cu t in comparison with 1:4
and 1:5 d ilu tio n s . With a 1:8 d ilu tio n cloudiness occurred but no se t
t l in g took p la ce .
92
The va ria tio n in the character of the ahove p re c ip ita te s in d icated
a d ifferen ce in the in s o lu b il i ty o f g lobu lins a t d iffer e n t low concentra
t io n s of NaCl so lu tio n . A 0.4M NaCl so lu tion when d ilu ted with four
volumes o f d i s t i l l e d water (1:4) has approximately a concentration o f
0.08M and the 1:5 ra tio lowers the concentration to 0.06M.
The molar concentration o f NaCl at which p recip ita ted was deter
mined to be between 0.08 and O.ObM when the d irect d ilu tio n procedure
was used and 0 . 07M when the in d ir ec t, slow, step-w ise d ilu tio n method
was employed*
The supernatant from which had been removed was studied s t i l l
fu rth er. Further reduction o f the s a lt concentration of the supernatant
was carried out w ith the in d ir ec t, slow, step-w ise d ilu tio n method. The
d ia ly sa te appeared cloudy but no p rec ip ita tio n occurred. The d ia ly s is
Was further carried to the point where there were p r a c tic a lly no chloride
ion s but no p rec ip ita tio n occurred. The d ia ly sa te was transferred to a
container and stored a t 6°C. There was an increase in cloudiness but
no p r e c ip ita tio n .
93
A QUANTITATIVE APPLICATION OF TEE PROCEDURE FOR FRACTIONATIONOF MUNG BEAN GLOBULINS
The procedure previously described fo r the separation o f Mung bean
g lo b u lin s , Gg, Gj, G -was subjected to a q u an titative study. Mung bean
meal extracted with 0.4M NaCl so lu tion and freed o f globulin-bound sub
stance was used fo r th is q u an tita tive work. A portion o f th is so lu tion
was analyzed fo r to ta l nitrogen and found to contain 0.004671 grams of
nitrogen per m l.
Separation o f Gg. The 300 ml. o f 0.4M Nad so lu tion containing
to ta l g lob u lin s and a to ta l o f 1.4014 grams o f nitrogen were placed in
a clean cellophane membrane and 27OO ml. o f 0.4M NaCl so lu tion were in
troduced in to the d ia lyzin g tank. Total volume of the so lu tion s in the
and tank were 3000 m l. o f 0.4M NaCl. The in d ire c t, slow, step -w ise d i
lu tio n procedure was employed for the fra c tio n a tio n o f the g lob u lin Gg
from the to ta l g lob u lin m ixture. Gg was previously determined to pre
c ip ita te a t 0.22M NaCl, therefore 2454 ml. o f d i s t i l l e d water were added
to the tank in order to bring the to ta l volume to 5454 ml. and to have
a f in a l concentration o f 0.22M NaCl. D is t i l le d water was added a t a
slow ra te , two drops per second, from a separatory funnel extended with
g la ss tubing so that the lower end was immersed in the d ia lyzin g water
in the tank. Twelve hours were allowed for completion o f p rec ip ita tio n
and sedim entation. The Gg fr a c tio n c o lle c te d in the bottom o f the b o tt le
which was attached to the end o f the cellophane membrane. The fra c tio n ,
Gg, formed a sem i-so lid paste and was easy to separate from the superna
tant by decantation o f the la t t e r . The supernatant was centrifuged and
9^
the e n tir e Gg fra c tio n was c o lle c te d and d isso lved in 250 ml. o f 0.4M
NaCl. Two 10 ml. a liq u o ts were taken for Kjeldabl nitrogen determ ination.
Total n itrogen content o f the Gg fra ctio n was 0.572 grams or 40.8 percent
of the to ta l g lob u lin o f Mung bean.
F ractionation o f Gj. The supernatant from which Gg was removed was
made to 300 ml. volume with 0 .2 2M NaCl so lu tion and placed in a clean
cellophane membrane. A volume o f 2,700 ml. o f 0.22M NaCl d ia lyzin g water
was introduced in to the tank. The volume o f so lu tion s in tube and tank
was 3,000 ml. o f 0.22M NaCl. A volume of 3»000 ml. o f d ia t i l le d water
was added to the tank to bring the to ta l volume to 6000 ml. and to a f in a l
concentration o f 0.11M NaCl. Twelve hours were allowed for completion
o f the p re c ip ita tio n . The fra c tio n , Gj, was p a ste - lik e in form and was
separated by decantation. The supernatant was centrifuged. The p recip i
ta te c o lle c te d was combined with the G and was d isso lved in 250 ml. o f
O.MM NaCl so lu tio n . Two 10 ml. a liq u ots were taken for Kjeldahl n itrogen
determ ination. Nitrogen content o f the G fra c tio n was 0.58658 gm. or
49 percent o f the to ta l g lob u lin of Mung bean.
Fractionation o f G4 * The supernatant from which G had been removed
was made to 300 ml, volume with 0.11M NaCl so lu tion and placed in a clean
cellophane membrane. A volume o f 27OO ml. o f 0.11M NaCl so lu tio n was
placed in the tank. The in d ire c t, slow, step-w ise d ilu tio n was carried
out as b efore. A volume o f 1 ,714 ml. o f d i s t i l l e d water was added to
the tank to bring the to ta l volume to 4714 ml. and the f in a l concentra
t io n to 0 . 07M NaCl. Twelve hours were allowed fo r the completion o f pre
c ip ita t io n o f Gjj, which was separated from the supernatant by centrifuga
t io n . The amount o f G4 obtained was small and was d isso lved in 100 ml.
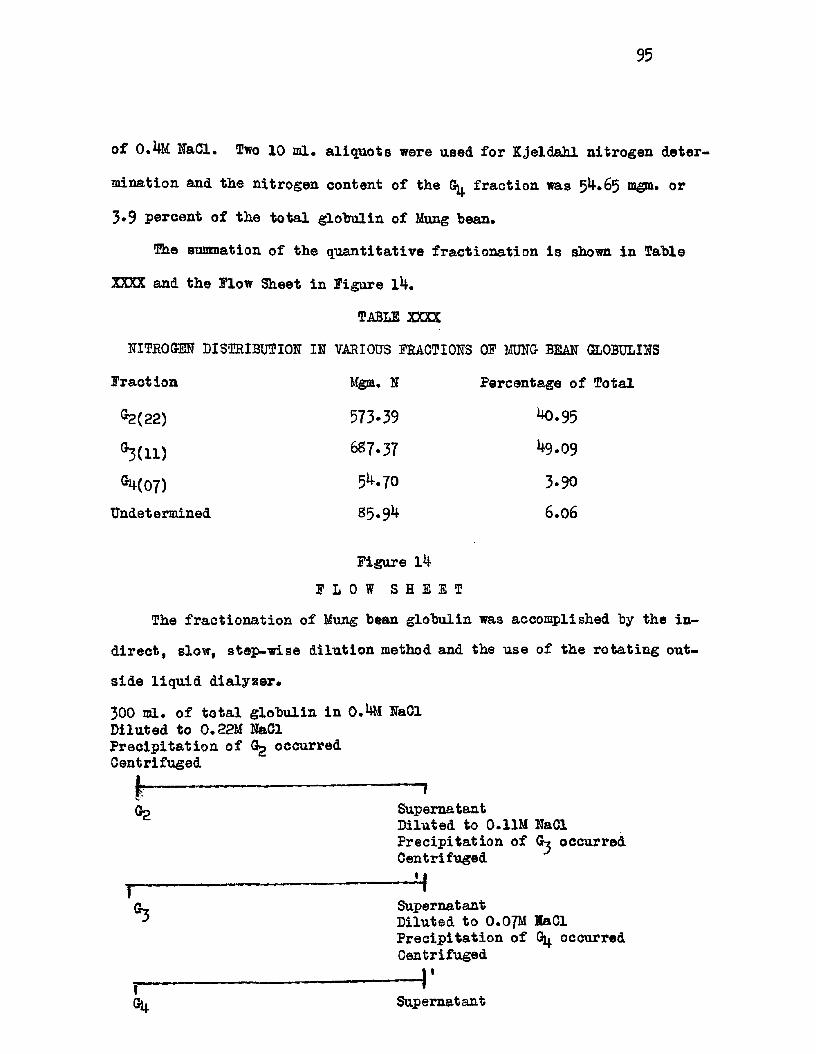
95
o f 0.4M NaCl. Two 10 ml. a liq u o ts were used for Kjeldahl n itrogen deter
m ination and the nitrogen content o f the G fra c tio n was 54*65 or
3*9 percent o f the to ta l g lob u lin o f Mung bean.
The summation o f the q u an tita tive fra ctio n a tio n i s shown in Table
XXXX and the Flow Sheet in Figure 14.
TABLE XXXX
NITROGEN DISTRIBUTION IN VARIOUS FRACTIONS OF MUNG BEAN GLOBULINS
Fraction Mgm. N Percentage o f Total
g2(22) 573*39 40.95
G3 (U ) 687*37 49.09
0^(07) 54.70 3*90
Undetermined 85.94 6.06
Figure l4
F L O W S H E E T
The fra ctio n a tio n o f Mung bean g lob u lin was accomplished by the in
d ir e c t , slow, step -w ise d ilu tio n method and the use of the ro ta tin g out
s id e liq u id d ia ly 2er*
300 ml. o f to ta l g lo b u lin in 0.4M NaCl D iluted to 0.22M NaCl P r ec ip ita tio n o f Gg occurred CentrifugedI----------------- ,
Gh SupernatantD iluted to 0.11M NaCl P recip ita tion o f Gj occurred Centrifuged
---------------------------------------------------------------— 4rGy Supernatant
T -----------------------Gfy Supernatant
D iluted to 0.07M XaCl P rec ip ita tio n of Gfy occurred Centrifuged
— I '
96
PURIFICATION OF FRACTIONATED MUNG BEAN GLOBULINS
There i s no sharp d iv id ing l in e between th is procedure and that o f
fra c tio n a tio n . Since the purpose o f th is work was the preparation o f
s in g le g lo b u lin components, i t was necessary to remove small q u a n tities
o f other fr a c tio n s and substances which were associa ted with or adsorbed
by these fraction ated globulins*
PURIFICATION OF THE PRECIPITATE Gg* For p u r ifica tio n , the Gg fra c tio n
was dispersed in 0.4m NaCl* A fter the p rec ip ita te was completely d is
solved, the so lu tio n was centrifuged to remove traces o f in so lu b le mate
r ia l . For r e -p rec ip ita tio n o f the G2 fra c tio n , the so lu tion was in tro
duced in to cellophane tubing and the concentration was lowered to 0.22M
NaCl by membrane eq u ilib ra tio n d ilu tio n . The p rec ip ita te formed in the
tubing and was separated from the supernatant by cen trifu gation . The
supernatant was discarded*
On repeating the p u r ifica tio n process i t was observed that there
was a reduction in the quantity o f the Gg fra c tio n . Further p u r ifica tio n
produced con stan tly dim inishing quantity o f Gg. By lowering the max imum
p re c ip ita tio n concentration of Gg to 0.20M and la te r to 0.18M NaCl,
approximately the o r ig in a l amount o f p rec ip ita te was obtained*
This change in p rec ip ita tin g concentration led to further in v e s t i
ga tion . A Gg fr a c tio n was subjected to e lectrop h oretic a n a ly sis and
found to be composed o f two d is t in c t components which co—p recip ita ted
together a t 0.22M NaCl, see Figure 15* Throu^a repeated d isso lu tio n
and p re c ip ita tio n , w ith removal o f traces o f in so lu b le dark m aterial
97
from the mixture by cen trifu gation , the maximum p rec ip ita tin g concen
tr a tio n o f Gg was lowered to 0.18M NaCl. I t was evident that the Gg
fr a c tio n contained certa in substances other than the two g lob u lin com
ponents and a l l were co-p recip ita ted together at 0.22M NaCl. A fter re
peating the d isp ersio n -p rec ip ita tio n o f Gg and removing a small quantity
of the dark substance, the maximum p rec ip ita tin g concentration was low
ered to 0.1SM NaCl. Such a complex formation may be expected to a ffe c t
the s o lu b il i t y of the ind ividual components. This suggested to the
author that a more e f fe c t iv e method should be sought for the removal o f
the dark colored substance.
RESOLUTION OF THE Gg FRACTION. The Gg fra c tio n was dispersed in 0.4m
NaCl and placed in cellophane tubing which was suspended in a ro ta tin g
ou tsid e liq u id d la lyzer containing d is t i l l e d water. The volume o f d is
t i l l e d water was ten tim es greater than that o f the p rotein so lu tion in
the cellophane tubing. In comparison with the previously described in
d ir e c t , slow, step -w ise membrane-equilibration d ilu tio n procedure, th is
procedure may be designated as d ir ec t , rapid membrane-equilibration.
P rec ip ita tio n occurred in the cellophane tubing w ithin 15 minutes but
the ro ta tio n o f the tank was continued for two hours. In two hours of
d ia lyzin g equilibrium was not reached but th is was to permit the sed i
mentation o f a dark, dense p rec ip ita te while a white f lu f fy p rec ip ita te
was separated from the dark m aterial by decantation. The dark p recip i
ta te was subjected to d isso lu tio n fo r a second time and a sim ilar phen
omenon occurred. As more white f lu f f y m aterial went in to suspension,
l e s s o f the dark m aterial was l e f t in the tube. The process o f reso lu tio n
98
was repeated u n t i l l i t t l e or none o f the white m aterial formed* The
reso lu tio n process was then considered complete. The f in a l residue o f
the Gg fr a c tio n was d isso lved in 0.4M NaCl so lu tion and became very
dark, b lu ish -purple in co lor but was not studied further.
TRACT IONATI ON OF THE RESOLVED PRODUCTS OF Gg. Nhen two volumes of d is
t i l l e d water were added to the to ta l c o lle c t io n of decantations o f the
reso lved product o f the Gg fra ctio n , the protein p rec ip ita ted immediately.
This was allowed to stand overnight a t 4°C. The protein was separated
from the water by cen trifu gation and the p rec ip ita te was red isso lved in
O. -M NaCl. A fter the p rec ip ita te was completely dispersed, i t was cen
tr ifu g ed to remove in so lu b le p a r t ic le s . The so lu tion was ready for frac
t io n a tio n . The c la r if ie d protein so lu tion was placed in a cellophane
membrane which was immersed in NaCl so lu tion of the same concentration
(O. iM) in the d ia lyzin g tank. The in d ir ec t, slow, step-w ise d ilu tio n
procedure was used w ith ro ta tin g outside liq u id d ia ly s is . The measured
volume o f d i s t i l l e d water was added to the O.hM NaCl so lu tion in the
d ia lyz in g tank a t two drops per second. I t was noted that in c ip ien t
p rec ip ita tio n occurred a t 0.1SM NaCl and then the max imum p rec ip ita tio n
occurred a t 0.17M. The concentration o f the so lu tion in the tank was
not d ilu ted fu rth er . The p rec ip ita te was separated from the supernatant
by cen tr ifu g a tio n . This fra ctio n was designated as 2( 17) .
Since the supernatant from which $2( 17) 193,8 s t i l l contained
an appreciable quantity o f protein (tr ic h lo ro a c e tic acid t e s t ) , further
fra c tio n a tio n for the residu al protein was continued. The c lear super
natant from which ®2 ( 17) 19as removed was placed in cellophane tubing.
99
A measured volume o f d i s t i l l e d water was added in order to bring the
concentration o f the d ia ly ser to that o f 0.1&M NaCl. P rec ip ita tio n did
not occur. The concentration o f the so lu tion was further lowered to
0.15M and la te r to O.l^M* The maximum p rec ip ita tio n occurred at O.l^M
NaCl. This p r ec ip ita te was recovered by centrifugation and designated
as ®2(lU)* suPerBa‘tant from which the ^ ( l^ ) 1jas remove<* was a
c lea r so lu tio n and was tested with tr ich lo r o a ce tic a c id . I t contained
a small amount o f p rotein but was not studied further.
USING SPECIFIC MOLAR CONCENTRATIONS OF SODIUM CHLORIDE FOR PURIFICATION.
The fra c tio n a tio n and p u r ifica tio n procedure previously employed fo r the
is o la t io n o f g lob u lin fra c tio n s were accomplished by adjusting them to
th e ir maximum p rec ip ita tin g concentrations "m .p.c.". The resu ltin g pro
ducts so far as the homogenity o f the protein was concerned were freed
o f gross contamination only. I t was necessary to use both the maximum
p re c ip ita tin g concentration "m.p.c." and the in c ip ien t p rec ip ita tin g
concentration " i .p .c ." to control the p rec ip ita tio n o f each fra c tio n in
order to elim inate trace contamination or to secure the desired s ta te
o f p u rity .
The p u r ific a t io n o f the 82(17) fra ctio n was accomplished by subject
ing i t to the procedures involving d e f in ite molar concentrations o f sodium
ch lorid e. The d e ta iled account i s described below*
1 . The 82(17) f ra ct*on was dispersed in 0.4M NaCl. A fter complete
d isp ersion , the so lu tio n was centrifuged and the volume measured.
2 . A fter the cellophane tubing was rinsed with 0.4M NaCl so lu tio n ,
the p ro te in so lu tio n was placed th erein . The p rotein so lu tion was covered
100
with to lu en e. She cellophane tubing was immersed in the d ia lyzin g tank
contain ing 0.4M NaCl so lu tio n . The to ta l volume o f O.hM NaCl so lu tio n
in the tubing and tank measured exactly 1000 ml.
3* The in d ir e c t , slow, step-w ise membrane-equilibration d ilu tio n
procedure was carried out. Following the ca lcu la tion s o f Table XXXIII,
d i s t i l l e d water was added to the d ia lyzin g tank at a rate o f two drops
per second from the reservior to the bottom o f the d ia lyzin g tank through
g la ss tubing. The tank was rotated throughout the d ilu tio n process.
H. A fter the ca lcu lated volume o f water (1222 m l.) was added, the
to ta l volume was 2222 ml. and the f in a l s a lt concentration was 0.1SM.
The in c ip ie n t p rec ip ita tio n o f fra c tio n &>(17) occurre^ a t th is concen
tr a tio n . N otation of the d ia lyzer continued for eight hours u n t i l equi
librium was reached.
5 . The cloudy formation o f p rec ip ita te which appeared a t the in cip
ie n t p re c ip ita tio n concentration was removed by cen trifu gation . The clar
i f i e d cen trifu gate was returned to the o r ig in a l cellophane tube and the
d ilu tio n procedure continued*
b* The ca lcu lated volume of water (130 m l.) was added slow ly as
before u n t i l the volume rose to 2352 ml. and the f in a l concentration was
lowered to 0.17M. R otation o f the d ia lyzer continued for eight hours
to e s ta b lish equilibrium . The p rec ip ita te i&ich formed in the tubing
was transferred to a 250 ml. centrifuge tube. A fter cen trifuging for
15 m inutes, the supernatant was decanted. This p u r ified 1,3,8
stored in a deep-freeze u n it .
The above procedure was follow ed for the p u r ifica tio n o f the other
101
fr a c tio n , &2(lh )» ®3 (11) and ®ty(o7)* ®ie *nciP*ent p rec ip ita tin g con
cen tration s o f the Gg(14)* ®3 ( n ) %.(o7) ^rac*ions were 0.15» 0.12
and 0.08M resp ec tiv e ly and the maximum p rec ip ita tin g concentrations were
0 .1^ , 0 .11 and 0.07M. The ca lcu la ted volumes o f water for d ilu tio n o f
each s a lt concentration are given in Table XXXIII.
102
TEE ELECTROPHORETIC ANALYSIS OE MUNG BEAN GLOBULINS
The knowledge that charged p a r tic le s in so lu tion migrate in an
e le c t r ic f i e ld has led to the development o f one o f the most powerful
to o ls fo r ch aracterizing proteins and numerous carbohydrates. E lectro
p horetic a n a ly sis has provided one o f the few physico-chem ical c r ite r ia
o f protein homogeneity. I t i s e sse n tia l that one he fam iliar with the
p r in c ip les o f the moving boundary method as used in the T ise liu s e lec
trophoresis apparatus (62 ,63 ,64 and 65) to be able to evaluate c r i t ic a l ly
the data which appear in the l ite r a tu r e .
I f a p rotein so lu tion buffered at any given pH i s placed in a U -ce ll
and pure buffer so lu tion i s ca re fu lly layered over i t , the protein w ill
migrate in to the buffer toward one o f the electrod es when d irect current
i s passed through the so lu tio n . With a s in g le p rotein , a l l the m olecules
w ill move at the same rate so that sharp boundaries w il l be maintained
between the protein and the b u ffer . With a so lu tio n containing n -protein
components, m igrating at d ifferen t speeds, n-boundaries w ill be formed
soon a fte r the current has been sta rted . In the ascending limb o f the
U -ce ll the f a s t e s t moving p rotein w il l form a boundary against the b u ffer,
the next f a s t e s t m igrating protein w ill form one against the fa s t e s t pro
te in , e tc . Movement o f the p rotein molecules may be follow ed by observ
ing the boundaries.
I f the protein in so lu tio n i s on the a lk a lin e s id e o f i t s iso e le c
t r ic p o in t, and hence i s negative in charge, the m igration w il l be toward
103
the anode (+) term inal. I f the protein i s on the acid side o f i t s iso
e le c t r ic p o in t, the opposite i s tru e . I f the protein i s at i t s iso e le c
t r i c p o in t, no m igration w il l take place*
At any s p e c if ic pH, temperature and s a lt concentration, the d istance
(d) moved by a given protein boundary per un it o f time ( t) w ill depend
upon the p o ten tia l gradient (F ). For a given p o ten tia l grad ient, the
rate o f m igration d /t w i l l be ch a ra cter istic for each ind ividual protein*
The p o ten tia l gradient may be calcu lated by the expression below:i
F I ----ak
where F * the p o ten tia l gradient, i = current (amp*), a • the cross sec
t io n a l area o f the U -c e ll and k s the conductivity of the buffer or pro
te in so lu tio n .
The speed o f m igration, or e lectrop h oretic m obility (u ) , may be
defined as the d istance moved in centim eters per second under a p o ten tia l
gradient o f 1 volt/cm . a t a certa in pH, in a d e f in ite bu ffer o f a defined
d dak cmu (cm /volt-sec) - - — * ---------- (---- -— — ——)
tF i t sec/vo lt/cmio n ic strength .
For the determ inations o f e lectrop h oretic m obility , i t i s necessary
to measure accurately 1) the distance moved by the protein boundary, 2)
the time in seconds, 3) the current passing through (ampere), 4) the con
d u ctiv ity o f the so lu tion (k a kc/ r ) , and 5) the cross sectio n a l area of
?the c e l l in cm •
10^
APPARATUS
The electrop h oretic a n a ly sis o f Mung bean g lobu lin was conducted
in th is laboratory with the new compact T ise liu s e lectrop h oresis appar
a tu s* . This apparatus, based on Longsworth's scanning m odification o f
the Toepler sch lieren method, has been described by Moore and White (6 6 ).
This apparatus has the valuable featu res o f the T ise liu s method yet
avoids i t s disadvantages of large s iz e and d if f ic u lty o f operation. An
e lectrop h oresis c e l l o f the type developed by T ise liu s i s used to contain
the sample and in which the boundaries are formed. I t has a capacity
for two ml, o f so lu tio n , the o p tic channels have dimensions o f 2 mm. in
width, 15 mm. along the o p tic path and 50 nun* height. This c e l l has
ex ce llen t dimensions fo r e lectrop h oretic a n a lysis because i t i s so nar
row that a r e la t iv e ly large amount o f heat may be generated in i t by
the passage o f current without causing convection, perm itting higher
f ie ld strength and more rapid a n a ly sis .
The actu al measurement o f the protein d istr ib u tio n can b est be made
by Longsworth* s m odification o f the Toepler sch lieren method. The c e l l
and i t s contents are illum inated with p a ra lle l l ig h t and the deviations
o f the rays caused by the re fra c tiv e index gradients are observed. In
th is scanning method the c e l l i s photographed on a moving photographic
p la te . Both p la te and k n ife edges are driven sim ultaneously by a small
motor that moves the p la te a t r igh t angles to the motion of the k n ife edges
and o f the l ig h t beam, g iv in g p ictu res sim ilar to those in Figure 15.
* Manufactured by Perkin Elmer.
105
BUFFER. EFFECTS
Since the charge and the magnitude o f charge o f a protein molecule
depends upon the surrounding reaction ( 67)* i t i s necessary that e lec tro
phoresis experiments he carried out in su ita b le buffers in order to ob
ta in comparable r e s u lt s . The buffer chosen as a solvent should have a
high b u ffer capacity i t s e l f so that the protein buffer capacity i s re la
t iv e ly reduced. This w il l r e su lt in fewer boundary anom alaties ( 68) .
A buffer w ith a low s p e c if ic conductance i s d esirab le in order to reduce
the disturbances due to the heating e f fe c t o f the current. The genera
tio n o f heat r e su lts from fr ic t io n of the ions passing through the solu
t io n and i s re la ted to the speed o f m igration o f the ions (6 9 ). Both
b u ffer capacity and conductance increase w ith the concentration o f buffer
s a lt s , and i t has been pointed out that because o f th is incom p atib ility
a compromise must be made (67)* Since buffer capacity does not depend
upon io n ic m o b ilit ie s , buffer s a lt s the ion s o f which have low m o b ilit ie s
should be se le c te d .
Buffer so lven ts for use in the electrop h oretic a n a ly sis o f human
plasma and serum have been studied at length by Longsworth (6 4 ). The
r e s u lt s o f these experiments show that in reso lv in g power none of the
b u ffers are superior, to the d ieth y l barbiturate (veronal) so lu tio n at
pH 8 . 6. The d ifferen ces in reso lv in g power o f three d ifferen t buffers
a t the same io n ic strength and p o ten tia l gradient on normal human plasma
were studied by Longsworth. The patterns obtained in the b arb ita l buf
fe r o f pH 8 .6 with io n ic strength o f 0 .1 showed the components w ell
10b
separated from each other and the peaks sharp and w ell defined , Where
a s , the same sample separated in a carbonate buffer o f pH 9*9 P 0 ,1 ,
and a phosphate buffer of pH 7»7 P 0 .1 showed that the reso lv in g
power o f these two b u ffers was l e s s sa tis fa c to ry w ith human plasma.
Ecrse plasma was a lso examined in the same buffers as those used in
the above work. In contrast with human plasma, th is m aterial gave a
more sa tis fa c to r y pattern in the phosphate than in the d ieth y l-b arb i-
tu rate b u ffer .
Karon (70) reported on borate and g lycin e buffer that were pre
pared according to Olark; veronal buffer according to Longsworth, and
an ammonia buffer prepared by adding 0 .2 molar ammonia to 0 .1 molar hy
drochloric acid so lu tio n . Whereas these buffers were sa tis fa c to r y so l
vents fo r peanut p rotein , only the g lycin e buffer was sa tis fa c to r y as
a so lvent for cotton seed p rotein . A buffer composed o f 0 .2 mole o f
ethylamine and 0 .1 mole o f veronal in a l i t e r o f so lu tion having a pH
o f 10.7 fcad most d esirab le ch a ra c te r is t ic s for cottonseed p rotein .
I t was thefcety suggested (64) that the proper solvent fo r the a n a lysis
o f the p rotein o f a g iven type v aries with the sp ecies and should be
determined experim entally.
107
THE PREPARATION OE BUFFERS OF DESIRED pH AND IONIG STRENGTH
Tables have "been prepared "by Cohn (71) and hy Green (72) from which
the m olecular r a t io s o f s a lt to acid can he obtained in preparing phos
phate and a ceta te b u ffers o f constant io n ic strength and varying pH or
constant pH and varying io n ic strength . For a l l the buffer mixtures in
e lectro p h o retic work in th is study, the Henderson-Hasselbach equation
was used fo r ca lcu la tio n o f the pK va lu es. A l i s t o f pK values o f the
more common ac id s used for buffer mixtures i s as fo llow s:
Acid pK value
A cetic 4.73
B arbituric 7*90
Oacodylic b.20
Glycine 2.35» 9-77
Phosphoric 6*77 (second d isso c ia tio n )
The fo llow in g are examples o f several types o f bu ffer problems that
a r is e in p ra ctice .
108
(A) The preparation o f a sodium aceta te buffer o f pE 4 .7 and io n ic
strength o f O.l* In order to secure th is buffer value one must l ) .
c a lc u la te the pH value o f a c e t ic ac id , 2 ) . ca lcu la te the ra tio o f
s a lt /a c id , 3)* ca lcu la te m olarity o f sodium aceta te and m olarity o f
a c e t ic acid*
1 ) . Since the io n iza tio n constant K o f a c e t ic a c id equals 1*86 x 10"5
10-5 .................. -5 .0000lo g o f 1 .86 0.2695
-^■*7305 the lo g o f io n iza tio n K
pK s the negative lo g o f the io n iza tio n K or - ( -4 .7 3 ) or 4,73
2 ) . To ca lcu la te the ra tio o f s a lt /a c id , Henderson-Hasselbach equation i s used.
pH a pK ♦ lo g s a lt /a c id or 4.70 * ^ .73 + lo g s a lt /a c id or
- 0 .03 * lo g s a lt /a c id
p o s it iv e value o f - 0 .03 i s 9 .97 - 10a n tilo g o f 9*97 i s 0.9330.933 i s the r a tio o f s a lt /a c id
3 ) . To ca lcu la te M o f sodium a ceta te and M o f a c e t ic a c id . Theio n ic strength o f univalent compounds i s equal to the molarconcentration. Since wealc acid does not contribute appreciably to the io n ic strength , the sa lt concentration had to be 0.1Min order to g ive an io n ic strength of 0 .1 .
0.933 s a ltr a tio 0.933 = ———-------
1.000 acid
ra tio z ac id a s a lt0.933 x a c id * s a lts a lt ♦ a c id a 0.1M(0.933 acid) ♦ acid = 0.1M1.933 acid » 0.1M
0.100 _ 0.0517M a cid1 .933 “ 0 . 01<83M s a lt
109
(B) The preparation o f a sodium phosphate buffer o f pH 7*0 and io n ic strength o f 0 . 1 .The pKg o f phosphoric acid » b*77
1) • To ca lcu la te the ra tio o f s a lt /a c id .
pH = pK ♦ lo g s a lt /a c id7 .0 - 6.77 ♦ lo g s a lt /a c id
O.23 s lo g s a lt /a c id
a n t ilo g o f 0 .23 i s 1*71 .7 i s the ra tio o f s a lt /a c id
2) * To fin d M concentration o f s a lt and of ac id .The sodium phosphate buffer a t pH 7*0 i s d isso c ia ted as fo llow s:
Na2HK>4------> Na+ * NaHFOif Na+ 4 HP0^““
NaHgKfy------> Ha+ + HgFOif
, j i = 0*5 { CV2
su b stitu te x for acid concentration, 1 . 73c for s a lt concentration
0 .1 « 0 .5 (1-7*) U 2) ♦ (1*7*) ( l 2) ♦ (1*7=0 ( 22)
(x) ( l 2 ) 4. ( * ) ( l 2 )
0 .2 » 1 .7x 4 1.73C ♦ 6 .Sx ♦ x ♦ x
0 .2 = 12. 2x
x = 0 .2 = 0.0164 M of HaHgPOij. and12. 2x
1 .7 x 0.0164 = 0.027S M of NagHFOij. g ive io n ic strength o f ©.1 M a t pH 7 .0
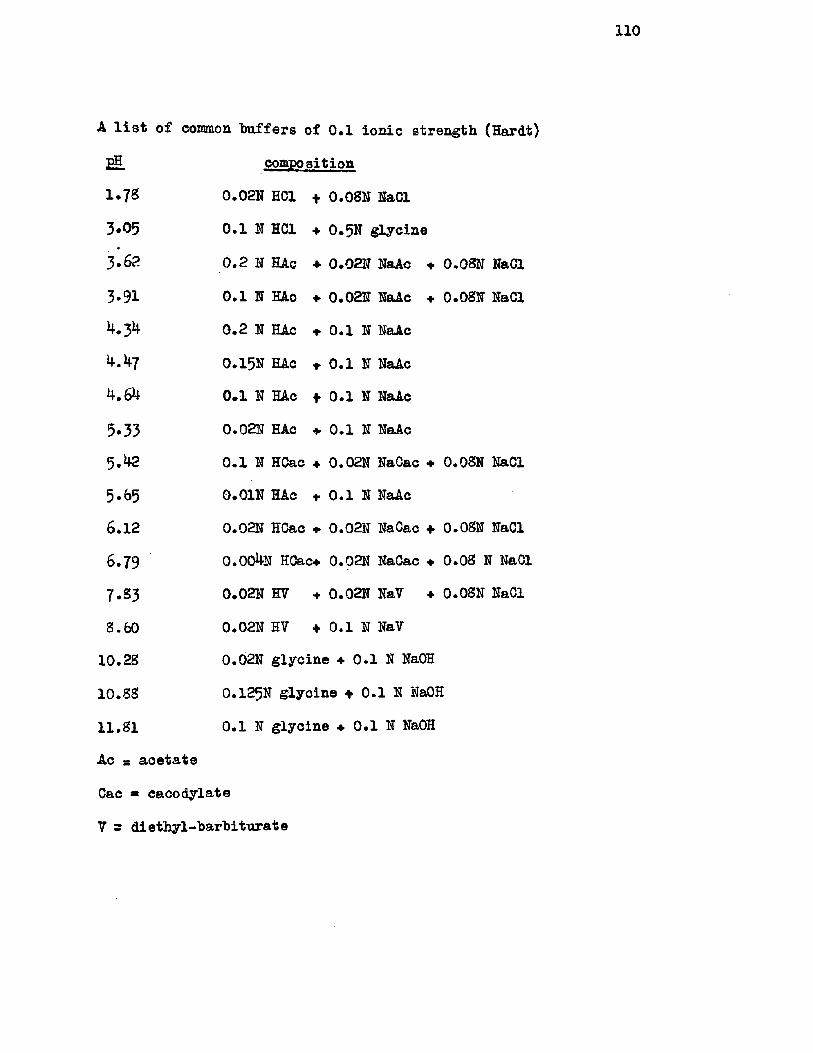
A l i s t o f common buffers of 0 .1 io n ic strength (Hardt)
& composition
1 . 7s 0.02N HC1 t 0.08N NaCl
3.05 0 .1 N HC1 ♦ 0.5N g lycin e
3 .62 0 .2 N HAc ■». 0.02N NaAc ♦ 0.08N NaCl
3.91 0 .1 N HAc ♦ 0.02N NaAc + O.OSN NaCl
0 .2 N HAc * 0 .1 N NaAc
0.15N HAc ♦ 0 .1 N NaAc
^.64 0 .1 IT HAc + 0 .1 N NaAc
5.33 0.02N HAc 0 .1 N NaAc
5.^2 0 .1 N HCac ♦ 0.02N NaCac + 0.08N NaCl
5-65 0.01N HAc ♦ 0 .1 N NaAc
6.12 0.02N HCac ♦ 0.02N NaCac ♦ O.OSN NaCl
6.79 O.OO N HCac* 0.02N NaCac + 0.08 N NaCl
7 .S 3 0.02N HV + 0.02N NaV ♦ O.OSN NaCl
8.60 0.02N HV ♦ 0 .1 N NaV
10.28 0.02N g ly c in e ♦ 0 .1 N NaOH
10.88 0.125H g lyc in e t 0 .1 S NaOH
11.81 0 .1 IT g lyc in e ♦ 0 .1 N NaOH
Ac s a ce ta te
Cac * cacodylate
V s di eth yl-b arb itu rat s
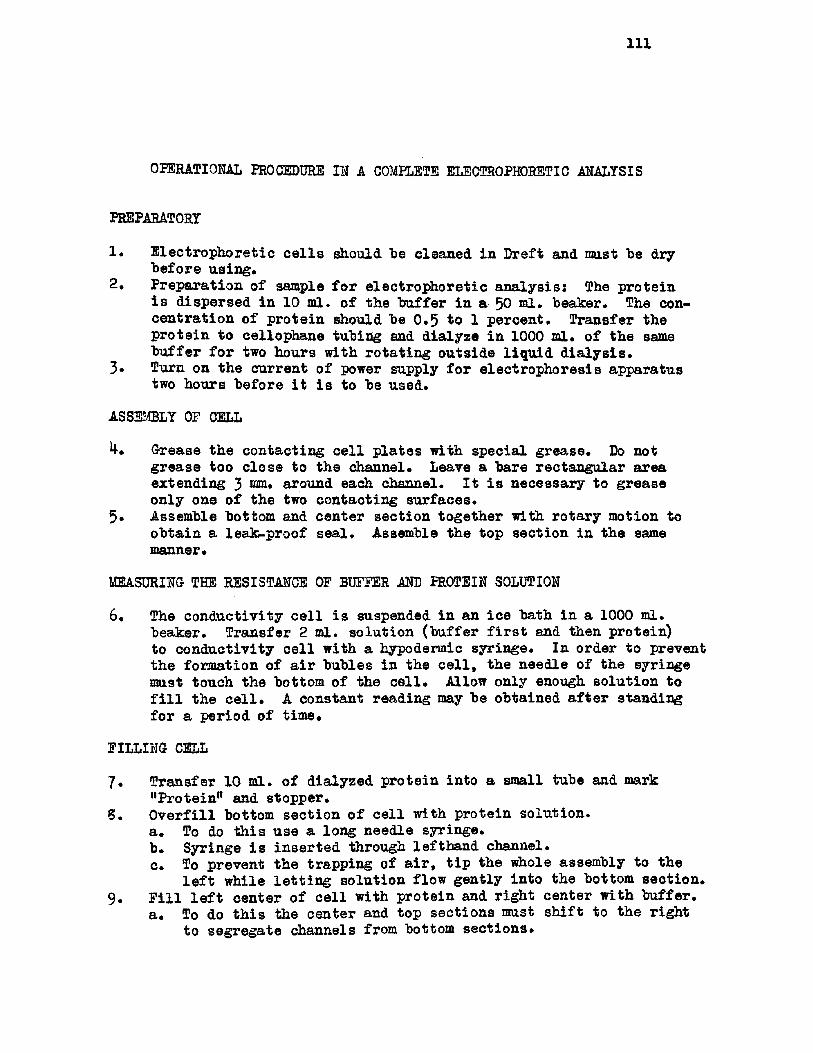
I l l
OPERATIONAL PROCEDURE IN A COMPLETE ELECTROPHORETIC ANALYSIS
PREPARATORY
1. E lectrophoretic c e l l s should he cleaned in Dreft and roast he dry before u sin g .
2 . Preparation of sample fo r e lectrop h oretic a n a ly sis: The p roteini s dispersed in 10 ml. o f the buffer in a 50 ml. beaker. The concen tration of protein should be 0 .5 to 1 percent. Transfer the protein to cellophane tubing and d ia lyze in 1000 ml. o f the same bu ffer fo r two hours with ro ta tin g outside liq u id d ia ly s is .
3» Turn on the current o f power supply fo r electrop h oresis apparatustwo hours before i t i s to be used.
ASSEMBLY OP CELL
4. Urease the contacting c e l l p la te s with sp ecia l grease. Do not grease too c lo se to the channel. Leave a bare rectangular area extending 3 mm. around each channel. I t i s necessary to grease only one o f the two contacting surfaces.
5 . Assemble bottom and center section together with rotary motion to obtain a leak-proof se a l. Assemble the top section in the same manner.
MEASURING- THE RESISTANCE OP BUFFER AND PROTEIN SOLUTION
6. The con d u ctiv ity c e l l i s suspended in an ic e bath in a 1000 ml. beaker. Transfer 2 ml. so lu tion (buffer f i r s t and then protein)to conductiv ity c e l l with a hypodermic syringe. In order to prevent the formation of a ir bubles in the c e l l , the needle o f the syringe must touch the bottom of the c e l l . Allow only enough so lu tion to f i l l the c e ll* A constant reading may be obtained a fte r standing for a period o f tim e.
FILLING CELL
7 . Transfer 10 ml. o f d ialyzed protein in to a small tube and mark "Protein” and stopper.
S . O v e r f ill bottom sectio n o f c e l l with protein so lu tio n .a . To do th is use a long needle syringe.b. Syringe i s in serted through lefthand channel.c . To prevent the trapping o f a ir , t ip the whole assembly to the
l e f t while le t t in g so lu tion flow gently in to the bottom sec tio n .9 . F i l l l e f t center o f c e l l with protein and righ t center with b u ffer,
a . To do th is the center and top section s must s h if t to the right to segregate channels from bottom se c tio n s .
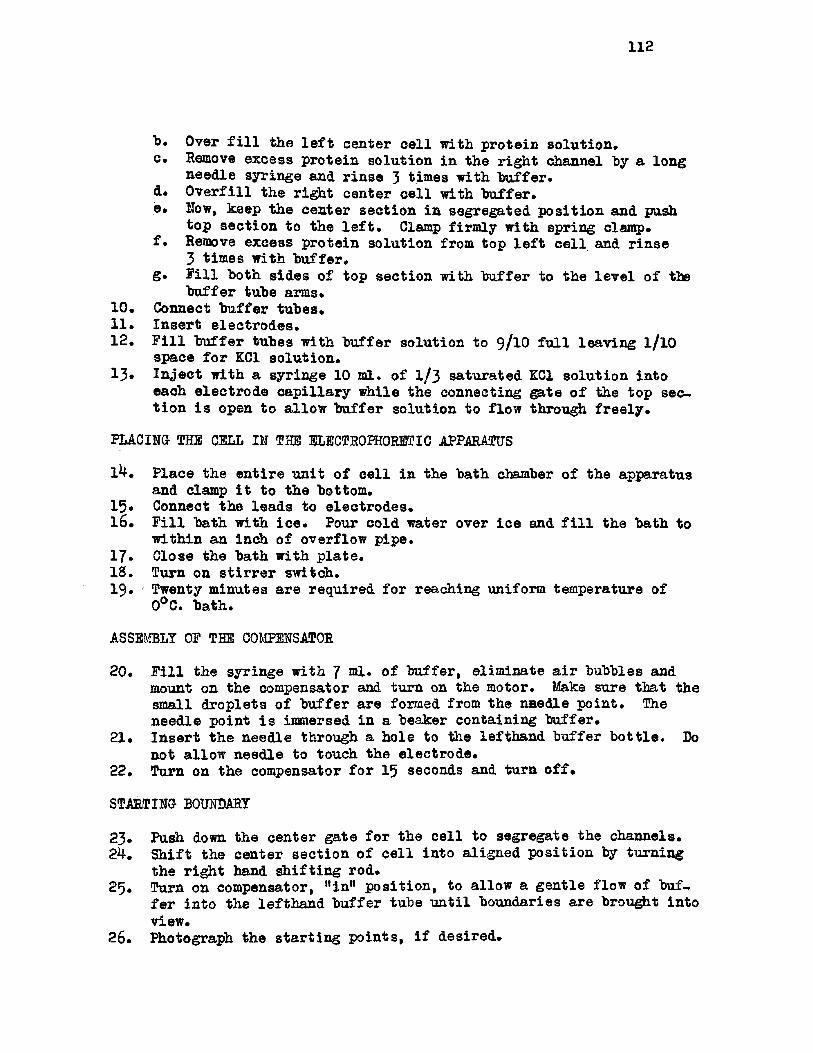
112
b. Over f i l l the l e f t center c e l l with protein so lu tio n .c . Remove excess p rotein so lu tion in the r ig h t channel "by a long
needle syringe and r in se 3 times with "buffer.d. O v e r fill the right center c e l l with b u ffer .e* How, keep the center sectio n in segregated p o sitio n and push
top sec tio n to the l e f t . Clamp firm ly with spring clamp.f . Remove excess protein so lu tion from top l e f t c e l l and rin se
3 tim es with b u ffer .g . f i l l both s id es o f top sectio n with buffer to the le v e l o f the
bu ffer tube arms.10. Connect buffer tubes.11. In sert e lec tro d es.12. F i l l b u ffer tubes with buffer so lu tion to S f l O f u l l leav in g l/lO
space fo r KC1 so lu tio n .13* In jec t w ith a syringe 10 ml. o f 1 /3 saturated KC1 so lu tion in to
each e lectrod e ca p illa ry w hile the connecting gate o f the top sec~tio n i s open to a llow buffer so lu tion to flow through fr e e ly .
PLACING THE CELL IN THE ELECTROPHORETIC APPARATUS
l4 . P lace the en tire u n it o f c e l l in the bath chamber o f the apparatus and clamp i t to the bottom.
13* Connect the lead s to e lec tro d es.16. F i l l bath with i c e . Pour cold water over ic e and f i l l the bath to
w ithin an inch o f overflow pipe.17« Close the bath with p la te .18. Turn on s t ir r e r sw itch.19. Twenty minutes are required for reaching uniform temperature of
0°C. bath.
ASSEMBLY OF THE COMPENSATOR
20. F i l l the syringe with 7 ®1» o f buffer, elim inate a ir bubbles and mount on the compensator and turn on the motor. Make sure that the small droplets o f bu ffer are formed from the nBedle p o in t. The needle point i s immersed in a beaker containing b u ffer.
21. In sert the needle through a hole to the lefthand buffer b o t t le . Do not a llow needle to touch the e lectrod e.
22. Turn on the compensator for 15 seconds and turn o f f .
STARTING BOUNDARY
23. Push down the center gate for the c e l l to segregate the channels.24. S h ift the center sec tio n o f c e l l in to a ligned p o sitio n by turning
the r igh t hand s h if t in g rod.25. Turn on compensator, Min ” p o sit io n , to allow a g en tle flow o f buf
fe r in to the lefthand buffer tube u n t il boundaries are brought in to view.
26. Photograph the s ta r tin g p o in ts , i f desired .
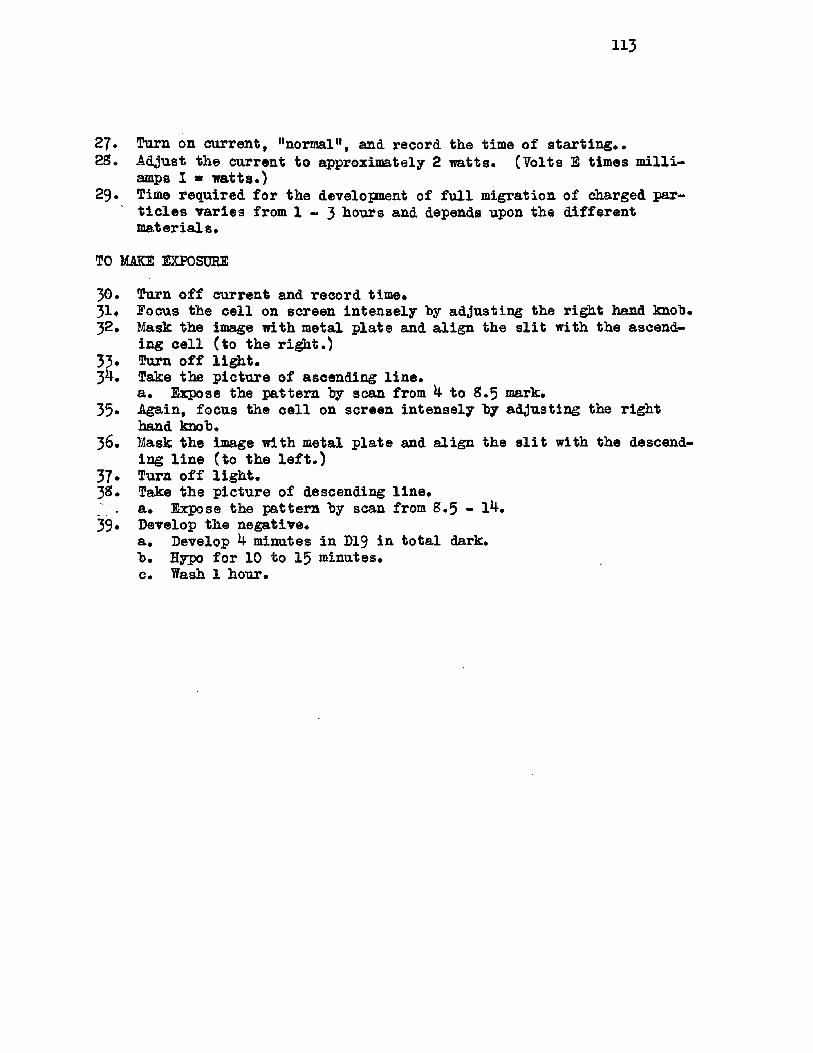
113
27. Turn on current, "normal", and record the time o f s ta rtin g .*28* Adjust the current to approximately 2 watts* (Y olts E times m il l i -
amps I ■ w a tts .)29. Time required fo r the development of f u l l m igration o f charged par
t i c l e s v a r ies from 1 - 3 hours and depends upon the d ifferen t m aterials*
TO MAKE EXPOSURE
30. Turn o f f current and record tim e.31* Focus the c e l l on screen in ten se ly by adjusting the righ t hand knob.32. Mask the image with metal p la te and a lig n the s l i t with the ascend
ing c e l l (to the r ig h t .)33. Tarn o f f l ig h t .3^. Take the p ictu re o f ascending l in e .
a . Expose the pattern by scan from *4- to 8 .5 mark.35. Again, focus the c e l l on screen in ten se ly by adjusting the right
hand knob.36, Mask the image with metal p la te and a lig n the s l i t with the descend
ing l in e (to the l e f t . )37* Turn o f f l ig h t .38. Take the p ictu re of descending l in e .; , a . Expose the pattern by scan from 8 .5 - 1^»39* Develop the n egative .
a . Develop ^ minutes in D19 i& to ta l dark*b . Hypo fo r 10 to 15 minutes.c . Wash 1 hour.
I l k
ELECTROPHORETIC ANALYSIS OF MUNG BEAN GLOBULINS
TOTAL GLOBULINS. As a s ta r tin g p o in t, i t was considered advisable to
use the b u ffers that Danielson (73) used in h is e lectrop h oretic stu d ies
o f pea p ro te in s . However the aceta te buffer of pH 3.72 with 0.2M NaCl
would not d isso lv e the to ta l g lob u lin s a t 0°C. TUhen the a ceta te buffer
was made to pH 3*19 a^d 0.2M NaCl was added, the p rotein was so luble a t
0°C. and the e lectrop h oresis a n a ly sis was conducted. Buffers other than
a c e ta te , the phosphate buffer o f pH 7*5 &&d the borate buffer o f pH 8.30
(as prepared by D anielson), were a lso employed for d ispersingthe to ta l
g lo b u lin . None o f these b u ffers was a sa tis fa c to r y solvent for the
separation o f to ta l Mung bean g lob u lin in electrophoresis a n a ly s is . An
NEj-ECl b u ffer , however, of pH 9*26, as prepared by Irving (7*0, was
superior in reso lv in g power in comparison with those mentioned above.
The various components were w ell separated from each other and the peaks
were sharp and w ell defined . The electrop h oretic patterns o f to ta l Mung
bean p roteins with various buffers are shown in Figure 15 and 16.
A la te r experiment showed that v ero n a l-c itra te buffer, prepared
according to Stanley (7 5 ), was not sa tis fa c to ry for the Mung bean glob
u lin s even though i t had proved to be a superior buffer for whey p ro te in s.
A comparison o f two types o f photographic f ilm was made. The con-
tr a s t process panchromatic f ilm which was recommended for electrop h oretic
recording, was compared with contrast process ortho f ilm . I t was found
that the la te r was the more desirab le film for th is work sin ce i t produced
much sharper and smoother l in e s .
115
THE PRECIPITATE 62( 22)* P rec ip ita te 6^(22) ira's dispersed 1° 10 m1,
of NHy-ECl "buffer o f pH 9 .26 and was d ialyzed in 1000 ml. o f the same
"buffer fo r two hours in a ro ta tin g , outside liq u id d ia lyzer . A fter equi
librium was reached, the p rotein was subjected to electrop h oretic analysis*
The duration o f th is experiment was 5185 seconds, at p o ten tia l gradient
o f 5.75 v o lt s per c n f T h e photographic record showed two peaks as can
be seen in Figure 15.
THE FRACTION Gg(l7) * *n electrop h oresis of 62(17) one ma*n Pea^ was
obtained a s shown in Figures 15 ©rid 17* Seven electrop h oretic analyses
were conducted, four o f which were made with a ceta te buffers o f pH's
3*2S, 3 . 90, 4*36 and 4.61 and three o f which were made with phosphate
b u ffers o f pH’ s 7«15» 7*48, 7*78* ®2(17) was 4omogeneous ^ 7
e lec tro p h o resis . The r e su lts o f these measurements are shown in Table
XXXXI and Figure 21, from which a determination o f the is o e le c tr ic point
o f gave the value o f pH 5*4.
THE FRACTION 62(^4)• *n seven e lectrop h oretic analyses o f th is fra ctio n
one main peak was obtained. Four aceta te bu ffers o f pH 3*27$ 3»85» 4 .44
and 4.7S and three phosphate buffers o f pH 7*27 • 7*52 and 7*75 were used.
The &2(l4) rac<;l on homogeneous by e lectrop h oresis . The m obility
measurements made w ith these seven pH values ind icated that the iso e le c
t r ic point o f th is fra c tio n was 5»7» (See Figure 18 and Table XXXXI.)
THE FRACTION G^(n)* The electrop h oretic m obility determination of th is
fr a c tio n was made with both a ceta te and phosphate buffers a t f iv e pH
values: 3 .3 4 , 3 . 80, 4 .4 0 , 6.15 and 6. 63. A ll patterns showed one peak,
th erefore i t was a homogeneous fra c tio n . The pH m obility curve o f 6^ ( n )
116
was a stra ig h t l in e from which the is o e le c tr ic point o f pH 5*0 was thus
determined. (See Figure 19 and Table XXXXI).
THE FRACTION Gj^q^. This fra c tio n gave one peak in electrop h oretic
a n a ly ses . M obility determination o f ^4.(07) was a*a< ® aceta te and
phosphate b u ffers with pH values! 3 . 32, 3 . 90 , 4 .21 , 4 .52 , 7 .30 , 7 . 5O
and 7 . 78 . The r e su lts o f the measurements are shown in Table XXXXI and
Figure 20 from which a determination of the is o e le c tr ic point o f 0*4(07)
gave the value o f 5*15*
RECONSTITUTION OF MUNG BEAN GLOBULINS. An electrop h oretic study o f re
co n stitu tio n of p u r ified Mung bean globulin fra ctio n s was conducted.
Approximately 0 .^ percent o f each o f the ^ ( 17) * ^2(14)» 3 (11) and
®4(07) was used. The concentration of to ta l protein o f the mixture was
determined to contain I .70 percent of protein (N x 6. 25) . A 10 ml. por
t io n o f the p rotein mixture was d ialyzed in 2000 ml. of NH HCl buffer
o f pH 9 .2 6 . A fter two hours d ia ly s is the f in a l pH o f the buffer was 9*0.
An electrop h oretic pattern showed four peaks, two o f which were separate
s in g le peaks and two were peaks that overlapped as can be seen in Figure 15.
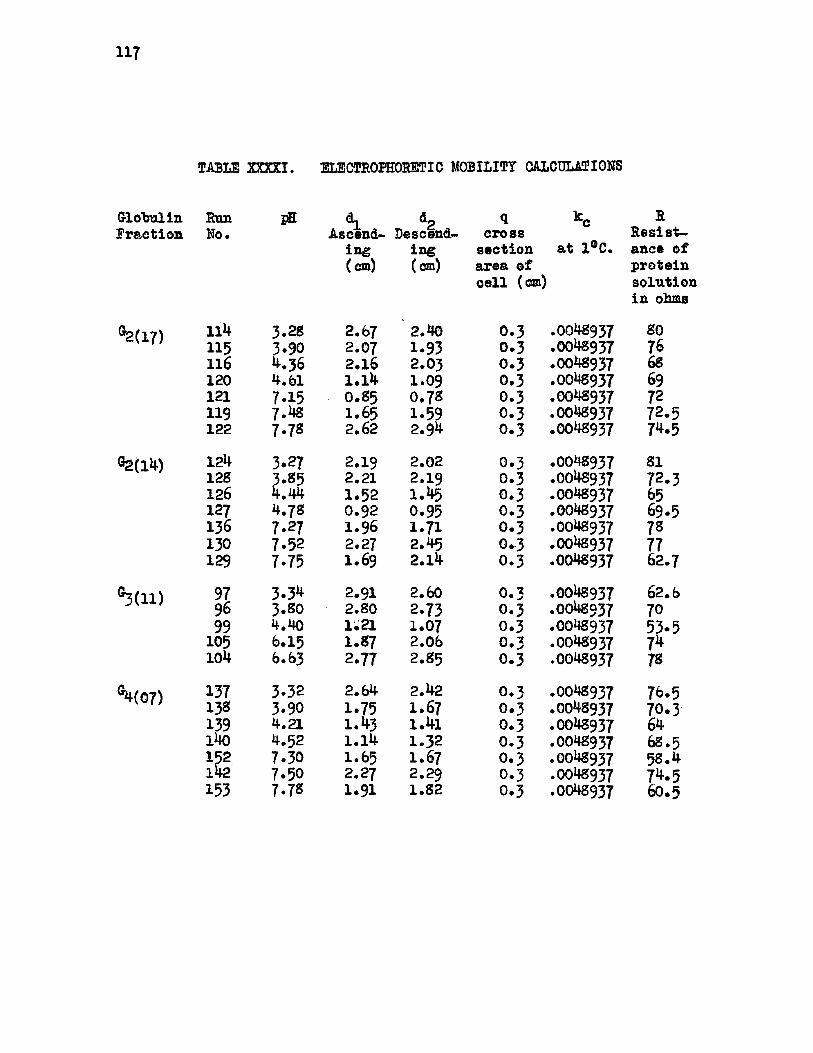
117
TABLE XXXXI. ELECTROPHORETIC MOBILITY CALCULATIONS
GlobulinFraction
*2(17)
°2 (l4 )
^ ( l l )
^(07)
RunNo.
IS ^1Ascending(cm)
^2Descending(cm)
<1cross
sectio n area o f c e l l (cm)
*c
a t 1°C.
RR esistance of protein so lu tion in ohms
I l k 3.28 2.67 2.40 0 .3 .0048937 80115 3.90 2.07 1.93 0 .3 .0048937 76116 4.36 2.16 2.03 0 .3 .0048937 68120 4.61 l . l 4 1.09 0 .3 .0048937 69121 7.15 O.85 0.7S 0 .3 .0048937 72119 7*48 1.65 1.59 0 .3 .0048937 72.5122 7.7S 2.62 2.94 0 .3 .0048937 74*5
124 3.27 2.19 2.02 0 .3 .0048937 81128 3.85 2.21 2.19 0 .3 .0048937 72.3126 4 .44 1 .52 1.45 0 .3 .0048937 65127 4.78 0 .92 0.95 0 .3 .0048937 69*5136 7.27 I .96 1.71 0*3 .0048937 78130 7.52 2.27 2.45 0 .3 .0048937 77129 7.75 1.69 2.14 0 .3 .0048937 62.7
97 3.34 2.91 2.60 0 .3 .0048937 62.696 3 . so 2.80 2.73 0 .3 .0048937 7099 4.40 1.21 1.07 0 .3 .0048937 53*5
105 6.15 1.87 2.06 0 .3 .0048937 7*104 6.63 2.77 2.85 0 .3 .0048937 78
137 3-32 2.64 2.42 0 .3 .0048937 76*513S 3.90 1.75 1.67 0 .3 .0048937 70*3139 4.21 1.43 l . 4 i 0 .3 .0048937 64l4o 4.52 1 .14 1.32 0 .3 .0048937 68.5152 7.30 1.65 1.67 0 .3 .0048937 58 .4142 7.50 2.27 2.29 0 .3 .0048937 7^*5153 7.7S 1.91 1.82 0 .3 .0048937 6O.5
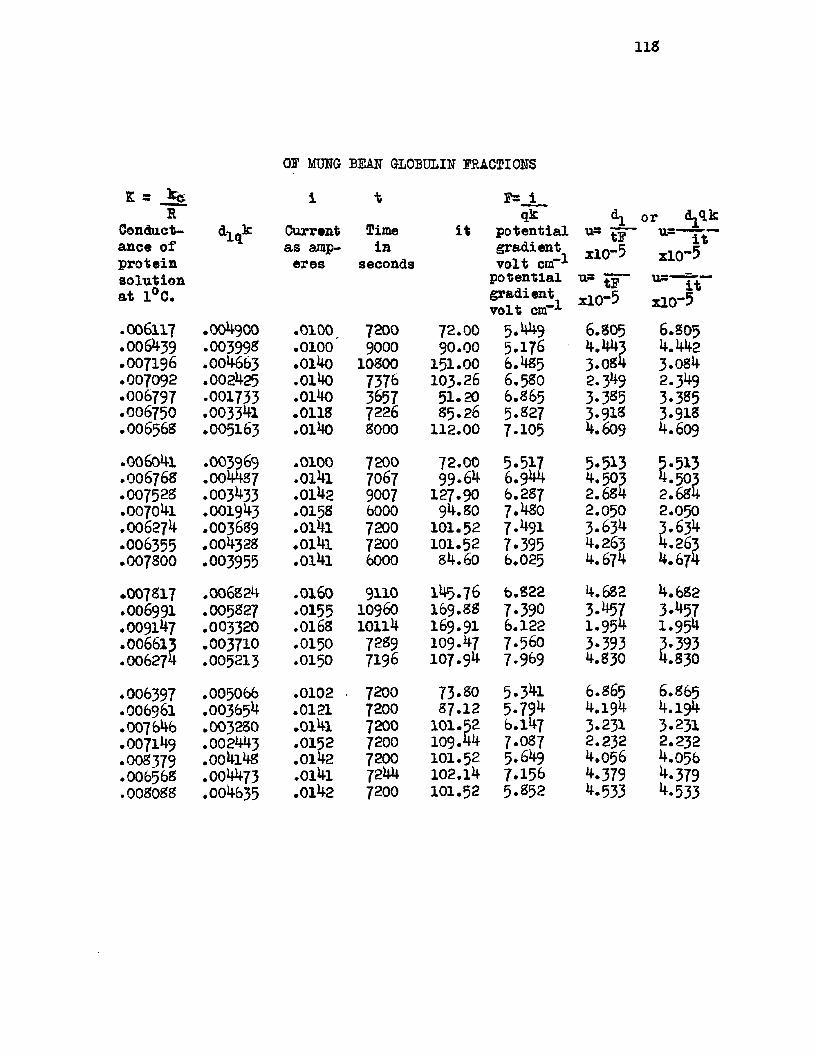
118
Of MUNG BEAK GLOBULIN FRACTIONS
K a i t f s i
Conduct dlq k Current Timeance of as amp inp rotein so lu tio n a t 1°C.
eres secon<
.006117 .004900 .0100 7200
.006439 .003998 . 0100' 9000
.007196 .004663 •Ol4o 10800
.007092 .002425 .01 *K) 7376
.006797 .001733 .0140 3657
.006750 .003341 .0118 7226
.006568 .005163 .0140 8000
.00604-1 .003969.004487
.0100 7200.OO6768 .0 l4 l 7067.007528 .003433 .0142 9007.007041 .001943 .0158 6000.006274 .003689 .0 l4 l 7200.006355 .004328 .0 l4 l 7200.007800 .003955 .o i4 i 6000
.007817 .006824 .0160 9110
.006991 .005827 .0155 10960
.009147 .003320 .0168 10114
.006613 .003710 .0150 7289
.OO6274 .005213 .0150 7196
♦006397 .005066 .0102 7200.006961 .003654 .0121 7200.007646 .003280 •0 l4 l 7200.007149 .002443 .0152 7200.OOS379 .004l4S .0142 7200.006568 .004473 .0 l4 i 7244.008088 .004635 .0142 7200
qk h or dLqki t potcuiiial u—u——7"*10-5 i10 -5v o lt cm A
72.00 5.449 6.805 6.80590.00 5*176 4.443 4.442
151.00 6.485 3.084 3.084103.26 6.580 2.349 2.349
51.20 6.865 3*385 3-38585.26 5*827 3.918 3.918
112.00 7*105 4.609 4.609
72.00 5.517 5.513 5.51399*64 6.944 4.503 4.503
127.90 6.287 2.684 2.68494.80 7.480 2.050 2.050
101.52 7.491 3.634 3.634101.52 7.395 4.263 4.263
84.60 6.025 4.674 4.674
145.76 6.822 4.682 4.682169.88 7.390 3.457 3.457169.91 6.122 1.954 1.954109.47 7.560 3.393 3*393107.94 7-969 4.830 4.830
73*80 5.341 6.865 6.86587.12 5.794 4.194 4.194
101.52 6.147 3.231 3.231109.44 7.087 2.232 2.232101.52 5.649 4.056 4.056102.14 7.156 4.379 4.379101.52 5.852 4.533 4.533
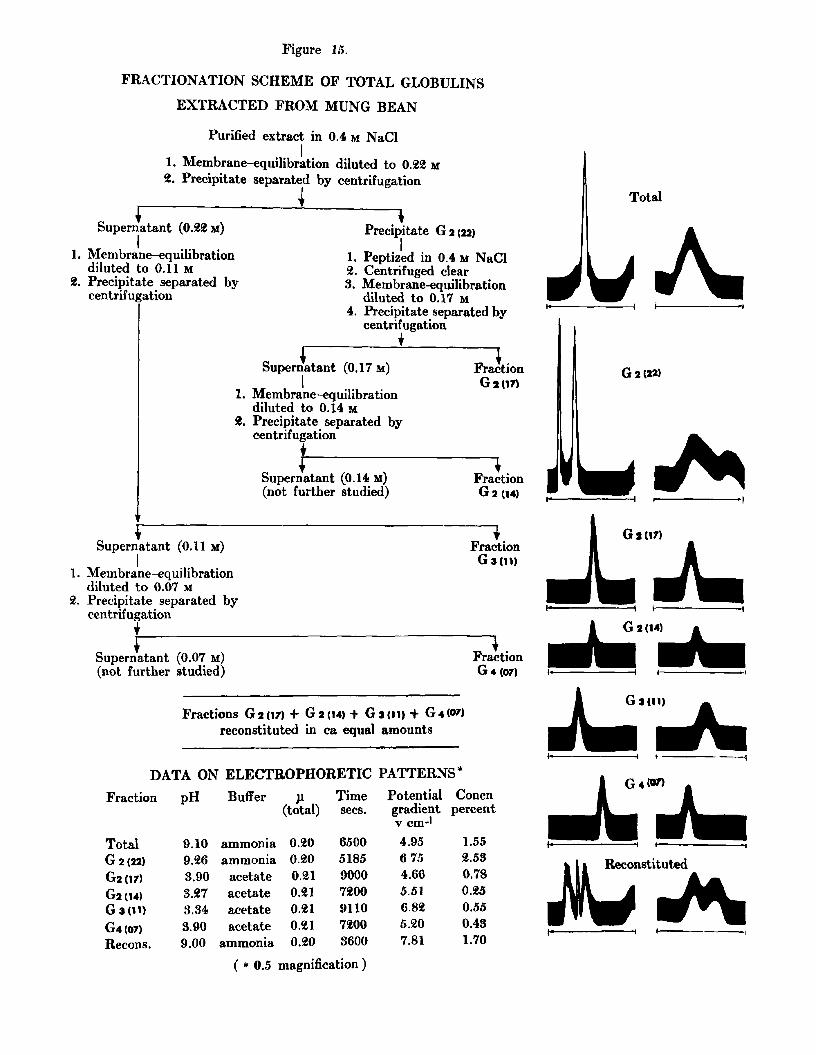
Figure 15.
FRACTIONATION SCHEME OF TOTAL GLOBULINS
EXTRACTED FROM MUNG BEAN
Purified extract in 0.4 m NaCl
1. Membrane-equilibration diluted t o 0 .2 2 m
2. Precipitate separated by centrifugation
_ ISupernatant (0.22 m)
1. Membrane-equilibration diluted to 0.11 M
2. Precipitate separated by centrifugation
Supernatant (0.17 m )
1. Membrane-equilibration diluted to 0.14 m Precipitate separated by centrifugation
Precipitate G 2 (22)
1. Peptized in 0.4 m NaCl2. Centrifuged clear3. Membrane-equilibration
diluted to 0.17 m
4. Precipitate separated by centrifugation
FractionGatm
2.
Supernatant (0.14 m ) (not further studied)
Fraction G 2 (14)
2 .
Supernatant (0 .1 1 m )I
Membrane-equilibration diluted to 0.07 m Precipitate separated by centrifugation
_____________
Supernatant (0.07 m ) (not further studied)
Fraction G 3 (11)
I •Fraction G 4 (07)
Fractions G 2 (1 7 ) + G 2 ( i 4 ) + G a o i ) + G i W reconstituted in ca equal amounts
DATA ON ELECTROPHORETIC PATTERNS*
Fraction pH Buffer P(total)
Timesecs.
Potential gradient v cm-'
Concnpercent
Total 9.10 ammonia 0.20 6500 4.95 1.55G 2 (22) 9.26 ammonia 0.20 5185 6 75 2.53G 2 (17) 3.90 acetate 0.21 9000 4.66 0.78G 2 (14) 3.27 acetate 0.21 7200 5.51 0.25GaOi) 3.34 acetate 0.21 9110 6 82 0.55G 4 (07) 3.90 acetate 0.21 7200 5.20 0.43Recons. 9.00 ammonia 0.20 3600 7.81 1.70
( * 0.5 magnification)
G 2 (22)
G 2 (14)
G4«*)
k 11 Reconstituted
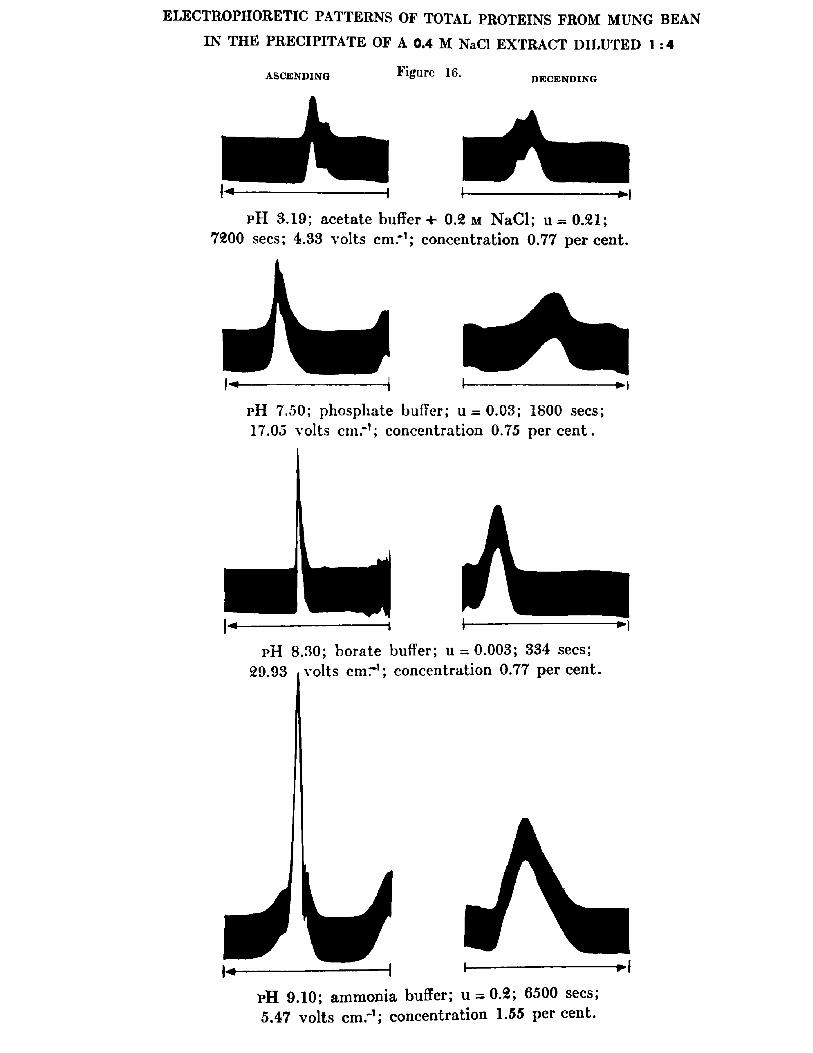
ELECTROPHORETIC PATTERNS OF TOTAL PROTEINS FROM MUNG BEAN
IN THE PRECIPITATE OF A 0.4 M NaCl EXTRACT DILUTED 1 :4
Figure 16.ASCENDING DECENDING
pH 3.19; acetate buffer-*- 0 .2 m NaCl; u = 0.21; 7200 secs; 4.33 volts cm."1; concentration 0.77 per cent.
pH 7.50; phosphate buffer; u = 0.03; 1800 secs; 17.05 volts cm.*1; concentration 0.75 p ercen t.
pH 8.30; borate buffer; u = 0.003; 334 secs; 29.93 ivolts cmr1; concentration 0.77 percent.
pH 9.10; ammonia buffer; u = 0.2; 6500 secs; 5.47 volts cm."1; concentration 1.55 percent.
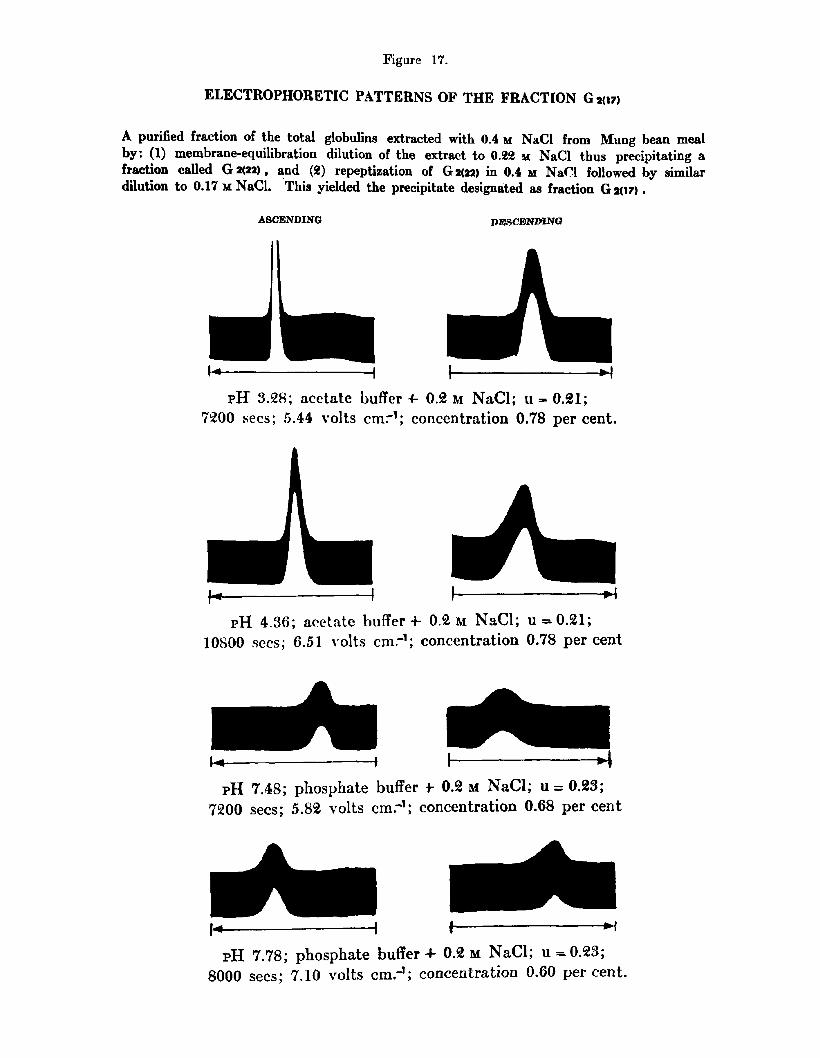
Figure 17.
ELECTROPHORETIC PATTERNS OF THE FRACTION G 2(17)
A purified fraction of the total globulins extracted with 0.4 m NaCl from Mung bean meal by: (1) membrane-equilibration dilution of the extract to 0.22 m NaCl thus precipitating a fraction called G 2(22) , and (2) repeptization of G 2(22) in 0.4 m NaCl followed by similar dilution to 0.17 m NaCl. This yielded the precipitate designated as fraction G 2(17) .
ASCENDING DESCENDING
pH 3.28; acetate buffer 4- 0.2 m NaCl; u =* 0.21; 7200 secs; 5.44 volts cmr1; concentration 0.78 percent.
pH 4.36; acetate buffer 4- 0.2 m NaCl; u —0.21; 10800 secs; 6.51 volts cm.-1; concentration 0.78 percent
pH 7.48; phosphate buffer 4 0.2 m NaCl; u = 0.23; 7200 secs; 5.82 volts cm.-1; concentration 0.68 per cent
H----------------------------- 1 f~---------------------------pH 7.78; phosphate buffer 4- 0.2 m NaCl; u ^ 0 .2 3 ;
8000 secs; 7.10 volts cm.J ; concentration 0.60 percent.
Figure 18.
ELECTROPHORETIC PATTERNS OF THE FRACTION G2<m>
A purified fraction of the total globulins of Mung bean meal obtained by membrane- equilibration dilution of the supernatant fiom precipitate G 2(17) to 0.14 m NaCl. This yielded the precipitate designated as fraction G i ( u ) .
ASCENDING DESCENDING
|4 ------------------------------, \----------------------------- H
pH 3.27; acetate buffer + 0.2 m NaCl; u « 0.21; 7200 secs; 5.51 volts cmr'; concentration 0.25 percent.
H------------------------------1 I----------------------------- HpH 4.44; acetate buffer 4- 0.2 m NaCl; u - 0.21;
9000 secs; 6.28 volts cmr1; concentration 0.28 percent.
pH 7.27; phosphate buffer 4- 0.2 m NaCl; u = 0.23; 7200 secs; 7.49 volts cmr1; concentration 0.35 percent.
pH 7.75; phosphate buffer 4- 0.2 m NaCl; u - 0.23; 6000 secs; 6.02 volts cmr1; concentration 0.34 per cent.
Figure 19.
ELECTROPHORETIC PATTERNS OF THE FRACTION G 3 (n)
A purified fraction of the total globulins of Mung bean meal obtained by membrane- equilibration dilution of the supernatant from precipitate G 2(22) to 0 .1 1 m NaCl. This yielded the precipitate designated as fraction Gs(i i ) .
ASCENDING DECENDING
pH 3.34; acetate buffer +■ 0.2 m NaCl; u = 0.21; 9110 secs; 6.82 volts cmr1; concentration 0.55 per cent.
pH 3.80; acetate buffer +- 0.2 m NaCl; u = 0.21; 10960 secs; 7.60 volts cm.'1; concentration 0.74 per cent.
h — -------------------------1 l----------------------------- h
pH 6.15; phosphate buffer 4- 0.2 m NaCl; u = 0.23; 7296 secs; 7.56 volts cmr1; concentration 0.33 per cent.
pH 6.63; phosphate buffer + 0.2 m NaCl; u = 0.23; 7196 secs; 7.96 volts cm."1; concentration 0.62 per cent.
Figure 20.
ELECTROPHORETIC PATTERNS OF THE FRACTION G 4 <07>
A purified fraction of the total globulins of Mung bean meal obtained by membrane- equilibration dilution of the supernatant from precipitate G3 (ii) to 0.07 M NaCl. This yielded the precipitate designated as fraction G 4 (07) .
ASCENDING DECENDING
pH 3.32; acetate buffer +■ 0.2 m NaCl; u»0 .2 1 ; 7200 secs; 6.82 volts cm.-1; concentration 0.43 per cent.
U ----------------------------- 1 I----------------------------- M
pH 4.21; acetate buffer + 0.2 m NaCl; u=«0.21; 7200 secs; 6.14 volts cm.-1; concentration 0.43 percent.
f - ---------------------------- 1 I---------------------------- Hp H 7.05; phosphate buffer 4- 0.2 m NaCl; u — 0.23;
7200 secs; 7.71 volts cmr1; concentration 0.43 percent.
H----------------------------- 1 I----------------------------- Mp H 7.78; phosphate buffer + 0.2 m NaCl; u = 0.23;
7200 secs; 5 .85 volts cmr1; concentration 0.36 percent.
u8
7
6
5
4
3
2
1012
3
4
5
6
u
8
7
6
5
4
3
2
1012
3
4
5
6
Figure 21.
pH — MOBILITY CURVES OF THE PURIFIED FRACTIONS
OF TOTAL GLOBULINS FROM MUNG BEAN
Fraction Gin*
j.
- 2
J.
T8 T4
T0 r9
T7
T8
T9 T7
I9
U 604 9
Fraction G 4 (ot>Fraction Gum
p HpH
126
SUMMARY AND CONCLUSION
R elationsh ips Between the S o lu b ility o f Mung Bean
P rotein and the Nature and Concentration o f Solvents
The r e s u lt s obtained from the study are shown in Tables VI through
XIV and Figure 2 .
A* The s a lt s o f strong a c id s and bases, such as those o f ch loride
and s u lfa te , showed nearly the same e ffe c tiv e n e ss in pep tizin g approximately
equal amounts (72 percent o f the to ta l nitrogen on a dry weight b a sis ) from
Mung bean meal. The s a lt s o f phosphates, carbonate and s u l f i t e a lso showed
p a r a lle l e f fe c t iv e n e s s in p ep tiz in g nearly equal amounts, S3 to S3 percent
of the to ta l n itrogen from the same samples.
B. The range o f io n ic strength of the neutral so lven ts was very nar-
row. I t was noted th at the h igh est p ep tizin g power o f NaCl so lu tio n was
very c lo se to 0.4M. On the other hand the range o f io n ic strength o f so lu
t io n s o f phosphate, carbonate and s u l f i t e was much broader.
C. Since the d e f in it io n o f g lob u lin refers to the s o lu b il i ty in neu
tr a l s a lt so lu tio n , i t i s obvious that the maximum amount o f Mung bean
g lo b u lin peptized by ch lorid es and su lfa te s was 72 percent. The question
a r is e s as to what kind o f p rotein (beyond the 72 percent) i s peptized by
those a lk a lin e so lven ts (phosphate, carbonate and s u l f i t e ) . Since th is
study was devoted to g lo b u lin s , other p roteins were not studied in d e ta il .
However, th ese data support the proposition that there i s a v a r ia tio n in
the nature or kind o f p rotein peptized by these two groups o f so lv en ts .
D. I t was noted that the sodium chloride solvent y ie ld ed a curve with
127
a steep s lo p e , part o f ifaich was nearly v e r t ic a l . The s ig n ifica n ce of
t h is type o f curve has "been pointed out previously in that i t not only
i l lu s t r a t e s the s o lu b i l i t y "behavior o f Mung bean p rotein in t h is so lvent
but i t a lso revea ls a scheme by which the protein might be iso la te d by
low ering the concentration o f the so lu te by d ilu tio n .
Factors that Influence the Degree o f P eptization o f Protein
A. Table XXI and Figure 5 demonstrate the e f fe c t o f time and sample-
so lven t r a t io s and show that in a l l in stan ces an increase in extractin g
time increased the amount o f to ta l n itrogen peptized from the samples.
Of the f iv e sam ple-solvent r a t io s employed, the one o f 5s 100 gave the high
e s t value o f p ep tiza tio n and that o f 15:100 gave the low est. When the
S-S-R was small (5 :100), time had le s s in fluence upon p ep tiza tio n . On
the other hand when the S-S-R was large (15:100), time had more in flu en ce
upon p ep tiza tio n .
B. Table XXIII and Figure 6 showed that the p a r t ic le s iz e a ffe c ted
the degree o f p ep tiza tio n to a great ex ten t. The 60 mesh s iz e gave about
20 percent greater y ie ld o f n itrogen over the 40 mesh s iz e which in turn
gave about 20 percent greater y ie ld of n itrogen over the 20 mesh s iz e .
C. Table XXVI and Figure 7 show no appreciable d ifferen ce between the
mechanical and hand s t ir r in g . There was a great d ifferen ce between the
f i r s t ex tra ctio n and the second and th ird ex tra ctio n s. When the S-S-R
was 10:100, 60 percent o f the n itrogen was peptized by the f i r s t extrac
t io n , 9 percent by the second and 3 percent by the f in a l ex traction with
27 percent o f the n itrogen remaining in the residue.
128
D. The e f fe c t o f temperature upon the degree o f p ep tiza tio n from
o i l fr e e and n on -o il free samples i s somewhat complex. From Table XXVIII
and Figure & i t appears that o i l fr e e samples gen era lly y ie ld ed higher
values than the n on -o il free samples except that with lower concentrations
and h igher temperatures reverse r e su lts were observed. Using n on-oil
fr e e samples the temperature of ex traction was shown to have l i t t l e or
no in flu en ce upon the degree o f p ep tiza tio n below U5°C. Above **5°C. there
was a decrease in the degree o f p ep tiza tion in both the o i l fr ee and the
n o n -o il fr e e samples. The downward slope o f the curves in a l l in stances
above 45°C. may be due to the heat coagulation o f some o f the protein
m a ter ia l. When u sin g low concentrations of s a lt , i t seems that the pres
ence o f o i l in the natural sample gave some p rotection against heat coag
u la t io n o f p rotein a t higher temperatures.
The P r ec ip ita tio n o f Protein as E ffected by D ilu tion
Figure 10 shows the sedim entation ra te o f Mung bean g lob u lin when
a s e r ie s o f ten d iffer en t ra tes o f d ilu tio n was made.
A. I t wa3 in te r e st in g to note the p rec ip ita tin g behavior of Mung
bean g lo b u lin when one volume o f 0.4M NaCl extract was d ilu ted with four
volumes o f d i s t i l l e d water ( f in a l concentration 0.08M); the rate o f sed
im entation was fa s te r and the p rec ip ita te was more compact than in any
other d ilu tio n s in the s e r ie s .
B. The s o lu b il i t y range o f Mung bean g lob u lin was thus concluded
to be between O.M-M NaCl as the maximum s o lu b ility concentration and 0.08M
NaCl as th e p re c ip ita t in g concentration.
129
0* Ih is lead s to a consideration of the g lob u lin behavior at d ilu
t io n s greater than 1 :4 . In Figure 10 i t was shown that as the d ilu tio n
r a t io s were increased (to the Number 10 C7lin d e r ) t the volume o f the pre
c ip ita te s were correspondingly la rg er . Since the amount o f p rotein in
a l l cy lin d ers was the same, why did the volume o f the p r ec ip ita te in crease
as the d ilu tio n ra tio increased? I t i s obvious that under such cond itions
the hydration i s greater and probably the amount o f adsorption o f albumin
i s a lso grea ter . This i s supported by data in Table XXX. Therefore, a
greater d ilu tio n fo r p rec ip ita tin g g lobu lin must not be employed because
i t may lead to ex cessiv e occlu sion o f other p roteins (albumin) from the
so lu tio n .
D. The removal o f albumin from g lob u lin was accomplished by the
d ilu tio n method. There i s no e x is t in g method o f separation o f albumin
from g lo b u lin which i s superior to p rec ip ita tio n of the g lob u lin by d ilu
tio n , leav in g the albumin in the so lu tio n .
E. From the above d iscu ssion i t w i l l be seen that the p rec ip ita tio n
e ffe c te d by the 1:4 d ilu tio n represents the g lob u lin fra c tio n o f Mung
bean. Hence Table XXX (d ilu t io n 1:4) represents the more accurate frac
t io n a l values: g lob u lin nitrogen 50*5 percent, albumin nitrogen 36*7
percent and N.P.N. 12.5 percent. The globulin/album in ra tio was I .37
and the protein n itrogen/non-protein nitrogen ra tio was 6.97* These
r a t io va lu es may be used as a means o f characterization o f the sp ecies
from which the p rotein s are secured.
130
Conditions E ssen tia l fo r the Iso la tio n o f and Upon Which the
C haracterization o f Mung Bean Globulins Depend
The is o la t io n o f p roteins in th e ir natural condition i s s t i l l in
a s ta te o f development. The nature and the quantity o f p rotein peptized
from d iffe r e n t sources has varied from extract to extract sin ce much de
pends upon the techn ics employed. In order to e s ta b lish a method by
which the r e s u lts o f th is study can be reproduced, the conditions essen
t i a l fo r the preparation o f Mung bean g lob u lins must be considered.
1 . Nature o f so lven t: A so lu tion o f neutral s a lt should be used.
2 . Ion ic strength o f solvent: A so lu tion o f maximum io n ic strength
should be used for p ep tiza tion . However, a so lu tion o f io n ic strength
above the maximum must be avoided since ex cessiv e concentration causes
occlu sion o f p rotein s other than g lob u lin . Contrariwise, so lu tio n s o f
lower than p r ec ip ita tio n concentration should be avoided to prevent de-
naturation o f p rotein .
3 . S o lu b ility range: A narrow s o lu b il i ty range requires l e s s
d ilu tio n to e f fe c t p rec ip ita tio n .
4 . P a r tic le s iz e o f sample: The smaller the p a r t ic le s iz e , the
greater the y ie ld .
5 . Sample-solvent ratio* A large ra tio r e su lts in an in e f f ic ie n t
ex tra c tio n . On the other hand, a small r a tio g iv es e f f ic ie n t ex traction
but may r e su lt in a volume o f extract which i s d i f f i c u l t to handle when
d ilu ted fo r p r e c ip ita t io n . Therefore, an e f f ic ie n t and convenient S—S-E
must be chosen.
b. E xtraction time: A period of time that i s o f long duration
131
must be avoided to prevent contamination, denaturation, growth o f micro-*
organisms and ferm entation. A period o f time that i s too short r e su lts
in in e f f ic ie n t ex traction .
7* E xtraction temperature: Room temperature o f 20 to 25°C. i s usu
a l ly e f f i c i e n t . Higher temperatures are apt to cause denaturation. On
the contrary low temperature, which might appear d esirab le , decrease the
ra te o f p ep tiza tio n and may r e su lt in p rec ip ita tio n of peptized p ro te in .
8 . A gitation : Occasional hand s t ir r in g was as e f fe c t iv e for extrac
t io n as mechanical s t ir r in g . High speed and v ib ration a l a g ita tio n may
cause denaturation.
9 . Successive extraction: This i s the only way to secure an ex
hau stive ex tra ctio n o f a sample.
10. Separation o f residue: The ordinary standard cen trifu ge seems
most d es ira b le . A Sharpies cen trifu ge should not be employed fo r th is
type o f work.
11. P rec ip ita tio n : TShen p rec ip ita tio n i s e ffec ted by d ilu tio n ,
water must be added to the extract a t a slow rate with continuous mixing.
12. Removal o f other p roteins: This can be achieved by repeated
d isp ersa l o f the p r e c ip ita te in s a lt so lu tion follow ed by p rec ip ita tio n
by d ilu tio n .
R otating Outside Liquid D ia ly sis Apparatus
The development o f the ro ta tin g outside liq u id d ia ly s is apparatus
fo r rapid membrane eq u ilib ra tio n d ilu tio n proved to be e f f ic ie n t for pre
c ip ita t io n , fra c tio n a tio n and p u r ifica tio n of p rotein . The e s se n t ia l char
a c t e r i s t ic s o f th is type o f d ia lyzer are: 1) the container which ro ta te s
132
a t a speed o f b 2 r .p .m ., 2) the cellophane tu.hi.ng only two th ird s f u l l
w ith p ro te in so lu tio n in stead o f completely f i l l e d to the le v e l o f the
d ia ly z in g water, 3) the cellophane tubing suspended e c c e n tr ica lly in
the l iq u id in the tank in order to increase a g ita tio n o f the en tire sys
tem when the container i s in motion* As a re su lt o f the movement, the
d iffu sa b le ion s adjacent to both s id es of the membrane w all are constantly
removed w ith a change o f concentration and thus eq u ilib ra tion i s e ffe c ted
in a shorter tim e.
Some o f the s p e c if ic ap p lica tion s o f th is type o f d ia lyzer are:
1* P rec ip ita tio n o f p rotein by in d irec t d ilu tio n was accomplished
when a measured volume o f p rotein so lu tion was placed in the cellophane
tubing and immersed in a measured volume o f d i s t i l l e d water in the di&-
ly z in g tank. The p rotein p recip ita ted when the desired concentration
o f the so lven t was reached. Ind irect d ilu tio n fo r p rec ip ita tin g protein
prevents denaturation o f the protein by avoiding d irect contact with an
excess amount o f water.
2 . An in d ir e c t , slow stepw ise membrane eq u ilib ra tion d ilu tio n tech
n ic w ith ro ta tin g ou tsid e liq u id d ia ly s is was employed fo r fra ctio n a tio n
and p u r if ic a t io n o f p ro te in . This was accomplished when the p rotein in
O.hM NaCl so lu tio n in the cellophane tubing was suspended in the same
concentration o f NaCl so lu tio n in the d ia lyzing tank. The to ta l volume
o f both were measured and then a measured volume o f water was slow ly added
to the tank* When equilibrium was reached, a desired concentration was
obtained. The Mung bean g lob u lin was separated in to i t s component frac
t io n s by th is tech n ic .
133
3* This d ia lyzer can a lso he used fo r continuous d ia ly s is to re
move a l l d iffu sa b le io n s. Continuous change o f d ia lyzin g mater i s con
ducted in a very convenient way.
The Fractionation of Mung Bean Globulin and the I so la tio n
o f Gg, and G
Using the membrane eq u ilib ra tion d ilu tio n procedure for lowering
the s a lt ion concentration o f the p rotein so lu tio n , the f i r s t fra c tio n a l
p r e c ip ita t io n of Mung bean g lob u lin occurred a t 0.22M NaCl. This precip
i t a t e was designated as fra c tio n p rec ip ita te 02(22)* c®ntrifugate
from the p r e c ip ita te ®2(22) was s im ila r ly to 0.11M NaCl and
y ie ld ed a p r e c ip ita te which was designated as fra c tio n The cen
tr ifu g a te o f the p rec ip ita te was further d ilu ted to 0.07M NaCl
and a th ird p r e c ip ita te was obtained. This fra c tio n was designated as
64(07)* The n itrogen d istr ib u tio n in terms o f percentage o f to ta l glob
u lin in these fra c tio n s are 40.95t **9*09 and 3*90 G2( 22)» G3( l l ) and
^4(07) r e sp e c tiv e ly . The e lectrop h oretic patterns of these fra c tio n s
showed that the 62( 22) con a ne^ two components whereas the others were
s in g le components.
Development o f a D isso lu tion Process for R esolving the G Complex
The p r e c ip ita te ®2(22) W&S to further fra ctio n a tio n by
the d isso lu tio n tech n ic . I t was f i r s t peptized in a small volume o f
6.4M NaCl so lu tio n in order to keep both the protein concentration and
the d ie le c t r ic constant o f the medium high. This technic decreased the
in te r a c tio n o f components o f d ifferen t species and other charged substances
and the decomposition o f any complex was p o ss ib le under such an environment,
134
I t was found th at the fra c tio n a l p r e c ip ita te , @2(22)* was a corD3P ex
two g lo b u lin components and some pigmentary m aterial which were hound
together and co -p rec ip ita ted a t the concentration of 0.22M NaCl. Such
complex formation may "be expected to a f fe c t the s o lu b i l i ty o f the in d i
vidual components.
The d isso lu tio n procedure fo r the decomposition o f such a complex
was simple to perform but d i f f ic u l t to p er fec t. Since the is o la t io n o f
each o f the s in g le components from a p rotein mixture was the primary
ob ject o f th is study, considerable time was devoted to th is problem.
The fra c tio n a l p rec ip ita te ®2(22) was P©P*ized in 0.4M NaCl
was introduced in to the cellophane tubing which was then suspended in
d i s t i l l e d water in the container. The volume o f d i s t i l l e d water was ten
tim es greater than that of the protein so lu tion in the cellophane tubing.
P r ec ip ita tio n occurred in the cellophane tubing w ith in 15 minutes, but
a period o f two hours was allowed fo r sedimentation o f the fa s t precip
i ta t in g components. The fa s t p rec ip ita tin g components, pigmentary sub
stance combined w ith p ro te in , were co-p recip ita ted and appeared as dark,
dense m aterial in th e bottom of the tubing. The true g lob u lin appeared
as white f lu f f y p r e c ip ita te (amorphous in form) which was suspended
throughout the supernatant and was separated from the dark p r ec ip ita te
by decantation . The d isso lu tio n procedure was repeated w ith the dark
p r e c ip ita te u n t i l a l l the g lob u lin was released from the pigmentary mater
i a l .
Further fra c tio n a tio n o f the d isso lu tio n product resu lted in one
component p r e c ip ita tin g a t 0.17M NaCl and designated as ®2(l7)»
135
other p r e c ip ita tin g a t O.llfld NaCl and ca lled * E lectrophoretic
p attern s showed that the ®g(x7) an<1 ^2(l4) were ®lnS le components*
Gs® of, Magi mom P rec ip ita tio n Concentration and Incip ien t P rec ip ita tio n
Concentration to Control the P o r ifica tio n o f the Globulin Fractions
The fra ctio n a tio n and p u r ifica tio n procedure previously employed
fo r th e is o la t io n o f g lob u lin fra c tio n s were accomplished by adjusting
them to th e ir maximum p rec ip ita tio n concentration "m .p.c.". The r e su lt
in g products, so fa r as the homogenity of the protein was concerned,
were freed of gross contamination only. I t was necessary to use sp e c if ic
molar concentrations o f the so lven t, both the maximum p rec ip ita tio n
concentration and the in c ip ien t p rec ip ita tio n concentration " i .p .c .11,
to control the p rec ip ita tio n o f each fra c tio n and elim inate trace con
tam ination and secure the desired s ta te o f pu rity .
The maximum p rec ip ita tio n concentrations of the Mung bean g lob u lin
fr a c tio n s ®2(l7)» ^ (lU )* &3 ( l l ) 811,1 ^ ( 07) Were ca refu lly determined to
be 0 .1 7 , 0 .1^ , 0 .11 and 0.07M NaCl resp ec tiv e ly . Their in c ip ien t precip
i ta t io n concentrations were accordingly 0 .1 3 , 0 .1 5 , 0 .12 and 0.08M NaCl.
By means o f e lectrop h oretic a n a ly s is , the patterns show that four
in d iv id u al s in g le g lob u lin components have been iso la te d in supposedly
undenatured s ta te from Mung bean meal. The problems of g lob u lin in d iv id
u a l i ty , g lob u lin d e f in it io n and g lob u lin is o la t io n have been studied c r i t
i c a l ly and the author has attempted to fo llow the advice of Osborne in
keeping h im self from a l l preconceived notions as to what co n stitu te s ortho
dox or non-orthodox tech n ics.
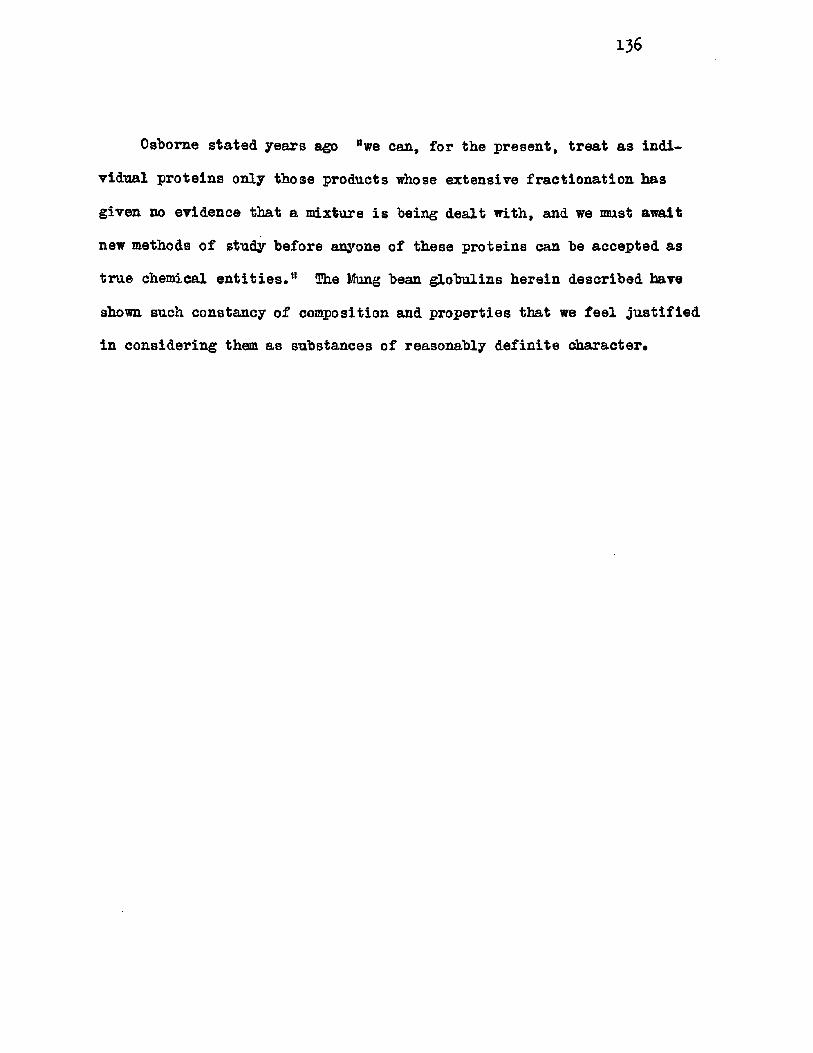
136
Osborne sta ted years ago "we can, for the present, trea t as in d i
v idual p ro te in s only those products whose extensive fra c tio n a tio n has
given no evidence that a mixture i s being d ea lt w ith, and we must await
new methods o f study before anyone o f these proteins can be accepted as
true chemical e n t it ie s ." !Ehe Mung bean g lob u lins herein described have
shown such constancy o f composition and properties that we f e e l j u s t i f ie d
in considering them as substances o f reasonably d e f in ite character.
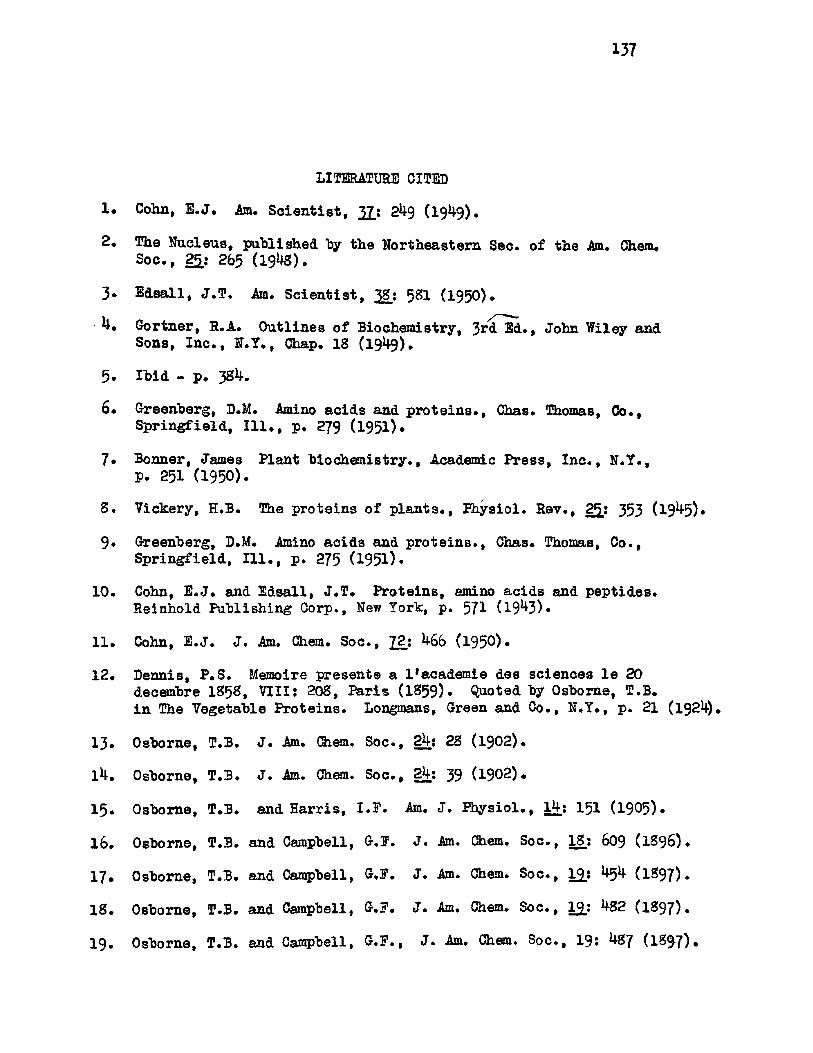
137
LITERATURE CITED
1 . Cohn, E .J . Am. S c ie n t is t , 3 J t 249 (1949).
2 . The Nucleus, published by the Northeastern Sec. o f the Am. (Diem.S o c ., 25.: 265 (1948).
3« S d sa ll , J .T . Am. S c ie n t is t , 38 : 581 (1950).
• 4 . Gortner, R.A. O utlines o f Biochemistry, 3rd~®d* * John Wiley andSons, I n c ., N .T ., Chap. 18 (1949).
5 . Ib id - p . 384.
6 . Greenberg, D.M. Amino acid s and p r o te in s ., Chas. Thomas, Co.,S p rin g fie ld , 111 ., p. 279 (1951).
7 . Bonner, James Plant b iochem istry.. Academic P ress, In c ., N .Y ., p. 251 (1950).
8 . Vickery, H.B. The p roteins o f p la n ts ., P h ysio l. Rev., 25.: 353 (1945).
9* Greenberg, D.M. Amino acid s and p r o te in s ., Chas. Thomas, Co.,S p r in g fie ld , 111., p . 275 (1951)•
10. Cohn, E .J . and E d sa ll, J .T . P roteins, amino ac id s and p eptides. Reinhold Publishing Corp., New York, p. 571 (1943).
11. Cohn, E .J . J . Am. Chem. S oc., J 2 i 466 (1950).
12. Dennis, P .S . Memoire presente a l'academ ie des sciences l e 20decembre I 858, VIII: 208, Paris (1S>59)« Quoted by Osborne, T.B.in The Vegetable P rotein s. Longmans, Green and Co., N .Y ., p. 21 (1924) .
13. Osborne, T.B. J . Am. Chem. S oc., 24: 28 (1902).
14. Osborne, T.B. J . Am. Chem. S oc ., 24: 39 (1902).
15 . Osborne, T.B. and H arris, I .E . Am. J . P h y s io l., 14: 151 (1905).
1 6 . Osborne, T.B. and Campbell, G.E. J . Am. Chem. S oc ., 18* 609 (IS96) .
17. Osborne, T.B. and Campbell, G.E. J . Am. Chem. S oc., 12.: 454 (IS97) .
IS . Osborne, T.B. and Campbell, G.E. J . Am. Chem. S oc ., 12.: 482 ( 1897) .
19 . Osborne, T.B. and Campbell, G.E., J . Am. Chem. Soc., 19: 487 (1^97)•
138
20. Osborne, T.B. and Campbell, G.F. J . Am. Chem. S oc ., l^.: ^ 4 ( I 897) .
21. Osborne, T.B. and Campbell, G.F. J . Am. Chem. S oc ., l^.: 509 (1897)*
22. Osborne, T.B. J . Am. Chem. Soc, , 11: 525 (1897).
23* Osborne, T.B. and Campbell, G.F. J . Am. Chem. Soc., 20: 348 ( I 898) .
24. Osborne, T.B. and Campbell, G.F. , J . Am. Chem. Soc., 20: 4o6 (1898).
25. Osborne, T.B. and Campbell, G.F. J . Am. Chem. Soc., 20: 393 (I898) .
26. Osborne, T.B. and Campbell, G.F. J . Am. Chem. S oc., 20: 362 ( I 898) .
27. Osborne, T.B. and Campbell, G.F. J . Am. Chem. S oc., 20: 4 l0 ( I 898) .
28. Osborne, T.B. and Campbell, G.F. J . Am. Chem. S oc ., 20: 4 l9 (1898).
29. Osborne, T.B. and H arris, I .F . , Am. ff. P h y s io l., l4 : 151 ( 1905) .
30. Jones, D.B. and Johns, C.O., J . B io l. Chem., 28: 67 (1916).
31. Johns, C.O. and Jones, D .B ., J . B io l. Chem., 28: 77 (1916) .
32. Johns, C.O. and Finks, A .J ., J . B io l. Chem., 24: ^29 (1918).
33. Johns, C.O., Finks, A .J. and Gersdorff, C .E.F., J , B io l. Chem.,2 L : I k s (1919).
3*. Johns, C.O. and Waterman, H.C., J . B io l . Chem., 44: 303 (1920).
35. Johns, C.O. and Gersdorff, C.E.F,. , J . B io l. Chem., 4^: 57 ( 1920) .
36. Jones, D .B ., G ersdorff,C .S .F ., Johns, C.O* and Finks, A .J ., J . B iol Chem., 52.: 231 (1922).
37. Jones, D.B. and Gersdorff, C.E.F,. , J . B io l. Chem., 58: 117 (1923).
38. Jones, D.B. and Gersdorff, C.E.F,, , J . B io l. Chem., J4; 415 (1927).
39- Anderson, R .J ., J . B io l. Chem., 48: 23 (1921) .
40. Gortner, R .A ., Hoffman, W.F. and S in c la ir , W.B., Cereal Chem., 6 : 1 (1929).
4 i . Bishop, L .R ., J . In s t . Brewing, 21: 316 (1929).
42. Staker, E .V ., J . Fhys. Chem., 25,: 1565 (I93l)«
43. Vickery, H .B ., Smith, E .L ., Hubbell, R.B. and Nolan, L .S ., J . B io l.Chem., i k O : 612. (1941).
139
44 . Quensel, 0 . , Untersuchungen uber d ie G ersten-globuline.D isser ta tio n , Uni. o f Uppsala, Sweden (1942).
4-5. V assel, B . , J . B io l. Chem., 159: 571 (1945).
46 . O fe lt , C.W. and C yril, D .E ., Ind. Eng. Chem., 4 l: 830 (1949).
47. D anielson, C.E., Bioehem. J . , 44: 387 ( 1949) .
48 . B ourdillon , J . , J . B io l. Chem., 180: 553 (1949) .
49 . Carpenter, D .C ., Arch. Bioehem., 2j[: 45 (1949) .
50. O ff ic ia l and te n ta tiv e methods of a n a ly sis o f the Asso. o f O ff.A gricu ltural Chem., Washington, D.C., 6th Ed., p . 4o4 (1945).
51. Ib id - p . 405.
52. Ib id - p . 26.
53* D i l l , J . J . , Some fa c to rs a ffe c t in g the determination of fa t ty acid sand unsaponifiable matter in plant m ateria ls . Thesis fo r degree o f Master o f Science, Mich. S tate College (1942).
54. W illiam s, R.D. and Olmsted, W.H., J . B io l. Chem., 108: 653 (1935)*
55. Smithsonian Physical Table, p. 218, Washington, D.C. (1933)*
56. Osborne, T .B ., J . Am. Chem. Soc., l4 : 629 (1892).
57. D avis, B .D ., Am. S c ie n t is t , ^4: 615 (1946).
58. Haurowitz, F e lix , Chemistry and b io logy o f p ro te in s, Academic Press,I n c ., N .Y ., p . 132 (1950).
59. Gortner, R .A ., O utlines o f b iochem istry ., John Wiley and Sons, I n c ., N .Y ., p. 352 (1949).
60. Ferry, R.M., Cohn, A .J. and Newman, E .S ., J . Am. Chem. S oc., 58:2370 (1936).
61 . Osborne, T.B*, J . Am. Chem. Soc., 24 : 28 (1902).
62. T is e l iu s , A ., Trans. Faraday S oc., 22; 524 (1937)*
63* Abramson, H.A., Moyer, L .S. and Gorin, M. H ., E lectrophoresis o fP rotein , Reinhold Publ. Co., N .Y ., p. 57 (1942).
64. Longsworth, L. G., Chem. R ev., ^0: 323 (1942).
65. Longsworth, L. G-., Ind. Eng. Chem. A nalytical Ed., 18.: 219 (1946).
140
66. Moore, D.H. and White, J.TJ., Rev. o f S c i. Instruments, 12.: 700 (1948).
67. Sorensen, S .P .L ., Compt. rend. trav . la h ., CarlsLerg, Vol. 12: (1917)*
68* Longsworth, L.G-. and Maclnnes, D.A., Chem., R ev., 24: 27 (1939)*
69* D avies, C.W., The conductiv ity o f so lu t io n s ., John Wiley and Sons, I n c ., K .Y ., p. 6 (1933).
70. Karon, M .J., Adams, M.E. and A ltschul, A.M., J . Rhys. C olloid Chem., 54: 56 (1950).
71. Cohn, E .J . , J . Am. Chem. Soc*, 52.* 696 (1928).
72. Green, A .A ., J . Am. Chem. Soc., 55/ 2331 (1933)•
73* D anielson, C.E., Acta Chem. Scand., 4: 762 (1950).
74 . Irv in g , Gr.W., Eontaine, T.D. and Warner, R .C ., Arch. Bioehem.,I l ^75 ( 1 9 ^ ) .
75* Stanley , W.G., Whitnah, C.H. and Andrews, A .C ., Dairy S c i . , 265 (1951).
ADDENDA
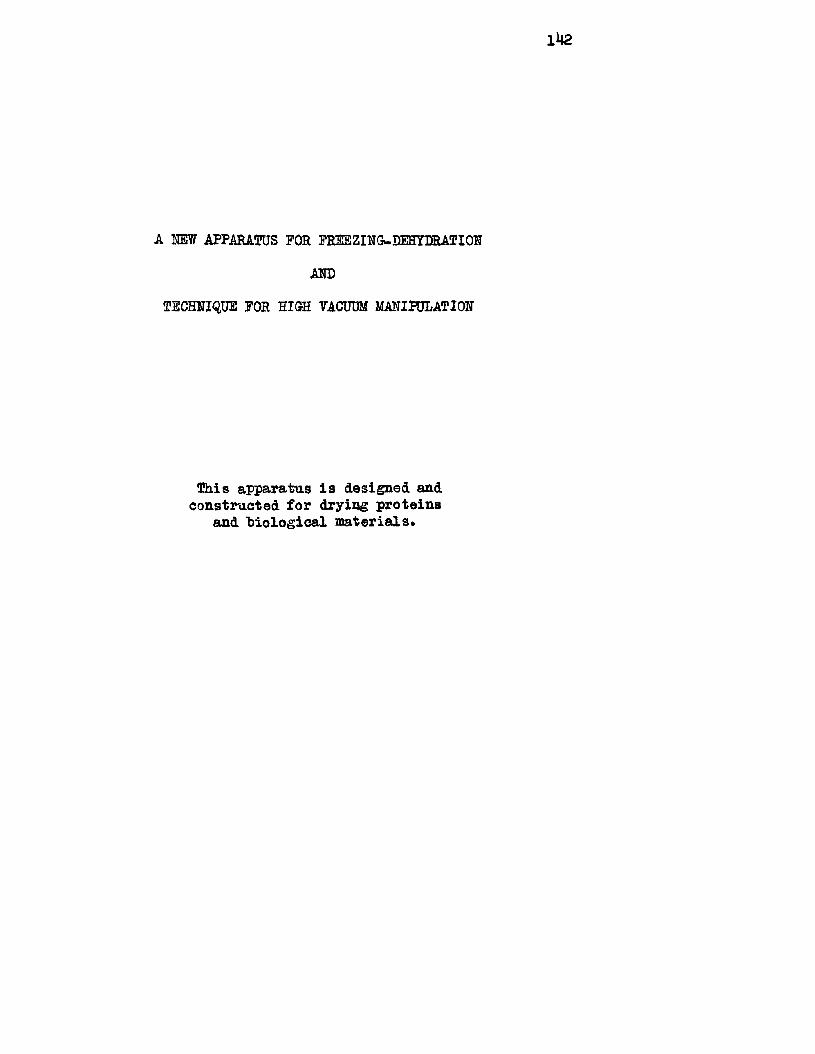
lH2
A HEW APPARATUS FOR FREEZINGwDEHYURATION
AID
TECHNIQUE FOR HIGH VACUUM MANIPULATION
This apparatus i s designed and constructed for drying proteins
and "biological m ateria ls .
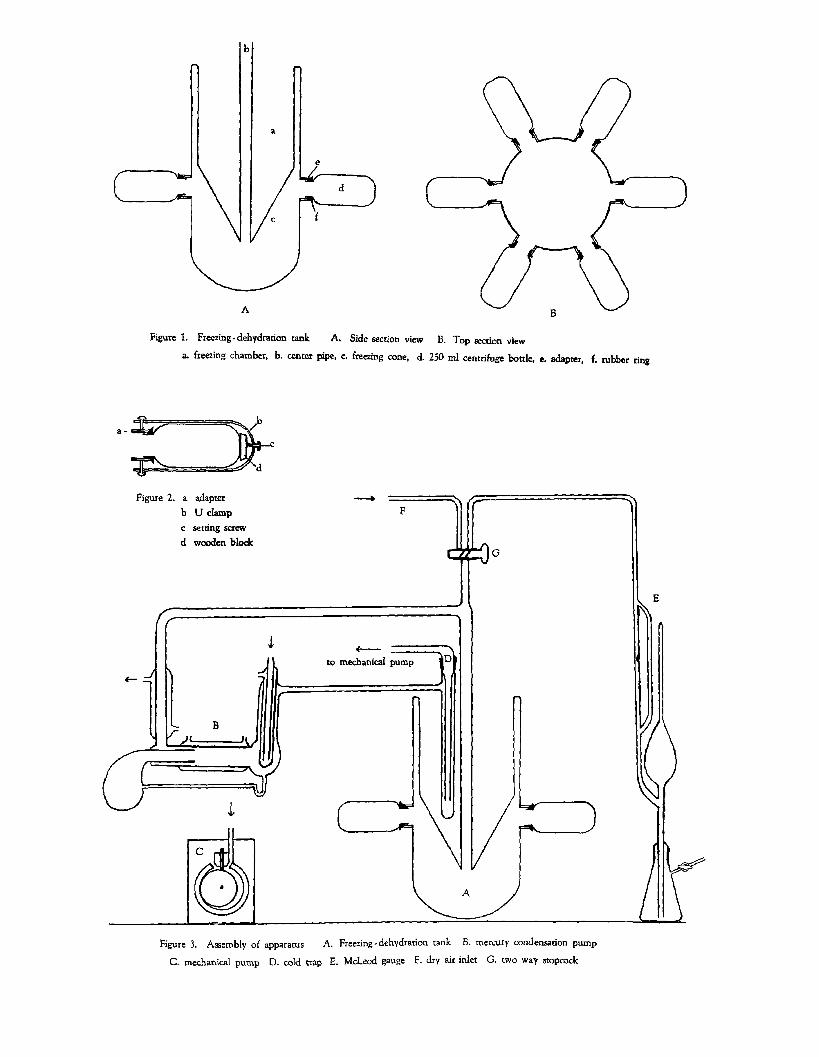
A
Figure 1. Freezing-dehydration tank A. Side section view B. Top section view
a. freezing chamber, b. center pipe, c. freezing cone, d. 250 ml centrifuge bottle, e. adapter, f. rubber ring
Figure 2. a adapter b U clamp c setting screw d wooden block
~\lD 1to mechanical pump
Figure 3. Assembly of apparatus A. Freezing-dehydration tank B. mercury condensation pump
C. mechanical pump D. cold trap E. McLeod gauge F. dry air inlet G. two way stopcock
A NSW APPARATUS 3P0R PREEZING-DEHYDRATION AND TECHNIQUE
EOR HIGH VACUUM MANIPULATION
By rapid freez in g and dehydration from frozen s ta te under low pres
sure b io lo g ic a l m ateria ls can he dried to a very low moisture content
without shrinkage in volume ( l ) . This technique has been u t i l iz e d in
the f ix a t io n o f t is s u e in morphological stu d ies and in h isto-ch em istry
(2 ,3 )* In a recent p u b lication (U) the use o f freezing-dehydration
method fo r the determination of moisture content o f dehydrated vegetab les
was described* I t involved the addition o f a large amount of water to
a weighed sample o f dried vegetab le, freez in g and drying from the frozen
s ta te and completion of the drying in a vacuum oven or vacuum desiccator
in the presence o f an e f f ic ie n t water absorbent. I t was observed that
there was a marked increase in the drying ra te o f samples o f dehydrated
vegetab les when f i r s t saturated with water, then frozen and subsequently
dried in vacuo from the frozen s ta te to a low moisture content. The in
crease in the drying ra te may be a ttr ib u ted to two fa c to rs . One i s an\
in crease in volume o f the frozen t is su e and the other i s the increase
in p o ro s ity . I t a lso was found that the completion o f the drying in a
vacuum oven at su ita b le temperatures produced the same r e su lts as drying
in an evacuated d esiccator a t room temperature.
To meet the requirements o f th is technique a new apparatus fo r freez
ing-dehydration has been designed and constructed in accordance with the
p r in c ip le s here described. The design o f th is freezing-dehydration vacuum
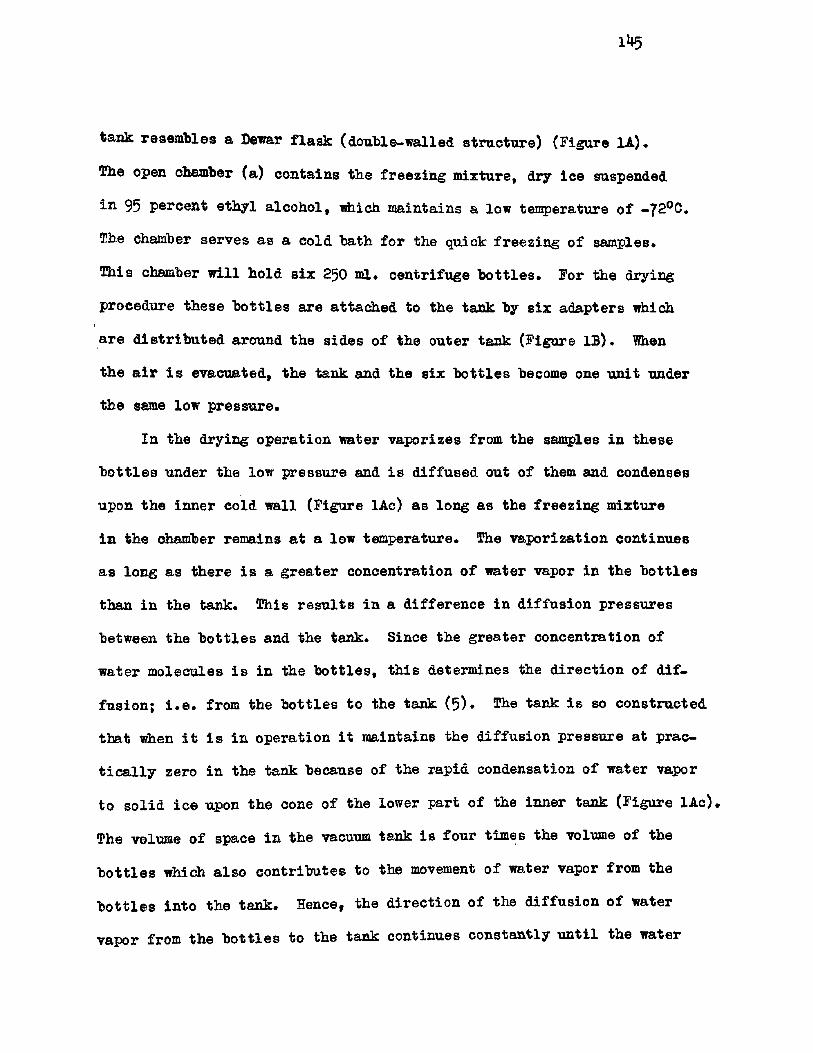
1^5
tank resem bles a Dewar f la s k (double-walled structure) (Figure 1A) ♦
The open chamber (a) contains the freez in g mixture, dry ic e suspended
in 95 percent ethyl a lco h o l, which maintains a low temperature o f - 72°C.
The chamber serves as a cold bath for the quick freez in g o f samples.
This chamber w il l hold s ix 250 ml. centrifuge b o t t le s . For the drying
procedure these b o t t le s are attached to the tank by s ix adapters which
are d istr ib u ted around the s id es o f the outer tank (Figure IB ). When
the a ir i s evacuated, the tank and the s ix b o tt le s become one u n it under
the same low pressure.
In the drying operation water vaporizes from the samples in these
b o t t le s under the low pressure and i s d iffu sed out o f them and condenses
upon the inner cold wall (Figure lAc) as long as the freezin g mixture
in the chamber remains a t a low temperature. The vaporization continues
as long as there i s a greater concentration o f water vapor in the b o tt le s
than in the tank. This r e su lts in a d ifferen ce in d iffu sio n pressures
between the b o t t le s and the tank. Since the greater concentration of
water m olecules i s in the b o t t le s , th is determines the d irectio n o f d if
fu sion ; i . e . from the b o tt le s to the tank (5)» The tank i s so constructed
that when i t i s in operation i t maintains the d iffu sio n pressure at prac
t i c a l l y zero in the tank because of the rapid condensation o f water vapor
to so lid ic e upon the cone of the lower part o f the inner tank (Figure lA c).
The volume o f space in the vacuum tank i s four tim es the volume of the
b o t t le s which a lso contributes to the movement o f water vapor from the
b o t t le s in to the tank. Hence, the d irection o f the d iffu s io n o f water
vapor from the b o tt le s to the tank continues constantly u n t il the water
146
vapor i s esdiausted in the h o t t le s and the samples are dried*
One p r in c ip le o f an e f f ic ie n t freezing-dehydration apparatus i s
the establishm ent o f a steep concentration gradient in the system* How
ever, the rate o f d iffu s io n i s a lso influenced by the d istance through
which the d iffu s in g m olecules must travel* These two fa cto rs are compo
nents o f what may he c a lled the concentration gradient* This p r in cip le
has guided the construction o f th is freezing-dehydration vacuum tank and
has met the requirement of e f fe c t iv e extraction o f water vapor from the
samples in the h o ttles*
CONSTRUCTION OF TANK.— The freezing-dehydration vacuum tank i s
made from the lower part (IS inches) of a s te e l gas cylinder (8 3 /4 inches
diam eter). The th ickness o f the outer w all i s 3/16 inch while the inner
tank i s made o f sheet s te e l 1 /8 inch th ick . The upper part o f the inner
tank i s r o lle d in to a cy lin d er, 8 inches in h eigh t, 7 1 /2 inches in di
ameter; the lower part i s r o lle d in to a cone, 6 inches in height and
th ese are welded together. A 3 /4 inch pipe 20 inches in length i s welded
through the t ip o f the cone. The tank i s evacuated through th is pipe
(Figure lA ,b ) . The two tanks are welded together across the top and the
u n it i s thus sim ilar to a double-walled Dewar f la s k . Six openings are
equally d istr ib u ted around the outer tank 10 inches from the top edge.
These openings provide for the connection of s ix 250 ml. centrifuge bot
t le s (Figure IB ). Adapters fo r the b o tt le s are welded at these openings.
They are made o f 1 1 /2 inch pipe and cut 1 1 /4 inches in len gth . Two
h o le s are threaded in to each p iece o f pipe on opposite s id es a t the center
fo r f i t t i n g 1 /2 inch long, 1 /4 inch b a ll head b o lts (Figure 2 a ). The
l k 7
b o lts are brazed in to p lace on the in sid e o f the adapters* U clamps o f
s tr ip iron (Figure 2b) which hook over the two b o lts on the adapter are
adjusted by a se t screw at the other end o f the U clamp to hold the cen
tr ifu g e b o t t le s stationary (Figure 2c)* A wooden block a c ts as a cushion
between the bottom o f the b o tt le and the se t screw. The adapters are
beveled a t a 90° angle on the in sid e to accomodate a rubber ring* which
f i t s over the neck o f the b o tt le (Figure lA , f ) . This provides an a ir
t ig h t connection between the b o ttle s and the tank*
Before welding, the in sid e and outside o f the two tanks were painted
with red oxide primer* Two coats o f red oxide primer were applied a fte r
the u n its were welded together and the tank was evacuated while the paint
was wet*
When in operation, the tank i s wrapped with an inch th ick wool blan
ket fo r insu lation*
ASSEMBLY OF APPARATUS AND LOW PRESSURE PRODUCTION The en tire
apparatus fo r freezing-dehydration (Figure 3) co n sis ts o f the freez in g -
dehydration tank, A, the mercury condensation pump B, the mechanical
pump C, and the cold trap D which i s connected between the mercury pump
a n d the mechanical pump to trap water vapor and mercury vapor. These
compose the a c t iv e parts o f the apparatus. The McLeod guage E and the
dry a ir in le t F are used in frequently and can be iso la te d from the more
a c t iv e parts by the stopcock a t G* The en tire assembly occupies a hor
iz o n ta l space on a bench or on a movable tab le o f two by four feet*
* Cenco F r iz z e l l holder No. 18107
lUg
This enables the u n it to he placed on a convenient working lev e l* The
s im p lic ity o f th is u n it e lim ina tes operational d i f f i c u l t i e s . I t i s easy
to evacuate th is simple system and to keep i t evacuated*
The capacity o f the mechanical pump should he h igh . Capacity i s
measured hy the time required to evacuate a given volume to a desired
pressure* This time i s in proportion to the volume o f the system. A
comparison o f the capacity o f two mechanical pumps w ill i l lu s t r a te these
p o in ts (Table I ) . The data in Table I in d ica tes that a larger volume
requ ires more time proportionally for proper evacuation. I t a lso fur
n ish es inform ation that a proper choice o f the mechanical pump i s impor
tant in obtaining the best production o f low pressure.
With the help o f a mercury d iffu sio n pump a low pressure of 10“ -*
i s p o ss ib le when a fa s t mechanical pump i s used (Table I I ) . Table II
i l lu s t r a t e s that the e f f ic ie n c y o f a mercury pump i s dependent upon a
'•backing pressure” produced by a mechanical pu$p.
The data in Table II in d ica te that a mercury d iffu sio n pump w il l
produce a higher vacuum when matched with an e f f ic ie n t mechanical pump.
This i l lu s t r a t e s that the use o f mercury and mechanical pumps together
are necessary to produce the desired low pressure and overcome the d efects
o f the system.
Although mercury d iffu sio n pumps backed by fa s t mechanical pumps
are preferred fo r high vacuum work and have been recommended by many
in v e st ig a to r s (7) * they do have one disadvantage. The vapor pressure
due to the mercury i s so high i t tends to destroy the vacuum in the sys
tem. I f a pressure of the order o f 10"^ micron i s to be maintained in
149
TABLE I
COMPARISON OP THE CAPACITY OP TWO VACUUM PUMPS (6)
Duo-seal pomps No. 1405 1 /3 h .p . No. 1400 1 /4 h .p .
Low p res, obtainable 0*05 micron Hg 0 .1 micron Hg
Pree a ir capacity 33*4 l i t e r s per min. 21 l i t e r s per min
Evacuated Volume in L iters and Time in Minutes
Pressure 5 1 . 10 1 . 20 1. 30 1 . 50 1. 5 l . 10 1 . 20 1
mm. Hg min. min. min. min. min. rain. min. min.
101 .65 1 .5 3.0 4 .3 7 .0 1 .4 2.8 5 .8
10° 1 .2 2 .3 4 .6 7 .0 11.5 2.3 4 .5 9 .0
10”1 1 .7 3 .5 7*0 10.8 17.2 3.0 6 .5 13.0
10-2 2 .5 5 .0 9*6 l4 .g 24.0 4.7 9 .5 19.0
10” 5 3 .5 b.8 13-7 20.3 33.5 7 .5 15.3 31.0
10"^ 5*1 10.6 21.0 31.5 54.0 20.0 40.0
TABLE II
PERFORMANCE OP MERCURY PUMP BACKED BY MECHANICAL PUMP
Pressure produced by Low pressure producedmechanical pump by mercury pump (Todd)
0 .1 mm. 0.0003 mm.
1 .0 mm. 0.0003 “ a*
5 .0 mm. 0.0003 mm.
10.0 mm. 0.007 mm.
20.0 mm. °*14
30.0 mm. °*3 ““a*
150
a system, mercury, which has a vapor pressure o f 0.185 micron a t 0°C.
must "be prevented from d iffu sin g in to the system. Since the vapor pres
sure o f mercury a t i s but 3 x 10“ micfon, the concentration o f
mercury may be grea tly reduced in the system by the use o f a cold trap
(S ) . Thus, a trap must be used but a tten tio n should be given to the
design o f the trap su ita b le for high vacuum work such that i t o ffe r s
only low r es is ta n ce to the flow o f gas. The trap used for th is appara
tus has an ou tsid e tube measuring J 2 mm. in diameter and an in sid e tube
measuring 18 mm. in diameter. I t has a un iversal jo in t o f ground g la ss
so that one o f i t s arms i s adjustab le. Since the mercury vapor i s ex
tremely poisonous, i t i s e sp e c ia lly dangerous for use in a poorly ven ti
la te d room. Both mercury vapor and water vapor endanger the e ff ic ie n c y
o f a h igh vacuum mechanical pump. Thus th is second condensation trap
i s a sa fe ty d ev ice .
The important fa c to rs a ffe c t in g the operation of a pumping system
are: 1 . leakages in the system, 2. The resista n ce of the pumping l in e ,
trap co n str ic t io n s , bends, e tc . These 'offer high resista n ce to the flow
o f gas. The capacity o f the vacuum lin e s i s determined by: 1 . the short
e s t p o ss ib le d istan ce between the pump and the vacuum apparatus; 2. the
la r g e s t diameter p o ss ib le o f the connecting tubes; 3» the use o f large
curves in tubing rather than sharp angles, and 4 . absorption o f gas on
the w a lls o f the en tire system. Both g la ss and metal adsorb an apprec
ia b le amount o f carbon d iox id e, a ir and moisture upon th e ir surfaces*
Metal u n its are more porous than g la ss , hence they have a higher capacity
fo r adsorbing gases than g la s s . In order to lib e r a te the adsorbed gases
151
a t a rapid rate g la ss mast be heated up to 300°C. w hile pumping* New
apparatus r e le a se s gases very slow ly a t room temperature* However,
metal u n its are not outgased by any procedure other than that o f contin
uous pumping. In a system fo r high vacuum i t i s imperative to remember
that the pumps are an in teg ra l part o f the whole system, and as such,
th e ir fu nction ing i s dependent on the design of the system. Even fo r
a h igh speed pump the res ista n ce of the pumping l in e s mast be kept to
a minimum. Short len gth s o f small diameter tubing must be avoided. I f
the res ista n ce o f the vacuum system i s h igh, the system w il l be a slow
system even i f the pump used has great speed, because the pump speed i s
then lim ited by the system.
OPERATIONAL PROCEDURE*— The reservoir or freez in g tank (Figure
lA ,a) i s f i l l e d with four l i t e r s o f 95 percent ethanol. Small p ieces
o f dry ic e (2 or 3 ounces) are added. Vigorous COg gas evo lves. Addi
t io n o f dry ic e i s continued every 5 to 10 seconds u n t il the vigorous
evolu tion o f COg gas decreases. This requires about two pounds o f dry
i c e . Then four p ieces o f dry ic e a h a lf pound in s iz e are added to
assure the temperature o f the alcohol a t - 72° G.
Six 250 ml. cen trifu ge b o t t le s containing samples are suspended
half-w ay in the freez in g tank fo r 20 to 30 minutes. The b o t t le s are
placed in an upright p o s it io n . A fter 30 minutes in the freez in g tank,
th e b o t t le s are removed and connected to the adapters and fastened with
the screws a t the ends o f the U clamps.
A fter the sample b o t t le s are removed, s ix pounds of dry ic e are pat
in to the freez in g tank. The temperature of -7 2 °C. w il l remain constant
152
for a period of 7 to 8 hours* Additional dry ice must be added i f the
operation i s to proceed for a longer period* The mechanical pump i s then
turned on for 3 to 5 minutes* When most of the a ir i s evacuated by the
mechanical pump, then heat i s applied to the mercury pump. The pressure
o f the system i s measured by a McLeod gauge*
When th is vacuum-dehydration process i s completed, the apparatus
should be turned o ff in the follow ing manner; 1* the heater for the
mercury pump i s f i r s t turned o ff; 2. a ir i s slowly allowed to go into
the system through the drying tube by turning the two way stopcock at
G- (Figure 3)* 3» *4® mechanical pump i s immediately turned o ff; 4 . re
move the b o ttle s containing dried samples, these are stored in a desio-
icca to r -contain ing P20 or Mg(ClOlj.^ and subsequently evacuated.
EXPMIMOTAL RESULTS,— A* Drying meats and vegetables. Six cen
tr ifu g e b o ttle s containing s ix d ifferent weighed samples were frozen in
the freezing chamber of the apparatus for 30 minutes then connected to
the vacuum tank for 4 hours dehydration. Pressure measured 22 micron
of mercury a fter 1 hour. Temperature of the freezing tank was —72®C*
.After 4 hours dehydration the samples were reweighed*
Sample Wt. Fresh Wt. Dried % Water Loss per Total Wt
1. Lean beef 58.30 gm. 37.15 gm. 36.8
2 . Kidney 38.86 gm. 22.20 gm. 43.0
3* Beef l iv e r 31* 5 gm. 18.10 gm. 42.8
4* Apple 54.65 ffn* 30.09 gn. 44.9
5 . Carrot 38.20 gm. 24.72 gm. 35.3
6. Cabbage 34.75 gm. 10.04 gn. 71.1
153
Observations made from r e su lts o f th is experiments
1 * When a sample was cut in to large chunks, the center portion was not
dried in 4 hours and remained frozen.
2 . A ll dried samples retained th e ir o r ig in a l form and s iz e .
3« Incom pletely dried samples absorbed moisture from atmospheric a ir .
This observation was made from apple t is su e which became stick y a few
minutes a f te r exposure to a ir .
4 . Pour hours dehydration was not su f f ic ie n t fo r drying these t is s u e s .
B. Drying meats and vegetab les. Six centrifuge b o tt le s containing
s ix d iffe r e n t weighed samples were frozen in the freezin g chamber o f the
apparatus fo r 30 minutes then connected to the vacuum tank fo r eigh t hours
dehydration. Pressure measured 20 microns a fte r 1 hour. A fter 8 hours
dehydration the samples were weighed and stored in a vacuum d esiccator
w ith PgO as water absorbent. The fo llow in g r e su lts were obtained. Per
centages o f water lo s s per to ta l weight were ca lcu lated a fte r 8 hours o f
vacuum dehydration and a f te r completion o f drying in a vacuum d esiccator
fo r 7 days.
Sample Wt. Fresh Sample
Wt. Sample a fte r 8 hr. Dehydration
$> Water Loss per
Total Weight
# Water Loss a fte r 7 Days in Desiccator
1 . Banana 3 2 .6 5 gnu 8.48 gm. 74.0 74.6
2 . Green bean 24.60 gm. 3,00 gn. 87.8 84.3
3* Sweet potato 45.79 20.07 S01* 56.17 6 6 .3 9
4 , Carrot 3 2 .3 3 8.53 g a . 7 3 .6 3 86.48
3 . Beef 46.10 gm. 14.20 gm. 69.19 71.14
6 . Beef l iv e r 42.00 gm. 16.30 gn. 61.19 67.07
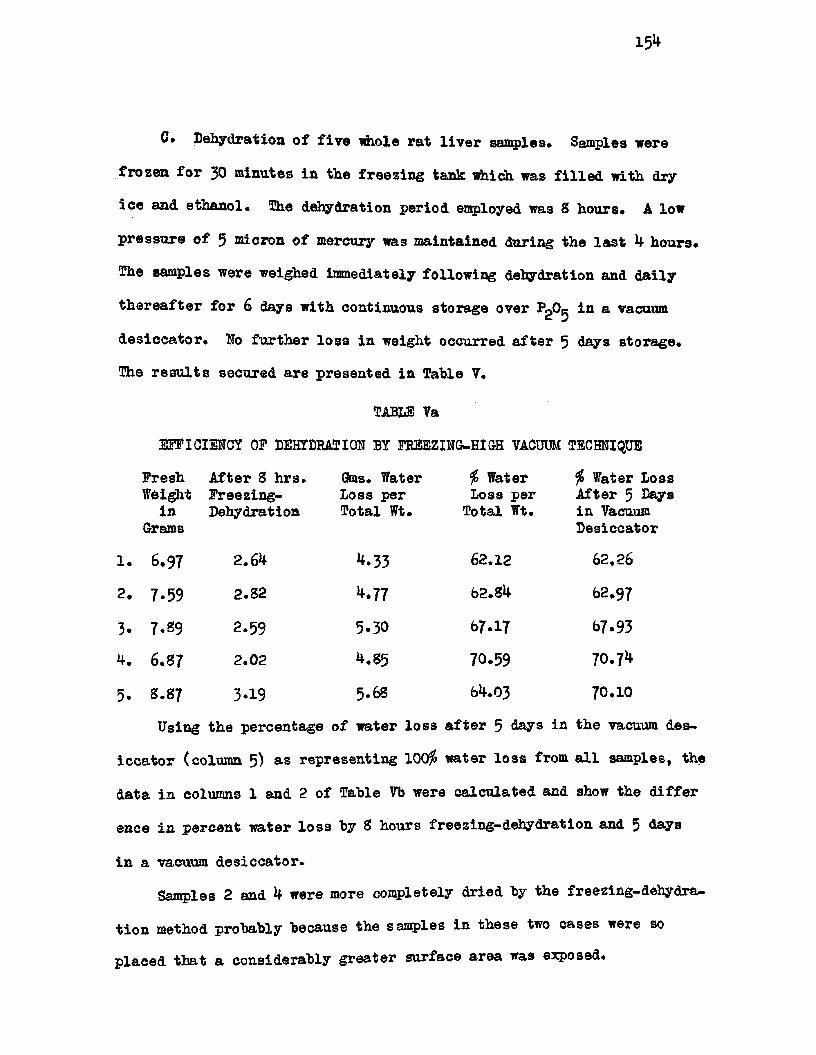
154
O* Dehydration o f f iv e whole rat l iv e r samples. Samples were
frozen fo r 30 minutes in the freez in g tank which was f i l l e d with dry
ic e and ethanol. The dehydration period employed was 8 hours* A low
pressure o f 5 micron o f mercury was maintained during the la s t 4 hours*
The samples were weighed immediately fo llow ing dehydration and d a ily
th erea fter fo r 6 days w ith continuous storage over Ig®5 a vacaam
desiccator* No further lo s s in weight occurred a fte r 5 days storage*
The r e s u lt s secured are presented in Tahle V.
TABLE Va
EFFICIENCY OF DEHYDRATION BY FREEZING-HIGH VACUUM TECHNIQUE
FreshWeight
inGrams
A fter 8 h rs.Freezing-Dehydration
Gas. Water Loss per Total Wt.
$ Water Loss per
Total Wt.
$ Water Loss A fter 5 Days in Vacuum D esiccator
1 . 6*97 2 .64 M 3 62.12 62.26
2 . 7-59 2.82 4*77 62.84 62*97
3. 7-S9 2.59 5.30 67*17 67*93
4 . 6*87 2.02 4.85 70*59 7 0 . 1 k
5. 8.87 3*19 5*68 64.03 70.10
Using the percentage o f water lo s s a f te r 5 days in the vacuum des
icca to r (column 5) as representing 100$ water lo s s from a l l samples, the
data in columns 1 and 2 o f Tahle Vb were ca lcu lated and show the d iffe r
ence in percent water lo s s hy 8 hours freezing-dehydration and 5 days
in a vacuum d esicca to r .
Samples 2 and 4 were more completely dried hy the freezing-dehydra^
t io n method prohahly because the samples in these two cases were so
placed th a t a considerably greater surface area was esqposed.
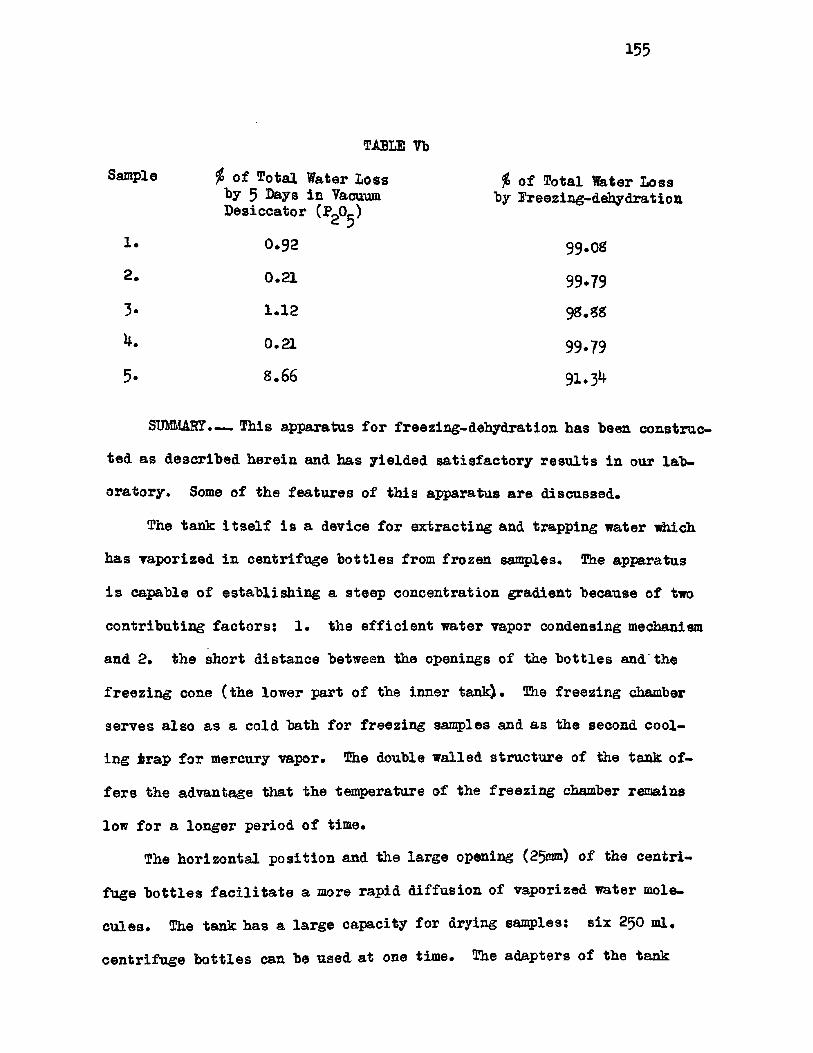
155
TABLE Vb
Sample $ o f Total Water Lossby 5 Days in VacuumD esiccator (Po0.-)
« 5
$ o f Total Water Loss by Freezing-dehydration
1 . 0*92 99*08
2. 0.21 99*79
1 .12 98.88
0.21 99*79
91*3^8.66
SUMMARY”. — This apparatus fo r freezing-dehydration has been construc
ted as described herein and has y ie ld ed sa tis fa c to ry r e s u lts in our lab
oratory* Some of the fea tu res o f th is apparatus are d iscussed .
The tank i t s e l f i s a device for extracting and trapping water which
has vaporized in centrifuge b o tt le s from frozen samples. The apparatus
i s capable o f e s ta b lish in g a steep concentration gradient because o f two
contributing fa c to rs: 1 . the e f f ic ie n t water vapor condensing mechanism
and 2 . the short d istance between the openings o f the b o tt le s and the
fr e ez in g cone (th e lower part o f the inner tank). The freezin g chamber
serves a lso as a co ld bath for freezin g samples and as the second cool
in g trap fo r mercury vapor. The double w alled structure of the tank of
fe r s the advantage that the temperature of the freez in g chamber remains
low fo r a longer period o f time.
The h orizon ta l p o s it io n and the large opening ( 25mm) o f the cen tr i
fuge b o t t le s f a c i l i t a t e a more rapid d iffu sio n of vaporized water mole
c u le s . The tank has a large capacity for drying samples: s ix 250 ml.
cen tr ifu g e b o t t le s can be used at one tim e. The adapters o f the t ank
156
allow b o t t le s to be used interchangeably which i s an improvement over
other types o f laboratory vaeuum-dehydration units* Further advantages
are o ffered by the use of centrifuge b o ttle s because substances which
must be separated from so lu tion by cen trifu gation can be dried in the
same b o t t le without tran sfer which prevents p ossib le lo s s o f sample,
l im it s contamination and saves time* The dried samples may be preserved
in the same b o ttles*
The s im p lic ity o f design o f the en tire u n it contributes to ease of
construction in an ordinary machine shop*
I t has been found that 8 hours operation i s su ff ic ie n t to dry samples
to near constant weight* The apparatus i s easy to operate and does not
require sp ec ia l a tten tio n during the period o f operation.
157
LITERATURE CITED
X* Gersh, I« , "The Altmann Technique fo r F ixation "by Drying w hile
Freezing1*, Anatomy Record, 53.: 309, (1932).
2 . Hoerr, N.L. and S cott, G-.H., "Frozen-Dehydration Method for H isto
lo g ic a l F ixation", Medical Physics, the Tear Book Publisher, In c .,
p . 466 (1949).
3* Simpson, W.L., "An Experimental A nalysis of the Altmann Technic o f
Freezing-D rying,w Anatomy Record, 80: 173 (1941)*
4 . Makower, Benjamin, "Use o f L yophilization in Determination of Mois
ture Content o f Dehydrated Vegetables," A nalytical Chem., 20: 856
(1948).
5 . Meyer, B .S ., and Anderson, D .B ., "Diffusion o f Gases", Plant Physi
o logy, Textbook, D. Van Nostrand Co., Inc. (1940).
6 . Welch Company Duo-Seal Pumps B u lle tin , Welch Co., Chicago (1947)*
7 . Sanderson, R .T ., "Vacuum Manipulation o f V o la tile Compounds", p. 30-
42, John Wiley & Sons, In c ., (1948).
8 . Dushman, S ., " S c ie n tif ic Foundation o f Vacuum Technique", p. 212,
John Wiley & Sons, I n c ., (1949)*
15 8
A HIGH TEMPERATURE BATH MADE FROM ALUMINUM SHAVINGS
159
A HIGH TEMPERATURE BATH MADE EROM ALUMINUM SHAVINGS
The need fo r a h igh temperature hath for hyd rolysis of p roteins in
aqueous so lu tio n s le d to the work presented as follow s* I t was necessary
to f in d a m ateria l fo r a hath in which constant h o ilin g temperature of
an aqueous so lu tio n could he obtained. Since aluminum shavings have a
high con d u ctiv ity o f h eat, i t was found that a high temperature hath
could he constructed from them.
An aluminum-shaving hath i s constructed o f a copper hox which con
ta in s aluminum turnings ahout the s iz e o f r ic e granules. The hox i s
placed on top o f a copper p la te a quarter o f an inch th ick and i s fa s
tened hy screws. The copper p la te i s heated hy three e le c tr ic elements
and the heat i s regulated and con tro lled hy a thermoregulator which i s
lo ca ted in the center o f the hath, (figu re l ) .
Because o f the high conductivity o f copper a uniform temperature
hath can he constructed* The copper p la te must he th ick enough in order
that s u f f ic ie n t heat may he d iffu sed to the en tire u n it. The en tire
hath i s in c lo sed in a hox o f tr a n s its so that the uniform temperature
o f the hath can he preserved. The space between the copper hox and the
tr a n s ite w all measures one inch and i s f i l l e d with rock wool as in su la to r .
The hath i s covered with ind ividual tra n site covers with notches to ac
commodate the necks o f the f la s k s .
The dimensions o f the in sid e o f the hath are as fo llow s: 40 inches
in len gth , 6 inches in width and ^ 1 /2 inches in depth* Eight 300 ml.
round bottom f la sk s can he set in a row. The f la sk s are conveniently
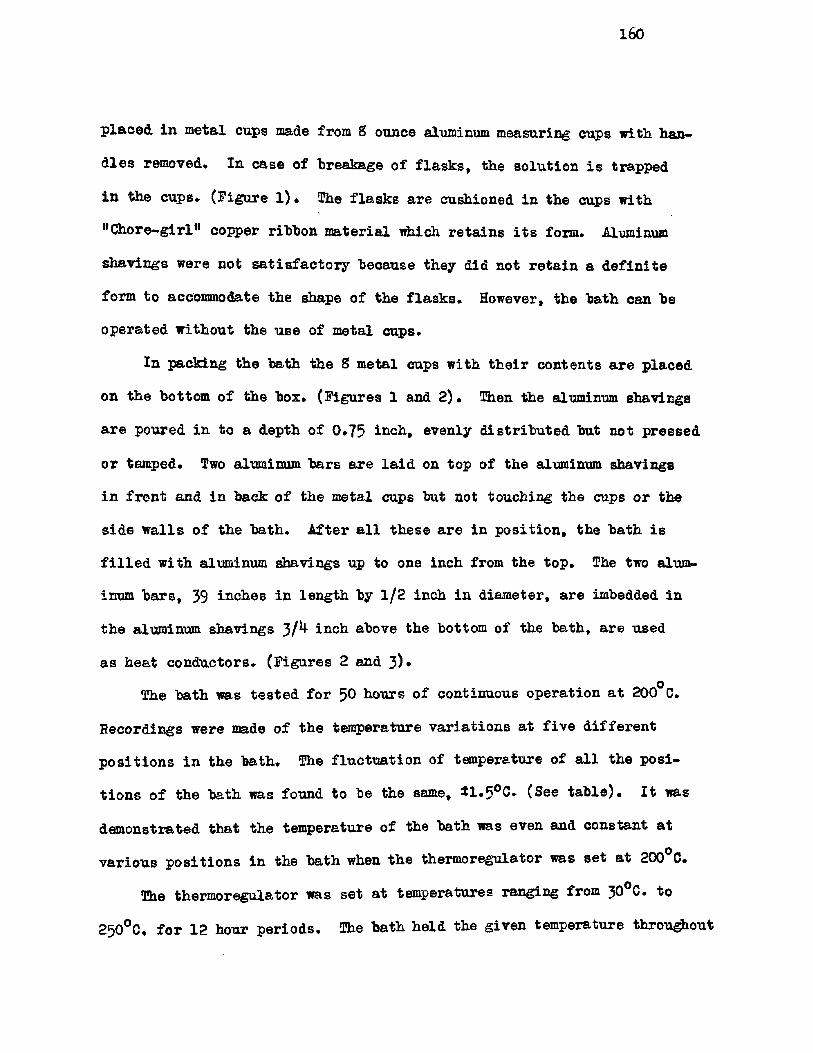
160
p laced in metal cups made from 8 ounce aluminum measuring cups with, hqn—
d ie s removed* In case of “breakage o f f la s k s , the so lu tion i s trapped
in the cups* (Figure 1) • The f la sk s are cushioned in the cups with
"Gho r e - g ir l11 copper ribbon m aterial which reta in s i t s form. Aluminum
shavings were not sa tis fa c to r y because they did not re ta in a d e f in ite
form to accommodate the shape o f the flask s* However, the bath can be
operated without the use of metal cups.
In packing the bath the 8 metal cups with th e ir contents are placed
on the bottom o f the box* (Figures 1 and 2 ) . Then the aluminum shavings
are poured in to a depth o f 0*75 inch, evenly d istr ib u ted but not pressed
or tamped. Two aluminum bars are la id on top o f the aluminum shavings
in front and in back o f the metal cups but not touching the cups or the
sid e w a lls o f the bath. A fter a l l these are in p o s itio n , the bath i s
f i l l e d w ith aluminum shavings up to one inch from the top . The two alum
inum bars, 39 inches in length by 1 /2 inch in diameter, are imbedded in
the aluminum shavings 3/^ i^ch above the bottom o f the bath, are used
as heat conductors* (Figures 2 and 3)*
The bath was tested for 50 hours o f continuous operation a t 200°0.
Recordings were made o f the temperature v aria tion s at f iv e d ifferen t
p o s it io n s in the bath. The flu c tu a tio n of temperature of a l l the p osi
t io n s o f the bath was found to be the same, *1*5°C» (See ta b le ) . I t was
demonstrated that the temperature o f the bath was even and constant a t
various p o s it io n s in the bath when the thermo regulator was set at 200 C.
The thermoregulator was set a t temperatures ranging from 30°C. to
250°C. fo r 12 hour periods. The bath held the given temperature throu^aout
161
the period tested* D etailed data on sp e c if ic temperatures other
200°C* were not compiled. Temperatures higher than 250°C. could he
secured hy adding more heating elements*
The aluminum-shaving hath so constructed has many advantages for
use in a chemical laboratory. I t i s e sp ec ia lly u sefu l a t or ahove 100°C.
fo r hydrolyzing or reflu x in g samples for long periods. P a r tia lly hydro
lyzed samples can he taken from each f la s k for a n a ly sis o f the degree
o f h yd ro lysis without d isturb ing the main procedure when the two-neck-
f la sk s are used* Aluminum shavings are non-corrosive and always appear
clean . Ahove 100°C. the shaving-bath has several advantages over a liq u id
hath: no liq u id escapes hy evaporation; no unpleasant fumes as with acid
or organic l iq u id s .
The cost o f the m ateria l, excepting the thermoregulator, for b u ild
in g the hath i s between $12.00 and $15*00. The thermoregulator i s manu
factured hy Fenwal, In c ., Ashland, M assachusetts. .An aluminum p la te 3/&
inch th ick , *40 inches hy 6 inches, weighing 10 pounds may he used instead
o f copper (c o st $3 .0 0 ). Aluminum shavings are obtainable a t machine
shops a t $ .10 per pound.
‘<1Figure 1. Front section view
Aluminum shavings
Rock wool insulation
Copper plate
Heating element
300 ml. flask placed in metal cup, cushioned with chore-girl copper ribbon
Position of thermo- regulator
0 0 0 ^ 0 0 0 ?* < t V f 1 ' / ‘V r t «< »V7<< */ ’ » w » «»<V> » » < i . W « < x
Figure 2. Top section view
Flask > ■ -a Aluminum bar
V A Aluminum shavings JfH^ Rock wool insulation
Figure 3. End section view
• • Aluminum bars ■ • • Heating elements
i - i Copper plate
163
TEMPERATTffiE VARIATIONS AT PIT/E POSITIONS IN THE BATH
Time in Thermo- 1 2 3 4 5Minutes regu lator
P ilo t Light °0 °c °0 °C °c
1 o f f 201 203 201 202 2012 o f f 201 203 201 202.5 2013 Off 201 203 201 203 2014 o f f 201 203 201 203 2015 o f f 201 202 200 202 2006 on 201 202 200 202 2007 on 200 201 199 201 200s on 200 201 199 200 2009 on 199 200 19S 200 199
10 on 199 200 198 200 199
11 on 198.5 200 198 200 19912 on 198 200 198 200 19913 on 198.5 200 19 8 200 19914 on 199 200.5 198 200 19915 on 199 200.5 198 200 20016 on 199-5 201 198 200 20017 on 200 201 198.5 200. 200IS on 200 201 199 200.5 20019 o f f 200 201 200 200.5 20020 o f f 200 201 200 201 201
21 o ff 200 201.5 200 201 20122 o f f 200 202 200 201 20123 o f f 200 202.5 200.5 201.5 201,24 o f f 200.5 203 200.5 202 201,25 o f f 200.5 203 200.5 202 20126 o ff 200.5 203 200.5 202 £0027 o f f 200.5 203 201 202 2002S o f f 200.5 202 200.5 202 20029 o ff 200 202 200.5 202 19930 o f f 200 202 200.5 201 199
31 o ff 200 202 200.5 200.5 19932 o f f 200 202 200 200.5 19933 on 200 201.5 200 200.5 1993*4- on 200 201 199.5 200 19935 on 199.5 200.5 199 200 19936 on 199 200 198.5 200 199.37 on 198.5 200 198.5 200 19938 on 198.5 200 198.5 200 19939 on 198 200 198 200 19940 on 19s . 5 200 198 200 199
164
TABLE Oont.
Time in Thermo- Minutes regulator
1 2 3 4 5
P ilo t Light °C °o °c °0 °c
4 l on 19S.5 200 198 200 19942 on 19^.5 200 198 200 19943 on 199 200.5 198.5 200 199.544 o ff 199 201 199 200 20045 o f f 199 201 199 200 20046 o f f 199 201 199.5 200 200?7 o ff 199.5 201.5 200 200.5 2004s o f f 200 202 200 201 200.549 o ff 200 202 200 201 200.550 o ff 200 202 200 201 201
51 o ff 200 202 200 201 20152 o ff 200 202 200 201 200.553 o f f 200 202 200 201 200.554 o f f 200 201*5 200 200.5 200.555 o ff 200 201*5 200 200.5 20056 o f f 199.5 201 199.5 200 20057 o f f 199 200.5 199 200 20058 on 198.5 200 199 200 199.559 on 198 200 198.5 199.5 19960 on 198 200 198.5 199.5 199
H ighest reading 201 203 201 203 201Lowest reading 198 200 198 200 199
Range or v aria tion 3 3 3 3 2
F luctuation t 1 .5 ± 1 .5 1 1 .5 i 1 .5 t 1