Embed Size (px)
Citation preview

CHARACTERISTICS OF HEAVY METAL UPTAKE AND
ACCUMULATION IN SELECTED PLANT SPECIES FOR
DEVELOPMENT OF PHYTOEXTRACTION TECHNOLOGY
BY
NASIR ALI
DEPARTMENT OF BIOTECHNOLOGY
UNIVERSITY OF MALAKAND,
CHAKDARA, DIR (L)
2016

CHARACTERISTICS OF HEAVY METAL UPTAKE AND
ACCUMULATION IN SELECTED PLANT SPECIES FOR
DEVELOPMENT OF PHYTOEXTRACTION TECHNOLOGY
BY
NASIR ALI
A thesis submitted to the Department of Biotechnology University of Malakand
for the partial fulfillment of the requirement for the degree of Doctor of
Philosophy (PhD) in Biotechnology
DEPARTMENT OF BIOTECHNOLOGY
UNIVERSITY OF MALAKAND,
CHAKDARA, DIR (L)
2016


DECLERATION
I declare that this work is original and I have not used other than the declared sources/
resources, and have explicitly marked all materials which have been quoted either literally or
by content from the used sources. I also declare that this work has so far neither been
submitted to Department of Biotechnology University of Malakand, Pakistan, for obtaining
the degree of PhD in Biotechnology or any other program.
Furthermore, the studies were carried out in the laboratory of the Department of
Biotechnology, University of Malakand Chakdara. Lower Dir, KPK Pakistan.
______________________________
Nasir Ali


ACKNOWLEDGEMENTS
I deem it highest pleasure to avail this opportunity to express my
heartiest gratitude to my supervisor, Dr. Fazal Hadi, Assistant Professor,
Department of Biotechnology, University of Malakand. His skillful guidance,
technical approach, art of making useful suggestions and inspiring attitude
made it very easy to undertake this work and to write this manuscript.
I am thankful to Dr. Syed Muhammad Jamal (Chairman Department of
Biotechnology) and other staff members of the Biotechnology Department,
for their sincere encouragement.
The Pakistan Science foundation is highly acknowledged for the financially
support of main part of my PhD research project, under the Pak-US linkage
program. The Directorate of Science and Technology, Khyber Pakthoonkhwa is
highly acknowledged for financially support of a part of my PhD research
project. The Higher Education Commission of Pakistan is acknowledged for
their support in term of Laptop provision Under Prime Minister Laptop
Scheme and reimbursement of the University fees Under Prime Minister fee
reimbursement scheme. Without their financial support it would be very
difficult for me to complete my PhD study.
I am very thankful to my parents, brother and sisters whose sincere
wishes accompanied me all the way my career. It was, in fact, their moral
support that gave me the confidence for taking this research work.
At last and not the least, I offer my thanks to all those who helped
me especially Dr. Ayaz Ahmad, Mr. Aminullah Jan (PhD Scholar) and Mr.
Altaf Hussain (MPhil Scholar) for their encouragement during the present
study.
In the last, all the errors that remain are mined alone.

NASIR ALI

Copyright Statement
This copy of the thesis has been supplied on condition that anyone who consults it is
understood to recognize that its copright rests with its author and that no quotation
from the thesis and no information derived from it may be published without the
author’s prior consent.

PREFACE
The thesis comprises of five chapters. A detail introduction to the problem has been given in
the first chapter. In second chapter the effect of chemical chelator (EDTA) and plant growth
regulator (Gibberellic acid) has been evaluated on the cadmium phytoextraction potential of
P. hysterophorus plant and include biochemical and physiological analysis. This chapter was
financially supported by Directorate of Science and Technology. In third chapter the effects
of various treatments of molybdenum (Mo) have been investigated on cadmium uptake and
accumulation in Ricinus communis and Cannabis sativa plants and studied the physiological
and biochemical changes occurred in the plants under cadmium stress. In fourth chapter, the
effect of Mo on expression of four CBF/DREB like genes in Ricinus communis and Cannabis
sativa plants under Cd stress have been investigated. The experimental work of chapter 3rd
and 4th
were financially supported by the Pakistan Science Foundation (PSF). The fifth
chapter gives a detailed discussion of the whole thesis and at the end of 5th
chapter
recommendations for further research has been given.

Table of contents
LIST OF FIGURES ...................................................................................................................................... I
LIST OF TABLES ...................................................................................................................................... III
LIST OF ABBREVATIONS ...................................................................................................................... V
LIST OF PUBLICATIONS ...................................................................................................................... VII
ABSTRACT .... ……………………………………………………..……………………………………………………………………………VIII
CHAPTER 1: GENERAL INTRODUCTION ............................. 1
1.1 Cadmium (Cd) as an environmental pollutant ........................................................................... 1
1.2 Sources of Cadmium pollution into the environment ............................................................... 1
1.3 Cadmium toxicity in humans ....................................................................................................... 2
1.4 Cadmium and plants ...................................................................................................................... 4
1.4.1 Cadmium uptake, transport and accumulation in plants ............................................... 4
1.4.2 Cadmium toxicity in plants ............................................................................................... 4
1.5 Remediation of toxic metals polluted soil ................................................................................ 10
1.5.1 Phytoremediation technologies ...................................................................................... 11
1.6 Enhanced phytoextraction .......................................................................................................... 13
1.6.1 Gibberellic acid (GA3) ..................................................................................................... 13
1.6.2 Ethylenediaminetetraacetic acid (EDTA) ..................................................................... 14
1.6.3 Molybdenum (Mo) ........................................................................................................... 14
1.7 Introduction to experimental plants........................................................................................... 15
1.7.1 Parthenium hysterophorus .............................................................................................. 15
1.7.2 Ricinus communis ............................................................................................................. 16
1.7.3 Cannabis sativa ................................................................................................................ 16
1.8 Aim and objectives ...................................................................................................................... 18

CHAPTER 2: THE EFFECT OF GIBBERELLIC ACID AND EDTA ON
CADMIUM PHYTOEXTRACTION: CORRELATIONS OF FREE
PROLINE, TOTAL PHENOLICS AND CHLOROPHYLL CONTENTS
WITH CADMIUM ACCUMULATION IN PARTHENIUM
HYSTEROPHORUS PLANT. ................................................................................... 20
ABSTRACT ........................................................................................................................................ 20
2.1 INTRODUCTION ....................................................................................................................... 21
2.1.1 Aim and objectives........................................................................................................... 23
2.2 MATERIALS AND METHODS .............................................................................................. 24
2.2.1 Preparation of soil and addition of cadmium................................................................ 24
2.2.2 Transplantation of seedlings and plant growth............................................................. 24
2.2.3 Treatments used ................................................................................................................ 24
2.2.4 Plant growth parameters analysis ................................................................................... 25
2.2.5 Analysis of free proline in plant root and leaves.......................................................... 25
2.2.6 Total phenolics estimation in roots and leaves ............................................................. 26
2.2.7 Chlorophyll estimation in leaves .................................................................................... 26
2.2.8 Cadmium (Cd) analysis in the plant .............................................................................. 27
2.2.9 Statistical analysis ............................................................................................................ 27
2.3 RESULTS ..................................................................................................................................... 28
2.3.1 Effect of EDTA and GA3 treatments on plant length (root and stem), biomass
(fresh and dry) and water contents of P. hysterophorus plant under Cd stress ........ 28
2.3.2 Effect of different treatments of GA3 and EDTA on plant Cd contents .................. 31
2.3.3 Effect of different treatments of GA3 and EDTA on total phenolics, free proline
and chlorophyll (a/b) contents of the plant under Cd stress ....................................... 33
2.3.4 Correlation among different parameters measured in plant ....................................... 35
2.4 DISCUSSION .............................................................................................................................. 40
2.4.1 Plant growth and biomass ............................................................................................... 40
2.4.2 Plant cadmium contents ................................................................................................... 41

2.4.3 Proline concentration ....................................................................................................... 41
2.4.4 Phenolics concentration within plant tissues ................................................................ 42
2.4.5 Chlorophyll contents ........................................................................................................ 42
Conclusions ................................................................................................................................. 42
CHAPTER 3: THE EFFECT OF MOLYBDENUM ON CADMIUM
PHYTOEXTRACTION AND PRODUCTION OF ENDOGENOUS
PHENOLICS, FREE PROLINE AND PHOTOSYNTHETIC PIGMENTS
IN RICINUS COMMUNIS AND CANNABIS SATIVA PLANTS. .................. 44
ABSTRACT ........................................................................................................................................ 44
3.1 INTRODUCTION ....................................................................................................................... 45
Aim and objectives .................................................................................................................... 47
3.2 MATERIALS AND METHODS .............................................................................................. 48
3.2.1 Preparation of soil and addition of cadmium................................................................ 48
3.2.2 Transplantation of seedlings and plant growth............................................................. 48
3.2.3 Molybdenum treatments .................................................................................................. 48
3.2.4 Plant growth parameters .................................................................................................. 50
3.2.5 Free proline analysis in root and leaves ........................................................................ 50
3.2.6 Total phenolics estimation in roots and leaves ............................................................. 50
3.2.7 Chlorophyll and carotenoids estimation in leaves ....................................................... 50
3.2.8 Cadmium (Cd) analysis in different plant parts ........................................................... 51
3.2.9 Statistical analysis ............................................................................................................ 51
3.3 RESULTS ..................................................................................................................................... 52
3.3.1 Ricinus communis plant ................................................................................................... 52
3.3.2 Cannabis sativa plant ...................................................................................................... 79
3.4 DISCUSSION ............................................................................................................................ 106
3.4.5 Conclusions ..................................................................................................................... 108

CHAPTER 4: EXPRESSION OF CBF/DREB LIKE TRANSCRIPTIONAL
FACTORS GENES IN RICINUS COMMUNIS AND CANNABIS SATIVA
PLANTS UNDER CADMIUM STRESS AND MOLYBDENUM FOLIAR
SPRAY ......................................................................................................................... 109
ABSTRACT ...................................................................................................................................... 109
4.1 INTRODUCTION ..................................................................................................................... 110
4.1.1. Aim and objectives ...................................................................................................... 112
4.2 MATERIALS AND METHODS ............................................................................................ 113
4.2.1 Plant materials and growth conditions ........................................................................ 113
4.2.2 Treatments during the experiment ............................................................................... 113
4.2.3 Genomic DNA extraction and amplification of DREB 1A, DREB 1B, DREB 1F
and CBF like genes sequences ..................................................................................... 113
4.2.4 Total RNA extraction .................................................................................................... 115
4.2.5 cDNA synthesis and Identification of DREB 1A, DREB 1B, DREB 1F and CBF
like genes ......................................................................................................................... 115
4.2.6. Sequence analysis.......................................................................................................... 116
4.2.7. Data analysis .................................................................................................................. 116
4.2.8. Experimental Design .................................................................................................... 117
4.3. RESULTS .................................................................................................................................. 118
4.3.1 Ricinus communis ........................................................................................................... 118
4.3.2 Cannabis sativa .............................................................................................................. 131
4.4 DISCUSSION ............................................................................................................................ 144
4.5 Conclusions ........................................................................................................................ 146
CHAPTER 5: GENERAL DISCUSSION .................................................................... 146
5.1. Phytoextraction as a promising green technology for heavy metals remediation ............ 146
5.2. CBF/DREB transcriptional factors (CBF regulon) can play role in phytoextraction of
cadmium ....................................................................................................................................... 146

5.3. Proline and phenolic compounds enhance plant defense and cadmium phytoextraction
....................................................................................................................................................... 147
5.4. High biomass and high concentration of toxic metals in the biomass greatly enhanced the
phytoextraction ability of plants ................................................................................................ 147
5.5. Conclusions ............................................................................................................................... 149
5.6. Recommendations .................................................................................................................... 150
REFERENCES ............................................................................................................................. 151

LIST OF FIGURES
Figure 1. 1: Effects of Cd on plant. ................................................................................................................ 5
Figure 1. 2 : Plants used during the experiments.. ....................................................................................... 17
Figure 2. 1: Effect GA3 and EDTA on the root and shoot length of P. hysterophorus................. 29
Figure 3. 1: Effect of different treatments of Mo on growth of Ricinus communis plant grown ... 56
Figure 3. 2: Overall effect of Mo on phenolic and proline concentration in Ricinus communis .... 62
Figure 3. 3: Overall effect of molybdenum on Cd accumulation and BCF in Ricinus communis. 68
Figure 3. 4: Effect of Mo on growth of Cannabis sativa plant under Cd stress. ............................ 83
Figure 3. 5: Overall effect of Mo on concentration of phenolic and proline Cannabis sativa. ...... 89
Figure 3. 6: Overall effect of Mo on Cd accumulation and Cd-bioconcentration in C. sativa. ...... 95
Figure 4.1: Total DNA extracted from Ricinus communis. .......................................................... 118
Figure 4.2: PCR product of CBF/DREB genes fragments from genomic DNA of R. communis.118
Figure 4.3: RT-PCR product of Actin gene fragment from Ricinus communis............................ 119
Figure 4. 4: RT-PCR product of DREB 1A and DREB 1B genes fragments of R. communis ..... 120
Figure 4. 5: RT-PCR product of DREB 1F and CBF like genes fragments of R. communis ...... 121
Figure 4. 6: Nucleotide sequence alignment of Ricinus communis DREB-1B............................. 123
Figure 4. 7: Nucleotide sequence alignment of Ricinus communis DREB-1F ............................ 124
Figure 4. 8: Nucleotide sequence alignment of Ricinus communis CBF like gene ...................... 125
Figure 4. 9: Multiple alignment CBF/DREB deduced amino acids sequence of R. communis .... 127
Figure 4. 10: Correlations of Cd accumulation with gene expression in Ricinus communis. ....... 129
Figure 4. 11: Correlations of genes expression with proline and phenolics in R. communis ....... 130
Figure 4. 12: Genomic DNA from Cannabis sativa plant. ........................................................... 131
Figure 4. 13: PCR product of DREB 1A, DREB 1B, DREB 1Fand CBF like transcription factor
of Cannabis sativa plant. ......................................................................................... 131
Figure 4. 14: RT-PCR product of Actin gene fragment ofCannabis sativa. ............................... 132
Figure 4. 15: RT-PCR product of DREB 1A and DREB 1B like genes of Cannabis sativa ...... 133
Figure 4. 16: RT-PCR product of DREB 1F and CBF gene of Cannasbis sative plant ............... 134

Figure 4. 17: Nucleotide sequence alignment of Cannabis sativa DREB 1B gene ...................... 136
Figure 4. 18: Nucleotide sequence alignment of Cannabis sativa DREB 1F gene ...................... 137
Figure 4. 19: Nucleotide sequence alignment of Cannabis sativa CBF like gene segment ......... 138
Figure 4. 20: Multiple alignment and comparison of the deduced amino acids sequence ........... 140
Figure 4. 21: Correlation of Cd accumulation with CBF/DREB genes expression in C. sativa .. 142
Figure 4. 22: Correlations of CBF/DREB genes expression with proline and phenolics in
Cannabis sativa plant. .............................................................................................. 143

LIST OF TABLES
Table 2. 1: Treatments done during the experiment. ............................................................................. 24
Table 2. 2: Effect of different treatments of GA3 and EDTA on growth of P. hysterophorus ............ 30
Table 2. 3: Effect of GA3 and EDTA on Cd contents within Parthenium hysterophorus plant ............ 32
Table 2. 4: Effect of EDTA and GA3 on free proline, total phenolics and chlorophyll contents. ........ 34
Table 2. 5: Correlations between different parameters in roots of P. hysterosphorus plant.................. 37
Table 2. 6: Correlations among different parameters measured in stem of P. hysterosphorus plant. ... 38
Table 2. 7: Correlation between the parameters measured in leaves of P. hysterosphorus plant. ......... 39
Table 3. 1: Treatments used during the experiment. .............................................................................. 49
Table 3. 2 Effect of Mo on plant growth in Ricinus communis plant under 25 ppm Cd polluted soil .. 53
Table 3. 3: Mo effect on growth of Ricinus communis plant in 50 ppm Cd polluted soil.. ................... 54
Table 3. 4: Effect of Mo on growth of R. communis plant grown in 100 ppm Cd contaminated soil. .. 55
Table 3. 5: Mo effect on proline, phenolic and photosynthetic pigments in R. communis plant grown in
25 ppm Cd contaminated soil. .......................................................................................... 59
Table 3. 6: Role of Mo treatments in proline, phenolic and photosynthetic pigments concentration in
Ricinus communis plant grown in 50 ppm Cd contaminated soil.. ................................... 60
Table 3. 7: Effect of Mo treatments on free proline, total phenolics and photosynthetic pigments in
Ricinus communis plant grown in 100 ppm Cd contaminated soil.. ................................. 61
Table 3. 8: Mo effect on Cd contents in Ricinus communis plant in 25 ppm Cd contaminated soil. ... 65
Table 3. 9 Effect of Mo on cadmium contents in R. communis plant in 50 ppm Cd contaminated soil.66
Table 3. 10: Mo effect on Cd contents in R. communis grown in 100 ppm Cd polluted soil. ............... 67
Table 3. 11: Different correlations in roots of R. communis grown in 25 ppm Cd contaminated soil. . 70
Table 3. 12: Correlations in roots of R. communis plant in 50 ppm Cd polluted soil. ........................... 71
Table 3. 13: Different correlations in roots of R. communis plant grown in 100 ppm Cd polluted soil.72
Table 3. 14: Correlations in stem of R. communis plant in 25 ppm Cd contaminated soil. ................... 73
Table 3. 15: Various correlations in stem of Ricinus communis grown in 50 ppm Cd polluted soil..... 74
Table 3. 16: Different correlations in stem of Ricinus communis plant under 100 ppm Cd stress. ....... 75
Table 3. 17: Correlations in Leaves of R. communis plant grown in 25 ppm Cd contaminated soil. .... 76

Table 3. 18: Different Correlations in Leaves of R. communis plant under 50 ppm Cd stress. ............. 77
Table 3. 19: Correlations in leaves of R. communis plant grown in 100 ppm Cd contaminated soil. ... 78
Table 3. 20: Effect of Mo on growth of Cannabis sativa plant under 25 ppm Cd stress ..................... 80
Table 3. 21: Mo effect on growth of Cannabis sativa plant in 50 ppm Cd contaminated soil. ............. 81
Table 3. 22: Effect of Mo on growth C. sativa plant under 100 ppm Cd stress .................................... 82
Table 3. 23: Effect of Mo on proline, phenolic, chlorophylls and carotenoids concentration in
Cannabis sativa plant grown in with 25 ppm Cd contaminated soil. ............................... 86
Table 3. 24: Mo effect on proline, phenolic chlorophyll (a, b) and carotenoids concentration in
Cannabis sativa plant grown in soil contaminated with 50 ppm Cd. ............................... 87
Table 3. 25: Effect of Mo on proline, phenolic, chlorophyll and carotenoids concentration in Cannabis
sativa plant grown in 50 ppm Cd soil. .............................................................................. 88
Table 3. 26: Cadmium contents in C. sativa plant under Mo treatments and 25 ppm Cd in soil. ......... 92
Table 3. 27: Effect of Mo on Cd contents in C. sativa plant grown in 50 ppm Cd polluted soil. ......... 93
Table 3. 28: Mo effect on Cd contents of C. sativa plant grown grown in 100 ppm Cd polluted soil. . 94
Table 3. 29: Correlations in roots of C. sativa plant grown under 25 ppm Cd stress . .......................... 97
Table 3. 30: Different Correlations in roots of C. sativa plant grown in 50 ppm Cd polluted soil. ...... 98
Table 3. 31: Correlations in roots of C. sativa plant grown in 100 ppm Cd contaminated soil . .......... 99
Table 3. 32: Correlations in stem of C. sativa plant under 25 ppm Cd stress ..................................... 100
Table 3. 33: Different correlations in stem of C. sativa plant grown in 50 ppm Cd containing soil
…………………………………………………………………………………………..101
Table 3. 34: Correlations in stem of C. sativa plant grown in 100 ppm Cd contaminated soil . ......... 102
Table 3. 35: Correlations in leaves of Cannabis sativa plant under 25 ppm Cd stress ...................... 103
Table 3. 36: Different correlations in leaves of Cannabis sativa plant under 50 ppm Cd stress. ........ 104
Table 3. 37: Correlations in leaves of C. sativa plant in 100 ppm Cd contaminated soil ………… .105
Table 4. 1: The following treatments were made during the experiment…………………......……..113
Table 4. 2: Primers used during the experiments. .............................................................................. 114

LIST OF ABBREVATIONS
Abbreviations Full Names
µL Microliter
0C Degree Centigrade
ABA Abscisic acid
ANOVA Analysis of variance
AP2 Activating Protein 2
BCF bio concentration factor
BLAST Basic Local Alignment Search Tool
Bp Base pair
CBF C-Repeat Binding Factor
Cd Cadmium
cDNA complementary DNA
Cm Centimeter
DW Dry weight
DNA Deoxyribonucleic acid
dNTP Deoxy Nucleotide triphosphate
DREB Dehydration Responsive Element Binding proteins
EDTA Ethylenediaminetetraacetic acid
ERF Ethylene-Responsive Factor
FC Folin-Ciocalteau reagent
G Gram
GA3 Gibberellic Acid
HSD Honestly Significant Difference
Mg Milligram
mg/L milligram per liter
mL Milli liter
Mo Molybdenum
N Nitrogen
Na+ Sodium ion
NCBI National Center for Biotechnological Information

Abbreviations Full Names
PAD Peripheral artery disease
PCR Polymerase Chain Reaction
pH Power of hydrogen ion concentration
Ppm Part per million
R2 Coefficient of Determination
RNA Ribonucleic acid
ROS Reactive Oxygen Species
rpm Revolution per minute
rpm Revolution per minute
SD Standard deviation
SPSS Statistical Package for Social Sciences
TF Transcriptional Factor
USEPA United State Environmental Protection Agency
μgg-1
Microgram per gram

LIST OF PUBLICATIONS
1. Nasir Ali and Fazal Hadi ―The effect of Gibberellic acid and EDTA on Cd
phytoextraction: correlation of free proline, total phenolics and chlorophyll content
with Cd contents of Parthenium hysterophorus plant. Environmental Science and
Pollution Research (2015) 22:13305–13318. (Impact factor 2.828).
2. Ayaz Ahmad, Fazal Hadi, and Nasir Ali ―Effective phytoextraction of cadmium
with increasing concentration of total phenolics and free proline in Cannabis sativa
plant under various treatments of fertilizers, plant growth regulators and sodium
salt‖ International Journal of Phytoremediation. 17: 56 – 65, 2015. (Impact factor
1.766)
3. Fazal Hadi, Nasir Ali, and Ayaz Ahmad ―Enhanced phytoremediation of Cd-
contaminated soil by Parthenium hysterophorus plant: Effect of gibberellic acid
(GA3) and synthetic chelator alone and in combinations‖ Bioremediation Journal,
18(1):46–55, 2014. (Impact factor 0.714)
4. Fazal Hadi, Sana Ullah, Fazal Hussain, Ayaz Ahmad, Amin Ullah Jan, Nasir Ali. ―Nitrogen fertilizer and EDTA effect on Cannabis sativa growth and
Phytoextraction of heavy metals (Cu and Zn) contaminated soil‖ International
Journal of Agronomy and Agricultural Research (IJAAR). 4 (6); 85-90. 2014.
(Impact factor 1.759).
5. Fazal Hadi, Ayaz Ahmad, Nasir Ali, ―Cadmium (Cd) removal from saline water
by Veronica anagallis and Epilobium laxum plants in hydroponic system‖
Agricultural Sciences, 5, 935-944 (2014). (Impact factor 0.117)
6. Fazal Hadi, Fazal Hussain, Muhammad Hussain, Sanaullah, Ayaz Ahmad, Saleem
Ur Rahman , Nasir Ali ―Phytoextraction of Pb and Cd; the effect of Urea and
EDTA on Cannabis sativa growth under metals stress” International Journal of
Agronomy and Agricultural Research (IJAAR). 5(3), 30-39. 2014. (Impact factor
1.759).
7. M. Tariq, G. Ali, F. Hadi, S. Ahmad, Nasir Ali and A. A. Shah. ―Callus induction
and invirto plant regeneration Rice (Oryza sativa L.) under various conditions‖
Pakistan Journal of Biological Sciences 11(2): 255-259, 2008.
8. Submission of two manuscripts are under process from chapter 3.
9. Submission of two manuscripts are under process from chapter 4.
Nasir Ali (2015) Characteristics of heavy metal uptake and accumulation in selected plant
species for development of phytoextraction technology. PhD Dissertation, Department of
Biotechnology, University of Malakand, pp: 1-177.
ABSTRACT
Metals are a group of highly toxic contaminants in the environment. Cadmium (Cd) is a
hazardous metal and its presence in soil is a serious threat to sustainable agriculture and to the
environment. Contaminated food is a major source of Cd entrance into the human body.
Cadmium can severely affect almost all the vital organs of human body, especially the liver
and kidney. Pollution of soil, especially agricultural fields contaminated with toxic metals,
has become a global problem and demands economic, efficient and environment friendly
remediation technologies. Phytoextraction is a potential plant-based technology for the
decontamination of polluted soil and water. It is an economic, solar driven, and environment
friendly technology. In the present study, physiological, biochemical and molecular
characteristics of cadmium uptake and accumulation in three plant species (Parthenium
hysterophorus, Ricinus communis and Cannabis sativa) were studied for the development of
phytoextraction technology.
In the first experiment, different treatments of Gibberellic Acid (GA3 10−2
, 10−4
and 10−6
M
as foliar spray) and Ethylenediaminetetraacetic acid (EDTA 40 mgKg-1
soil as single dose
and 10 mgKg-1
soil given in four doses) were studied for their effects on Cd phytoextraction,
and concentration of proline, phenolics and chlorophyll in Parthenium hysterophorus plants
grown in Cd (100 ppm) contaminated soil. The plants showed Cd hyperaccumulator potential
based on Cd bio-concentration factor (BCF > 1 in control plants). The GA3 and EDTA
application increased the extent of Cd phytoextraction by the plants. Most significantly
increase in Cd accumulation and bio concentration (BCF 9.75 ± 0.34) were found in plants
treated with GA3 (10−2
M) in combination with split doses of EDTA. Gibberellic acid
significantly increased the concentrations of phenolics and chlorophyll in the plants.
Cadmium accumulation in plant tissues showed positive correlation with free proline (R2
=
0.527, R2= 0.630) and total phenolics (R
2 = 0.554, R
2 = 0.723) in roots and leaves,
respectively.
In the second experiment, physiological and biochemical analyses were performed. The
objectives were to assess the effect of Molybdenum (Mo 0.5, 1.00 and 2.00 ppm) on Cd
phytoextraction, and concentration of endogenous proline, phenolics and photosynthetic in
Ricinus communis and Cannabis sativa plants grown in Cd (25, 50 and 100 ppm)

contaminated soil. Molybdenum was applied as a foliar spray, soil addition and seed soaking.
Foliar spray of Molybdenum highly increased Cd uptake and accumulation in both plants.
Molybdenum seed soaking and foliar spray highly increased the biomass, concentration of
free proline and total phenolics as compared to control plants. Positive correlations of proline
and phenolics with Cd accumulation were found in roots and leaves; suggesting a significant
role of proline and phenolics in Cd phytoaccumulation.
Molecular investigation was carried out with objectives: (1) To determine the presence and
then expression of DREB-1A, DREB-1B, DREB-1F and CBF like genes in Ricinus
communis and Cannabis sativa plants, (2) To evaluate the effect of molybdenum and
cadmium on expression of these genes, (3) To correlate the expression of genes with Cd
accumulation, and free proline and total phenolics concentrations in plants. Molybdenum was
applied as a foliar spray (0.5, 1, 2 ppm) while Cd (50 ppm) was added to soil. cDNA was
synthesized through reverse transcriptase Polymerase chain reaction (RT-PCR). PCR from
genomic DNA and cDNA with genes specific primers were performed. The PCR products
were sequenced and compared the nucleotide sequences and deduced amino acid sequences
for homology with other plants. Results confirmed the presence of DREB-1A, DREB-1B,
DREB-1F and CBF like genes in R. communis. In C. sativa the genes were identified for the
first time. Cadmium induced the expression of DREB-1B, DREB-1F and CBF like genes in
both the plants while molybdenum foliar spray further increased the expression of these
genes under Cd stress. The DREB-1A showed no expression in both the plants while its
presence was confirmed by the PCR product of genomic DNA with gene specific primers.
The CBF-like gene was expressed in both the plants sprayed with molybdenum (without Cd),
while the other genes were not expressed with Mo only. The DREB-1F and CBF like gene of
both the plants showed more than 80 % nucleotide sequence homology with these genes in
other plants. Predicted amino acid sequence of DREB-1F from both plant showed more than
75% homology with protein sequences of other plants, while the CBF like gene demonstrated
more than 80% homology with protein sequences of other plants species. The expression of
DREB-1B, DREB-1F and CBF-like genes (semi quantitative) was positively correlated with
Cd accumulation, free proline and total phenolics in Cannabis sativa plant, while these
correlations were significantly positive in Ricinus communis.
Application of GA3 and Mo increased concentration of Cd in plants tissues. A positive inter-
correlation was found between Cd concentration in plant tissues, production of prolin and
phenolics and the expression of DREB-1B, DREB-1F and CBF-like genes.

CHAPTER 1
GENERAL INTRODUCTION

CHAPTER 1 GENERAL INTRODUCTION
1
CHAPTER 1: GENERAL INTRODUCTION
1.1 Cadmium (Cd) as an environmental pollutant
Metals are a group of hazardous environmental contaminants. Their presence in soil and
water is a serious threat to sustainable agriculture, the environment and human health
(Ahmad et al 2015; Kevresan et al 1998). Out of 90 naturally occurring elements only 53 are
categorized as metals (Weast 1984). Among the metals Ni, Zn, Cu, Co, W, Cr, and V are
non-toxic at lower concentrations while As, Al, Hg, Sb, Ag, Cd and Pb are highly toxic to
humans and other living organisms even at lower concentration (Beak et al 2006; Sogut et al
2005). Cadmium (Cd) is a prevalent metal. It has relatively low occurrence (64th
among the
elements) in the earth's crust, and is found in water, soil, air as well as inside animals and
plants (Sarkari et al 2013). It does not occurs in a free-state, and almost always forms
compounds/complexes with other elements and molecules. Due to its highly toxic nature the
North Carolina National Toxicology Program (NCNTP) has categorized it as a potential
human carcinogen (Sarkari et al 2013). Cadmium is one of four metals of greatest global
concern because of its prevalence, hazardous effects on environment and impacts on human
health (di Toppi and Gabbrielli 1999). Its presence in water and soil can result in severe
health problems (Raskin et al 1997; di Toppi and Gabbrielli 1999).
1.2 Sources of Cadmium pollution into the environment
Cadmium enters into the environment through natural and anthropogenic (man-made)
activities. Natural processes such as erosion of parent rocks release 15,000 metric tons (mt) of
Cd per year, volcanic eruptions emit 820 mt Cd per annum and forest fires release 1-70 mt of
Cd per year in to the atmosphere (Sarkari et al 2013). Anthropogenic activities contribute 3-
10 times more Cd emission into the environment as compared to the natural processes
(Nriagu 1988). Anthropogenic contamination of cadmium into environment are from the
products in which Cd is an essential part (such as cadmium pigmented plastics, nickel-
cadmium batteries, glasses, ceramics, paints and enamels, cadmium coated ferrous and non-
ferrous products, cadmium stabilized polyvinylchloride (PVC) products, cadmium electronic
compounds and cadmium alloys) or those substances in which Cd occur as impurity (e.g.
non-ferrous alloys and metals of copper, lead and zinc, fossil fuels like oil, peat, coal and

CHAPTER 1 GENERAL INTRODUCTION
2
wood, Iron and steel, cement and phosphate fertilizers) (Martelli et al 2006; Sarkari et al
2013).
1.3 Cadmium toxicity in humans
Due to high soil-to-plant transfer rates, food is considered as the major source of Cd exposure
(about 95%) in humans (McLaughlin et al 2006). It is estimated that most of the food-
cadmium (almost 80%) comes from vegetables, cereals and potatoes (McLaughlin et al 2006;
Berglund et al 1994). The average intake of cadmium in food usually varies from 8 - 25 μg
per day of which about 0.5-1.0 μg is retained in the body (Berglund et al 1994). Inside the
human body, Cd primarily accumulates in the liver and form complexes with
metallothioneins (MT - a low molecular weight protein) (Sarkari et al., 2013). The Cd-MT
complexes are released into the blood and transported into various organs and tissues of the
body (Sarkari et al., 2013). During prolonged exposure most of the Cd accumulates in the
cortical region of kidney (Curtis et al 1999; Gonick 2008). The chemical form of Cd
determines its distribution within the body. For example Cd accumulation in the liver mainly
occur in the form of CdCl2, whereas in kidney it accumulates in the form of CdMT. Cadmium
can accumulate almost in all organs of the human body such as kidney, liver, testis, heart,
spleen, thymus, lungs, central nervous system, epididymis, salivary glands, and prostate.
However, nearly 50% of the total body Cd accumulates in kidney and liver because of high
MT concentration in these organs (Sarkari et al 2013; Siddiqui 2010). Cadmium absorption is
increased by the acidic environment of the digestive tract and also by the wide-ranging
proton-metal co-transporter DMT1, Nramp2, DCT1, or SLC11A2 and the carrier MTP1
metal ions (metal transporter protein 1) at the enterocytes apical membrane (Ryu et al 2004).
Most of the ingested Cd is primarily excreted in urine, while small amounts of Cd is excreted
in feces by conjugating with metallothionein, glutathione or cysteine (Zalups and Ahmad
2003). The daily excretion of cadmium from the body (mainly by the kidneys) does not
exceed 0.01% of the amount of cadmium consumed in the diet (USEPA, 2007)
In different countries the daily intake of Cd in food ranges from 10 to 35 μg per person
(Sarkari et al 2013). Cadmium contents in food significantly affect its concentration within
human blood. Adult human body contains approximately 15 - 30 mg of Cd and this amount
increases with age due to the long half-life of cadmium (10-30 years) inside human body
(Martelli et al 2006). The suggested safe intake limit set for Cd is 7 μg Cd per week per kg

CHAPTER 1 GENERAL INTRODUCTION
3
body weight or 25 μg Cd per kg body weight per month or 0.4 - 0.5 mg per week (WHO
1989).
Cadmium is serious threat to human health even at low concentration due its non-degradable
nature, poor excretion rate from human body and less tolerance of the body to this element
(Waalkes 2003). Cadmium mainly affects the organs like liver, lungs, kidney, testes, heart,
prostate, skeletal system, immune system and nervous system. Itai- itai disease is caused by
long term exposure to high doses of cadmium and mostly occurs in women. This disease is
characterized by severely reduced glomerular and tubular function of nephron, and
generalized osteoporosis and osteomalacia that cause multiple bone fractures (Inaba et al
2005). Several studies suggested an increased risk of peripheral artery disease (PAD) at low
dose Cd exposure (Navas-Acien et al 2005). In the stomach, Cd reacts with HCl and form
CdCl2, which produces severe inflammation of the digestive tract (Waisberg et al 2005).
Cadmium exposure in men can damage the leydig, sertoli and vascular endothelial cells of
testes and thus result in the inhibition of testosterone synthesis and impairment of
spermatogenesis (Goyer et al 2004). Prolonged exposure of Cd can lead to malfunctioning of
the immune system because target cells for Cd are T cells, B cells, macrophages and natural
killer cells. It seems that the direct immune-toxicity by Cd is the alteration in immune
responses of both cell-mediated and humoral immunity (Krocova et al 2000; Marth et al
2000). Some reports also suggest an association of eosinophilia and anemia with cadmium
toxicity (Sarkari et al 2013).
Cadmium is a potential carcinogen. It can effect gene expression by reducing DNA
methylation, interferes with DNA damage-repair system, inhibit apoptosis and induce
oxidative stress (Takiguchi et al 2003; Huang et al 2008). Cadmium has been considered as a
Class-1 human carcinogen by the International Agency for Research on Cancer (IARC 1993).
Cadmium exposure can cause cancer in organs such as kidneys (Pesch et al 2000), lungs
(Nawrot et al 2006), liver (Waalkes and Misra, 1996), hematopoietic system (Waalkes and
Misra, 1996), endometrium (Akesson et al 2008), mammary glands (McElroy et al 2006),
pancrease (Kriegel et al 2006), urinary bladder (Kellen et al 2007), prostate (Jarup et al 1998;
Zeng et al 2004) and stomach (Waalkes and Misra 1996).
Major symptoms of severe Cd toxicity, such as fever, general weakness and shortness of
breath, generally appear 24 hrs after exposure. Acute Cd exposure can also leads to
pneumonia, pulmonary oedema and in severe circumstances results in respiratory failure and
even death (Jarup et al 1998). Women possess higher concentration of Cd in their body as

CHAPTER 1 GENERAL INTRODUCTION
4
compared to men (Vahter et al 2007; Jarup and Akesson 2009) because of intestinal
absorption of dietary Cd in females is higher than males (Berglund et al 1994).
1.4 Cadmium and plants
1.4.1 Cadmium uptake, transport and accumulation in plants
Of the different properties of soil known to affect Cd bio-availability, pH is considered to be
the most significant. Several studies revealed a linear trend between pH of soil and uptake of
Cd by plants i.e. decreasing pH of the soil will increase Cd uptake and concentration with in
plant tissues (Kirkham 2006). Another factor that determines Cd accumulation is the plant
species (Li et al 2005). It is believed by some investigators that uptake of Cd from soil occurs
through active transport (in which energy is consumed), but most researchers points towards
the passive uptake hypothesis of Cd by plants (Larcher 1995; Marschner 1995). Cadmium
ions have been found to compete with many elements like copper (Kudo et al 2011), chlorine
(Oporto et al 2009), phosphorus (Dheri et al 2007), calcium (Choi and Harada 2005) and zinc
(Zhao et al 2002) for uptake and transport within plants. Inside the xylem Cd form bonds
with sulphydryl, nitrogen and oxygen ligand groups and is transported upward with the
movement of water (Tran and Popova 2013). Transpiration is thought to have important role
in Cd uptake and transport (Hardiman and Jacoby, 1984; Salt et al 1995), but some scientists
have provided contradictory evidence (Perfus-Barbeoch et al 2002). Transport of Cd in
phloem occurs through phytochelatins and phytometallophores, for example metallothionein,
nicotinamine, cysteine, glutathione and molecules bearing sulphydryl groups (Tran and
Popova 2013). It is also supposed that phytometallophores and phytochelatins play a role in
Cd accumulation within grains and seeds of a plant (Tran and Popova 2013).
1.4.2 Cadmium toxicity in plants
Cadmium is a phytotoxic element. It reduces plant growth even at very low concentration
(Aery and Rana 2003). Cadmium inhibits photosynthesis in plants by damaging
photosynthetic apparatus (especially the photosystems), inhibiting the activity of the enzyme
Fe (III) reductase (causing serious deficiency of Fe) and also causing closure of stomata in
higher plants (Vassilev et al 2005; Chugh and Sawhney 1999; Siedlecka and Krupa 1996).
Cadmium also targets two important enzymes involved in CO2 fixation i.e.
phosphoenolpyruvate carboxylase and ribulose-1,5-bisphosphate carboxylase (Stiborova
1988). Overall decrease in protein levels has been found in plants subjected to Cd stress

CHAPTER 1 GENERAL INTRODUCTION
5
(Tamas et al 1997). Cadmium negatively affects the absorption, translocation and distribution
of many essential nutrients such as Mg, Fe, Ca, K, P, Zn, Mn, B and S in plants, thus
disturbing plant growth and development (Metwally et al 2005; Guo et al 2007). Cadmium
has been found to cause H+ATPase inhibition in roots cells of maize plant. The H
+ATPase is
an ion transporter across the plasma membrane and its inhibition by Cd results in the
decreased uptake of some essential nutrients (Astolfi et al 2005).
Figure 1. 1: Effects of Cd on plant. (http://www.nature.com/articles/srep14078)
1.4.2.1 Generation of ROS under heavy metals stress and plant defense
Reactive oxygen species (ROS) are toxic by-product of incompletely reduced oxygen species.
They are produced mostly in mitochondria and chloroplast of plant cells. At low
concentration, under normal physiological condition, plant cells are able to manage their
negative impacts (Michalak 2006). Increases in the levels of ROS have been observed in
plant cells under stress conditions, such as wounding, pathogen attacks, herbivore feeding,
metals, UV light and others (Diaz et al 2001; Wojtaszek 1997). Normally cells try to maintain

CHAPTER 1 GENERAL INTRODUCTION
6
lower concentration of ROS, as they are highly reactive (Wojtaszek 1997). They can react
with virtually every organic component of a living cell. The most common ROS are
superoxide radical (.O2-), hydroxyl radical (.OH) and hydrogen peroxide (H2O2) which
originate from the transfer of one, two or three electrons to di-oxygen (O2). Heavy metals
cause oxidative stress by generation of free radicals, disturbance in metabolic pathways,
inactivation of antioxidant enzymes (catalases, peroxidases and superoxide dismutases) and
destruction of low molecular weight antioxidants (such as glutathione) (Sahw et al 2004).
Cadmium is thought to induce oxidative stress in plant by indirect mechanisms, such as
disturbance of the electron transport chain, interference with the anti-oxidative defence or
initiation of lipid peroxidation through the stimulation of lipoxygenase (an enzyme
responsible to initiate lipid peroxidation) (Michalak 2006; Smeets et al 2005).
Cadmium is induces oxidative stress in plants (Somashekaraiah et al 1992; Hendy et al 1992)
by stimulating the production of oxygen free radicals (Balaknina et al 2005; Demirevska-
Kepava et al 2006) and/or by reducing the concentration of anti-oxidants both enzymatic and
non-enzymatic (Mohan and Hosetti 2006; Cho and Seo 2004). Cadmium stimulates lipid
peroxidation by decreasing the activities of catalase, superoxidase, dehydroascorbate
reductase, ascorbate peroxidase and glutathione reductase while enhanced the activity of
lipoxygenases in plant leaves (Panda and Khan 2003; Khan et al 2002). Several investigators
have reported the induction of peroxidase (POX) activity by Cd in many plants species such
as Calamus tenuis, Brassica juncea, Cicer arietinum, Bacopa monniera (Khan and Patra
2007; Hayat et al 2007; Hasan et al 2007; Mishra et al 2006).
Damage to plants occurs when the capability of antioxidant system and detoxification process
decrease as compared to the production of ROS. Several antioxidant mechanisms are present
to defend plants from the damage caused by oxidative stress (Pal et al 2006; Smeets et al
2005). These antioxidant systems include metabolites like tocopherol, glutathione and
ascorbate, and enzymatic scavengers of reactive oxygen for example catalases, superoxide
dismutases and peroxidases (Mandhania et al 2006; Demiral and Turkan 2005; Panda and
Khan 2003; Khan et al 2002). The most significant low molecular weight antioxidants
include glutathione, ascorbic acid, α-tocopherol, thiols and protective pigments for example
carotenoids (Devi and Prasad 1998; Tausz et al 2003). These non-enzymatic ROS scavengers
are important in defending different components of a cell from most of ROS, however they
cannot deal with reducing radicals like metastable hydroperoxides or superoxide (Chaudiere
and Ferrari-Iliou 1999).

CHAPTER 1 GENERAL INTRODUCTION
7
1.4.2.2 Antioxidant Action of Phenols
A variety of secondary metabolites are produced in the plants. Among which phenolic
compounds holds an important position. These compounds possess at least one aromatic ring
with one or more hydroxyl (OH-) groups. The antioxidant activity of phenolic compounds
has been known for many years (Bors et al 1990). Several reports demonstrated the
accumulation of phenolic compounds and increase in peroxidase activity in many plants
subjected to high concentrations of toxic metals. Antioxidant activity of phenolics is due to
their high capability to chelate toxic metals (Jung et al 2003). Metal ions initiate free radical
oxidative chain reaction by converting lipid hydroperoxide (COOH) into lipid alkoxyl
radicals. Phenolic compounds prevent lipid peroxidation of the lipid alkoxyl radicals by
trapping them. This process depends on the molecular structure, and the position and number
of the OH-group in the molecules (Millic et al 1998). It has been demonstrated that phenolic
compounds (particularly flavonoids) alter the kinetics of lipid peroxidation through
modification of the lipid packing order (Arora et al 2000). Phenolic compounds increase the
stability of membranes by reducing fluidity of membrane (in a concentration-dependent way)
and alter the rate of free radicals diffusion and inhibit peroxidative reaction (Blokhina et al
2003; Arora et al 2000). In addition to the capacity of phenolic compounds (procyanidins and
flavanols) to bind with proteins, they can also bind to the phospholipids (through H-bonding)
in the membranes and accumulate on both sides of the membrane; thus protecting membrane
from oxidation stress of ROS (Verstraeten et al 2003). In-vitro studies revealed that active
oxygen species such as O2-2
superoxide, peroxyl radical, 1O2 -singlet oxygen or H2O2 -
hydrogen peroxide are directly scavenge by flavonoids, mainly because of their ability to
donate hydrogen atoms or electrons (Khan et al 2000; Arora et al 2000; Sakihama et al
2000). Antioxidant activity of phenolics (especially flavonoids) are due to three structural
features; (1) the 2, 3-double bond with conjugation with 4 – oxo group in C-ring, (2) the orto
3,4-dihydroxy structure in B-ring and (3) the presence of a 3 – OH group in C ring and a 5 –
OH group in the A ring (Michalak 2006). Among these features, the most important electron
donating activity is shown by 3– OH group (Takahama and Oniki 2000).
1.4.2.3 Effect of free proline
Proline is an amino acid which accumulates within plant tissues during environmental stress
from salinity, drought, frost, toxic heavy metals and others (Sun et al 2007; Khatamipour et al
2011; Handique and Handique 2009). High concentration of free proline is found in plants

CHAPTER 1 GENERAL INTRODUCTION
8
under cadmium stress (Ahmad et al 2015; Sun et al 2007) and It can be an indicator of heavy
metal stress in plants (Khatamipour et al 2011). Prolines protect plants from toxic metal stress
by acting as a chelator of metals (Farago and Mullen, 1979), osmoprotectant (Hartzendorf
and Rolletschek 2001), membrane stabilizer (Bandurska 2001), scavenger of hydroxyl ions
(Smirnoff and Cumbes 1989), inhibitor of lipid peroxidation (Mehta and Gaur 1999),
protective shield for enzymes (Paleg et al 1984), source of nitrogen and carbon (Fukutaku
and Yamada 1984), stabilizer of the protein synthesis machinery (Kadpal and Rao 1985), and
regulater of cytosolic acidity (Venekamp 1989; Venekamp et al 1989). Under cadmium
stress, accumulation of free proline occurs mainly due to deficiency of water within cells
(Nikolic et al 2008).
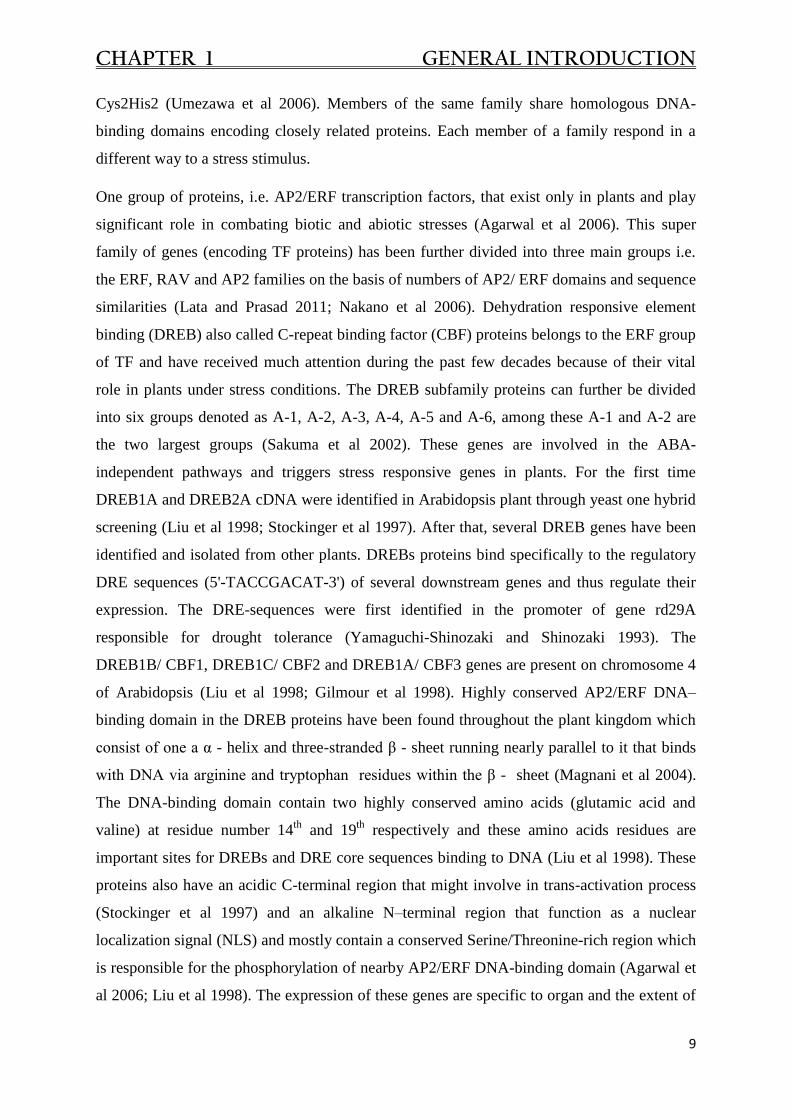
1.4.3 Plant stresses and CBF/DREB transcriptional factors (CBF regulon)
Plants combat environmental stresses by activation of set of genes playing diverse functions.
These genes can be classified into two groups. The first group comprise of functional proteins
(i.e. late embryogenesis abundant proteins, molecular chaperones, antifreeze proteins,
enzymes involved in biosynthesis of important osmolytes such as sugar, proline and sugar
alcohols, enzymes involved in detoxification reactions, betaines, membrane transporters and
water channel proteins) that play a direct role in plant defence against harsh environmental
conditions. The second group consisted of regulatory proteins that control transduction of
signals and expression of stress related genes, including several transcription factors (TF),
enzymes that catalyze metabolism of phospholipids, protein kinases and other stress
signalling molecules. Understanding the molecular mechanism behind the abiotic stress
tolerance is very important for further enhancement of stress tolerance in crop plants through
genetic manipulation (Lata and Prasad 2011; Shinozaki and Yamaguchi-Shinozaki 2007;
Agarwal et al 2006).
Expression of several abiotic stress responsive genes can be regulated by controlling the
expression of a single regulatory gene encoding TF/regulon, for the betterment of crops under
various environmental stress conditions (Yang et al 2011; Century et al 2008). A regulon
consist of two or more structural genes each having its own promotor and are coordinately
regulated by a common regulator molecule/transcription protein. Genes in a single regulon
share a common or related regulatory sequence which can each be recognized by the
transcriptional factor/ regulator molecule. Gene for transcriptional factors can be grouped
into many large families including AP2/ERF, MYC, MYB, NAC, zincfinger, WRKY and
CHAPTER 1 GENERAL INTRODUCTION
9
Cys2His2 (Umezawa et al 2006). Members of the same family share homologous DNA-
binding domains encoding closely related proteins. Each member of a family respond in a
different way to a stress stimulus.
One group of proteins, i.e. AP2/ERF transcription factors, that exist only in plants and play
significant role in combating biotic and abiotic stresses (Agarwal et al 2006). This super
family of genes (encoding TF proteins) has been further divided into three main groups i.e.
the ERF, RAV and AP2 families on the basis of numbers of AP2/ ERF domains and sequence
similarities (Lata and Prasad 2011; Nakano et al 2006). Dehydration responsive element
binding (DREB) also called C-repeat binding factor (CBF) proteins belongs to the ERF group
of TF and have received much attention during the past few decades because of their vital
role in plants under stress conditions. The DREB subfamily proteins can further be divided
into six groups denoted as A-1, A-2, A-3, A-4, A-5 and A-6, among these A-1 and A-2 are
the two largest groups (Sakuma et al 2002). These genes are involved in the ABA-
independent pathways and triggers stress responsive genes in plants. For the first time
DREB1A and DREB2A cDNA were identified in Arabidopsis plant through yeast one hybrid
screening (Liu et al 1998; Stockinger et al 1997). After that, several DREB genes have been
identified and isolated from other plants. DREBs proteins bind specifically to the regulatory
DRE sequences (5'-TACCGACAT-3') of several downstream genes and thus regulate their
expression. The DRE-sequences were first identified in the promoter of gene rd29A
responsible for drought tolerance (Yamaguchi-Shinozaki and Shinozaki 1993). The
DREB1B/ CBF1, DREB1C/ CBF2 and DREB1A/ CBF3 genes are present on chromosome 4
of Arabidopsis (Liu et al 1998; Gilmour et al 1998). Highly conserved AP2/ERF DNA–
binding domain in the DREB proteins have been found throughout the plant kingdom which
consist of one a α - helix and three-stranded β - sheet running nearly parallel to it that binds
with DNA via arginine and tryptophan residues within the β - sheet (Magnani et al 2004).
The DNA-binding domain contain two highly conserved amino acids (glutamic acid and
valine) at residue number 14th
and 19th
respectively and these amino acids residues are
important sites for DREBs and DRE core sequences binding to DNA (Liu et al 1998). These
proteins also have an acidic C-terminal region that might involve in trans-activation process
(Stockinger et al 1997) and an alkaline N–terminal region that function as a nuclear
localization signal (NLS) and mostly contain a conserved Serine/Threonine-rich region which
is responsible for the phosphorylation of nearby AP2/ERF DNA-binding domain (Agarwal et
al 2006; Liu et al 1998). The expression of these genes are specific to organ and the extent of
CHAPTER 1 GENERAL INTRODUCTION
10
stress given to the plant. For example, expression of AhDREB1 gene was higher in roots as
compared to stem and leaves under salt stress (Shen et al 2003). The OsDREB1F showed
constitutive expression throughout the plant with highly significant expression in callus and
panicles as compared to the other tissues in the plant (Wang et al 2008). Over expression of
DREB1A/CBF3 or DREB1B/CBF1 in transgenic Arabidopsis plants demonstrated strong
tolerance to drought, high salinity and frost which implies that DREB/CBF regulate a wide
range of genes under stress conditions (Kasuga et al 1999; Liu et al 1998; Jaglo-Ottosen et al
1998). Over expression of DREB1A/CBF3 transgenics are reported to accumulate amino acid
proline and different sugars under normal physiological (non-stressed) conditions (Gilmour et
al 2000). The OsDREB1F over expression highly increase plant tolerance to low temperature,
drought and high salinity both in Arabidopsis and rice, thus playing an important role in
signal transduction under stress conditions (Wang et al 2008). The effect of CBF/DREB
genes have not been studied under the stress caused by toxic heavy metals and in present
study we have investigated the effect to molybdenum on expression level of DREB1A,
DREB1B, DREB1F and CBF like transcriptional factors in three plants (Ricinus communis,
Cannabis sativa and Parthenium hysterophorus) under Cd stress.
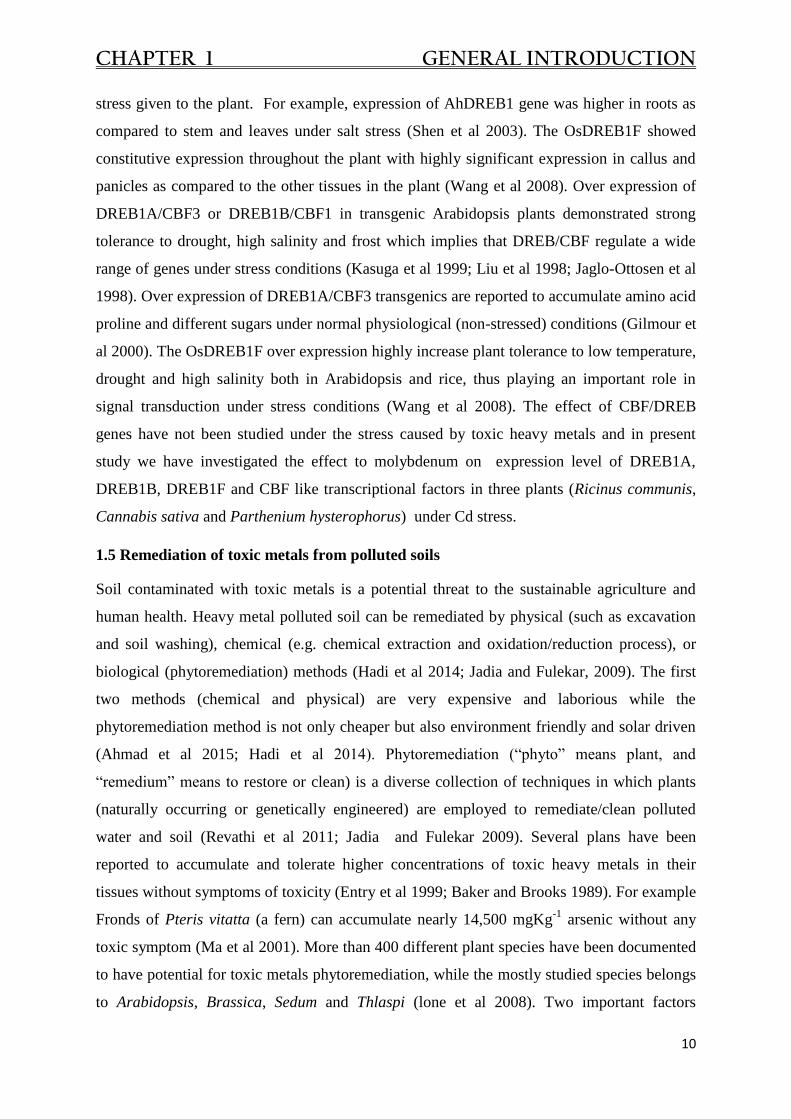
1.5 Remediation of toxic metals from polluted soils
Soil contaminated with toxic metals is a potential threat to the sustainable agriculture and
human health. Heavy metal polluted soil can be remediated by physical (such as excavation
and soil washing), chemical (e.g. chemical extraction and oxidation/reduction process), or
biological (phytoremediation) methods (Hadi et al 2014; Jadia and Fulekar, 2009). The first
two methods (chemical and physical) are very expensive and laborious while the
phytoremediation method is not only cheaper but also environment friendly and solar driven
(Ahmad et al 2015; Hadi et al 2014). Phytoremediation (―phyto‖ means plant, and
―remedium‖ means to restore or clean) is a diverse collection of techniques in which plants
(naturally occurring or genetically engineered) are employed to remediate/clean polluted
water and soil (Revathi et al 2011; Jadia and Fulekar 2009). Several plans have been
reported to accumulate and tolerate higher concentrations of toxic heavy metals in their
tissues without symptoms of toxicity (Entry et al 1999; Baker and Brooks 1989). For example
Fronds of Pteris vitatta (a fern) can accumulate nearly 14,500 mgKg-1
arsenic without any
toxic symptom (Ma et al 2001). More than 400 different plant species have been documented
to have potential for toxic metals phytoremediation, while the mostly studied species belongs
to Arabidopsis, Brassica, Sedum and Thlaspi (lone et al 2008). Two important factors

CHAPTER 1 GENERAL INTRODUCTION
11
determining the phytoremediation potential of a plant are its biomass and concentration of
toxic metals in the biomass i.e. plants having high biomass and high concentration of
pollutant in the biomass are most suitable for the phytoremediation potential (Fritioff et al
2005).
1.5.1 Phytoremediation technologies
Phytoremediation is a broad term used for several remediation techniques based on green
plants. These techniques are given below.
1.5.1.1 Phytoextraction
Phytoextraction is based on the extraction and accumulation of contaminants by plants.
Ideally, the contaminants are translocated to the above ground parts of the plants. Plants
usually show tolerance to heavy metals but most of them do not have the ability to
accumulate these metals to significant amount in above-ground parts of the plants. Some
plants have the natural ability to accumulate higher concentration of heavy metals without
developing any symptoms of toxicity and such plants are called hyperaccumulator of that
metal. Such hyperaccumulator plants should be used for the phytoextraction purposes (Baker
and Brooks 1989; Zhou and Song 2004; Sun et al 2008). Plants used for phytoextraction
purposes should have the following properties: (a) the concentration of metal in the shoots
should be higher than 100 mg kg-1
for cadmium, 1000 mg kg-1
for Ni, Cu, As, Se and Co and
10,000 mg kg-1
for Mn and Zn (Baker and Brooks 1989; Ma et al 2001; Zhou and Song 2004;
Sun et al 2008); (b) shoot to root metal concentration (translocation factor) should be greater
than 1.0 (Wei and Zhou, 2004); (c) the ratio of metal concentration in plant to soil
(bioconcentration factor) should be higher than 1.0, occasionally touching 50-100 (Cluis,
2004; Sun et al 2008); (d) the plant used should have high biomass and have the potential to
translocate contaminant from roots to aerial parts of the plant (Sun et al 2011; Evangelou et
al 2007). Most of the hyperaccumulator do not show all the desirable characteristics required
for efficient phytoextraction of toxic heavy metals.
1.5.1.2 Rhizofilteration/ phytofilteration
Rhizofilteration is a phytoremediation technique in which contaminants from polluted water
is absorbed, concentrate and accumulate in roots of green plants (Ghosh and Singh 2005; Salt
et al 1995). This technique can be used for Cd, Pb, Cu, Zn, Ni and Cr, which mostly retained
in roots of a plants (Jadia and Fulekar 2009; Ghosh and Singh 2005). In this technique, plants

CHAPTER 1 GENERAL INTRODUCTION
12
are first grown in clean water until a long root system is formed and then transferred into
polluted water for acclimatization and pollutant (metal) uptake by roots of the plants. After
saturation with heavy metals, the roots of plants are harvested and disposed of safely.
Repetition of the process several times can reduce the pollutant in the water to a safe limit.
Several plant (such as Helianthus annus, Brassica juncea, Zea mays and Secale cereale) have
been screened for their ability to absorb and concentrate toxic metals in their roots from
solutions (Dushenkov et al 1995). Water hyacinth was found to effectively remove trace
elements from waste water streams (Zhu et al 1999).
1.5.1.3 Phytostabilization
In this technique, roots of a plant stabilize the pollutant either by absorption, precipitation,
forming complex with metal or binding the metal with organic materials (Gwozdz and
Kopyra 2003). The main idea behind phytostabilization is to transform toxic metals to an
inert form in the soil (Cunningham et al 1997). Plants used for phytostabilization purposes
should have the properties like tolerance to high concentrations of toxic metals, ability of
immobilizing toxic metals in soil through root absorption, reduction or precipitation and low
metal translocation rate from root into aerial parts of the plant to eliminate the need of
treating harvested shoot as toxic waste. Stabilization is a technical and logistical stance in the
areas where remediation of soil from toxic metals is not possible. Through this method
vegetation can be restored that has been removed as a result of high concentrations of toxic
metals in the site (Tordoff et al 2000).
1.5.1.4 Phytotransformation/ phytodegradation
Pollutant absorption by plants and subsequent transformation into non-toxic substances
through the metabolic reactions within plants or externally by plant exudates (such as
enzymes) is known as Phytotransformation/ phytodegradation. This technique cannot be used
for heavy metals due to the non-biodegradable nature of metals. It is mostly used for complex
organic compounds that are degraded by plants into non-toxic form (Prasad and Freitas
2003). Presently this technique is being employed (demonstration-scale) on groundwater
contaminated with explosive materials like RDX (Research Department explosive) and TNT
(Trinitro toluene) at Milan Army Ammunition Plant by the Army Corps Engineers in
Tennessee, United States of America (Miller 1996).

CHAPTER 1 GENERAL INTRODUCTION
13
1.5.1.5 Phytovolatilization
Phytovolatilization is the transformation of toxic pollutant into volatile non-toxic form within
the plants, which then evaporate into air. The pollutant may modified in to less toxic volatile
form as it travels with water along the vascular system of the plant from roots to leaves,
whereby the pollutants evaporate into the air along with water. For example mercury in the
form of Hg (II) when absorbed by a plant is converted into less toxic form Hg (0) and then
evaporated from leaves of the plant (Kozuchowski and Johnson 1978).
1.6 Enhanced phytoextraction
There are two strategies to remediate metal contaminated soil using green plants. First
strategy is the use of metal hyperaccumulators plant species while second method is the use
of plants having fast growth and high biomass (Griga and Bjelkova 2013). Reduction in plant
biomass under metal stress and non-bioavailability of heavy metals in soil is often a problem
for metal phytoextraction. Scientists have tried to overcome the problem by application of
various chemicals either to the plants directly or into the soil (Tassi et al 2008; Falkowska et
al 2011). In the present research, we have used gibberellic acid (GA3),
ethylenediaminetetraacetic acid (EDTA) and molybdenum (Mo) to enhance the Cd
phytoextraction potential of our experimental plants.
1.6.1 Gibberellic acid (GA3)
Gibberellic acid (GA3) is one of the plant growth regulators, which was first time reported by
Kurusawa in Gibberella fujikuroi infected rice plant in 1962. Gibberellic acids comprises a
vast group of hormones derived from the ent-gibberellane skeleton and are produced in
different plant species. Gibberellic acids play many important roles in growth and
development of a plant, including stimulation of cell division and cell elongation, promotion
of seed development and germination (by α-amylase enzyme synthesis), delay senescence in
leaves (Falkowska et al 2011). During stress conditions a decline in concentration of plant
growth promoters (gibberellic acids and cytokinins) and an up rise in concentration of plant
growth inhibitor (such as abscisic acid) occur in plants. To compensate for the decrease in
GA3 concentration, the exogenous application of gibberellic acid could be used as an
alternative mechanism (Falkowska et al 2011). We have used GA3 in our experiments for two
purposes; to compensate for the decrease in its concentration due to stress and to increase
biomass of the plant.
CHAPTER 1 GENERAL INTRODUCTION
14
1.6.2 Ethylenediaminetetraacetic acid (EDTA)
Ethylenediaminetetraacetic acid(EDTA) is a colourless and water soluble solid having
chemical formula (HO2CCH2)2N CH2 CH2 N(CH2 CO2 H)2 (Holleman et al 2001). EDTA was
synthesized for the first time by Ferdinand Munz in 1935, from ethylenediamine and
chloroacetic acid. EDTA is produced as several salts, notably disodium EDTA and calcium
disodium EDTA. It is an excellent synthetic chelator of metals and form strong complexes
with metals (especially divalent and trivalent metals) through four carboxylate and two amine
groups (Holleman et al 2001). After binding with EDTA, the metal ions remain in solution
with low reactivity. In the present research EDTA was used in soil to chelate Cd and increase
its bio-availability to the plant.
1.6.3 Molybdenum (Mo)
Plant need several nutrients for normal growth and development. These mineral nutrients can
be divided into two groups on the basis of the quantity required by plants i.e. macronutrients
and micronutrients. Macronutrients (such as C, H, O, N, P, K, S, Ca, and Mg) are required by
plants in relatively large amount while micronutrients (like Fe, Zn, Mn, Ni, Cu, and Mo) are
needed by plant in very minute quantity. Molybdenum (Mo) is a transition element having
many oxidation states (from Zero to VI) but mostly occur in soils in VI oxidative state
Molybdenum mostly occur as an important component of molybdenum cofactor called Moco,
which binds to molybdoenzymes (molybdenum-requiring enzymes) found in animals, plants
and microorganisms (Williams and Frausto da Silva 2002). Arnon and Stout (1939)
demonstrated that Mo is required by plants, while they were working on tomato plant grown
hydroponically. Molybdenum occurs in the soil normally up to 2 – 3 mg kg-1
but can reach
as high as 300 mg kg-1
in shales having substantial amount of organic matter (Reddy et al
1997; Fortescue 1992). In agricultural soils, Mo occurs in several different forms such as
ferrimolybdenite [Fe2 (MoO4)], wulfenite (PbMoO4) and molybdenite (MoS2) (Reddy et al
1997). Mo bio-availability in soil for plants strongly depends on the pH of soil and the
concentration of adsorbing oxides like Fe oxides, also on the water drainage and organic
substances in the soil (Kaiser et al 2005). In alkaline soils the availability of Mo to plants
becomes higher mainly in MoO4 anion form while in acidic soil (pH < 5) bio-availability
decreases due to increased adsorption of oxides anions to soil particles (Reddy et al 1997).
Plants develop many phenotypic variation under Mo deficiency and most of these symptoms

CHAPTER 1 GENERAL INTRODUCTION
15
are associated with reduction in activity of molybdoenzymes. These symptoms are mostly
related to reduce nitrogen availability mainly when nitrate is the major nitrogen source
available for plant. Failure to synthesize the molybdenum cofactor (Moco) decreases the
activity of the important nitrogen reducing and assimilatory enzymes such as Nitrate
reductase (NR) and xanthine dehydrogenase/oxidase (XDH) (Agarwala et al 1978; Jones et al
1976). Mo catalyses other enzymes such as aldehyde oxidase (AO) involved in Abscisic acid
biosynthesis and sulfite oxidase (SO) catalyse the conversion of sulfite to sulfate, an essential
step in the catabolism amino acids containing sulfur (Williams and Frausto da Silva 2002;
Mendel and Haensch 2002). Molybdoenzymes are involved in the synthesis of indole-3-
acetic acid (IAA) and ABA (Hesberg et al 2004; Sagi et al 2002). In present research we
investigated the effect of Mo on growth, biomass and Cd phytoextraction potential of Ricinus
communis and Cannabis sativa plant under cadmium stress. Also the effect of Mo on
expression of CBF/DREB genes in these plants grown in Cd contaminated soil.
1.7 Introduction to experimental plants
Three plants were used during the experiments. They are Parthenium hysterophorus, Ricinus
communis and Cannabis sativa.
1.7.1 Parthenium hysterophorus
Parthenium hysterophorus belongs to the family Asteraceae. It is an annual herb having tap
roots grows deep into soil and erect soft stem which progressively become semi-woody with
maturity (figure 1.1). The stem usually attains a height of about 1 - 2 meter. Leaves are pale
green, bi-pinnatfied and soft fine hairs covered its surface (Bhawmilk and Sarkar 2005). It is
native to the tropics and subtropics of America (Parsons and Cuthbertson 1992). It is
common invasive species in Australia, India, Pakistan and some parts of Africa that invades
all disturbed land including pastures, farms and roadsides. In some places, it is found almost
in epidemic proportions, affecting crops, human health (causes allergy) and livestock.
Parthenium hysterophorus have the ability to grow and reproduce throughout the year. Under
favorable conditions, 4 or 5 consecutive generations of seedlings could arise at the same
place. Photosynthetic properties of this plant leaf is mostly associated to C3 type pathway and
the plant possess high rate of photosynthesis at 25 - 35 0C while low temperature showed
negative effect of plant growth, flowering and seed production (Navie et al 1996).

CHAPTER 1 GENERAL INTRODUCTION
16
1.7.2 Ricinus communis
Ricinus communis belongs to family Euphorbiaceae in plant kingdom. It is known as castor
bean and is distributed across the world, mostly in the tropical regions (Rana et al 2012).
Ricinus is a perennial shrub which reaches a height of more than 3 meter. It is a fast growing
C3 plant. Glossy alternate leaves surround the stem which is covered with light brown bark.
The leaves appear like palm leaves, containing 5 – 9 finger lobes. Small monoecious flowers
appear in the form of panicle inflorescence (figure 1.2). The fruit is in the form of spiny
epicarp enclosing bean like seeds. Ricinus is an economical plant due the quantity and quality
of its oil which is used in making eco-friendly coatings and paints (Rajkumar and Freitas
2008). Ricinus got attention due to its natural ability to grow in polluted soil as well as its
potential for toxic metals accumulation (Shi and Cai 2009; Rajkumar and Freitas 2008). Stem
of the plant possess antiprotozoal, antidiabetic and anticancer activities (Singh et al 2010).
Oil extracted from roots, leaf and seed of the plant is used in the treatment of liver disorder
and inflammation (Kensa and Yasmi 2011).
1.7.3 Cannabis sativa
Cannabis sativa is an annual herb and belong to Cannabaceae family in plant kingdom
(Figure 1.3). Mostly the male and female plants are separate i.e. dioecious except the fiber
hemp varieties which are monoecious (Debruyne et al 1994). Male (staminate) plans are
generally taller but less healthy than female (pistillate) plants. Plant stem is erect and ranges
in length from 0.2m to 4.0 m. Though, most Cannabis plants attain heights of about 1 – 3m.
This plant is highly suitable for growing in heavy metal polluted soil because of its fast
growth, high biomass and non-palatable nature (Citterio et al 2003).

CHAPTER 1 GENERAL INTRODUCTION
17
Figure 1. 2 : Plants used during the experiments. (A) Parthenium hysterophorus plant
(http://www.durbaninvasives.org.za/target-list/Parthenium-hysterophorus), (B) Ricinus
communis (http://luirig.altervista.org/pics/index4.php?search=Ricinus+communis&page=1)
and (C) Cannabis sativa (http://www.photomazza.com/?Cannabis-sativa).

CHAPTER # 1 AIM AND OBJECTIVES
18
1.8 Aim and objectives
Aim:
This physiological, biochemical and molecular investigation was carried out with aim to find
out the cadmium phytoextraction potential of selected plant species and to evaluate the effect
of molybdenum (Mo), Gibberellic acid (GA3) and ethylenediaminetetraacetic acid (EDTA)
on cadmium uptake and translocation into plant tissues, for the development of
phytoextraction technology. The main aim of this study was to investigate the role of
CBF/DREB like genes in Cd accumulation in selected plants species. Three plants i.e.
Parthenium hysterophorus, Cannabis sativa, and Ricinus communis were selected for present
research study.
Objectives:
1. To investigate the effect of GA3 and EDTA on biomass, Cd uptake and accumulation in
Parthenium hysterophorus plant.
2. To find out the role of EDTA and GA3 on free proline and total phenolics concentration
in P. hysterophorus plant under Cd stress.
3. To evaluate the effect of GA3 and EDTA on chlorophyll and carotenoids contents in P.
hysterophorus plant in Cd contaminated soil.
4. To evaluate the effect of Mo on plant height, biomass and water content in Ricinus
communis and Cannabis sativa under Cd stress.
5. To investigate the role of Mo on Cd uptake, translocation and accumulation in Ricinus
communis and Cannabis sativa plants.
6. To evaluate the effect of Mo and Cd on the concentration of free proline and total
phenolics in Ricinus communis and Cannabis sativa plants.
7. To study the concentration of chlorophyll and carotenoids in Ricinus communis and
Cannabis sativa plants under different treatments of Mo and Cd.
8. To identify the presence of DREB 1A, DREB 1B, DREB 1F and CBF like gene
sequences in Ricinus communis and Cannabis sativa plants.
9. To study the expression of DREB 1A, DREB 1B, DREB 1F and CBF like genes in
Ricinus communis and Cannabis sativa plants.
10. To find out the correlations of:
a. Free proline and total phenolics with the expression of DREB 1A, DREB 1B,
DREB 1F and CBF like genes in Ricinus communis and Cannabis sativa
plants.
b. Cadmium accumulation with the expression of DREB 1A, DREB 1B, DREB
1F and CBF like genes in Ricinus communis and Cannabis sativa plants.
c. Cadmium concentration and accumulation with the concentration of free
proline and total phenolics in all the three plants.
d. Biomass with free proline and total phenolics concentration in all the selected
plants.
e. Chlorophyll and carotenoids concentration with biomass, total phenolics, free
proline and cadmium accumulation in all the three plants.

CHAPTER # 2
THE EFFECT OF GIBBERELLIC ACID AND EDTA ON Cd
PHYTOEXTRACTION: CORRELATIONs OF FREE PROLINE, TOTAL
PHENOLICS AND CHLOROPHYLL CONTENTs WITH CADMIUM
ACCUMULATION IN PARTHENIUM HYSTEROPHORUS PLANT

CHAPTER # 2 ABSTRACT
20
CHAPTER 2: The effect of gibberellic acid and EDTA on cadmium
phytoextraction: correlations of free proline, total phenolics
and chlorophyll contents with Cd accumulation in
Parthenium hysterophorus plant.
ABSTRACT
A pot experiment was conducted to evaluate the effects of gibberellic acid (GA3) and
ethylenediaminetetraacetic acid (EDTA) on plant growth (measured as length, biomass and
water content), cadmium (Cd) up-take, total phenolics, free proline and chlorophyll content
of P. hysterophorus plant in Cd contaminated (100 mg Kg-1
) soil. GA3 (10-2
, 10-4
and 10-6
M)
was applied as foliar spray while EDTA (40 mg Kg-1
soil single dose, 10 mg Kg-1
four doses)
was added to soil. Results demonstrated a significant decrease in growth parameters of the
plant due to Cd stress. Lower concentration of GA3 (10-6
M) showed highest significant
increase in the growth parameters while Cd concentration, accumulation (1.97 ± 0.11 mg per
DW) and bioconcentration (9.75 ± 0.34) was significantly higher in the treatment T11 (GA3
10-2
+ four split doses of 10mg EDTA). Cadmium induced increased free proline levels in
roots, while total phenolics concentration was significant in all parts of the plant. Chlorophyll
contents were significantly reduced by Cd while GA3 showed significantly increase the
chlorophyll concentration. Cadmium contents of the plant showed negative correlation with
FW, DW, TWC and chlorophyll contents while positive correlation with free proline (R2
=
0.527, R2
= 0.630) and total phenolics (R2
= 0.554, R2
= 0.723) in roots and leaves of the
plant respectively. Proline and phenolics also showed positive correlation with DW of the
plant.
Published in Journal “Environmental Science and Pollution Research‖
Thomsons Impact factor: 2.826.
Authors: Nasir Ali and Fazal Hadi
Title of paper: ―The effect of Gibberellic acid and EDTA on Cd phytoextraction:
correlation of free proline, total phenolics and chlorophyll content with Cd contents of
Parthenium hysterophorus plant.
Year of publication: (2015),
Volume and PP: 22(17): 13305-13318.
DOI: 10.1007/s11356-015-4595-3

CHAPTER # 2 INTRODUCTION
21
2.1 INTRODUCTION
Cadmium is a heavy metal of great environmental concern which enters the agricultural soil
mostly through anthropogenic activities such as mining, sewage effluents, pesticides, chemical
fertilizers application to fields and industrial waste disposal (Kidd et al 2007; Adewole et al
2010; Hadi et al 2014). From soil and water it can easily absorbed and accumulated into plants
tissues due to its high bio-availability in soil and consequently reaches the human bodies through
food chain (Liu et al 2009; Ambedkar and Muniyan 2013). Crops cultivated in polluted soil may
accumulate Cd in different parts mainly root, leaf and grain. Consumption of Cd polluted plants
may develop a number of Cd-related chronic diseases such as cancer, oxidative stress (by
displace Ca2+
or Zn2+
in proteins), tissue necrosis and impairment of kidney and liver (Kafel et al
2014; John et al 2008; Liu et al 2005). As heavy metals are not bio-degradable (by
microorganisms and plants) so, they are continuously accumulating in soil and their presence in
soil (especially agricultural soil) is of great concern for both plants and animals health (Mubeen
et al 2010). For clean and sustainable environment the removal of such heavy metal form soil
and water is very important and need the development of an effective, affordable and
environment friendly technology for this purpose. Various conventional methods (including both
chemical and physical) have been used for the restoration of heavy metal contaminated soil but
these methods are very costly, laborious and adversely affect both the soil structure and
ecosystem. The discovery of some plants ability to accumulate and tolerate high concentrations
of heavy metals, led to the development of a new plant based technology, known as
phytoremediation (Entry et al 1999; Baker and Brooks 1989). Phytoremediation technology is
cost-effective, solar driven, aesthetically pleasing and environment friendly (Schwitzguebel et al
2009; Chai et al 2012). More than 400 species of plants have been investigated for their heavy
metals phytoremediation potential and most of these plants belong to Arabidopsis, Brassica,
Sedum and Thlaspi species (lone et al 2008). In the present research Parthenium hysterophorus
was studied at its reproductive stage for its Cd phytoextraction potential. This plant belong to
Asteraceae family and is native species of America, which invaded Australia, India, Pakistan and
some parts of Africa (Dhawan and Dhawan 1996). It is a fast growing, stress tolerant perennial
herb, which is unpalatable to herbivores, thus prevent metal entrance into food chain.
Plants grown on metal contaminated soil often show slow growth, low biomass and/ or lower
metal concentration within the biomass (Li et al 2003). For efficient heavy metals

CHAPTER # 2 INTRODUCTION
22
phytoremediation plant must have high biomass and can also tolerate and accumulate high
concentration of toxic heavy metal within their tissues. Heavy metal tolerant plants commonly
have low biomass or most plants showing high biomass do not show tolerance to high metals
concentration of heavy metals in soil. To increase biomass as well as metal phytoextraction
potential of plants, several chemical amendments (applied to plant or added to soil/ water) have
been done by different scientists, such as the application of hormones (foliar spray) and addition
of metal chelator to soil (Falkowska et al 2011; Hadi and Bano 2009; Chen and Cutright 2001).
In the present experiment a plant hormone ―Gibberellic acid‖ (GA3) and a synthetic chelator
EDTA (ethylenediaminetetraacetic acid) was used for increasing the Cd phytoremediation
potential of the plant. GA3 enhance plant growth and biomass while EDTA increase the metal
bioavailability in soil by forming complexes with metals (Broughton and McComb 1971;
Benjerano and Lips 1970; Chen et al 2004; Hadi and Bano 2009; Hadi et al 2010).
Plant under stress conditions produce and accumulate a variety of metabolic products including
amino acids (such as proline) and phenolic compounds (Diaz et al 2001). Many investigators
have reported accumulation of free proline under conditions of salinity, drought, intense light
and ultraviolet radiation, heavy metals, and in response to oxidative stress and biotic stresses
(Haudecoeur et al 2009; Yang et al 2009; Choudhary et al 2005). Proline not only take part in
protein synthesis but also showed a positive correlation with plant stress because it can act as a
metal chelator, signaling molecule, maintaining osmotic or cell turgor pressure; reducing
electrolyte leakage by stabilizing membranes; and protecting plant from oxidative stress by
reducing concentration of reactive oxygen species (ROS) (Xu et al 2009). Similarly phenolic
compounds are also produced during heavy metal stress, which not only act as metal chelator but
also act as antioxidant and directly scavenge reactive oxygen specie (ROS) (Michalak 2006).
ROSs can destroy lipids, DNA, proteins and chlorophyll by producing highly reactive (nascent)
oxygen (Ramadevi and Parsad, 1998). High concentrations of phenolic compounds has been
reported in different plants such as wheat in response to nickel toxicity (Diaz et al 2001),
Phaseolus vulgaris when exposed to cadmium and Phyllantus tenellus leaves in response to
copper sulphate (Diaz et al 2001) and maize due to aluminum (Winkel-shirley 2002).

CHAPTER # 2 AIM AND OBJECTIVES
23
2.1.1 Aim and objectives
Aim:
The aim of this chapter was to evaluate the effect of a plant growth regulator (gibberellic acid,
GA3) and a chelating agent (ethylenediaminetetraacetic acid, EDTA) on the phytoextraction
potential of Parthenium hysterophorus plants.
Objectives:
1. To study the growth and biomass of the P. hysterophorus plant in Cd contaminated soil.
2. To investigate the concentration of proline and phenolics in different parts of the plant.
3. To find out the effects of GA3 and EDTA on Cd uptake, its translocation into plant shoot
and accumulation in different parts of the plant.
4. To evaluate the effect of Cd on contents of chlorophyll in leaves.
5. To study the correlations of total phenolics and free proline with the DW and Cd contents
of the plant.

CHAPTER # 2 MATERIALS AND METHODS
24
2.2 MATERIALS AND METHODS
2.2.1 Preparation of soil and addition of cadmium
Soil was collected from fields nearby the University of Malakand at Chakdara, Pakistan. The soil
was grounded into powdered form after drying in sunlight. Water holding capacity (300 ml water
per kg soil ± 3) and pH (6.5 ± 0.3) of the soil was calculated. The dried soil was then poured in
to plastic pots (size ‘18 height x15 diameter cm‘) at the rate of 1 kg soil per pot. Cadmium (100
mg kg-1
soil) was added to each pot as cadmium acetate dihydrate (CH3COO)2 Cd·2H2O (Merck,
Germany) solution. No cadmium was added to the control (C) pots.
2.2.2 Transplantation of seedlings and plant growth
Each pot was watered a day before transplantation of plantlets. Seedlings (P. hysterophorus
plantlets) of uniform size (height 3 in) were collected for fields and single plantlet was
transferred to each pot. Natural condition of light and temperature (35/25°C) was provided for
growth of plants. Replicate of three pots were used for each treatment and the controls. Two
controls were used; one without cadmium (C) and the other with cadmium only (C1). Plants
were watered, at three days interval.
2.2.3 Treatments used
Table 2. 1: Treatments done during the whole experiment.
Treatment Treatment
code
Treatment Treatment
code
control (No Cd) C Cd + GA3 10-6
M + EDTA 40 mg T6
control (only Cd) C1 Cd + GA3 10-6
M + EDTA 10 mg T7
Cd + GA3 10-2
M T1 Cd + GA3 10-4
M + EDTA 40 mg T8
Cd + GA3 10-4
M T2 Cd + GA3 10-4
M + EDTA 10 mg T9
Cd + GA3 10-6
M T3 Cd + GA3 10-2
M + EDTA 40 mg T10
Cd + EDTA 40 mg T4 Cd + GA3 10-2
M + EDTA 10 mg T11
Cd + EDTA 10 mg T5
Note: Foliar spray of GA3 was applied to plants in four split doses, while EDTA was added to
soil as 40 mg single dose and 10 mg EDTA in four split doses.

CHAPTER # 2 RESULTS
25
2.2.3.1 Exogenous application of GA3
Three different concentrations (10-2
, 10-4
and 10-6
M) of GA3 were applied to the plants in the
form of foliar spray (10 ml solution per plant) in four doses (each dose at 10 d intervals). First
treatment was made 15 days after transplantation. Polythene bags were used to cover soil in
pots during application of GA3 so that hormones droplets do not reach the root zone.
2.2.3.2 Ethylenediaminetetraacetic acid (EDTA) addition into soil
A total of 40 mg of EDTA was added per Kg soil (i.e. single pots) in the form of aqueous
solution in two different ways i.e. single dose of 40 mg EDTA per pot (kg soil) and in four
split doses, each of 10 mg EDTA per dose, at 10 days interval. First treatment of EDTA
(single or split dose) was made 10 days after transplantation
2.2.3.3 Combination treatments of GA3 and EDTA
Some plants were treated with both GA3 and EDTA in combination. The three different
concentrations of GA3 (10-6
, 10-4
and 10-2
M) and the two different ways of EDTA (40 mg per
pot) application (single and split dose) form a total of six types of different combination
(3×2). In the combination treatments, both the GA3 and EDTA applications were made as
mentioned earlier.
2.2.4 Plant growth parameters analysis
Plant shoot length was measured on weekly basis. After two and a half months from
transplantation (at reproductive stage) the plants were harvested and length of the plant roots
and shoots were measured in cm. Plants were washed with a 5 mM solution of EDTA and
Tris-HCl (pH 6.0), and then rinsed with distilled water to remove any surface bounded metals
(Genrich et al 2000). After washing each plant was cut into three parts i.e. roots, stem and
leaves and fresh weight of each part was measured with the help of analytical balance. The
parts of each plant were packed in separate paper envelopes and then kept in oven for 48 h at
800C for drying. The dry weight of each part was measured by analytical balance and then
grinded into powdered form.
2.2.5 Analysis of free proline in plant root and leaves
Bates et al (1973) method was used for the quantification of free proline within different parts
(root and leaves) of the plant. Fresh plant tissue (100 mg from each part) was homogenized/
crushed in 2 ml tubes containing 1.5 ml of 3 % sulfosalicylic acid. The homogenate was then

CHAPTER # 2 RESULTS
26
centrifuged for 5 minutes at 13000 rpm. The supernatant (only 300 µL) was transferred into
new tube and then 2 ml each of acid ninhydrin (containing 1.25 g of ninhydrin heated in 20
ml phosphoric acid (6 M) and 30 ml glacial acetic acid until dissolved completely) and
glacial acetic acid were added to it. The mixture was kept in water bath (100 0C) for one hour.
The tubes were immediately dipped into ice after removing from water bath. Toluene (1 ml
per tube) was added to the reaction mixture and then vigorously mixed for 10-30 seconds.
Toluene containing chromophore layer was removed from the aqueous phase with the help of
micropipette and warmed to the room temperature. Spectrophotometer was used (250 nm
wavelength) to measure the absorbance of each sample. Toluene was used as a blank
(control). The standard curve was used to calculated the concentration of proline in different.
Three replicates were used for each sample.
2.2.6 Total phenolics estimation in roots and leaves
Total phenolic were calculated in roots, stems and leaves of each plant. Dried sample (200
mg each) was mixed with 10 ml of methanol (80 %) and then shake for at least 30 minutes in
close vessel (flask) to prevent evaporation of solvent. From each extract 2ml was taken in
separate tubes and centrifuged at 13000 rpm for 3 to 5 minutes. Singleton and Rossi (1965)
method with slight modifications was used to analysis total phenolics in extract. A 250 µL of
Folin-Ciocalteau (FC) reagent was mixed with 100 µL gallic acid standard solutions or
methanolic extract and the mixture was kept in dark (at room temperature) for 3-5 minutes.
Then 7 % of 500 µL sodium carbonate (Na2CO3) solution was added to the mixture and the
dH2O was used to raise the net volume up to 5 mL with. The mixture was kept in dark at
room temperature for 2 hrs. A spectrophotometer was used to measure the absorbance of the
samples at 760 nm. Different standard solutions (10, 30, 50, 100, 150 mgL-1
) of gallic acid
were prepared in methanol (80 %) and their absorbance were used as standard for measuring
total phenolics in each samples. 80 % methanol solution was used as blank (control). Three
replicates were used for each sample.
2.2.7 Chlorophyll measurment in leaves
Concentration of chlorophyll a and b were calculated by using the method of Arnon, (1949).
First of all fresh leaves were obtained from the plants (both control and treated plants). Then
2ml (80%) acetone was mixed with 200 mg of fresh leaves and properly grinded. After
grinding the mixtures were shifted into ependorf tubes and then centrifuged for five minutes
at 10,000 rpm. The supernatant (after centrifugation) were poured into clean test-tubes and
6ml acetone (80 %) was added to it. The samples were then analyzed for absorbance at 645

CHAPTER # 2 RESULTS
27
nm and 663 nm with the help of spectrophotometer. The following formulas were used for
calculating the concentration of chlorophyll a and b:
Chlorophyll a (µg ml-1
) = 12.7 (A663) - 2.69 (A645)
Chlorophyll b (µg ml-1
) = 22.9 (A645) - 4.68 (A663)
2.2.8 Cadmium (Cd) analysis in plants
Oven dried samples (root, stem and leaves) were first grounded into powdered form and then
subjected to acid digestion using Allen (1974) method. Dried powder (0.25 g) from each
sample was taken into separate flasks (50 ml). A 6.5 ml of three acids mixture containing
sulfuric acid, nitric acid and perchloric acid (1, 5 and 0.5 ml respectively) was added to each
flask. For complete digestion each flask (sample) was kept on electric hot plates until
completely digested. The digested samples were then filtered into another volumetric flask
(50 ml) and with the help of dH2O the volume was raised up to 50 ml. Each filtrate sample
was then stored in small plastic bottles. The samples were then analyzed for Cd concentration
with the help of Atomic Absorption/Flame Spectrophotometer (model Hitachi Z-8000,
Japan). Analysis was carried out under the conditions: wavelength (228.8 nm), Lamp current
(4.0 mA), Flow rate (Argon gas), 200 ml per min.
Translocation factor (TF) is the ratio of metal concentration in aerial parts (stem and leaves)
of the plant to the metal concentration in roots. Translocation factor of Cd was calculated
using the formula given below:
TF (roots into stem) = [metal] shoot / [metal] root
TF (roots into leaves) = [metal] leaves / [metal] root
Bio-concentration Factor (BCF) was defined as the accumulated concentration of heavy
metals in root divided by concentration to that in respective soil (Yoon et al., 2006).
BCF= [metal] root / [metal] soil
2.2.9 Statistical analysis
The data was further analyzed for mean values, analysis of variance (ANOVA) and
correlations between different parameters using software such as SPSS 16 (Statistical
Package for Social Sciences – 16) and MS Excel 2007.

CHAPTER # 2 RESULTS
28
2.3 RESULTS
2.3.1 Effect of EDTA and GA3 treatments on plant length (root and stem), biomass
(fresh and dry) and water contents of P. hysterophorus plant under Cd stress
Plant length, biomass and water content were significantly reduced by the Cd contaminated
(100 mg Cd Kg-1
) soil when both the controls C (without Cd) and C1 (with Cd only) were
compared, except the dry weight (DW) of stem and total water content (TWC) of leaves
(Figure 2.1 and Table 2.2). The effect of all the treatments (except T4, T5 and T11 in root,
while T4 and T11 in stem) were statistically significant on root and shoot length of the plant
as compared to C1 (control with Cd only) (Table 2.2). The highest significant root length
(24.33 ± 1.00 cm) and stem length (44.33 ± 4.73 cm) was demonstrated by the treatment T3
(GA3 10-6
M). There was a significant increase in Fresh weight (FW) and TWC of plant roots
in all the treatments (except T10 and T11) when compared with C1. , However, FW of plant
stem and leaves were statistically significant only in GA3 alone treatments (T1, T2 and T3) as
compared to C1 (Table 2.2). Among the treatments highest FW and TWC of entire plant were
produced by the treatment T3. All the treatments significantly increased DW of root, stem,
leaves and entire plant as compared to C1, except root DW in T6 (GA3 10-6
M + EDTA 40
mg kg-1
) and T7 (GA310-6
M + EDTA 10 mg kg-1
), stem DW in T10 (GA3 10-2
M + EDTA
40 mg kg-1
) and T11 (GA3 10-2
M + EDTA 10 mg kg -1
) and leaf DW in T11. The highest
significant DW in roots (1.65 ± 0.02 g), stem (2.40 ± 0.05 g), leaves (2.40 ± 0.05 g) and
entire plant (6.45 ± 0.12 g) was recorded in the treatment T3 as given in Table 2.2.

29
Figure 2. 1: Effect of different treatments of GA3 and EDTA on the root and shoot length of Parthenium hysterophorus plant, in cadmium contaminated
soil (100 mg Cd kg-1
soil).

30
Table 2. 2: Effect of different treatments of GA3 and EDTA on different growth parameters (length, biomass and water content) of Parthenium hysterophorus plant, in cadmium
contaminated soil (100 mg Cd/kg soil). GA3 was applied in four split doses, and 40 mg EDTA was added in a single dose while four doses of 10 mg EDTA added to a pot. SD denote
standard deviation and different letters shows significant different among values of different parameters. While ‗R‘ stands for Roots, ‗S‘ for Stem, ‗L‘ for leaf and EP for Entire Plant
Treatment length (cm) ±
SD
Fresh weight (g) ± SD Dry biomass (g) ± SD Total water content (g) ± SD
R S R S L EP R S L EP R S L EP
C No Cd 24.00 ± 1.00 ab
33.00 ± 1.00 cd
8.70 ± 0.44 a
10.00 ± 1.00 bc
8.50 ± 0.50 bc
27.20 ± 1.61 bc
1.92 ± 0.07 a
1.67 ± 0.06 ef
2.40 ± 0.10 a
5.99 ± 0.23 b
6.78 ± 0.37 ab
8.33 ± 0.94 bcd
6.10 ± 0.46 c
21.21 ± 1.39 bcd
C1 Cd only 12.00 ± 0.98 hi
24.10 ± 0.85 ef
4.23 ± 0.20 f
6.40 ± 0.98 def
6.50 ± 0.60 de
17.13 ± 1.78 ef
0.68 ± 0.03 ij
1.53 ± 0.03 f
1.40 ± 0.03 e
3.75 ± 0.09 f
3.55 ± 0.17 e
4.73 ± 0.95 efg
5.10 ± 0.57 cde
13.38 ± 1.69 fgh
T1 Cd + GA3 10-2
M 21.37 ± 1.09 bc
33.50 ± 1.50 cd
6.50 ± 0.19 c
11.50 ± 1.09 ab
10.10 ± 0.56 ab
28.10 ± 1.84 b
1.30 ± 0.03 d
2.20 ± 0.03 b
2.27 ± 0.03 a
5.77 ± 0.09 b
5.20 ± 0.16 c
9.30 ± 1.06 abc
7.83 ± 0.53 ab
22.33 ± 1.75 bc
T2 Cd + GA3 10-4
M 22.00 ± 0.78 abc
40.30 ± 4.59 ab
7.80 ± 0.19 b
12.67 ± 0.78 a
10.40 ± 0.56 a
30.87 ± 1.53 ab
1.45 ± 0.01 c
2.29 ± 0.05 ab
2.34 ± 0.05 a
6.08 ± 0.11 b
6.35 ± 0.18 b
10.38 ± 0.73 ab
8.06 ± 0.51 a
24.79 ± 1.42 ab
T3 Cd + GA3 10-6
M 24.33 ± 1.00 a
44.33 ± 4.73 a
8.70 ± 0.25 a
13.53 ± 1.00 a
11.20 ± 0.75 a
33.43 ± 2.00 a
1.65 ± 0.02 b
2.40 ± 0.05 a
2.40 ± 0.05 a
6.45 ± 0.12 a
7.05 ± 0.23 a
11.13 ± 0.95 a
8.80 ± 0.70 a
26.98 ± 1.88 a
T4 Cd + EDTA 40 mg 10.00 ± 0.97 i
18.00 ± 1.00 fg
3.40 ± 0.32 g
5.20 ± 0.97 ef
5.30 ± 0.96 e
13.90 ± 2.24 f
0.43 ± 0.02 k
1.32 ± 0.02 g
1.10 ± 0.02 f
2.85 ± 0.06 g
2.97 0.30 ef
3.88 ± 0.95 fg
4.20 ± 0.94 de
11.05 ± 2.19 gh
T5 Cd + EDTA 10 mg 10.50 ± 1.05 i
15.00 ± 1.32 g
3.33 ± 0.17 g
4.70 ± 1.05 f
5.20 ± 0.50 e
13.23 ± 1.72 f
0.50 ± 0.01 k
1.43 ± 0.05 g
1.20 ± 0.05 f
3.13 ± 0.11 g
2.83 ± 0.16 f
3.27 ± 1.00 g
4.00 ± 0.45 e
10.10 ± 1.61 h
T6 Cd + GA3 10-6
M + EDTA 40 mg
20.00 ± 0.99 cd
35.00 ± 1.00 bc
5.40 ± 0.09 d
8.90 ± 0.99 bcd
8.20 ± 0.26 cd
22.50 ± 1.34 cd
0.67 ± 0.01 j
1.96 ± 0.04 c
1.95 ± 0.04 b
4.58 ± 0.09 c
4.73 ± 0.08 cd
6.94 ± 0.95 cde
6.25 ± 0.22 bc
17.92 ± 1.25 cde
T7 Cd + GA3 10-6
M + EDTA 10 mg
18.00 ± 1.00 de
31.07 ± 2.11 cd
5.32 ± 0.02 d
8.70 ± 1.00 cd
8.00 ± 0.06 cd
22.02 ± 1.08 d
0.76 ± 0.03 hi
1.87 ± 0.03 cd
1.89 ± 0.03 bc
4.52 ± 0.09 c
4.56 ± 0.01 d
6.83 ± 0.97 cde
6.11 ± 0.03 c
17.50 ± 0.99 def
T8 Cd + GA3 10-4
M + EDTA 40 mg
17.60 ± 0.87 def
32.50 ± 1.32 cd
5.20 ± 0.10 d
8.43 ± 0.87 cd
7.50 ± 0.30 cd
21.13 ± 1.27 de
0.84 ± 0.03 gh
1.77 ± 0.03 de
1.84 ± 0.03 bc
4.45 ± 0.09 cd
4.36 ± 0.07 d
6.66 ± 0.84 de
5.66 ± 0.27 cde
16.68 ± 1.18 def
T9 Cd + GA3 10-4
M + EDTA 10 mg
16.30 ± 0.65 efg
28.33 ± 1.15 de
5.16 ± 0.14 de
8.10 ± 0.65 cd
7.34 ± 0.43 cd
20.60 ± 1.22 de
0.87 ± 0.03 fg
1.72 ± 0.03 e
1.78 ± 0.03 c
4.37 ± 0.09 cd
4.29 ± 0.11 d
6.38 ± 0.62 def
5.56 ± 0.40 cde
16.23 ± 1.13 ef
T10 Cd + GA3 10-2
M + EDTA 40 mg
15.00 ± 0.45 fg
29.67 ± 1.53 cde
4.50 ± 0.33 ef
7.87 ± 0.45 cd
7.26 ± 0.98 cd
19.63 ± 1.76 de
0.95 ± 0.02 ef
1.66 ± 0.06 ef
1.56 ± 0.06 d
4.17 ± 0.14 de
3.55 ± 0.31 e
6.21 ± 0.39 def
5.70 ± 0.92 cde
15.46 ± 1.62 efg
T11 Cd + GA3 10-2
M + EDTA 10 mg
14.20 ± 0.43 gh
23.67 ± 1.53 ef
4.43 ± 0.25 f
7.76 ± 0.43 cde
7.21 ± 0.75 cd
19.40 ± 1.43 de
0.99 ± 0.03 e
1.58 ± 0.03 f
1.46 ± 0.03 de
4.03 ± 0.09 ef
3.44 ± 0.22 ef
6.18 ± 0.40 def
5.75 ± 0.72 cd
15.37 ± 1.34 efg

CHAPTER # 2 RESULTS
31
2.3.2 Effect of different treatments of GA3 and EDTA on plant Cd contents
Cadmium concentrations in the Roots of the plant increased significantly in all the treatments
when compared with C1 (control with Cd only) and the highest significant root Cd
concentration (1267.00 ± 12.60 and 1245 ± 16.20 ppm) was recorded for the treatment T4
and T5 respectively (Table 2.3). The treatments showed significant increase in Cd
concentration of the plant stem (except T1, T2 and T3) and leaves (except T1) as compared to
C1. The treatment T11 produced the highest significant effect on the concentration of stem
and leaf Cd concentrations (166.33 ± 18.00 and 570.00 ± 23.45 ppm respectively).
Accumulation of Cd (mg per DW) in different parts of the plant was statistically significant
in all the treatments (except in T1 plant stem) as compared to C1 (Table 2.3). The table
shows that the highest significant Cd accumulation in roots (0.84 ± 0.04, 0.86 ± 0.03 and 0.87
± 0.04 mg Cd per DW) of the plant was found in the treatments T9, T10 and T11
respectively, while the treatment T11 also possessed the highest Cd accumulation in stem
(0.26 ± 0.03 mg Cd per DW), leaves (0.83 ± 0.04 mg Cd per DW) and entire plant (1.97 ±
0.11 mg Cd per DW). The treatments showed an increase of 4.07-9.79 folds Cd contents in
roots, 1.61-3.21 in stem, 1.86-4.71 in leaves and 2.37-5.65 folds the entire plant Cd
accumulation respectively as given in Table 2.3. The highest increase in Cd accumulation
within roots (9.79 times), stem (3.21 times), leaves (4.71 times) and entire plant (5.65 times)
was demonstrated by the treatment T11. The results also showed that the highest Cd
accumulation percentage in the treatments was found within roots followed by leaves of the
plant while the lowest Cd accumulation percentage was noted in the plant stem. The control
plant showed more than 50% of Cd with in its leaves. Cadmium translocation in treated
plants was significantly lower than the control C1. Cadmium bio-concentration (BCF) of the
plant was found higher than one (i.e. 1.85 ± 0.22) in the control C1 plants which clearly
shows that the P. hysterophorus is a hyper accumulator of Cd. The treatment further
increased the Cd BCF and the increase was found statistically significant as compared to the
control C1. The highest significant Cd BCF (9.75 ± 0.34) was demonstrated by the treatment
T11.

CHAPTER # 2 RESULTS
32
Table 2. 3: Effect of different treatments of GA3 and EDTA on Cd concentration, accumulation, translocation and Bioconcentration of Parthenium hysterophorus plant, in cadmium
contaminated soil (100 mg Cd kg-1
soil). GA3 was applied in four split doses, and 40 mg EDTA was added in a single dose while four doses of 10 mg EDTA added to a pot. SD
denote standard deviation and different letters shows significant different among values of different parameters. while ‗R‘ stands for Roots, ‗S‘ for Stem, ‗L‘ for leaf, EP for Entire
Plant, TF for translocation factor, BCF for Bioconcentration Factor.
Treatment Cd concentration (ppm) ± SD Cd accumulation (mg Kg-1
) ± SD Fold increase in Cd
accumulation
compared to C1*
Cd accumulation % Cadmium TF Cadm-
ium
BCF
R S L R S L EP R S L EP R S L R to
S
R to
L
C1 Cd only 129.67 ± 12.00
h 49.00 ± 9.40
d 126.00 ± 12.00
i 0.09 ± 0.01
g 0.08 ± 0.02
d 0.18 ± 0.02
g 0.35 ± 0.05
g 0.09 mg
0.08 mg
0.18 mg
0.35 mg
25.59 23.45 50.96 0.38 ± 0.04
a 0.97 ± 0.01
a 1.85 ± 0.22
h
T1 Cd + GA3 10-2
M 278.00 ± 9.20
g 60.00 ± 12.00
d 145.00 ± 9.20
hi 0.36 ± 0.02
f 0.13 ± 0.03
cd 0.33 ± 0.03
f 0.82 ± 0.07
f 4.07 1.61 1.86 2.37 44.01 15.95 40.04 0.22 ±
0.04 b
0.52 ± 0.02
d 2.85 ± 0.21
g
T2 Cd + GA3 10-4
M 346.33 ± 13.40
f 72.00 ± 9.20
d 167.00 ± 13.40
gh 0.50 ± 0.02
e 0.17 ± 0.02
bc 0.39 ± 0.04
ef 1.06 ± 0.09
ef 5.65 2.01 2.21 3.05 47.54 15.55 36.92 0.21 ±
0.02 b
0.48 ± 0.02
e 3.48 ± 0.22
fg
T3 Cd + GA3 10-6
M 432.33 ± 11.20
e 80.50 ± 13.40
cd 189.00 ± 11.20
g 0.71 ± 0.03
c 0.19 ± 0.04
abc 0.45 ± 0.04
de 1.36 ± 0.10
d 8.03 2.36 2.57 3.92 52.51 14.15 33.34 0.19 ±
0.03 b
0.44 ± 0.01
f 4.22 ± 0.23
f
T4 Cd + EDTA 40 mg 1267.00 ± 12.60
a 143.00 ± 11.20
ab 425.00 ± 12.60
cd 0.54 ± 0.03
de 0.19 ± 0.02
abc 0.47 ± 0.02
de 1.20 ± 0.07
de 6.13 2.30 2.65 3.46 45.36 15.70 38.94 0.11 ±
0.01 b
0.34 ± 0.01
hi 8.43 ± 0.32
bcd
T5 Cd + EDTA 10 mg 1245.00 ± 16.20
a 149.00 ± 12.60
ab 456.00 ± 16.20
c 0.62 ± 0.02
d 0.21 ± 0.03
ab 0.55 ± 0.04
d 1.38 ± 0.09
cd 7.01 2.60 3.10 3.98 45.05 15.39 39.56 0.12 ±
0.01 b
0.37 ± 0.01
gh 8.84 ± 0.25
bc
T6 Cd + GA3 10-6
M + EDTA 40 mg
1123.00 ± 16.00
b 112.00 ± 16.20
bc 345.00 ± 12.90
f 0.75 ± 0.02
bc 0.22 ± 0.04
ab 0.67 ± 0.04
c 1.65 ± 0.10
bc 8.47 2.68 3.81 4.74 45.78 13.31 40.91 0.10 ±
0.01 b
0.31 ± 0.01
i 7.18 ± 0.28
e
T7 Cd + GA3 10-6
M + EDTA 10 mg
1098.00 ± 15.20
b 119.00 ± 12.90
b 365.00 ± 15.20
f 0.83 ± 0.04
ab 0.22 ± 0.03
ab 0.69 ± 0.04
bc 1.75 ± 0.11
ab 9.40 2.72 3.91 5.03 47.79 12.71 39.50 0.11 ±
0.01 b
0.33 ± 0.01
i 7.73 ± 0.34
de
T8 Cd + GA3 10-4
M + EDTA 40 mg
992.33 ± 16.00
c 120.00 ± 15.20
b 379.00 ± 9.60
ef 0.83 ± 0.04
ab 0.21 ± 0.03
abc 0.70 ± 0.03
bc 1.74 ± 0.10
ab 9.39 2.59 3.95 5.02 47.82 12.15 40.02 0.12 ±
0.01 b
0.38 ± 0.03
g 7.83 ± 0.30
de
T9 Cd + GA3 10-4
M + EDTA 10 mg
968.00 ± 12.00
c 129.00 ± 9.60
ab 413.00 ± 9.20
de 0.84 ± 0.04
a 0.22 ± 0.02
ab 0.74 ± 0.03
abc 1.80 ± 0.09
ab 9.48 2.71 4.16 5.18 46.81 12.32 40.87 0.13 ±
0.01 b
0.43 ± 0.02
f 8.23 ± 0.24
cd
T10 Cd + GA3 10-2
M + EDTA 40 mg
908.00 ± 9.00
d 147.33 ± 9.20
ab 510.00 ± 18.00
b 0.86 ± 0.03
a 0.24 ± 0.02
ab 0.80 ± 0.06
ab 1.90 ± 0.11
ab 9.71 2.99 4.51 5.48 45.36 12.84 41.80 0.16 ±
0.01 b
0.56 ± 0.01
c 9.13 ± 0.22
ab
T11 Cd + GA3 10-2
M + EDTA 10 mg
878.00 ± 9.00
d 166.33 ± 18.00
a 570.00 ± 23.45
a 0.87 ± 0.04
a 0.26 ± 0.03
a 0.83 ± 0.04
a 1.97 ± 0.11
a 9.79 3.21 4.71 5.65 44.27 13.36 42.37 0.19 ±
0.02 b
0.65 ± 0.01
b 9.75 ± 0.34
a
* For C1 (control with Cd only), actual values of extracted Cd (mg) are given.
CHAPTER # 2 RESULTS
33
2.3.3 Effect of different treatments of GA3 and EDTA on total phenolics, free proline
and chlorophyll (a/b) contents of the plant under Cd stress
Free proline and total phenolics in roots, stem and leaves while chlorophyll (a/b) contents in
leaves of the plant are presented in Table 2.4. cadmium contaminated soil significantly
increased free proline contents only in plant roots while total phenolics were significantly
higher in all parts (root, stem and leaves) of the plant (comparing the controls C and C1). The
increase in proline content of the plant roots were statistically non-significant in the
treatments (compared to C1) while the treatment T3 in stem and treatments T10 and T11 in
leaves of the plant significantly increased free proline concentration when compared with
control C1. The increase in total phenolics in roots of the plant was significantly increased by
the treatments except the EDTA alone treatments (T4 and T5) where increase was
statistically non-significant (compared to the control C1) as given in Table 2.4. In plant stem
total phenolic concentration was significantly increased by the treatments (except T1, T4, T5,
T8 and T9) as compared to C1 while in leaves all the treatments showed significant increase
in total phenolics (compared to C1). The highest significant total phenolic content in roots
(79.00 ± 3.94 ppm) was found in treatment T7 while in stem (34.00 ± 2.50 ppm) and leaves
(156.00 ± 13.20 ppm) it was recorded in the treatment T11 (Table 2.4). The table also shows
that the concentration of chlorophyll (a and b) was reduced significantly by the cadmium
polluted soil (comparing C with C1). The treatments containing GA3 foliar spray significantly
increased chlorophyll (a/b) concentration in leaves of the plant as compared to C1, except the
chlorophyll a contents of T9, T10 and T11 (where the increase is non-significant compared to
C1). The EDTA alone treatments showed significant decrease in chlorophyll content (except
chlorophyll a concentration in T4) as compared to C1.

CHAPTER # 2 RESULTS
34
Table 2. 4: Effect of Gibberellic acid and EDTA treatments on free proline, total phenolics and chlorophyll (a/b) contents of Parthenium
hysterophorus plant grown in Cd contaminated soil (100 mg Cd/kg soil). GA3 was applied in four split doses, and 40 mg EDTA was added in a
single dose while four doses of 10 mg EDTA added to a pot.
Treatments Free proline (ppm) ± SD Total Phenolics ± SD Chlorophyll ± SD
Roots Stem leaf Root stem leaf a b total
chlorophyll
C control (without Cd) 12.00 ±
2.80 b
15.00 ±
3.40 c
10.00 ±
1.88 d
15.00 ±
4.20 g
8.50 ±
3.50 d
27.00 ±
3.50 d
5.10 ±
0.36 bc
4.67 ±
0.15 a
9.77 ±
0.31 b
C1 Cd only 57.60 ±
3.33 a
24.00 ±
3.33 bc
28.57 ±
5.40 cd
29.23 ±
3.33 f
20.00 ±
3.33 c
90.80 ±
9.40 c
3.65 ±
0.20 gh
2.81 ±
0.03 h
6.46 ±
0.23 f
T1 Cd + GA3 10-2
M 58.00 ±
3.00 a
25.00 ±
3.00 abc
39.00 ±
5.06 abc
50.00 ±
3.00 cd
29.00 ±
3.00 abc
120.00 ±
6.80 b
5.20 ±
0.19 bc
4.32 ±
0.03 b
9.52 ±
0.22 b
T2 Cd + GA3 10-4
M 64.30 ±
5.96 a
25.80 ±
5.96 ab
45.00 ±
9.00 abc
57.00 ±
2.96 bc
33.00 ±
2.96 a
139.00 ±
9.20 ab
5.70 ±
0.19 ab
4.54 ±
0.05 a
10.24 ±
0.24 a
T3 Cd + GA3 10-6
M 62.50 ±
3.60 a
35.00 ±
3.60 a
48.57 ±
6.75 abc
65.00 ±
3.60 b
36.00 ±
3.60 a
145.00 ±
9.80 ab
5.98 ±
0.25 a
4.70 ±
0.05 a
10.68 ±
0.30 g
T4 Cd + EDTA 40 mg 60.00 ±
2.50 a
24.00 ±
2.50 bc
32.00 ±
8.61 bcd
33.00 ±
2.50 f
23.00 ±
2.50 bc
138.00 ±
5.90 ab
3.05 ±
0.32 hi
2.35 ±
0.02 i
5.40 ±
0.34 g
T5 Cd + EDTA 10 mg 59.70 ±
2.70 a
27.00 ±
2.70 ab
30.00 ±
12.66 cd
36.00 ±
2.70 ef
22.00 ±
2.70 bc
123.00 ±
6.50 b
2.95 ±
0.17 i
2.27 ±
0.05 i
5.22 ±
0.22 c
T6 Cd + GA3 10-6
M + EDTA 40 mg 63.00 ±
2.25 a
32.00 ±
2.25 ab
43.40 ±
9.45 abc
79.00 ±
2.25 a
29.95 ±
2.25 ab
123.00 ±
11.00 b
4.76 ±
0.09 cd
3.87 ±
0.04 c
8.63 ±
0.13 cd
T7 Cd + GA3 10-6
M + EDTA 10 mg 59.00 ±
3.94 a
26.00 ±
3.94 ab
44.29 ±
8.10 abc
76.00 ±
3.94 a
30.00 ±
3.94 ab
143.00 ±
12.90 ab
4.67 ±
0.02 cde
3.59 ±
0.03 d
8.26 ±
0.05 de
T8 Cd + GA3 10-4
M + EDTA 40 mg 63.00 ±
2.50 a
32.00 ±
2.50 ab
46.43 ±
5.06 abc
65.00 ±
2.50 b
28.00 ±
2.50 abc
130.00 ±
10.40 ab
4.37 ±
0.10 def
3.36 ±
0.03 e
7.73 ±
0.13 de
T9 Cd + GA3 10-4
M + EDTA 10 mg 60.00 ±
3.58 a
31.00 ±
3.58 ab
49.29 ±
9.00 abc
60.00 ±
3.58 b
28.90 ±
3.58 abc
145.00 ±
9.60 ab
4.30 ±
0.14 defg
3.31 ±
0.03 ef
7.61 ±
0.17 e
T10 Cd + GA3 10-2
M + EDTA 40 mg 63.00 ±
3.38 a
29.00 ±
3.38 ab
54.29 ±
8.86 ab
47.00 ±
3.38 d
31.00 ±
3.38 ab
130.00 ±
9.20 ab
4.10 ±
0.33 efg
3.15 ±
0.06 fg
7.25 ±
0.39 ef
T11 Cd + GA3 10-2
M + EDTA 10 mg 61.67 ±
2.50 a
32.00 ±
2.50 ab
57.14 ±
6.75 a
44.00 ±
2.50 de
34.00 ±
2.50 a
156.00 ±
13.20 a
3.95 ±
0.25 fg
3.12 ±
0.03 g
7.07 ±
0.28 ab

CHAPTER # 2 RESULTS
35
2.3.4 Correlation among different parameters measured in plant
Correlations among different parameters measured in roots of the plants are presented in
Table 2.5. The table shows significant correlations among plant growth parameters for roots
(length, FW, DW and TWC). Conversely the correlation of roots Cd concentration with
length (R2 = -0.452), FW (R
2 = - 0.588), DW (R
2 = -0.674) and TWC (R
2 = -0.546) of the
plant roots was found negative and mostly significant. Cadmium concentration in roots
showed highly significant positive correlation (R2 = 0.661) with the accumulation of Cd
within roots. The concentration of free proline and total phenolics in roots showed a positive
significant correlations (R2 = 0.527 and R2 = 0.554 respectively) with Cd accumulation but
their correlation with the concentration of Cd in roots was statistically non-significant. The
total phenolics of roots also showed positive significant correlations with length (R2 =
0.728), FW (R2 = 0.537) and TWC (R2 = 0.590) while its correlation with roots DW was
also positive but statistically non-significant. The correlations of free proline contents of roots
also demonstrated positive correlation with the growth parameters but the correlation were
found to be statistically non-significant. Correlations between the parameters measured in
stems of the plant are given in Table 2.6. The table shows positive significant correlations
between length, FW, DW and TWC of the stem while the correlations of these parameters
with stem Cd concentration were negative and statistically significant. Stem Cd accumulation
also showed negative correlations with above growth parameters but these correlations were
non-significant statistically. Free proline and total phenolics concentration of stem showed
positive correlation with all the parameters measured in plant stem but the correlations of
proline concentration was statistically significant only with phenolics content (R2 = 0.577)
and Cd accumulation (R2 = 0.867) while the correlations of total phenolics were significant
with all the parameters except Cd concentration and accumulation with in stem. The table 2.7
shows correlations among different parameters measured in plant leaves. Like roots and stem,
the leaves of plant also showed positive significant correlations among the growth parameters
(FW, DW and TWC). Cadmium concentration and accumulation of leaf demonstrated
negative correlations with the growth parameters and only the correlations of Cd
concentration were found statistically significant with the growth parameters. Correlation
between free proline and total phenolics was positive and statistically significant but their

CHAPTER # 2 RESULTS
36
(proline and phenolics) correlations with all the other parameters were positive but non-
significant (except the negative correlation of proline and chlorophyll b). Chlorophyll a and b
showed positive correlation with all the other parameters of leaf (except its negative
correlation with Cd contents of leaf). The correlations of chlorophyll a were statistically
significant with growth parameters (positive) and Cd concentration (negative).

CHAPTER # 2 RESULTS
37
Table 2. 5: Correlations among different parameters measured in roots of P. hysterophorus plant
Length FW DW TWC Cd conc Cd accumulation Proline Phenolics
Length Pearson Correlation 1 0.945**
0.833**
0.950**
-0.452 0.131 0.415 0.728**
Sig. (1-tailed) 0.001 0.001 0.001 0.070 0.343 0.090 0.004
FW Pearson Correlation 0.945**
1 0.921**
0.994**
-0.588* -0.010 0.397 0.537
*
Sig. (1-tailed) 0.001 0.001 0.001 0.022 0.488 0.101 0.036
DW Pearson Correlation 0.833**
0.921**
1 0.872**
-0.674**
-0.001 0.371 0.299
Sig. (1-tailed) 0.001 0.001 0.001 0.008 0.499 0.117 0.173
TWC Pearson Correlation 0.950**
0.994**
0.872**
1 -0.546* -0.012 0.393 0.590
*
Sig. (1-tailed) 0.001 0.001 0.001 0.033 0.485 0.103 0.022
Cd concentration
Pearson Correlation -0.452 -0.588* -0.674
** -0.546
* 1 0.661
** 0.132 0.163
Sig. (1-tailed) 0.070 0.022 0.008 0.033 0.010 0.341 0.306
Cd accumulation
Pearson Correlation 0.131 -0.01 -0.001 -0.012 0.661**
1 0.527* 0.554
*
Sig. (1-tailed) 0.343 0.488 0.499 0.485 0.010 0.039 0.031
Proline
Pearson Correlation 0.415 0.397 0.371 0.393 0.132 0.527* 1 0.423
Sig. (1-tailed) 0.090 0.101 0.117 0.103 0.341 0.039 0.085
Phenolics
Pearson Correlation 0.728**
0.537* 0.299 0.590
* 0.163 0.554
* 0.423 1
Sig. (1-tailed) 0.004 0.036 0.173 0.022 0.306 0.031 0.085
**. Correlation is significant at the 0.01 level (1-tailed). *. Correlation is significant at the 0.05 level (1-tailed).

CHAPTER # 2 RESULTS
38
Table 2. 6: Correlations among different parameters measured in stem of P. hysterophorus plant.
Length FW DW TWC Cd conc Cd accumulation Proline Phenolics
Length Pearson Correlation 1 0.944**
0.937**
0.941**
-0.543* -0.070 0.437 0.745
**
Sig. (1-tailed) 0.001 0.001 0.001 0.034 0.415 0.078 0.003
FW Pearson Correlation 0.944**
1 0.972**
0.999**
-0.572* -0.132 0.333 0.771
**
Sig. (1-tailed) 0.001 0.001 0.001 0.026 0.341 0.145 0.002
DW Pearson Correlation 0.937**
0.972**
1 0.964**
-0.689**
-0.257 0.267 0.651*
Sig. (1-tailed) 0.001 0.001 0.001 0.007 0.210 0.201 0.011
TWC Pearson Correlation 0.941**
0.999**
0.964**
1 -0.553* -0.114 0.341 0.785
**
Sig. (1-tailed) 0.001 0.001 0.001 0.031 0.362 0.139 0.001
Cd concentration Pearson Correlation -0.543* -0.572
* -0.689
** -0.553
* 1 0.867
** 0.275 0.040
Sig. (1-tailed) 0.034 0.026 0.007 0.031 0.001 0.193 0.451
Cd accumulation Pearson Correlation -0.070 -0.132 -0.257 -0.114 0.867**
1 0.577* 0.481
Sig. (1-tailed) 0.415 0.341 0.210 0.362 0.001 0.025 0.057
Proline Pearson Correlation 0.437 0.333 0.267 0.341 0.275 0.577* 1 0.640
*
Sig. (1-tailed) 0.078 0.145 0.201 0.139 0.193 0.025 0.013
Phenolics
Pearson Correlation 0.745**
0.771**
0.651* 0.785
** 0.040 0.481 0.640
* 1
Sig. (1-tailed) 0.003 0.002 0.011 0.001 0.451 0.057 0.013
**. Correlation is significant at the 0.01 level (1-tailed). *. Correlation is significant at the 0.05 level (1-tailed).

CHAPTER # 2 RESULTS
39
Table 2. 7: Correlation among different parameters measured in leaves of P. hysterophorus plant.
FW DW TWC Cd
conc.
Cd
accumul-
ation
Proline Phenolics Chlorophyll
a
Chlorophyll b Total
Chlorophyll
FW Pearson
Correlation
1 0.971**
0.998**
-0.614* -0.223 0.402 0.219 0.986
** 0.136 0.146
Sig. (1-tailed) 0.001 0.001 0.017 0.243 0.098 0.247 0.001 0.337 0.326
DW Pearson
Correlation
0.971**
1 0.952**
-0.608* -0.166 0.377 0.189 0.984
** 0.043 0.052
Sig. (1-tailed) 0.001 0.001 0.018 0.303 0.114 0.279 0.001 0.447 0.436
TWC Pearson
Correlation
0.998**
0.952**
1 -0.609* -0.238 0.405 0.226 0.976
** 0.162 0.171
Sig. (1-tailed) 0.001 0.001 0.018 0.228 0.096 0.24 0.004 0.308 0.297
Cd
concentration
Pearson
Correlation
-0.614* -0.608
* -0.609
* 1 0.859
** 0.399 0.494 -0.576
* -0.398 -0.337
Sig. (1-tailed) 0.017 0.018 0.018 0.001 0.101 0.051 0.025 0.101 0.142
Cd
accumulation
Pearson
Correlation
-0.223 -0.166 -0.238 0.859**
1 0.723**
0.630* -0.141 -0.458 -0.39
Sig. (1-tailed) 0.243 0.303 0.228 0.001 0.004 0.014 0.331 0.067 0.105
Proline Pearson
Correlation
0.402 0.377 0.405 0.399 0.723**
1 0.693**
0.448 -0.147 -0.087
Sig. (1-tailed) 0.098 0.114 0.096 0.101 0.004 0.006 0.072 0.324 0.394
Phenolics Pearson
Correlation
0.219 0.189 0.226 0.494 0.630* 0.693
** 1 0.252 0.013 0.106
Sig. (1-tailed) 0.247 0.279 0.240 0.051 0.014 0.006 0.215 0.484 0.371
Chlorophyll a Pearson
Correlation
0.986**
0.984**
0.976**
-0.576* -0.141 0.448 0.252 1 0.137 0.147
Sig. (1-tailed) 0.001 0.001 0.001 0.025 0.331 0.072 0.215 0.336 0.324
Chloropyll b Pearson
Correlation
0.136 0.043 0.162 -0.398 -0.458 -0.147 0.013 0.137 1 0.993 **
Sig. (1-tailed) 0.337 0.447 0.308 0.101 0.067 0.324 0.484 0.336 0.001
Total
chlorophyll
0.146 0.052 0.171 -0.337 -0.39 0.017 0.106 0.147 0.993** 1
0.326 0.436 0.297 0.142 0.105 0.394 0.371 0.324 0.001
**. Correlation is significant at the 0.01 level (1-tailed). *. Correlation is significant at the 0.05 level (1-tailed).

CHAPTER # 2 DISCUSSION
40
2.4 DISCUSSION
Soils polluted with metals not only effect plants growth and yield but can also negatively
affect animals and humans, when reach their bodies through food chain. Cadmium is toxic
metal, which is a potential threat to human health, must be removed from the soil. In our
research, the effects of chemical chelator (EDTA) and plant growth regulator (Gibberellic
acid) was evaluated on the cadmium phytoextraction potential of P. hysterophorus plant.
2.4.1 Plant growth and biomass
Plant growth parameters such as biomass have been reported to be highly sensitive to heavy
metals exposure (Hadi and Bano, 2009; Hadi et al 2010; John et al 2009; Arun et al 2005).
Heavy metals like cadmium when present in large amounts with in plant tissues reduction in
plant development due to their toxicity (Khatamipour et al 2011). In this research study,
cadmium demonstrated significant reduction in plant length and biomass of Parthenium
hysterophorus plant (comparing C with C1). Decrease in biomass and growth of plants in
cadmium contaminated soil is often observed and this reduction in length (root and shoot)
and biomass could be directly related to the negative affect of heavy metal on the division
meristematic cells and also on the cell elongation and cell expansion growth of these cells
(Houshmandfar and Moraghebi, 2011). One of the reasons for inhibition of cell elongation
growth is the increase cross-linking of cell wall components by the heavy metal cadmium
(Poschenrieder et al 1989). Our plant also showed reduction in fresh weight and consequently
in the water contents with in different its different parts under cadmium stress (comparing C
with C1). Similar reduction in fresh weight under cadmium stress was reported by Zheng et al
(2010) and Khatamipour et al (2011) in Glycyrrhiza uralensis plant. Cadmium has also been
found to cause physiological drought by altering water content in plant tissues (Barcelo and
Poschenrieder, 1990).
Addition of EDTA into the cadmium contaminated soil further reduced the plant growth
while application of GA3 foliar spray enhanced the growth and biomass of the Parthenium
hysterophorus plant. This effect of EDTA on decreasing plant growth and biomass could be
due to increase in mobility of cadmium by EDTA in soil (Epelde et al 2008; Lou et al 2007).
The increase in growth and biomass might be due to the role of GA3 in promotion of cell
enlargement (Buchanan et al 2000) and on the rate of cell division (Moore, 1989; Arteca,
1996) which are the two main processes for the increase in growth and biomass. GA3 also
enhance the synthesis of DNA, RNA and protein (Benjerano and Lips, 1970; Broughton and

CHAPTER # 2 DISCUSSION
41
McComb, 1971) and ribose and polyribosome multiplication (Evins and Varner, 1972) would
increase biomass of a plant.
On the other hand GA3 treatment also increases permeability of cell membrane (Crozier and
Turnbull, 1984) that would enhance absorption of mineral nutrients, their transport and
utilization (Khan et al 1998; Crozier and Turnbull, 1984; Al-Wakeel et al 1995). Thus
enhancing the capability of the GA3 treated plants for high biomass production as
demonstrated in our experiment (Table 2.2). Increase in biomass of due to GA3 application
was observed tomato plants by Masroor et al (2006) and in in maize by Hadi et al (2010).
2.4.2 Plant cadmium up take
The results showed that Parthenium hysterophorus is a hyperaccumulator of cadmium at its
reproductive stage as obvious from its high Bioconcentration factor (1.85). GA3 and EDTA in
combination greatly increase cadmium concentration with in different parts of the plant. The
reason might be that EDTA increase the bioavalibility in soil solution (Mamindy-Pajany et al
2014; Meers et al 2005; Chen and Cutright 2001) while the GA3 increased absorption and
translocation of cadmium into different parts of the plant (Hadi et al 2014; Tassi et al 2008).
2.4.3 Proline concentration
Accumulation of proline in plant tissue is often considered as an indicator of environmental
stress such as drought, salinity and heavy metal stress. It has been found that free proline
chelates cadmium ion in plant tissues and convert them into nontoxic complex of Cd-proline
(Sharma et al 1998). Our results also showed a strong correlation between free proline and
cadmium accumulation within different tissues of the Parthenium hysterophorus plant. This
suggests that free proline may play an important role in Cd accumulation and also in the
reduction of cadmium toxicity within plants. Several plant have been reported to accumulate
high concentration of free proline under heavy metal stress such as S. nigrum, sunflower,
wheat, tomato and Igna unguiculata (Khatamipour et al 2011; Sun et al 2007; Zengin and
Munzuroglu, 2006; Costa and Morel, 1994). Higher concentration of free proline was
recorded in the roots of P. hysterophorus plant as compared to the stem and leaves. Similarly
high root proline concentration in Vigna unguiculata plant was found by Bhattacharjee and
Mukherjee (1994). GA3 treatment demonstrated high concentrations of free proline, which
suggested an important role of GA3 in the synthesis of proline.

CHAPTER # 2 DISCUSSION
42
2.4.4 Phenolics concentration within plant tissues
Phenolic compounds play an important role in protection, restoration and degradation
processes caused by toxic chemicals (Rice-Evans et al 1997). High concentrations of total
phenolics have been found in different plants under various environmental stresses (Diaz et al
2001; Lavola et al 2000). Soluble phenolic compounds showed important antioxidant activity
and are thus considered to be closely related to stress situations (Wild and Schmitt, 1995).
Schutzendubel et al (2001) reported that scots pine accumulate high concentration of soluble
phenolics subjected to Cd stress. Phenolic compounds act as metal chelators and also as
antioxidant during heavy metal stress (Michalak, 2006). High concentration of phenolics was
recorded in leaves of the P. hysterophorus plant compared to roots and stem. Similarly high
concentration of phenolic compounds in leaves of Crotalaria juncea was reported by
Uraguchi et al (2006).
2.4.5 Chlorophyll contents
Excess of cadmium in soil decreases content of chlorophyll (Ngayila et al 2008), its synthesis
rate (Vajpayee et al 2000), efficiency of photosystems (Chugh et al 1997), photosynthetic
enzymes (Mobin and Nafees, 2007; Thapar et al 2008), plant water balance and consequently
on plant growth and biomass (Zhou and Qiu, 2005). Our results also demonstrated that a
negative correlation existed between the cadmium contents of leaf and the chlorophyll
contents (Table 2.7) which are in agreement with earlier reports (Mobin and Nafees, 2007;
Sun et al 2008; Ekmekci et al 2008), who found that heavy metal suppressed the
photosynthetic activity of plants. Faller et al (2005) demonstrated that Cd2+
has inhibitory
effect on the photoactivation of photosystem II as result of its competitive binding with the
Ca2+
site. The net photosynthetic rate has been shown to decrease conspicuously with high
concentrations of cadmium (Lakshaman and Surinder, 1999). Different physiological
activities influence the metabolization of chlorophyll in plants. The chlorophyll-a firs
synthesized and transformed into Chlorophyll-b (Guo et al 2006). Therefore, higher content
of Chl-a was found in our plant as compared to the Chl-b (Table 2.4) which is in complete
agreement with the work of Mobin and Nafees (2007).
Conclusions
Phytoextraction capabilities of Parthenium hysterophorus highly increased at reproductive
stage and at this it can be considered as hyperaccumulator of cadmium at this stage. GA3
increased cadmium content of the plant but the effect of GA3 was more pronounced at higher
concentration in combination split doses of EDTA at low concentrations. It has also been

CHAPTER # 2 DISCUSSION
43
found that concentration of free proline and total phenolics significantly increased with the
increase in Cd concentration of plant tissues, especially in the GA3 treated plants. This
suggests that GA3 has some role in the synthesis of these compounds. Proline and phenolics
showed positive correlation with the plant dry weight as well as with the Cd accumulation in
different parts of the plant. Further study is recommended to find the biochemical basis of
proline and phenolics synthesis and the molecular mechanism through which GA3 enhance
their biosynthesis in plant during Cd stress.

CHAPTER # 3
THE EFFECT OF MOLYBDENUM ON CADMIUM PHYTOEXTRACTION AND
PRODUCTION OF ENDOGENOUS PHENOLICS, FREE PROLINE AND
PHOTOSYNTHETIC PIGMENTS IN RICINUS COMMUNIS AND CANNABIS
SATIVA PLANTS

CHAPTER # 3 ABSTRACT
44
CHAPTER 3: The effect of molybdenum on cadmium phytoextraction and
production of endogenous phenolics, free proline and
photosynthetic pigments in Ricinus communis and
Cannabis sativa plants.
ABSTRACT
Purpose of the present study was to investigate the effect of molybdenum (Mo 0.5, 1.0 and
2.0 ppm) on Cd phytoextraction, total phenolics, free proline, biomass and photosynthetic
pigments in Ricinus communis and Cannabis sativa plants grown in cadmium (Cd 25, 50 and
100 ppm) contaminated soils. Mo was applied as seed soaking, soil addition and foliar spray.
Foliar applications of Mo significantly increased biomass, Cd accumulation and Cd-
bioconcentration in R. communis and C. sativa plants. Total phenolics and free proline in
roots and leaves of the plants were highly increased by foliar as well as seed soaking
treatments of Mo. Significantly positive correlations existed between Cd accumulation and
concentration of total phenolics and free proline in roots and leaves of both the plants. In R.
communis the correlations of Cd accumulation with concentration of total phenolics (in roots
and leaves) and free proline (in leaves) were higher than 70 % (R2 = 0.70). In C. sativa plant,
the roots demonstrated significant correlations (R2 > 0.75) of Cd accumulation with proline
and phenolic concentrations under 25 ppm and 50 ppm Cd contaminated soil. Total phenolics
concentration in leaves of both the plants showed highly significant correlations (R2 > 0.70)
with chlorophylls and carotenoid concentration. Foliar spray of molybdenum was found more
significant as compared to seed soaking and soil addition treatments, in terms of increase in
plants growth, Cd concentration, endogenous production of total phenolics and free proline.
Manuscripts submitted from this chapter:
Nasir Ali and Fazal Hadi. (2015). ‗‗Molybdenum (Mo) increased the phytoremediation
potential of industrially important plant (Ricinus communis) for removal of hazardous metal
(cadmium) from contaminated soil, along with increase in endogenous phenolics, proline and
photosynthetic pigments‘‘ Journal of Hazardous Materials. (Submitted).
.
CHAPTER # 3 INTRODUCTION
45
3.1 INTRODUCTION
Cadmium is one of the toxic heavy metal that enters agricultural soil mostly through
industrial effluents, mining operations, municipal runoff and application of phosphate
fertilizers (Rogers et al 2007). It can easily be absorb by plant roots and translocated into
aerial parts; inhibiting plant growth, uptake of micro- and macronutrients and reduction in
rate of photosynthesis; thus reduce crops yield and also compromise the quality of food
(Ahmad et al 2015; Zadeh et al 2008). Consumption of Cd contaminated food results in
serious health problems (Ahmad et al 2015; Zadeh et al 2008). In human body, Cd can affect
gene expression, interferes with DNA damage repair system, inhibit apoptosis and induce
oxidative stress; resulting damage to different organs such as kidneys, liver, lung and bone
(Takiguchi et al 2003; Huang et al 2008; Krocova et al 2000; Joseph 2009). Safe restoration
of Cd polluted soil is utmost important for sustainable agriculture, environment and human
health. Phytoremediation is an environment friendly remediation technology that uses green
plants for the decontamination of polluted soil and water. This is an economical, environment
friendly and aesthetically pleasing technology (Hadi et al 2014). Plants under heavy metals
stress often showed decrease in growth and biomass which in turn reduce their
phytoremediation potential (Tassi et al 2008; Falkowska et al 2011). To combat the toxic
metals, increase in concentration of endogenous free proline and total phenolic compounds
have been reported in many plants (Ahmad et al 2015; Ali and Hadi 2015). Phenolic
compounds protect cellular components from oxidative stress caused by reactive oxygen
species while free proline has been reported to protect some important enzymes from
deactivation by toxic heavy metals (Michalak 2006; Handique and handique 2009).
Micronutrients are required by plants in very minute quantity for normal physiological
activities. Molybdenum (Mo) is one of the micronutrients required by plants for normal
growth and its deficiency reduces the activities of nitrate reductase and glutamine synthetase:
enzymes catalyzing the initial steps of nitrate metabolism (Hristozkova et al 2006). Mo have
also been reported to catalyse other enzymes such as aldehyde oxidase (AO) involved in
Abscisic acid biosynthesis and sulfite oxidase (SO) catalyse the conversion of sulfite to
sulfate, an essential step in the catabolism amino acids containing Sulphur (Williams and
Frausto da Silva 2002). It is also found that molybdoenzymes are involved in the synthesis of
indole-3-acetic acid (IAA) and abscisic acid (Hesberg et al 2004; Sagi et al 2002).
Ricinus communis (Castor bean) and Cannabis sativa plants were used as experimental plant
which belongs to Euphorbiaceae and Cannabaceae families respectively of the plantae

CHAPTER # 3 INTRODUCTION
46
kingdom (Rana et al 2012). Both the plants are highly suited for metal phytoremediation
purpose due to their high biomass, fast growth, deep roots and non-palatable nature to
herbivores (prevent entrance of metals into food chain) (Linger et al 2005; Citterio et al
2003).

CHAPTER # 3 AIMS AND OBJECTIVES
47
Aims and objectives
Aims:
Aim of this chapter was to study the role of molybdenum (Mo) in cadmium phytoextraction
by Ricinus communis and Cannabis sativa plants and biochemical changes occurred in these
plants under molybdenum treatments and cadmium stress.
Objectives:
1. To evaluate the effect of different concentrations of cadmium in soil on plant growth
and biomass.
2. To study the effect of molybdenum on plant length, biomass and water content under
cadmium stress.
3. To find out the role of molybdenum on cadmium concentration and accumulation in
different parts of the selected plants.
4. To evaluate the effect of molybdenum treatments on translocation of cadmium from
roots into the aerial parts of the selected plants.
5. To assess the effect of molybdenum and cadmium on the production of endogenous
production of free proline and total phenolics in roots and leaves of the plants.
6. To find out the role of molybdenum and cadmium on chlorophyll and carotenoids
contents in leaves of the selected plants.
7. To study the inter-correlations between plant length, biomass, proline, phenolics, Cd
concentration, Cd accumulation and photosynthetic pigments.

CHAPTER # 3 MATERIALS AND METHODS
48
3.2 MATERIALS AND METHODS
3.2.1 Preparation of soil and addition of cadmium
Fertile soil was collected from fields near the University of Malakand at Chakdara, Pakistan.
The soil was dried in sunlight and grounded into powdered form. Water holding capacity
(300 ml water per kg soil ± 3) and pH (6.5 ± 0.3) of the soil was calculated. From the soil,
0.25 kg was poured into plastic pots (20 × 12 cm). Cadmium (Cd) in the form of cadmium
acetate dihydrate (CH3COO)2 Cd·2H2O (Merck, Germany) solution was added to soil in the
pots. Three different concentrations (25, 50 and 100 ppm) cadmium were used in soil (Table
3.1). Cadmium was allowed to equilibrate in soil for one month.
3.2.2 Transplantation of seedlings and plant growth
Each pot was watered a day before transplantation of seedlings. Seeds of Ricinus communis
and Cannabis sativa were obtained from Herbarium University of Malakand, and sown in
normal soil beds in green house. After germination uniform sized (7 cm) seedlings were
collected from the green house and transplanted into pots (single seedling per pot). Plants
were allowed to grow under natural condition of light and temperature (35/25°C). Three
replicate pots were used for each treatment and control. Plants were watered at three days
interval, according to the water holding capacity of the soil.
3.2.3 Molybdenum treatments
Three concentrations (0.5, 1.0 and 2.0 ppm) of molybdenum were applied in three different
ways i.e. seed soaking, soil addition and foliar spray (Table 3.1). Ammonium molybdate
pentahydrate was used as a source of molybdenum. Stock solution of Mo was prepared and
then treatments solutions were made through serial dilution. In case of seed soaking
treatments, seeds were kept in respective Mo solutions for 24 hrs before sowing. In soil
addition treatments, Mo (0.5, 1.0 and 2.0 ppm) solution were added into soil once after 15
days of transplantation. The solutions of Mo were applied according to the water holding
capacity of soil. Six foliar treatments were done, each at one week interval. First foliar
treatment was done 15 days after transplantation. During foliar spray, soil in the pots were
covered with plastic bags to avoid entrance of Mo droplets into soil.

CHAPTER # 3 MATERIALS AND METHODS
49
Table 3. 1: The following treatments were used during the experiment. C act as control for
C1, C2 and C3. The C1 is control for treatments T1 to T9, C2 is control for treatments T10 to
T18 while C3 is control for treatments T19 to T27.
Treatments
Sym
bols
Treatments
Sym
bols
Treatments
Sym
bols
Without Cd and Mo C
25 ppm Cd C1 50 ppm Cd C2 100 ppm Cd C3
0.50 ppm Mo [S.S] T1 0.50 ppm Mo [S.S] T10 0.50 ppm Mo [S.S] T19
1.00 ppm Mo [S.S] T2 1.00 ppm Mo [S.S] T11 1.00 ppm Mo [S.S] T20
2.00 ppm Mo [S.S] T3 2.00 ppm Mo [S.S] T12 2.00 ppm Mo [S.S] T21
0.50 ppm Mo [A.S] T4 0.50 ppm Mo [A.S] T13 0.50 ppm Mo [A.S] T22
1.00 ppm Mo [A.S] T5 1.00 ppm Mo [A.S] T14 1.00 ppm Mo [A.S] T23
2.00 ppm Mo [A.S] T6 2.00 ppm Mo [A.S] T15 2.00 ppm Mo [A.S] T24
0.50 ppm Mo [F.S] T7 0.50 ppm Mo [F.S] T16 0.50 ppm Mo [F.S] T25
1.00 ppm Mo [F.S] T8 1.00 ppm Mo [F.S] T17 1.00 ppm Mo [F.S] T26
2.00 ppm Mo [F.S] T9 2.00 ppm Mo [F.S] T18 2.00 ppm Mo [F.S] T27
Note: ‗S.S‘ stands for seed soaking, ‗A.S‘ stands for added to soil ‗F.S‘ stands for foliar
spray, ‗C‘ stands for control, ‗T‘ denotes treatment, ‗Cd‘ symbolize cadmium and Mo denote
molybdenum. Treatments T1-T9 possess 25 ppm Cd, T10- T18 contain 50 ppm Cd while
T19-T27 contain 100 ppm Cd concentration.

CHAPTER # 3 MATERIALS AND METHODS
50
3.2.4 Plant growth parameters
Plant were harvested after two months of seedling transplantation. Roots and shoot lengths of
each plant were measured using a centimeter ruler. Plants were washed with a solution of 5
mM EDTA and 5 mM Tris-HCl (pH 6.0), and then with distilled water to remove metal ion
bounded to the plant surface (Genrich et al 2000). After washing each plant was cut into
three parts i.e. roots, stem and leaves and fresh weight of each part was measured
immediately with the help of analytical balance. Each part was packed in separate paper
envelopes and dried in oven for 48 h at 80 0C. The dry weight of each part was measured by
analytical balance and then grinded into powdered form for further analysis of metal
concentration.
3.2.5 Free proline analysis in root and leaves
Free proline quantification in plant tissues (root and leaves) were made by the method of
Bates et al (1973). The detailed method has been mentioned in previous chapter 2, Section
Materials and Methods on page 25 under the title ―Analysis of free proline in plant root and
leaves‖.
3.2.6 Total phenolics estimation in roots and leaves
Total phenolic were estimated in roots and leaves of the plants using the method of Singleton
and Rossi (1965). The detailed method has already been given in previous chapter 2, section
material and methods on page 26 under title ―Total phenolics estimation in roots and leaves‖.
3.2.7 Chlorophyll and carotenoids estimation in leaves
Concentration of chlorophylls (a and b) were estimated by the method of Arnon (1949). A
detail of the method is already given in previous chapter 2, Section Materials and Methods on
page 26 under the title ― Chlorophyll estimation in leaves‖.
Carotenoids concentrations in fresh leaves were estimated by using the method of Sumanta et
al (2014). Fresh leaf samples (0.5 g) were homogenized in 10 ml of 80% acetone, centrifuged
at 10000 rpm for 15 minutes. The supernatants were transferred into clean test tubes
containing 4.5 ml of 80% acetone. Three replicates were used for each treatment. Carotenoids
were estimated by measuring absorbance of the samples at 470 nm wavelength. The
following formulas were used for calculation of carotenoids contents:

CHAPTER # 3 MATERIALS AND METHODS
51
Carotenoids contents = A480 x volume of extract x 10 x 100/2500 x weight of plant material
(g).
3.2.8 Cadmium (Cd) analysis in different plant parts
Oven dried samples (root, stem and leaves) were first grounded into powdered form and then
subjected to acid digestion using Allen (1974) method. Detailed method has already been
given in previous chapter 2, section material and methods on page 27 under title ―Cadmium
(Cd) analysis in the plant‖. After digestion the samples were analyzed for Cd concentration
with the help of Atomic Absorption/Flame Spectrophotometer (model Hitachi Z-8000,
Japan).
3.2.9 Statistical analysis
The data was further analyzed for mean values, analysis of variance (ANOVA) using
software such as SPSS 16 and MS Excel 2007. Significant differences among the treatments
for different parameters were analyzed through Tukey‘s Honestly Significant Difference
(HSD) test.

CHAPTER # 3 RESULTS
52
3.3 RESULTS
3.3.1 Ricinus communis plant
3.3.1.1 Plant length, biomass and water contents
Plant length, biomass and water content in different parts of Ricinus communis under various
treatments of molybdenum and Cd are shown in Tables 3.2, 3.3 and 3.4. In table 3.2 and
figure 3.1. The control C (without Cd and Mo) is compared with C1 (25 ppm Cd), C2 (50
ppm Cd) and C3 (100 ppm) for the effect of Cd on plant growth. In the same table, C1 is
compared with treatments T1 – T9 for the effect of Mo on plant growth under Cd stress. A
gradual decrease in plant growth parameters was noted with increasing concentration of Cd in
soil i.e. C1 (25 ppm Cd) > C2 (50 ppm Cd) > C3 (100 ppm Cd). Treatments of Mo increased
the growth and biomass of Ricinus communis plant as compared to C1 (Table 3.2). Highest
significant increase in roots and stem length were found in T7 (1 ppm Mo foliar spray) as
given in table 3.2 and figure 3.1X. It was found that 2 ppm Mo foliar treatment most
significantly increased dry weight (DW) of the plant (Table 3.2).
The table 3.3 shows the effect of Mo treatments on growth parameter of Ricinus communis
plants grown in 50 ppm Cd contaminated soil. Highest significant increase in roots and stem
length were demonstrated by T10 (0.5 ppm Mo seed soaking) and T18 (2.0 ppm Mo foliar
spray) respectively, as compared to the C2 (Table 3.3 and figure 3.1Y). Dry weight in roots
and stem were most significantly increased by 2 ppm Mo foliar spray (T18) while the same
concentration of Mo (2 ppm) in the form of seed soaking (T12) highly increased dry weight
in leaves.
The effect of Mo treatments on plant growth parameters in 100 ppm Cd contaminated soil is
presented in Table 3.4. Roots and stem lengths were increased significantly by 2 ppm Mo in
the form of seed soaking and foliar spray respectively as compared to C3 (Table 3.4 and
figure 3.1 Z). Biomass (fresh and dry) in all parts of the plant were highly increased by 2 ppm
Mo foliar treatment (T27).

CHAPTER # 3 RESULTS
53
Table 3. 2: Effect of different treatments of molybdenum (Mo) on plant length, biomass and water content in different parts of Ricinus communis plant grown in
25 ppm Cd contaminated soil. C1 (25 ppm Cd only) is used as control for the treatments (T1 – T9). Table also compares C1 (25 ppm Cd), C2 (50 ppm Cd) and
C3 (100 ppm Cd) with each other and also with control C (without Cd and Mo). Note: ‗SD‘ stands for ‗standard deviation‘ and the different alphabets in
superscript represent significant difference between the values within a single column.
Treatments Length (cm) ± SD FW (g) ± SD DW (g) ± SD TWC (g) ± SD
Roots Stem Roots Stem Leaves Entire plant
Roots Stem Leaves Entire plant
Roots Stem Leaves Entire plant
C Control (without Cd and Mo)
12.50 ± 1.00 abcd
31.25 ± 3.13 abc
3.75 ± 0.30 cde
7.81 ± 0.70 cde
9.77 ± 0.78 abcd
21.33 ± 1.71 abc
1.13 ± 0.09 de
2.34 ± 0.19 bcd
2.93 ± 0.23 abc
6.40 ± 0.51 cde
2.63 ± 0.21 bcd
5.47 ± 0.44 abcd
6.84 ± 0.55 bcd
14.93 ± 1.19 abc
C1 Control (with Cd 25 ppm)
9.73 ± 0.78 def
24.32 ± 2.43 cde
2.92 ± 0.26 ef
6.08 ± 0.49 ef
6.99 ± 0.63 efg
15.99 ± 1.44 cde
0.79 ± 0.07 fg
1.64 ± 0.15 ef
1.89 ± 0.15 ef
4.32 ± 0.35 fg
2.13 ± 0.17 cde
4.44 ± 0.36 cdef
5.10 ± 0.41 ef
11.67 ± 0.93 cde
C2 Control (with Cd 50 ppm)
8.12 ± 0.65 ef
20.30 ± 2.03 de
2.78 ± 0.22 ef
5.08 ± 0.51 ef
6.54 ± 0.65 fg
14.40 ± 1.15 de
0.66 ± 0.05 fg
1.19 ± 0.11 fg
1.58 ± 0.13 fg
3.42 ± 0.27 gh
2.12 ± 0.17 cde
3.89 ± 0.31 ef
4.96 ± 0.40 ef
10.97 ± 0.88 de
C3 Control (with Cd 100 ppm)
6.81 ± 0.54 f
17.02 ± 1.70 e
2.04 ± 0.14 f
4.26 ± 0.34 f
4.89 ± 0.39 g
11.19 ± 1.12 e
0.55 ± 0.06 g
1.02 ± 0.08 g
1.05 ± 0.08 g
2.62 ± 0.21 h
1.49 ± 0.12 e
3.24 ± 0.26 f
3.84 ± 0.31 f
8.57 ± 0.69 e
T1 Cd 25 ppm+ Mo 0.5 ppm (Seed soaking)
15.00 ± 1.50 a
27.23 ± 2.45 cd
3.68 ± 0.40 cde
6.81 ± 0.75 cde
8.71 ± 0.78 cdef
19.20 ± 1.54 bcd
1.25 ± 0.13 cde
2.11 ± 0.17 cde
2.70 ± 0.22 bcd
6.06 ± 0.48 de
2.43 ± 0.19 bcd
4.70 ± 0.42 bcde
6.01 ± 0.54 cde
13.14 ± 1.05 bcd
T2 Cd 25 ppm+ Mo 1.0 ppm (Seed soaking)
14.21 ± 1.42 ab
35.00 ± 3.15 ab
5.25 ± 0.47 ab
8.75 ± 0.70 ab
10.97 ± 0.77 abcd
24.97 ± 3.00 a
1.52 ± 0.11 bc
2.71 ± 0.30 bc
3.47 ± 0.28 a
7.70 ± 0.62 abc
3.73 ± 0.30 a
6.04 ± 0.48 a
7.50 ± 0.60 abc
17.27 ± 1.38 a
T3 Cd 25 ppm+ Mo 2 ppm (Seed soaking)
13.00 ± 1.30 abc
28.00 ± 2.52 bc
5.46 ± 0.55 a
8.45 ± 0.85 a
11.12 ± 1.22 abc
25.03 ± 2.25 a
1.64 ± 0.13 ab
2.77 ± 0.22 b
3.24 ± 0.26 ab
7.65 ± 0.61 abc
3.82 ± 0.31 a
5.68 ± 0.45 ab
7.88 ± 0.63 ab
17.38 ± 1.39 a
T4 Cd 25 ppm+ Mo 0.5 ppm (Soil addition)
12.00 ± 1.20 abcd
26.31 ± 2.37 cd
3.16 ± 0.25 de
6.58 ± 0.59 de
9.24 ± 0.83 bcde
18.97 ± 1.33 cd
0.98 ± 0.09 ef
1.91 ± 0.15 de
2.14 ± 0.17 def
5.02 ± 0.40 ef
2.18 ± 0.17 cd
4.67 ± 0.37 bcde
7.10 ± 0.57 bcd
13.95 ± 1.12 abcd
T5 Cd 25 ppm+ Mo 1.0 ppm (Soil addition)
11.00 ± 0.99 bcde
29.45 ± 2.36 abc
3.98 ± 0.32 cd
7.36 ± 0.44 cd
8.94 ± 0.72 cdef
20.28 ± 1.62 abc
1.23 ± 0.10 cde
2.14 ± 0.19 cde
2.39 ± 0.22 cde
5.76 ± 0.52 def
2.74 ± 0.25 bc
5.23 ± 0.42 abcd
6.55 ± 0.65 bcde
14.52 ± 1.16 abc
T6 Cd 25 ppm+ Mo 2 ppm (Soil addition)
10.45 ± 0.94 cde
27.32 ± 2.19 cd
3.99 ± 0.36 cd
7.02 ± 0.77 cd
8.54 ± 0.68 def
19.55 ± 1.56 bcd
1.47 ± 0.12 bc
1.98 ± 0.16 de
2.87 ± 0.23 abc
6.32 ± 0.51 cde
2.52 ± 0.20 bcd
5.04 ± 0.40 abcde
5.67 ± 0.45 de
13.23 ± 1.06 bcd
T7 Cd 25 ppm+ Mo 0.5 ppm (Foliar spray)
10.90 ± 0.98 cde
26.94 ± 2.16 cd
3.31 ± 0.23 de
6.68 ± 0.53 de
8.97 ± 0.90 cdef
18.96 ± 1.71 cd
1.28 ± 0.12 cde
2.42 ± 0.22 bcd
2.96 ± 0.27 abc
6.66 ± 0.60 bcd
2.03 ± 0.18 de
4.26 ± 0.38 def
6.01 ± 0.54 cde
12.30 ± 1.11 cd
T8 Cd 25 ppm+ Mo 1.0ppm (Foliar spray)
15.76 ± 1.33 a
36.00 ± 2.88 a
4.43 ± 0.40 bc
9.00 ± 0.81 a
12.15 ± 1.09 a
25.58 ± 2.30 a
1.45 ± 0.13 bcd
3.42 ± 0.27 ab
3.34 ± 0.27 ab
8.21 ± 0.66 ab
2.98 ± 0.24 b
5.58 ± 0.45 abc
8.81 ± 0.70 a
17.37 ± 1.39 a
T9 Cd 25 ppm+ Mo 2.0 ppm (Foliar spray)
12.71 ± 1.14 abcd
31.00 ± 2.48 abc
4.68 ± 0.37 abc
8.42 ± 0.67 abc
11.45 ± 0.92 ab
24.55 ± 1.96 ab
1.91 ± 0.19 a
3.95 ± 0.29 a
3.41 ± 0.34 a
8.27 ± 0.83 a
2.77 ± 0.28 bc
4.48 ± 0.55 cdef
8.04 ± 0.80 ab
16.29 ± 1.63 ab

CHAPTER # 3 RESULTS
54
Table 3. 3: Role of Mo treatments on length, biomass and water content of Ricinus communis plant in 50 ppm Cd polluted soil. Note: ‗SD‘ denote ‗standard
deviation‘, and the different letter in superscript present significant difference among the values within a column.
Treatments Length (cm) ± SD FW (g) ± SD DW (g) ± SD TWC (g) ± SD
Roots Stem Roots Stem Leaves
Entire plant
Roots Stem Leaves Entire plant
Roots Stem Leaves
Entire plant
C2 Control (with Cd 50 ppm)
8.12 ± 0.97 c
20.30 ± 2.44 ab
2.78 ± 0.33 d
5.08 ± 0.61 d
6.54 ± 0.78 b
14.40 ± 1.73 c
0.66 ± 0.08 c
1.19 ± 0.14 b
1.58 ± 0.19 c
3.42 ± 0.41 c
2.12 ± 0.25 c
3.89 ± 0.47 b
4.96 ± 0.60 ab
10.97 ± 1.32 b
T10 Cd 50 ppm+ Mo 0.5 ppm (Seed soaking)
13.46 ± 1.21 a
26.05 ± 2.34 ab
4.68 ± 0.42
6.11 ± 0.55 c
7.82 ± 0.70 ab
18.61 ± 1.68 bc
1.12 ± 0.10 ab
1.89 ± 0.17 ab
2.12 ± 0.19 bc
5.14 ± 0.46 abc
3.56 ± 0.32 ab
4.21 ± 0.38 ab
5.70 ± 0.51 ab
13.48 ± 1.21 ab
T11 Cd 50 ppm+ Mo 1.0 ppm (Seed soaking)
12.75 ± 1.53 ab
25.32 ± 3.04 ab
6.20 ± 0.74 a
7.85 ± 0.94ab
9.84 ± 1.18 a
23.90 ± 2.87 a
1.24 ± 0.15 ab
2.52 ± 0.30 a
2.86 ± 0.34 ab
6.62 ± 0.79 a
4.96 ± 0.60 a
5.33 ± 0.64 ab
6.98 ± 0.84 a
17.28 ± 2.07 a
T12 Cd 50 ppm+ Mo 2.0 ppm (Soil addition)
11.67 ± 1.63 abc
18.00 ± 2.52 b
6.14 ± 0.86ab
7.29 ± 1.02 bc
9.98 ± 1.40 a
23.41 ± 3.28 a
1.38 ± 0.19 a
2.32 ± 0.32 a
3.14 ± 0.44 a
6.84 ± 0.96 a
4.76 ± 0.67 a
4.97 ± 0.70 ab
6.84 ± 0.96 a
16.57 ± 2.32 a
T13 Cd 50 ppm+ Mo 0.5 ppm (Soil addition)
8.98 ± 1.08 bc
20.14 ± 2.42 ab
4.02 ± 0.48 cd
5.45 ± 0.65 cd
8.29 ± 0.99 ab
17.76 ± 2.13 bc
0.87 ± 0.10 bc
1.20 ± 0.14 b
1.69 ± 0.20 c
3.76 ± 0.45 bc
3.15 ± 0.38 bc
4.25 ± 0.51 ab
6.60 ± 0.79 a
14.00 ± 1.68 ab
T14 Cd 50 ppm+ Mo 1.0 ppm (Soil addition)
9.87 ± 1.28 abc
24.02 ± 3.12 ab
5.07 ± 0.66 b
6.61 ± 0.86 bc
7.45 ± 0.97 ab
19.12 ± 2.49 b
1.11 ± 0.14 ab
1.92 ± 0.25 ab
2.03 ± 0.26 bc
5.05 ± 0.66 abc
3.96 ± 0.51 ab
4.69 ± 0.61 ab
5.42 ± 0.70 ab
14.07 ± 1.83 ab
T15 Cd 50 ppm+ Mo 2.0 ppm (Soil addition)
10.88 ± 1.31 abc
21.41 ± 2.57 ab
5.33 ± 0.64 b
7.85 ± 0.94ab
7.40 ± 0.89 ab
20.58 ± 2.47 ab
1.21 ± 0.15 ab
2.08 ± 0.25 a
3.12 ± 0.37 a
6.41 ± 0.77 a
4.12 ± 0.49 ab
5.77 ± 0.69 a
4.28 ± 0.51 b
14.17 ± 1.70 ab
T16 Cd 50 ppm+ Mo 0.5 ppm (Foliar spray)
9.79 ± 1.47 abc
25.00 ± 3.75 ab
4.21 ± 0.63 c
6.54 ± 0.98 bc
8.02 ± 1.20 ab
18.77 ± 2.82 bc
1.42 ± 0.21 a
2.17 ± 0.33 a
2.65 ± 0.40 ab
6.25 ± 0.94 a
2.79 ± 0.42 bc
4.37 ± 0.66 ab
5.37 ± 0.80 ab
12.53 ± 1.88 ab
T17 Cd 50 ppm+ Mo 1.0 ppm (Foliar spray)
12.56 ± 2.01 ab
25.23 ± 4.04 ab
4.87 ± 0.78 bc
8.08 ± 1.29 a
7.89 ± 1.26 ab
20.84 ± 3.33 ab
1.30 ± 0.21 ab
2.45 ± 0.39 a
2.44 ± 0.39 abc
6.19 ± 0.99 a
3.57 ± 0.57 ab
5.63 ± 0.90 ab
5.45 ± 0.87 ab
14.64 ± 2.34 ab
T18 Cd 50 ppm+ Mo 2.0 ppm (Foliar spray)
12.02 ± 1.44 abc
28.14 ± 3.38 a
6.32 ± 0.61 a
7.56 ± 0.91ab
6.23 ± 0.75 ab
20.11 ± 2.27 ab
1.49 ± 0.13 a
2.55 ± 0.30 a
1.98 ± 0.24 bc
6.02 ± 0.67 a
4.98 ± 0.48 a
5.05 ± 0.61 ab
4.25 ± 0.51 ab
14.19 ± 1.59 ab

CHAPTER # 3 RESULTS
55
Table 3. 4: Effect of Mo treatments on growth parameter of Ricinus communis plant grown in 100 ppm Cd contaminated soil. Note: ‗SD‘ denote ‗standard
deviation‘ and the different letter in superscript present significant difference among the values within a column.
Treatments Length (cm) ± SD FW (g) ± SD DW (g) ± SD TWC (g) ± SD
Roots Stem Roots Stem Leaves
Entire plant
Roots Stem Leaves
Entire plant
Roots Stem Leaves
Entire plant
C3 Control (with Cd 100 ppm)
6.81 ± 0.82 b
17.02 ± 2.04 bc
2.04 ± 0.25 e
4.26 ± 0.51 e
4.89 ± 0.59 b
11.19 ± 1.34 b
0.55 ± 0.07 e
1.02 ± 0.12 c
1.05 ± 0.13 c
2.62 ± 0.31 d
1.49 ± 0.18 d
3.24 ± 0.39 c
3.84 ± 0.46 b
8.57 ± 1.03 b
T19 Cd 100 ppm+ Mo 0.5 ppm (Seed soaking)
7.68 ± 0.69 b
21.77 ± 1.96 ab
3.45 ± 0.31 cde
5.11 ± 0.46 cde
6.54 ± 0.59 ab
15.09 ± 1.36 ab
0.80 ± 0.07 cde
1.58 ± 0.14 abc
1.77 ± 0.16 bc
4.15 ± 0.37 bcd
2.65 ± 0.24 bcd
3.52 ± 0.32 bc
4.76 ± 0.43 ab
10.94 ± 0.98 ab
T20 Cd 100 ppm+ Mo 1.0 ppm (Seed soaking)
8.48 ± 1.02 ab
21.16 ± 2.54 ab
5.18 ± 0.62 ab
5.55 ± 0.65 bc
8.23 ± 0.99 a
18.86 ± 2.26 a
1.00 ± 0.12 abcd
2.11 ± 0.25 a
2.54 ± 0.30 a
5.65 ± 0.68 ab
4.18 ± 0.50 a
3.34 ± 0.40 c
5.69 ± 0.68 a
13.21 ± 1.59 a
T21 Cd 100 ppm+ Mo 2 ppm (Seed soaking)
11.35 ± 1.59 a
19.21 ± 2.69 ab
5.54 ± 0.78 a
6.09 ± 0.85 bc
7.34 ± 1.17 a
18.97 ± 2.80 a
1.13 ± 0.18 ab
1.94 ± 0.27 ab
2.55 ± 0.39 a
5.62 ± 0.84 ab
4.41 ± 0.59 a
4.15 ± 0.58 bc
4.79 ± 0.78 a
13.35 ± 1.96 a
T22 Cd 100 ppm+ Mo 0.5 ppm (Soil addition)
7.51 ± 0.90 b
16.83 ± 2.02 c
3.10 ± 0.37 de
4.56 ± 0.55 de
6.93 ± 0.83 ab
14.58 ± 1.75 ab
0.73 ± 0.09 de
1.11 ± 0.13 bc
1.32 ± 0.16 c
3.16 ± 0.38 cd
2.37 ± 0.28 cd
3.45 ± 0.41 bc
5.61 ± 0.67 a
11.42 ± 1.37 ab
T23 Cd 100 ppm+ Mo 1.0 ppm (Soil addition)
8.25 ± 1.07 ab
16.98 ± 2.21 c
4.54 ± 0.59 abcd
5.35 ± 0.71 cd
6.23 ± 0.81 ab
16.22 ± 2.11 ab
0.92 ± 0.12 bcd
1.60 ± 0.21 abc
1.70 ± 0.22 bc
4.22 ± 0.55 bcd
3.62 ± 0.47 abc
3.85 ± 0.50 abc
4.53 ± 0.59 ab
11.99 ± 1.56 ab
T24 Cd 100 ppm+ Mo 2 ppm (Soil addition)
10.23 ± 1.23 ab
17.89 ± 2.15 bc
5.01 ± 0.60 abc
6.36 ± 0.79 ab
6.18 ± 0.74 ab
17.76 ± 2.13 a
1.10 ± 0.13 abc
1.74 ± 0.21 ab
2.65 ± 0.32 a
5.49 ± 0.66 ab
3.91 ± 0.47 ab
4.82 ± 0.58 a
3.53 ± 0.42 b
12.27 ± 1.47 ab
T25 Cd 100 ppm+ Mo 0.5 ppm (Foliar spray)
8.18 ± 1.23 ab
20.90 ± 3.13 ab
3.87 ± 0.58 bcd
5.47 ± 0.82 cd
6.70 ± 1.01 ab
16.04 ± 2.41 ab
1.19 ± 0.18 ab
1.82 ± 0.27 a
2.22 ± 0.33 ab
5.22 ± 0.78 ab
2.68 ± 0.40 bcd
3.65 ± 0.55 bc
4.48 ± 0.67 ab
10.82 ± 1.62 ab
T26 Cd 100 ppm+ Mo 1.0ppm (Foliar spray)
9.47 ± 1.52 ab
22.45 ± 3.59 a
4.01 ± 0.64 abcd
6.75 ± 1.08 a
6.59 ± 1.06 ab
17.35 ± 2.78 a
1.09 ± 0.17 ab
2.05 ± 0.33 a
1.98 ± 0.32 ab
5.12 ± 0.82 ab
2.92 ± 0.47 abc
4.70 ± 0.75 a
4.61 ± 0.74 ab
12.24 ± 1.96 a
T27 Cd 100 ppm+ Mo 2.0 ppm (Foliar spray)
11.55 ± 1.21 a
23.52 2.82 a
5.96 ± 0.51 a
7.38 ± 0.79 a
6.18 ± 0.62 ab
19.52 ± 1.91 a
1.44 ± 0.11 a
2.53 ± 0.27 a
1.92 ± 0.18 ab
5.89 ± 0.55 a
4.52 ± 0.40 a
4.85 ± 0.52 a
4.26 ± 0.44 b
13.63 ± 1.36 a

CHAPTER # 3 RESULTS
56
Figure 3. 1: Effect of different treatments of Mo on growth of Ricinus communis plant grown
in soil contaminated with 25 ppm (X), 50 ppm (Y) and 100 ppm (Z) cadmium. In figure X,
the control C (without Cd and Mo) was compared with C1 (25 ppm Cd), C2 (50 ppm Cd) and
C3 (100 ppm Cd) while the treatments T1 –T9 were compared with C2. In figure Y, the
treatments T10 – T18 are compared with C2 while in figure Z, the treatments T19 –T27 are
compared with C3.
X
Y
Z

CHAPTER # 3 RESULTS
57
3.3.1.2 Biochemical variation in plants under various treatments of Mo and Cd
Variation in concentrations of free proline, total phenolics and photosynthetic pigments
(chlorophylls and carotenoids) in Ricinus communis plant under various treatments of Mo and
in Cd contaminated soil are given in table 3.5, table 3.6 and table 3.7. In table 3.5, the control
C (without Cd and Mo) is compared with C1 (25 ppm Cd), C2 (50 ppm Cd) and C3 (100
ppm) for the Cd effect on free proline, total phenolics, chlorophyll and carotenoids
concentration in the Ricinus communis plant. The treatments T1 –T9 are compared with the
C1 for the effect of Mo on the biochemical parameter under Cd stress in table 3.5. Increase in
concentration of free proline and total phenolics were recorded with increasing Cd
concentration in control soils (C3 > C2 > C1 > C). Highest significant increase in
concentration of total phenolics and free proline concentration in roots and leaves were
recorded in 1.00 and 2.00 ppm Mo foliar treatments (T8 and T9) respectively, as compared to
C1 (Table 3.5). Photosynthetic pigments were significantly increased by the treatments T8
and T9 as compared to C1.
Table 3.6 presents the effect of Mo treatments on the concentration of free proline, total
phenolics, chlorophyll and carotenoids in Ricinus communis plant in 50 ppm Cd
contaminated soil. Plants treated with 2 ppm Mo as seed soaking (T12) and foliar spray (T18)
most significantly increased concentration of proline and phenolics concentrations
(respectively) in roots as compared to C2. Leaves demonstrated highest concentration of
proline and phenolics with the treatment T18 (Table 3.6). Chlorophylls concentration in
leaves were most significantly high in the treatment T12 (2 ppm Mo foliar spray) as
compared to C2, while concentration of carotenoid in leaves was highly significant in T16 (1
ppm Mo foliar spray).
Effect of Mo on free proline, total phenolics, chlorophyll and carotenoids concentrations in
Ricinus communis plant grown in 100 ppm Cd contaminated soil is given in table 3.7. Highly
significant increase in concentration of proline in roots and leaves were recorded in plants
treated with 1.00 ppm Mo as seed soaking (T20) and foliar spray (T26) respectively. Foliar
treatments T25 (0.50 ppm Mo) and T27 (2.00 ppm Mo) highly increased concentration of
total phenolics in leaves and roots respectively (Table 3.7). Carotenoids concentration within
leaves were significantly increased (compared to C3) by the foliar treatments of Mo (T25,

CHAPTER # 3 RESULTS
58
T26 and T27) and highest significant increase in carotenoids was recorded in plants treated
with foliar spray of 2.00 ppm Mo (T27).
The overall effect of Mo treatments on free proline and total phenolics under different
concentrations of Cd in soil is given in figure 3.2. It was found that Mo treatments increased
the concentration of free proline and total phenolics as the soil Cd concentration increased
from 25 to 50 ppm and then decrease as the Cd concentration reaches 100 ppm.

CHAPTER # 3 RESULTS
59
Table 3. 5: Effect of various Mo treatments on concentrations of free proline, total phenolic compounds and photosynthetic pigments in Ricinus
communis plant grown in 25 ppm Cd contaminated soil. The table also shows effect of different Cd concentrations (25, 50 and 100 ppm) in soil on the
above parameters with in the plant. Note: ‗SD‘ denote ‗standard deviation‘ and the different letter in superscript present significant difference among the
values within a column.
Treatments Free proline (ppm) ± SD Total Phenolics (ppm) ± SD
Chlorophyll contents (ppm) ± SD Carotenoids (ppm) ± SD
Roots Leaves Roots leaves a b total chlorophyll C Control (without Cd and Mo) 28.80 ±
2.30 e 20.70 ± 1.66 e
26.45 ± 2.12 f
36.80 ± 2.94 e
36.61 ± 2.93 a
19.37 ± 1.55 a
55.98 ± 4.48 a
40.23 ± 3.22 ab
C1 Control (with Cd 25 ppm) 40.20 ± 4.82 de
37.08 ± 4.45 d
35.00 ± 4.20 ef
58.54 ± 7.02 d
6.99 ± 0.84 de
5.76 ± 0.69 cde
12.75 ± 1.53 de
29.00 ± 3.48 cde
C2 Control (with Cd 50 ppm) 43.54 ± 3.48 de
40.86 ± 3.27 d
39.00 ± 3.12 de
67.74 ± 5.42 cd
6.62 ± 0.53 de
5.32 ± 0.43 de
11.94 ± 0.96 de
21.28 ± 1.70 ef
C3 Control (with Cd 100 ppm) 48.98 ± 4.41 cd
54.00 ± 4.86 c
44.32 ± 3.99 bcde
69.12 ± 6.22 bcd
4.58 ± 0.41 e
3.91 ± 0.35 e
8.49 ± 0.76 e
15.63 ± 1.41 f
T1 Cd 25 ppm+ Mo 0.5 ppm (Seed soaking)
48.00 ± 3.84 cd
39.00 ± 3.12 d
44.97 ± 3.60 bcde
62.00 ± 4.96 d
7.89 ± 0.63 d
6.00 ± 0.48 cde
13.89 ± 1.11 d
28.45 ± 2.28 cde
T2 Cd 25 ppm+ Mo 1.0 ppm (Seed soaking)
52.00 ± 5.72 bcd
48.00 ± 5.28 cd
52.00 ± 5.72 abc
68.23 ± 7.51 bcd
8.18 ± 0.90 d
7.06 ± 0.78 cd
15.24 ± 1.68 d
30.20 ± 3.32 cd
T3 Cd 25 ppm+ Mo 2 ppm (Seed soaking)
64.07 ± 5.12 ab
49.23 ± 3.94 cd
55.00 ± 4.40 ab
76.35 ± 6.11 abcd
8.52 ± 0.68 cd
7.19 ± 0.57 cd
15.71 ± 1.26 d
34.20 ± 2.74 bc
T4 Cd 25 ppm+ Mo 0.5 ppm (Soil addition)
54.00 ± 4.32 abcd
45.23 ± 3.62 cd
38.41 ± 3.07 def
62.33 ± 4.99 d
7.12 ± 0.57 de
6.08 ± 0.49 cd
13.20 ± 1.06 de
24.30 ± 1.94 de
T5 Cd 25 ppm+ Mo 1.0 ppm (Soil addition)
65.00 ± 7.80 ab
43.00 ± 5.16 cd
40.71 ± 4.89 cde
63.71 ± 7.65 cd
7.45 ± 0.67 de
6.51 ± 0.59 cd
13.96 ± 1.26 d
26.03 ± 2.34 de
T6 Cd 25 ppm+ Mo 2 ppm (Soil addition)
67.00 ± 6.03 a
40.21 ± 3.22 d
34.73 ± 2.78 ef
61.41 ± 4.91 d
7.38 ± 0.59 de
6.15 ± 0.49 cd
13.53 ± 1.08 de
24.60 ± 1.97 de
T7 Cd 25 ppm+ Mo 0.5 ppm (Foliar spray)
47.00 ± 3.76 cd
55.00 ± 4.40 bc
48.24 ± 3.86 abcd
81.88 ± 6.55 abc
8.97 ± 0.72 cd
7.56 ± 0.60 c
16.53 ± 1.32 cd
36.25 ± 2.90 abc
T8 Cd 25 ppm+ Mo 1.0ppm (Foliar spray)
60.00 ± 6.00 abc
67.00 ± 5.36 ab
59.92 ± 4.79 a
91.77 ± 7.34 a
12.15 ± 0.97 b
10.37 ± 0.83 b
22.52 ± 1.80 b
41.48 ± 3.32 ab
T9 Cd 25 ppm+ Mo 2.0 ppm (Foliar spray)
67.70 ± 5.20 ab
67.98 ± 5.44 a
57.00 ± 4.56 a
86.23 ± 6.90 ab
11.45 ± 0.92 bc
10.00 ± 0.80 b
21.45 ± 1.72 bc
44.00 ± 3.52 a
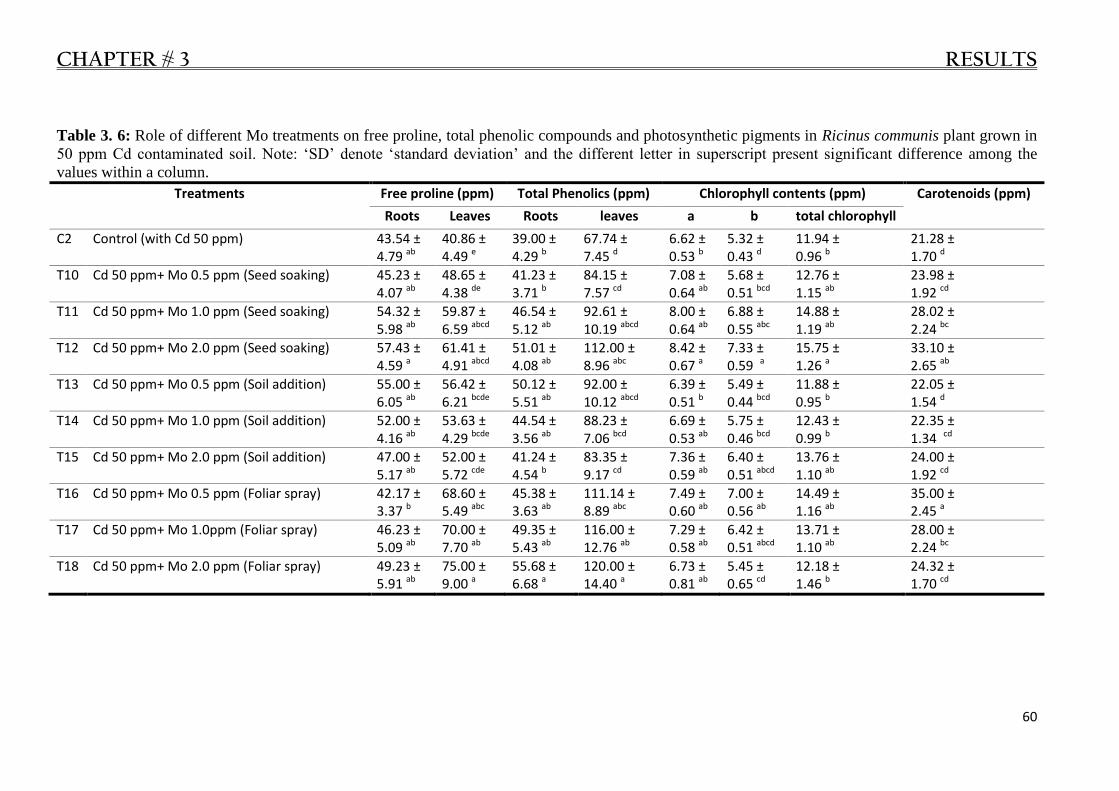
CHAPTER # 3 RESULTS
60
Table 3. 6: Role of different Mo treatments on free proline, total phenolic compounds and photosynthetic pigments in Ricinus communis plant grown in
50 ppm Cd contaminated soil. Note: ‗SD‘ denote ‗standard deviation‘ and the different letter in superscript present significant difference among the
values within a column.
Treatments Free proline (ppm) Total Phenolics (ppm) Chlorophyll contents (ppm) Carotenoids (ppm)
Roots Leaves Roots leaves a b total chlorophyll
C2 Control (with Cd 50 ppm) 43.54 ± 4.79 ab
40.86 ± 4.49 e
39.00 ± 4.29 b
67.74 ± 7.45 d
6.62 ± 0.53 b
5.32 ± 0.43 d
11.94 ± 0.96 b
21.28 ± 1.70 d
T10 Cd 50 ppm+ Mo 0.5 ppm (Seed soaking) 45.23 ± 4.07 ab
48.65 ± 4.38 de
41.23 ± 3.71 b
84.15 ± 7.57 cd
7.08 ± 0.64 ab
5.68 ± 0.51 bcd
12.76 ± 1.15 ab
23.98 ± 1.92 cd
T11 Cd 50 ppm+ Mo 1.0 ppm (Seed soaking) 54.32 ± 5.98 ab
59.87 ± 6.59 abcd
46.54 ± 5.12 ab
92.61 ± 10.19 abcd
8.00 ± 0.64 ab
6.88 ± 0.55 abc
14.88 ± 1.19 ab
28.02 ± 2.24 bc
T12 Cd 50 ppm+ Mo 2.0 ppm (Seed soaking) 57.43 ± 4.59 a
61.41 ± 4.91 abcd
51.01 ± 4.08 ab
112.00 ± 8.96 abc
8.42 ± 0.67 a
7.33 ± 0.59 a
15.75 ± 1.26 a
33.10 ± 2.65 ab
T13 Cd 50 ppm+ Mo 0.5 ppm (Soil addition) 55.00 ± 6.05 ab
56.42 ± 6.21 bcde
50.12 ± 5.51 ab
92.00 ± 10.12 abcd
6.39 ± 0.51 b
5.49 ± 0.44 bcd
11.88 ± 0.95 b
22.05 ± 1.54 d
T14 Cd 50 ppm+ Mo 1.0 ppm (Soil addition) 52.00 ± 4.16 ab
53.63 ± 4.29 bcde
44.54 ± 3.56 ab
88.23 ± 7.06 bcd
6.69 ± 0.53 ab
5.75 ± 0.46 bcd
12.43 ± 0.99 b
22.35 ± 1.34 cd
T15 Cd 50 ppm+ Mo 2.0 ppm (Soil addition) 47.00 ± 5.17 ab
52.00 ± 5.72 cde
41.24 ± 4.54 b
83.35 ± 9.17 cd
7.36 ± 0.59 ab
6.40 ± 0.51 abcd
13.76 ± 1.10 ab
24.00 ± 1.92 cd
T16 Cd 50 ppm+ Mo 0.5 ppm (Foliar spray) 42.17 ± 3.37 b
68.60 ± 5.49 abc
45.38 ± 3.63 ab
111.14 ± 8.89 abc
7.49 ± 0.60 ab
7.00 ± 0.56 ab
14.49 ± 1.16 ab
35.00 ± 2.45 a
T17 Cd 50 ppm+ Mo 1.0ppm (Foliar spray) 46.23 ± 5.09 ab
70.00 ± 7.70 ab
49.35 ± 5.43 ab
116.00 ± 12.76 ab
7.29 ± 0.58 ab
6.42 ± 0.51 abcd
13.71 ± 1.10 ab
28.00 ± 2.24 bc
T18 Cd 50 ppm+ Mo 2.0 ppm (Foliar spray) 49.23 ± 5.91 ab
75.00 ± 9.00 a
55.68 ± 6.68 a
120.00 ± 14.40 a
6.73 ± 0.81 ab
5.45 ± 0.65 cd
12.18 ± 1.46 b
24.32 ± 1.70 cd

CHAPTER # 3 RESULTS
61
Table 3. 7: Effect of Mo treatments on free proline, total phenolics and photosynthetic pigments in Ricinus communis plant grown in 100 ppm Cd
contaminated soil. Note: ‗SD‘ denote ‗standard deviation‘ and the different letter in superscript present significant difference among the values within a
column.
Treatments Free proline (ppm) Total Phenolics (ppm) Chlorophyll contents (ppm) Carotenoids (ppm)
Roots Leaves Roots leaves a b total chlorophyll
C3 Control (with Cd 100 ppm) 35.00 ± 3.85 c
30.25 ± 3.33 d
33.25 ± 3.66 c
67.74 ± 7.45 cd
27.30 ± 2.18 abc
20.22 ± 1.62 ab
47.52 ± 3.80 abc
42.20 ± 3.38 d
T19 Cd 100 ppm+ Mo 0.5 ppm (Seed soaking) 54.94 ± 4.94 abc
34.16 ± 3.07 cd
57.00 ± 5.13 ab
85.00 ± 7.65 abcd
28.46 ± 2.56 ab
23.22 ± 2.09 a
51.68 ± 4.65 ab
45.12 ± 3.61 cd
T20 Cd 100 ppm+ Mo 1.0 ppm (Seed soaking) 71.25 ± 7.84 a
49.43 ± 5.44 ab
63.00 ± 6.93 ab
91.05 ± 10.02 ab
25.37 ± 2.03 bc
21.20 ± 1.70 ab
46.57 ± 3.73 abc
47.02 ± 3.76 cd
T21 Cd 100 ppm+ Mo 2 ppm (Seed soaking) 67.00 ± 5.36 ab
36.24 ± 2.90 cd
61.25 ± 4.90 ab
75.00 ± 6.00 bcd
20.84 ± 1.67 c
16.82 ± 1.35 b
37.66 ± 3.01 c
50.23 ± 4.02 cd
T22 Cd 100 ppm+ Mo 0.5 ppm (Soil addition) 47.49 ± 5.22 bc
43.59 ± 4.79 abc
47.57 ± 5.23 bc
70.35 ± 7.74 bcd
24.75 ± 1.98 bc
18.06 ± 1.44 ab
42.81 ± 3.42 bc
46.31 ± 3.24 cd
T23 Cd 100 ppm+ Mo 1.0 ppm (Soil addition) 57.08 ± 4.57 ab
44.53 ± 3.56 abc
51.73 ± 4.14 ab
73.00 ± 5.84 bcd
30.11 ± 2.41 ab
21.17 ± 1.69 ab
51.28 ± 4.10 ab
53.02 ± 3.18 bcd
T24 Cd 100 ppm+ Mo 2 ppm (Soil addition) 67.00 ± 7.37 ab
39.97 ± 4.40 bcd
65.00 ± 7.15 a
64.48 ± 7.09 d
30.88 ± 2.47 ab
21.71 ± 1.74 ab
52.59 ± 4.21 ab
67.42 ± 5.39 bc
T25 Cd 100 ppm+ Mo 0.5 ppm (Foliar spray) 51.22 ± 4.10 abc
45.14 ± 3.61 abc
57.00 ± 4.56 ab
101.85 ± 8.15 a
28.09 ± 2.25 abc
19.88 ± 1.59 ab
47.97 ± 3.84 abc
58.03 ± 4.06 b
T26 Cd 100 ppm+ Mo 1.0ppm (Foliar spray) 57.99 ± 6.38 ab
51.24 ± 5.64 a
64.00 ± 7.04 a
96.36 ± 10.60 a
31.71 ± 2.54 a
22.30 ± 1.78 a
54.01 ± 4.32 a
81.89 ± 6.55 a
T27 Cd 100 ppm+ Mo 2.0 ppm (Foliar spray) 69.00 ± 8.28 ab
40.56 ± 4.87 abc
66.00 ± 7.92 a
85.00 ± 10.20 abc
33.52 ± 4.02 a
23.57 ± 2.83 a
57.09 ± 6.85 a
88.61 ± 6.20 a

CHAPTER # 3 RESULTS
62
Figure 3. 2: Overall effect of the molybdenum treatments on total phenolic and free proline
concentration in plants grown under different concentration of cadmium in soil.
b
c ab
bc
a
a
ab
ab
0
10
20
30
40
50
60
70
80
90
Free Proline Total phenolics
Co
nce
ntr
ario
n (
pp
m)
control with only Cd
25 ppm Cd in soil + Mo
50 ppm Cd in soil + Mo
100 ppm Cd in soil + Mo

CHAPTER # 3 RESULTS
63
3.3.1.3 Cadmium concentration and accumulation in different plant parts under various
treatments of molybdenum.
Variation in concentration, accumulation, translocation and bioconcentration of Cd in
different parts of Ricinus communis plant is given in tables (3.8, 3.9 and 3.10). Table 3.8
demonstrate the effect of different concentration of cadmium in soil on uptake and
accumulation of cadmium in plant tissues. A gradual increase was noted in plant Cd
concentration with increasing concentration of Cd in soils. The table 3.8 also shows the effect
of molybdenum treatments (T1-T9) on plant Cd uptake from 25 ppm Cd contaminated soil as
compare to C1 (25 ppm Cd, without Mo). The treatment T8 (1 ppm Mo foliar spray) most
significantly increased Cd concentration in roots. Stem and leaves of the plant demonstrated
highest significant increase in Cd concentration with 2 ppm Mo foliar spray (T9) as given in
table 3.8. It was found that 1.00 and 2.00 ppm Mo (seed soaking and foliar spray)
significantly increased Cd accumulation in the plant tissues. The treatment T9 showed
highest significant Cd accumulation in root, leaf and entire plant while the stem demonstrated
highest Cd accumulation in the treatment T8 (1 ppm Mo foliar spray) as shown in table 3.8.
The Mo treated plants (T1 –T9) showed increase in Cd bioconcentration as compared to C1.
Effect of Mo treatments in combination with 50 ppm Cd in soil (T10-18) on Cd uptake in
Ricinus communis is presented in table 3.9. Cadmium concentration in different parts of the
plant increased significantly in treatments T13 (0.5 ppm Mo added to soil) and T18 (2.00
ppm Mo foliar spray) as compared to C2 (50 ppm Cd in soil, without Mo treatments). Roots
accumulated Cd most significantly high in plants sprayed with 0.5 ppm Mo (T16) while stem
and leaves showed highly significant accumulated Cd in plants treated with 2 ppm Mo foliar
spray (T18). Cadmium translocation into leaves increased significantly with 0.5 ppm Mo as
seed soaking (T10). Bioconcentration of Cd was significantly increased by the treatments
T13 (0.5 ppm Mo into soil) and T18 (2 ppm Mo foliar spray) as compared to C2.
Variations in Cd uptake in plant tissues with Mo treatments (T19-T27) under 100 ppm Cd in
soil are given in table 3.10. Application of 0.5 ppm Mo (seed soaking and foliar spray)
significantly increased Cd concentration in roots of the plant. The same concentration (0.5
ppm) of Mo as soil addition significantly increased Cd concentration in stem (Table 3.10).

CHAPTER # 3 RESULTS
64
Foliar spray of 2.00 ppm Mo highly increased Cd concentration in leaves of the plant.
Highest significant accumulation of Cd in different parts of the plant were recorded in the
treatment T27 (2.00 ppm Mo foliar spray). Translocation and bioconcentration of Cd were
highly significant in plants sprayed with 2.00 ppm Mo (T27) as given in table 3.10.
Figure 3.3 present the overall effect of Mo treatments on Cd accumulation and
bioconcentration in Ricinus communis plant under varied Cd concentration in soil. The Mo
treatment showed an overall increase in plant Cd accumulation while decrease was recorded
in Cd bioconcentration with the increasing Cd concentration in soil.

CHAPTER # 3 RESULTS
65
Table 3. 8: Role of different treatments of Mo on Cd contents in Ricinus communis plant grown in 25 ppm Cd contaminated soil. Note: ―R-S‖ denote ―
Roots into Stem‖, ―R-L‖ denote ―Roots into Leaves‖, ―SD‖ represent ―Standard Deviation‖, while different letter in superscript represent significant
difference among the values in a column.
Treatments Cd concentration (ppm) Cd accumulation (mg/DW) % Cd accumulation Cd translocation
factor
Cd-Bioconcentration factor
Roots Stem Leaves Roots Stem Leaves Entire plant Roots Stem Leaves R-S R-L
C1 Control (with Cd 25 ppm)
137.00 ± 16.44 b
58.07 ± 6.38 c
78.00 ± 10.14 b
0.11 ± 0.02 e
0.10 ± 0.02 d
0.15 ± 0.03 c
0.35 ± 0.07 e
30.80 27.19 42.01 0.42 ± 0.05 a
0.57 ± 0.01 a
3.25 ± 0.41 c
C2 Control (with Cd 50 ppm)
219.05 ± 26.28 a
79.00 ± 8.69 b
87.00 ± 11.31 b
0.14 ± 0.03 de
0.09 ± 0.02 d
0.14 ± 0.05 c
0.38 ± 0.08 e
38.41 25.07 36.52 0.36 ± 0.03 c
0.40 ± 0.03 e
2.19 ± 0.25 c
C3 Control (with Cd 100 ppm)
268.70 ± 32.16 a
114.00 ± 12.54 a
125.00 ± 16.25 a
0.15 ± 0.05 de
0.12 ± 0.02 d
0.13 ± 0.01 c
0.40 ± 0.08 de
37.36 29.45 33.19 0.43 ± 0.02 a
0.47 ± 0.02 b
1.51 ± 0.11 d
T1 Cd 25 ppm+ Mo 0.5 ppm (Seed soaking)
195.60 ± 23.40 ab
65.23 ± 7.18 b
85.23 ± 8.52 b
0.25 ± 0.02 bcde
0.14 ± 0.03 cd
0.23 ± 0.04 abc
0.62 ± 0.12 bcde
39.80 22.52 37.69 0.35 ± 0.04 d
0.44 ± 0.01 d
4.04 ± 0.48 bc
T2 Cd 25 ppm+ Mo 1.0 ppm (Seed soaking)
204.09 ± 24.48 ab
69.00 ± 7.59 b
89.28 ± 8.92 b
0.31 ± 0.06 bcd
0.19 ± 0.04 abcd
0.31 ± 0.06 ab
0.81 0.16 abcd
38.42 23.16 38.42 0.34 ± 0.05 d
0.44 ± 0.01 d
4.19 ± 0.47 bc
T3 Cd 25 ppm+ Mo 2 ppm (Seed soaking)
214.54 ± 25.68 ab
81.10 ± 9.03 b
98.87 ± 9.89 ab
0.35 ± 0.07 abc
0.23 ± 0.04 abc
0.32 ± 0.05 ab
0.90 0.17 abc
39.02 25.31 35.67 0.38 ± 0.03 b
0.46 ± 0.01 bc
4.70 ± 0.52 abc
T4 Cd 25 ppm+ Mo 0.5 ppm (Soil addition)
208.68 ± 24.96 ab
70.00 ± 7.70 b
91.00 ± 8.19 b
0.21 ± 0.04 cde
0.13 ± 0.03 cd
0.20 ± 0.03 bc
0.53 0.10 cde
38.24 25.11 36.64 0.34 ± 0.02 d
0.44 ± 0.03 cd
4.23 ± 0.47 bc
T5 Cd 25 ppm+ Mo 1.0 ppm (Soil addition)
200.35 ± 24.00 ab
67.00 ± 7.37 b
84.56 ± 7.61 b
0.25 ± 0.05 bcde
0.14 ± 0.03 bcd
0.21 ± 0.02 bc
0.60 0.11 bcde
41.62 24.16 34.22 0.33 ± 0.03 d
0.42 ± 0.02 d
4.11 ± 0.42 bc
T6 Cd 25 ppm+ Mo 2 ppm (Soil addition)
196.63 ± 23.52 ab
69.42 ± 7.64 b
83.24 ± 7.49 b
0.29 ± 0.06 bcd
0.14 ± 0.03 cd
0.24 ± 0.04 abc
0.67 0.12 abcde
43.32 20.69 36.00 0.35 ± 0.06 c
0.43 ± 0.01 d
4.21 ± 0.45 bc
T7 Cd 25 ppm+ Mo 0.5 ppm (Foliar spray)
245.00 ± 29.40 a
67.89 ± 7.47 b
82.43 ± 10.03 b
0.32 ± 0.08 abcd
0.17 ± 0.03 abcd
0.25 ± 0.05 abc
0.73 0.15 abcde
43.48 22.80 33.72 0.28 ± 0.04 f
0.34 ± 0.02 f
4.33 ± 0.51 bc
T8 Cd 25 ppm+ Mo 1.0ppm (Foliar spray)
267.86 ± 32.04 a
70.45 ± 7.75 b
100.20 ± 12.22 ab
0.39 ± 0.08 ab
0.24 ± 0.05 a
0.34 ± 0.07 ab
0.97 0.19 ab
40.19 25.05 34.76 0.26 ± 0.03 g
0.38 ± 0.03 e
4.69 ± 0.57 abc
T9 Cd 25 ppm+ Mo 2.0 ppm (Foliar spray)
256.00 ± 30.72 a
82.23 ± 8.94 b
102.12 ± 12.46 a
0.49 ± 0.11 a
0.24 ± 0.05 ab
0.35 ± 0.08 a
1.08 0.24 a
45.42 22.24 32.34 0.32 ± 0.02 e
0.40 ± 0.02 e
5.21 ± 0.62 ab

CHAPTER # 3 RESULTS
66
Table 3. 9: Effect of Mo treatments on Cd contents in Ricinus communis plant grown in 50 ppm Cd contaminated soil. Note: ―R-S‖ denote ― Roots into
Stem‖, ―R-L‖ denote ―Roots into Leaves‖, ―SD‖ represent ―Standard Deviation‖, while different letter in superscript represent significant difference among
the values in a column.
Treatments Cd concentration (ppm) Cd accumulation (mg/DW) % Cd accumulation Cd translocation
factor
Cd-Bioconcent
ration factor Roots Stem Leaves Roots Stem Leaves Entire plant Roots Stem Leaves R-S R-L
C2 Control (with Cd 50 ppm)
219.07 ± 19.71 b
79.00 ± 9.48 b
87.00 ± 11.31 d
0.14 ± 0.03 b
0.09 ± 0.02 b
0.14 ± 0.03 b
0.38 ± 0.09 b
38.46 25.04 36.49 0.36 ± 0.05 cde
0.40 ± 0.02 e
2.19 ± 0.25 b
T10 Cd 50 ppm+ Mo 0.5 ppm (Seed soaking)
228.47 ± 20.52 ab
88.35 ± 10.60 b
137.07 ± 17.81 abc
0.26 ± 0.05 ab
0.17 ± 0.04 ab
0.29 ± 0.06 ab
0.72 ± 0.15 ab
35.91 23.44 40.66 0.39 ± 0.03 abc
0.60 ± 0.03 a
2.78 ± 0.31 ab
T11 Cd 50 ppm+ Mo 1.0 ppm (Seed soaking)
232.00 ± 20.88 ab
89.23 ± 10.71 ab
125.25 ± 16.25 abcd
0.29 ± 0.06 ab
0.23 ± 0.05 ab
0.36 ± 0.09 a
0.88 ± 0.20 ab
33.13 25.83 41.04 0.38 ± 0.04 bcd
0.54 ± 0.04 bc
2.63 ± 0.30 ab
T12 Cd 50 ppm+ Mo 2 ppm (Seed soaking)
238.75 ± 21.42 ab
95.00 ± 11.40 ab
98.45 ± 12.74 bcd
0.33 ± 0.08 a
0.22 ± 0.06 ab
0.31 ± 0.08 ab
0.87 ± 0.22 ab
38.41 25.72 35.88 0.40 ± 0.06 ab
0.41 ± 0.05 e
2.50 ± 0.28 ab
T13 Cd 50 ppm+ Mo 0.5 ppm (Soil addition)
289.05 ± 26.01 a
121.00 ± 14.52 a
142.35 ± 18.46 ab
0.25 ± 0.05 ab
0.15 ± 0.03 ab
0.24 ± 0.06 ab
0.64 ± 0.15 ab
39.56 22.79 37.65 0.42 ± 0.03 a
0.49 ± 0.02 cd
3.39 ± 0.38 a
T14 Cd 50 ppm+ Mo 1.0 ppm (Soil addition)
246.63 ± 22.14 ab
86.92 ± 10.43 b
128.12 ± 16.64 abcd
0.27 ± 0.06 ab
0.17 ± 0.04 ab
0.26 ± 0.07 ab
0.71 ± 0.17 ab
39.02 23.83 37.15 0.35 ± 0.02 de
0.52 ± 0.02 c
2.77 ± 0.31 ab
T15 Cd 50 ppm+ Mo 2 ppm (Soil addition)
229.08 ± 20.61 ab
83.25 ± 9.99 b
92.20 ± 11.99 cd
0.28 ± 0.06 ab
0.18 ± 0.04 ab
0.29 ± 0.07 ab
0.75 ± 0.17 ab
37.62 23.45 38.93 0.36 ± 0.05 cd
0.40 ± 0.03 e
2.30 ± 0.26 b
T16 Cd 50 ppm+ Mo 0.5 ppm (Foliar spray)
248.12 ± 22.32 ab
79.23 ± 9.51 b
112.00 ± 14.56 bcd
0.36 ± 0.08 a
0.19 ± 0.05 ab
0.30 ± 0.08 ab
0.84 ± 0.21 ab
42.93 20.94 36.13 0.32 ± 0.06 f
0.45 ± 0.04 de
2.63 ± 0.29 ab
T17 Cd 50 ppm+ Mo 1.0ppm (Foliar spray)
257.58 ± 23.13 ab
85.00 ± 10.20 b
123.98 ± 16.12 abcd
0.34 ± 0.08 a
0.21 ± 0.06 ab
0.31 ± 0.09 ab
0.86 ± 0.23 ab
39.63 24.63 35.74 0.33 ± 0.03 ef
0.48 ± 0.03 cd
2.73 ± 0.30 ab
T18 Cd 50 ppm+ Mo 2.0 ppm (Foliar spray)
287.21 ± 25.83 a
108.00 ± 12.96 ab
168.00 ± 21.84 a
0.32 ± 0.07 ab
0.27 ± 0.07 a
0.36 ± 0.08 a
0.93 ± 0.22 a
34.81 29.29 35.91 0.38 ± 0.01 bcd
0.58 ± 0.02 ab
3.30 ± 0.37 a

CHAPTER # 3 RESULTS
67
Table 3. 10: Effect of Mo treatments on Cd contents in Ricinus communis plant grown in 100 ppm Cd contaminated soil. Note: ―R-S‖ denote ― Roots into
Stem‖, ―R-L‖ denote ―Roots into Leaves‖, ―SD‖ represent ―Standard Deviation‖, while different letter in superscript represent significant difference among
the values in a column.
Treatments Cd concentration (ppm) Cd accumulation (mg/DW) % Cd accumulation Cd translocation
factor
Cd-Bioconcentra
tion factor
Roots Stem Leaves Roots Leaves Entire plant Roots Stem Leaves R-S R-L
C3 Control (with Cd 100 ppm)
268.70 ± 32.16 c
114.00 ± 12.54 c
125.00 ± 16.25 e
0.15 ± 0.05 b
0.12 ± 0.02 c
0.13 ± 0.01 b
0.40 ± 0.08 b
37.36 29.45 33.19 0.43 ± 0.02 d
0.47 ± 0.02 g
1.51 ± 0.11 c
T19 Cd 100 ppm+ Mo 0.5 ppm (Seed soaking)
331.05 ± 19.86 a
142.90 ± 10.00 ab
190.75 ± 16.21 bcd
0.27 ± 0.04 ab
0.23 ± 0.04 abc
0.34 ± 0.06 ab
0.83 ± 0.14 ab
31.96 27.29 40.75 0.43 ± 0.02 d
0.58 ± 0.02 ef
2.00 ± 0.15 ab
T20 Cd 100 ppm+ Mo 1.0 ppm (Seed soaking)
302.45 ± 18.12 abc
144.33 ± 10.10 ab
172.89 ± 14.70 bcd
0.30 ± 0.05 ab
0.31 ± 0.06 ab
0.44 ± 0.09 a
1.05 ± 0.20 a
28.92 29.09 41.99 0.48 ± 0.01 c
0.57 ± 0.01 ef
1.85 ± 0.14 abc
T21 Cd 100 ppm+ Mo 2 ppm (Seed soaking)
274.51 ± 16.44 c
153.66 ± 10.76 ab
167.86 ± 14.27 cde
0.36 ± 0.07 a
0.30 ± 0.06 ab
0.47 ± 0.10 a
1.12 ± 0.24 a
31.94 26.71 41.35 0.56 ± 0.03 a
0.61 ± 0.02 e
1.86 ± 0.14 abc
T22 Cd 100 ppm+ Mo 0.5 ppm (Soil addition)
326.36 ± 19.56 ab
164.98 ± 11.55 a
215.63 ± 18.33 ab
0.24 ± 0.04 ab
0.18 ± 0.03 bc
0.29 ± 0.06 ab
0.71 ± 0.14 ab
33.65 25.99 40.36 0.51 ± 0.01 b
0.66 ± 0.04 d
2.23 ± 0.16 a
T23 Cd 100 ppm+ Mo 1.0 ppm (Soil addition)
295.28 ± 17.70 abc
152.50 ± 10.68 ab
210.29 ± 17.87 abc
0.27 ± 0.05 ab
0.25 ± 0.05 abc
0.36 ± 0.08 ab
0.88 ± 0.18 ab
31.23 27.95 40.81 0.52 ± 0.02 b
0.71 ± 0.02 bc
2.07 ± 0.15 ab
T24 Cd 100 ppm+ Mo 2 ppm (Soil addition)
287.58 ± 17.25 abc
134.65 ± 9.43 bc
152.93 ± 13.00 de
0.32 ± 0.06 a
0.24 ± 0.04 abc
0.41 ± 0.08 a
0.94 ± 0.11 a
33.12 24.50 42.38 0.47 ± 0.01 c
0.53 ± 0.03 f
1.74 ± 0.13 bc
T25 Cd 100 ppm+ Mo 0.5 ppm (Foliar spray)
275.00 ± 16.50 c
128.15 ± 8.97 bc
185.77 ± 15.79 bcd
0.33 ± 0.07 a
0.23 ± 0.05 abc
0.42 ± 0.10 a
0.98 ± 0.22 a
33.63 23.96 42.41 0.47 ± 0.03 c
0.67 ± 0.02 cd
1.86 ± 0.14 abc
T26 Cd 100 ppm+ Mo 1.0ppm (Foliar spray)
279.72 ± 16.74 bc
133.26 ± 9.33 bc
205.64 ± 17.48 abc
0.31 ± 0.07 ab
0.27 ± 0.06 ab
0.41 ± 0.10 a
0.99 ± 0.23 a
30.87 27.75 41.38 0.48 ± 0.03 c
0.74 ± 0.04 b
1.92 ± 0.14 ab
T27 Cd 100 ppm+ Mo 2.0 ppm (Foliar spray)
290.43 ± 17.40 abc
162.81 ± 10.42 a
242.17 ± 20.58 a
0.32 ± 0.05 a
0.37 ± 0.06 a
0.51 ± 0.07 a
1.20 ± 0.18 a
26.67 30.08 42.50 0.51 ± 0.02 b
0.83 ± 0.03 a
2.25 ± 0.15 a
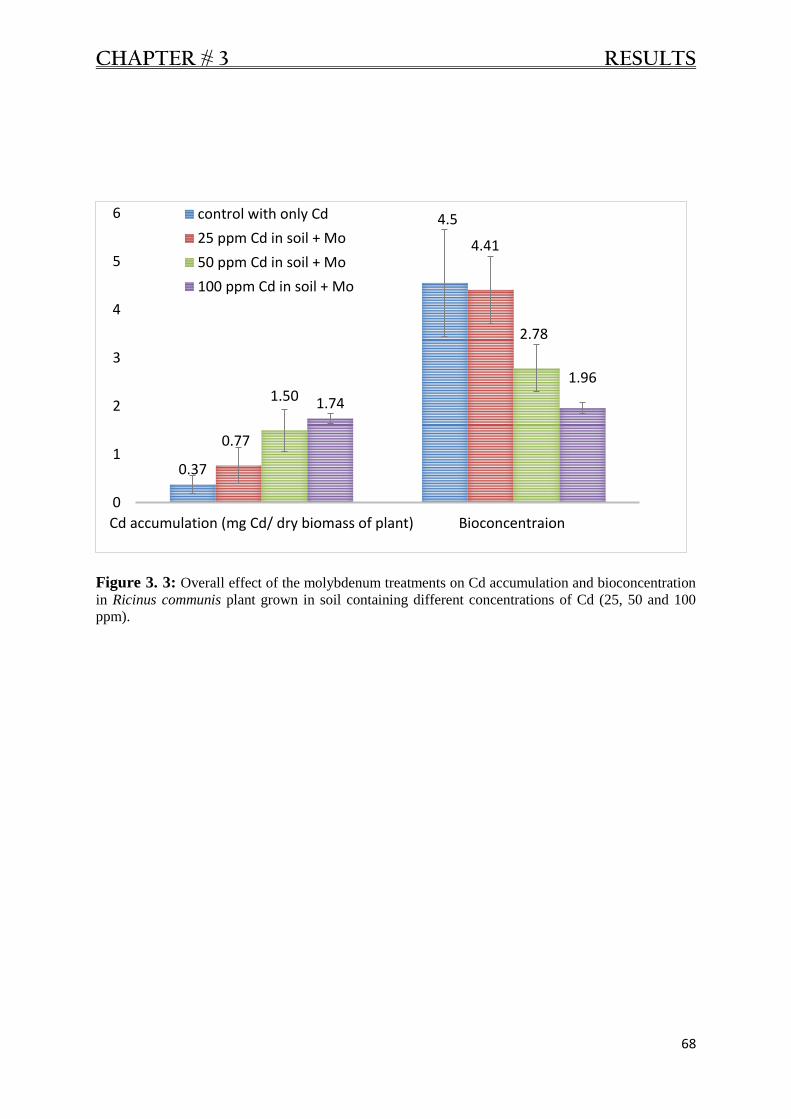
CHAPTER # 3 RESULTS
68
Figure 3. 3: Overall effect of the molybdenum treatments on Cd accumulation and bioconcentration
in Ricinus communis plant grown in soil containing different concentrations of Cd (25, 50 and 100
ppm).
0.37
4.5
0.77
4.41
1.50
2.78
1.74
1.96
0
1
2
3
4
5
6
Cd accumulation (mg Cd/ dry biomass of plant) Bioconcentraion
control with only Cd
25 ppm Cd in soil + Mo
50 ppm Cd in soil + Mo
100 ppm Cd in soil + Mo

CHAPTER # 3 RESULTS
69
3.3.1.4 Correlation among different parameters in Ricinus communis plant
Tables 3.11 - 3.19 present correlations among different parameters in roots, stem and leaves
of Ricinus communis plant grown in 25, 50 and 100 ppm Cd contaminated soil, under various
treatments of Mo (0.5, 1.00 and 2.00 ppm). Total phenolics concentration showed
significantly positive correlations with Cd accumulation in plant roots (table 3.11, 3.12 and
3.13) and leaves (table 3.17, 3.18 and 3.19). Proline concentrations in roots (tables 3.11, 3.12)
and leaves (tables 3.17, 3.18) also demonstrated significantly positive correlations with Cd
accumulation in plants grown in 25 and 50 ppm Cd contaminated soil respectively. Proline
concentration showed strong positive correlation with Cd accumulation in roots in 25, 50 and
100 ppm Cd contaminated soil (Tables 3.11, 3.12 and 3.13). Photosynthetic pigments
(chlorophyll and carotenoids) showed strong correlation with total phenolics concentration
within leaves of the plant at all the Cd concentrations (25, 50 and 100 ppm in soil) as shown
in table 3.17, 3.18 and 3.19. It was found that dry weight in roots, stem and leaves
demonstrated significantly positive correlation with Cd accumulation (tables 3.11 – 3.19).

CHAPTER # 3 RESULTS
70
Table 3. 11: Correlations among different parameter in roots of Ricinus communis plant grown in 25 ppm Cd contaminated soil.
Le
ng
th
Fre
sh
we
igh
t
Dry
we
igh
t
To
tal
wa
ter
co
nte
nt
Cd
co
nc
en
tra
tion
Cd
ac
cu
mu
lat
ion
Fre
e
Pro
line
To
tal
Ph
en
olic
s
Length (cm) Pearson Correlation
1 0.758** 0.731
** 0.699
** -0.117 0.646
* 0.340 0.596
*
Sig. (1-tailed) 0.002 0.003 0.006 0.358 0.012 0.140 0.021
Fresh weight (g) Pearson Correlation
0.758** 1 0.896
** 0.964
** -0.114 0.777
** 0.637
* 0.640
*
Sig. (1-tailed) 0.002 0.000 0.000 0.362 0.001 0.013 0.013
Dry weight (g) Pearson Correlation
0.731** 0.896
** 1 0.744
** 0.056 0.939
** 0.721
** 0.644
*
Sig. (1-tailed) 0.003 0.000 0.003 0.431 0.000 0.004 0.012
Total water content
(g)
Pearson Correlation 0.699
** 0.964
** 0.744
** 1 - 0.205 0.602
* 0.624
* 0.694
*
Sig. (1-tailed) 0.006 0.000 0.003 0.262 0.019 0.020 0.016
Cd concentration
(ppm)
Pearson Correlation -0.117 -0.114 0.056 -0.205 1 0.377 0.668
** 0.793
**
Sig. (1-tailed) 0.358 0.362 0.431 0.262 0.113 0.009 0.001
Cd accumulation
(mg/DW)
Pearson Correlation 0.646
* 0.777
** 0.939
** 0.602
* 0.377 1 0.668
** 0.793
**
Sig. (1-tailed) 0.012 0.001 0.000 0.019 0.113 0.009 0.001
Free Proline (ppm) Pearson Correlation
0.340 0.637* 0.721
** 0.624
* 0.093 0.668
** 1 0.342
Sig. (1-tailed) 0.140 0.013 0.004 0.020 0.387 0.009 0.138
Total Phenolics
(ppm)
Pearson Correlation 0.596
* 0.640
* 0.644
* 0.574
* 0.619
* 0.793
** 0.342 1
Sig. (1-tailed) 0.021 0.013 0.012 0.026 0.016 0.001 0.138
**. Correlation is significant at the 0.01 level (1-tailed). *. Correlation is significant at the 0.05 level (1-tailed).

CHAPTER # 3 RESULTS
71
Table 3. 12: Correlations among different parameter in roots of Ricinus communis plant grown in 50 ppm Cd contaminated soil.
Le
ng
th
Fre
sh
we
igh
t
Dry
we
igh
t
To
tal
wa
ter
co
nte
nt
Cd
co
nc
en
t-
ratio
n
Cd
ac
cu
mu
l-
atio
n
Fre
e
Pro
line
To
tal
Ph
en
olic
s
Length Pearson Correlation 1 0.695* 0.581
* 0.661
* -0.064 0.508 0.124 0.271
Sig. (1-tailed) 0.013 0.039 0.019 0.430 0.067 0.367 0.224
Fresh weight Pearson Correlation 0.695* 1 0.717
** 0.982
** -0.021 0.632
* 0.610
* 0.410
Sig. (1-tailed) 0.013 0.010 0.000 0.477 0.025 0.030 0.119
Dry weight Pearson Correlation 0.581* 0.717
** 1 0.573
* -0.026 0.915
** 0.094 0.322
Sig. (1-tailed) 0.039 0.010 0.042 0.472 0.000 0.398 0.182
Total water content Pearson Correlation 0.661* 0.982
** 0.573
* 1 -0.018 0.497 0.692
* 0.396
Sig. (1-tailed) 0.019 0.000 0.042 0.480 0.072 0.013 0.129
Cd concentration Pearson Correlation -0.064 -0.021 -0.026 -0.018 1 0.373 0.289 0.809**
Sig. (1-tailed) 0.430 0.477 0.472 0.480 0.144 0.209 0.002
Cd accumulation Pearson Correlation 0.508 0.632* 0.915
** 0.497 0.373 1 0.694* 0.807*
*
Sig. (1-tailed) 0.067 0.025 0.000 0.072 0.144 0.013 0.026
Free Proline Pearson Correlation 0.124 0.610* 0.094 0.692
* 0.289 0.694* 1 0.522
Sig. (1-tailed) 0.367 0.030 0.398 0.013 0.209 0.013 0.061
Total Phenolics Pearson Correlation 0.271 0.410 0.322 0.396 0.809** 0.807
** 0.522 1
Sig. (1-tailed) 0.224 0.119 0.182 0.129 0.002 0.026 0.061
**. Correlation is significant at the 0.01 level (1-tailed). *. Correlation is significant at the 0.05 level (1-tailed).

CHAPTER # 3 RESULTS
72
Table 3. 13: Correlations among different parameter in roots of Ricinus communis plant grown in 100 ppm Cd contaminated soil.
Le
ng
th
Fre
sh
we
igh
t
Dry
we
igh
t
To
tal
wa
ter
co
nte
nt
Cd
co
nc
en
tratio
n
Cd
ac
cu
mu
lat
ion
Fre
e
Pro
line
To
tal
ph
en
olic
s
Length Pearson Correlation 1 0.799** 0.794** 0.756** -0.354 0.751** 0.444 0.246
Sig. (1-tailed) 0.003 0.003 0.006 0.158 0.006 0.099 0.356
Fresh weight Pearson Correlation 0.799** 1 0.824** 0.989** -0.113 0.665* 0.634* 0.201
Sig. (1-tailed) 0.003 0.002 0.000 0.378 0.019 0.025 0.289
Dry weight Pearson Correlation 0.794** 0.824** 1 0.733** -0.375 0.763* 0.325 0.203
Sig. (1-tailed) 0.003 0.002 0.008 0.143 0.012 0.180 0.287
Total water content Pearson Correlation 0.756** 0.989** 0.733** 1 -0.040 0.792** 0.677* 0.189
Sig. (1-tailed) 0.006 0.000 0.008 0.457 0.003 0.016 0.300
Cd concentration Pearson Correlation -0.354 -0.113 -0.375 -0.040 1 -0.115 0.315 0.450
Sig. (1-tailed) 0.158 0.378 0.143 0.457 0.376 0.188 0.096
Cd accumulation Pearson Correlation 0.751** 0.665* 0.763* 0.792** -0.115 1 0.673* 0.339
Sig. (1-tailed) 0.006 0.019 0.012 0.003 0.376 0.021 0.739*
Free Proline Pearson Correlation 0.444 0.634* 0.325 0.677* 0.315 0.673* 1 0.010
Sig. (1-tailed) 0.099 0.025 0.180 0.016 0.188 0.021 0.164
Total phenolics Pearson Correlation 0.246 0.201 0.203 0.189 0.650* 0.739* 0.346 1
Sig. (1-tailed) 0.356 0.289 0.287 0.300 0.016 0.010 0.164
**. Correlation is significant at the 0.01 level (1-tailed). *. Correlation is significant at the 0.05 level (1-tailed).

CHAPTER # 3 RESULTS
73
Table 3. 14: Correlations among different parameter in stem of Ricinus communis plant grown in 25 ppm Cd contaminated soil.
Le
ng
th
Fre
sh
we
igh
t
Dry
w
eig
ht
To
tal
wa
ter
co
nte
nt
Cd
co
nc
en
t-
ratio
n
Cd a
ccu
mu
-
latio
n
Length (cm) Pearson Correlation
1 0.954** 0.920** 0.916** -0.527* 0.753**
Sig. (1-tailed) 0.000 0.000 0.000 0.039 0.002
Fresh weight (g) Pearson Correlation
0.954** 1 0.957** 0.967** -0.418 0.862**
Sig. (1-tailed) 0.000 0.000 0.001 0.088 0.000
Dry weight (g) Pearson Correlation
0.920** 0.957** 1 0.851** -0.342 0.926**
Sig. (1-tailed) 0.000 0.000 0.000 0.138 0.000
Total water content (g) Pearson Correlation
0.916** 0.967** 0.851** 1 -0.454 0.747**
Sig. (1-tailed) 0.000 0.000 0.000 0.069 0.003
Cd concentration
(ppm)
Pearson Correlation -0.527* -0.418 -0.342 -0.454 1 0.018
Sig. (1-tailed) 0.039 0.088 0.138 0.069 0.478
Cd accumulation
(mg/DW)
Pearson Correlation 0.753** 0.862** 0.926** 0.747** 0.018 1
Sig. (1-tailed) 0.002 0.001 0.001 0.003 0.478
**. Correlation is significant at the 0.01 level (1-tailed). *. Correlation is significant at the 0.05 level (1-tailed).
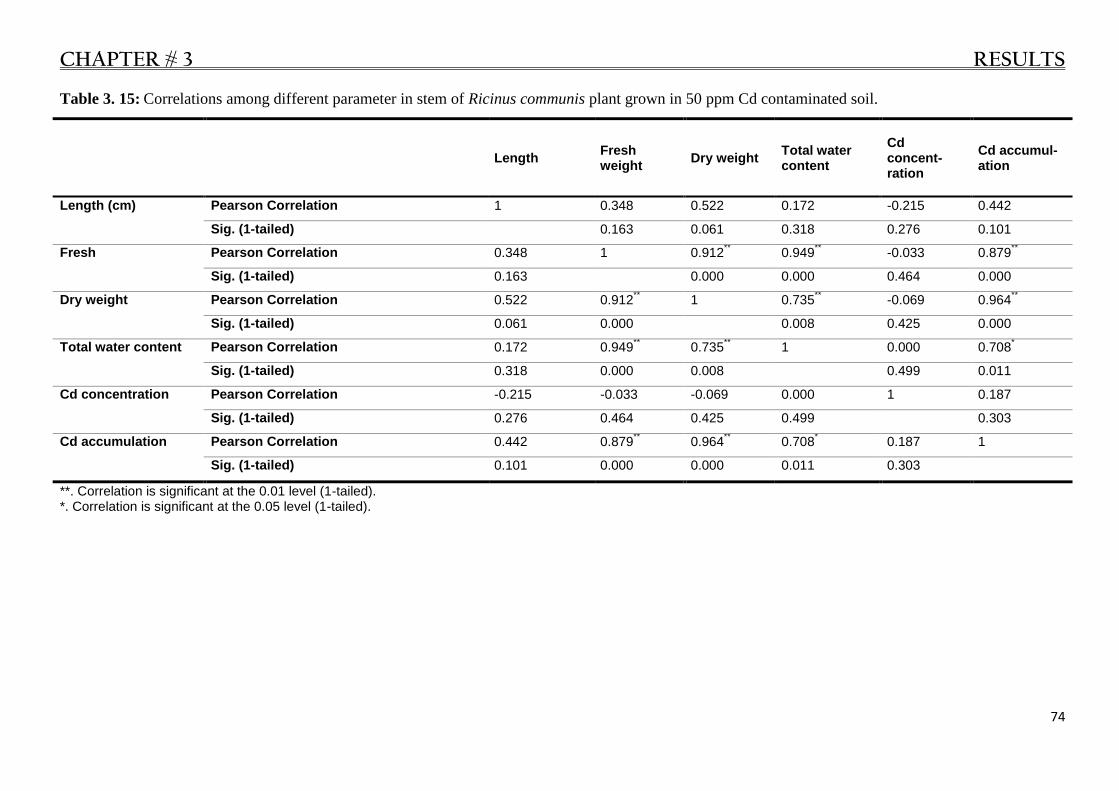
CHAPTER # 3 RESULTS
74
Table 3. 15: Correlations among different parameter in stem of Ricinus communis plant grown in 50 ppm Cd contaminated soil.
Length Fresh weight
Dry weight Total water content
Cd concent-ration
Cd accumul-ation
Length (cm) Pearson Correlation 1 0.348 0.522 0.172 -0.215 0.442
Sig. (1-tailed) 0.163 0.061 0.318 0.276 0.101
Fresh Pearson Correlation 0.348 1 0.912** 0.949
** -0.033 0.879
**
Sig. (1-tailed) 0.163 0.000 0.000 0.464 0.000
Dry weight Pearson Correlation 0.522 0.912** 1 0.735
** -0.069 0.964
**
Sig. (1-tailed) 0.061 0.000 0.008 0.425 0.000
Total water content Pearson Correlation 0.172 0.949** 0.735
** 1 0.000 0.708
*
Sig. (1-tailed) 0.318 0.000 0.008 0.499 0.011
Cd concentration Pearson Correlation -0.215 -0.033 -0.069 0.000 1 0.187
Sig. (1-tailed) 0.276 0.464 0.425 0.499 0.303
Cd accumulation Pearson Correlation 0.442 0.879** 0.964
** 0.708
* 0.187 1
Sig. (1-tailed) 0.101 0.000 0.000 0.011 0.303
**. Correlation is significant at the 0.01 level (1-tailed). *. Correlation is significant at the 0.05 level (1-tailed).

CHAPTER # 3 RESULTS
75
Table 3. 16: Correlations among different parameter in stem of Ricinus communis plant grown in 100 ppm Cd contaminated soil.
Len
gth
Fre
sh
we
igh
t
Dry
we
igh
t
To
tal
wa
ter
co
nte
nt
Cd
co
ncen
t
-ratio
n
Cd
acc
um
ul
-atio
n
Length Pearson Correlation 1 0.541 0.773** 0.270 -0.361 0.686*
Sig. (1-tailed) 0.053 0.004 0.225 0.153 0.014
Fresh weight Pearson Correlation 0.541 1 0.829** 0.920** -0.304 0.759**
Sig. (1-tailed) 0.053 0.001 0.000 0.197 0.005
Dry weight Pearson Correlation 0.773** 0.829** 1 0.543 -0.270 0.953**
Sig. (1-tailed) 0.004 0.001 0.052 0.225 0.000
Total water content Pearson Correlation 0.270 0.920** 0.543 1 -0.266 0.471
Sig. (1-tailed) 0.225 0.000 0.052 0.229 0.085
Cd concentration Pearson Correlation -0.361 -0.304 -0.270 -0.266 1 0.027
Sig. (1-tailed) 0.153 0.197 0.225 0.229 0.471
Cd accumulation
(mg/DW)
Pearson Correlation 0.686* 0.759** 0.953** 0.471 0.027 1
Sig. (1-tailed) 0.014 0.005 0.000 0.085 0.471
**. Correlation is significant at the 0.01 level (1-tailed). *. Correlation is significant at the 0.05 level (1-tailed).
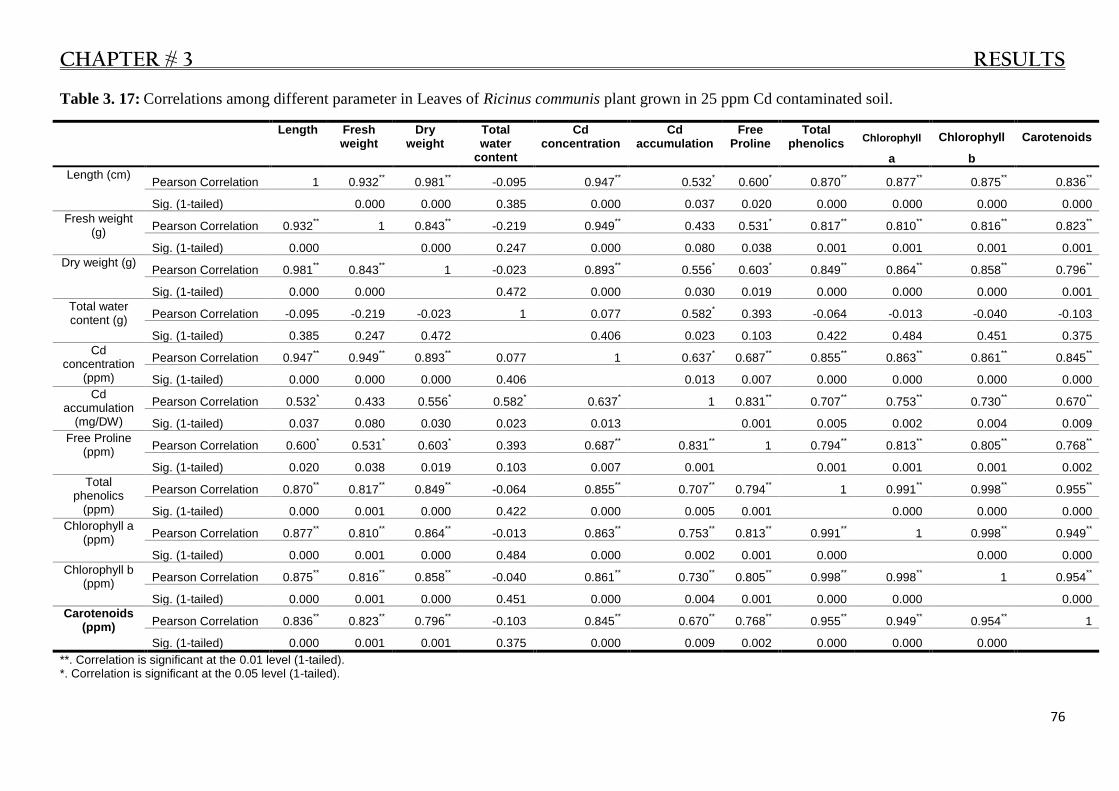
CHAPTER # 3 RESULTS
76
Table 3. 17: Correlations among different parameter in Leaves of Ricinus communis plant grown in 25 ppm Cd contaminated soil.
Length Fresh weight
Dry weight
Total water
content
Cd concentration
Cd accumulation
Free Proline
Total phenolics
Chlorophyll
a
Chlorophyll
b
Carotenoids
Length (cm) Pearson Correlation 1 0.932
** 0.981
** -0.095 0.947
** 0.532
* 0.600
* 0.870
** 0.877
** 0.875
** 0.836
**
Sig. (1-tailed) 0.000 0.000 0.385 0.000 0.037 0.020 0.000 0.000 0.000 0.000
Fresh weight (g)
Pearson Correlation 0.932** 1 0.843
** -0.219 0.949
** 0.433 0.531
* 0.817
** 0.810
** 0.816
** 0.823
**
Sig. (1-tailed) 0.000 0.000 0.247 0.000 0.080 0.038 0.001 0.001 0.001 0.001
Dry weight (g) Pearson Correlation 0.981
** 0.843
** 1 -0.023 0.893
** 0.556
* 0.603
* 0.849
** 0.864
** 0.858
** 0.796
**
Sig. (1-tailed) 0.000 0.000 0.472 0.000 0.030 0.019 0.000 0.000 0.000 0.001
Total water content (g)
Pearson Correlation -0.095 -0.219 -0.023 1 0.077 0.582* 0.393 -0.064 -0.013 -0.040 -0.103
Sig. (1-tailed) 0.385 0.247 0.472 0.406 0.023 0.103 0.422 0.484 0.451 0.375
Cd concentration
(ppm)
Pearson Correlation 0.947** 0.949
** 0.893
** 0.077 1 0.637
* 0.687
** 0.855
** 0.863
** 0.861
** 0.845
**
Sig. (1-tailed) 0.000 0.000 0.000 0.406 0.013 0.007 0.000 0.000 0.000 0.000
Cd accumulation
(mg/DW)
Pearson Correlation 0.532* 0.433 0.556
* 0.582
* 0.637
* 1 0.831
** 0.707
** 0.753
** 0.730
** 0.670
**
Sig. (1-tailed) 0.037 0.080 0.030 0.023 0.013 0.001 0.005 0.002 0.004 0.009
Free Proline (ppm)
Pearson Correlation 0.600* 0.531
* 0.603
* 0.393 0.687
** 0.831
** 1 0.794
** 0.813
** 0.805
** 0.768
**
Sig. (1-tailed) 0.020 0.038 0.019 0.103 0.007 0.001 0.001 0.001 0.001 0.002
Total phenolics
(ppm)
Pearson Correlation 0.870** 0.817
** 0.849
** -0.064 0.855
** 0.707
** 0.794
** 1 0.991
** 0.998
** 0.955
**
Sig. (1-tailed) 0.000 0.001 0.000 0.422 0.000 0.005 0.001 0.000 0.000 0.000
Chlorophyll a (ppm)
Pearson Correlation 0.877** 0.810
** 0.864
** -0.013 0.863
** 0.753
** 0.813
** 0.991
** 1 0.998
** 0.949
**
Sig. (1-tailed) 0.000 0.001 0.000 0.484 0.000 0.002 0.001 0.000 0.000 0.000
Chlorophyll b (ppm)
Pearson Correlation 0.875** 0.816
** 0.858
** -0.040 0.861
** 0.730
** 0.805
** 0.998
** 0.998
** 1 0.954
**
Sig. (1-tailed) 0.000 0.001 0.000 0.451 0.000 0.004 0.001 0.000 0.000 0.000
Carotenoids (ppm)
Pearson Correlation 0.836** 0.823
** 0.796
** -0.103 0.845
** 0.670
** 0.768
** 0.955
** 0.949
** 0.954
** 1
Sig. (1-tailed) 0.000 0.001 0.001 0.375 0.000 0.009 0.002 0.000 0.000 0.000
**. Correlation is significant at the 0.01 level (1-tailed). *. Correlation is significant at the 0.05 level (1-tailed).
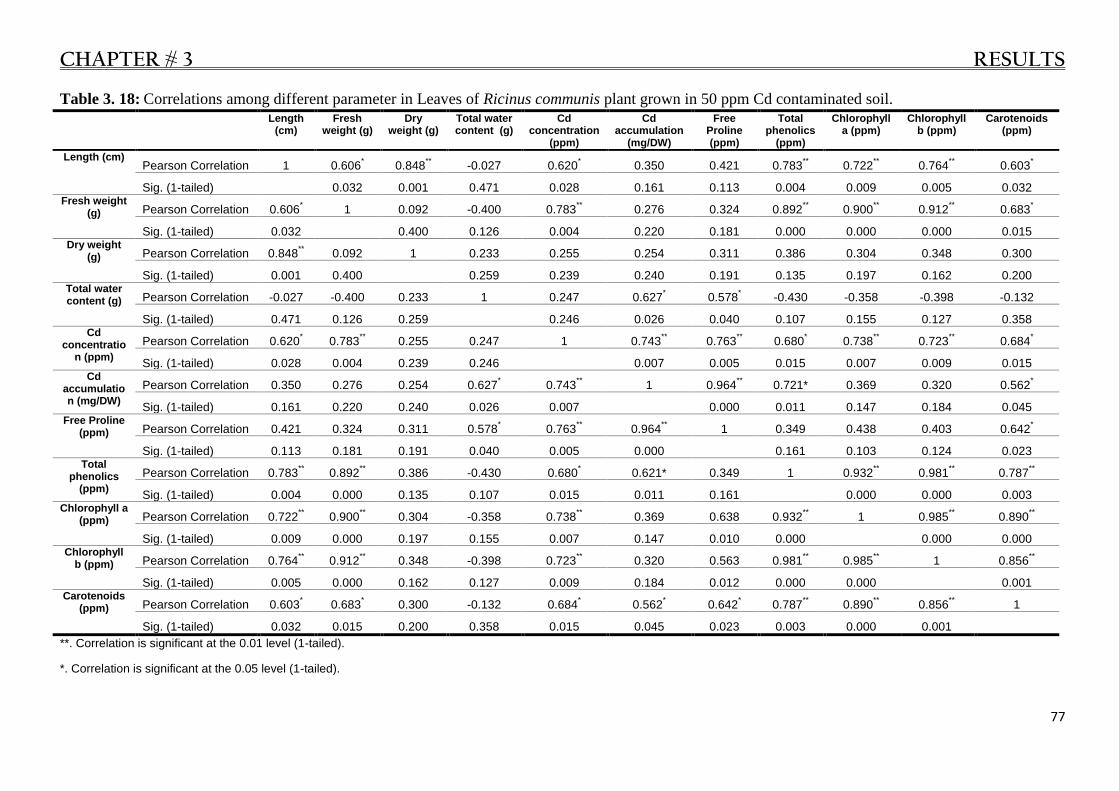
CHAPTER # 3 RESULTS
77
Table 3. 18: Correlations among different parameter in Leaves of Ricinus communis plant grown in 50 ppm Cd contaminated soil.
Length (cm)
Fresh weight (g)
Dry weight (g)
Total water content (g)
Cd concentration
(ppm)
Cd accumulation
(mg/DW)
Free Proline (ppm)
Total phenolics
(ppm)
Chlorophyll a (ppm)
Chlorophyll b (ppm)
Carotenoids (ppm)
Length (cm) Pearson Correlation 1 0.606
* 0.848
** -0.027 0.620
* 0.350 0.421 0.783
** 0.722
** 0.764
** 0.603
*
Sig. (1-tailed) 0.032 0.001 0.471 0.028 0.161 0.113 0.004 0.009 0.005 0.032 Fresh weight
(g) Pearson Correlation 0.606* 1 0.092 -0.400 0.783
** 0.276 0.324 0.892
** 0.900
** 0.912
** 0.683
*
Sig. (1-tailed) 0.032 0.400 0.126 0.004 0.220 0.181 0.000 0.000 0.000 0.015 Dry weight
(g) Pearson Correlation 0.848** 0.092 1 0.233 0.255 0.254 0.311 0.386 0.304 0.348 0.300
Sig. (1-tailed) 0.001 0.400 0.259 0.239 0.240 0.191 0.135 0.197 0.162 0.200 Total water content (g) Pearson Correlation -0.027 -0.400 0.233 1 0.247 0.627
* 0.578
* -0.430 -0.358 -0.398 -0.132
Sig. (1-tailed) 0.471 0.126 0.259 0.246 0.026 0.040 0.107 0.155 0.127 0.358 Cd
concentration (ppm)
Pearson Correlation 0.620* 0.783
** 0.255 0.247 1 0.743
** 0.763
** 0.680
* 0.738
** 0.723
** 0.684
*
Sig. (1-tailed) 0.028 0.004 0.239 0.246 0.007 0.005 0.015 0.007 0.009 0.015 Cd
accumulation (mg/DW)
Pearson Correlation 0.350 0.276 0.254 0.627* 0.743
** 1 0.964
** 0.721* 0.369 0.320 0.562
*
Sig. (1-tailed) 0.161 0.220 0.240 0.026 0.007 0.000 0.011 0.147 0.184 0.045 Free Proline
(ppm) Pearson Correlation 0.421 0.324 0.311 0.578* 0.763
** 0.964
** 1 0.349 0.438 0.403 0.642
*
Sig. (1-tailed) 0.113 0.181 0.191 0.040 0.005 0.000 0.161 0.103 0.124 0.023 Total
phenolics (ppm)
Pearson Correlation 0.783** 0.892
** 0.386 -0.430 0.680
* 0.621* 0.349 1 0.932
** 0.981
** 0.787
**
Sig. (1-tailed) 0.004 0.000 0.135 0.107 0.015 0.011 0.161 0.000 0.000 0.003 Chlorophyll a
(ppm) Pearson Correlation 0.722** 0.900
** 0.304 -0.358 0.738
** 0.369 0.638 0.932
** 1 0.985
** 0.890
**
Sig. (1-tailed) 0.009 0.000 0.197 0.155 0.007 0.147 0.010 0.000 0.000 0.000 Chlorophyll
b (ppm) Pearson Correlation 0.764** 0.912
** 0.348 -0.398 0.723
** 0.320 0.563 0.981
** 0.985
** 1 0.856
**
Sig. (1-tailed) 0.005 0.000 0.162 0.127 0.009 0.184 0.012 0.000 0.000 0.001 Carotenoids
(ppm) Pearson Correlation 0.603* 0.683
* 0.300 -0.132 0.684
* 0.562
* 0.642
* 0.787
** 0.890
** 0.856
** 1
Sig. (1-tailed) 0.032 0.015 0.200 0.358 0.015 0.045 0.023 0.003 0.000 0.001
**. Correlation is significant at the 0.01 level (1-tailed).
*. Correlation is significant at the 0.05 level (1-tailed).

CHAPTER # 3 RESULTS
78
Table 3. 19: Correlations among different parameter in leaves of Ricinus communis plant grown in 100 ppm Cd contaminated soil.
Length (cm)
Fresh weight
(g)
Dry weight
(g)
Total water content (g)
Cd concentra
tion (ppm)
Cd accumulation (mg/DW)
Free Proline (ppm)
Total phenolics
(ppm)
Chlorophyll a (ppm)
Chlorophyll b (ppm)
Carotenoids (ppm)
Length (cm) Pearson Correlation 1 0.721
** 0.863
** -0.468 0.702
* 0.068 0.179 0.607
* 0.593
* 0.064 0.456
Sig. (1-tailed) 0.009 0.001 0.086 0.012 0.426 0.310 0.031 0.035 0.430 0.093
Fresh weight (g)
Pearson Correlation 0.721**
1 0.271 -0.717**
0.905**
0.147 0.241 0.791**
0.775**
-0.035 0.575*
Sig. (1-tailed) 0.009 0.224 0.010 0.000 0.343 0.251 0.003 0.004 0.461 0.041
Dry weight (g) Pearson Correlation 0.863
** 0.271 1 -0.127 0.314 -0.012 0.073 0.266 0.258 0.115 0.214
Sig. (1-tailed) 0.001 0.224 0.363 0.188 0.486 0.420 0.228 0.236 0.376 0.277
Total water content (g)
Pearson Correlation -0.468 -0.717**
-0.127 1 -0.365 0.423 0.427 -0.265 -0.336 -0.311 -0.165
Sig. (1-tailed) 0.086 0.010 0.363 0.150 0.112 0.109 0.229 0.171 0.191 0.325
Cd concentration
(ppm)
Pearson Correlation 0.702* 0.905
** 0.314 -0.365 1 0.456 0.585
* 0.924
** 0.869
** -0.166 0.714
*
Sig. (1-tailed) 0.012 0.000 0.188 0.150 0.092 0.038 0.000 0.001 0.324 0.010
Cd accumulation
(mg/DW)
Pearson Correlation 0.068 0.147 -0.012 0.423 0.456 1 0.930**
0.866* 0.646
* -0.335 0.721
**
Sig. (1-tailed) 0.426 0.343 0.486 0.112 0.092 0.000 0.008 0.022 0.172 0.009
Free Proline (ppm)
Pearson Correlation 0.179 0.241 0.073 0.627 0.585* 0.930
** 1 0.723
** 0.661
* -0.309 0.702
*
Sig. (1-tailed) 0.310 0.251 0.420 0.010 0.038 0.000 0.009 0.019 0.193 0.012
/Total phenolics
(ppm)
Pearson Correlation 0.607* 0.791
** 0.266 -0.265 0.924
** 0.866
* 0.723
** 1 0.959
** 0.773* 0.896
**
Sig. (1-tailed) 0.031 0.003 0.228 0.229 0.000 0.008 0.009 0.000 0.017 0.000
Chlorophyll a (ppm)
Pearson Correlation 0.593* 0.775
** 0.258 -0.336 0.869
** 0.646
* 0.661
* 0.959
** 1 0.037 0.946
**
Sig. (1-tailed) 0.035 0.004 0.236 0.171 0.001 0.019 0.018 0.000 0.459 0.000
Chlorophyll b (ppm)
Pearson Correlation 0.064 -0.035 0.115 -0.311 -0.166 -0.335 -0.609 0.773* 0.037 1 0.013
Sig. (1-tailed) 0.430 0.461 0.376 0.191 0.324 0.172 0.019 0.017 0.459 0.486
Carotenoids (ppm)
Pearson Correlation 0.456 0.575* 0.214 -0.165 0.714
* 0.721
** 0.702
* 0.896
** 0.946
** 0.013 1
Sig. (1-tailed) 0.093 0.041 0.277 0.325 0.010 0.009 0.012 0.000 0.000 0.486
**. Correlation is significant at the 0.01 level (1-tailed). *. Correlation is significant at the 0.05 level (1-tailed).

CHAPTER # 3 RESULTS
79
3.3.2 Cannabis sativa plant
3.3.2.1 Effects of molybdenum on plant growth parameters (length, biomass and water
contents) under cadmium stress
The effect of molybdenum on plant length, biomass and water content in Cannabis sativa
grown in 25, 50 and 100 ppm cadmium contaminated soil are given in Tables 3.20, 3.21 and
3.22. In table 3.20 and figure 3.4 X, the control C (without Cd and Mo) is compared with C1
(25 ppm Cd), C2 (50 ppm Cd) and C3 (100 ppm) for the effect of Cd on plant growth and
biomass. The table also compare C1 with treatments T1 – T9 for the molybdenum effect on
plant growth under 25 ppm cadmium contaminated soil. It was found that application of Mo
in the form of foliar spray and seed soaking significantly increased plant length, biomass and
water content in Cannabis sativa plant (Table 3.20). Highest significant increase in roots
length and biomass was demonstrated by 1.0 ppm Mo seed soaking treatment (T2) as
compared to C1. Stem and leaves showed highest significant increase in length and biomass
with 1.00 ppm (T8) and 2.00 ppm (T9) Mo foliar spray respectively (Table 3.20).
The effect of molybdenum treatments (T10-T18) on growth parameters of Cannabis sativa
plants in 50 ppm Cd contaminated soil is given in Table 3.21 and figure 3.4Y. Foliar spray of
1 and 2 ppm molybdenum significantly increased plant growth parameters, especially
biomasses (fresh and dry) in all parts of the plant as compared to C2 (50 ppm Cd into soil,
without Mo treatment). Biomass (fresh and dry) in stem, leaves and entire plant increased
most significantly in the treatment T18 (2.00 ppm Mo foliar spray) as given in table 2.21.
The table 3.22 shows the effect of molybdenum treatments on growth parameter of Ricinus
communis plants grown in 100 ppm Cd contaminated soil. Roots and stem lengths were
increased most significantly with 2.00 ppm Mo foliar spray (T27) as compared to C3 (100
ppm Cd added to soil, without Mo treatment) as given in table 3.22 and figure 3.4Z. Highest
biomass (fresh and dry) in roots were recorded with the treatment T21 (2.00 ppm Mo seed
soaking) while the stem and leaves showed highest biomass with the treatment T27 (2 ppm
Mo foliar spray) as shown in table 3.22.

CHAPTER # 3 RESULTS
80
Table 3. 20: Effect of molybdenum (Mo) treatments on length, biomass and water content in different parts of Cannabis sativa plant in soil contaminated with 25
ppm Cd. C1 (25 ppm Cd only) was used as control for the treatments (T1 – T9). Table also compares C1 (25 ppm Cd), C2 (50 ppm Cd) and C3 (100 ppm Cd) with
each other and also with control C (without Cd and Mo). Note: ‗SD‘ stands for ‗standard deviation‘ and the different alphabets in superscript represent significant
difference between the values within a single column.
Treatments Length (cm) ±
SD
FW (g) ± SD DW (g) ± SD TWC (g) ± SD
Root Stem Root Stem Leaves Entire
Plant
Root Stem Leaves Entire
Plant
Root Stem Leaves Entire
Plant
C Control (without Cd
and Mo)
12.50 ±
1.00 bc
31.25 ±
3.13 abc
4.75 ±
0.38 ab
8.74 ±
0.79 cde
9.77 ±
0.78 bc
23.26 ±
1.86 bcd
1.83 ±
0.15 a
2.34 ±
0.19 cde
2.93 ±
0.23 cd
7.10 ±
0.57 bcde
2.93 ±
0.23 ab
6.40 ±
0.51 cd
6.84 ±
0.55 ab
16.16 ±
1.29 bcd
C1 Control (with Cd 25
ppm)
10.00 ±
0.80 cde
24.32 ±
2.43 cde
3.12 ±
0.28 fg
6.12 ±
0.49 fg
6.99 ±
0.63 de
16.24 ±
1.46 fgh
1.22 ±
0.11 def
1.64 ±
0.15 fg
1.89 ±
0.15 fgh
4.75 ±
0.38 gh
1.90 ±
0.15 de
4.48 ±
0.36 ef
5.10 ±
0.41 cde
11.49 ±
0.92 fgh
C2 Control (with Cd 50
ppm)
8.12 ±
0.65 de
20.30 ±
2.03 de
2.65 ±
0.21 gh
5.20 ±
0.52 g
5.84 ±
0.58 e
13.69 ±
1.09 gh
1.02 ±
0.08 fg
1.60 ±
0.14 fg
1.58 ±
0.13 gh
4.19 ±
0.34 gh
1.64 ±
0.13 ef
3.60 ±
0.29 f
4.26 ±
0.34 de
9.50 ±
0.76 gh
C3 Control (with Cd 100
ppm)
6.81 ±
0.54 e
17.02 ±
1.70 e
2.04 ±
0.14 h
4.34 ±
0.35 g
4.89 ±
0.39 e
11.28 ±
1.13 h
0.85 ±
0.09 g
1.23 ±
0.10 g
1.32 ±
0.11 h
3.40 ±
0.27 h
1.19 ±
0.10 f
3.11 ±
0.25 f
3.57 ±
0.29 e
7.87 ±
0.63 h
T1 Cd 25 ppm+ Mo 0.5
ppm (Seed soaking)
12.25 ±
1.23 bc
27.23 ±
2.45 cd
3.68 ±
0.40 cdef
9.87 ±
1.09 cd
8.71 ±
0.78 cd
22.26 ±
1.78 cde
1.36 ±
0.14 cdef
3.12 ±
0.25 ab
2.70 ±
0.22 de
7.18 ±
0.57 bcd
2.31 ±
0.19 cd
6.75 ±
0.61 cd
6.01 ±
0.54 bc
15.08 ±
1.21 cdef
T2 Cd 25 ppm+ Mo 1.0
ppm (Seed soaking)
17.50 ±
1.75 a
35.00 ±
3.15 ab
5.00 ±
0.45 a
10.45 ±
0.84 bc
11.20 ±
0.78 ab
26.65 ±
3.20 abc
1.75 ±
0.12 ab
2.71 ±
0.30 bc
3.47 ±
0.28 bc
7.93 ±
0.63 abc
3.25 ±
0.26 a
7.74 ±
0.62 bc
7.73 ±
0.62 a
18.72 ±
1.50 abc
T3 Cd 25 ppm+ Mo 2.0
ppm (Seed soaking)
11.20 ±
1.12 bcd
28.00 ±
2.52 bc
4.35 ±
0.44 abcd
7.99 ±
0.80 def
8.96 ±
0.99 bcd
21.30 ±
1.92 cdef
1.57 ±
0.13 abcd
2.42 ±
0.19 cd
3.50 ±
0.28 bc
7.49 ±
0.60 abc
2.78 ±
0.22 abc
5.57 ±
0.45 de
5.46 ±
0.44 bcd
13.81 ±
1.10 def
T4 Cd 25 ppm+ Mo 0.5
ppm (Soil addition)
10.52 ±
1.05 cd
26.31 ±
2.37 cd
3.87 ±
0.31 bcdef
5.00 ±
0.45 g
8.22 ±
0.74 cd
17.09 ±
1.20 def
1.60 ±
0.14 abc
1.67 ±
0.13 fg
2.14 ±
0.17 efg
5.41 ±
0.43 fg
2.27 ±
0.18 cd
3.33 ±
0.27 f
6.08 ±
0.49 bc
11.68 ±
0.93 efg
T5 Cd 25 ppm+ Mo 1.0
ppm (Soil addition)
11.20 ±
1.01 bcd
29.45 ±
2.36 abc
3.52 ±
0.28 defg
6.00 ±
0.36 fg
9.20 ±
0.74 bcd
18.72 ±
1.50 defg
1.40 ±
0.11 bcde
1.72 ±
0.15 efg
2.39 ±
0.22 def
5.51 ±
0.50 efg
2.12 ±
0.19 de
4.28 ±
0.34 ef
6.81 ±
0.68 ab
13.21 ±
1.06 def
T6 Cd 25 ppm+ Mo 2.0
ppm (Soil addition)
11.50 ±
1.04 bc
31.00 ±
2.48 abc
3.44 ±
0.31 defg
6.53 ±
0.72 efg
8.54 ±
0.68 cd
18.51 ±
1.48 defg
1.09 ±
0.09 efg
1.98 ±
0.16 def
2.65 ±
0.21 de
5.72 ±
0.46 defg
2.35 ±
0.19 bcd
4.55 ±
0.36 ef
5.89 ±
0.47 bc
12.79 ±
1.02 defg
T7 Cd 25 ppm+ Mo 0.5
ppm (Foliar spray)
10.90 ±
0.98 bcd
25.94 ±
2.16 cd
3.31 ±
0.23 efg
9.68 ±
0.77 cd
8.97 ±
0.90 bcd
21.96 ±
1.98 cde
1.25 ±
0.11 cdef
2.42 ±
0.22 cd
2.96 ±
0.27 bcd
6.62 ±
0.60 cdef
2.06 ±
0.19 de
7.26 ±
0.65 bc
6.01 ±
0.54 bc
15.33 ±
1.38 cde
T8 Cd 25 ppm+ Mo 1.0
ppm (Foliar spray)
13.20 ±
1.19 bc
36.00 ±
2.88 a
4.26 ±
0.38 abcde
12.25 ±
1.10 ab
12.15 ±
1.09 a
28.66 ±
2.58 ab
1.40 ±
0.13 bcde
3.42 ±
0.27 a
4.25 ±
0.34 a
9.07 ±
0.73 a
2.86 ±
0.23 abc
8.83 ±
0.71 b
7.90 ±
0.63 a
19.59 ±
1.57 ab
T9 Cd 25 ppm+ Mo 2.0
ppm (Foliar spray)
14.00 ±
1.26 b
36.59 ±
2.93 a
4.56 ±
0.36 abc
14.24 ±
1.14 a
10.46 ±
0.84 abc
29.26 ±
2.34 a
1.43 ±
0.14 bcde
3.56 ±
0.36 a
3.66 ±
0.37 ab
8.65 ±
0.86 ab
3.13 ±
0.31 a
10.68 ±
1.07 a
6.80 ±
0.68 ab
20.61 ±
2.06 a
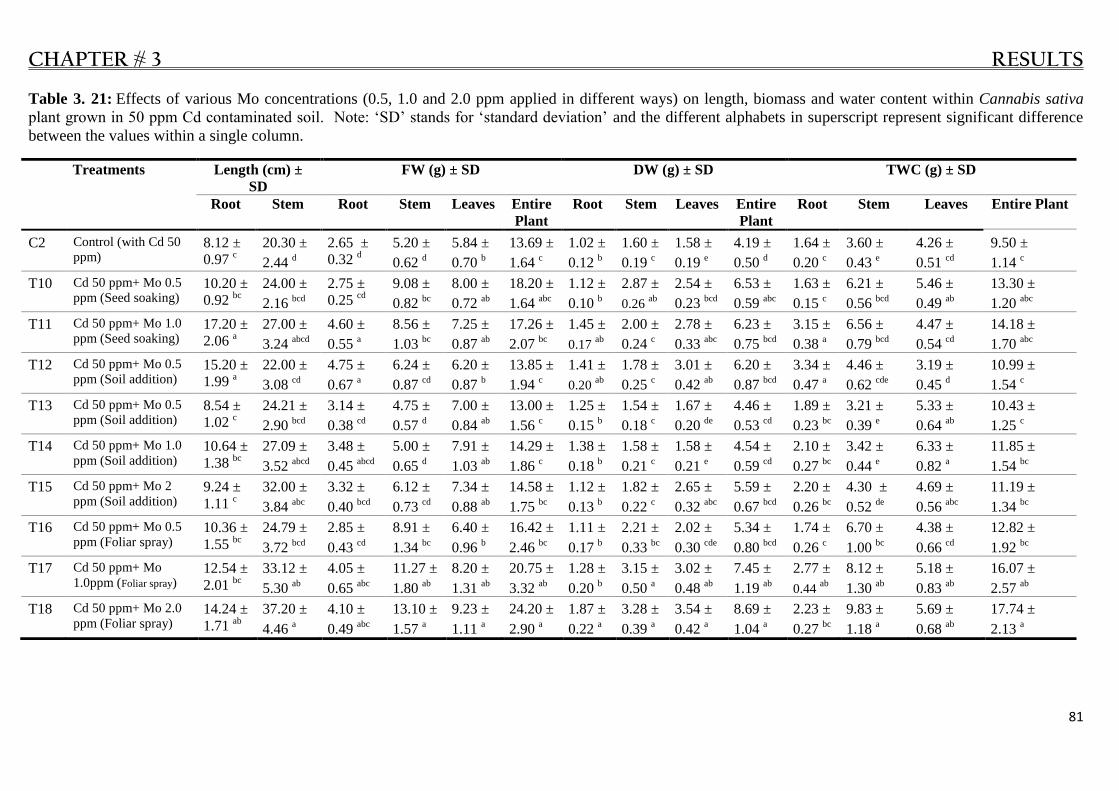
CHAPTER # 3 RESULTS
81
Table 3. 21: Effects of various Mo concentrations (0.5, 1.0 and 2.0 ppm applied in different ways) on length, biomass and water content within Cannabis sativa
plant grown in 50 ppm Cd contaminated soil. Note: ‗SD‘ stands for ‗standard deviation‘ and the different alphabets in superscript represent significant difference
between the values within a single column.
Treatments Length (cm) ±
SD
FW (g) ± SD DW (g) ± SD TWC (g) ± SD
Root Stem Root Stem Leaves Entire
Plant
Root Stem Leaves Entire
Plant
Root Stem Leaves Entire Plant
C2 Control (with Cd 50
ppm) 8.12 ±
0.97 c
20.30 ±
2.44 d
2.65 ±
0.32 d
5.20 ±
0.62 d
5.84 ±
0.70 b
13.69 ±
1.64 c
1.02 ±
0.12 b
1.60 ±
0.19 c
1.58 ±
0.19 e
4.19 ±
0.50 d
1.64 ±
0.20 c
3.60 ±
0.43 e
4.26 ±
0.51 cd
9.50 ±
1.14 c
T10 Cd 50 ppm+ Mo 0.5
ppm (Seed soaking) 10.20 ±
0.92 bc
24.00 ±
2.16 bcd
2.75 ±
0.25 cd
9.08 ±
0.82 bc
8.00 ±
0.72 ab
18.20 ±
1.64 abc
1.12 ±
0.10 b
2.87 ±
0.26 ab
2.54 ±
0.23 bcd
6.53 ±
0.59 abc
1.63 ±
0.15 c
6.21 ±
0.56 bcd
5.46 ±
0.49 ab
13.30 ±
1.20 abc
T11 Cd 50 ppm+ Mo 1.0
ppm (Seed soaking) 17.20 ±
2.06 a
27.00 ±
3.24 abcd
4.60 ±
0.55 a
8.56 ±
1.03 bc
7.25 ±
0.87 ab
17.26 ±
2.07 bc
1.45 ±
0.17 ab
2.00 ±
0.24 c
2.78 ±
0.33 abc
6.23 ±
0.75 bcd
3.15 ±
0.38 a
6.56 ±
0.79 bcd
4.47 ±
0.54 cd
14.18 ±
1.70 abc
T12 Cd 50 ppm+ Mo 0.5
ppm (Soil addition) 15.20 ±
1.99 a
22.00 ±
3.08 cd
4.75 ±
0.67 a
6.24 ±
0.87 cd
6.20 ±
0.87 b
13.85 ±
1.94 c
1.41 ±
0.20 ab
1.78 ±
0.25 c
3.01 ±
0.42 ab
6.20 ±
0.87 bcd
3.34 ±
0.47 a
4.46 ±
0.62 cde
3.19 ±
0.45 d
10.99 ±
1.54 c
T13 Cd 50 ppm+ Mo 0.5
ppm (Soil addition) 8.54 ±
1.02 c
24.21 ±
2.90 bcd
3.14 ±
0.38 cd
4.75 ±
0.57 d
7.00 ±
0.84 ab
13.00 ±
1.56 c
1.25 ±
0.15 b
1.54 ±
0.18 c
1.67 ±
0.20 de
4.46 ±
0.53 cd
1.89 ±
0.23 bc
3.21 ±
0.39 e
5.33 ±
0.64 ab
10.43 ±
1.25 c
T14 Cd 50 ppm+ Mo 1.0
ppm (Soil addition) 10.64 ±
1.38 bc
27.09 ±
3.52 abcd
3.48 ±
0.45 abcd
5.00 ±
0.65 d
7.91 ±
1.03 ab
14.29 ±
1.86 c
1.38 ±
0.18 b
1.58 ±
0.21 c
1.58 ±
0.21 e
4.54 ±
0.59 cd
2.10 ±
0.27 bc
3.42 ±
0.44 e
6.33 ±
0.82 a
11.85 ±
1.54 bc
T15 Cd 50 ppm+ Mo 2
ppm (Soil addition) 9.24 ±
1.11 c
32.00 ±
3.84 abc
3.32 ±
0.40 bcd
6.12 ±
0.73 cd
7.34 ±
0.88 ab
14.58 ±
1.75 bc
1.12 ±
0.13 b
1.82 ±
0.22 c
2.65 ±
0.32 abc
5.59 ±
0.67 bcd
2.20 ±
0.26 bc
4.30 ±
0.52 de
4.69 ±
0.56 abc
11.19 ±
1.34 bc
T16 Cd 50 ppm+ Mo 0.5
ppm (Foliar spray) 10.36 ±
1.55 bc
24.79 ±
3.72 bcd
2.85 ±
0.43 cd
8.91 ±
1.34 bc
6.40 ±
0.96 b
16.42 ±
2.46 bc
1.11 ±
0.17 b
2.21 ±
0.33 bc
2.02 ±
0.30 cde
5.34 ±
0.80 bcd
1.74 ±
0.26 c
6.70 ±
1.00 bc
4.38 ±
0.66 cd
12.82 ±
1.92 bc
T17 Cd 50 ppm+ Mo
1.0ppm (Foliar spray) 12.54 ±
2.01 bc
33.12 ±
5.30 ab
4.05 ±
0.65 abc
11.27 ±
1.80 ab
8.20 ±
1.31 ab
20.75 ±
3.32 ab
1.28 ±
0.20 b
3.15 ±
0.50 a
3.02 ±
0.48 ab
7.45 ±
1.19 ab
2.77 ±
0.44 ab
8.12 ±
1.30 ab
5.18 ±
0.83 ab
16.07 ±
2.57 ab
T18 Cd 50 ppm+ Mo 2.0
ppm (Foliar spray) 14.24 ±
1.71 ab
37.20 ±
4.46 a
4.10 ±
0.49 abc
13.10 ±
1.57 a
9.23 ±
1.11 a
24.20 ±
2.90 a
1.87 ±
0.22 a
3.28 ±
0.39 a
3.54 ±
0.42 a
8.69 ±
1.04 a
2.23 ±
0.27 bc
9.83 ±
1.18 a
5.69 ±
0.68 ab
17.74 ±
2.13 a

CHAPTER # 3 RESULTS
82
Table 3. 22: Effect of Mo (0.5, 1.0 and 2.0 ppm) on growth parameters (length, biomass and water content) in Cannabis sativa plant grown in 100 ppm Cd
contaminated soil Note: ‗SD‘ stands for ‗standard deviation‘ and the different alphabets in superscript represent significant difference between the values within a
single column.
Treatments Length (cm) ±
SD
FW (g) ± SD DW (g) ± SD TWC (g) ± SD
Stem Root Stem Leaves Entire
Plant
Root Stem Leaves Entire
Plant
Root Stem Leaves Entire
Plant
Entire
Plant
C3 Control (with Cd 100
ppm) 6.81 ±
0.82 b
17.02 ±
2.04 b
2.04 ±
0.25 d
4.34 ±
0.52 cd
4.89 ±
0.59 cd
11.28 ±
1.35 c
0.85 ±
0.10 b
1.23 ±
0.15 d
1.32 ±
0.16 c
3.40 ±
0.41 d
1.19 ±
0.14 c
3.11 ±
0.37 bc
3.57 ±
0.43 bcd
7.87 ±
0.94 b
T19 Cd 100 ppm+ Mo 0.5
ppm (Seed soaking) 9.89 ±
0.89 ab
18.54 ±
1.67 b
2.97 ±
0.27 bcd
5.45 ±
0.49 abcd
6.21 ±
0.56 bcd
14.63 ±
1.32 abc
1.10 ±
0.10 ab
1.61 ±
0.14 abcd
1.78 ±
0.16 bc
4.49 ±
0.40 abcd
1.87 ±
0.17 bc
3.84 ±
0.35 abc
4.43 ±
0.40 abc
10.14 ±
0.91 ab
T20 Cd 100 ppm+ Mo 1.0
ppm (Seed soaking) 11.00 ±
1.32 ab
20.24 ±
2.43 ab
4.04 ±
0.48 ab
6.75 ±
0.81 a
6.87 ±
0.82 abc
17.66 ±
2.12 ab
1.25 ±
0.15 ab
1.87 ±
0.22 abcd
2.24 ±
0.27 ab
5.36 ±
0.64 abc
2.79 ±
0.33 a
4.88 ±
0.59 a
4.63 ±
0.56 ab
12.30 ±
1.48 a
T21 Cd 100 ppm+ Mo 2
ppm (Seed soaking) 12.85 ±
1.80 a
22.14 ±
3.10 ab
4.32 ±
0.60 a
6.34 ±
0.89 abc
5.23 ±
0.73 bcd
15.89 ±
2.22 abc
1.38 ±
0.19 a
2.02 ±
0.28 ab
2.26 ±
0.32 ab
5.66 ±
0.79 ab
2.94 ±
0.41 a
4.32 ±
0.60 ab
2.97 ±
0.42 d
10.23 ±
1.43 ab
T22 Cd 100 ppm+ Mo 0.5
ppm (Soil addition) 7.25 ±
0.87 b
17.23 ±
2.07 b
3.13 ±
0.38 abcd
3.77 ±
0.45 d
4.45 ±
0.53 d
11.35 ±
1.36 c
0.95 ±
0.11 ab
1.26 ±
0.15 cd
1.45 ±
0.17 c
3.66 ±
0.44 cd
2.18 ±
0.26 ab
2.51 ±
0.30 c
3.00 ±
0.36 d
7.69 ±
0.92 b
T23 Cd 100 ppm+ Mo 1.0
ppm (Soil addition) 8.57 ±
1.11 ab
22.22 ±
2.89 ab
2.84 ±
0.37 bcd
4.53 ±
0.59 bcd
5.94 ±
0.77 bcd
13.30 ±
1.73 bc
1.08 ±
0.14 ab
1.42 ±
0.18 bcd
1.48 ±
0.19 bc
3.98 ±
0.52 bcd
1.76 ±
0.23 bc
3.11 ±
0.40 bc
4.46 ±
0.58 abc
9.32 ±
1.21 ab
T24 Cd 100 ppm+ Mo 2
ppm (Soil addition) 9.21 ±
1.11 ab
20.00 ±
3.24 ab
2.78 ±
0.33 bcd
5.45 ±
0.65 abcd
5.51 ±
0.66 bcd
13.74 ±
1.65 abc
1.10 ±
0.13 ab
1.49 ±
0.18 abcd
1.71 ±
0.21 bc
4.30 ±
0.52 abcd
1.68 ±
0.20 bc
3.96 ±
0.47 abc
3.80 ±
0.46 bcd
9.43 ±
1.13 ab
T25 Cd 100 ppm+ Mo 0.5
ppm (Foliar spray) 7.54 ±
1.13 b
23.15 ±
3.47 ab
2.67 ±
0.40 cd
7.00 ±
1.05 a
4.87 ±
0.73 cd
14.54 ±
2.18 abc
1.01 ±
0.15 ab
2.10 ±
0.32 a
1.65 ±
0.25 bc
4.76 ±
0.71 abcd
1.66 ±
0.25 bc
4.90 ±
0.74 a
3.22 ±
0.48 cd
9.78 ±
1.47 ab
T26 Cd 100 ppm+ Mo
1.0ppm (Foliar spray) 9.21 ±
1.47 ab
23.12 ±
3.54 ab
3.44 ±
0.55 abc
7.01 ±
0.96 a
7.84 ±
1.25 a
17.29 ±
2.77 a
1.13 ±
0.18 ab
1.78 ±
0.28 abc
2.74 ±
0.44 a
5.65 ±
0.90 a
2.31 ±
0.37 ab
4.23 ±
0.68 ab
5.09 ±
0.82 a
11.63 ±
1.86 a
T27 Cd 100 ppm+ Mo 2.0
ppm (Foliar spray) 12.61 ±
1.47 a
27.12 ±
2.41 a
3.68 ±
0.44 abc
5.87 ±
0.70 abcd
6.75 ±
0.81 ab
16.30 ±
1.96 abc
1.25 ±
0.15 ab
1.87 ±
0.22 abcd
2.86 ±
0.34 a
5.98 ±
0.72 ab
2.43 ±
0.29 ab
4.00 ±
0.48 ab
3.89 ±
0.47 abcd
10.32 ±
1.24 ab

CHAPTER # 3 RESULTS
83
Figure 3. 4: Effect of Mo treatments on growth of Cannabis sativa plant under Cd stress. In
figure X, the control C (without Cd and Mo) was compared with C1 (25 ppm Cd), C2 (50
ppm Cd) and C3 (100 ppm Cd) while the treatments T1 –T9 were compared with C2. In
figure Y, the treatments T10 – T18 are compared with C2 while in figure Z, the treatments
T19 –T27 are compared with C3.
X
Y
Z

CHAPTER # 3 RESULTS
84
3.2.2 Effect of different concentrations of Mo on free proline, total phenolics, chlorophyll and
carotenoids contents in Cannabis sativa plant
The effect of Mo treatments on concentration of free proline, total phenolics, chlorophyll and
carotenoids in Cannabis sativa plants grown in 25, 50 and 100 ppm Cd contaminated soil is
given in table 3.23, 3.24 and 3.25. The table 2.23 compare C (without Cd and Mo) with C1
(25 ppm Cd only), C2 (50 ppm Cd only) and C3 (100 ppm Cd only) for the effect on Cd on
free proline, total phenolics and chlorophyll pigments in the plant. In the same table (3.23)
treatments (T1 – T9) are compared with C1 for the effect of molybdenum treatments on the
above biochemical parameters. It was found that free proline concentration in roots and
leaves increased significantly in C1, C2 and C3 as compared to C (Table 2.23). Molybdenum
concentration of 1.00 ppm as seed soaking (T2) and foliar spray (T8) highly increased free
proline in roots and leaves respectively. All the treatments increased phenolics concentration
in roots and leaves of the plant as compared to C1. Highest significant concentration of total
phenolics in roots and leaves were noted in 0.5 ppm Mo application as seed soaking (T1) and
foliar spray (T7) respectively. Chlorophyll and carotenoids concentration decreased in leaves
with increasing concentration of Cd in soil i.e. in the order of C (without Cd) > C1 (25 ppm
Cd in soil) > C2 (50 ppm Cd in soil) > C3 (100 ppm Cd in soil). The photosynthetic pigments
increased in the treatments (T1-T9) as compared to C1 (Table 3.23). Highest significant
increase in chlorophyll and carotenoid contents were recorded in the treatment T9 (25 ppm
Cd + 2.0 ppm Mo foliar spray) as given in Table 3.23.
The effects of Mo treatments (T10-T18) on concentration of free proline, total phenolics and
photosynthetic pigments in Cannabis sativa plants grown in 50 ppm Cd contaminated soil are
presented in Table 3.24. Highest significant increase in free proline and total phenolics
concentrations in roots were found in 1.00 ppm Mo as seed soaking (T11) and foliar spray
(T7) treatments respectively. Total phenolics and free proline concentrations in leaves were
highly increased by foliar application of 0.5 ppm (T16) and 2.00 ppm (T18) Mo respectively
(Table 3.24). Highest increase in concentration chlorophyll a, b and carotenoids was recorded
in the treatment T18 (2.00 ppm Mo foliar spray) as compared to C2 (Table 324).
Effect of molybdenum treatments (T19 – T27) on the concentration of free proline, total
phenolics and photosynthetic pigments in Cannabis sativa plant grown in 100 ppm Cd
contaminated soil is given in Table 3.25. Highest significant increase in concentration of free
proline and total phenolics in roots were recorded in the treatment T20 (2.00 ppm Mo seed

CHAPTER # 3 RESULTS
85
soaking). Concentration of free proline and total phenolics in leaves were highly increased in
with foliar spray of 1.00 ppm (T26) and 2.00 ppm (T27) Mo respectively (Table 3.25). It was
also noted that free proline concentration in roots was higher than leaves of the Cannabis
plant in all the treatments and controls given Tables 3.25. Highest significant increase in
concentration of chlorophyll ‗b‘ was recorded in the treatment T19 (0.5 ppm Mo seed
soaking). The chlorophyll a and total chlorophyll (a + b) concentration were increased
significantly with the treatment T27 (2 ppm Mo foliar spray). Carotenoids concentration in
leaves were significantly increased by application of Mo in the form of soil addition and
foliar spray (i.e. treatments T23 to T27) as compared to the control C3 (Table 3.25).
Overall effect of Mo treatments on free proline and total phenolics in Cannabis sativa under
different concentrations (25, 50 and 100 ppm) of cadmium in soil is given in Figure 3.5. It
was noted that free proline concentration increased in plant as the soil Cd concentration
increased from 25 - 50 ppm and then decreased when soil Cd concentration reached 100 ppm.
Concentration of total phenolics in plant tissues was found to increased rapidly by increasing
Cd concentration in soil from 25 ppm to 50 ppm and beyond 50 ppm Cd (in soil) the increase
in phenolics concentration became very slow (Figure 3.5).

CHAPTER # 3 RESULTS
86
Table 3. 23: Effect of Mo treatments on free proline, phenolic compounds, chlorophyll (a, b) and carotenoids concentration in Cannabis sativa plant grown
in soil contaminated with 25 ppm Cd. C1 (25 ppm Cd only) was used as control for the treatments (T1 – T9). The C1 (25 ppm Cd), C2 (50 ppm Cd) and C3
(100 ppm Cd) are compared with C (without Cd). Note: ‗SD‘ stands for ‗standard deviation‘ and different alphabets in superscript represent significant
difference between the values within a single column.
Treatments Free proline (ppm) ± SD Total Phenolics (ppm) ± SD Chlorophyll contents (ppm) ± SD Carotenoids
(ppm) ± SD Root Leaves Root Leaves A b total
chlorophyll
C Control (without Cd and Mo) 12.65 ±
1.01 g
18.70 ±
1.66 f
10.54 ±
0.84 f
36.80 ±
2.94 e
36.61 ±
2.93 a
26.00 ±
2.08 abc
62.61 ±
5.01 a
48.00 ±
3.84 cde
C1 Control (with Cd 25 ppm) 23.00 ±
2.76 fg
25.00 ±
3.00 ef
25.23 ±
3.03 e
58.54 ±
7.02 de
25.06 ±
3.01 cd
21.00 ±
2.52 bcde
46.06 ±
5.53 cde
45.00 ±
5.40 de
C2 Control (with Cd 50 ppm) 35.00 ±
2.80 ef
30.25 ±
2.42 cde
33.25 ±
2.66 de
67.74 ±
5.42 bcde
27.30 ±
2.18 bcd
20.22 ±
1.62 cde
47.52 ±
3.80 bcde
42.20 ±
3.38 de
C3 Control (with Cd 100 ppm) 40.20 ±
3.62 de
32.12 ±
2.89 bcde
40.22 ±
3.62 cd
75.00 ±
6.75 bcde
22.33 ±
2.01 d
16.54 ±
1.49 e
38.87 ±
3.50 e
36.23 ±
3.26 e
T1 Cd 25 ppm+ Mo 0.5 ppm (Seed
soaking)
52.32 ±
4.19 bcd
28.00 ±
2.24 def
56.55 ±
4.52 a
76.48 ±
6.12 bcde
31.41 ±
2.51 abc
27.00 ±
2.16 ab
58.41 ±
4.67 abc
47.00 ±
3.76 cde
T2 Cd 25 ppm+ Mo 1.0 ppm (Seed
soaking)
67.86 ±
7.46 a
40.52 ±
4.46 ab
45.67 ±
5.02 abc
86.71 ±
9.54 abc
28.00 ±
3.08 bcd
24.65 ±
2.71 abcd
52.65 ±
5.79 abcde
48.98 ±
5.39 cde
T3 Cd 25 ppm+ Mo 2 ppm (Seed
soaking)
56.00 ±
4.48 abc
32.00 ±
2.56 bcde
50.23 ±
4.02 abc
79.01 ±
6.32 abcd
23.00 ±
1.84 d
19.56 ±
1.56 de
42.56 ±
3.40 de
52.32 ±
4.19 cd
T4 Cd 25 ppm+ Mo 0.5 ppm (Soil
addition)
45.23 ±
3.62 cde
35.73 ±
2.86 abcd
45.30 ±
3.62 abc
67.00 ±
5.36 cde
27.32 ±
2.19 bcd
21.00 ±
1.68 bcde
48.32 ±
3.87 bcde
48.24 ±
3.86 cde
T5 Cd 25 ppm+ Mo 1.0 ppm (Soil
addition)
54.36 ±
6.52 abc
34.23 ±
4.11 abcd
49.27 ±
5.91 abc
63.71 ±
7.65 de
33.23 ±
2.99 ab
24.61 ±
2.22 abcd
57.84 ±
5.21 abc
55.23 ±
4.97 cd
T6 Cd 25 ppm+ Mo 2 ppm (Soil
addition)
59.12 ±
5.32 ab
32.76 ±
2.62 bcde
52.23 ±
4.18 ab
61.41 ±
4.91 de
34.08 ±
2.73 ab
25.24 ±
2.02 abcd
59.33 ±
4.75 abc
70.23 ±
5.62 b
T7 Cd 25 ppm+ Mo 0.5 ppm (Foliar
spray)
48.78 ±
3.90 bcd
37.00 ±
2.96 abc
54.30 ±
4.34 ab
97.00 ±
7.76 a
31.00 ±
2.48 abc
23.12 ±
1.85 abcd
54.12 ±
4.33 abcd
60.45 ±
4.84 bc
T8 Cd 25 ppm+ Mo 1.0ppm (Foliar
spray)
55.23 ±
5.52 abc
42.00 ±
3.36 a
44.24 ±
3.54 bcd
91.77 ±
7.34 ab
35.00 ±
2.80 ab
25.93 ±
2.07 abc
60.93 ±
4.87 ab
85.30 ±
6.82 a
T9 Cd 25 ppm+ Mo 2.0 ppm (Foliar
spray)
57.45 ±
4.60 abc
27.18 ±
2.17 def
40.14 ±
3.21 cd
79.01 ±
6.32 abcd
37.00 ±
2.96 a
27.41 ±
2.19 a
64.41 ±
5.15 a
92.30 ±
7.38 a

CHAPTER # 3 RESULTS
87
Table 3. 24: Effect of Mo treatments on free proline, phenolic compounds, chlorophyll (a, b) and carotenoids concentration in Cannabis sativa plant grown
in soil contaminated with 50 ppm Cd. Note: ‗SD‘ stands for ‗standard deviation‘ and different alphabets in superscript represent significant difference
between the values within a single column.
Treatments Free proline (ppm) ± SD Total Phenolics (ppm) ±
SD
Chlorophyll contents (ppm) ± SD Carotenoids (ppm) ± SD
Root Leaves Root Leaves a B total
chlorophyll
C2 Cd 50 ppm 35.00 ± 3.85 d
30.25 ± 3.33 c
33.25 ± 3.66 c
69.35 ± 7.45 cd
27.30 ± 2.18 ab
20.22 ± 1.62 abc
47.52 ± 3.80 abc
42.20 ± 3.38 d
T10 Mo 0.5 ppm (S.S) 54.94 ± 4.94 abc
34.16 ± 3.07 c
57.00 ± 5.13 ab
85.00 ± 7.65 abcd
28.46 ± 2.56 a
23.22 ± 2.09 ab
51.68 ± 4.65 ab
45.12 ± 3.61 cd
T11 Mo 1.0 ppm (S.S) 71.25 ± 7.84 a
49.43 ± 5.44 a
63.00 ± 6.93 ab
91.05 ± 10.02 abc
25.37 ± 2.03 ab
21.20 ± 1.70 abc
46.57 ± 3.73 abc
47.02 ± 3.76 cd
T12 Mo 2.0 ppm (S.S) 67.00 ± 5.36 ab
36.24 ± 2.90 bc
61.25 ± 4.90 ab
75.00 ± 6.00 bcd
20.84 ± 1.67 b
16.82 ± 1.35 c
37.66 ± 3.01 c
50.23 ± 4.02 cd
T13 Mo 0.5 ppm (A.S) 47.49 ± 5.22 cd
43.59 ± 4.79 ab
47.57 ± 5.23 bc
70.35 ± 7.74 cd
24.75 ± 1.98 ab
18.06 ± 1.44 bc
42.81 ± 3.42 bc
46.31 ± 3.24 cd
T14 Mo 1.0 ppm (A.S) 57.08 ± 4.57 abc
44.53 ± 3.56 ab
51.73 ± 4.14 ab
73.00 ± 5.84 bcd
30.11 ± 2.41 a
21.17 ± 1.69 abc
51.28 ± 4.10 ab
53.02 ± 3.18 cd
T15 Mo 2.0 ppm (A.S) 67.00 ± 7.37 ab
39.97 ± 4.40 abc
65.00 ± 7.15 a
64.48 ± 7.09 d
30.88 ± 2.47 a
21.71 ± 1.74 abc
52.59 ± 4.21 ab
67.42 ± 5.39 b
T16 Mo 0.5 ppm (F.S) 51.22 ± 4.10 bcd
45.14 ± 3.61 ab
57.00 ± 4.56 ab
101.85 ± 8.15 a
28.09 ± 2.25 a
19.88 ± 1.59 abc
47.97 ± 3.84 abc
58.03 ± 4.06 bc
T17 Mo 1.0 ppm (F.S) 57.99 ± 6.38 abc
51.24 ± 5.64 a
64.00 ± 7.04 ab
96.36 ± 10.60 ab
31.71 ± 2.54 a
22.30 ± 1.78 ab
54.01 ± 4.32 ab
81.89 ± 6.55 a
T18 Mo 2.0 ppm (F.S) 69.00 ± 8.28 a
40.56 ± 4.87 abc
66.00 ± 7.92 a
85.00 ± 10.20 abcd
33.52 ± 4.02 a
23.57 ± 2.83 a
57.09 ± 6.85 a
88.61 ± 6.20 a

CHAPTER # 3 RESULTS
88
Table 3. 25: Effect of Mo treatments on free proline, phenolic compounds, chlorophyll (a, b) and carotenoids concentration in Cannabis sativa plant grown
in soil contaminated with 50 ppm Cd. Note: ‗SD‘ stands for ‗standard deviation‘ and different alphabets in superscript represent significant difference
between the values within a single column.
Treatments Free proline (ppm) ± SD Total Phenolics (ppm)
± SD
Chlorophyll contents (ppm) ± SD Carotenoids (ppm) ± SD
R S R S a B total
chlorophyll
C3 Cd 100 ppm 40.20 ±
2.41 c
32.12 ±
1.93 d
40.22 ±
2.41 c
75.00 ±
4.50 bcd
22.33 ±
1.34 c
16.54 ±
0.99 c
38.87 ± 2.33 d
36.23 ± 2.90 d
T19 Mo 0.5 ppm (S.S) 46.70 ±
4.20 c
35.53 ±
3.20 cd
53.94 ±
5.66 ab
83.51 ±
7.52 bcd
29.32 ±
2.64 abc
25.45 ±
2.29 a
54.77 ± 4.93 ab
40.12 ± 3.61 cd
T20 Mo 1.0 ppm (S.S) 60.57 ±
6.66 ab
51.41 ±
5.66 ab
50.83 ±
5.59 abc
94.69 ±
10.42 ab
25.65 ±
2.05 bc
23.21 ±
1.86 ab
48.86 ± 3.91 abcd
45.02 ± 3.76 cd
T21 Mo 2.0 ppm (S.S) 68.23 ±
5.46 a
40.60 ±
3.25 bcd
65.91 ±
4.47 a
86.27 ±
6.90 abcd
27.00 ±
2.16 abc
16.82 ±
1.35 c
43.82 ± 3.51 bcd
48.23 ± 4.02 cd
T22 Mo 0.5 ppm (A.S) 40.37 ±
4.44 c
45.33 ±
4.99 abc
50.42 ±
5.55 abc
73.16 ±
8.05 bcd
25.23 ±
2.02 bc
15.87 ±
1.27 c
41.10 ± 3.29 cd
44.31 ± 3.24 cd
T23 Mo 1.0 ppm (A.S) 48.52 ±
3.88 bc
43.43 ±
3.47 abcd
54.83 ±
4.39 ab
69.57 ±
5.57 cd
26.87 ±
2.15 abc
17.15 ±
1.37 c
44.02 ± 3.52 bcd
53.02 ± 3.18 bc
T24 Mo 2.0 ppm (A.S) 52.76 ±
5.80 bc
41.57 ±
4.57 bcd
58.13 ±
6.39 b
67.06 ±
7.38 d
30.88 ±
2.47 ab
20.30 ±
1.62 bc
51.18 ± 4.09 abc
67.42 ± 5.39 b
T25 Mo 0.5 ppm (F.S) 43.54 ±
3.48 c
41.12 ±
3.29 bcd
60.44 ±
4.83 ab
100.92 ±
8.47 ab
25.00 ±
2.00 bc
15.23 ±
1.22 c
40.23 ± 3.22 cd
60.03 ± 4.06 bc
T26 Mo 1.0 ppm (F.S) 46.00 ±
5.06 bc
53.29 ±
5.86 a
49.24 ±
5.42 abc
105.21 ±
11.02 a
32.56 ±
2.60 a
22.10 ±
1.77 ab
54.66 ± 4.37 a
84.89 ± 6.55 a
T27 Mo 2.0 ppm (F.S) 41.23 ±
4.95 c
34.49 ±
4.14 bcd
44.68 ±
5.36 bc
113.27
±10.35 a
33.52 ±
4.02 a
23.14 ±
2.78 ab
56.66 ± 6.80 a
88.61 ± 6.20 a

CHAPTER # 3 RESULTS
89
Figure 3. 5: Overall effect of the molybdenum on concentration of total phenolic and free
proline Cannabis sativa plant grown in soil containing different concentrations of Cd (25, 50
and 100 ppm).
24.43
38.68
54.26 59.92
55.23
73.59
51.55
70.81
0.00
10.00
20.00
30.00
40.00
50.00
60.00
70.00
80.00
90.00
Free Proline Total phenolics
Co
nce
ntr
ario
n (
pp
m)
controls without Mo25 ppm Cd in soil + Mo50 ppm Cd in soil + Mo100 ppm Cd in soil + Mo

CHAPTER # 3 RESULTS
90
3.3.2.3 Effect of different treatments of molybdenum on cadmium uptake in Cannabis sativa
plant.
The effect of Mo on Cd concentration, accumulation, translocation and bioconcentration in
Cannabis sativa plant is given in Tables (3.26, 3.27 and 3.28). The table 3.26 shows the
effect of different concentrations of Cd in soil i.e. C1 (25 ppm Cd), C2 (50 ppm Cd) and C3
(100 ppm Cd) on uptake and accumulation of Cd in the plants. It was found that Cd
concentration and accumulation in the plants increased in the order of C1< C2< C3. In the
same table effect of molybdenum treatments (T1-T9) on Cd uptake by the plant from 25 ppm
Cd contaminated soil as compare to C1 (25 ppm Cd, without Mo) is given. Molybdenum
treatments increased cadmium contents in the plant as compared to C1. Concentration of Cd
in roots and stem of the plant were highly increased by 2 ppm Mo in the form of soil addition
(T6) and seed soaking (T3) respectively. Application of 2 ppm Mo foliar spray (T9) most
significantly increased Cd concentration in leaves as compared to C1 (Table 3.26). The
treatments (T1 – T9) increased accumulation of Cd in different parts of the plant. Highest Cd
accumulation in roots, stem and leaves of the plant were recorded in the treatments T5 (1
ppm Mo added to soil), T9 (2 ppm Mo foliar spray) and T8 (1 ppm Mo foliar spray)
respectively. Cadmium translocation from roots into aerial parts of the plant was highly
increased by the treatment T2 (1.00 ppm Mo seed soaking). The treatments of Mo
demonstrated increase in Cd-bioconcentration as compared to C1. Highest increase in Cd
bioconcentration was noted in the treatment T5 (1.00 ppm Mo into soil) as given in table
3.26.
The effect of molybdenum treatments on cadmium concentration, accumulation, translocation
and bioconcentration in Cannabis sativa plant grown in soil contaminated with 50 ppm Cd is
given in table 3.27. The treatments of molybdenum demonstrated increase in Cd
concentration in different parts of the plant as compared to C2 (50 ppm Cd added to soil).
Highest significant Cd concentrations in roots, stem and leaves were found in the treatments
T15 (2.00 ppm Mo into soil), T12 (2.00 ppm Mo as seed soaking) and T16 (0.5 ppm Mo as
foliar spray) respectively (Table 3.27). Foliar application of 2.00 ppm Mo (T18) most
significantly increased Cd accumulation in roots and stem of the plant. Treatment of 2.00
ppm Mo as seed soaking (T12) demonstrated highly significant Cd accumulation in leaves of
the plant (Table 3.27). Cadmium translocation from roots into stem and leaves were
significantly increased by the treatment T12 (2.00 ppm Mo as seed soaking). Treatments of

CHAPTER # 3 RESULTS
91
Mo (T10 – T18) have increased the Cd bioconcentration as compared to C2 while most
significantly higher bioconcentration of Cd was recorded in the treatments T12 (Table 3.27).
The effect of Mo treatments (T19 –T27) on Cd uptake in Cannabis sativa plant grown in 100
ppm Cd contaminated soil is given in table 3.28. The treatments of Mo increased
concentration of Cd in all parts of the plant as compared to C3 (100 ppm Cd in soil, without
Mo). Highest increase in roots Cd concentration was shown by 2 ppm Mo added to soil
(T24). Stem and leaves of the plant showed highest concentration of Cd in 2 ppm (T27) and
0.5 ppm Mo foliar spray (T25) respectively. Accumulation of Cd in roots of the plant was
highly increased by 2 ppm Mo added to soil (T24). Stem and leaves demonstrated highest
significant Cd accumulation with foliar sprayed of 0.5 ppm Mo (T25) and 2 ppm Mo (T27)
respectively. The treatment T27 significantly increased Cd accumulation in the entire plant as
compared C3 (100 ppm Cd in soil, without Mo), given in table 3.28.
Overall effect of Mo treatments on Cd accumulation and bioconcentration in Cannabis sativa
plant under different concentrations of Cd in soil is given in Figure 3.6. The figure showed
that Cd accumulation increased with increase in concentration of cadmium in soil while Cd
bioaccumulation decreased with increasing Cd in soil.
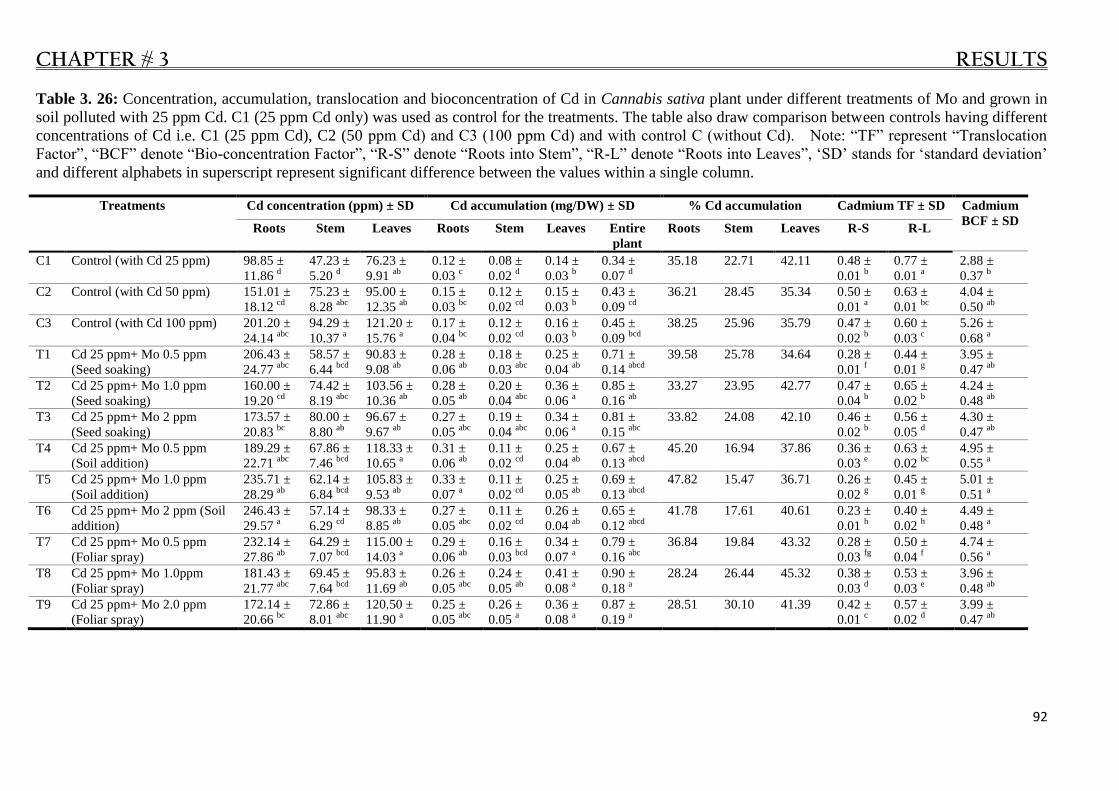
CHAPTER # 3 RESULTS
92
Table 3. 26: Concentration, accumulation, translocation and bioconcentration of Cd in Cannabis sativa plant under different treatments of Mo and grown in
soil polluted with 25 ppm Cd. C1 (25 ppm Cd only) was used as control for the treatments. The table also draw comparison between controls having different
concentrations of Cd i.e. C1 (25 ppm Cd), C2 (50 ppm Cd) and C3 (100 ppm Cd) and with control C (without Cd). Note: ―TF‖ represent ―Translocation
Factor‖, ―BCF‖ denote ―Bio-concentration Factor‖, ―R-S‖ denote ―Roots into Stem‖, ―R-L‖ denote ―Roots into Leaves‖, ‗SD‘ stands for ‗standard deviation‘
and different alphabets in superscript represent significant difference between the values within a single column.
Treatments Cd concentration (ppm) ± SD Cd accumulation (mg/DW) ± SD % Cd accumulation Cadmium TF ± SD Cadmium
BCF ± SD Roots Stem Leaves Roots Stem Leaves Entire
plant
Roots Stem Leaves R-S R-L
C1 Control (with Cd 25 ppm) 98.85 ±
11.86 d
47.23 ±
5.20 d
76.23 ±
9.91 ab
0.12 ±
0.03 c
0.08 ±
0.02 d
0.14 ±
0.03 b
0.34 ±
0.07 d
35.18 22.71 42.11 0.48 ±
0.01 b
0.77 ±
0.01 a
2.88 ±
0.37 b
C2 Control (with Cd 50 ppm) 151.01 ±
18.12 cd
75.23 ±
8.28 abc
95.00 ±
12.35 ab
0.15 ±
0.03 bc
0.12 ±
0.02 cd
0.15 ±
0.03 b
0.43 ±
0.09 cd
36.21 28.45 35.34 0.50 ±
0.01 a
0.63 ±
0.01 bc
4.04 ±
0.50 ab
C3 Control (with Cd 100 ppm) 201.20 ±
24.14 abc
94.29 ±
10.37 a
121.20 ±
15.76 a
0.17 ±
0.04 bc
0.12 ±
0.02 cd
0.16 ±
0.03 b
0.45 ±
0.09 bcd
38.25 25.96 35.79 0.47 ±
0.02 b
0.60 ±
0.03 c
5.26 ±
0.68 a
T1 Cd 25 ppm+ Mo 0.5 ppm
(Seed soaking)
206.43 ±
24.77 abc
58.57 ±
6.44 bcd
90.83 ±
9.08 ab
0.28 ±
0.06 ab
0.18 ±
0.03 abc
0.25 ±
0.04 ab
0.71 ±
0.14 abcd
39.58 25.78 34.64 0.28 ±
0.01 f
0.44 ±
0.01 g
3.95 ±
0.47 ab
T2 Cd 25 ppm+ Mo 1.0 ppm
(Seed soaking)
160.00 ±
19.20 cd
74.42 ±
8.19 abc
103.56 ±
10.36 ab
0.28 ±
0.05 ab
0.20 ±
0.04 abc
0.36 ±
0.06 a
0.85 ±
0.16 ab
33.27 23.95 42.77 0.47 ±
0.04 b
0.65 ±
0.02 b
4.24 ±
0.48 ab
T3 Cd 25 ppm+ Mo 2 ppm
(Seed soaking)
173.57 ±
20.83 bc
80.00 ±
8.80 ab
96.67 ±
9.67 ab
0.27 ±
0.05 abc
0.19 ±
0.04 abc
0.34 ±
0.06 a
0.81 ±
0.15 abc
33.82 24.08 42.10 0.46 ±
0.02 b
0.56 ±
0.05 d
4.30 ±
0.47 ab
T4 Cd 25 ppm+ Mo 0.5 ppm
(Soil addition)
189.29 ±
22.71 abc
67.86 ±
7.46 bcd
118.33 ±
10.65 a
0.31 ±
0.06 ab
0.11 ±
0.02 cd
0.25 ±
0.04 ab
0.67 ±
0.13 abcd
45.20 16.94 37.86 0.36 ±
0.03 e
0.63 ±
0.02 bc
4.95 ±
0.55 a
T5 Cd 25 ppm+ Mo 1.0 ppm
(Soil addition)
235.71 ±
28.29 ab
62.14 ±
6.84 bcd
105.83 ±
9.53 ab
0.33 ±
0.07 a
0.11 ±
0.02 cd
0.25 ±
0.05 ab
0.69 ±
0.13 abcd
47.82 15.47 36.71 0.26 ±
0.02 g
0.45 ±
0.01 g
5.01 ±
0.51 a
T6 Cd 25 ppm+ Mo 2 ppm (Soil
addition)
246.43 ±
29.57 a
57.14 ±
6.29 cd
98.33 ±
8.85 ab
0.27 ±
0.05 abc
0.11 ±
0.02 cd
0.26 ±
0.04 ab
0.65 ±
0.12 abcd
41.78 17.61 40.61 0.23 ±
0.01 h
0.40 ±
0.02 h
4.49 ±
0.48 a
T7 Cd 25 ppm+ Mo 0.5 ppm
(Foliar spray)
232.14 ±
27.86 ab
64.29 ±
7.07 bcd
115.00 ±
14.03 a
0.29 ±
0.06 ab
0.16 ±
0.03 bcd
0.34 ±
0.07 a
0.79 ±
0.16 abc
36.84 19.84 43.32 0.28 ±
0.03 fg
0.50 ±
0.04 f
4.74 ±
0.56 a
T8 Cd 25 ppm+ Mo 1.0ppm
(Foliar spray)
181.43 ±
21.77 abc
69.45 ±
7.64 bcd
95.83 ±
11.69 ab
0.26 ±
0.05 abc
0.24 ±
0.05 ab
0.41 ±
0.08 a
0.90 ±
0.18 a
28.24 26.44 45.32 0.38 ±
0.03 d
0.53 ±
0.03 e
3.96 ±
0.48 ab
T9 Cd 25 ppm+ Mo 2.0 ppm
(Foliar spray)
172.14 ±
20.66 bc
72.86 ±
8.01 abc
120.50 ±
11.90 a
0.25 ±
0.05 abc
0.26 ±
0.05 a
0.36 ±
0.08 a
0.87 ±
0.19 a
28.51 30.10 41.39 0.42 ±
0.01 c
0.57 ±
0.02 d
3.99 ±
0.47 ab

CHAPTER # 3 RESULTS
93
Table 3. 27: Effect of Mo treatments on Cd contents in Cannabis sativa plant grown in 50 ppm Cd polluted soil. Note: ―TF‖ represent ―Translocation
Factor‖, ―BCF‖ denote ―Bio-concentration Factor‖, ―R-S‖ denote ―Roots into Stem‖, ―R-L‖ denote ―Roots into Leaves‖, ‗SD‘ stands for ‗standard deviation‘
and different alphabets in superscript represent significant difference between the values within a single column.
Treatments Cd concentration (ppm) ± SD Cd accumulation (mg/DW) ± SD % Cd accumulation Cd TF ± SD Cd BCF
± SD Roots Stem Leaves Roots Stem Leaves Entire
plant
Roots Stem Leaves R-S R-L
C2 Control (with Cd 50 ppm) 151.01 ±
13.59 d
75.23 ±
9.03 b
95.00 ±
12.35 b
0.15 ±
0.03 b
0.12 ±
0.03 b
0.15 ±
0.04 b
0.43 ±
0.10 b
36.27 28.42 35.31 0.50 ±
0.02 a
0.63 ±
0.03 a
2.02 ±
0.23 b
T10 Cd 50 ppm+ Mo 0.5 ppm
(Seed soaking)
227.07 ±
20.44 abc
76.49 ±
9.18 b
113.13 ±
14.71 ab
0.26 ±
0.05 ab
0.22 ±
0.05 ab
0.29 ±
0.06 ab
0.77 ±
0.16 ab
33.47 28.83 37.70 0.34 ±
0.03 f
0.50 ±
0.05 de
2.33 ±
0.27 ab
T11 Cd 50 ppm+ Mo 1.0 ppm
(Seed soaking)
206.43 ±
18.58 abcd
85.82 ±
10.30 ab
126.62 ±
16.46 ab
0.30 ±
0.06 ab
0.17 ±
0.04 ab
0.36 ±
0.09 ab
0.83 ±
0.19 ab
36.44 20.85 42.72 0.41 ±
0.05 d
0.61 ±
0.06 ab
2.64 ±
0.30 ab
T12 Cd 50 ppm+ Mo 2 ppm
(Seed soaking)
217.86 ±
19.61 abc
108.00 ±
12.96 a
132.58 ±
17.23 ab
0.31 ±
0.07 ab
0.19 ±
0.05 ab
0.40 ±
0.11 a
0.91 ±
0.23 ab
34.25 21.39 44.36 0.49 ±
0.03 ab
0.62 ±
0.07 ab
3.02 ±
0.33 a
T13 Cd 50 ppm+ Mo 0.5 ppm
(Soil addition)
203.57 ±
18.32 bcd
88.62 ±
10.63 ab
125.00 ±
16.25 ab
0.26 ±
0.05 ab
0.14 ±
0.03 b
0.21 ±
0.05 ab
0.60 ±
0.14 ab
42.52 22.70 34.78 0.43 ±
0.05 cd
0.61 ±
0.02 ab
2.69 ±
0.30 ab
T14 Cd 50 ppm+ Mo 1.0 ppm
(Soil addition)
244.29 ±
21.99 abc
76.12 ±
9.13 b
131.81 ±
17.14 ab
0.34 ±
0.07 a
0.12 ±
0.03 b
0.21 ±
0.05 ab
0.67 ±
0.16 ab
50.70 18.07 31.23 0.31 ±
0.06 fg
0.54 ±
0.06 cd
2.90 ±
0.22 a
T15 Cd 50 ppm+ Mo 2 ppm (Soil
addition)
260.71 ±
23.46 a
72.39 ±
8.69 b
118.18 ±
15.36 ab
0.29 ±
0.06 ab
0.13 ±
0.03 b
0.32 ±
0.08 ab
0.74 ±
0.17 ab
39.68 17.88 42.43 0.28 ±
0.08 g
0.45 ±
0.03 e
2.64 ±
0.30 ab
T16 Cd 50 ppm+ Mo 0.5 ppm
(Foliar spray)
255.36 ±
22.98 ab
73.88 ±
8.87 b
143.23 ±
18.62 a
0.29 ±
0.07 ab
0.17 ±
0.04 b
0.29 ±
0.08 ab
0.74 ±
0.19 ab
38.57 22.17 39.25 0.29 ±
0.07 g
0.56 ±
0.05 bcd
2.76 ±
0.31 ab
T17 Cd 50 ppm+ Mo 1.0ppm
(Foliar spray)
210.71 ±
18.96 abc
78.36 ±
9.40 b
119.36 ±
15.52 ab
0.27 ±
0.07 ab
0.25 ±
0.07 ab
0.37 ±
0.10 ab
0.89 ±
0.24 ab
30.82 28.11 41.07 0.37 ±
0.03 e
0.57 ±
0.08 abc
2.35 ±
0.27 ab
T18 Cd 50 ppm+ Mo 2.0 ppm
(Foliar spray)
196.43 ±
17.68 cd
91.00 ±
10.92 ab
106.06 ±
13.79 ab
0.37 ±
0.08 a
0.30 ±
0.07 a
0.38 ±
0.09 ab
1.05 ±
0.24 a
35.35 28.62 36.03 0.46 ±
0.07 bc
0.54 ±
0.07 cd
2.40 ±
0.27 ab

CHAPTER # 3 RESULTS
94
Table 3. 28: Effect of Mo treatments on Cd contents in Cannabis sativa plant grown in 100 ppm Cd polluted soil. Note: ―TF‖ represent ―Translocation
Factor‖, ―BCF‖ denote ―Bio-concentration Factor‖, ―R-S‖ denote ―Roots into Stem‖, ―R-L‖ denote ―Roots into Leaves‖, ‗SD‘ stands for ‗standard deviation‘
and different alphabets in superscript represent significant difference between the values within a single column.
Treatments Cd concentration (ppm) Cd accumulation (mg/DW) % Cd accumulation Cd TF BCF
Roots Stem Leaves Roots Leaves Entire
plant
Roots Stem Leaves R-S R-L
C3 Control (with Cd 100 ppm) 268.00 ±
24.12 c
94.29 ±
11.31 b
121.20 ±
15.76 b
0.23 ±
0.05 b
0.12 ±
0.03 b
0.16 ±
0.04 b
0.51 ±
0.12 b
45.30 22.98 31.71 0.35 ±
0.05 ef
0.45 ±
0.05 f
1.48 ±
0.16 b
T19 Cd 100 ppm+ Mo 0.5 ppm (Seed
soaking)
287.00 ±
25.83 c
167.35 ±
20.08 a
171.73 ±
22.32 ab
0.32 ±
0.06 ab
0.27 ±
0.06 ab
0.31 ±
0.07 ab
0.90 ±
0.18 ab
35.49 30.23 34.28 0.58 ±
0.02 a
0.60 ±
0.02 bcd
1.98 ±
0.22 ab
T20 Cd 100 ppm+ Mo 1.0 ppm (Seed
soaking)
293.00 ±
26.37 c
138.56 ±
16.63 ab
192.21 ±
24.99 a
0.37 ±
0.08 ab
0.26 ±
0.06 ab
0.43 ±
0.14 ab
1.07 ±
0.20 ab
34.75 24.53 40.72 0.47 ±
0.05 c
0.65 ±
0.03 ab
1.97 ±
0.22 ab
T21 Cd 100 ppm+ Mo 2 ppm (Seed
soaking)
324.00 ±
29.16 bc
134.21 ±
16.11 ab
182.76 ±
23.76 ab
0.45 ±
0.10 ab
0.27 ±
0.07 ab
0.42 ±
0.11 ab
1.14 ±
0.24 ab
39.61 23.96 36.44 0.41 ±
0.06 d
0.56 ±
0.04 cde
2.00 ±
0.22 ab
T22 Cd 100 ppm+ Mo 0.5 ppm (Soil
addition)
326.48 ±
29.38 bc
168.32 ±
20.68 a
230.23 ±
29.93 a
0.31 ±
0.07 ab
0.22 ±
0.05 ab
0.34 ±
0.09 ab
0.87 ±
0.20 ab
36.08 25.20 38.72 0.53 ±
0.04 b
0.70 ±
0.03 a
2.35 ±
0.27 a
T23 Cd 100 ppm+ Mo 1.0 ppm (Soil
addition)
400.40 ±
36.04 ab
136.32 ±
16.36 ab
200.09 ±
26.01 a
0.44 ±
0.10 ab
0.20 ±
0.05 ab
0.30 ±
0.08 ab
0.93 ±
0.22 ab
46.96 20.98 32.06 0.34 ±
0.07 ef
0.50 ±
0.02 ef
2.32 ±
0.25 a
T24 Cd 100 ppm+ Mo 2 ppm (Soil
addition)
425.04 ±
38.25 a
135.00 ±
16.20 ab
185.91 ±
24.17 ab
0.47 ±
0.10 a
0.20 ±
0.05 ab
0.32 ±
0.06 ab
1.00 ±
0.23 ab
47.44 20.42 32.15 0.32 ±
0.08 f
0.44 ±
0.06 f
2.29 ±
0.25 a
T25 Cd 100 ppm+ Mo 0.5 ppm (Foliar
spray)
400.40 ±
36.04 ab
145.20 ±
17.42 ab
235.42 ±
28.26 a
0.41 ±
0.10 ab
0.31 ±
0.08 a
0.36 ±
0.10 ab
1.08 ±
0.28 ab
37.84 28.57 33.59 0.36 ±
0.06 e
0.54 ±
0.02 de
2.24 ±
0.25 a
T26 Cd 100 ppm+ Mo 1.0ppm (Foliar
spray)
312.93 ±
28.16 bc
164.08 ±
19.69 a
165.00 ±
21.45 ab
0.36 ±
0.09 ab
0.30 ±
0.08 ab
0.46 ±
0.15 a
1.11 ±
0.30 ab
32.27 26.58 41.15 0.52 ±
0.02 b
0.53 ±
0.03 e
1.94 ±
0.22 ab
T27 Cd 100 ppm+ Mo 2.0 ppm (Foliar
spray)
296.91 ±
26.72 c
171.45 ±
19.97 a
184.33 ±
23.96 ab
0.37 ±
0.08 ab
0.31 ±
0.07 a
0.53 ±
0.13 a
1.22 ±
0.25 a
30.73 25.72 43.55 0.56 ±
0.02 ab
0.62 ±
0.02 bc
2.02 ±
0.23 ab

CHAPTER # 3 RESULTS
95
Figure 3. 6: Overall effect of the molybdenum on Cd accumulation and Cd-bioconcentration in Cannabis
sativa plant grown in soil containing different concentrations of Cd (25, 50 and 100 ppm).
0.41
4.06
0.77
4.40
0.80
2.67
1.05
2.17
0.00
0.50
1.00
1.50
2.00
2.50
3.00
3.50
4.00
4.50
5.00
Cd accumulation (mg Cd/ dry biomass of plant) Bioconcentraion
controls without Mo
25 ppm Cd in soil
50 ppm Cd in soil
100 ppm Cd in soil

CHAPTER # 3 RESULTS
96
3.3.2.4 Correlations among different parameters
The correlations among plant growth parameters, free proline, total phenolics, photosynthetic
pigments and cadmium contents in different parts (roots, stem and leaves) of Cannabis sativa are
presented in Tables (3.29 to3.37). Cadmium accumulation in roots demonstrated strong positive
correlation with free proline and total phenolics as given in Tables 3.29, 3.30 and 3.31. The same
tables also showed positive correlation of dry weight with the concentration of phenolics and proline
in roots of the plant. Positive correlations were noted between dry weight and Cd accumulation in
stem of Cannabis sativa plant (Tables 3.32, 3.33 and 3.34). Total phenolics in plant leaves
demonstrated strong positive correlation with chlorophylls and carotenoids concentrations (Tables
3.35, 3.36 and 3.37). It was noted that free proline concentration showed positive correlation with Cd
accumulation in leaves of the plant. Dry weight in leaves demonstrated strong positive correlation
with total phenolics and chlorophyll a concentrations (Tables 3.35, 3.36 and 3.37).

CHAPTER # 3 RESULTS
97
Table 3. 29: Correlations between different parameters studied in roots of Cannabis sativa plant grown in 25 ppm Cd contaminated soil and under various
treatments of Mo.
Length (cm) Fresh weight
(g)
Dry weight
(g)
Total water
content (g)
Cd concentration (ppm) Cd
accumulation
(mg/DW)
Free Proline
(ppm)
Total Phenolics
(ppm)
Length (cm) Pearson Correlation 1 0.915**
0.781**
0.921**
-0.037 0.504* 0.753
** 0.302
Sig. (1-tailed) 0.000 0.001 0.000 0.455 0.047 0.002 0.170
Fresh weight (g) Pearson Correlation 0.915**
1 0.907**
0.984**
-0.096 0.561* 0.724
** 0.300
Sig. (1-tailed) 0.001 0.000 0.000 0.384 0.029 0.004 0.172
Dry weight (g) Pearson Correlation 0.781**
0.907**
1 0.816**
-0.129 0.621* 0.567
* 0.292
Sig. (1-tailed) 0.001 0.001 0.001 0.345 0.016 0.027 0.179
Total water
content (g)
Pearson Correlation 0.921**
0.984**
0.816**
1 -0.076 0.504* 0.751
** 0.286
Sig. (1-tailed) 0.000 0.000 0.001 0.407 0.048 0.002 0.184
Cd concentration
(ppm)
Pearson Correlation -0.037 -0.096 -0.129 -0.076 1 0.692**
0.511* 0.823
**
Sig. (1-tailed) 0.455 0.384 0.345 0.407 0.006 0.045 0.001
Cd accumulation
(mg/DW)
Pearson Correlation 0.504* 0.561
* 0.621
* 0.504
* 0.692
** 1 0.773
** 0.850
**
Sig. (1-tailed) 0.047 0.029 0.016 0.048 0.006 0.002 0.000
Free Proline
(ppm)
Pearson Correlation 0.753**
0.724**
0.567* 0.751
** 0.511
* 0.773
** 1 0.713
**
Sig. (1-tailed) 0.002 0.004 0.027 0.002 0.045 0.002 0.005
Total Phenolics
(ppm)
Pearson Correlation 0.302 0.300 0.292 0.286 0.823**
0.850**
0.713**
1
Sig. (1-tailed) 0.170 0.172 0.179 0.184 0.001 0.000 0.005
**. Correlation is significant at the 0.01 level (1-tailed). *. Correlation is significant at the 0.05 level (1-tailed).

CHAPTER # 3 RESULTS
98
Table 3. 30: Correlations between different parameters studied in roots of Cannabis sativa plant grown in 50 ppm Cd contaminated soil and under various
treatments of Mo.
Length (cm) Fresh
weight (g)
Dry weight
(g)
Total water
content (g)
Cd
concentration
(ppm)
Cd accumulation
(mg/DW)
Free Proline
(ppm)
Total phenolics
(ppm)
Length (cm) Pearson Correlation 1 0.888**
0.703* 0.816
** -0.044 0.574
* 0.773
** 0.644
*
Sig. (1-tailed) 0.000 0.012 0.002 0.452 0.041 0.004 0.022
Fresh weight (g) Pearson Correlation 0.888**
1 0.695* 0.958
** -0.029 0.588
* 0.783
** .626
*
Sig. (1-tailed) 0.000 0.013 0.000 0.468 0.037 0.004 0.027
Dry weight (g) Pearson Correlation 0.703* 0.695
* 1 0.458 -0.117 0.780
** 0.653
* 0.619*
Sig. (1-tailed) 0.012 0.013 0.091 0.374 0.004 0.020 0.012
Total water
content (g)
Pearson Correlation 0.816**
0.958**
0.458 1 0.011 0.414 0.706* 0.565
*
Sig. (1-tailed) 0.002 0.000 0.091 0.488 0.117 0.011 0.044
Cd
concentration
(ppm)
Pearson Correlation -0.044 -0.029 -0.117 0.011 1 0.526 0.420 0.548
Sig. (1-tailed) 0.452 0.468 0.374 0.488 0.059 0.114 0.051
Cd
accumulation
(mg/DW)
Pearson Correlation 0.574* 0.588
* 0.780
** 0.414 0.526 1 0.814
** 0.764
**
Sig. (1-tailed) 0.041 0.037 0.004 0.117 0.059 0.002 0.005
Free Proline
(ppm)
Pearson Correlation 0.773**
0.783**
0.653* 0.706
* 0.420 0.814
** 1 0.907
**
Sig. (1-tailed) 0.004 0.004 0.020 0.011 0.114 0.002 0.000
Total phenolics
(ppm)
Pearson Correlation 0.644* 0.626
* 0.619* 0.565
* 0.548 0.764
** 0.907
** 1
Sig. (1-tailed) 0.022 0.027 0.012 0.044 0.051 0.005 0.000
**. Correlation is significant at the 0.01 level (1-tailed).
*. Correlation is significant at the 0.05 level (1-tailed).

CHAPTER # 3 RESULTS
99
Table 3. 31: Correlations between different parameters studied in roots of Cannabis sativa plant grown in 100 ppm Cd contaminated soil and under various
treatments of Mo.
Length (cm) Fresh
weight (g)
Dry weight
(g)
Total
water
content (g)
Cd
concentration
(ppm)
Cd
accumulation
(mg/DW)
Free Proline
(ppm)
Total phenolics
(ppm)
Length (cm) Pearson Correlation 1 0.860** 0.965** 0.804** -0.227 0.449 0.662* 0.086 Sig. (1-tailed) 0.001 0.000 0.003 0.264 0.097 0.018 0.407
Fresh weight (g)
Pearson Correlation 0.860** 1 0.914** 0.993** -0.229 0.403 0.692* 0.056 Sig. (1-tailed) 0.001 0.000 0.000 0.262 0.124 0.013 0.439
Dry weight (g) Pearson Correlation 0.965** 0.914** 1 0.862** -0.066 0.599* 0.763** 0.540* Sig. (1-tailed) 0.000 0.000 0.001 0.428 0.014 0.005 0.019
Total water content (g)
Pearson Correlation 0.804** 0.993** 0.862** 1 -0.268 0.335 0.650* 0.013 Sig. (1-tailed) 0.003 0.000 0.001 0.227 0.172 0.021 0.486
Cd concentration (ppm)
Pearson Correlation -0.227 -0.229 -0.066 -0.268 1 0.758** 0.084 0.549 Sig. (1-tailed) 0.264 0.262 0.428 0.227 0.006 0.409 0.050
Cd accumulation (mg/DW)
Pearson Correlation 0.449 0.403 0.599* 0.335 0.758** 1 0.582* 0.555* Sig. (1-tailed) 0.097 0.124 0.014 0.172 0.006 0.039 0.048
Free Proline (ppm)
Pearson Correlation 0.662* 0.692* 0.763** 0.650* 0.084 0.582* 1 0.332 Sig. (1-tailed) 0.018 0.013 0.005 0.021 0.409 0.039 0.174
Total phenolics (ppm)
Pearson Correlation 0.086 0.056 0.540* 0.013 0.549 0.555* 0.332 1 Sig. (1-tailed) 0.407 0.439 0.019 0.486 0.050 0.048 0.174
*. Correlation is significant at the 0.05 level (1-tailed).
**. Correlation is significant at the 0.01 level (1-tailed).

CHAPTER # 3 RESULTS
100
Table 3. 32: Correlations between different parameters studied in stem of Cannabis sativa plant grown in 25 ppm Cd contaminated soil and under various treatments
of Mo.
Length (cm) Fresh weight (g) Dry weight (g) Total water
content (g)
Cd concentration
(ppm)
Cd accumulation
(mg/DW)
Length (cm) Pearson Correlation 1 0.807**
0.797**
0.800**
-0.249 0.713**
Sig. (1-tailed) 0.001 0.001 0.001 0.217 0.005
Fresh weight (g) Pearson Correlation 0.807**
1 0.969**
0.997**
-0.053 0.918**
Sig. (1-tailed) 0.001 0.000 0.000 0.435 0.000
Dry weight (g) Pearson Correlation 0.797**
0.969**
1 0.946**
-0.085 0.925**
Sig. (1-tailed) 0.001 0.000 0.000 0.397 0.000
Total water content
(g)
Pearson Correlation 0.800**
0.997**
0.946**
1 -0.042 0.904**
Sig. (1-tailed) 0.001 0.000 0.000 0.449 0.000
Cd concentration
(ppm)
Pearson Correlation -0.249 -0.053 -0.085 -0.042 1 0.283
Sig. (1-tailed) 0.217 0.435 0.397 0.449 0.187
Cd accumulation
(mg/DW)
Pearson Correlation 0.713**
0.918**
0.925**
0.904**
0.283 1
Sig. (1-tailed) 0.005 0.000 0.000 0.000 0.187
**. Correlation is significant at the 0.01 level (1-tailed).

CHAPTER # 3 RESULTS
101
Table 3. 33: Correlations between different parameters studied in stem of Cannabis sativa plant grown in 50 ppm Cd contaminated soil and under various
treatments of Mo.
Length (cm) Fresh weight
(g)
Dry weight (g) Total water
content (g)
Cd concentration
(ppm)
Cd accumulation
(mg/DW)
Length (cm) Pearson Correlation 1 0.687* 0.644
* 0.687
* -0.217 0.601
*
Sig. (1-tailed) 0.014 0.022 0.014 0.273 0.033
Fresh weight (g) Pearson Correlation 0.687* 1 0.951
** 0.996
** -0.088 0.935
**
Sig. (1-tailed) 0.014 0.000 0.000 0.405 0.000
Dry weight (g) Pearson Correlation 0.644* 0.951
** 1 0.919
** -0.153 0.956
**
Sig. (1-tailed) 0.022 0.000 0.000 0.336 0.000
Total water content (g) Pearson Correlation 0.687* 0.996
** 0.919
** 1 -0.066 0.910
**
Sig. (1-tailed) 0.014 0.000 0.000 0.428 0.000
Cd concentration (ppm) Pearson Correlation -0.217 -0.088 -0.153 -0.066 1 0.139
Sig. (1-tailed) 0.273 0.405 0.336 0.428 0.351
Cd accumulation
(mg/DW)
Pearson Correlation 0.601* 0.935
** 0.956
** 0.910
** 0.139 1
Sig. (1-tailed) 0.033 0.000 0.000 0.000 0.351
*. Correlation is significant at the 0.05 level (1-tailed).
**. Correlation is significant at the 0.01 level (1-tailed).

CHAPTER # 3 RESULTS
102
Table 3. 34: Correlations between different parameters studied in stem of Cannabis sativa plant grown in 100 ppm Cd contaminated soil and under various
treatments of Mo.
Length (cm) Fresh weight
(g)
Dry weight
(g)
Total water
content (g)
Cd
concentration
(ppm)
Cd accumulation
(mg/DW)
Length (cm) Pearson Correlation 1 0.295 0.364 0.258 0.303 0.411
Sig. (1-tailed) 0.204 0.150 0.236 0.197 0.119
Fresh weight (g) Pearson Correlation 0.295 1 0.946** 0.992** 0.089 0.732**
Sig. (1-tailed) 0.204 0.000 0.000 0.403 0.008
Dry weight (g) Pearson Correlation 0.364 0.946** 1 0.897** 0.232 0.845**
Sig. (1-tailed) 0.150 0.000 0.000 0.260 0.001
Total water content
(g)
Pearson Correlation 0.258 0.992** 0.897** 1 0.030 0.666*
Sig. (1-tailed) 0.236 0.000 0.000 0.467 0.018
Cd concentration
(ppm)
Pearson Correlation 0.303 0.089 0.232 0.030 1 0.707*
Sig. (1-tailed) 0.197 0.403 0.260 0.467 0.011
Cd accumulation
(mg/DW)
Pearson Correlation 0.411 0.732** 0.845** 0.666* 0.707* 1
Sig. (1-tailed) 0.119 0.008 0.001 0.018 0.011
*. Correlation is significant at the 0.05 level (1-tailed).
**. Correlation is significant at the 0.01 level (1-tailed).

CHAPTER # 3 RESULTS
103
Table 3. 35: Correlations between different parameters studied in leaves of Cannabis sativa plant grown in 25 ppm Cd contaminated soil and under various
treatments of Mo.
Length
(cm)
Fresh
weight (g)
Dry weight
(g)
Total
water
content (g)
Cd
concentration
(ppm)
Cd
accumulation
(mg/DW)
Free
Proline
(ppm)
Total
phenolics
(ppm)
Chlorophyll
a (ppm)
Chlorophyll
b (ppm)
Carotenoids
(ppm)
Length (cm) Pearson Correlation 1 0.937
** 0.969
** -0.131 0.915
** 0.546
* 0.540
* 0.644
* 0.764
** 0.714
** 0.714
**
Sig. (1-tailed) 0.000 0.000 0.342 0.000 0.033 0.035 0.012 0.002 0.005 0.005
Fresh
weight (g)
Pearson Correlation 0.937**
1 0.822**
-0.172 0.956**
0.456 0.647* 0.541
* 0.649
* 0.752
** 0.752
**
Sig. (1-tailed) 0.000 0.001 0.297 0.000 0.068 0.011 0.035 0.011 0.002 0.002
Dry weight
(g)
Pearson Correlation 0.969**
0.822**
1 0.093 0.817**
0.568* 0.424 0.669
** 0.787
** 0.633
* 0.633
*
Sig. (1-tailed) 0.000 0.001 0.387 0.001 0.027 0.085 0.009 0.001 0.014 0.014
Total water
content (g)
Pearson Correlation -0.131 -0.172 0.093 1 0.114 0.494 0.295 -0.124 -0.317 -0.145 - 0.145
Sig. (1-tailed) 0.342 0.297 0.387 0.362 0.051 0.176 0.350 0.158 0.326 0.326 Cd
concentration
(ppm)
Pearson Correlation 0.915**
0.956**
0.817**
0.114 1 0.610* 0.742
** 0.517
* 0.574
* 0.710
** 0.710
**
Sig. (1-tailed) 0.000 0.000 0.001 0.362 0.018 0.003 0.042 0.025 0.005 0.005 Cd
accumulation
(mg/DW)
Pearson Correlation 0.546* 0.456 0.568
* 0.494 0.610
* 1 0.592
* 0.157 0.117 0.186 0.186
Sig. (1-tailed) 0.033 0.068 0.027 0.051 0.018 0.021 0.313 0.359 0.281 0.281
Free Proline
(ppm)
Pearson Correlation 0.540* 0.647
* 0.424 0.295 0.742
** 0.592
* 1 0.181 0.225 0.336 0.336
Sig. (1-tailed) 0.035 0.011 0.085 0.176 0.003 0.021 0.287 0.241 0.143 0.143 Total
phenolics
(ppm)
Pearson Correlation 0.644* 0.541
* 0.669
** -0.124 0.517
* 0.157 0.181 1 0.899
** 0.830
** 0.830
**
Sig. (1-tailed) 0.012 0.035 0.009 0.350 0.042 0.313 0.287 0.000 0.000 0.000
Chlorophyll a
(ppm)
Pearson Correlation 0.764**
0.649* 0.787
** -0.317 0.574
* 0.117 0.225 0.899
** 1 0.698
** 0.698
**
Sig. (1-tailed) 0.002 0.011 0.001 0.158 0.025 0.359 0.241 0.000 0.006 0.006
Chlorophyll b
(ppm)
Pearson Correlation 0.714**
0.752**
0.633* -0.145 0.710
** 0.186 0.336 0.830
** 0.698
** 1 0.940
**
Sig. (1-tailed) 0.005 0.002 0.014 0.326 0.005 0.281 0.143 0.000 0.006 0.000
Carotenoids
(ppm)
Pearson Correlation 0.714**
0.752**
0.633* - 0.145 0.710
** 0.186 0.336 0.830
** 0.698
** 0.940
** 1
Sig. (1-tailed) 0.005 0.002 0.014 0.326 0.005 0.281 0.143 0.000 0.006 0.000
**. Correlation is significant at the 0.01 level (1-tailed). *. Correlation is significant at the 0.05 level (1-tailed).

CHAPTER # 3 RESULTS
104
Table 3. 36: Correlations between different parameters studied in leaves of Cannabis sativa plant grown in 50 ppm Cd contaminated soil and under various
treatments of Mo.
Length
(cm)
Fresh
weight (g)
Dry
weight (g)
Total water
content (g)
Cd
concentration
(ppm)
Cd
accumulation
(mg/DW)
Free
Proline
(ppm)
Total
phenolics
(ppm)
Chlorophyll
a (ppm)
Chlorophyll
b (ppm)
Carotenoids
(ppm)
Length (cm) Pearson Correlation 1 0.532 0.752** -0.195 0.366 0.349 0.241 0.734** 0.775** 0.694* 0.694*
Sig. (1-tailed) 0.057 0.006 0.294 0.149 0.162 0.251 0.008 0.004 0.013 0.013
Fresh weight
(g)
Pearson Correlation 0.532 1 -0.158 -0.109 0.929** 0.175 0.353 0.221 0.367 0.666* 0.666*
Sig. (1-tailed) 0.057 0.332 0.382 0.000 0.314 0.158 0.269 0.148 0.018 0.018
Dry weight (g) Pearson Correlation 0.752** -0.158 1 -0.143 -0.296 0.270 0.006 0.684* 0.619* 0.291 0.291
Sig. (1-tailed) 0.006 0.332 0.347 0.203 0.225 0.493 0.015 0.028 0.207 0.207
Total water
content (g)
Pearson Correlation -0.195 -0.109 -0.143 1 0.252 0.548 0.371 -0.356 -0.450 -0.129 -0.129
Sig. (1-tailed) 0.294 0.382 0.347 0.242 0.050 0.146 0.156 0.096 0.361 0.361
Cd
concentration
(ppm)
Pearson Correlation 0.366 0.929** -0.296 0.252 1 0.341 0.462 0.014 0.137 0.511 0.521
Sig. (1-tailed) 0.149 0.000 0.203 0.242 0.168 0.089 0.484 0.353 0.050 0.050
Cd
accumulation
(mg/DW)
Pearson Correlation 0.349 0.175 0.270 0.548 0.341 1 0.567* 0.213 0.121 0.390 0.390
Sig. (1-tailed) 0.162 0.314 0.225 0.050 0.168 0.044 0.277 0.370 0.133 0.133
Free Proline
(ppm)
Pearson Correlation 0.241 0.353 0.006 0.371 0.462 0.567* 1 0.183 0.290 0.319 0.319
Sig. (1-tailed) 0.251 0.158 0.493 0.146 0.089 0.044 0.306 0.208 0.184 0.184
Total phenolics
(ppm)
Pearson Correlation 0.734** 0.221 0.684* -0.356 0.014 0.213 0.183 1 0.857** 0.737** 0.737**
Sig. (1-tailed) 0.008 0.269 0.015 0.156 0.484 0.277 0.306 0.001 0.008 0.008
Chlorophyll a
(ppm)
Pearson Correlation 0.775** 0.367 0.619* -0.450 0.137 0.121 0.290 0.857** 1 0.525 0.525
Sig. (1-tailed) 0.004 0.148 0.028 0.096 0.353 0.370 0.208 0.001 0.060 0.060
Chlorophyll b
(ppm)
Pearson Correlation 0.694* 0.666* 0.291 -0.129 0.511 0.390 0.319 0.737** 0.525 1 0.900**
Sig. (1-tailed) 0.013 0.018 0.207 0.361 0.050 0.133 0.184 0.008 0.060 .000
Carotenoids
(ppm)
Pearson Correlation 0.694* 0.666* 0.291 -0.129 0.521 0.390 0.319 0.737** 0.525 0.900** 1
Sig. (1-tailed) 0.013 0.018 0.207 0.361 0.050 0.133 0.184 0.008 0.060 0.000
*. Correlation is significant at the 0.05 level (1-tailed). **. Correlation is significant at the 0.01 level (1-tailed).

CHAPTER # 3 RESULTS
105
Table 3. 37: Correlations between different parameters studied in leaves of Cannabis sativa plant grown in 100 ppm Cd contaminated soil and under various
treatments of Mo.
Length
(cm)
Fresh
weight (g)
Dry
weight (g)
Total water
content (g)
Cd
concentration
(ppm)
Cd
accumulation
(mg/DW)
Free
Proline
(ppm)
Total
phenolics
(ppm)
Chlorophyll
a (ppm)
Chlorophyll
b (ppm)
Carotenoids
(ppm)
Length (cm) Pearson Correlation 1 0.777** 0.882** -0.242 0.604* 0.449 0.398 0.687* 0.567* 0.599* 0.599*
Sig. (1-tailed)
0.004 0.000 0.250 0.032 0.097 0.127 0.014 0.044 0.034 0.034
Fresh weight
(g) Pearson Correlation 0.777** 1 0.389 -0.084 0.900** 0.287 0.528 0.739** 0.411 0.759** 0.759**
Sig. (1-tailed) 0.004
0.134 0.409 0.000 0.210 0.058 0.007 0.119 0.005 0.005
Dry weight
(g) Pearson Correlation 0.882** 0.389 1 -0.291 0.210 0.441 0.188 0.553* 0.523* 0.309 0.309
Sig. (1-tailed) 0.000 0.134
0.207 0.280 0.101 0.302 0.094 0.060 0.192 0.192
Total water
content (g) Pearson Correlation -0.242 -0.084 -0.291 1 0.352 0.383 0.089 -0.002 -0.109 0.089 0.089
Sig. (1-tailed) 0.250 0.409 0.207
0.159 0.137 0.404 0.498 0.382 0.403 0.403
Cd
concentration
(ppm)
Pearson Correlation 0.604* 0.900** 0.210 0.352 1 0.404 0.537 0.667* 0.351 0.737** 0.737**
Sig. (1-tailed) 0.032 0.000 0.280 0.159
0.124 0.055 0.018 0.160 0.008 0.008
Cd
accumulation
(mg/DW)
Pearson Correlation 0.449 0.287 0.441 0.383 0.404 1 0.351 0.121 -0.183 0.186 0.186
Sig. (1-tailed) 0.097 0.210 0.101 0.137 0.124
0.160 0.370 0.306 0.304 0.304
Free Proline
(ppm) Pearson Correlation 0.398 0.528 0.188 0.089 0.537 0.351 1 0.097 -0.036 0.282 0.282
Sig. (1-tailed) 0.127 0.058 0.302 0.404 0.055 0.160
0.395 0.461 0.215 0.215
Total
phenolics
(ppm)
Pearson Correlation 0.687* 0.739** 0.553* -0.002 0.667* 0.121 0.097 1 0.644* 0.876** 0.876**
Sig. (1-tailed) 0.014 0.007 0.094 0.498 0.018 0.370 0.395
0.022 0.000 0.000
Chlorophyll a
(ppm) Pearson Correlation 0.567* 0.411 0.523 -0.109 0.351 -0.183 -0.036 0.644* 1 0.407 0.407
Sig. (1-tailed) 0.044 0.119 0.060 0.382 0.160 0.306 0.461 0.022
0.121 0.121
Chlorophyll b
(ppm) Pearson Correlation 0.599* 0.759** 0.309 0.089 0.737** 0.186 0.282 0.876** 0.407 1 0.950**
Sig. (1-tailed) 0.034 0.005 0.192 0.403 0.008 0.304 0.215 0.000 0.121
0.000
Carotenoids
(ppm) Pearson Correlation 0.599* 0.759** 0.309 0.089 0.737** 0.186 0.282 0.876** 0.407 0.950** 1
Sig. (1-tailed) 0.034 0.005 0.192 0.403 0.008 0.304 0.215 0.000 0.121 0.000
*. Correlation is significant at the 0.05 level (1-tailed).
**. Correlation is significant at the 0.01 level (1-tailed).

CHAPTER # 3 DISCUSSION
106
3.4 DISCUSSION
The effect of molybdenum on phytoextraction potential of Ricinus communis and Cannabis
sativa plants were evaluated in the present work. Molybdenum effect was also studied on
concentration of free proline, total phenolics and photosynthetic pigments in plant tissues
under varied Cd stress.
Presence of toxic heavy metals in soil significantly reduces growth and biomass of a plant
(Hadi et al 2010; John et al 2009; Hadi and Bano 2009). In present research, Ricinus
communis and Cannabis sativa plants demonstrated significant reduction in growth and
biomass when subjected to varied concentration of Cd in soil. Heavy metals have been
reported to disturb the function of some key enzymes involved in metabolism and
consequently reduce plant growth and biomass (John et al 2009). It has been found that
nitrate absorption into roots and its translocation and assimilation in plant tissues is
negatively affected by presence of Cd in the soil and in plant tissues (Gouia et al 2000;
Hernandez et al 1996). Toxic effect of Cd on growth and biomass have been reported in other
plants i.e. Parthenium hysterophorus, Lycopersicon esculentum, Pisum sativum and Brassica
juncea (Hadi el al., 2014; Haouari et al 2012; Bavi et al 2011; John et al 2009). Our results
showed that different treatments of Mo restored the plant growth and biomass in both the
plants under cadmium stress. Seed soaking and foliar treatments of Mo most significantly
increased biomass and growth of Ricinus communis plant. Molybdenum might counter
balance the negative effect of Cd on plant growth and biomass due to its key role on nitrate
assimilation; a major nitrogen source for proteins synthesis and biomass production in plants
(Hristozkova et al 2006). Vargas and Ramirez (1989) reported that Mo application
significantly increased dry weight in cowpea and soybean pods. Acidity in soil decrease bio-
availability of Mo and consequently its uptake by plant roots, which might be the reason of
Mo deficiency in many plant species like herbs, crops and trees grown in acidic soils (Kaiser
et al 2005; Saco et al 1995). Molybdenum application through foliar sprays can effectively
supplement internal molybdenum deficiencies and rescue the activity of molybdoenzymes
(Kaiser et al 2005). Our results showed that foliar spray of Mo significantly increased
biomass in plants as compared to the treatments of molybdenum addition into soil.
Plants under stress conditions such as heavy metals, salinity and high/low temperatures
produce and accumulate high concentration of free proline in their tissues (Hadi et al 2015;
Ahmad et al 2015; Khatamipour et al 2011; Ahmad et al 2008; Sun et al 2007; Ahmad and
Jhon, 2005). Free proline accumulation in plants act as indicator for environmental stress in
CHAPTER # 3 DISCUSSION
107
many plant species (Khatamipour et al 2011). Several plants species such as Cannabis,
tomato, sunflower, cowpea and wheat have been found to increase concentration of free
proline in their tissues under heavy metals stress (Hadi et al 2014; Zengin and Munzuroglu,
2006; De and Mukherjee, 1998; Lalk and Dorfling, 1985). Present results demonstrated high
concentration of free proline in roots and leaves of Ricinus communis and Cannabis sativa
plants under Cd stress. Treatments of Mo further increased free proline concentration in the
plant tissues. Seed soaking with Mo increase free proline in roots while foliar spray
treatments demonstrated highly increased in free proline in leaves of the plants. Free proline
concentration in roots of both plants were found higher than leaves in all the treatments and
controls. High concentration of free proline in roots as compared to leaves in Cannabis plant
has previously been reported by Ahmad et al, (2015).
Toxic heavy metals results in the production of reactive oxygen species that in turn cause
oxidative stress in plants. To combat oxidative stress plants synthesize a variety of phenolic
compounds. These compounds possess antioxidant potential and protect cellular components
from oxidative damage caused by reactive oxygen species (Diaz et al 2001). In previous
literature, increase in concentration of phenolic compounds in plants have been reported
under Cd stress (Hadi et al 2015; Michalak, 2006; Uraguchi et al 2006). Present results
demonstrated high concentration of phenolic compounds in roots and leaves of Ricinus
communis and Cannabis sativa plants under Cd stress. It was found that treatments of Mo
further increased total phenolics in roots and leaves of plants grown in Cd contaminated soil.
Foliar application of Mo was most significant in terms of total phenolics concentration in
roots and leaves of Ricinus communis plant. Both the plants showed high concentration of
phenolic compounds in leaves as compared to roots which is in complete agreement with the
work of Ahmad et al (2015) on Cannabis sativa, Ali and Hadi, (2015) on Parthenium
hysterophorus and Uraguchi et al (2006) on Crotalaria juncea.
Due to high bioavalibility of cadmium, it can easily be absorbed by plant roots and
translocate into its aerial parts. Our results showed highest concentration of Cd in roots of
both the plant while the lowest Cd concentration was present in stem. Which means that
translocation rate of Cd from roots into leaves was higher than into stem of the plants.
Similarly, higher concentration of Cd were reported by Ahmad et al (2015), Linger et al
(2005) and Citterio et al (2003) in roots, followed by leaves and stem respectively. Metals
phytoextraction potential can be enhanced by increasing plant biomass as well as heavy metal
concentration in the biomass (Ahmad et al 2015). Molybdenum has been reported to increase

CHAPTER # 3 DISCUSSION
108
plant dry weight due to its role as cofactor for enzymes involved in nitrate metabolism
(Hristozkova et al 2006; Vargas and Ramirez, 1989; Kaiser et al 2005; Hadi et al 2014).
Nitrate is an important source of plants nitrogen and high availability of nitrogen results in
high biomass production in plants. Foliar spray of Mo increased plant biomass as well as
concentration of Cd within the biomass and both the plants showed high Cd accumulation in
the foliar treatments as compared to the seed soaking and soil addition treatments. Ricinus
communis and Cannabis sativa are considered as hyperaccumulator of cadmium due to its
higher Cd bioconcentration factor (greater than one) in untreated plants (only Cd added to
soil). Concentration of phenolic compounds in roots and leaves of the plants demonstrated
strong positive correlation with Cd accumulation and dry weight of the plant. Strong
correlation conform the significant role of phenolic compounds in protection of plant cells
against the toxic effects of Cd metal (Hadi et al 2015; Ahmad et al 2015; Khatamipour et al
2011; Sun et al 2007).
3.4.5 Conclusions
Ricinus communis and Cannabis sativa are good candidates for toxic metals phytoextraction
due to their high biomass and tolerance to toxic metals. Foliar spray of Mo demonstrated
significant increase in both biomass and Cd accumulation in both the plants. Phenolic
compounds in the plants leaves were highly increased by the Mo treatments, especially foliar
spray treatments. Strong correlation between dry weight, Cd accumulation and total phenolics
under different treatments of Mo was observed in the plants.

CHAPTER # 4
EXPRESSION OF CBF/DREB LIKE GENES IN RICINUS COMMUNIS AND
CANNABIS SATIVA PLANTS UNDER CADMIUM STRESS AND
MOLYBDENUM FOLIAR SPRAY.

CHAPTER # 4 ABSTRACT
109
CHAPTER 4: Expression of CBF/DREB like transcriptional factors genes
in Ricinus communis and Cannabis sativa plants under
cadmium stress and molybdenum foliar spray
ABSTRACT
Transcriptional factors such as CBF/DREB have been studied mostly under various abiotic
stress. Presently we investigated the expression of DREB 1A, DREB 1B, DREB 1F and CBF
like genes in Ricinus communis and Cannabis sativa plants under the cadmium (Cd) stress
and different treatments of molybdenum (Mo). Cadmium (50 ppm) was added into soil while
Mo (0.5, 1.0 and 2.0 ppm) was applied as foliar spray. The DREB 1B, DREB 1F and CBF
like genes showed expression in both the plants due to Cd exposure. Their expression was
further increased by molybdenum foliar sprayed on the plants under Cd stress. It was noted
that molybdenum alone (without Cd) have no effect on the expression of DREB1B and
DREB 1F while the CBF like gene showed expression under Mo only (without Cd). No
expression was observed in DREB 1A gene either under Cd stress or Mo application.
Application of 2.00 ppm Mo in combination with 50 ppm Cd highly increased expression of
CBF like gene in both plants. Positive correlation of DREB 1B, DREB 1F and CBF like
genes expression was found with Cd accumulation, free proline and total phenolics
concentration in both the plants.

CHAPTER # 4 INTRODUCTION
110
4.1 INTRODUCTION
Cadmium is toxic heavy metal and its presence in soil offer stress condition to plants,
resulting in reduced growth and development. To combat the stress condition, plants respond
by the activation of several stress related genes. These genes can be categorized into two
groups; one group of genes have the direct impact on stress (i.e. they producing function
proteins such as enzymes involved in detoxification reactions, betaines, membrane
transporters and water channel proteins etc.) while the second group of genes indirectly
combat stress condition (by produce regulatory proteins that control transduction of signals
and expression of stress related genes, including several transcription factors [TF].
Transcriptional factors are important because a single TF protein can activate several related
genes at a time and thus produce a strong response to stress condition (Hadi et al 2011).
Research on TF (involved in different stresses) have received much attention in the past few
decades due to their important role in combating different environmental stresses. CBF (C-
repeat binding factors)/DREB (Dehydration response element binding protein) are important
group of transcription factors (TF) belong to ethylene responsive element binding proteins
(ERF) that follow the ABA-independent signal transduction pathway (Agarwal et al 2006).
These TFs have been studied mostly under dehydration (Thomashow 1999), low temperature
(Kume et al 2005), and salinity (Liu et al 1998; Nakashima et al 2000; Suzuki et al 2001)
stresses and have been found to improve plant tolerance to unfavorable environmental
conditions (Zarka et al 2003; Knight et al 2004). No literature is available on the role of
CBF/DREB genes in plants under heavy metals stress. Kohan and Bagherieh-Najjar (2011)
suggested that CBF/DREB transcription factors might have some role in plant defence
against heavy metals toxicity.
Micronutrients play important role in plant growth and development. Molybdenum (Mo) is a
micronutrient required by plants in a very minute quantity for normal physiology. It mainly
act as a cofactor for some important enzymes, such as Nitrate reductase (NR) and xanthine
dehydrogenase/oxidase (XDH), involved in nitrate metabolism in plants (Agarwala et al
1978; Jones et al 1976). Two different plants (Ricinus communis and Cannabis sativa) were
selected for the experiment. Ricinus communis belongs to the family Euphorbiaceous in plant
kingdom. It is a perennial shrub which reach a height of more than 3 meter and are found
mostly in the tropical regions (Rana et al 2012). Cannabis sativa is an annual herb and belong

CHAPTER # 4 INTRODUCTION
111
to Cannabaceae family. These plants were selected due to their fast growth, high biomass and
non-palatable nature; suitable for growing in heavy metal polluted soil.

CHAPTER # 4 AIMS AND OBJECTIVES
112
4.1.1. Aim and objectives
Aim:
The aim of the chapter was to investigate the role of CBF/DREB genes in Ricinus communis
and Cannabis sativa plants for the development of phytoextraction technology.
Objectives:
1. To study the presence of DREB 1A, DREB 1B, DREB 1F and CBF like genes in
Ricinus communis and Cannabis sativa plants.
2. To investigate the effect of cadmium (Cd) on expression of DREB 1A, DREB 1B,
DREB 1F and CBF like genes in the experimental plants.
3. To find out the role of molybdenum (Mo) alone and in combination with Cd on the
expression of the DREB 1A, DREB 1B, DREB 1F and CBF like genes.
4. To study the correlation of DREB 1A, DREB 1B, DREB 1F and CBF like genes
expression with cadmium accumulation in the selected plants.
5. To find out the correlations of free proline and total phenolics with the expression of
DREB 1A, DREB 1B, DREB 1F and CBF like genes.

CHAPTER # 4 MATERIALS AND METHODS
113
4.2 MATERIALS AND METHODS
4.2.1 Plant materials and growth conditions
Viable seeds of Ricinus communis and Cannabis sativa were obtained from Herbarium
University of Malakand, Pakistan. Seeds were sown in pots containing soil (collected from
agricultural fields). Water holding capacity (300 ± 3 mL water per kg soil) and pH (6.5) of
soil was measured. Plants were grown under conditions of 30 ± 5 0C (daytime)/25 ± 4
0C
(night) and 85 ± 5 % relative humidity. Cadmium (50 ppm) was added to the respective pots
in the form of cadmium acetate dehydrate solution (CH3COO)2 Cd·2H2O (CAS # 5743-04-4,
Merck, Germany) while molybdenum (0.5, 1.0 and 2.0 ppm) in the form of ammonium
molybdate pentahydrate was applied in the form of foliar spray. Treatments of cadmium (into
soil) and molybdenum (foliar spray) were applied after 4 weeks of germination.
4.2.2 Treatments during the experiment
Three controls (C, C1 and C2) and three treatments (T1, T2 and T3) were used during the
experiment as shown in table 4.1. The control C1 (only Cd) and C2 (only Mo) are compared
with the control C (without Cd and Mo). The treatments (T1, T2 and T3) are compared with
the control C1 to find the effect of different Mo concentrations on gene expression. While the
control C2 is used to know the effect of molybdenum alone (without cadmium).
Table 4. 1: The following treatments were made during the experiment.
S/No. Treatments Symbols
1 Control without Cd and Mo C
2 Control with Cd (50 ppm) only C1
3 Control with Mo (1.00 ppm) only C2
4 Cd (50 ppm) + Mo (0.5 ppm) T1
5 Cd (50 ppm) + Mo (1.0 ppm) T2
6 Cd (50 ppm) + Mo (2.0 ppm) T3
4.2.3 Genomic DNA extraction and amplification of DREB 1A, DREB 1B, DREB 1F
and CBF like genes sequences
Fresh leaves were taken from the plants (Ricinus communis and Cannabis sativa),
immediately frozen in liquid nitrogen and grinded into powdered form using mortar and

CHAPTER # 4 MATERIALS AND METHODS
114
pestle. Then 100 mg of grinded samples were transferred into 1.5 mL Eppendorf tubes and
Lysis buffer was added immediately to each tube to prevent DNA damage. GeneJET plant
genomic DNA purification mini kit (Cat # K0792, Thermo Scientific, Lithuania) was used for
DNA extraction according to the manufacturer protocol. Four degenerate primers (given in
table 4.2) were used for identification of four genes (DREB-1A, DREB-1B, DREB-1F and
CBF-like gene sequences) in Ricinus communis and Cannabis sativa genomes. The primers
were design using pick primer tool at NCBI website. Polymerase Chain Reactions (PCRs)
were carried out in a thermocycler (Kyratec supercycler, model # SC300, thermal cycler,
Queensland Australia) in 50 μL of solution containing 15 μL of extracted DNA, 5 μL of each
primer (forward and reverse) and 25 μL of PCR master mix (Cat # K0171,
Fermentas,Thermo). The mixture was treated at 95ºC (5 min) and subjected to 35 cycles of
amplification (denaturation at 95ºC for 1 min, primer annealing (temperature for each primer
given in table 4.1) for 1 min and polymerization at 72ºC for 2 min) with a final elongation
cycle of 5 min at 72ºC. The PCR products were run on Agarose (CAS # 9012-36-6, Bio-
Basic, Canada) gel (1 %) for 30 mins at 70 volts potential difference in horizontal Midi-Gel
systems. The DNA bands were detected using Gel documentation system.
Table 4. 2: Primers used during the experiments.
S/N
o. Name of Genes Primers
Am
plified
Pro
duct
size
Annealin
g
Tem
peratu
r
e
1 Ricinus communis Dehydration-
responsive element binding
protein 1A, putative, mRNA
Forward CGCGTGCGTAAGACTGAAAG 233
pb 55
0C Reverse AGCCACAGAGTTGGAAGGTG
2 Ricinus communis Dehydration-
responsive element-binding
protein 1B, putative, mRNA
Forward GAAATGGGAAGTGGGTCAGT 458
bp 52
0C Reverse TTTCATGGCTGGTGGAGTAA
3 Ricinus communis Dehydration-
responsive element binding
protein 1F, putative, mRNA
Forward GCCACGAGCTATCCGAAGAA 253
bp 55
0C Reverse GCAACCTCCAAGCAGAGTCA
4 Ricinus communis CBF-like
transcription factor
Forward CCAGCAAAGAAGAGGAAAGC 382
bp 51
0C
Reverse TAGAAGACGCAGACGAACAA
5 Actin gene (Housekeeping
gene)
Forward AACAGCCCTTCTTTGGTTTT 423
bp
50 0C
Reverse AGAGAGAGAGACAGAATGGT

CHAPTER # 4 MATERIALS AND METHODS
115
4.2.4 Total RNA extraction
Total RNA extraction from leaves was done after six hour of treatments (Table 4.1). All the
apparatus and working area were cleaned with RNAase cleaning agent (Sigma Rnase ZAP
cat # R2020) to avoid RNA degradation by RNAases. Fresh leaves were taken from treated
and control plants, immediately frozen in liquid nitrogen and grinded into powdered form.
Then 100 mg of grinded tissue is immediately transferred into RNAse free 1.5 mL micro-
centrifuge (Eppendorf) tubes and 500 ml of lyses buffer was immediately added to the tubes.
Tubes were vortexed for about 30 seconds. GeneJET Plant RNA Purification Mini Kit (Cat#
K0801, Thermo Scientific) was used for total RNA extraction. Extracted RNA was stored at
- 20 0C for a short time.
4.2.5 cDNA synthesis and Identification of DREB 1A, DREB 1B, DREB 1F and CBF
like genes
First strand cDNA was synthesized using total RNA as template via Revert Aid First Strand
cDNA Synthesis Kit (Fermentas, Thermo, Cat # K1622). Reaction mixture was prepared in
PCR tubes by mixing 5 µg Total RNA (5 µL), 1 µL Oligo (dT)18 primer, 4 µL 5X reaction
Buffer, 1 µL RiboLock Rnase Inhibitor (20 U/µL), 10 µL dNTP Mix (10mM) and 1µL
RevertAid M-MuLV RT (200 U/µL). Total volume was raised up to 20 µL by adding
nuclease-free water. During addition the tubes were kept on ice to prevent degradation of
reaction components. Thermal cycler (Kyratec supercycler, model # SC300, thermal cycler,
Queensland Australia) was used for the synthesis of first strand cDNA. The samples were
incubate in the thermal cycler at 25 0C for 5 mins followed by 42
0C for 60 mins and the
reaction was terminated at 70 0C for 5 mins according to the kit manufacturer instructions.
After completing the synthesis of first strand cDNA, the next step was to amplify specific
sequences of the target genes (cDNA) using thermal cycler. For each sample 50 μL of
reaction mixture were prepared containing 15 μL of cDNA, 5 μL of each primer (forward and
reverse) and 25 μL of PCR master mix (Cat # K0171, Fermentas,Thermo). The mixture was
treated at 95ºC (5 min) and subjected to 35 cycles of amplification (denaturation at 95ºC for 1
min, primer annealing [temperatures given in table 4.2] for 1 min and polymerization at 72ºC
for 2 min) with a final elongation cycle of 5 min at 72ºC. Reverse transcriptase [RT] PCR of
Actin gene sequences were performed to test the optimization of experiments. The PCR
products were run on Agarose (CAS # 9012-36-6, Bio-Basic, Canada) gel (1 %) for 30 mins
at 70 volts potential difference. PCR products were visualized under UV light and
photographs were taken using gel documentation system. The DNA bands were compared

CHAPTER # 4 MATERIALS AND METHODS
116
with a 100 bp DNA ladder (Thermo Scientific cat # SM0323) for size determination.
Intensities of bands were measured semi quantitatively using Quantity one 4.6.3 Bio-Rad
software. The molecular analysis took about eight (8) months.
4.2.6. Sequence analysis
The PCR product for each primer was purified using PCR purification Kit (Cat # K0702,
Thermo scientific). The purified PCR products were then analyzed for nucleotides sequence
using DNA sequencer (Applied Biosystems 3730/3730xl DNA Analyzers, USA). Some of
the purified DNA was stored at 4 0C for a short time and at -20
0C for longer storage.
Multiple sequence alignments of the deduced amino acid sequence sequences were carried
out using BLAST (NCBI).
4.2.7. Data analysis
Nucleotides sequences and deduced amino acid sequences were analyzed for percent
homology with related genes of other plants. Gene expression (semi-quantitatively) was
correlated with Cd accumulation, concentration of free proline and total phenolics using MS
excel and SPSS softwares.

CHAPTER # 4 MATERIALS AND METHODS
117
4.2.8. Experimental Design
Seed sowing in soil and germination
Treatments of Molybdenum (foliar spray) and Cadmium (addition into soil).
Three controls (C, C1 and C2) and three combination treatments (T1, T2 and T3) were used.
Cadmium was added to soil after three and a half week of germination while molybdenum was applied after four weeks of germination.
Total RNA extraction from fresh leaves after six hours of Mo treatments and then cDNA was synthesis using RT-
PCR
Amplification of CBF/DREB like genes with specific primers from cDNA, using PCR.
Sequencing of CBF/DREB genes fragments, (PCR products)
BLAST analysis of nucleotid sequences and predicted amino acid sequences
Statistical data analysis

CHAPTER # 4 RESULTS
118
4.3. RESULTS
4.3.1 Ricinus communis
4.3.1.1 CBF/DREB Like genes sequences in Ricinus communis genomic DNA
Total genomic DNA extracted from Ricinus communis plant was intact and in good quality as
shown in figure 4.1. The PCR reactions with gene specific primers were carried out to
confirm the presence of DREB 1A, DREB 1B, DREB 1F and CBF like genes sequences in
the Ricinus communis plant. The PCR product confirmed the presence of all four gene
sequences in Ricinus communis plants (Figure 4.2).
Figure 4.1: Total DNA extracted from Ricinus communis.
Figure 4.2: PCR product of four DREB/CBF genes fragments from genomic DNA of Ricinus
communis. PCR product for each gene fragment is given in triplicate. Lane order is (1-3)
represent DREB 1A, (4-6) shows DREB 1B, (7-9) shows DREB 1F and (10-12) represent
CBF like transcription factor. Lane M contain DNA marker.
A M
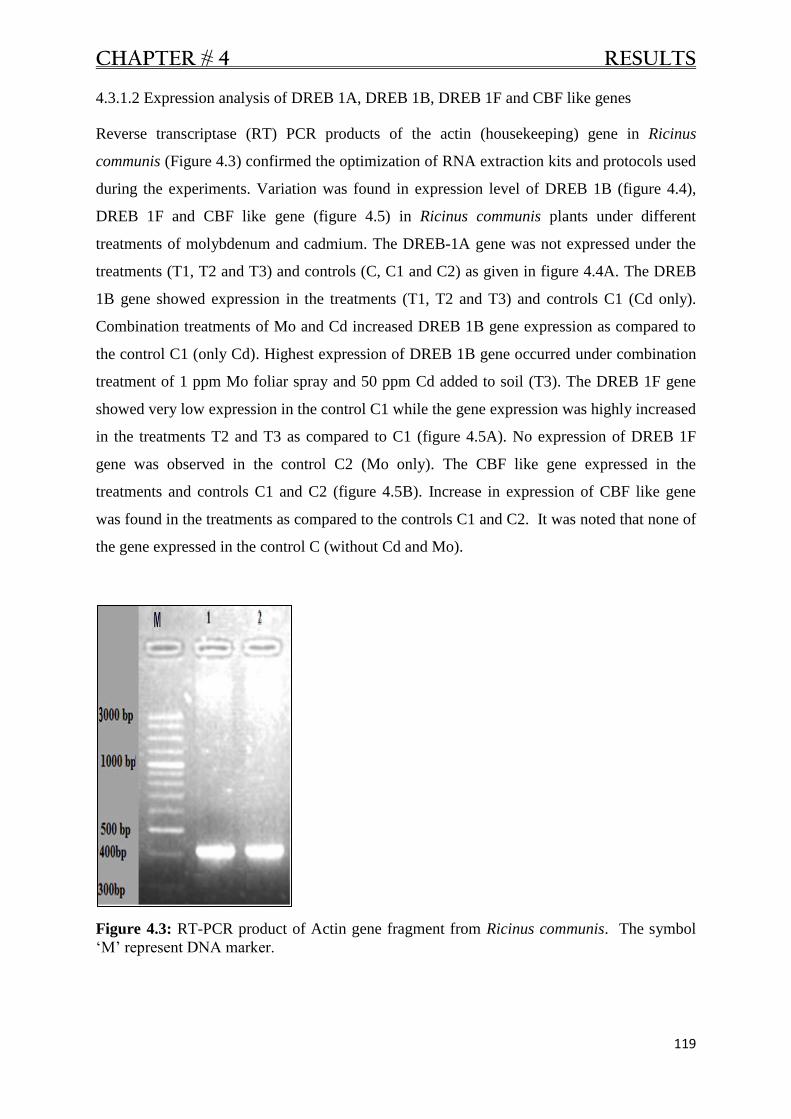
CHAPTER # 4 RESULTS
119
4.3.1.2 Expression analysis of DREB 1A, DREB 1B, DREB 1F and CBF like genes
Reverse transcriptase (RT) PCR products of the actin (housekeeping) gene in Ricinus
communis (Figure 4.3) confirmed the optimization of RNA extraction kits and protocols used
during the experiments. Variation was found in expression level of DREB 1B (figure 4.4),
DREB 1F and CBF like gene (figure 4.5) in Ricinus communis plants under different
treatments of molybdenum and cadmium. The DREB-1A gene was not expressed under the
treatments (T1, T2 and T3) and controls (C, C1 and C2) as given in figure 4.4A. The DREB
1B gene showed expression in the treatments (T1, T2 and T3) and controls C1 (Cd only).
Combination treatments of Mo and Cd increased DREB 1B gene expression as compared to
the control C1 (only Cd). Highest expression of DREB 1B gene occurred under combination
treatment of 1 ppm Mo foliar spray and 50 ppm Cd added to soil (T3). The DREB 1F gene
showed very low expression in the control C1 while the gene expression was highly increased
in the treatments T2 and T3 as compared to C1 (figure 4.5A). No expression of DREB 1F
gene was observed in the control C2 (Mo only). The CBF like gene expressed in the
treatments and controls C1 and C2 (figure 4.5B). Increase in expression of CBF like gene
was found in the treatments as compared to the controls C1 and C2. It was noted that none of
the gene expressed in the control C (without Cd and Mo).
Figure 4.3: RT-PCR product of Actin gene fragment from Ricinus communis. The symbol
‗M‘ represent DNA marker.

CHAPTER # 4 RESULTS
120
A
B
Figure 4. 4: RT-PCR product of DREB 1A (A) and DREB 1B (B) genes fragments of Ricinus communis under various treatments of cadmium and
molybdenum. Three replicates are given for each gene and designated by numbers 1, 2 and 3. The letter ‗M‘ denote DNA marker, ‗C‘ stands for control
without Cd and Mo, ‗C1‘ represent control having 50 ppm Cd only, ‗C2‘ denote control having 1.00 ppm Mo only, ‗T1, T2 and T3‘ present treatments
containing 50 ppm Cd in combination with 0.5, 1.00 and 2.00 ppm Mo in each treatment respectively and ‗B‘ denote blank without template DNA.
1 2
1 2 3
3

CHAPTER # 4 RESULTS
121
A
B
Figure 4. 5: RT-PCR product of DREB 1F (A) and CBF like factor (B) genes fragments of Ricinus communis plant under various treatments of cadmium and
molybdenum. Three replicates are given for each gene and designated by numbers 1, 2 and 3. The letter ‗M‘ denote DNA marker, ‗C‘ stands for control without Cd and Mo,
‗C1‘ represent control having 50 ppm Cd only, ‗C2‘ denote control having 1.00 ppm Mo only, ‗T1, T2 and T3‘ present treatments containing 50 ppm Cd in combination
with 0.5, 1.00 and 2.00 ppm Mo in each treatment respectively and ‗B‘ denote blank without template DNA.
1 2 3
1 2 3

CHAPTER # 4 RESULTS
122
4.3.1.3 Nucleotides sequence analysis of DREB 1B, DREB 1F and CBF like genes of Ricinus
communis plant
The cDNA sequence of DREB 1B, DREB 1F and CBF like gene fragments in Ricinus
commuis and their sequence alignment with related genes from other plants are presented in
Figures 4.6, 4.7 and 4.8 respectively. Multiple sequence alignment was done using BLAST
tool. The Ricinus communis DREB 1B gene fragment showed 72% nucleotide sequence
similarity with Jatropha curcas DREB 1F gene, 76% with Theobroma cacao DREB 1B gene
(Figure 4.6). The Ricinus communis DREB 1F gene fragment demonstrated 80 % nucleotide
sequence alignments with DREB 1B (of Jatropha curcas) and CBF4 (of Populus deltiodes)
while 81 % sequence homology with CBF2 (of Populus simonii) as shown in figure 4.7. It
was noted that Ricinus communis CBF like gene fragment showed 80%, 83% and 82%
sequence homology with DREB-1A (of Jatropha carcus), DREB1F (of Populus euphratica)
and CBF6 (of Populus balsamifera) gene sequences respectively (Figure 4.8).

CHAPTER # 4 RESULTS
123
Rc DREB 1B 2 AAATGGGAAGTGGGTCAGTGAATTAAGACAACCCTACAATAATAAGTCGAGGATATGGTT 61
Jc DREB 1F 168 AAATGGGAAATGGGTGAGTGAACTGAGAGAAC—-TACAG-ACTAAGTCTCGGATATGGCT 224
Tc DREB 1B ------------------------------------------------------------
Consensus ********* ***** ****** * * * *** **** ******** **********
Rc DREB 1B 62 AGGAACATTTCCATCACCTGACATGGCCGCTAGGGCTTATGACGTAGCAGCTTTTGCATT 121
Jc DREB 1F 225 TGGAACGTTTCCAAACCCTGAAATGGCAGCGAGAGCTTATGATGTAGCTGTTAAAGCACT 284
Tc DREB 1B 336 ---------------------CATGGCTGCTAGGGCTTATGATGCAGCGGCCTTAGCTCT 396
Consensus ***** ** ** ******** * *** ** ** *
Rc DREB 1B 122 ACGAGGAGATTCTGCTTCCTTAAACTTTCCTGAATCAGTTCATTTGTTGCCTCAGGCTAG 181
Jc DREB 1F 285 TCGGGGAAATACGGCGTCATTAAACTTTCCTGAAACAGCGCATTTGTTGCCTCAAGTTGG 344
Tc DREB 1B 397 CAAGGGAGATTCTGCTTCCTTAAACTTTCCTGAGTCAGCTAATGCATTACCACGTGCTAG 456
Consensus *** ** * ** ** ******** ****** *** ** * *** ** ** * *
Rc DREB 1B 182 ATCTACTTCTATAAAGGATATTCAGTATGCAGCTCTGGAAGCTGCTGATCAGAGTGTTAg 241
Jc DREB 1F 345 GTCAACCTCTATAAAGGATATTCAATGCGCCGCATTGGAAGCTGCAG------GTGTTCA 398
Tc DREB 1B 357 GTCATCCTCCATCAGGGATATACAATATGCTGCTATGGAGGCTGCCGA------------
Consensus ** * ** ** * ****** ** * ** ** **** ***** *
Rc DREB 1B 242 tggtggtggtggtggtggtAGTGATGTTGATCATCTGTTTCAATGTTCTTCTTCTTCTCT 301
Jc DREB 1F 399 TGGTGGTGGTGGCGATG---------------------TTCAATGTGCTTCTTCTTC--- 434
Tc DREB 1B ------------------------------------------------------------
Consensus ************ * ** ******** **********
Rc DREB 1B 302 ATCTTTTTGTTCCTCGACTATAGAAGGAAGTGACAATGTTGGGAAAGATTGGAATAAGAA 361
Jc DREB 1F 435 ATCTTCGTTGAAAGCTAGTGTTGAAGAAGGTTATAATAATAATAATAATAATAATAATGA 494
Tc DREB 1B ------------------------------------------------------------
Consensus ***** * * * * * **** * ** * *** * ** ** ***** *
Rc DREB 1B 362 TATGAATATGTTTTTGGATGAAGAGGAGTTGTTTAACATGCCTGCATTACTCGATAGCAT 421
Jc DREB 1F 495 TAATAAAATGTTTCTGGATGAAGAAGAGTTGTTTAATATGCCGGCATTACTTGATAGTAT 554
Tc DREB 1B ------------------------------------------------------------
Consensus ** ** ****** ********** *********** ***** ******** ***** **
Rc DREB 1B 422 GGCAGAAGGGTTAATTCTTACTCCACCAGCCATGAAA 458
Jc DREB 1F 555 GGCAGAAGGGTTGATTCTAACACCACCAGCCATGAAA 591
Tc DREB 1B -------------------------------------
Consensus ************ ***** ** ***************
Figure 4. 6: Nucleotide sequence (Gene fragment) alignment of Ricinus communis DREB-1B with
DREB-1F of Jatropha curcas and DREB-1B of Theobroma cacao. The symbols ‗Rc‘ represent
Ricinus communis, ‗Jc‘ represent Jatropha curcas, ‗Tc‘ represent Theobroma cacao and ‗*‘ indicate
the nucleotide in that column are similar in all the sequences in alignment. The dotted line shows the
missing nucleotides in a sequence. Ricinus communis DREB-1B gene sequences showed 72 % and
76% homology with DREB-1F and DREB-1B genes sequences of Jatropha curcas and Theobroma
cacao respectively.

CHAPTER # 4 RESULTS
124
Rc DREB 1F 1 GCCACGAGCTATCCGAAGAAGCGAGCTGGGCGGAGAGTGTTCAAGGAGACTCGACATCCT 60
Jc DREB 1B 138 GCTACAAGCTACCCGAAGAAGCGAGCAGGGCGGCGAATATTTAAGGAAACACGACATCCC 197
Pd CBF4 139 GCAACAAGTTTTCCGAAAAAACGCGCTGGCCGCAGAATATTCAGGGAGACTCGGCACCCG 198
Ps CBF2 176 GCAACAAGTTTTCCGAAAAAACGCGCTGGCCGCAGAATATTCAGGGAGACTCGGCACCCG 235
Consensus ** ** ** * ****** ** ** ***** ** *** * **** ********* ** **
Rc DREB 1F 61 GTCTTTAGAGGCGTTAGGAATAGGAATAATGACAAGTGGGTCTGCGAGCTACGTGAGCCA 120
Jc DREB 1B 198 ATTTTTCGTGGAGTTCGAAAAAGAAACAATGAAAAATGGGTTTGTGAGCTTAGAGAACCC 257
Pd CBF4 199 GTTTTTAGAGGTGTTCGGAAGAGGAATGGTAACAAATGGGTGTGTGAGATGCGGGAACCA 258
Ps CBF2 236 GTTTTTAGAGGTGTTCGGAAGAGGAATGGTAACAAATGGGTGTGTGAGATGCGGGAACCA 295
Consensus * *** * ** *** * ** ** ** * * ** ***** ** *** * * ** **
Rc DREB 1F 121 AATAAGAAATCAAGAATATGGCTTGGTACTTATCCTACTCCTGAAATGGCAGCTAGAGCA 180
Jc DREB 1B 258 AATAAGAAGACACGTATATGGCTCGGTACATATCCAACACCAGAAATGGCGGCCAGAGCA 317
Pd CBF4 259 AACAAGAAGTCACGAATATGGTTAGGAACATATCCTACACCAGAAATGGCAGCTCGAGCT 318
Ps CBF2 296 AACAAGAAGTCACGAATATGGTTAGGAACATATCCTACACCAGAAATGGCAGCTCGAGCT 355
Consensus ** ***** ** * ****** * ** ** ******** ** *********** ****
Rc DREB 1F 181 CACGACGTTGCTGCATTGGCTCTTAGAGGAAAATCTGCTTGCCTTAACTTTGCTGACTCT 240
Jc DREB 1B 318 CATGACGTGGCTGCATTAGCGCTTAGAGGAAAATCGGCTTGTCTTAACTTTGCAGATTCT 377
Pd CBF4 319 CATGATGTTGCTGCTTTGGCACTTAGAGGCAAATCTGCTTGCCTTAACTTCGCTGATTCT 378
Ps CBF2 356 CATGATGTTGCTGCTTTGGCACTTAGAGGCAAATCTGCTTGCCTTAACTTCGCTGATTCT 415
Consensus ** ** ** ***** ** ** ******** ***** ***** ******** ** ** ***
Rc DREB 1F 241 GCTTGGAGGTTGC 253
Jc DREB 1B 378 TCTTGGAGGTTGC 390
Pd CBF4 379 GCCTGGAGGTTGC 391
Ps CBF2 416 GCCTGGAGGTTGC 428
Consensus * **********
Figure 4. 7: Nucleotide sequence (Gene fragment) alignment of Ricinus communis DREB-1F with
DREB-1B of Jatropha curcas, CBF4 of Popullu deltoids and CBF2 of Populus simonii. Symbols ‗Rc‘
represent Ricinus communis, ‗Jc‘ represent Jatropha curcas, ‗Pd‘ represent Populus deltoids, ‗Ps‘
represent Populus simonii and ‗*‘ indicate the nucleotide in that column are similar in all the
sequences in alignment. The dotted line shows the missing nucleotides in a sequence. Ricinus
communis DREB-1F gene fragment demonstrated 80 % nucleotide sequence homology with DREB-
1B and CBF4 gene sequences of Jatropha curcas and Populus deltoids respectively and 81%
sequence homology with CBF2 gene sequences of Populus simonii plant. Among the four plants 74%
sequence homology was found between the gene sequences.

CHAPTER # 4 RESULTS
125
Rc CBF like factor 7 AAGAAGAGGAAAGCAGGGAGGACCAAGTTCAAGGAGACTAGGCATCCGATTTATAGAGGT 66
Jc DREB 1A 67 AAAAAGAGGAAGGCAGGAAGGACTAAGTTTAAGGAAACCAGACACCCATTTTATAGAGGT 126
Pe DREB 1F 303 AAGAAGAACAAAGCGGGAAGGAAGAAGTTCAAGGAGACGCGGCATCCGGTATATAGGGGG 362
Pb CBF6 124 AAGAAGAACAAAGCGGGAAGGAAGAAGTTCAAGGAGACGAGGCATCCGGTATATAGGGGG 183
Consensus ** **** ** ** ** **** ***** ***** ** * ** ** * ***** **
Rc CBF like factor 67 GTAAGGCGAAGAAATGGGAATAAATGGGTATGTGAAGTTAGAGAACCGAACCTGAAA--- 123
Jc DREB 1A 127 GTTCGACGAAGAAATGGAAATAAATGGGTATGTGAAGTGCGAGAACCAAATAAGAACAAG 186
Pe DREB 1F 363 GTACGGAGAAGAAATGGGAATAAATGGGTATGTGAAGTGCGTGAACCAAACAAGAAATCA 422
Pb CBF6 184 GTAMGGAGAAGAAATGGGAATAAATGGGTATGTGAAGTGCGYGAACCAAACAAGAAATCA 243
Consensus ** * ********** ******************** * ***** ** ***
Rc CBF like factor 124 TCAAGAATATGGCTAGGGACATACCCTACCCCAGAAATGGCAGCTAGGGCACATGATGTT 183
Jc DREB 1A 187 TCAAGGATTTGGTTAGGTACGTTTCCTACTCCAGAAATGGCAGCTAGGGCACACGACATT 246
Pe DREB 1F 423 ---AGAATTTGGGTGGGGACCTTCAAGAGCCCAGAAATGGCAGCTAGGGCACATGATGTT 480
Pb CBF6 244 ---AGAATTTGGGTGGGGACCTTCAAGAGCCCAGAAATGGCAGCTAGGGCACATGATGTT 300
Consensus ** ** *** * ** ** * * * *********************** ** **
Rc CBF like factor 184 GCTGCTTTGGCATTCAGAGGAGAGTTTGCTTCTCTCAACTATCTTGATTCAGCTTGGATA 243
Jc DREB 1A 247 GCTGCTCTGGCATTAAGAGGAGATCTTGCTATACTAAACTTCCCTGATTCTGCTTCGGTA 306
Pe DREB 1F 481 GCTGCTTTAGCACTTAAAGGAGAGTTTGCTGCCTTGAACTTTCTTGATTCAGCTTTGATA 540
Pb CBF6 301 GCTGCTTTAGCACTTAAAGGAGAGCTTGCTGCCTTGAACTTTCTCGATTCAGCTTTGATA 360
Consensus ****** * *** * * ****** ***** * **** * ***** **** * **
Rc CBF like factor 244 CTGCCACGACCAAAGTCGTCTTCTCATGAAGATATTAAAAGGGCTGCTCTTGAAGCTGCT 303
Jc DREB 1A 307 CTTCCAAGACCGAAGTCTTCTTCTGCAAAAGATATTAAAAGGG----------------- 349
Pe DREB 1F 543 CTTCCTCGAGCAAAGTCGTCTTCTGCCGAAGATATACAAAGGGCTGCCCTTGCTGCTACA 602
Pb CBF6 364 CTTCCTCGAGCAAAGTCGTCTTCTGCTAGAGATATACAAAGGGCTGCCCTTGCTGCTACA 425
Consensus ** ** ** * ***** ****** ****** ********** **** *** *
Rc CBF like factor 304 GAGG-CTTT 311
Jc DREB 1A ---------
Pe DREB 1F 603 GAGGTCTTT 611
Pb CBF6 426 GAGG 409
Consensus ****
Figure 4. 8: Nucleotide sequence (Gene fragment) alignment of Ricinus communis CBF like gene
with DREB-1B of Jatropha curcas, DREB-1F of Populus euphratica and CBF6 of Populus
balsamifera. The symbols ‗Rc‘ represent Ricinus communis, ‗Jc‘ represent Jatropha curcas, ‗Pe‘
represent Populus euphratica, ‗Pb‘ represent Populus balsamifera and ‗*‘ indicate the nucleotide in
that column are similar in all the sequences in alignment. The dotted line shows the missing
nucleotides in a sequence. The Ricinus communis CBF like gene fragment showed 80%, 83% and
82% sequence homology with DREB-1B of Jatropha curcas, DREB-1F of Populus euphratica and
CBF6 of Populus balsamifera.

CHAPTER # 4 RESULTS
126
4.3.1.4 Protein Sequence analysis of DREB 1B, DREB 1F and CBF like genes in Ricinus
communis plant
The predicted amino acid sequence of DREB 1B, DREB 1F and CBF like gene fragments of
Ricinus communis were subjected to multiple sequence alignment with the amino acid
sequences of related proteins from other plant species using BLAST tool (Figure 4.9). Amino
acid sequences of Ricinus communis DREB 1B protein showed 63 % and 60 % homology
with DREB 1F of Jatropha carcus and DREB 1B of Theobroma cocoa (Figure 4.9 A).
Predicted amino acid sequence of Ricinus communis DREB 1F showed 92% sequence
homology with DREB 1B of Jatropha carcus and CBF2 of Populus simonii while 93%
sequence homology with amino acid sequence of Populus deltiodes CBF4 protein (Figure 4.9
B). Amino acid sequence of Ricinus communis CBF like factor showed 75%, 81% and 79%
homology with DREB 1A of Jatropha carcus, DREB 1F of Populus euphratica and CBF6 of
Populus balsamifera amino acid sequences respectively (Figure 4.9 C).

CHAPTER # 4 RESULTS
127
A Rc DREB 1B 3 NGKWVSELRQPYNNKSRIWLGTFPSPDMAARAYDVAAFALRGDSASLNFPESVHLLPQAR 182
Jc DREB 1F 57 NGKWVSELRE-LQTKSRIWLGTFPNPEMAARAYDVAVKALRGNTASLNFPETAHLLPQVG 115
Tc DREB 1B 59 NGKWVSELREPIK-KSRIWLGTFSSPGMAARAYDAAALALKGDSASLNFPESANALPRAR 117
Consensus ********* ********* ** ******* * ** * ******* **
Rc DREB 1B 183 STSIKDIQYAALEAADQsvsggggggsdvdHlfqcsssslsfcssTIEGSDNVGKDWNKN 362
Jc DREB 1F 116 STSIKDIQCAALEAAG----------VHGGGGDVQCASSSSSLKASVEEGYNNNNNNNND 165
Tc DREB 1B 118 SSSIRDIQYAAMEAAEAFGDIAKTPSPSPSLSSSSSLPSPPLPSLE-NSSENVQGSSEK- 175
Consensus * ** *** ****** * *
Rc DREB 1B 363 MNMFLDEEELFNMPALLDSMAEGLILTPPAMK 458
Jc DREB 1F 166 NKMFLDEEELFNMPALLDSMAEGLILTPPAMK 197
Tc DREB 1B 176 --LFLDEEEVFNMPGILDSMAEGLILTPPAMQ 205
Consensus ****** **** ***************
B Rc DREB 1F 1 ATSYPKKRAGRRVFKETRHPVFRGVRNRNNDKWVCELREPNKKSRIWLGTYPTPEMaara 180
Jc DREB 1B 39 ATSYPKKRAGRRIFKETRHPIFRGVRKRNNEKWVCELREPNKKTRIWLGTYPTPEMAARA 98
Pd CBF4 15 ATSRPKKRAGRRIFKETRHPIFRGVRKRNGDKWVCELREPNKKSRIWLGTYPTPEMAARA 74
Ps CBF2 47 ATSFPKKRAGRRIFRETRHPVFRGVRKRNGNKWVCEMREPNKKSRIWLGTYPTPEMAARA 106
Consensus *** ******** * ***** ***** ** ***** ****** ****************
Rc DREB 1F 181 hdvaalalrGKSACLNFADSAWRL 252 Jc DREB 1B 99 HDVAALALRGKSACLNFADSSWRL 122
Pd CBF4 75 HDVAALAFRGKSACLNFADSAWRL 98
Ps CBF2 107 HDVAALALRGKSACLNFADSAWRL 130
Consensus ******************** ***
C Rc CBF 10 KR-KAGRTKFKETRHPIYRGVRRRNGNKWVCEVREPNLKSRIWLGTYPTPEMAARAHDVAA 189
Jc DREB 1A 45 KR-KAGRRVFKETRHPVYRGVRKRNGNKWVCELREPNKKTRIWLGTYPTPEMAARAHDVAA 104
Pe DREB 1F 42 KKNKAGRKKFKETRHPVYRGVRRRNGNKWVCEVREPNKKSRIWVGTFKSPEMAARAHDVAA 104
Pb CBF6 42 KKNKAGRKKFKETRHPVYRGVRRRNGNKWVCEVREPNKKSRIWVGTFKSPEMAARAHDVAA 104
Consensus * **** ******* *************** **** * *** ** ************
Rc CBF 190 LAFRGEFASLNYLDSAWILPRPKSSSHEDIKRAALEAAEAFK 315
Jc DREB 1A 105 LAFRGKSACLNFADSAWRLPVPASRDAKEIRRAASQAAEMFR 146
Pe DREB 1F 105 LALKGEFAALNFLDSALILPRAKSSSAEDIQRAALAATEVF- 143
Pb CBF6 105 LALKGELAALNFLDSALILPRAKSSSARDIQRAALAATEV-- 142
Consensus ** * * ** *** ** * * *** * *
Figure 4. 9: Multiple alignment and comparison of the deduced amino acids sequence of (A) Ricinus
communis DREB-1B with DREB-1F from Jatropha curcas and DREB-1B from Theobroma cacao, (B) Ricinus
communis DREB-1F with DREB-1B from Jatropha curcas, CBF4 from Populus deltoids and CBF2 from
Populus simonii and (C) Ricinus communis CBF like factor with DREB-1B from Jatropha curcas, DREB-1F
from Populus euphratica and CBF6 from Populus balsamifera. The symbols ‗Rc‘ represent Ricinus communis,
‗Jc‘ represent Jatropha curcas, ‗Tc‘ represent Theobroma cacao , ‗Pd‘ represent Populus deltoids, ‗Ps‘
represent Populus simonii, ‗Pe‘ represent Populus euphratica and ‗*‘ indicate the nucleotide in that column are
similar in all the sequences in alignment. The dotted line shows the missing amino acids in a sequence. Ricinus
communis DREB-1B like amino acid sequences showed 63% and 60% homology with DREb-1F and DREB-1B
amino acids sequences of Jatropha curcas and Theobroma cacao respectively. DREB-1F like amino acid
sequences in Ricinus communis demonstrated 92%, 93% and 92% homology with amino acid sequences of
DREB-B, CBF4 and CBF2 proteins in Jatropha curcas, Populus deltoids, and Populus simonii respectively.
Amino acids sequence of CBF like factor in Ricinus communis possessed 75%, 81% and 79% homology with
amino acid sequences of DREB-1A, DREB-1F and CBF6 proteins in Jatropha curcas, Populus euphratica and
Populus balsamifera respectively.

CHAPTER # 4 RESULTS
128
4.3.1.5 Correlations of DREB 1B, DREB 1F and CBF like gene with Cd accumulation, free
proline and total phenolics concentration in Ricinus communis plant
Correlations of Cd accumulation in Ricinus communis with expression of DREB 1B, DREB
1F and CBF like genes is given in figure 4.10 (A, B, C). Positive correlations were observed
between the Cd accumulation and expression of DREB 1B (figure 4.10 A), DREB 1F (Figure
4.10 B) and CBF like genes (Figure 4.10 C) in Ricinus communis plant. The figure 4.11 (A –
F) present correlations of DREB 1B, DREB 1F and CBF like genes expression with free
proline and total phenolics concentration in Ricinus communis plant. Free proline
concentration demonstrated highly significant positive correlations with DREB 1B (R2 =
0.92), DREB 1F (R2 = 0.93) and CBF like genes (R
2 = 0.88) expression as given in figure
4.11 (A, B and C respectively). Total phenolics concentration showed positive correlations
with the DREB 1B, DREB 1F and CBF like genes in Ricinus communis (Figure 4.11 D, E,
F).

CHAPTER # 4 RESULTS
129
Figure 4. 10: Correlations of cadmium accumulation with expression of DREB-1F (A), DREB-1F
(B) and CBF like factor (C) gene in Ricinus communis plant.
y = 0.0076x + 0.2423 R² = 0.4779
0.00
0.20
0.40
0.60
0.80
1.00
1.20
0.00 20.00 40.00 60.00 80.00 100.00 120.00
Cd
acc
um
ula
ion
(m
g/D
W)
Expression level
DREB 1B gene
y = 0.0134x + 0.3201 R² = 0.5162
0.00
0.20
0.40
0.60
0.80
1.00
1.20
0.00 10.00 20.00 30.00 40.00 50.00
Cd
acc
um
ula
tio
n (
mg/
DW
)
Expression level
DREB 1F gene
y = 0.0076x + 0.3161 R² = 0.5092
0.00
0.20
0.40
0.60
0.80
1.00
1.20
0.00 20.00 40.00 60.00 80.00 100.00
Cd
acc
um
ula
tio
n (
mg/
DW
)
Expression level
CBF like gene
A
B
C

CHAPTER # 4 RESULTS
130
Figure 4. 11: Correlations of DREB 1B, DREB 1F and CBF like genes expression with free
proline (A, B and C respectively) and total phenolics concentration (D, E and F respectively) in
Ricinus communis plant. The symbol ―*‖ shows significance of the correlations.
y = 0.2262x + 32.492 R² = 0.9202 **
0
10
20
30
40
50
60
0.00 50.00 100.00 150.00
Free
pro
line
con
cen
trat
ion
(p
pm
)
DREB-1B gene expression level A
y = 0.4333x + 33.915 R² = 0.9394 **
0
10
20
30
40
50
60
0.00 20.00 40.00 60.00
Free
pro
line
con
cen
trat
ion
(p
pm
)
DREB-1F gene expression level
y = 0.336x + 27.239 R² = 0.8845 **
0
10
20
30
40
50
60
70
0.00 50.00 100.00
Free
pro
line
con
cen
trat
ion
(p
pm
)
CBF like gene expression level
y = 0.7273x + 54.763 R² = 0.7496 *
0
20
40
60
80
100
120
140
0.00 50.00 100.00 150.00
Tota
l ph
eno
lics
con
cen
trat
ion
(p
pm
)
DREB-1B gene expression level
y = 1.3967x + 59.241 R² = 0.7694 *
0
20
40
60
80
100
120
140
0.00 20.00 40.00 60.00
Tota
l ph
eno
lics
con
cen
trat
ion
(p
pm
)
DREB-1F gene expression level
y = 1.0016x + 41.949 R² = 0.6196 *
0
20
40
60
80
100
120
140
0.00 50.00 100.00
Tota
l ph
eno
lics
con
cen
trat
ion
(p
pm
)
CBF like gene expression level
B A
C D
E F

CHAPTER # 4 RESULTS
131
4.3.2 Cannabis sativa
4.3.2.1 Identification of CBF/DREB like gene sequences in Cannabis sativa plant
Genomic DNA extracted from Cannabis sativa plant is presented in figure 4.12. The DNA
was found intact and good quality. PCR product from genomic DNA using degenerate
primers showed the presence of DREB 1A, DREB 1B, DREB 1F and CBF like gene
sequences in Cannabis sativa plant (Figure 4.13).
Figure 4. 12: Genomic DNA extracted from Cannabis sativa plant. The lane 1 – 4 present
replicates.
Figure 4. 13: PCR product of DREB 1A (lane 1 – 3), DREB 1B (Lane 4 – 6), DREB 1F
(lane 7 – 9) and CBF like transcription factor (lane 10 -12) gene fragments of Cannabis
sativa plant. DNA marker is present on the left side and represented by ‗M‘.
M

CHAPTER # 4 RESULTS
132
4.3.2.2 Expression analysis of DREB 1A, DREB 1B, DREB 1F and CBF like genes
sequences in Cannabis sativa
Reverse transcriptase [RT] PCR product of Actin gene of Cannabis sativa plant is given in
figure 4.14. Prominent DNA bands (PCR product) of actin gene fragments in the figure 4.14
reflected the optimization of experiments. Expression of DREB 1A and DREB 1B like genes
sequences is presented in the figure 4.15. No expression of DREB 1A like gene was found in
the treatments and controls (figure 4.15 A). The DREB 1B like gene of Cannabis sativa plant
expressed under the treatments (T1, T2 and T3) and the control C1 (only Cd) as shown in
figure 4.15 B. The treatments of Cd and Mo (T1, T2 and T3) induced slight increase in the
expression of DREB 1B like gene as compared to the control C1. Figure 4.16 (A and B)
shows the expression of DREB 1F and CBF like genes in Cannabis sativa plants under
various treatments of Cd and Mo. The DREB 1F like gene expressed in the treated plants (T1,
T2 and T3) and in the control C1 (Cd only) as given in figure 4.16 A. It was found that
expression of CBF like gene occurred in the controls C1 and C2 (Mo only), while its
expression increased in the treatments (T1 – T3) (Figure 4.16 B).
Figure 4. 14: RT-PCR product of Actin gene fragment of Cannabis sativa. The symbol ‗M‘
represent DNA marker. The number 1 and 2 denote replicates.

CHAPTER # 4 RESULTS
133
A
B
Figure 4. 15: RT-PCR product of DREB 1A (A) and DREB 1B (B) like genes of Cannabis sativa plant under various treatments of cadmium and
molybdenum. Three replicates are given for each gene and designated by numbers 1, 2 and 3. The letter ‗M‘ denote DNA marker, ‗C‘ stands for control
without Cd and Mo, ‗C1‘ represent control having 50 ppm Cd only, ‗C2‘ denote control having 1.00 ppm Mo only, ‗T1, T2 and T3‘ present treatments
containing 50 ppm Cd in combination with 0.5, 1.00 and 2.00 ppm Mo in each treatment respectively, ‗B‘ denote blank without template DNA.
1 2 3
1 2 3

CHAPTER # 4 RESULTS
134
A
B
Figure 4. 16: Reverse transcriptase [RT]-PCR product of DREB 1F (A) and CBF like gene (B) fragment of Cannabis sativa plant under various treatments of
cadmium and molybdenum. Three replicates are given for each gene and designated by numbers 1, 2 and 3. The letter ‗M‘ denote DNA marker, ‗C‘ stands for
control without Cd and Mo, ‗C1‘ represent control having 50 ppm Cd only, ‗C2‘ denote control having 1.00 ppm Mo only, ‗T1, T2 and T3‘ present
treatments containing 50 ppm Cd in combination with 0.5, 1.00 and 2.00 ppm Mo in each treatment respectively, ‗B‘ denote blank without template DNA.
1 2 3
1 2 3

CHAPTER # 4 RESULTS
135
4.3.2.3 Nucleotide sequences analysis
Nucleotides sequence alignment of Cannabis sativa DREB 1B, DREB 1F and CBF like gene
fragments with related gene sequences of other plants are presented in figures 4.17, 4.18 and
4.19 respectively. Nucleotides sequence alignment (Figure 4.17) shows 83 % and 81 %
homology of Cannabis sativa DREB 1B like gene sequences with DREB 1B (of Pyrus
bretschneideri) and DREB 1D (of Malus domestica) respectively. It was noted that Cannabis
sativa DREB 1F like nucleotides sequences were 90%, 92% and 88% homologous to DREB
1F (of Prunus mume), DREB 1E (of Malus domestica) and DREB 1E (of Pyrus
bretschneideri) gene sequences respectively (Figure 4.18). Nucleotide sequence alignment of
Cannabis sativa CBF like gene sequences showed 86 %, 83 % and 83 % similarity with CBF
like gene sequences (of Ricinus communis), CBF5 (of Populus trichcarpa) and CBF5 (of
Populus balsamifera) respectively (Figure 4.19).

CHAPTER # 4 RESULTS
136
Cs DREB 1B 5 TGGGAAGTGGGTGTGTGAAATGAGGCAACCGGATCATAACAAGTCGAGGGTATGGCTCGG 64
Pyb DREB 1B 146 TGGGAAGTGGGTGTGTGAGCTGAGGCAACCGGATCACAAGAAATCGCGGATATGGCTCGG 205
Md DREB 1D 146 TGGGAAGTGGGTGTGTGAGCTGAGGCAACCGGATCACAAGAAATCGCGGATATGGCTCGG 205
Consensus ****************** **************** ** ** *** ** **********
Cs DREB 1B 65 GACATTTCCTTA-CCCTGACATGGCTGCTAGGGCTTATGAAGTAGCAGCTTTTGCATTGA 123
Pyb DREB 1B 206 AAC-TTTCACTAGCCCTGACATGGCTGCTAGGGCTTATGATGTTGCAGCCTTGGCTCTCA 264
Md DREB 1D 206 AAC-TTTCACTAGCCCTGACATGGCTGCTAGGGCTTATGATGTTGCAGCCTTGGCTCTCA 264
Consensus ** **** ** *************************** ** ***** ** ** * *
Cs DREB 1B 124 GAGGAGAGTCTGCTTCGCTAAACTTTCCT---GA-GAT-CA-GTTCATTGTTGCCGCAGTTCA 180
Pyb DREB 1B 265 AGGGTGAGTCTGCTTCACTCAACTTTCCTAACGA GAC-AA-GTGC—T-TTGCCGCGCTTCG 321
Md DREB 1D 265 AGGGTGAGTCTGCTTCACTCAACTTTCCT---AACGAGGCAAGTGC-TT-T-GCCGCGCTTCG 321
Consensus ** *********** ** ********* * ** * ** * * * ***** ***
Cs DREB 1B 181 CGTCTAATGCTAACATGGAAAACGACAAAGTAGGTGCGGGGTCAGCAGG-TGCCGAGGCT 239
Pyb DREB 1B 322 AGTCGAATGCTTATACCGTAAAGGACATACAATGTGCTGCCTTAG-AGGCTGCCGAGGCA 380
Md DREB 1D 322 AGTCGAATGCTTATACCGTAAAGGASATACAATGTGCTGCCTTAG-AGGCTGCCGAGGCA 380
Consensus *** ****** * * * *** ** * * * **** * * ** *** *********
Cs DREB 1B 240 GTCTTGGAGGTTAAAGGTAAAGCCTCTTCATCTTCTTCTTTGAAGTTGGAGAAGGTAGAG 299
Pyb DREB 1B 381 TTCTTGGAGGTTAAAGGTAAAGCCTCTTCATCTTCTTCTTTGAAGTTGGAGAAGGTAGAG 440
Md DREB 1D 381 TTCTTGGAGGTTAAAGTTAAAGCCTCTTCCTCTTCTTCTTTGAAGTTGGAGAAGGTAGAA 440
Consensus *************** ************ *****************************
Cs DREB 1B 300 GAAGAAGAGGTGAGAAAAGTTGT 322
Pyb DREB 1B 441 GAAGAAGAGGTGAGAAAAGTTGT 463
Md DREB 1D 441 GAAGAAGAGATGGGAAAAGTTGT 463
Consensus ********* ** **********
Figure 4. 17: Nucleotide sequence alignment of Cannabis sativa DREB 1B like gene
fragment with DREB 1B of Pyrus x bretschneideriand DREB 1D of Malus domestica. The
symbol ‗Cs‘ represent Cannabis sativa, ‗Pyb‘ represent Pyrus x bretschneideri, ‗Md‘
represent Malus domestica and ‗*‘ indicate the nucleotide in that column are similar in all the
sequences in alignment. The dotted line shows the missing nucleotides in a sequence.
Cannabis sativa DREB-1B like gene sequences showed 83 % and 81 % homology with
DREB-1B and DREB-1D gene sequences of Pyrus x bretschneideri and Malus domestica
respectively. Nucleotide sequence homology among the three genes sequences is equal to
80%.

CHAPTER # 4 RESULTS
137
Cs DREB 1F 13 CCGAAGAAGCGAGCGGGGAGGAGAGTGTTCAAGGAGACGAGGCACCCAGTCTATAGAGGA 72
Pm DREB 1F 175 CCGAAGAAGCGAGCCGGGAGGAGGGTTTTCAAGGAGACGAGGCACCCGGTTTATAGGGGT 234
Md DREB 1E 399 ---AAGAAGCGAGCGGGGAGGAGAGTTTTCAAGGAGACGAGGCACCCAGTTTACAGAGGA 455
Pyb DREB 1E 492 ---AAGAAGCGAGCGGGGAGGAGAGTTTTCAAGGAGACGAGGCACCCGGTTTACAGAGGA 548
Consensus *********************** ******************** ** ** *****
Cs DREB 1F 73 GTTAGGAGGAGGAACAATGACAAGTGGGTGTGCGAGATGAGGGAGCC—-A-AAC---AAGAAG 129
Pm DREB 1F 235 GTGAGGAGGAGGAACAATGACAAGTGGGTTTGTGAAATGAGAGAGCCCAACAAG---AAGAAG 294
Md DREB 1E 456 GTTAGGAGGAGGAACAACAACAAGTGGGTGTGCGAAATGAGGGAACC--A-AACAAGAAGAAG 515
Pyb DREB 1E 549 GTGAGGAGGAGGAACAACAACAAGTGGGTGTGCGAAATGAGAGAACC—-A-AACAAGAAGAAG 608
Consensus ***************** **************** ***** ** ** * ** ******
Cs DREB 1F 130 TCGAGGATATGGCTCGGAACTTATCCTACGGCCGAGATGGCTGCTCGAGCGCATGACGTG 189
Pm DREB 1F 295 TCCAGGATATGGCTCGGGACTTATCCGACGGCTGAGATGGCTGCTCGTGCCCATGACGTG 354
Md DREB 1E 516 TCGAGGATATGGCTCGGAACTTATCCGACGGCCGAGATGGCAGCTCGGGCGCATGACGTG 575
Pyb DREB 1E 609 TCGAGGATATGGCTCGGAACTTATCCGACGGCCGAGATGGCAGCTCGGGCGCATGACGTG 668
Consensus ***************** ******** ************** ***** ** *********
Cs DREB 1F 190 GCCGCATTGGCGTTTAGAGGGAAGCCTGCCTGCCTCAACTTTGCTGACTCCGCGTGGAGG 249
Pm DREB 1F 355 GCGGCATTGGCGTTTAGAGGGAAGCTTGCCTGCCTCAACTTTGCTGACTCCGCGTGGAGG 414
Md DREB 1E 576 GCGGCATTGGCCTTTAGAGGGAAGCTTGCCTGCCTCAATTTTGCAGACTCCGCATGG--- 632
Pyb DREB 1E 668 GCGGCATTGGCCTTTAGAGGGAAGCTTGCCTGCCTCAATTTTGCAGACTCCGCATGG--- 725
Consensus ** ******** ************* ************ ***** ******** ***
Cs DREB 1F 250 TTGC 253
Pm DREB 1F 415 CTGC 418
Md DREB 1E ----
Pyb DREB 1E ----
Consensus
Figure 4. 18: Nucleotide sequence alignment of Cannabis sativa DREB 1F like gene
segment with DREB 1F of Prunus mume, DREB 1E of Malus domestica and DREB 1E of
Pyrus x bretschneideri. The symbols ‗Cs‘ represent Cannabis sativa, ‗Pm‘ Prunus mume,
‗Md‘ represent Malus domestica, ‗Pyb‘ represent Pyrus x bretschneideri and ‗*‘ indicate the
nucleotide in that column are similar in all the sequences in alignment. The dotted line shows
the missing nucleotides in a sequence. Cannabis sativa DREB-1F like gene sequences
demonstrated 90%, 92 % and 88 % homology with DREB-1F, DREB-1E and DREB-1E of
Prunus mume, Malus domestica and Pyrus x bretschneideri respectively. Nucleotides
sequence similarity of 80% was found among the above four genes sequences.

CHAPTER # 4 RESULTS
138
Cs CBF 1 CCAGCAAAGAAGAGGAAAGCAGGGAGGAAGAAGTTCAAGGAGACTCGGCACCCGATGTAC 60
Rc CBF 85 CCAGCAAAGAAGAGGAAAGCAGGGAGGACCAAGTTCAAGGAGACTAGGCATCCGATTTAT 144
Pt CBF5 130 ------AAGAAGAAGAAAGCAGGAAGGAAGAAGTTCAAGGAGACTCGGCACCCGGTATAT 189
Pb CBF5 10 ------AAGAAGAAGAAAGCAGGAAGGAAGAAGTTCAAGGAGACTCGGCACCCGGTATAT 69
Consensus ******* ********* **** *************** **** *** * **
Cs CBF 61 AGCGGTGTCCGGCGAAGAAACTCCAGGAAATGGGTTTGCGAGGTGCGAGAACCCAACAAG 120
Rc CBF 145 AGAGGTGTAAGGCGAAGAAATGGGAATAAATGGGTATGTGAAGTTAGAGAACCGAACCTG 204
Pt CBF5 190 AGGGGGGTACGGAAGAGAAATGGGAATAAATGGGTATGTGAAGTGCGAGAACCGAACAAG 249
Pb CBF5 70 AGGGGGGTACGGAAGAGAAATGGGAATAAATGGGTGTGTGAAGTGCGAGAACCGAACAAG 129
Consensus ** ** ** *** ***** * ******** ** ** ** ******* *** *
Cs CBF 121 AAGACCAGGATTTGGCTAGGGACTTTCCCCACCCCCGAAATGGCAGCTAGGGCACATGAC 180
Rc CBF 205 AAATCAAGAATATGGCTAGGGACATACCCTACCCCAGAAATGGCAGCTAGGGCACATGAT 264
Pt CBF5 250 AAATCAAGAATTTGGTTAGGGACCTTCACTAGCCCAGAAATGGCAGCTAGGGCACATGAC 309
Pb CBF5 130 AAATCAAGAATTTGGTTAGGGACCTTCACTAGCCCAGAAATGGCAGCTAGGGCACATGAC 189
Consensus ** * ** ** *** ******* * * * * *** ***********************
Cs CBF 181 GTGGCGGCCTTAGCACTTAGAGGAGAATTTGCTTCTCTCAATTTTCCTGATTCAGCTTGG 240
Rc CBF 265 GTTGCTGCTTTGGCATTCAGAGGAGAGTTTGCTTCTCTCAACTATCTTGATTCAGCTTGG 324
Pt CBF5 310 GTTGCTGCCTTAGCACTGAAGGGAGAAACTGCTACTTTAAATTTTCCTGATTCAGCTTTG 369
Pb CBF5 190 GTTGCTGCCTTAGCACTGAAGGGAGAAACTGCTACTTTAAATTTTCCTGATTCAGCTTTG 249
Consensus ** ** ** ** *** * * ***** **** ** * ** * ** *********** *
Cs CBF 241 ATACTTCCACGACCGAAGTCGTCTTCTGCTGAAGATATAAAAAGAGCTGCGCTTGAAGCT 300
Rc CBF 325 ATACTGCCACGACCAAAGTCGTCTTCTCATGAAGATATTAAAAGGGCTGCTCTTGAAGCT 384
Pt CBF5 370 ATACTTCCTCGAGCGAAGTCGTCTTCTGCTGGAGATATACGAAGAGCTGCGCGTGATGCT 429
Pb CBF5 250 ATACTTCCTCGAGCGAAGTCGTCTTCTGCTRGAGATATACGAAGAGCTGCGCGTGATGCT 309
Consensus ***** ** *** * ************ * ****** *** ***** * *** ***
Cs CBF 301 GCTGAGGCTTTCAAGCCAAGTGCTTCTGATCTATCCTCAACATCACCACCATCGTCTTCT 360
Rc CBF 385 GCTGAGGCTTTCAAGCCAAGTTCTACTGATCTATCCTCAACATCACCACCATCGTCTTCT 444
Pt CBF5 430 GTTGAGGCCTTTATACCTAGTGCTTCT--------------------------------- 457
Pb CBF5 310 GTTGAGGCCTTTATACCTAGTGCTTCT--------------------------------- 337
Consensus * ****** ** * ** *********
Cs CBF 361 TCTTGTTCGTCTGCGTCTTCTA 382
Rc CBF 445 TCTTGTTCGTCTGCGTCTTCTA 466
Pt CBF5 ----------------------
Pb CBF5 ----------------------
Consensus
Figure 4. 19: Nucleotide sequence alignment of Cannabis sativa CBF like gene segment
with CBF like gene of Ricinus communis, CBF5 of Populus trichocarpa and CBF5 of
Populus balsamifera. The symbol ‗Cs‘ Cannabis sativa, ‗Rc‘ represent Ricinus communis,
‗Pt‘ represent Populus trichocarpa, ‗Pb‘ represent Populus balsamifera and ‗*‘ indicate the
nucleotide in that column are similar in all the sequences in alignment. The dotted line shows
the missing nucleotides in a sequence. The CBF like gene sequences of Cannabis sativa
showed 86 %, 83 % and 83% homology with CBF like gene sequences of Ricinus communis,
Populus trichocarpa and Populus balsamifera plants respectively. Nucleotides sequence
homology of 65% was present among the four gene sequences.

CHAPTER # 4 RESULTS
139
4.3.2.4 Protein sequence analysis of DREB 1B, DREB 1F and CBF like genes of Cannabis
sativa plant
Predicted amino acid sequence of Cannabis sativa DREB 1B, DREB 1F and CBF like
protein fragments and their sequence comparison with related proteins from other plant
species is given in figure 4.19 (A, B, C respectively). The Cannabis sativa DREB 1B like
protein fragment showed 73% and 77% amino acid homology with DREB 1B (of Pyrus x
bretschneideri) and DREB 1D (of Malus domestica) proteins (Figure 4.19 A). Amino acid
sequence similarity of 95% was found between Cannabis sativa DREB-1F like protein
fragment and DREB-1F (of Prunus mume) protein (Figure 4.19 B). Similarly DREB-1E (of
Malus domestica) and DREB-1E (of Pyrus x bretschneideri) proteins demonstrated 94%
amino acid sequence similarity with the Cannabis sativa DREB-1F like protein segment
(Figure 4.19 B). The CBF like protein fragment of Cannabis sativa showed 93% amino acid
sequence homology with CBF like protein fragment of Ricinus communis and 84% amino
acid sequence homology with CBF5 of Populus trichocarpa and Populus balsamifera (Figure
4.19 C).

CHAPTER # 4 RESULTS
140
A Cs DREB 1B 6 GKWVCEMRQPDHNKSRVWLGTFPYPDMAARAYEVAAFALRGESASLNFPEISSLLPQFTS 185
Pyb DREB 1B 34 GKWVCELRQPDHKKSRIWLGTFTSPDMAARAYDVAALALKGESASLNFPNETSALPRFES 93
Md DREB 1D 34 GKWVCELRQPDHKKSRIWLGTFTSPDMAARAYDVAALALKGESASLNFPNEASALPRFES 93
Consensus ****** ********* ***** ******** *** ** ********* * ** * *
Cs DREB 1B 186 SNANMEND 206
Pyb DREB 1B 94 -NAYTVKD 100 Md DREB 1D 94 -NA----D 95
** *
B Cs DREB 1F 1 ATSYPKKRAGRRVFKETRHPVYRGVRRRNNDKWVCEMREPNK-KSRIWLGTYPTAEMAAR 177
Pm DREB 1F 40 ASSRPKKRAGRRVFKETRHPVYRGVRRRNNDKWVCEMREPKKTKSRIWLGTYPTAEMAAR 99
Md DREB 1E 42 ASSRPKKRAGRRVFKETRHPVYRGVRRRNNNKWVCEMREPNKKKSRIWLGTYPTAEMAAR 101
Pyb DREB 1E 42 ASSRPKKRAGRRVFKETRHPVYRGVRRRNNNKWVCEMREPNKKKSRIWLGTYPTAEMAAR 101
Consensus * * ************************** *********** *****************
Cs DREB 1F 178 AHDVAALAFRGKPACLNFADSAWRL 252
Pm DREB 1F 100 AHDVAALAFRGKLACLNFADSAWRL 124
Md DREB 1E 102 AHDVAALAFRGKLACLNFADSAWRL 126
Pyb DREB 1E 102 AHDVAALAFRGKLACLNFADSAWRL 126
Consensus *************************
C Cs CBF 40 ETRHPIYRGVRQRNGNKWVCEVREPNKKSRIWLGTYPTPEMaarahdvaalalrGEFASL 219
Rc CBF 42 ETRHPIYRGVRRRNGNKWVCEVREPNLKSRIWLGTYPTPEMAARAHDVAALAFRGEFASL 101
Pt CBF5 55 ETRHPVYRGVRKRNGNKWVCEVREPNKKSRIWLGTFTSPEMAARAHDVAALALKGETATL 114
Pb CBF5 15 ETRHPVYRGVRKRNGNKWVCEVREPNKKSRIWLGTFTSPEMAARAHDVAALALKGETATL 74
Consensus *********** *********************** *************** * * *
Cs CBF 220 NFPDSAWILPRPKSSSAEDIKRAALEAAEAFK 315
Rc CBF 102 NYLDSAWILPRPKSSSHEDIKRAALEAAEAFK 133
Pt CBF5 115 NFPDSALILPRAKSSSAGDIRRAARDAVEAF- 145
Pb CBF5 75 NFPDSALILPRAKSSSARDIRRAAXDAVEAF- 105
Consensus * *** ********* ****** * ***
Figure 4. 20: Multiple alignment and comparison of the deduced amino acids sequence of (A)
Cannabis sativa DREB-1B like protein fragment with DREB-1B of Pyrus x bretschneideri
and DREB-1B of Malus domestica, (B) Cannabis sativa DREB-1F like protein fragment with
DREB-1F of Prunus mume, DREB-1E of Malus domestica and DREB-1E of Pyrus x
bretschneideriand (C) Cannabis sativa CBF like protein fragment with CBF of Ricinus
communis, CBF5 from Populus trichocarpa and CBF5 of Populus balsamifera. The symbols
‗*‘ indicate the nucleotide in that column are similar in all the sequences in alignment, ―Cs‖
represent Cannabis sativa, ―Pyb‖ denote Pyrus x bretschneideri, ―Md‖ represent Malus
domestica, ―Pm‖ denote Prunus mume, ―Rc‖ shows Ricinus communis, ―Pt‖ represent
Populus trichocarpa and ―Pb‖ denote Populus Balsamifera. The dotted line shows the
missing amino acids in a sequence. Cannabis sativa DREB-1B like protein fragment showed
73% and 77% amino acid sequence homology with DREB-1B proteins of Pyrus x
bretschneideri and Malus domestica respectively. Amino acid sequence of DREB-1F protein
fragment of Cannabis sativa showed amino acid sequence similarity of 95%, 94% and 94%
with DREB-1F, DREB1E and DEB1E amino acids sequences of Prunus mume, Malus
domestica and Pyrus x bretschneideri respectively. Amino acid sequence of Cannabis sativa
CBF like protein fragment demonstrated 93%, 84% and 84% homology with amino acid
sequences of CBF like proteins of Ricinus communis, Populus trichocarpa and Populus
balsamifera respectively.
CHAPTER # 4 RESULTS
141
4.3.2.5 Correlations of DREB 1B, DREB 1F and CBF like gene sequences with Cd
accumulation and concentration of proline and phenolics in Cannabis sativa plant
Correlations of cadmium accumulation in Cannabis sativa plants with expression of DREB
1B, DREB 1F and CBF like genes are presented in Figure 4.21 (A, B and C respectively).
Cadmium accumulation demonstrated significantly positive correlation with expression of the
BREB 1B gene (Figure 4.21 A) while the correlation of Cd accumulation with DREB 1F
(Figure 4.21 B) and CBF like gene (Figure 4.21 C) were positive but not statistically
significant. Expression of Cannabis sativa DREB-1B like gene showed strong positive
correlation (R2 = 0.7509) with accumulation of cadmium in Cannabis sativa plant (Figure
4.21 A). Positive correlations were found between DREB 1B, DREB 1F and CBF like genes
expression and the concentration of free proline (Figure 4.22 A, B, C respectively) and total
phenolics (Figure 4.22 D, E, F respectively) in Cannabis sativa plant.

CHAPTER # 4 RESULTS
142
Figure 4. 21: Correlation of cadmium accumulation in Cannabis sativa with expression of
CsDREB-1B (A), CsDREB-1F (B) and CsCBF like gene (C). The symbol ―*‖ denote the
significance of the correlation.
y = 0.0216x - 0.1604 R² = 0.7509 *
0.00
0.20
0.40
0.60
0.80
1.00
1.20
0.00 10.00 20.00 30.00 40.00 50.00 60.00
Cd
acc
um
ula
tio
n (
mg/
DW
)
Expression level
DREB 1B gene
A
y = 0.0224x - 0.051 R² = 0.551
0.00
0.20
0.40
0.60
0.80
1.00
1.20
0.00 10.00 20.00 30.00 40.00 50.00 60.00
Cd
acc
um
ula
tio
n (
mg/
DW
)
Expression level
DREB 1F Gene
B
y = 0.0178x + 0.1562 R² = 0.5629
0.00
0.20
0.40
0.60
0.80
1.00
1.20
0.00 10.00 20.00 30.00 40.00 50.00 60.00
Cd
acc
um
ula
tio
n (
mg/
DW
)
Expression Level
CBF like gene
C

CHAPTER # 4 RESULTS
143
Figure 4. 22: Correlations of DREB 1B, DREB 1F and CBF like genes expression with free
proline (A, B and C respectively) and total phenolics concentration (D, E and F respectively) in
Cannabis sativa plant.
y = 0.6569x + 59.401 R² = 0.5646
0
20
40
60
80
100
120
0.00 20.00 40.00 60.00
Free
pro
line
con
cen
trat
ion
(p
pm
)
DREB-1B like gene expression level A
y = 0.6702x + 62.433 R² = 0.4162
0
20
40
60
80
100
120
0.00 20.00 40.00 60.00
Free
pro
line
con
cen
trat
ion
(p
pm
)
DREB-F like gene expression level
y = 0.2135x + 31.795 R² = 0.0563
0
10
20
30
40
50
60
0.00 20.00 40.00 60.00
Free
pro
line
con
cen
trat
ion
(p
pm
)
CBF like gene expression level C
y = 0.6569x + 59.401 R² = 0.5646
0
20
40
60
80
100
120
0.00 20.00 40.00 60.00
Tota
l ph
eno
lics
con
cen
trat
ion
(p
pm
)
DREB-1B like gene expression level
y = 0.6702x + 62.433 R² = 0.4162
0
20
40
60
80
100
120
0.00 20.00 40.00 60.00
Tota
l ph
eno
lics
con
cen
trat
ion
(p
pm
)
DREB-F like gene expression level
y = 0.2135x + 31.795 R² = 0.0563
0
10
20
30
40
50
60
0.00 20.00 40.00 60.00
Tota
l ph
eno
lics
con
cen
trat
ion
(p
pm
)
CBF like gene expression level
B
D
E F
A
C

CHAPTER # 4 DISCUSSION
144
4.4 DISCUSSION
A variety of transcription factors affect the expression of stress resistant genes and thus play a
crucial role in plant responses to biotic and abiotic stresses (Akhtar et al 2012; Hadi et al
2011; Ito et al 2006; Dubouzet et al 2003). Expression of transcriptional factors like CBF/
DREB have been previously studied under low temperature, drought and salinity stresses
(Hadi et al 2011). In present research we found that DREB 1B, DREB 1F and CBF like genes
in Ricinus communis and Cannabis sativa plants expressed under Cd stress. Extensive cross-
talk between abiotic stress signaling pathways have been reported in previous literature
(Agarwal and Jha 2010; Huang et al 2012). Since the expression of DREB/CBF genes is
known to be influenced by low-temperature, drought or salinity stress, therefore it would not
be surprising that their expression might also be influenced by other abiotic stresses such as
heavy metal exposure. Mechanism by which cadmium induce the expression of DREB/CBF
genes is not known as far as our knowledge is concern. Cadmium has been found to induce
physiological drought by altering water content in plant tissues (Barcelo and Poschenrieder
1990) and this might be one of the reasons for the expression of DREB 1B, DREB 1F and
CBF like genes like genes in Ricinus communis and Cannabis sativa plants under Cd stress.
But a relationship between drought and Cd stresses at the transcription level has not been
reported as far as we know (Oono et al 2014).
In our experiments, the molybdenum foliar spray alone (without Cd) had no effect on the
expression of DREB 1A, DREB 1B and DREB 1F like gene in Ricinus communis and
Cannabis sativa plants. The CBF like genes expressed under the Mo foliar spray (without
Cd) in the plants. Application of molybdenum foliar spray in combination with Cd (added to
soil) increased the expression of DREB 1B, DREB 1F and CBF like genes; suggesting a
possible role of molybdenum in enhancing the expression of these genes under Cd stress.
Molybdenum cofactor (MoCo) is required for the biosynthesis of abscisic acid (ABA) (Xiong
et al 2001). Several investigators reported expression of CBF/ DREB like transcription
factors under high concentration of abscisic acid in plant tissues (Liu et al 1998; Yang et al
2009; Wang et al 2008; Shen et al 2003). It is possible that Mo might enhanced the
expression of DREB 1B, DREB 1F and CBF like genes by increasing biosynthesis of abscisic
acid under cadmium stress. Since we have studied only a small fragments of the DREB 1A,
DREB 1B, DREB 1F and CBF like gene and the full length gene sequences have not been
isolated and investigated due to lack of financial support and time constrain.
Expression of the CBF/ DREB like genes demonstrated positive correlation with the
concentration of free proline in plant tissues, which suggest the possible role of these genes in

CHAPTER # 4 DISCUSSION
145
biosynthesis of proline (Tuteja et al 2012). Increased in concentration of free proline have
been reported under the over-expressed CBF/DREB genes (Gilmour et al 2000; Hadi et al
2011). Proline act as an osmoprotector and thus protect cellular components from toxic
effects of heavy metals. It was noted that total phenolics in plant leaves increased with the
expression of CBF/DREB genes. Phenolic compounds are strong antioxidants and play an
important role in scavenging the reactive oxygen species (ROS) produced by cadmium in the
plants.

CHAPTER # 4 DISCUSSION
146
4.5 Conclusions
DREB/CBF genes have mostly been studied under drought, frost and salinity stresses. In
present research an effort has been made to study the effect of toxic heavy metal (cadmium)
and micronutrient (molybdenum) on the expression of four selected DREB/CBF genes in
Ricinus communis and Cannabis sativa plants. Three of the four genes (DREB-1B, DREB-1F
and CBF like factor) sequences showed expression under cadmium stress. Molybdenum
further increased expression level of the above genes sequences when used in combination
with cadmium. Only the CBF like gene demonstrated expression in plants treated with only
Mo. DREB-1A like gene sequences did not showed expression at all the treatments and
controls. Our results suggested that expression of these genes responsive to drought stress
(also implying a relationship to high-salinity and low temperature stresses) was affected by
Cd exposure, but a relationship between Cd and drought stresses at the transcription level has
not been reported as far as we know. It is further recommended to isolate the whole gene
sequences of the DREB-1B, DREB-1F and CBF like genes to conform that the studied
sequences belongs to these genes. Other DREB/CBF genes should be studied in Ricinus
communis and Cannabis sativa plants for their expression under Cd stress.

CHAPTER # 5
GENERAL DISCUSSION

CHAPTER # 4 GENERAL DISCUSSION
146
CHAPTER 5: General discussion
5.1. Phytoextraction as a promising green technology for heavy metals remediation
Environmental pollution is global problem and number of organizations and agencies are
involved to facilitate the safe restoration of soil and ground water but most of the strategies
adopted for this purpose are highly expensive and laborious. Instead of classical technologies,
phytoextraction is an emerging technology for the safe restoration of toxic metals polluted
soil and water. It is very cheaper, solar driven and environment friendly technology, which is
highly suitable for the developing countries like Pakistan. Many research is going on to find
out the biochemical and molecular mechanisms involved in the uptake and accumulation of
toxic metals in plant. In the present research, we investigated the molecular, biochemical and
physiological aspects of cadmium phytoextraction from contaminated soil using Ricinus
communis, Cannabis sativa and Parthenium hysterophorus plants. All the three plants are
highly suited for the phytoextraction purpose due to their huge biomass, high tolerance to
heavy metals and almost non palatable nature to herbivores to prevent entry of toxic metals
into the food chain.
5.2. CBF/DREB transcriptional factors (CBF regulon) can play role in phytoextraction
of cadmium
Transcriptional factors (TF) play an important role in plant defense against abiotic stress.
Single TF can regulate a number of downstream genes (regulon), their products contribute in
resistance to abiotic stresses. Which make the TF a suitable candidate in research for the
improvement in phytoextraction technology. In present research, we investigated the
expression of well characterized drought, frost and salinity stress-related transcription factors
(i.e. DREB 1A, DREB-1B, DREB-1F and CBF) genes in Ricinus communis and Cannabis
sativa plants under Cd stress. The DREB-1B, DREB-1F and CBF like gene sequences were
identified for the first time in Cannabis sativa plant. It was found that the DREB-1B, DREB-
1F and CBF like genes expressed in Ricinus communis and Cannabis sativa plants under
cadmium stress. The actual mechanism by which Cd induces the expression of DREB/CBF
genes is not known as for as our knowledge is concerned. Extensive cross-talk between
different stress signalling pathways have been reported in plants (Agarwal and Jha 2010;
Huang et al 2012) and it can be expected that these transcription factors might also be
expressed under cadmium stress. Over expression of CBF/DREB genes in plants have been
reported to increase the tolerance level of plants to various abiotic stresses (Hadi et al 2011).
The increase in expression of DREB-B, DREB-1F and CBF like genes and accumulation of

CHAPTER # 4 GENERAL DISCUSSION
147
cadmium in plants support our hypothesis that the DREB-B, DREB-1F and CBF like genes
might have some important role in increasing plant tolerance and accumulation of cadmium
in plants. The overexpression of CBF/DREB like TF might play two important roles in the
improvement of cadmium phytoextraction; (1) they could increase the phytoextraction
potential of a plant by increasing its tolerance to cadmium and (2) possibly they may provide
an opportunity to use this plants for removal of Cd from soil under harsh conditions such as
salinity, low temperature or drought. The present investigation could open a window for new
research in field of regulon biotechnology (CBF regulon) for development of phytoextraction
technology.
5.3. Proline and phenolic compounds enhance plant defense and cadmium
phytoextraction
Significant increase in concentration of free proline and total phenolics in roots and leaves of
Ricinus communis, Cannabis sativa and Parthenium hysterophorus were noted with increase
in accumulation of cadmium in the plant tissues. Proline and phenolic compounds increase
the tolerance level of a plant by scavenging the reactive oxygen species produced by toxic
heavy metals as well as by shielding the macromolecules and cell organelles from the direct
or indirect toxicity of cadmium (Khatamipour et al 2011; Sun et al 2007). Proline act as an
osmoprotectant and its concentration in plants is highly increased during drought conditions.
Cadmium produce physiological drought in plants which activate the enzyme ‗pyroline-5-
carboxylate‘ (involved in proline bio-synthesis) and thus increase the concentration of free
proline in plant tissues (Ali et al 2001; Delauney and Verma 1993). Phenolic compounds are
produced mainly in response to the increased level of ROS during the heavy metals stress in
plants (Jung et al 2003: Bors et al 1990). The treatments of molybdenum and gibberellic acid
highly increased the concentration of free proline and total phenolics in the plants and thus
amplified the plant defense against cadmium toxicity. A plant with strong biochemical
defense is highly suited for the phytoextraction purposes.
5.4. High biomass and high concentration of toxic metals in the biomass greatly
enhanced the phytoextraction ability of plants
Total amount of metal extracted by plants are determined by concentration of the metals in
biomass and total biomass of the plant and both of these factors are important
(Padmavathiamma and Li 2007). For efficient phytoextraction, a plant must produce high
biomass and should tolerate high concentration of toxic heavy metals in the biomass. Plant
growth parameters such as biomass are highly sensitive to Cd toxicity (Hadi et al 2015;

CHAPTER # 4 GENERAL DISCUSSION
148
Khatamipour et al 2011; Arun et al 2005). Cadmium disturbs the structure and function of
some important enzymes involved in metabolism and consequently decrease plant growth
and biomass (Houshmandfar and Moraghebi 2011; John et al 2009). To increase the biomass
we used phytohormone gibberellic acid (GA3) in our first experiment on Parthenium
hysterophorus plant and found that biomass of the plant was highly increased by GA3 under
cadmium stress. In the same experiment ethylenediaminetetraacetic acid was used for
increasing Cd bioavalibility in soil. EDTA increased the concentration of Cd in plant but
reduced the biomass which in turn affect the phytoextraction potential of plants. Application
of GA3 in combination with EDTA restored the plant biomass as well as the uptake and
accumulation of Cd in the plant tissues. This might be due to the effect of EDTA on
increasing Cd bio-availability in soil and the role of GA3 on the plant growth and nutrient
uptake (Mamindy-Pajany et al 2014; Hadi et al 2014; Tassi et al 2008; Meers et al 2005;
Thayalakumaran et al 2003; Chen and Cutright 2001).
Ricinus communis and Cannabis sativa plants showed higher biomass with molybdenum
treatments. Molybdenum act as cofactor for enzymes involved in nitrogen metabolism,
synthesis of indole-3-acetic acid (IAA) and abscisic acid ABA (Hesberg et al 2004; Sagi et al
2002; Schwartz et al 1997; Marin and Marion-Poll 1997) that play important role in
increasing plant growth and defense against toxicity of heavy metals. R. communis and C.
sativa with molybdenum (Mo) foliar spray increased the biomass and Cd accumulation in the
plants tissues. All the plants demonstrated highest Cd concentration in their roots which is the
confirmation of results obtained in Nerium oleander (Kadukova et al 2006), Triticum
aestivum and Triticum durum (Kovaeevic et al 1999; Ozturk et al 2003), Pinus sylvestris
(Kim et al 2003) and maize (Ekmekci et al 2008).

CHAPTER # 4 GENERAL DISCUSSION
149
5.5. Conclusions
The DREB 1A, DREB 1B and CBF like genes expressed in Ricinus communis and Cannabis
sativa plants under cadmium stress. Molybdenum foliar spray further increased the expression of
these genes under Cd stress. The presence of these genes are reported in Cannabis sativa plant
for the first time. Cadmium uptake and accumulation in plants tissues increased with increase in
concentration of free proline and total phenolics. Significantly positive correlations of DREB
1A, DREB 1B and CBF like genes expression with Cd accumulation, free proline and total
phenolics were found in Ricinus communis while such correlations were positive but non-
significant in Cannabis sativa. Foliar spray of Mo was found better in terms of increasing
biomass, Cd accumulation and concentration of proline and phenolics in the plants as compared
to seed soaking and soil addition applications of Mo. Both the plants showed high
bioconcentration of Cd in their tissues and the treatments of Mo further increased the
bioconcentration. The treatments of gibberellic acid and ethylenediaminetetraacetic acid highly
increased Cd uptake, translocation and accumulation in P. hysterophorus plant. Biomass of the
plant was increased by the foliar application of gibberellic acid while uptake and Cd
accumulation was enhanced by ethylenediaminetetraacetic acid.

CHAPTER # 4 GENERAL DISCUSSION
150
5.6. Recommendations
Since the CBF/DREB genes are investigated for the first time for its role in Cd phytoextraction
and this research will open a new window for investigation of CBF/DREB like genes under
heavy metals stress. We have isolated and studied some parts of the whole genes, we were
interested in further study of whole genes but due to financial and time constraint unable to
perform. Therefore further study is recommended to isolate and investigate the full length
CBF/DREB genes under cadmium stress. Molybdenum have shown good results and it is highly
recommended to study its role in phytoextraction of other toxic metals as well as its effect on
other transcription factors involved in plant abiotic stresses. Mo play important role in nitrate
uptake and assimilation in plants, so it is recommended to test the effect of nitrogen fertilizer in
combination with the foliar spray of Mo on Cd phytoextraction. Further study is recommended to
find the biochemical basis of proline and phenolics synthesis and their role in Cd
phytoextraction. It is highly suggested to investigate the effect of individual phenolics rather
than total phenolics to find out the candidate compound, responsible for metal detoxicificantion
and enhanced phytoextraction. In the present work individual phenolics were not studied due to
financial constraint.
REFERENCES
151
REFERENCES
Adewole MB, Sridhar MKC, Adeoye GO (2010) Removal of Heavy Metals from Soil Polluted
with Effluents from a Paint Industry Using Helianthus annuus L. and Tithonia
diversifolia (Hemsl.) as Influenced by Fertilizer Applications. Bioremediation Journal
14(4), 169–179.
Aery NC, Rana DK (2003) Growth and cadmium uptake in barley under cadmium stress.
Journal of Environmental Biology 24, 117-123.
Agarwal PK, Agarwal P, Reddy MK, Sopory SK (2006) Role of DREB transcription factors in
abiotic and biotic stress tolerance in plants. Plant Cell Reports 25, 1263–1274.
Agarwal PK, Jha B (2010) Transcription factors in plants and ABA dependent and independent
abiotic stress signaling. Biologia Plantarum 54 (2), 201-212.
Agarwala SC, Sharma CP, Farooq S, Chatterjee C (1978) Effect of molybdenum deficiency on
the growth and metabolism of corn plants raised in sand culture. Canadian Journal of
Botany 56, 1905–1909.
Ahmad A, Hadi F, Ali N (2015) Effective Phytoextraction of Cadmium (Cd) with Increasing
Concentration of Total Phenolics and Free Proline in Cannabis sativa (L) Plant Under
Various Treatments of Fertilizers, Plant Growth Regulators and Sodium Salt. International
Journal of Phytoremediation 17, 56-65.
Ahmad P, Jhon R (2005) Effect of salt stress on growth and biochemical parameters of Pisum
sativum L. Archives of Agronamy and Soil Science 51, 665-672.
Ahmad P, Jhon R, Sarwat M, Umar S (2008) Responses of proline, lipid peroxidation and
antioxidative enzymes in two varieties of Pisum sativum L. under salt stress.
International Journal of Plant Production 2, 353-366.
Akesson A, Julin B, Wolk A (2008) Long-term dietary cadmium intake and postmenopausal
endometrial cancer incidence: a population-based prospective cohort study. Cancer
Research 68, 6435-6441.

REFERENCES
152
Akhtar M1, Jaiswal A, Taj G, Jaiswal JP, Qureshi MI, Singh NK (2012) DREB1/CBF
transcription factors: their structure, function and role in abiotic stress tolerance in plants.
Journal of Genetics 91(3), 385-95.
Ali G, Srivastava PS, Iqbal M (2001) Responses of Bacopa monniera cultures to cadmium
toxicity. Bulletin of Environmental Contamination and Toxicology 66: 342–349.
Ali N, Hadi F (2015) Phytoremediation of cadmium improved with the high production of
endogenous phenolics and free proline contents in Parthenium hysterophorus plant
treated exogenously with plant growth regulator and chelating agent. Environmental
Science and Pollution Research 22, 13305-13318.
Allen SE (1974) Chemical Analysis of Ecological Materials. Blackwell Scientific Publication,
Oxford, London.
Al-Wakeel SAM, Hamed AA, Dadoura SS (1995) Interactive effects of water stress and
gibberellic acid on mineral composition of fenugreek plant. Egyptian Journal of
Physiological Sciences 18, 269-282.
Ambedkar G, Muniyan M (2013) Bioaccumulation of heavy and essential metals in the selected
freshwater fish species from Preumallake Cuddalore District, Tamilnadu, India. Indian
streams research journal 2(12), 1-7.
Arnon DI (1949) Copper enzymes in isolated chloroplasts, Polyphenoloxidae in Beta vulgaris
Plant Physiology 24, 1- 15.
Arnon DI, Stout PR (1939) Molybdenum as an essential element for higher plants. Plant
Physiology 14, 599–602.
Arora A, Byrem TM, Nari MG, Strasburg GM (2000) Modulation of liposomal membranes
fluidity by flavonoids and isoflavonoids. Archives of Biochemistry and Biophysics 373(1),
102-109.
Arteca RN (1996) Plant Growth Substances: Principles and Applications, Chapman and Hall Inc,
New York.
Arun KS, Carlos C, Herminia LZ, Avudainayagam S (2005) Chromium toxicity in plants.
Environment International 31, 739-753.

REFERENCES
153
Astolfi S, Zuchi S, Passera C (2005) Effect of cadmium on H+ATPase activity of plasma
membrane vesicles isolated from roots of different S-supplied maize (Zea mays L.) plants.
Plant Sciences 169, 361–368.
Baker AJM Brooks RR (1989) Terrestrial higher plants which hyperaccumulate metallic
elements – a review of their distribution ecology and phytochemistry. Biorecovery 1,
811–826.
Balaknina T, Kosobryukhov A, Ivanov A, Kreslauskii V (2005) The effect of cadmium on CO2
exchange, variable fluorescence of chlorophyll and the level of antioxidant enzymes in pea
leaves. Russian Journal of Plant Physiology 52, 15-20.
Bandurska H (2001) Does proline accumulated in leaves of water deficit stressed barley plants
confine cell membrane injuries? II. Proline accumulation during hardening and its
involvement in reducing membrane injuries in leaves subjected to severe osmotic stress.
Acta Physiol. Plant 23, 483-490.
Barcelo J, Poschenriede C (1990) Plant water relations as affected by heavy metal stress: A
review. Journal of Plant Nutrition 13, 1-37.
Bates LS, Waldren RP, Teare ID (1973) Rapid determination of free proline for water stress
studies. Journal of Plant Soil 39, 205–207.
Bavi K, Kholdebarin B, Moradshah A (2011) Effect of cadmium on growth, protein content and
peroxidase activity in pea plants. Pakistan Journal of Botany 43, 1467-1470.
Beak KH, Chang JY, Chang YY, Bae BH, Kim J, Lee IS (2006) Phytoremediation of soil
contaminated with cadmium and/or 2,4,6- Trinitrotoluene. Journal of Environmental
Biology 27, 311-316.
Benjerano NR, Lips SH (1970) Hormonal regulation of nitrate reductase activity in leaves. New
Phytologist 69(1), 165-169.
Berglund M, Akesson A, Nermell B, Vahter M (1994) Intestinal absorption of dietary cadmium
in women depends on body iron stores and fiber intake. Environmental Health
Perspectives 102, 1058-1066.
Bhattacharjee S, Mukherjee AK (1994) Influence of cadmium and lead on physiological and
biochemical responses of Vigna unguiculata (L). WalP. Seedling germination

REFERENCES
154
behaviour, total protein, proline content and protease activity. Pollution Research 13,
269-277.
Bhawmilk PC, Sarkar D (2005) Parthenium hysterophorus: Its world status and potential
management. pP. 1-6. In: Proceeding of the Second International Conference on
Parthenium Management 5-7 December 2005. University of Agricultural Science
Bangolore, India.
Blokhina O, Virolainen E, Fagerstedt KV (2003) Antioxidants, oxidative damage and oxygen
deprivation stress: a review. Annals of Botany 91, 179-194.
Bors W, Heller W, Michel C, Saran M (1990) Flavonoids as antioxidants: determination of
radical-scavenging efficiency. Methods in Enzymology 186, 343-355.
Broughton WJ, McComb AJ (1971) Changes in the pattern of enzyme development in
gibberellin-treated pea internodes. Annual Botany journal 35, 213-228.
Buchanan BB, Gruissem W, Jones RL (2000) Biochemistry and Molecular Biology of Plants,
American Society of Plant Physiologists, Rockville, Maryland, USA.
Century K, Reuber TL, Ratcliffe OJ (2008) Regulating the regulators: the future prospects for
transcription-factor-based agricultural biotechnology products. Plant Physiology 147, 20–
29.
Chai MW, Li RL, Shi FC, Liu FC, Pan X, Cao D, Wen X (2012) Effects of cadmium stress on
growth, metal accumulation and organic acids of Spartina alterniflora Loisel. African
Journal of Biotechnology 11(22), 6091-6099.
Chaudiere J, Ferrari-Iliou R (1999) Intracellular antioxidants: from chemical to biochemical
mechanisms. Food and Chemical Toxcology 37, 949-962.
Chen H, Cutright T (2001) EDTA and HEDTA effects on Cd, Cr and Ni uptake by Helianthus
annus. Chemosphere 45, 21–28
Chen Y, Shen Z, Li X (2004) The use of vetiver grass (Vetiveria zizanioides) in the
phytoremediation of soils contaminated with heavy metals. Applied Geochemistry 19,
1553-1565

REFERENCES
155
Cho U Seo N (2004) Oxidative stress in Arabidopsis thaliana exposed to cadmium is due to
hydrogen peroxide accumulation. Plant Sciences 168, 113-120.
Choi YE Harada E (2005) Roles of calcium and cadmium on Cd containing intra and
extracellular formation of Ca crystals in tobacco. Journal of Plant Biology 48, 113–119.
Choudhary NL, Sairam RK, Tyagi A (2005) Expression of delta1-pyrroline-5-carboxylate
synthetase gene during drought in rice (Oryza sativa L.). Indian Journal of Biochemistry
and Biophysics 42, 366–370.
Chugh LK Sawhney SK (1999) Photosynthetic activities of Pisum sativum seedlings grown in
presence of cadmium. Plant Physiology and Biochemistry 37, 297-303.
Chugh LK, Sawhney SK, Ghorbal MN, Ferjani EE (1997) Cadmium and zinc induction of lipid
peroxidation and effects on antioxidant enzymes activities in bean (Phaseolus vulgaris
L.). Plant Sciences 127, 139-147.
Citterio S, Santagostino A, Fumagalli P, Prato N, Ranalli P, Sgorbati S (2003) Heavy metal
tolerance and accumulation of Cd, Cr and Ni by Cannabis sativa L. Plant and Soil
256:243-252.
Cluis C (2004) Junk-greedy greens: phytoremediation as a new option for soil decontamination.
Biotechnology Journal 2:60–67.
Costa G, Morel J (1994) Water relations, gas exchange and amino acid content in Cd-treated
lettuce. Plant Physiology and Biochemistry 32, 561–570.
Crozier A, Turnbull CGN, (1984) Gibberellins: Biochemistry and action in extension growth.
What‘s New in Plant Physiology 15, 9-12.
Cunningham SD, Shann JR, Crowley DE, Anderson TA (1997) Phytoremediation of
contaminated water and soil. In E. L. Kruger, T. A. Anderson, & J. R. Coats (Eds.),
Phytoremediation of soil and water contaminants. ACS Symposium series 664 (pP. 2–19).
Washington, DC: American Chemical Society.
Curtis D, Klaassen JL, Choudhuri S (1999) Metallothionein: An Intracellular Protein to Protect
Against Cadmium Toxicity. Annual Review of Pharmacology and Toxicology 39, 267–294.
REFERENCES
156
De B, Mukherjee AK (1998) Mercury induced metabolic changes in seedlings and cultured cells
of tomato. Geobios 23, 83-88.
Debruyne D, Albessard F, Bigot MC, Moulin M (1994) Comparison of three advanced
chromatographic techniques for Cannabis identification. Bulletin on Narcotics 46, 109-
121.
Delauney AJ, Verma DPS (1993) Proline biosynthesis and osmoregulation in plants. Plant
Journal 41, 215–223.
Demiral T, Turkan I (2005) Comparative lipid peroxidation, antioxidant defense systems and
proline content in roots of two rice cultivars differing in salt tolerance. Environmental and
Experimental Botany 53, 247-57.
Demirevska-Kepava K, Simova-Stoilova L, Stoyanova Z, Feller U (2006) Cadmium stress in
barley: Growth, leaf pigment and protein composition and detoxification of reactive
oxygen species. Journal of Plant Nutrition 29, 451-468.
Devi SR, Prasad MNV (1998) Copper toxicity in Ceratophyllum demeresum L. (Coontail), a free
floating macrophyte: Response of antioxidant enzymes and antioxidants. Plant Sciences,
138:157.
Dhawan SR, Dhawan P (1996) Regeneration in Parthenium hysterophorus L. World Weeds 3,
181–182.
Dheri GS, Singh Brar M, Malhi SS (2007) Influence of phosphorus application on growth and
cadmium uptake of spinach in two cadmium-contaminated soils. Journal of Plant Nutrition
and Soil Sciences 170, 495–499.
di Toppi LS, Gabbrielli R (1999) Response to cadmium in higher plants. Environmental and
Expimental Botany 41, 105–130.
Diaz J, Bernal A, pomar F, Merino F (2001) Induction of shikimate dehydrogenase and
peroxidase in pepper (Capsicum annum L.) seedlings in response to copper stress and its
relation to lignifcation. Plant Sciences 1, 161-179.
Dubouzet JG, Sakuma Y, Ito Y, Kasuga M, Dubouzet EG, et al (2003) OsDREBgenes in
rice, Oryza sativa L., encode transcription activators that function in drought-, high-salt-

REFERENCES
157
and cold-responsive gene expression. Plant J 33: 751–763. doi: 10.1046/j.1365-
313x.2003.01661.x
Dushenkov V, Kumar PBAN, Motto H, Raskin I (1995) Rhizofiltration: The use of plants to
remove heavy metals from aqueous streams. Environmental Science and Technology 29,
1239–1245.
Ekmekci Y, Tanyolac D, Ayhan B (2008) Effects of cadmium on antioxidant enzyme and
photosynthetic activities in leaves of two maize cultivars. Journal of Plant Physiology
165, 600–611.
Entry JA, Watrud LS, Reeves M (1999) Accumulation of 137Cs and 90Sr from contaminated
soil by three grass species inoculated with mycorrhizal fungi. International Journal of
Environmental Pollution 104, 449-457.
Epelde L, Hernández-Allica J, Becerril JM, Blanco F, Garbisu C (2008) Effects of chelates on
plants and soil microbial community: comparison of EDTA and EDDS for lead
phytoextraction. Science of Total Environment 401, 21–28.
Evangelou MWH, Ebel M, Schaeffer A (2007) Chelate assisted phytoextraction of heavy metals
from soils; effect, mechanism, toxicity, and fate of chelating agents. Chemosphere 68,
989-1003.
Evins WH, Varner JE (1972) Hormonal control of polyribosome formation in barley aleurone
layers. Plant Physiology 49, 348-352.
Falkowska M, Pietryczuk A, Piotrowska A, Bajguz A, Grygoruk A, Czerpak R (2011) The effect
of gibberellic acid (GA3) on growth, metal biosorption and metabolism of the green algae
Chlorella vulgaris (chlorophyceae) Beijerinck exposed to cadmium and lead stress.
Polish Journal of Environmental studies 20, 53–59.
Faller P, Kienzler K, Krieger-Liszkay A (2005) Mechanism of Cd2+
toxicity: Cd2+
inhibits
photoactivation of Photosystem II by competitive binding to the essential Ca2+
site.
Biochimica et Biophysica Acta 1706, 158–164.
Farago ME, Mullen WA (1979) Plants which accumulate metals. Part IV. A possible copper-
proline complex from the roots of Armeria maritima. Inorg. Chim. Acta 32, L93–L94.

REFERENCES
158
Fortescue JAC (1992) Landscape geochemistry: retrospect and prospect. Applied Geochemistry
7, 1–53.
Fritioff A, Kautsky L, Greger M (2005) Influence of temperature and salinity on heavy metal
uptake by submersed plants. Environmental pollution 133, 265–274.
Fukutaku Y, Yamada Y (1984) Source of proline nitrogen in waterstressed soybean (glycine
max) ii. Fate of isn-labelled protein. Physiol. Plant 61, 622-628.
Genrich I, Burd D, George D, Glick BR (2000) Plant growth promoting bacteria that decrease
heavy metal toxicity in plants. Canadian Journal of Microbiology 46, 237–245.
Ghosh M, Singh SP (2005) A review on phytoremediation of heavy metals and utilization of its
byproducts. Applied Ecology and Environmental Research 3(1), 1-18.
Gilmour SJ, Sebolt AM, Salazar MP, Everard JD, Thomashow MF (2000) Overexpression of
Arabidopsis CBF3 transcriptional activator mimics multiple biochemical changes
associated with cold acclimation. Plant Physiology 124, 1854–1865.
Gilmour SJ, Zarka DG, Stockinger EJ, Salazar MP, Houghton JM, Thomashow MF (1998) Low
temperature regulation of the Arabidopsis CBF family of AP2 transcriptional activators as
an early step in cold-induced COR gene expression. The Plant Journal 16, 433–442.
Gonick HC (2008) Nephrotoxicity of cadmium & lead. Indian Journal of Medical Research 128,
335-352.
Gouia H, Ghorbala HH, Meyer C (2000) Effects of cadmium on activity of nitrate reductase and
on other enzymes of the nitrate assimilation pathway in bean. Plant Physiology and
Biochemistry 38, 629-638.
Goyer RA, Liu J, Waalkes MP (2004) Cadmium and cancer of prostate and testis. Biometals 17,
555-558.
Guo CN, Liu F, Xu XM (2006) Chlorophyll-b deficiency and photosynthesis in plants. Plant
Physiology Communications 42, 967-973
Guo TR, Zhang GP, Zhou MX, Wu FB, Chen JX (2007) Influence of aluminum and cadmium
stresses on mineral nutrition and root exudates in two barley cultivars. Pedosphere 17,
505–512.

REFERENCES
159
Gwozdz EA, Kopyra M (2003) Plant cell responses to heavy metals – biotechnological aspects.
Biotechnologia 3, 107–123.
Hadi F, Ali N, Ahmad A (2014) Enhanced phytoremediation of cadmium-contaminated soil by
Parthenium hysterophorus plant: effect of gibberellic acid (GA3) and synthetic chelator,
alone and in combinations. Bioremediation Journal 18(1), 46–55.
Hadi F, Bano A (2009) Utilization of Parthenium hysterophorus for the remediation of lead-
contaminated soil. Weed Biology and Management 9 (4), 307–314.
Hadi F, Bano A, Fuller MP (2010) The improved phytoextraction of lead (Pb) and the growth of
maize (Zea mays L.): the role of plant growth regulators (GA3 and IAA) and EDTA alone
and in combinations. Chemosphere 80, 457-462.
Hadi F, Gilpin M, FullerMP (2011) Identification and expression analysis of CBF/DREB1 and
COR15 genes in mutants of Brassica oleracea var. botrytis with enhanced proline
production and frost resistance. Plant Physiology and Biochemistry 49, 1323-1332.
Handique GK, Handique AK (2009) Proline accumulation in lemongrass (Cymbopogon
flexuosus Stapf.) due to heavy metal stress. Journal of Environmental Biology 30, 299-
302.
Haouari CC, Nasraoui AH, Bouthour D, Houda MD, Daieb CB, Mnai J, Gouia H (2012)
Response of tomato (Lycopersicon esculentum) to cadmium toxicity: Growth, element
uptake, chlorophyll content and photosynthesis rate. African Journal of Plant Sciences 6,
1–7.
Hardiman RT, Jacoby B (1984) Absorption and translocation of Cd in bush beans (Phaseolus
vulgaris). Physiologia Plantarum 61, 670–674.
Hartzendorf T, Rolletschek H (2001) Effect of NaCl-salinity on amino acid and carbohydrate
contents of Phragmites australis. Aquat. Bot 69, 195-208.
Hasan, S.A., B. Ali, S. Hayat and A. Ahmad (2007) Cadmium induced changes in the growth
and carbonic anhydrase activity of chickpea. Turkish Journal of Biology 31, 137-140.
Haudecoeur E, Tannieres M, Cirou A, Raffoux A, Dessaux Y, Faure D (2009) Proline
antagonizes GABA-induced quenching of quorum-sensing in Agrobacterium

REFERENCES
160
tumefaciens. Proceedings of the National Academy of Sciences of the United States of
America 106, 14587–14592.
Hayat S, Ali B, Hasan SA, Ahmad A (2007) Brassinosteroid enhanced the level of antioxidants
under cadmium stress in Brassica juncea. Environmental and Experimental Botany 60, 33-
41.
Hendy GAF, Baker AJM, Evart CF (1992) Cadmium tolerance and toxicity, oxygen radical
processes and molecular damage in cadmium tolerant and cadmium-sensitive clones of
Holcus lanatus. Acta Botanica Neerlandica 41, 271-281.
Hernandez LE, Carpena-Ruiz R, Garate A (1996) Influence of cadmium on the NO 3 −
assimilation of two cultivars of Zea mays. Developments in Plant and Soil Sciences 68,
207-212.
Hesberg C, Haensch R, Mendel RR, Bittner F (2004) Tandem orientation of duplicated xanthine
dehydrogenase genes from Arabidopsis thaliana. Journal of Biological Chemistry 279,
13547–13554.
Holleman AF, Wiberg E (2001), Inorganic Chemistry, San Diego: Academic Press.
Houshmandfar A, Moraghebi F (2011) Effect of mixed cadmium, copper, nickel and zinc on
seed germination and seedling growth of safflower. African Journal of Agricultural
Research 6(5), 1182-1187
Hristozkova M, Geneva M, Stancheva I (2006) Response of Pea Plants (Pisum sativum L.) to
Reduced Supply with Molybdenum and Copper. International Journal of Agriculture
and Biology 8(2), 218-220.
Huang D, Zhang Y, Qi Y, Chen C, Weihong J (2008) Global DNA hypomethylation, rather than
reactive oxygen species (ROS), a potential facilitator of cadmium-stimulated K562 cell
proliferation. Toxicology Letters 179, 43-47.
Huang GT, Ma SL, Bai LP, Zhang L, Ma H, Jia P, Liu J, Zhong M, Guo ZF (2012) Signal
transduction during cold, salt, and drought stresses in plants. Molecular Biology Reports
39, 969–987.

REFERENCES
161
IARC (1993) Beryllium, Cadmium, Mercury and Exposures in the Glass Manufacturing
Industry, vol. 58. International Agency for Research on Cancer, Lyon, USA, ISBN
9283212584, pP. 119–238.
Inaba T, Kobayashi E, Suwazono Y, Uetani M, Oishi M, Nakagawa H, Nogawa K. (2005)
Estimation of cumulative cadmium intake causing Itai-itai disease. Toxicology Letters
159(2), 192-201.
Ito Y, Katsura K, Maruyama K, Taji T, Kobayashi M, et al (2006) Functional analysis of rice
DREB1/CBF-type transcription factors involved in cold-responsive gene expression in
transgenic rice. Plant Cell Physiol 47: 141–153. doi: 10.1093/pcp/pci230
Jadia CD, Fulekar MH (2009). Phytoremediation of heavy metals: Recent techniques. African
Journal of Biotechnology 8(6), 921-928.
Jaglo-Ottosen KR, Gilmour SJ, Zarka DG, Schabenberger O, Thomashow MF (1998)
Arabidopsis CBF1 overexpression induces cor genes and enhances freezing tolerance.
Science 280, 104–106.
Jarup L, Akesson A (2009) Current status of cadmium as an environmental health
problem. Toxicology and Applied Pharmacology 238, 201-208.
Jarup L, Berglund M, Elinder CG, Nordberg G, Vahter M (1998) Health effects of cadmium
exposure- a review of the literature and a risk estimate. Scandinavian Journal
of Work, Environment & Health 24 (1), 1-5.
John R, Ahmad P, Gadgil K, Sharma S (2008) Effect of cadmium and lead on growth,
biochemical parameters and uptake in Lemna polyrrhiza L. Plant soil environment 54(6),
262–270
John R, Ahmad P, Gadgil K, Sharma S (2009) Heavy metal toxicity: effect on plant growth,
biochemical parameters and metal accumulation by Brassica juncea L. International
Journal of Plant Production 3, 65–76
Jones RW, Abbott AJ, Hewitt EJ, James DM, Best GR (1976) Nitrate reductase activity and
growth in Paul‘s scarlet rose suspension cultures in relation to nitrogen source and
molybdenum. Planta 133, 27–34.

REFERENCES
162
Joseph P (2009) Mechanisms of cadmium carcinogenesis. Toxicology and Applied
Pharmacology 238, 272- 279.
Jung CH, Maeder V, Funk F, Frey B, Sticher H, Frosserd E (2003) Release of phenols from
Lupinus albus L. roots exposed to Cu and their possible role in Cu detoxification. Plant
Soil 252, 301-312.
Kadpal R P, Rao N A (1985) Alterations in the biosynthesis of proteins and nucleic acids in
finger millet (eleucine coracana) seedlings during water stress and the effect of proline on
protein biosynthesis. Plant science 40, 73 -79.
Kadukova J, Manousaki E, and Kalogerakis N (2006) Lead and cadmium accumulation from
contaminated soils by Nerium oleander. Acta Metallurgica Slovaca 12, 181–187.
Kafel A, Rozpędek K, Szulińska E, Zawisza-Raszka A, Migula P (2014) The effects of
cadmium or zinc multigenerational exposure on metal tolerance of Spodoptera exigua
(Lepidoptera: Noctuidae). Environmental Science and Pollution Research 21, 4705–
4715.
Kaiser BN, Gridley KL, Brady JN, Phillips T, Tyerman SD (2005) The Role of Molybdenum in
Agricultural Plant Production. Annals of Botany 96, 745–754.
Kasuga M, Liu Q, Miura S, Yamaguchi-Shinozaki K, Shinozaki K (1999) Improving plant
drought, salt, and freezing tolerance by gene transfer of a single stress-inducible
transcription factor. Nature Biotechnology 17, 287–291.
Kellen E, Zeegers MP, Hond ED, Buntinx F (2007) Blood cadmium may be associated with
bladder carcinogenesis: the Belgian case-control study on bladder cancer. Cancer
Detection and Prevention 31(1), 77-82.
Kensa VM, Yasmi SS (2011) Phytochemical screening and antibacterial activity on Ricinus
communis L. Plant Sciences Feed 1 (9), 167-173.
Kevresan S, Krstic B, Popovic M, Kovacev L, Peyevic S, Kandrac J, Malencici K (1998)
Biochemical changes in sugar beet lines in dependence of soil moisture. Biologia
Plantarum 40, 245-250.

REFERENCES
163
Khan AG, Kuek TM, Chaudhury TM, Khoo CS, Hayes WJ (2000) Role of plants, mycorrhizae
and phytochelators in heavy metal contaminated land remediation. Chemosphere 41, 197-
207.
Khan MH, Patra HK (2007) Sodium chloride and cadmium induced oxidative stress and
antioxidant response in Calamus tenuis leaves. Indian Journal of Plant Physiology 12, 34-
40.
Khan MH, Singha LB, Panda SK (2002) Changes in antioxidant levels in Oryza sativa L. roots
subjected to NaCl-salinity stress. Acta Physiologiae Plantarum 24, 145-148.
Khan NA, Ansari HR, Samiullah (1998) Effect of gibberellic acid spray during ontogeny of
mustard on growth, nutrient uptake and yield characteristics. Journal
of Agronomy and Crop Science 181, 61-73
Khatamipour M, Piri E, Esmaeilian Y, Tavassoli A (2011) Toxic effect of cadmium on
germination, seedling growth and proline content of Milk thistle (Silybum marianum).
Annals of Biological Research 2 (5), 527-532.
Kidd PS, Domínguez-Rodríguez MJ, Díez J, Monterroso C (2007) Bioavailability and plant
accumulation of heavy metals and phosphorus in agricultural soils amended by long-term
application of sewage sludge. Chemosphere 66: 1458–1467
Kim CG, Bell JNB, and Power SA. 2003. Effects of soil cadmium on Pinus sylvestris L.
seedlings. Plant and Soil 257, 443–449.
Kirkham MB (2006) Cadmium in plants on polluted soils: Effects of soil factors,
hyperaccumulation, and amendments. Geoderma 137, 19–32.
Knight H, Zarka DG, Okamoto H, Thomashow MF, Knight MR (2004) Abscisic Acid
Induces CBF Gene Transcription and Subsequent Induction of Cold-Regulated Genes via
the CRT Promoter Element. Plant Physiology 135, 1710–1717.
Kohan E, Bagherieh-Najjar MB (2011) DRE-binding Transcription factor (DREB1A) as a
master regulator induced a broad range of abiotic stress tolerance in plant. African Journal
of Biotechnology 10(67), 15100-15108.
Kovaeevic G, Kastori R, and Merkulov LJ (1999) Dry matter and leaf structure in young wheat
plants as affected by cadmium, lead, and nickel. Biologia Plantarum 42, 119–123.
REFERENCES
164
Kozuchowski J, Johnson DL (1978) Gaseous emissions of mercury from an aquatic vascular
plant. In: Ebinghaus R, Baeyens W, Vasiliev O, editors. Novosibersk, Siberia, NATO ASI
Series. Nature 274, 468–469.
Kriegel AM, Soliman AS, Zhang Q, El-Ghawalby N, Ezzat F, Soultan A, Abdel-Wahab
M, Fathy O, Ebidi G, Bassiouni N, Hamilton SR, Abbruzzese JL, Lacey MR, Blake DA
(2006) Serum cadmium levels in pancreatic cancer patients from the East Nile Delta region
of Egypt. Environmental Health Perspectives 114, 113-119.
Krocova Z, Macela A, Kroca M, Hernychova L (2000) The immunomodulatory effect(s) of lead
and cadmium on the cells of immune system in vitro. Toxicology in vitro 14, 33-40.
Kudo H, Kudo K, Ambo H, Uemura M, Kawai S (2011) Cadmium sorption to plasma membrane
isolated from barley roots is impeded by copper association onto membranes. Plant
Sciences 180, 300–305.
Kume S, Kobayashi F, Ishibashi M, Ohno R, Nakamura C, Takumi S (2005) Differential and
coordinated expression of Cbf and Cor/Lea genes during long-term cold acclimation in two
wheat cultivars showing distinct levels of freezing tolerance. Genes and Genetic
System 80, 185–197.
Lakshaman KC, Surinder KS (1999) Photosynthetic activities of Pisum sativum seedlings grown
in presence of cadmium. Plant Physiology and Biochemistry 37, 297-303.
Lalk I, Dorfling K (1985) Hardening, ABA, proline and freezing resistance in the winter wheat
varieties. Physiologia Plantarum 63, 287–292.
Larcher W (1995) Physiological Plant Ecology: Ecophysiology and Stress Physiology of
Functional Groups (3rd edition). New York: Springer.
Lata C, Prasad M, (2011) Role of DREBs in regulation of abiotic stress responses in plants.
Journal of Experimental Botany 62, 4731–4748.
Lavola A, Julkunen-Titto R, Delarosa TM, Lehto T, Aphalo PJ (2000) Allocation of carbon to
growth and secondary metabolites in birch seedlings under UV-B radiation and CO2
exposure. Physiologia Plantarum 109, 260-267.

REFERENCES
165
Li YM, Chaney R, Brewer E, Roseberg R, Angle JS, Baker AJM, Reeves R, Nelkin J (2003)
Development of a technology for commercial phytoextraction of nickel: economic and
technical considerations. Plant and Soil 249, 107–115.
Li Z, Li L, Chen GPJ (2005) Bioavailability of Cd in a soil–rice system in China: soil type versus
genotype effects. Plant and Soil 271, 165–173.
Linger P, Ostwald A, Haensler J (2005) Cannabis sativa L. growing on heavy metal
contaminated soil: growth, cadmium uptake and photosynthesis. Physiologia Plantarum
49(4), 567–576.
Liu J, Zhu Q, Zhang Z, Xu J, Yang J, Wong MH (2005) Variations in cadmium accumulation
among rice cultivars and types and the selection of cultivars for reducing cadmium in the
diet. Journal of the Science of Food and Agriculture 85, 147–153.
Liu Q, Kasuga M, Sakuma Y, Abe H, Miura S, Goda H, Shimada Y, Yoshida S, Shinozaki K,
Yamaguchi-Shinozaki K (1998) Two transcription factors, DREB1 and DREB2, with an
EREBP/AP2 DNA binding domain separate two cellular signal transduction pathways in
drought- and low-temperature-responsive gene expression, respectively, in Arabidopsis.
The Plant Cell 10, 391–406.
Liu Z, He X, Chen W, Yuan F, Yan K, Tao D (2009) Accumulation and tolerance
characteristics of cadmium in a potential hyperaccumulator— Lonicera japonica Thunb.
Water Air Soil Pollution 196, 29–40.
Lone MI, He Z, Stoffella PJ, Yang X (2008) Phytoremediation of heavy metal polluted soils and
water: progresses and perspectives. Journal of Zhejiang University-SCIENCE B 9, 210-
220.
Lou LQ, Ye ZH, Wong MH (2007) Solubility and accumulation of metals in chinese brake fern,
vetiver and rostrate sesbania using chelating agents. International Journal of
Phytoremediation 9, 325–343.
Ma LQ, Komar KM, Tu C, Zhang W, Cai Y, Kennelley ED (2001) A fern that hyperaccumulates
arsenic. Nature 409, 579-579.
Magnani E, Sjölander K, Hake S (2004) From endonucleases to transcription factors: evolution
of the AP2 DNA binding domain in plants. The Plant Cell 16, 2265–2277.

REFERENCES
166
Mamindy-Pajany Y, Sayen S, Guillon E (2014) Impact of lime-stabilized biosolid application on
Cu, Ni, Pb and Zn mobility in an acidic soil. Environmental Science and Pollution
Research 21, 4473–4481.
Mandhania S, Madan S, Sawhney V (2006) Antioxidant defense mechanism under salt stress in
wheat seedlings. Boilogia Plantrium 50(2), 227-231.
Marin A, Marion-Poll A (1997) Tomato flacca mutant is impaired in ABA aldehyde oxidase and
xanthine dehydrogenase activities. Plant Physiology and Biochemistry 35, 369–372.
Marschner (1995) Mineral Nutrition of Higher Plants. New York: Academic Press.
Martelli A, Rousselet E, Dycke C, Bouron A, Moulis JM (2006) Cadmium toxicity in animal
cells by interference with essential metals. Biochimie 88, 1807-1814.
Marth E, Barth S, Jelovcan S (2000) Influence of cadmium on the immune system. Description
of stimulating reactions. Central European Journal of Public Health 8, 40-44.
Masroor M, Khan A, Gautam C, Mohammad F, Siddiqui MH, Naeem M, Khan MN (2006)
Effect of Gibberellic Acid Spray on Performance of Tomato. Turkish Journal of Biology
30, 11-16.
McElroy JA, Shafer MM, Trentham-Dietz A, Hampton JM, Newcomb PA (2006) Cadmium
exposure and breast cancer risk. Journal of the National Cancer Institute's 98(12), 869-
873.
McLaughlin MJ, Whatmuff M, Warne M, Heemsbergen D, Barry G, Bell M, Nash D, Pritchard
D (2006) A field investigation of solubility and food chain accumulation of biosolid-
cadmium across diverse soil types. Environmental Chemistry 3(6), 428-432.
Meers E, Lesage E, Lamsal S, Hopgood M, Vervaekle P, Tack FMG, Verloo MG (2005)
Enhanced phytoextraction: I. Effect of EDTA and citric acid on heavy metal uptake by
Heliantus annus from a calcareous soil. International Journal of Phytoremediation 7,
129–142.
Mehta S K, Gaur J P (1999) Heavy-metal-induced proline accumulation and its role in
ameliorating metal toxicity in Chlorella vulgaris. New Phytol 143, 253–259

REFERENCES
167
Mendel RR, Haensch R (2002) Molybdoenzymes and molybdenum cofactor in plants. Journal of
Experimental Botany 53, 1689–1698.
Metwally A, Safronova VI, Belimov AA, Dietz KJ (2005) Genotypic variation of the response to
cadmium toxicity in Pisum sativum L. Jorunal of Experimental Botany 56, 167–178.
Michalak A (2006) Phenolic Compounds and Their Antioxidant Activity in Plants Growing
under Heavy Metal Stress. Polish Journal of Environmental Studies 15(4), 523-530.
Miller R (1996) Phytoremediation, Technology Overview Report, Ground-Water. Remediatoin
Technologies Analysis Center, Series O, Vol. 3.
Millic BL, Djilas SM, Canadanovic-Brunet JM (1998) Antioxidative activity of phenolic
compounds on the metal-ion breakdown of lipid peroxidation system. Food Chemistry 61,
443-447.
Mishra S, Srivastava S, Tripathi RD, Govindarajan R, Kuriakase SV, Prasad MNV (2006)
Phytochelatin synthesis and response of antioxidants during cadmium stress in Bacopa
monnieri L. Plant Physiology and Biochemistry 44, 25-37.
Mobin M, Nafees AK (2007) Photosynthetic activity, pigment composition and antioxidative
response of two mustard (Brassica juncea) cultivars differing in photosynthetic capacity
subjected to cadmium stress. Journal of Plant Physiology 164, 601-610.
Mohan BS, Hosetti BB (2006) Phytotoxicity of cadmium on the physiological dynamics of
Salvinia natans L. grown in macrophyte ponds. Journal of Environmental Biology 27:701-
704.
Moore TC (1989) Biochemistry and Physiology of Plant Hormones, Springer-Verlag Inc, New
York.
Mubeen H, Naeem I, Taskeen A, (2010) Phytoremediation of Cu (II) by Calotropis Procera
Roots. New York Science Journal 3(3), 1-5
Nakano T, Suzuki K, Fujimura T, Shinshi H (2006) Genome wide analysis of the ERF gene
family in Arabidopsis and rice. Plant Physiology 140, 411–432.
Nakashima K, Shinwari ZK, Sakuma Y, Seki M, Miura S, Shinozaki K, Yamaguchi-Shinozaki K
(2000) Organization and expression of two Arabidopsis DREB2 genes encoding DRE-

REFERENCES
168
binding proteins involved in dehydration- and high-salinity-responsive gene expression.
Plant Molecular Biololgy 42, 657–665.
Navas-Acien A, Silbergeld EK, Sharrett R, Calderon-Aranda E, Selvin E, Guallar E (2005)
Metals in urine and peripheral arterial disease. Environmental Health Perspectives 113,
164-169.
Navie SC, McFadyen RC, Panetta FD, Adkins SW (1996) The Biology of Australian weed
Parthenium hysterophorus L. Plant Protection Quarterly 11, 76-88.
Nawrot T, Plusquin M, Hogervorst J, Roels HA, Celis H, Thijs L, Vangronsveld J, Van Hecke
E, Staessen JA (2006) Environmental exposure to cadmium and risk of cancer: a
prospective population-based study. Lancet Oncology 7(2), 119-126.
Ngayila N, Botineau M, Baudu M, Basly JP (2008) Myriophyllum alterniflorum DC. Effect of
low concentrations of copper and cadmium on somatic and photosynthetic endpoints: A
chemometric approach. Ecological Indicators 9, 379- 384.
Nikolic N, Kojic D, Pilipovic A, Pajevic S, Krstic B, Borisev M, Orlovic S (2008) Response of
hybrid popular to cadmium stress: Photosynthetic characteristics, cadmium and proline
accumulation, and antioxidant enzyme activity. Acta Biologica Cracoviensia series
botanica 50(2), 95-103.
Nikolopoulos D, Manetas Y (1991) Compatible solutes and in vitro stability of salsola soda
enzymes: proline incompatibility. Phytochemistry 30,411-413.
Nriagu J (1988) A silent killer of environmental metal poisoning. Environmental Pollution 50(1-
2), 139-161.
Oono Y, Yazawa T, Kawahara Y, Kanamori H, Kobayashi F, Sasaki H, et al (2014) Genome-
Wide Transcriptome Analysis Reveals that Cadmium Stress Signaling Controls the
Expression of Genes in Drought Stress Signal Pathways in Rice. PLoS ONE 9(5): e96946.
doi:10.1371/journal.pone.0096946
Oporto C, Smolders E, Degryse F, Verheyen L, Vandecasteele C (2009) DGT-measured fluxes
explain the chloride-enhanced cadmium uptake by plants at low but not at high Cd supply.
Plant and Soil 318, 127–135.

REFERENCES
169
Ozden M, Demirel U, Kahraman A (2009) Effects of proline on antioxidant system in leaves of
grapevine (Vitis vinifera L.) exposed to oxidative stress by H2O2. Scientia
Horticulturae 119, 163–168.
Ozturk L, Eker S, and Ozkutlu F (2003) Effect of cadmium on growth and concentrations of
cadmium, ascorbic acid and sulphydryl groups in durum wheat cultivars. Turkish Journal
of Agriculture and Forestry 27, 161–168.
Padmavathiamma PK, Li LY (2007) Phytoremediation Technology: Hyper-accumulation Metals
in Plants. Water Air Soil Pollution 184, 105–126.
Pal M, Horvath E, Janda T, Paldi E, Szalai G (2006) Physiological changes and defence
mechanisms induce by cadmium stress in maize. Journal of Plant Nutrition and Soil
Science 169, 239-246.
Paleg L G, Stewart G R, Bradbeer J W (1984) Proline and glycine betaine influences protein
solvation. Plant physiology 75, 974-978.
Panda SK, Khan MH (2003) Salt stress influences lipid peroxidation and antioxidants in the leaf
of an indica rice (Oryza sativa L.). Physiology and Molecular Biology of Plants 9,273-278.
Parsons WT, Cuthbertson EG (1992) Noxious Weeds of Australia. Inkata Press, Melbourne.
Perfus-Barbeoch L, Leonhardt N, Vavasseur A, Forestier C (2002) Heavy metal toxicity:
cadmium permeates through calcium channels and disturbs the plant water status. Plant
Journal 32, 539–548.
Pesch B, Haerting J, Ranft U, Klimpel A, Oelschlagel B, Schill W (2000) Occupational risk
factors for renal cell carcinoma: agent-specific results from a case-control study in
Germany. MURC Study GrouP. Multicenter urothelial and renal cancer study.
International Journal of Epidemiology 29, 1014-1024.
Poschenrieder C, Gunse G, Barcelo J (1989) Influence of Cadmium on Water Relations,
Stomatal Resistance, and Abscisic Acid Content in Expanding Bean Leaves. Plant
Physiology 90, 1365-1371.
Prasad MNV, Freitas HMDO (2003) Metal hyperaccumulation in plants-biodiversity prospecting
for phytoremediation technology. Electron Journal of Biotechnology 6(3), 110–146.

REFERENCES
170
Rajkumar M, Freitas H (2008) Influence of metal resistant-plant growth promoting bacteria on
the growth of Ricinus communis in soil contaminated with heavy metals. Chemosphere 71
(5), 834–842.
Ramadevi S, Prasad MNV (1998) Copper toxicity in Ceratophyllum demeresum l. (coontail), a
free floating macrophyte: Response of antioxidant enzymes and antioxidants.
Plant Sciences 138-157.
Rana M, Dhamija H, Prashar B, Sharma S (2012) Ricinus communis L. – A Review.
International Journal PharmTech, Research 4(4), 1706-1711.
Raskin I, Smith RD, Salt DE (1997) Phytoremediation of metals: using plants to remove
pollutants from the environment. Current Opinion in Biotechnology 8, 221–226.
Reddy KJ, Munn LC, Wang L (1997) Chemistry and mineralogy of molybdenum in soils. In:
Gupta UC, ed. Molybdenum in agriculture. Cambridge: Cambridge University Press.
Revathi K, Haribabu TE, Sudha PN (2011). Phytoremediation of Chromium contaminated soil
using Sorghum plant. International Journal of Environmental Sciences 2(2), 417-428.
Rice-Evans CA, Miller NJ, Paganga G (1997). Antioxidant properties of phenolic compounds.
Trends Plant Sciences 2, 152-159.
Rogers NJ, Franklin NM, Apte SC, Batley GE (2007) The Importance of Physical and Chemical
Characterization in Nanoparticle Toxicity Studies. Integrated Environmental
Assessment and Management 3, 303-304.
Ryu DY, Lee SJ, Park DW, Choi BS, Klassen CD, Park JD (2004) Dietary iron regulates
intestinal cadmium absorption through iron transporters in rats. Toxicology Letters 152, 19-
25.
Saco D, Alvarez M, Martin S (1995) Activity of nitrate reductase and the content of proteins in
Nicotiana rustica grown with various levels of molybdenum. Journal of Plant Nutrition
18, 1149-1153.
Sagi M, Scazzocchio C, Fluhr R (2002) The absence of molybdenum cofactor sulfuration is the
primary cause of the flacca phenotype in tomato plants. Plant Journal 31, 305–317.

REFERENCES
171
Sahw BP, Sahu SK, Mishra RK (2004) Heavy metal induced oxidative damage in terrestrial
plants. In: Presad MNV (Ed.), Heavy Metal Stress in Plants: From Biomolecules to
Ecosystems, second ed. Springer, Berlin, pp 84–126.
Sakihama Y, Mano J, Sano S, Asada K, Yamasaki H (2000) Reduction of phenoxyl radicals
mediated by monodehydroascorbate reductase. Biochemical and Biophysical Research
Communications 279, 949-954.
Sakuma Y, Liu Q, Dubouzet JG, Abe H, Shinozaki K, Yamaguchi-Shinozaki K (2002) DNA-
binding specificity of the ERF/AP2 domain of Arabidopsis DREBs, transcription factors
involved in dehydration- and cold-inducible gene expression. Biochemical and Biophysical
Research Communications 29, 998–1009.
Salt DE, Blaylock M, Kumar PBAN, Dushenkov V, Ensley BD, Chet L, Chet I, Raskin I (1995)
Phytoremediation: a novel strategy for the removal of toxic metals from the environment
using plants. Biogeochemistry13, 468–474.
Sarkari A, Ravindran G, Krishnamurthy V (2013) A brief review on the effect of cadmium
toxicity: from cellular to organ level. International Journal of Biotechnology and Research
3(1), 17-36.
Schutzendubel A, Schwanz P, Teichmann T, Gross K, Langenfeld-Heyser R, Godbold DL, Polle
A (2001) Cadmium-induced changes in antioxidative systems, hydrogen peroxide
content, and differentiation in Scots pine roots. Plant Physiology 127, 887–898.
Schwartz SS, Leon-Kloosterziel KM, Koorneef M, Zeevart JAD (1997) Biochemical
characterisation of the ab2 and ab3 mutants in Arabidopsis thaliana. Plant Physiology 117,
161–166.
Schwitzguebel JP, Kumpiene J, Comino E, Vanek T (2009) From green to clean: a promising
and sustainable approach towards environmental remediation and human health for the
21 st century. Agrochimica 53, 209-237.
Sharma SS, Schat H, Vooijs R (1998) In vitro alleviation of heavy metal-induced enzyme
inhibition by proline. Phytochemistry 49, 1531–1535.

REFERENCES
172
Shen YG, Zhang WK, Yan DQ, Du BX, Zhang JS, Liu Q, Chen SY (2003) Characterization of a
DRE-binding transcription factor from a halophyte Atriplex hortensis.
Theoretical and Applied Genetics 107, 155–161.
Shi GR, Cai QS (2009) Cadmium tolerance and accumulation in eight potential energy crops.
Biotechnology Advances 27(5), 555–561.
Shinozaki K, Yamaguchi-Shinozaki K (2007) Gene networks involved in drought stress response
and tolerance. Journal of Experimental Botany 58, 221–227.
Siddiqui MF (2010). Cadmium induced renal toxicity in male rats, Rattus rattus. Eastern Journal
of Medicine 15, 93-9.
Singh RK, Gupta MK, Singh AK, Kumar S (2010) Pharmacognostical Investigation Of Ricinus
communis Stem. International Journal of Pharmaceutical Sciences and Research 1(6), 89-
94.
Singleton VL, Rossi JA (1965) Colorimetry of total phenolics with phosphomolybdic-
phosphotungstic acid reagents. American Journal of Enology and Viticulture 16, 144-
158.
Smeets K, Cuypers A, Lambrechts A, Semane B, Hoet P, Vanlaere A, Vangronsveld J (2005)
Induction of oxidative stress and antioxidative mechanisms in Phaseolus vulgaris after Cd
application. Plant Physiology and Biochemistry 43, 437-444.
Smirnoff N, Cumbes Q J (1989) Hydroxyl radical scavenging activity of compatible solutes.
Phytochemistry 28, 1057–1060.
Sogut Z, Zaimoglu BZ, Erdogan R, Sucu YM (2005) Phytoremediation of landfill leachate using
Pennisetum clandestinum. Journal of Environmental Biology 26, 13-20.
Somashekaraiah BV, Padmaja K, Prasad APK (1992) Phytotoxicity of cadmium ion in
germinating seedling of mung bean (Phaseolus vulgaris): Involvement of lipid peroxides in
chlorophyll degradation. Physiologia Plantarum 85, 85-89.
Stiborova M, Doubrovava M, Brezninova A, Frederick A (1986) Effect of heavy metal ion on
growth and biochemical characteristics of photosynthesis of barley Hordeum vulgare L.
Phytosynthetica 20, 418-425.

REFERENCES
173
Stockinger EJ, Gilmour SJ, Thomashow MF (1997) Arabidopsis thaliana CBF1 encodes an AP2
domain-containing transcriptional activator that binds to the C-repeat/DRE, a cis-acting
DNA regulatory element that stimulates transcription in response to low temperature and
water deficit. Proceedings of the National Academy of Sciences USA 94, 1035–1040.
Sumanta N, Haque CI, Nishika J, Suprakash R (2014) Spectrophotometric Analysis of
Chlorophylls and Carotenoids from Commonly Grown Fern Species by Using Various
Extracting Solvents. Research Journal of Chemical Sciences 4(9), 63-69.
Sun Q, Ye ZH, Wang XR, Wong MH (2007). Cadmium hyperaccumulation leads to an increase
of glutathione rather than phytochelatins in the cadmium hyperaccumulator Sedum
alfredii. Journal of Plant Physiology 164, 1489–98.
Sun Y, Zhou Q, Diao CY (2008) Effects of cadmium and arsenic on growth and metal
accumulation of Cd-hyperaccumulator Solanum nigrum L. Bioresource Technology
99(5), 1103–1110.
Sun Y, Zhou Q, Xu Y, Wang L, Liang X (2011) The role of EDTA on cadmium phytoextraction
in a cadmium hyperaccumulator Rorippa globosa. Journal of Environmental
Chemistry and Ecotoxicology 3(3), 45-51.
Suzuki N, Koizumi N, Sano H (2001) Screening of cadmium-responsive genes in Arabidopsis
thaliana. Plant Cell and Environment 24, 1177–1188.
Takahama U, Oniki T (2000) Flavonoid and some other phenolics as substrates of peroxidase:
physiological significance of the redox reactions. Journal of Plant Research 113, 301-309.
Takiguchi M, Achanzar W, Qu W, Li G, Waalkes M (2003) Effects of cadmium on DNA-(-
cytosine-5) methyltransferase activity and DNA methylation status during cadmium
induced cellular transformation. Experimental Cell Research 286, 355-365.
Tamas L, Huttova J, Zigova Z (1997) Accumulation of stress protein in intracellular spaces of
barley leaves induced by biotic and abiotic factors. Biol Plant 39:387-394.
Tassi E, Pouget J, Petruzzelli G, Barbafieri M (2008) The effects of exogenous plant growth
regulators in the phytoextraction of heavy metals. Chemosphere 71, 66–73.

REFERENCES
174
Tausz M, Wonisch A, Grill D, Morales D, Jimenez MS (2003) Measuring antioxidants in tree
species in the natural environment: from sampling to data evaluationm. Journal of
Experimental Botany 54, 1505-1510.
Thapar R, Srivastava AK, Bhargava P, Mishra Y, Rai LC (2008) Impact of different abiotic
stress on growth, photosynthetic electron transport chain, nutrient uptake and enzyme
activities of Cu-acclimated Anabaena doliolum. Journal of Plant Physiology 165, 306-
316
Kume Tordoff GM, Baker AJM, Willis AJ (2000) Current approaches to the revegetation and
reclamation of metalliferous mine wastes. Chemosphere 41(1–2), 219–228.
Tran TA, Popova LP (2013) Functions and toxicity of cadmium in plants: recent advances and
future prospects. Turkish Jouranl of Botany 37, 1-13.
Tuteja N, Gill SS, Tiburcio AF, Tuteja R (2012) Improving crop resistance to abiotic stress.
Wiley-Blackwell publishers, Germany, P. 249.
Umezawa T, Fujita M, Fujita Y, Yamaguchi-Shinozaki K, Shinozaki K (2006) Engineering
drought tolerance in plants: discovering and tailoring genes to unlock the future. Current
Opinion in Biotechnology 17, 113–122.
Uraguchi S, Watanabe1 I, Yoshitomi A, Kiyono M, Kuno K (2006) Characteristics of cadmium
accumulation and tolerancein novel Cd-accumulating crops, Avena strigosa and
Crotalaria juncea. Journal of Experimental Botany 57 2955–2965
USEPA (2007) Integrated Risk Information System (IRIS) home page.
http://www.epa.gov/iris/subst/index.html. U.S. Environmental Protection Agency, Office of
Emergency and Remedial Response, Washington, DC.
Vahter M, Akesson A, Liden C, Ceccatelli C, Berglund M (2007) Gender differences in the
disposition and toxicity of metals. Environmental Research 104, 85-9.
Vajpayee P, Tripathi RD, Rai UN, Ali, Singh SN (2000) Chromium (VI) accumulation reduces
chlorophyll biosynthesis, nitrate reductase activity and protein content in Nymphaea alba
L. Chemosphere 41, 1075-1082

REFERENCES
175
Vargas R, Ramirez C (1989) Response of soyabeans and groundnuts to Rhizobium and to N, P
and Mo fertilizer on a Typic Pellustert from Canas, Guanacaste. Agronomia
Costarricense 13(2), 175-181.
Vassilev A, Perez-Sanz A, Semane B, Carteer R, Vangronsveld J (2005) Cadmium
accumulation and tolerance of two salix genotypes hydrophonically grown in presence of
cadmium. Journal of Plant Nutrition 28, 2159-2177.
Venekamp JH (1989) Regulation of cytosolic acidity in plants under conditions of drought.
Physiol Plant 76, 112-117.
Venekamp JH, Lampe JE, Koot JTM (1989) Organic acids as a sources of drought-induced
proline synthesis in field bean plants, vicia faba. International Journal of Plant physiology
133, 654 - 659.
Verstraeten SV, Keen CL, Schmitz HH, Fraga CG, Oteiza PI (2003) Flavan-3-ols and
procyanidins protect liposomes against lipid oxidation and disruption of the bilayer
structure. Free Radical Biology and Medicine 34, 84-92.
Waalkes M (2003) Cadmium carcinogenesis. Mutation Research 533, 107-120.
Waalkes M, Misra R (1996) Cadmium carcinogenicity and genotoxicity. In: Chang, L., editor.
Toxicology of metals. Boca Raton, FL: CRC Press pp- 231-244.
Waisberg M, Black WD, Chan DY, Hale BA (2005) The effect of pharmacologically altered
gastric pH on cadmium absorption from the diet and its accumulation in murine tissues.
Food and Chemical Toxicology 43, 775-782.
Wang Q, Guan Y, Wu Y, Chen H, Chen F, Chu C (2008) Overexpression of a rice OsDREB1F
gene increases salt, drought, and low temperature tolerance in both Arabidopsis and rice.
Plant Molecular Biology 67, 589–602.
Weast RC (1984) CRC Handbook of Chemistry and Physics. 64th Edn., CRC Press, Baca Raton.
Wei SH, Zhou QX (2004) Discussion on basic principles and strengthening measures for
phytoremediation of soils contaminated by heavy metals. Chinese Journal of Ecology 23,
65–72.

REFERENCES
176
WHO (1989) Evaluation of Certain Food Additives and Contaminants. Thirty-third Report of the
Joint FAO/WHO Expert Committee on Food Additives. World health organization
Technical Report Series 776.
Wild A, Schmitt V (1995) Diagnosis of damage to Norway spruce (Picea abies) through
biochemical criteria. Physiologia Plantarum 93, 357-382.
Williams RJP, Frausto da Silva JJR (2002) The involvement of molybdenum in life.
Biochemical and Biophysical Research Communications 292, 293–299.
Winkel-shirley B (2002) Biosynthesis of favonoids and effects of stress. Current Opinion in
Plant Biology 5, 218-223
Wojtaszek P (1997) Oxidative burst: an early plant response to pathogen infection. Biochemical
Journal 322, 681-692.
Xiong L, Ishitani M, Lee H, Zhu KJ (2001) The Arabidopsis LOS5/ABA3 locus encodes a
molybdenum cofactor sulfurase and modulates cold stress-and osmotic stress-responsive
gene expression. Plant Cell 13, 2063–2083.
Xu J, Yin X, Li X (2009) Protective effects of proline against cadmium toxicity in
icropropagated hyperaccumulator, Solanum nigrum L. Plant Cell Reports 28, 325–333.
Yamaguchi-Shinozaki K, Shinozaki K (1993) The plant hormone abscisic acid mediates the
drought-induced expression but not the seed-specific expression of rd22, a gene responsive
to dehydration-stress in Arabidopsis thaliana. Molecular Genetics and Genomics 238, 17–
25.
Yang SL, Lan SS, Gong M (2009) Hydrogen peroxide-induced proline and metabolic pathway of
its accumulation in maize seedlings. Journal of Plant Physiology 166, 1694–1699.
Yang W, Liu XD, Chi XJ, Wu CA, Li YZ, Song LL, Liu XM, Wang YF, Wang FW, Zhang
C, Liu Y, Zong JM, Li HY (2011) Dwarf apple MbDREB1 enhances plant tolerance to low
temperature, drought, and salt stress via both ABA-dependent and ABA-independent
pathways. Planta 233, 219–229.
Zadeh BM, Savaghebi-Firozabadi GR, Alikhani HA, Hosseini HM (2008) Effect of Sunflower
and Amaranthus Culture and Application of Inoculants on Phytoremediation of the Soils

REFERENCES
177
Contaminated with Cadmium. American-Eurasian Journal of Agricultural
& Environmental Sciences 4, 93–103.
Zalups RK, Ahmad S (2003) Molecular handling of cadmium in transporting epithelia.
Toxicology and Applied Pharmacology 186 163-188.
Zarka DG, Vogel JT, Cook D, Thomashow MF (2003) Cold induction of Arabidopsis CBF genes
involves multiple ICE (Inducer of CBF Expression) promoter elements and a cold-
regulatory circuit that is desensitized by low temperature. Plant Physiology 133, 910– 918.
Zeng X, Jin T, Jiang X, Kong Q, Ye T, Nordberg GF (2004) Effects on the prostate of
environmental cadmium exposure - a cross-sectional population study in China. Biometals
17(5), 559-565.
Zengin FK, Munzuroglu O (2006) Toxic effects of cadmium (Cd++
) on metabolism of sunflower
(Helianthus annuus L.) seedlings. Acta Agriculturae Scandinavica, Section B —
Soil & Plant Science 56, 224-229.
Zhao FJ, Hamon RE, Lombi E, McLaughlin MJ, McGrath SP (2002) Characteristics of cadmium
uptake in two contrasting ecotypes of the hyperaccumulator Thlaspi caerulescens. Journal
of Experimnetal Botany 53, 535–543.
Zheng HP, Gao LS, Wang SR (2010) Effects of cadmium on growth and antioxidant responses
in Glycyrrhiza uralensis seedlings. Plant Soil and Environment 56(11), 508-515.
Zhou QX, Song YF (2004) Principles and Methods of Contaminated Soil Remediation. Science
Press, Beijing, China.
Zhou WB, Qiu BS (2005) Effects of cadmium hyperaccumulation on physiological
characteristics of Sedum alfredii Hance (Crassulaceae). Plant Science 169, 737-745.
Zhu YL, Zayed AM, Quian JH, De Souza M, Terry N (1999) Phytoaccumulation of trace
elements by wetland plants: II. Water hyacinth. Journal of Environmental Quality 28, 339–
344.