Embed Size (px)
Citation preview

Guidelines for Specification of Data Center Power Density
White Paper #120
By Neil Rasmussen
2005 American Power Conversion. All rights reserved. No part of this publication may be used, reproduced, photocopied, transmitted, or stored in any retrieval system of any nature, without the written permission of the copyright owner. www.apc.com Rev 2005-0 2
Executive Summary Conventional methods for specifying data center density are ambiguous and misleading.
Describing data center density using Watts / ft2 or Watts / m2 is not sufficient to determine
power or cooling compatibility with high density computing loads like blade servers.
Historically there is no clear standard way of specifying data centers to achieve predictable
behavior with high density loads. An appropriate specification for data center density
should assure compatibility with anticipated high density loads, provide unambiguous
instruction for design and installation of power and cooling equipment, prevent oversizing,
and maximize electrical efficiency. This paper describes the science and practical
application of an improved method for the specification of power and cooling infrastructure
for data centers.
2005 American Power Conversion. All rights reserved. No part of this publication may be used, reproduced, photocopied, transmitted, or stored in any retrieval system of any nature, without the written permission of the copyright owner. www.apc.com Rev 2005-0 3
Introduction The specification of operating power density for data centers and server rooms is a growing challenge for IT
professionals. Specifying data centers at the traditional densities of 40-80 Watts / ft2 (430 - 861 Watts / m2)
will result in the inability to reliably deploy the latest generations of IT equipment. Specifying data centers at
the 600-1000 Watts / ft2 ( 6458 – 10764 Watts / m2) operating density of the latest generations of high
density IT equipment will result in data centers that stress the limits of data center power and cooling
technology and result in extraordinary capital costs as well as low electrical operating efficiencies.
The density planning problem is further exacerbated by the need to design a data center to operate through
a number of IT refresh cycles where the nature of future IT equipment to be installed is unknown.
The historical method of specifying data center density in Watts / ft2 provides very little useful guidance for
answering critical questions that are faced by data center operators today. In particular, the historical power
density specification does not answer the key question: “What happens when a rack is deployed that
exceeds the density specification?” This is a very practical question because the typical data center today
has a density rating of 1.5 kW per rack while typical IT equipment has a greater power density of 3-20 kW
per rack.
A new and more complete method of specifying data center power density is needed. An improved method
would address the following needs:
• Assuring compatibility with high density IT equipment
• Avoiding waste of electricity, space, or capital expense
• Providing a means to validate IT deployment plans to the design cooling and power capability
This paper is focused on an improved method of specifying power density. Building data centers to
implement power, cooling, racks, and management for high density applications is the subject of a number of
other APC white papers including APC White Paper #46, “Cooling Strategies for Ultra-High Density Racks
and Blade Servers.”
The Various Density Specification Methods The definition of power density is inconsistent in the literature which has resulted in significant confusion in
the user communities. In order to better understand these definitions, consider the following hypothetical
500 kW data center:
2005 American Power Conversion. All rights reserved. No part of this publication may be used, reproduced, photocopied, transmitted, or stored in any retrieval system of any nature, without the written permission of the copyright owner. www.apc.com Rev 2005-0 4
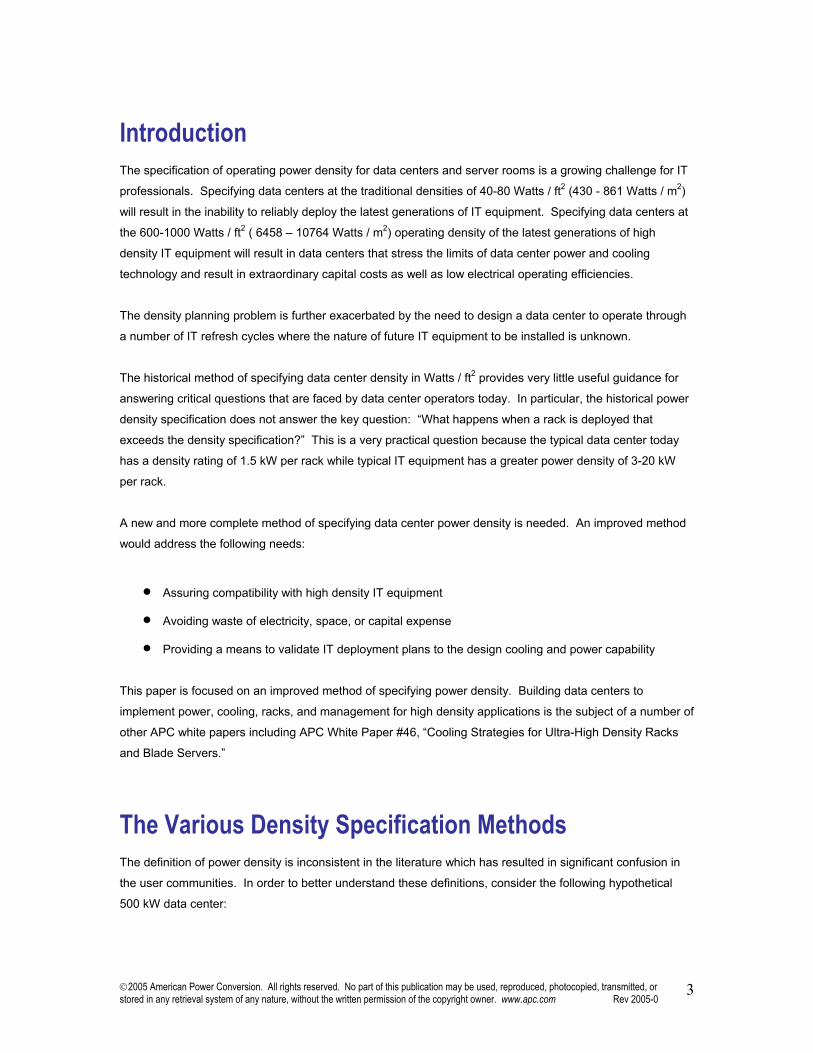
500 kW Data Center Parameters English Metric
Total power consumed by IT equipment 500,000 Watts
Total space consumed by IT equipment 2,800 ft2 260 m2
Back-room area devoted to cooling plant, switchgear, etc 1,400 ft2 130 m2
Total data center floor space 4,200 ft2 390 m2
Footprint per IT rack enclosure 6.7 ft2 0.622 m2
Quantity of rack enclosures 100
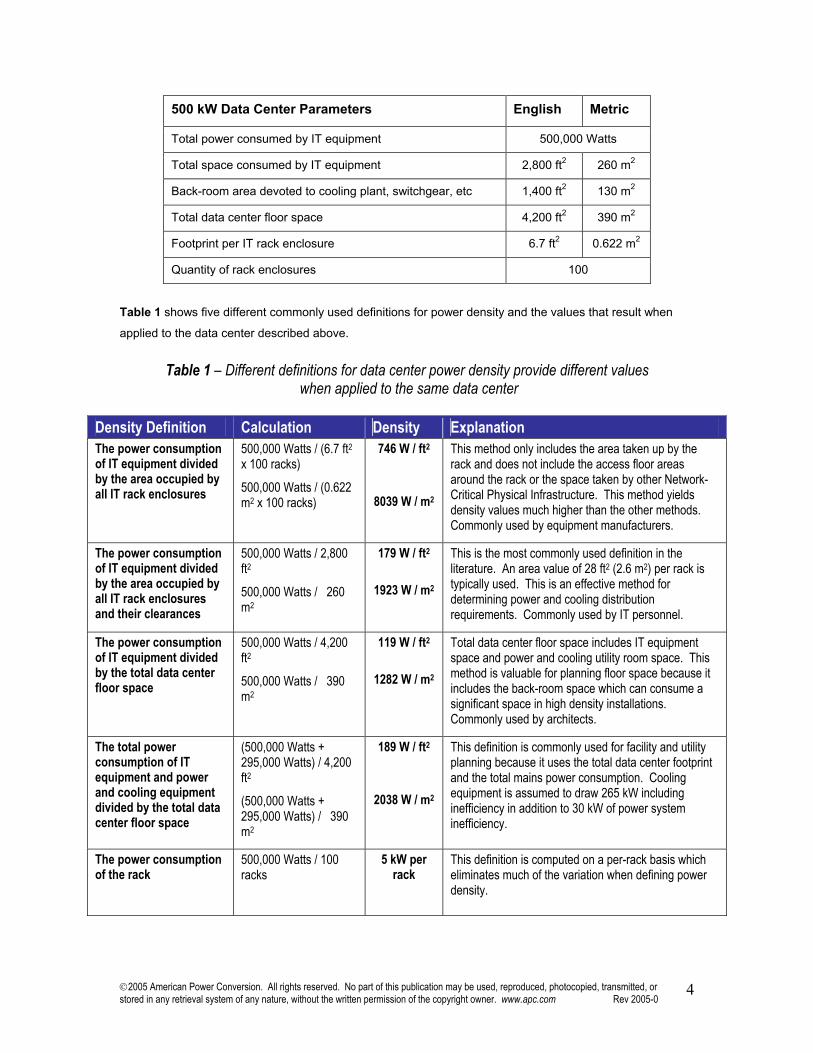
Table 1 shows five different commonly used definitions for power density and the values that result when
applied to the data center described above.
Table 1 – Different definitions for data center power density provide different values
when applied to the same data center
Density Definition Calculation Density Explanation The power consumption of IT equipment divided by the area occupied by all IT rack enclosures
500,000 Watts / (6.7 ft2 x 100 racks)
500,000 Watts / (0.622 m2 x 100 racks)
746 W / ft2
8039 W / m2
This method only includes the area taken up by the rack and does not include the access floor areas around the rack or the space taken by other Network-Critical Physical Infrastructure. This method yields density values much higher than the other methods. Commonly used by equipment manufacturers.
The power consumption of IT equipment divided by the area occupied by all IT rack enclosures and their clearances
500,000 Watts / 2,800 ft2
500,000 Watts / 260 m2
179 W / ft2
1923 W / m2
This is the most commonly used definition in the literature. An area value of 28 ft2 (2.6 m2) per rack is typically used. This is an effective method for determining power and cooling distribution requirements. Commonly used by IT personnel.
The power consumption of IT equipment divided by the total data center floor space
500,000 Watts / 4,200 ft2
500,000 Watts / 390 m2
119 W / ft2
1282 W / m2
Total data center floor space includes IT equipment space and power and cooling utility room space. This method is valuable for planning floor space because it includes the back-room space which can consume a significant space in high density installations. Commonly used by architects.
The total power consumption of IT equipment and power and cooling equipment divided by the total data center floor space
(500,000 Watts + 295,000 Watts) / 4,200 ft2
(500,000 Watts + 295,000 Watts) / 390 m2
189 W / ft2
2038 W / m2
This definition is commonly used for facility and utility planning because it uses the total data center footprint and the total mains power consumption. Cooling equipment is assumed to draw 265 kW including inefficiency in addition to 30 kW of power system inefficiency.
The power consumption of the rack
500,000 Watts / 100 racks
5 kW per rack
This definition is computed on a per-rack basis which eliminates much of the variation when defining power density.
2005 American Power Conversion. All rights reserved. No part of this publication may be used, reproduced, photocopied, transmitted, or stored in any retrieval system of any nature, without the written permission of the copyright owner. www.apc.com Rev 2005-0 5
All of the definitions for density in Table 1 are used in published literature and specifications. The four
definitions that use W / ft2 or W / m2 are ambiguous unless accompanied by a clear explanation of what is
included in area and what is included in power. Yet published values for density routinely omit this
information. This has led to tremendous confusion in the industry, and common miscommunication between
IT personnel and facilities designers and planners. The data in Table 1 clearly shows that density
specifications for the same facility can vary by almost a factor of 8 depending on the density
definition used.
The clearest statement of density is the “per rack” power consumption. This provides unambiguous
guidance regarding the power and cooling requirements of a rack (for IT equipment, the rack’s electrical
power consumption in Watts equals the cooling requirement in Watts). This paper will show that the per-rack
power consumption has another major advantage in the specification of data center density – namely, that it
is the most effective way to specify variations of density within a data center.
Real data centers do not exhibit a uniform power density. Some racks draw more electrical power and
consequently generate more heat than others. Patch panel racks may draw zero power. Blade server racks
may draw 20 kW or more power. Compounding this problem is the fact that IT equipment is constantly being
refreshed, which means the power consumption of particular racks is subject to change over time.
Conventional density specifications don't fully take in to account these power variations and as time goes on
they become less effective.
Limitations of Conventional Density Specification Methods The two examples below illustrate the severe limitations of conventional density specification:
In this first example, consider the case of a data center specified for 50 W / ft2 (538 W /m2). Using the
density definition of total IT load / total IT rack space and clearances, this equates to 1400 W per rack (50 W
/ ft2 x 28 ft2 / rack). A data center constructed to have the capability to deliver a maximum of 1400 W of
power and a maximum of 1400 W of cooling to every rack meets this requirement. There are many types of
IT equipment, such as blade servers, that exceed 1400 W per chassis. None of these types of equipment
could be deployed in a data center that has a strict 1400 W per-rack limit. The result is that this data center
would be incompatible with many types of IT equipment. Furthermore, when a low power load is placed in a
rack, like patch panels, the unused power is not available in other racks, since all racks have a 1400 W
power and cooling limit. The overall result is an ineffective data center that is incompatible with many types
of IT equipment, and furthermore is unable to effectively utilize the available rack space, the power capacity,
or the cooling capacity.
In the second example, data center density is specified rack-by-rack. For each rack location the power and
cooling are exactly specified. A design can be implemented to meet this specification, and the data center is
2005 American Power Conversion. All rights reserved. No part of this publication may be used, reproduced, photocopied, transmitted, or stored in any retrieval system of any nature, without the written permission of the copyright owner. www.apc.com Rev 2005-0 6
completely characterized in advance. This is an ideal situation; unfortunately, almost no real data center can
provide an exact rack-level power specification in advance. In real data centers the rack-level loads cannot
be predicted over the lifetime of the installation. In the case where the actual IT deployment density is
inconsistent with the original rack-level specification, there are serious consequences, including that when
an IT load below the rack power specification is deployed the unused power is not available in other racks,
since every rack has a specified power and cooling limit. The overall result is an ineffective data center that
requires information about future IT deployments which is typically not obtainable.
These two examples are both commonly used methods for specifying density in data centers. The overall
room-level specification and the exact rack-by-rack specification both have serious practical limitations
resulting in implementations that fail to meet customer expectations. An improved approach to specification
would retain flexibility and compatibility regarding IT loads but at the same time maximize electrical efficiency
and the utilization of power, cooling, and space.
Density Specification Requirements The preceding discussion suggests a number of requirements for an improved density specification method.
The requirements are:
Predictability: The density specification must permit the ability to determine the power and cooling
capacity at any rack location for any proposed or actual installation of IT equipment.
Accept partially specified future requirements: The density specification must not require that the
exact power be known in advance for each rack location. In fact, IT equipment only lasts for a fraction of the
life of a data center and is routinely changed out for new and different equipment.
Support power and cooling borrowing: Available power and cooling that is not used at a specific rack
should be available for use by other racks.
Minimize waste: Electrical inefficiency should be minimized. Available power, cooling, and space should
be utilized. Capital and operating costs should be minimized.
Support staged deployment: The density specification must support a staged deployment, including
the case where different stages may be at different densities, and where the data for future deployment
stages is not known at the time of earlier deployments.
Although some of the above requirements are in conflict, they can serve as the foundation for establishing
an improved method for specifying power density in data centers.
2005 American Power Conversion. All rights reserved. No part of this publication may be used, reproduced, photocopied, transmitted, or stored in any retrieval system of any nature, without the written permission of the copyright owner. www.apc.com Rev 2005-0 7
Practical Constraints and Options Any practical method for the specification of power density must comprehend actual practical constraints and
options involved in data center design. A number of these constraints and options are described, along with
their impact on density specification:
Power distribution increments: The cost and complexity of power distribution is a non-linear function
of power. For example, an 18 kW three-phase power feed does not cost three times that of a 6 kW single-
phase power feed. There are a number of optimal power capacities for AC power distribution due to
matching of circuit breakers with receptacles and due to fault coordination of circuit breakers. These issues
and the optimal power distribution circuits are described in APC White Paper #29, “Rack Powering Options
for High Density.” Specifications regarding power distribution should be developed around these optimal
circuit sizes, which vary depending on geographic location.
Air distribution limitations: The distribution of air within a data center is a primary factor limiting rack
power density. IT equipment requires between 100 and 160 cfm (47.2 - 75.5 L / s) of air per kW. Many data
centers have either pre-existing raised floors or have ceiling height limitations that limit the height of any
raised floor. In cases where the raised floor is part of the air distribution system there are practical limits to
the volume of air which can be moved predictably under the floor, which limits the achievable average and
peak rack power densities. For many pre-existing installations this limits the practical average power density
to around 5 kW per rack. To exceed this density, additional supplemental air conditioning and / or
distribution equipment must be installed. The consequence is that cost can grow rapidly above a critical
power density, and an appropriate density specification would recognize and address this issue before it
became a problem.
Weight: Some facilities have floor loading limits. This is particularly true of existing raised floor
installations. IT equipment that achieves very high power density typically also generates a heavy rack
weight load. In some cases this is a very practical limit to the ability to deploy high density. The
consequence is that a density specification should not futilely specify power densities that exceed the
corresponding floor loading limit of the facility.
Reserved floor space: Many data centers have floor area reserved for functions that are not specified
for density. Such functions could include tape storage, operator workspace, or special access areas. The
consequence is that a density specification model must reserve these areas and not depend on them to
provide any function related to implementing high density power or cooling.
Ability to spread loads: The ability to spread IT equipment physically within a data center is a practical
option for most IT equipment today, due to the wide use of fiber-optic cabling. It is not necessary or
desirable in many cases to deploy equipment at the full density it is capable of. Blade servers and 1U
servers are examples of high density IT equipment that can readily be spread out between racks in order to
decrease density. While packing racks with blade servers or 1U servers appears to optimize space usage,
2005 American Power Conversion. All rights reserved. No part of this publication may be used, reproduced, photocopied, transmitted, or stored in any retrieval system of any nature, without the written permission of the copyright owner. www.apc.com Rev 2005-0 8
in many cases the benefit is illusory, and the costs associated with achieving the high density power and
cooling to a rack usually greatly exceed the costs of consuming extra racks. The consequence is that a
density model should not blindly specify density values based on equipment capabilities, but instead should
take into account the possibility of spreading loads in order to optimize the cost and availability of the entire
system.
Actual space constraints for a particular site: Actual physical space constraints at a particular site
greatly affect the overall value proposition of high density. Many existing facilities that were designed for low
density find that the deployment of high density relieves space pressure; however, the benefits of
compaction of the IT space are not large. On the other hand, there are facilities that are highly constrained
by physical space for which floor area is extremely expensive or impractical to obtain. The consequence is
that a density specification methodology must take into account the value of space and any hard limits on
space.
Loss of Space to Power and Cooling Infrastructure Power and cooling infrastructure consumes space that could otherwise be utilized by IT equipment.
Sometimes, power and cooling equipment is moved outside of the space used for IT equipment and is
located in a nearby room. However, the space consumed is still real and must be counted as an effective
loss in achievable density. The space consumed by power and cooling infrastructure can be expressed in
equivalent racks, and this space increases as the need for power and cooling capacity increases. This effect
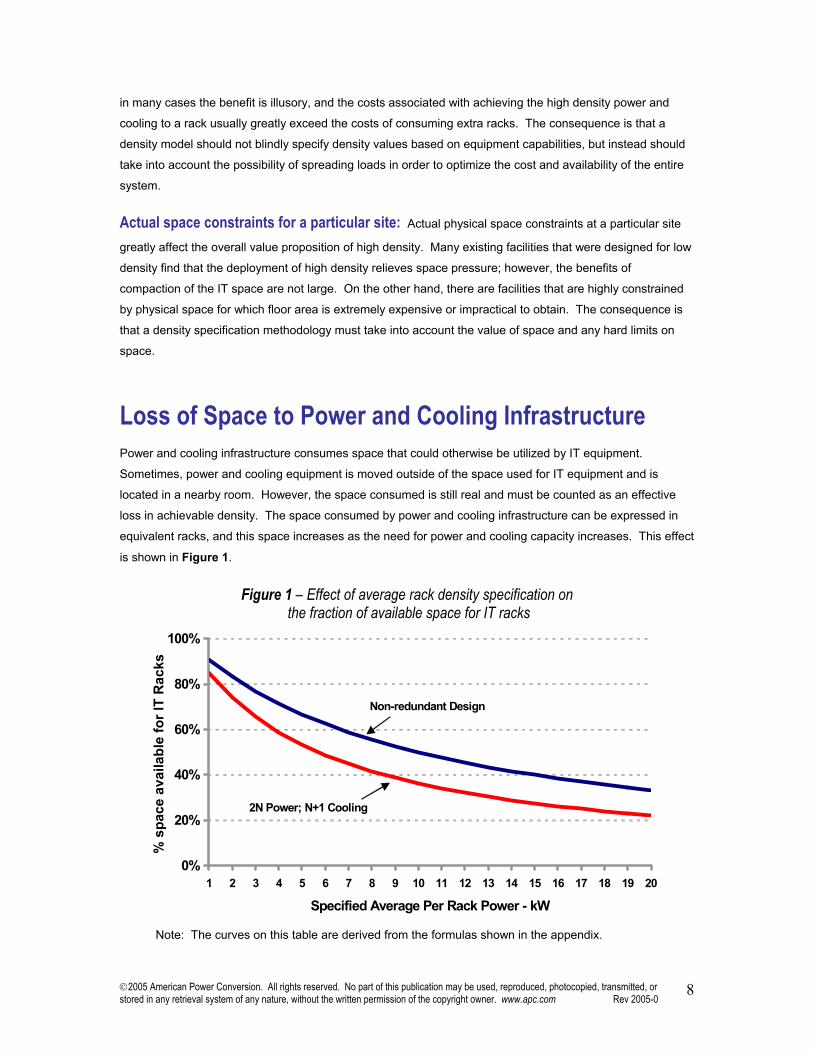
is shown in Figure 1.
Figure 1 – Effect of average rack density specification on
the fraction of available space for IT racks
0%
20%
40%
60%
80%
100%
1 2 3 4 5 6 7 8 9 10 11 12 13 14 15 16 17 18 19 20
Specified Average Per Rack Power - kW
% s
pace
ava
ilabl
e fo
r IT
Rac
ks
Non-redundant Design
2N Power; N+1 Cooling
Note: The curves on this table are derived from the formulas shown in the appendix.
2005 American Power Conversion. All rights reserved. No part of this publication may be used, reproduced, photocopied, transmitted, or stored in any retrieval system of any nature, without the written permission of the copyright owner. www.apc.com Rev 2005-0 9
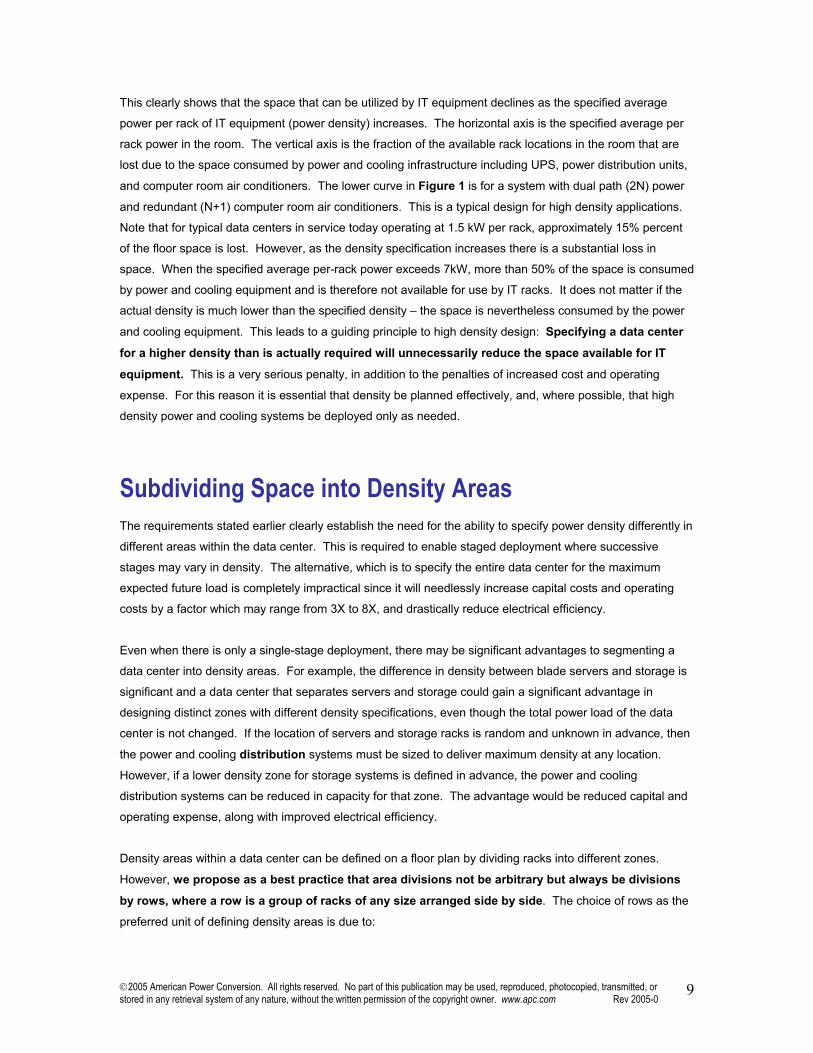
This clearly shows that the space that can be utilized by IT equipment declines as the specified average
power per rack of IT equipment (power density) increases. The horizontal axis is the specified average per
rack power in the room. The vertical axis is the fraction of the available rack locations in the room that are
lost due to the space consumed by power and cooling infrastructure including UPS, power distribution units,
and computer room air conditioners. The lower curve in Figure 1 is for a system with dual path (2N) power
and redundant (N+1) computer room air conditioners. This is a typical design for high density applications.
Note that for typical data centers in service today operating at 1.5 kW per rack, approximately 15% percent
of the floor space is lost. However, as the density specification increases there is a substantial loss in
space. When the specified average per-rack power exceeds 7kW, more than 50% of the space is consumed
by power and cooling equipment and is therefore not available for use by IT racks. It does not matter if the
actual density is much lower than the specified density – the space is nevertheless consumed by the power
and cooling equipment. This leads to a guiding principle to high density design: Specifying a data center
for a higher density than is actually required will unnecessarily reduce the space available for IT
equipment. This is a very serious penalty, in addition to the penalties of increased cost and operating
expense. For this reason it is essential that density be planned effectively, and, where possible, that high
density power and cooling systems be deployed only as needed.
Subdividing Space into Density Areas The requirements stated earlier clearly establish the need for the ability to specify power density differently in
different areas within the data center. This is required to enable staged deployment where successive
stages may vary in density. The alternative, which is to specify the entire data center for the maximum
expected future load is completely impractical since it will needlessly increase capital costs and operating
costs by a factor which may range from 3X to 8X, and drastically reduce electrical efficiency.
Even when there is only a single-stage deployment, there may be significant advantages to segmenting a
data center into density areas. For example, the difference in density between blade servers and storage is
significant and a data center that separates servers and storage could gain a significant advantage in
designing distinct zones with different density specifications, even though the total power load of the data
center is not changed. If the location of servers and storage racks is random and unknown in advance, then
the power and cooling distribution systems must be sized to deliver maximum density at any location.
However, if a lower density zone for storage systems is defined in advance, the power and cooling
distribution systems can be reduced in capacity for that zone. The advantage would be reduced capital and
operating expense, along with improved electrical efficiency.
Density areas within a data center can be defined on a floor plan by dividing racks into different zones.
However, we propose as a best practice that area divisions not be arbitrary but always be divisions
by rows, where a row is a group of racks of any size arranged side by side. The choice of rows as the
preferred unit of defining density areas is due to:
2005 American Power Conversion. All rights reserved. No part of this publication may be used, reproduced, photocopied, transmitted, or stored in any retrieval system of any nature, without the written permission of the copyright owner. www.apc.com Rev 2005-0 10
• Many rack power distribution architectures are row based
• Many rack cooling distribution architectures are row based
This means that the row will be the preferred and most cost effective level at which to define density
requirements, and the preferred increment of deployment. For this reason, the remainder of this paper will
focus on the row as the level at which density variations for zones are defined.
Deployment Strategy The density specification requirements must comprehend IT loads that change over time and also
comprehend staged deployments. Some assumptions must be made regarding if and how the power and
cooling infrastructure will change over time.
It is unreasonable to assume that existing power distribution and air distribution equipment will change in
response to changing IT loads. Changes to these systems, such as working on live electrical circuits or
water pipes, may require or risk downtime to groups of racks or even the entire data center. It is well
documented that human error is the primary cause of downtime in data centers and that changes made to
operating equipment are a primary downtime contributor. For this reason it is a best practice that power
and cooling distribution equipment for a row or zone be installed and then not changed or
reconfigured during the operating lifetime of that row or zone.
The practical implementation of this best practice is a deployment strategy that can be summarized as
follows:
• Lay out rows of racks / enclosures on the floor plan using standard aisle spacings
• Determine the design density specification for a row and then build a complete row to support that
density specification.
• If equipment is to be deployed that is within the parameters of the design specification for an existing
unfilled row, it may be deployed in that row.
• If equipment is to be deployed that is at a substantially different density than that of an unfilled row,
do not modify the power or cooling systems in order to deploy it in that row, but rather
construct a new row designed for the higher density.
• Over time, rows that are lightly populated should be targeted for a complete tear-down and rebuild at
a different density specification that is more consistent with current needs.
The use of this strategy is highly recommended as it minimizes the opportunity for human error related to
change work on operating rows within the data center. This practical and effective strategy does place a
2005 American Power Conversion. All rights reserved. No part of this publication may be used, reproduced, photocopied, transmitted, or stored in any retrieval system of any nature, without the written permission of the copyright owner. www.apc.com Rev 2005-0 11
constraint on the model for density specification, in that the power and cooling distribution for a row system
does not change after installation.
Note that there are some power and cooling distribution products on the market that permit reconfiguration of
the power and cooling architecture without the risk of downtime. For example, the APC InfraStruXure
system does allow for:
• Changing UPS power output by adding hot-pluggable modules
• Changing the type and capacity of receptacles in a rack via hot-swappable rack PDUs
• Adding supplemental cooling airflow capacity to a rack via a plug-in rack-mounted devices
This type of equipment allows for some additional flexibility after installation and is particularly beneficial in
smaller installations where staged row deployment is not feasible.
Peak vs. Average Density within a Row or Zone Although having loads of exactly the same power in every rack would simplify density specification, the prior
discussions suggest that this is an impractical goal with little resemblance to real-world installations. In fact,
rack densities can be expected to vary between zero (patch panels) and 30 kW (high density blade servers).
This variation has a dramatic effect on the nature of effective density specification.
Within a given row or zone of racks where the power per rack varies, the average rack power will be less
than the peak rack power. The important ratio of the actual peak-to-average rack power within a row will
therefore always be greater than or equal to one. It is instructive to consider a number of alternative
methods to specify power density for a row design that will support a known collection of racks of various
per-rack power consumptions.
Design all racks in row to peak. One approach to specifying a row density would be to specify that any
and all racks in the row have a power and cooling density capable of the maximum anticipated peak rack
power. In this case, the total cooling and power capacity must be sized assuming all racks could draw the
maximum power. This will necessarily cause a substantial oversizing of the power and cooling capacity,
which will lead to increased capital and operating costs, as well as poor electrical efficiency. These penalties
will be zero if the peak-to-average per-rack power consumption is equal to one, but will become substantial if
the peak-to-average per-rack power consumption within the row is 1.5 or greater. Furthermore, specification
at the maximum worst case power does not take into account the option that the loads that created the
maximum peak rack power could have been spread out, which could have reduced the peak-to-average per-
rack power. In general, specifying overall row density for the worst case peak rack power is sub-optimal
unless the peak-to-average rack power ratio is close to 1, which is rarely the case in typical installations.
2005 American Power Conversion. All rights reserved. No part of this publication may be used, reproduced, photocopied, transmitted, or stored in any retrieval system of any nature, without the written permission of the copyright owner. www.apc.com Rev 2005-0 12
Design all racks in row to average. Another approach would be to specify all racks at an average power
density. Like the previous approach, this simple method is not satisfactory, but for different reasons. This
method requires that any rack loads that attempt to exceed the average have equipment removed until they
are equal to or below the average. Furthermore, this method has an additional subtle limitation – any racks
that have an actual density below the specified design density give rise to unused power and cooling
capacity that cannot be used to create additional capacity for other racks. This is because the row was only
designed to power and cool each rack up to the average. Consider the following scenario: An IT operator
wants to deploy a 4 kW blade chassis in a row designed for 2 kW per rack. One could argue that it is
feasible to re-route a 2 kW power whip from an unused rack (if available) to the blade chassis. However,
cooling this 4 kW load becomes questionable because the cooling system wasn’t designed to cool racks
above 2 kW. Furthermore, there now remains a rack that is unusable because its power was taken by
another rack.
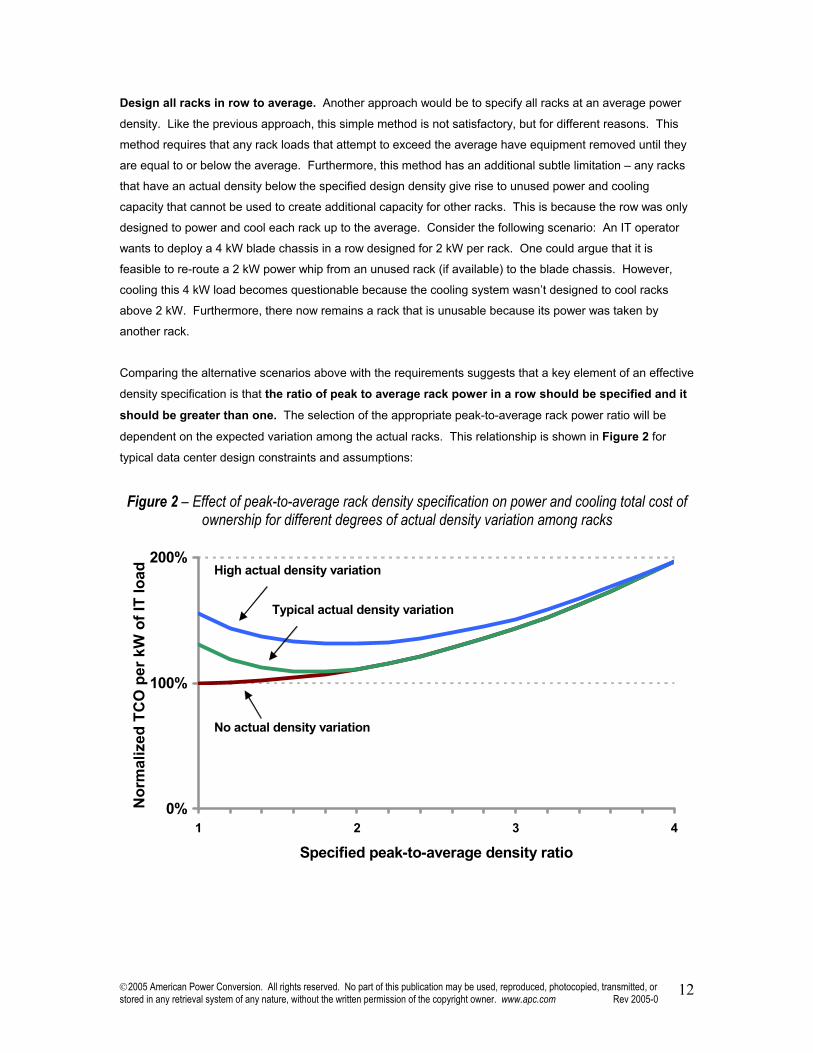
Comparing the alternative scenarios above with the requirements suggests that a key element of an effective
density specification is that the ratio of peak to average rack power in a row should be specified and it
should be greater than one. The selection of the appropriate peak-to-average rack power ratio will be
dependent on the expected variation among the actual racks. This relationship is shown in Figure 2 for
typical data center design constraints and assumptions:
Figure 2 – Effect of peak-to-average rack density specification on power and cooling total cost of ownership for different degrees of actual density variation among racks
0%
100%
200%
1 2 3 4
Specified peak-to-average density ratio
Nor
mal
ized
TC
O p
er k
W o
f IT
load High actual density variation
No actual density variation
Typical actual density variation
2005 American Power Conversion. All rights reserved. No part of this publication may be used, reproduced, photocopied, transmitted, or stored in any retrieval system of any nature, without the written permission of the copyright owner. www.apc.com Rev 2005-0 13
Figure 2 shows how the peak-to-average rack density specification affects the normalized TCO expense1
related to power and cooling infrastructure per kW of installed IT equipment for three different scenarios of
actual rack power variation. The data shows that for the case where all racks have the same power
consumption, TCO is optimized (lowest) when the peak-to-average rack density ratio is equal to one. This
effect is explained because specifying additional peak power density capability adds power and cooling
distribution costs but does not add any value when all racks have the same power consumption. However,
when the power variation among the actual installed racks increases, there is a substantial penalty when the
peak-to-average specification is not increased. This is due to stranded unusable power and cooling
capacity, combined with the need to increase floor space for a given IT load. The consequence is that a
peak-to-average rack density ratio of greater than one optimizes TCO for real-world installations.
This leads to another key element of an effective data center density specification: The peak-to-average
rack power density ratio within a row should be approximately two for typical designs, and that if the
expected actual peak-to-average rack density variation within a row is greater than 2 then the
spreading of the highest density IT loads among racks to limit the peak-to-average ratio, or the
reassignment of outlying loads to other rows, is recommended.
Rules-Based Density Specifications When the average and peak rack power densities for a row or zone have been specified a design to
predictably implement that specification is possible. In the case where the peak rack power is near the
average value, the implementation is straightforward. However, when the peak-to-average rack power within
a row becomes on the order of 1.5 or larger, the challenges and costs of implementing the design increase.
The problem of assuring that any racks can operate at the peak rack power so long as the average power is
not exceeded can be a serious constraint in installations that use raised floor air supply systems. The
overall achievable average and peak power densities can be increased if a rules-based density deployment
is permitted within the density specification.
To understand the problem solved by rules-based specifications, consider the case of a row to be installed in
an existing raised floor cooling system with the recommended peak-to-average rack power density of 2.
From the point of view of the power system, each rack must be provided with power distribution at the peak
rack density, but supplied by a PDU or UPS that is rated for the average rack density multiplied by the
number of IT racks. This is simple to implement. However from a cooling perspective, each rack does not
have a well defined air distribution system that is rated at twice the average rack density. Racks operating at
a density above the average must borrow underutilized capacity from neighboring racks that operate at
below the average rack density. In the case of the raised floor which has limited airflow capacity, this means
that separating high density racks from each other within the row greatly reduces the local overload on the
1 TCO expense includes capital cost of power and cooling equipment and its 10-year service, space, and electricity cost. These will vary $50K - $90K per rack depending on design and fractional utilization. Note that UPS and chiller expenses are not affected by peak-to-average ratio - variations in TCO are driven by the costs of power and cooling distribution systems.

2005 American Power Conversion. All rights reserved. No part of this publication may be used, reproduced, photocopied, transmitted, or stored in any retrieval system of any nature, without the written permission of the copyright owner. www.apc.com Rev 2005-0 14
cooling distribution system. If a specification includes the ability to establish rules regarding the location of
high density racks within the row, then higher peak and average densities can be achieved within the
constraints of the system.
An example of a simple rule would be that a rack can only exceed the average power rating by the amount
that the average consumption of the adjacent racks is below the average. More sophisticated rules could be
used to maximize the predictable power density that can be achieved in a given installation, and these rules
could be implemented in the power and cooling management system.2
Specifying Density Options for Future Growth Many data centers are not built out completely at one time, but evolve and grow over time. In these cases, it
is not always desirable or practical to specify density in advance for rows or zones not yet planned. Any
practical method for specifying data center density must comprehend future requirements for which density
is difficult to predict, and preserve future density options as possible. Ideally, expenses and commitments
related to the deployment of power and cooling infrastructure are delayed for as long as possible.
Furthermore, the later expansion of the data center does not compromise the availability of the IT equipment
that is already operating.
A commonly used option is to build out all the power and cooling infrastructure in advance to support a pre-
defined power density. This has the advantage that the pre-installation of this equipment ensures that during
future IT deployments major utility work does not need to be performed on the live data center. However,
this approach has many major downside costs, including:
• Future IT density exceeds the density of the power and cooling infrastructure and therefore cannot
be effectively deployed
• Future IT density is less than the density of the power and cooling infrastructure and therefore major
infrastructure investments are wasted
• The facility never expands, or expansion is forced to occur in another location due to regulations or
other business issues, and therefore major infrastructure investments are wasted
• The near term loading on the data center is much lower than the rated power and cooling
infrastructure, leading to major decreases in electrical efficiency and significant and unnecessary
electricity costs
• The advance installation of currently unneeded power and cooling infrastructure drives unnecessary
capital equipment and maintenance contract costs
2 The implementation of cooling density rules within a management system are subject to patents pending by APC Corporation
2005 American Power Conversion. All rights reserved. No part of this publication may be used, reproduced, photocopied, transmitted, or stored in any retrieval system of any nature, without the written permission of the copyright owner. www.apc.com Rev 2005-0 15
An effective model for specifying density would avoid these issues by supporting a design and
implementation approach of modular and scalable power and cooling infrastructure. Such an architecture
would be based on the up-front installation of main utility feeds such as row or zone level power feeds and
cooling feeds, in conjunction with deferred installation of expensive power and cooling infrastructure such as
UPS systems, PDUs, racks, power distribution within the row, air conditioners, and air distribution
equipment. The specific density to be supported within a zone or row would be a decision that would be
deferred to the time of deployment, and the power and cooling infrastructure would be deployed on a row by
row basis. The APC InfraStruXure system is one practical example of such architecture.
This discussion leads to another key element of the proposed density specification method: Rows or zones
within a data center that are to be deployed in the future should be planned for a worst case high
density value and primary feed wiring and piping should be installed up-front to support this
density; however the actual selection of power and cooling equipment for rows should be deferred
until the deployment density and plan are defined. In this way the primary cost drivers of the power and
cooling infrastructure are rightsized to the actual application, and deployed where and when needed. This
greatly reduces capital costs, operating costs, and results in a much more energy efficient data center.
The Model A model for the specification of power density that meets the requirements identified earlier and
comprehends the various practical constraints and limitations can now be constructed.
The model includes the following key elements:
• A data center physical layout is created which is based on rows of racks or enclosures
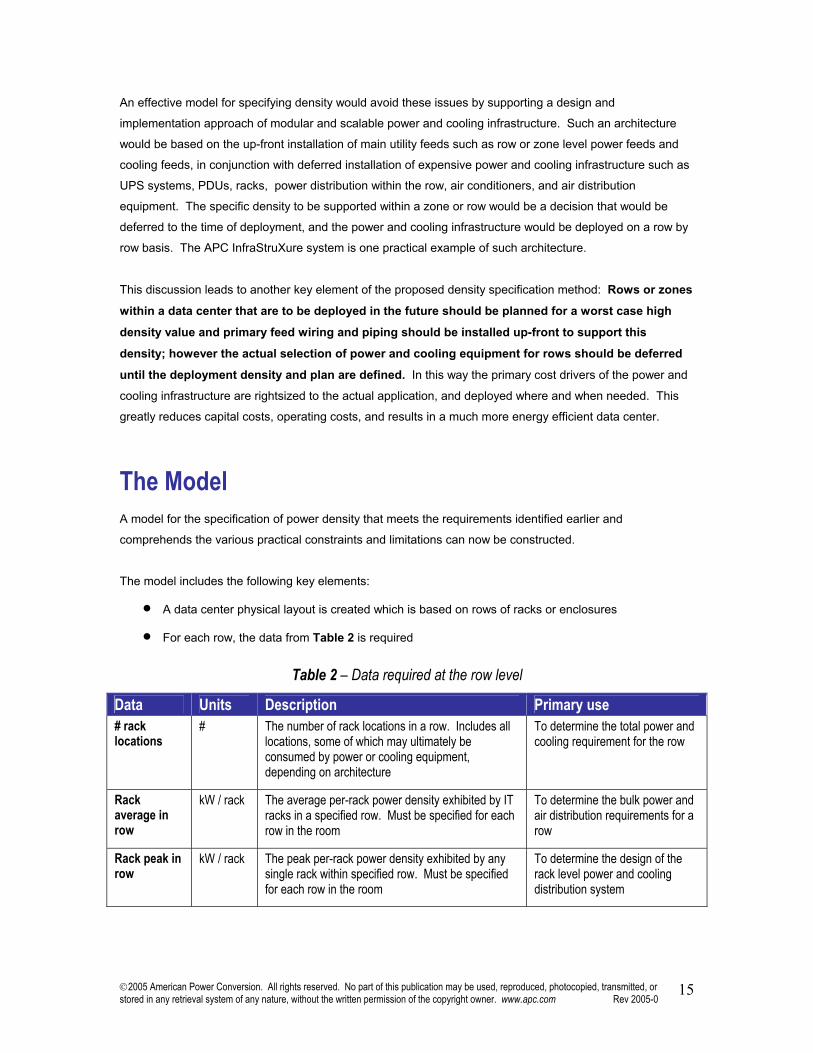
• For each row, the data from Table 2 is required
Table 2 – Data required at the row level
Data Units Description Primary use # rack locations
# The number of rack locations in a row. Includes all locations, some of which may ultimately be consumed by power or cooling equipment, depending on architecture
To determine the total power and cooling requirement for the row
Rack average in row
kW / rack The average per-rack power density exhibited by IT racks in a specified row. Must be specified for each row in the room
To determine the bulk power and air distribution requirements for a row
Rack peak in row
kW / rack The peak per-rack power density exhibited by any single rack within specified row. Must be specified for each row in the room
To determine the design of the rack level power and cooling distribution system
2005 American Power Conversion. All rights reserved. No part of this publication may be used, reproduced, photocopied, transmitted, or stored in any retrieval system of any nature, without the written permission of the copyright owner. www.apc.com Rev 2005-0 16
• For rows to be deployed in the future, maximum realistic values for average and peak rack power
should be specified, with the understanding that these values can be reduced prior to deployment
with only a small penalty from oversizing the primary feed wiring and piping
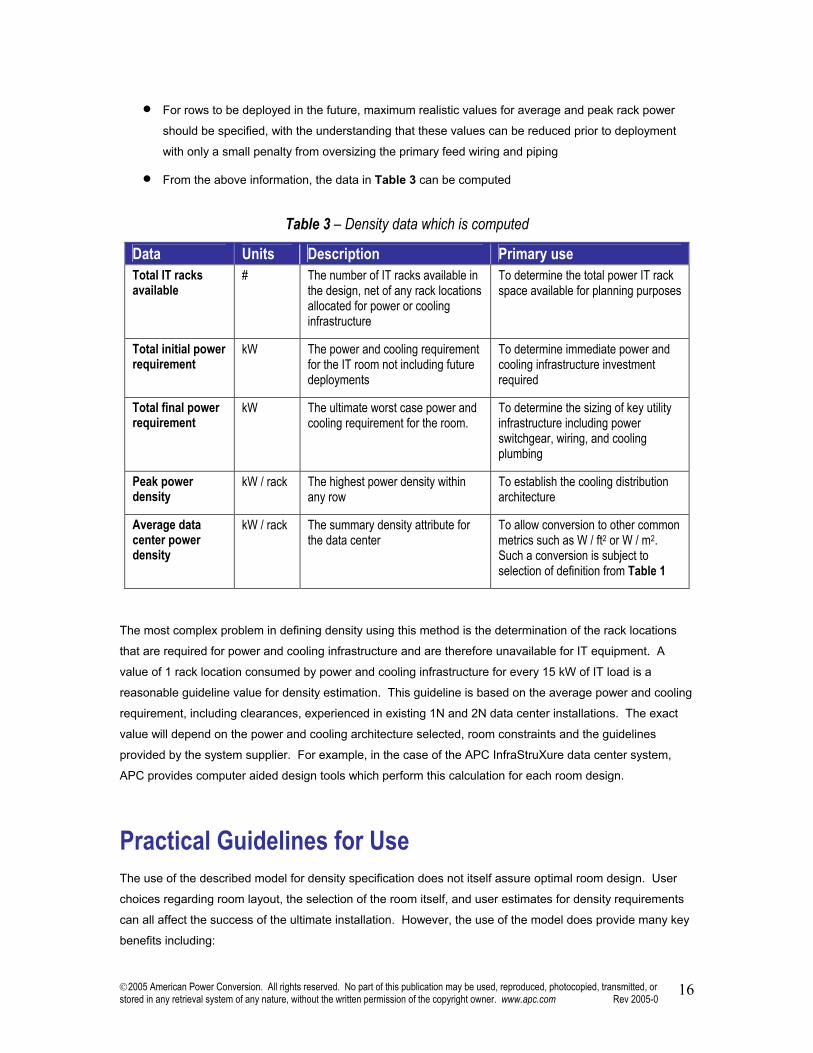
• From the above information, the data in Table 3 can be computed
Table 3 – Density data which is computed
Data Units Description Primary use Total IT racks available
# The number of IT racks available in the design, net of any rack locations allocated for power or cooling infrastructure
To determine the total power IT rack space available for planning purposes
Total initial power requirement
kW The power and cooling requirement for the IT room not including future deployments
To determine immediate power and cooling infrastructure investment required
Total final power requirement
kW The ultimate worst case power and cooling requirement for the room.
To determine the sizing of key utility infrastructure including power switchgear, wiring, and cooling plumbing
Peak power density
kW / rack The highest power density within any row
To establish the cooling distribution architecture
Average data center power density
kW / rack The summary density attribute for the data center
To allow conversion to other common metrics such as W / ft2 or W / m2. Such a conversion is subject to selection of definition from Table 1
The most complex problem in defining density using this method is the determination of the rack locations
that are required for power and cooling infrastructure and are therefore unavailable for IT equipment. A
value of 1 rack location consumed by power and cooling infrastructure for every 15 kW of IT load is a
reasonable guideline value for density estimation. This guideline is based on the average power and cooling
requirement, including clearances, experienced in existing 1N and 2N data center installations. The exact
value will depend on the power and cooling architecture selected, room constraints and the guidelines
provided by the system supplier. For example, in the case of the APC InfraStruXure data center system,
APC provides computer aided design tools which perform this calculation for each room design.
Practical Guidelines for Use The use of the described model for density specification does not itself assure optimal room design. User
choices regarding room layout, the selection of the room itself, and user estimates for density requirements
can all affect the success of the ultimate installation. However, the use of the model does provide many key
benefits including:
2005 American Power Conversion. All rights reserved. No part of this publication may be used, reproduced, photocopied, transmitted, or stored in any retrieval system of any nature, without the written permission of the copyright owner. www.apc.com Rev 2005-0 17
• It provides a more complete and accurate description of data center density than other commonly
used specification methods
• Data centers built to the specification will have more predictable performance
• The model is specific enough that costs, including capital and operating costs, can be rapidly
estimated, speeding the design cycle and permitting alternate scenario analysis
• It supports a system of modular scalable data center deployment, which can dramatically reduce
TCO and improve electrical efficiency
Practical applications of the described density specification method include:
• Comparing TCO associated with alternate data center sites or room locations
• Estimating costs associated with increasing density in a planned or existing data center
• Providing a specification that clearly establishes density expectations in a form comprehensible to IT
users, so that IT users, data center operators, and data center systems suppliers establish the same
expectations
Implementation of this density specification method into computer aided data center design tools can
facilitate and automate the specification and design process.
Example of a Data Center Specification An example illustrates how the model can be used to specify an actual data center. In this case a room is
provided for a server consolidation project. All UPS, power distribution, and cooling systems are to be
located within the room and do not currently exist. Due to headroom no raised floor exists or is feasible. A
mixture of networking equipment is to be deployed, including blade servers, rack-mount servers, storage,
and networking equipment. The blade servers are to be located together and not spread out. The current
requirement is estimated to fill only half of the provided room. The remainder of the room is to be reserved
at 20% higher than the current deployed density, with the capability to support at least 3 racks of future blade
servers estimated to draw 25 kW per rack. The availability requirement is for a non redundant power and
cooling system.
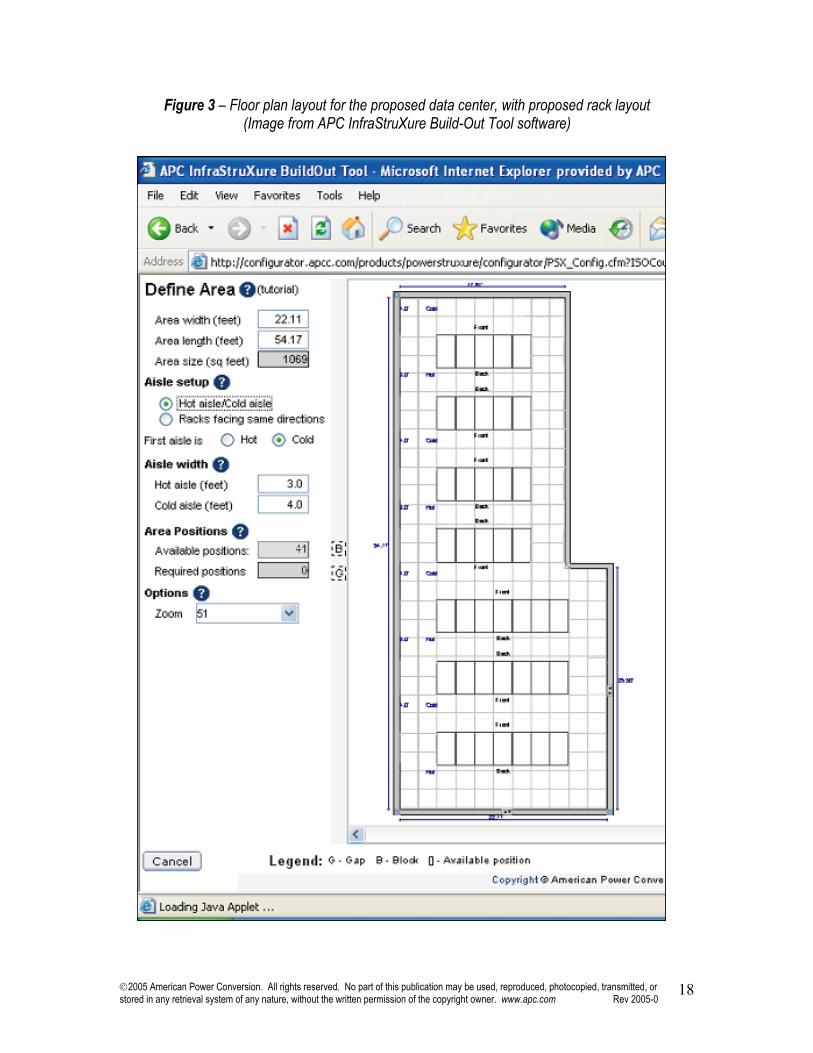
The outline of the room is shown in Figure 3, along with a proposed rack layout, yielding a total of 41 rack
locations in the room. It is decided that rows 1, 2, and 3 will be deployed immediately and rows 4, 5, 6, and
7 will be deployed at a later date. A review of the current planned deployment allows some assignment of
like-powered equipment to rows to reduce the peak to average ratio of the rows, and locates the blade
servers together as required in row 2. The row-level specification of rows 1, 2, and 3 is entered into Table 4.
2005 American Power Conversion. All rights reserved. No part of this publication may be used, reproduced, photocopied, transmitted, or stored in any retrieval system of any nature, without the written permission of the copyright owner. www.apc.com Rev 2005-0 18
Figure 3 – Floor plan layout for the proposed data center, with proposed rack layout (Image from APC InfraStruXure Build-Out Tool software)
2005 American Power Conversion. All rights reserved. No part of this publication may be used, reproduced, photocopied, transmitted, or stored in any retrieval system of any nature, without the written permission of the copyright owner. www.apc.com Rev 2005-0 19
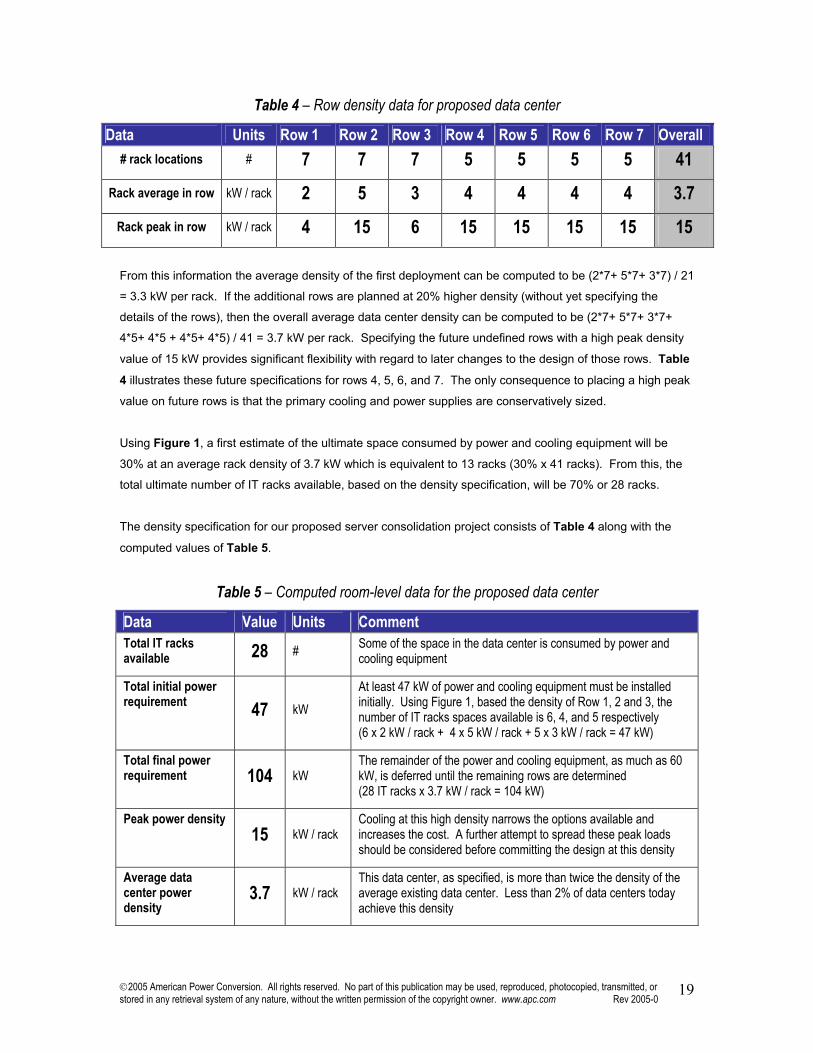
Table 4 – Row density data for proposed data center
Data Units Row 1 Row 2 Row 3 Row 4 Row 5 Row 6 Row 7 Overall # rack locations # 7 7 7 5 5 5 5 41
Rack average in row kW / rack 2 5 3 4 4 4 4 3.7 Rack peak in row kW / rack 4 15 6 15 15 15 15 15
From this information the average density of the first deployment can be computed to be (2*7+ 5*7+ 3*7) / 21
= 3.3 kW per rack. If the additional rows are planned at 20% higher density (without yet specifying the
details of the rows), then the overall average data center density can be computed to be (2*7+ 5*7+ 3*7+
4*5+ 4*5 + 4*5+ 4*5) / 41 = 3.7 kW per rack. Specifying the future undefined rows with a high peak density
value of 15 kW provides significant flexibility with regard to later changes to the design of those rows. Table
4 illustrates these future specifications for rows 4, 5, 6, and 7. The only consequence to placing a high peak
value on future rows is that the primary cooling and power supplies are conservatively sized.
Using Figure 1, a first estimate of the ultimate space consumed by power and cooling equipment will be
30% at an average rack density of 3.7 kW which is equivalent to 13 racks (30% x 41 racks). From this, the
total ultimate number of IT racks available, based on the density specification, will be 70% or 28 racks.
The density specification for our proposed server consolidation project consists of Table 4 along with the
computed values of Table 5.
Table 5 – Computed room-level data for the proposed data center
Data Value Units Comment Total IT racks available 28 # Some of the space in the data center is consumed by power and
cooling equipment
Total initial power requirement 47 kW
At least 47 kW of power and cooling equipment must be installed initially. Using Figure 1, based the density of Row 1, 2 and 3, the number of IT racks spaces available is 6, 4, and 5 respectively (6 x 2 kW / rack + 4 x 5 kW / rack + 5 x 3 kW / rack = 47 kW)
Total final power requirement 104 kW
The remainder of the power and cooling equipment, as much as 60 kW, is deferred until the remaining rows are determined (28 IT racks x 3.7 kW / rack = 104 kW)
Peak power density 15 kW / rack
Cooling at this high density narrows the options available and increases the cost. A further attempt to spread these peak loads should be considered before committing the design at this density
Average data center power density
3.7 kW / rack This data center, as specified, is more than twice the density of the average existing data center. Less than 2% of data centers today achieve this density
2005 American Power Conversion. All rights reserved. No part of this publication may be used, reproduced, photocopied, transmitted, or stored in any retrieval system of any nature, without the written permission of the copyright owner. www.apc.com Rev 2005-0 20
From this point, a design can be created. The next step would be to establish the actual locations of the
power and cooling equipment, based on the nature of the equipment and the system design. This process
based on complex mathematical models of the specific equipment, along with optimization rules and
customer preferences. This process is unique for different power and cooling equipment vendors and will
not be discussed here. Ideally, the design would only call for the power and cooling equipment required at
the initial deployment, but would anticipate and facilitate the installation of power and cooling equipment in
the future to meet the partially specified future deployment plan. For example, by assuring that during the
first deployment phase, the primary power wiring and cooling piping are pre-installed to the future racks.
Note that although the future rows are currently specified with average and peak rack density values, these
values can be changed any time prior to the future deployment as long as the total power of the entire area
does not exceed the currently planned value.
Conclusion Conventional methods for describing data center density are primitive, incomplete, and ambiguous. These
legacy methods are unable to provide planning guidance to assure predictable data center power and
cooling performance with the high power density of the latest generations of IT equipment.
This paper outlines the requirements for density specification and introduces a new method for density
specification. This method provides actionable specifications that clearly communicate requirements
between IT staff and facilities designers, and facilitates the creation of data centers that are predictable and
cost effective, and electrically efficient.
About the Author: Neil Rasmussen is a founder and the Chief Technical Officer of American Power Conversion. At APC, Neil
directs the world’s largest R&D budget devoted to power, cooling, and rack infrastructure for critical
networks, with principal product development centers in Massachusetts, Missouri, Denmark, Rhode Island,
Taiwan, and Ireland. Neil is currently leading the effort at APC to develop modular scalable data center
solutions.
Prior to founding APC in 1981, Neil received his Bachelors and Masters degrees from MIT in electrical
engineering where he did his thesis on the analysis of a 200MW power supply for a Tokamak Fusion reactor.
From 1979 to 1981 he worked at MIT Lincoln Laboratories on flywheel energy storage systems and solar
electric power systems.
2005 American Power Conversion. All rights reserved. No part of this publication may be used, reproduced, photocopied, transmitted, or stored in any retrieval system of any nature, without the written permission of the copyright owner. www.apc.com Rev 2005-0 21
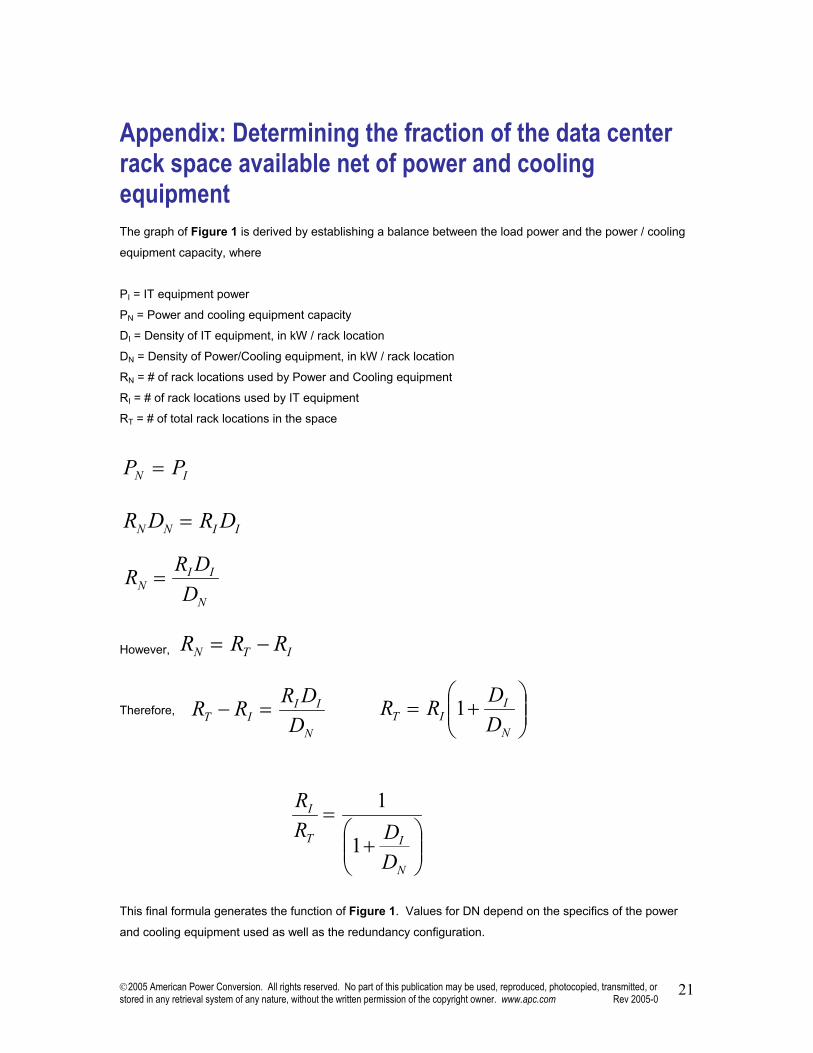
Appendix: Determining the fraction of the data center rack space available net of power and cooling equipment The graph of Figure 1 is derived by establishing a balance between the load power and the power / cooling
equipment capacity, where
PI = IT equipment power
PN = Power and cooling equipment capacity
DI = Density of IT equipment, in kW / rack location
DN = Density of Power/Cooling equipment, in kW / rack location
RN = # of rack locations used by Power and Cooling equipment
RI = # of rack locations used by IT equipment
RT = # of total rack locations in the space
IN PP =
IINN DRDR =
However, ITN RRR −=
Therefore,
This final formula generates the function of Figure 1. Values for DN depend on the specifics of the power
and cooling equipment used as well as the redundancy configuration.
N
IIN D
DRR =
N
IIIT D
DRRR =−
+=
N
IIT D
DRR 1
+
=
N
IT
I
DDR
R
1
1