Embed Size (px)
Citation preview

By:Nick Hall
Andrew KalfayanMichael LaowJoey Suitonu
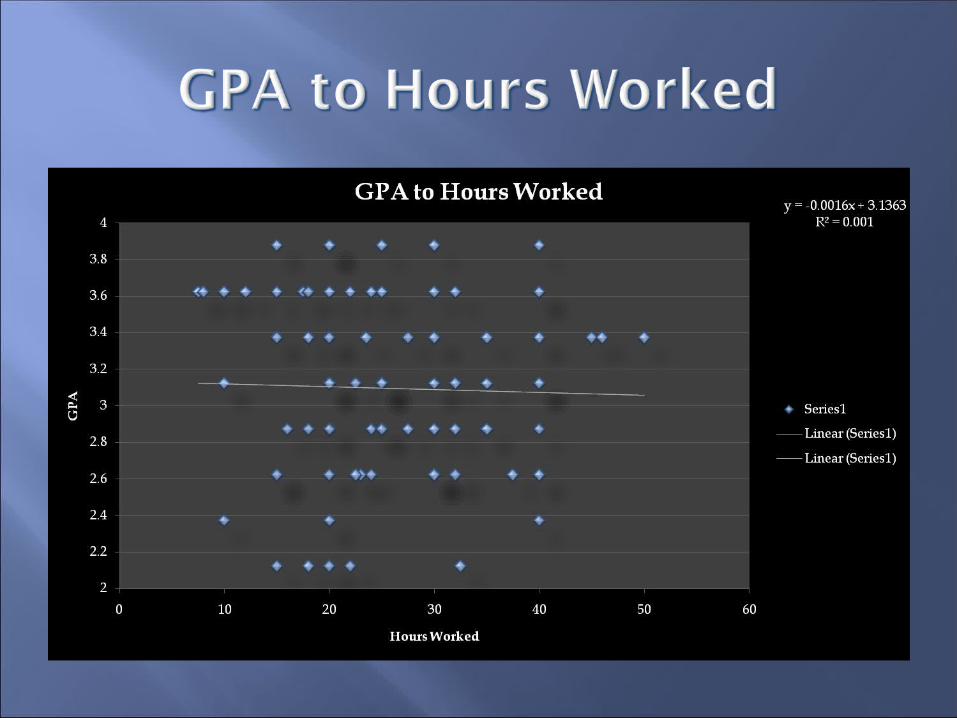
Could the lack of time due to increasing work hours be the cause of lower academic performance?
Is there a significant difference in GPA from the sample of employed and unemployed students surveyed?
Our goal was to determine whether it is beneficial to work less or not at all while attending school.
Everyday college students have to balance their lives between school and work. With today’s cost of living, especially in Southern California, individuals have to work more hours to maintain their lifestyles.
Our belief is that there is a correlation between the employed and unemployed students and their overall G.P.A.
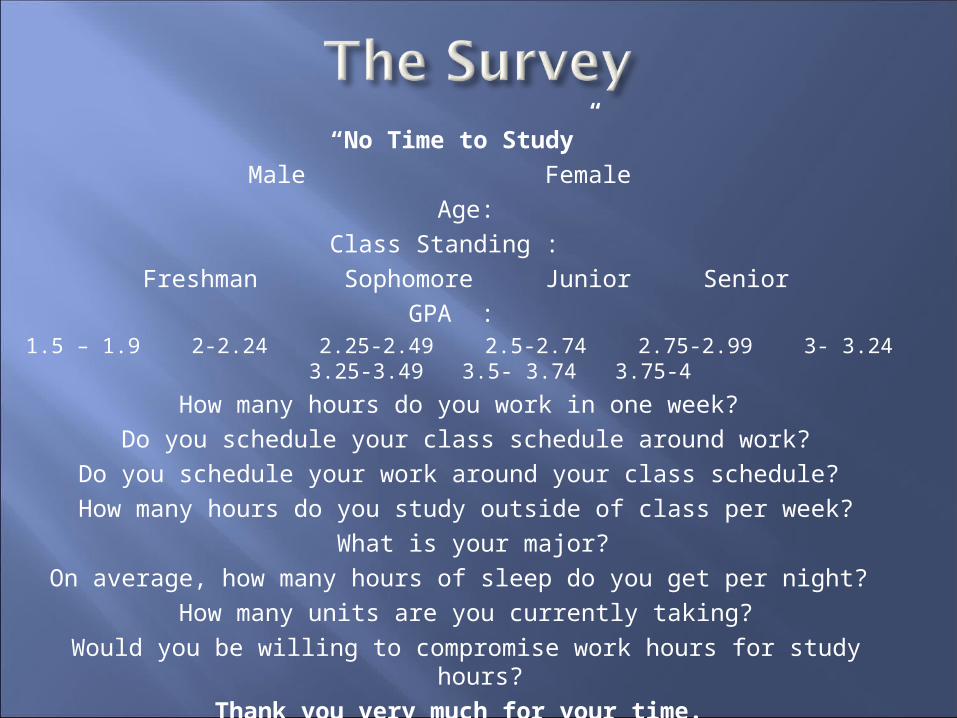
“No Time to Study” Male Female
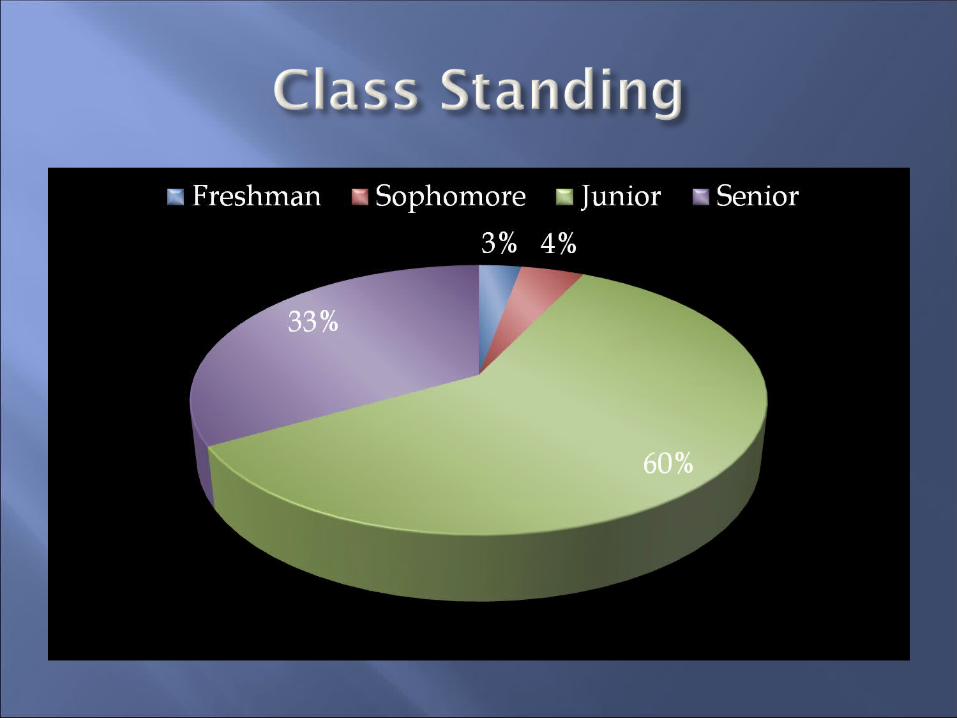
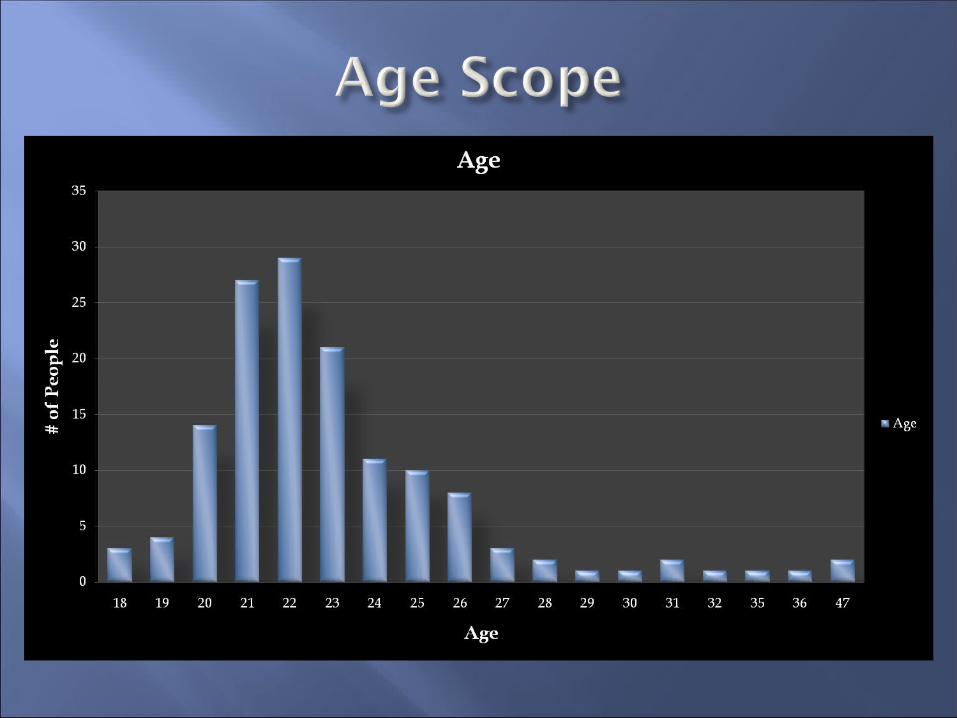
Age:Class Standing :
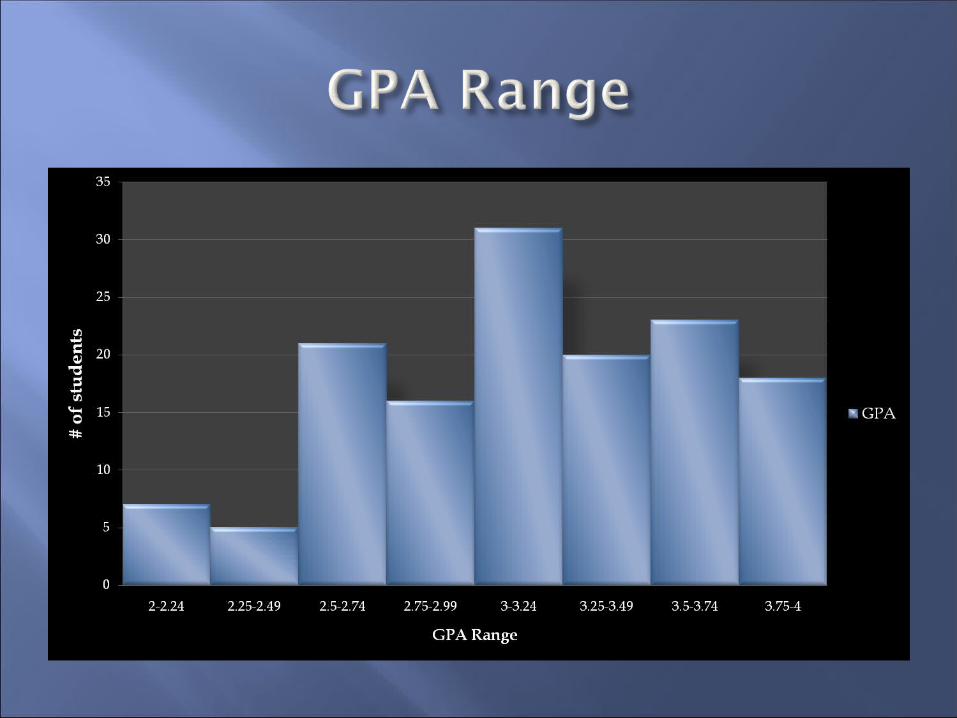
Freshman Sophomore Junior SeniorGPA :
1.5 – 1.9 2-2.24 2.25-2.49 2.5-2.74 2.75-2.99 3- 3.24 3.25-3.49 3.5- 3.74 3.75-4
How many hours do you work in one week? Do you schedule your class schedule around work?
Do you schedule your work around your class schedule? How many hours do you study outside of class per week?
What is your major? On average, how many hours of sleep do you get per night?
How many units are you currently taking?Would you be willing to compromise work hours for study hours?
Thank you very much for your time.
Southern California Cal State Universities
Our main focus was on the College of Business at California State University San Marcos
We also received data from an assortment of different majors such as Kinesiology, Communications, Human Development, Psychology, Biology, Criminology, and Liberal studies, and Cosmetology.
Given that our objective was focused on work hours and its effect on GPA the differences in each major was not an issue.
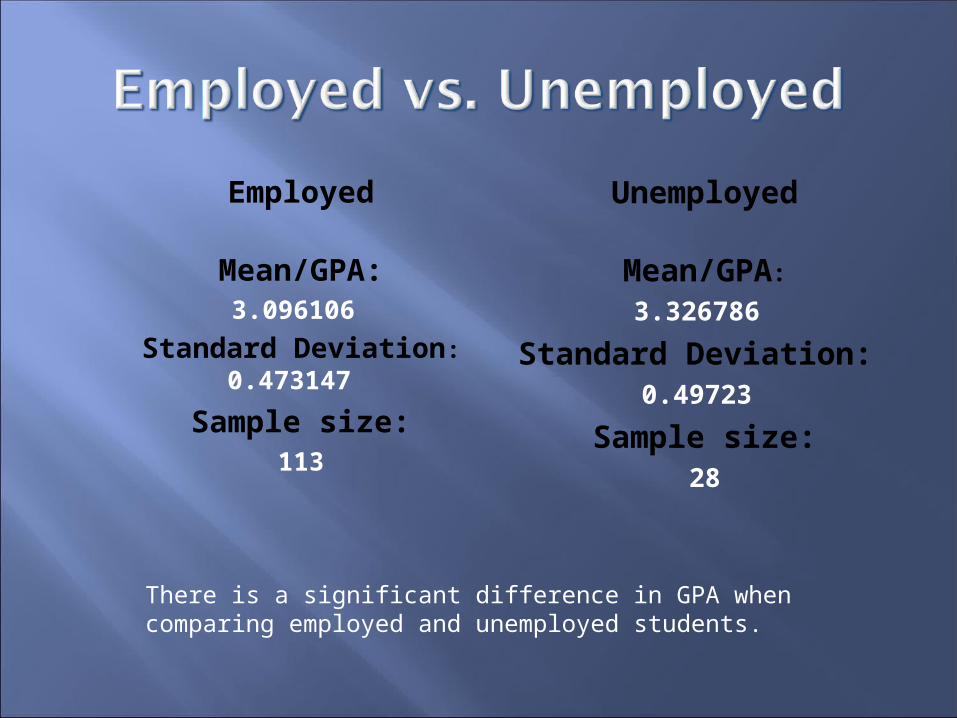
Employed
Mean/GPA:3.096106
Standard Deviation:
0.473147
Sample size:113
Unemployed
Mean/GPA:
3.326786
Standard Deviation: 0.49723
Sample size:28
There is a significant difference in GPA when comparing employed and unemployed students.

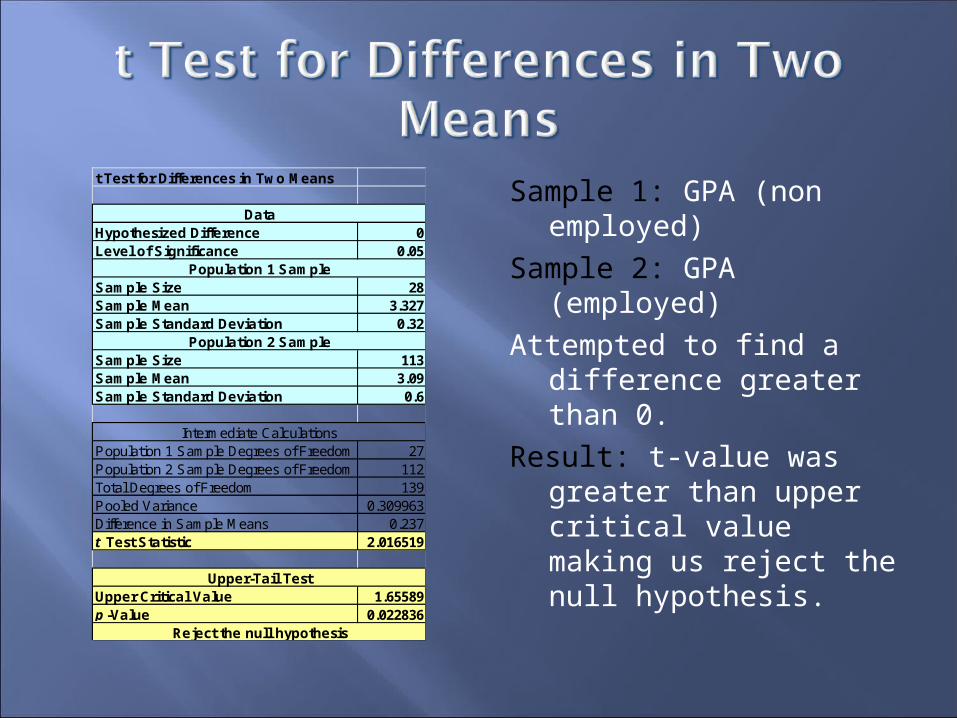
t Test for Differences in Two Means
Hypothesized Difference 0Level of Significance 0.05
Population 1 SampleSample Size 28Sample Mean 3.327Sample Standard Deviation 0.32
Population 2 SampleSample Size 113Sample Mean 3.09Sample Standard Deviation 0.6
Population 1 Sample Degrees of Freedom 27Population 2 Sample Degrees of Freedom 112Total Degrees of Freedom 139Pooled Variance 0.309963Difference in Sample Means 0.237t Test Statistic 2.016519
Upper-Tail TestUpper Critical Value 1.65589p -Value 0.022836
Reject the null hypothesis
Data
Intermediate Calculations
Sample 1: GPA (non employed)
Sample 2: GPA (employed)
Attempted to find a difference greater than 0.
Result: t-value was greater than upper critical value making us reject the null hypothesis.
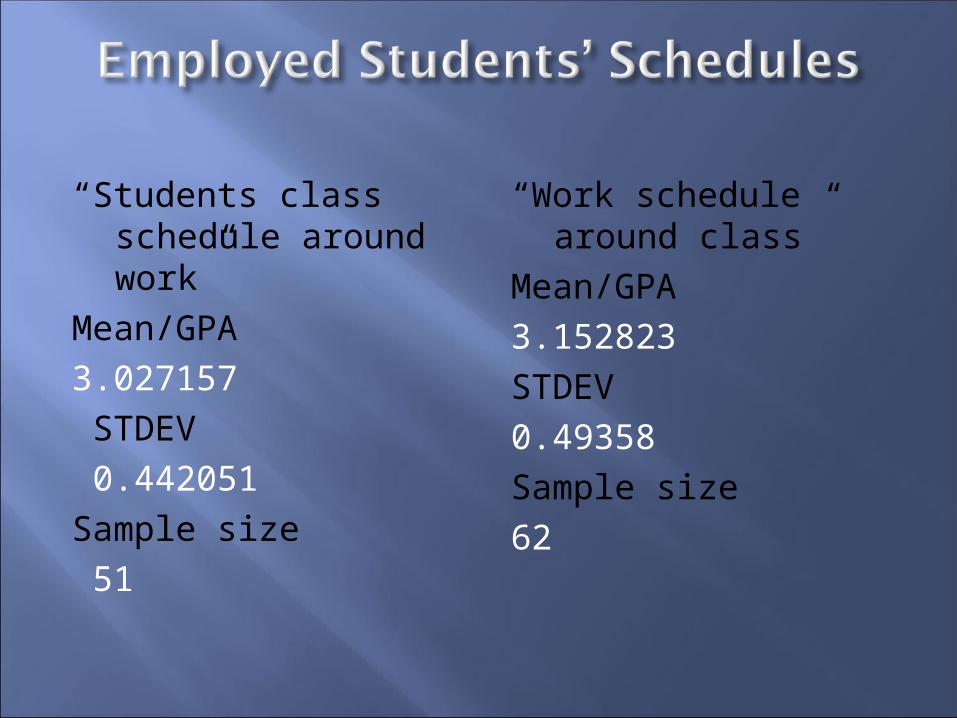
“Students class schedule around work”
Mean/GPA 3.027157 STDEV 0.442051 Sample size 51
“Work schedule around class”
Mean/GPA 3.152823 STDEV 0.49358 Sample size 62
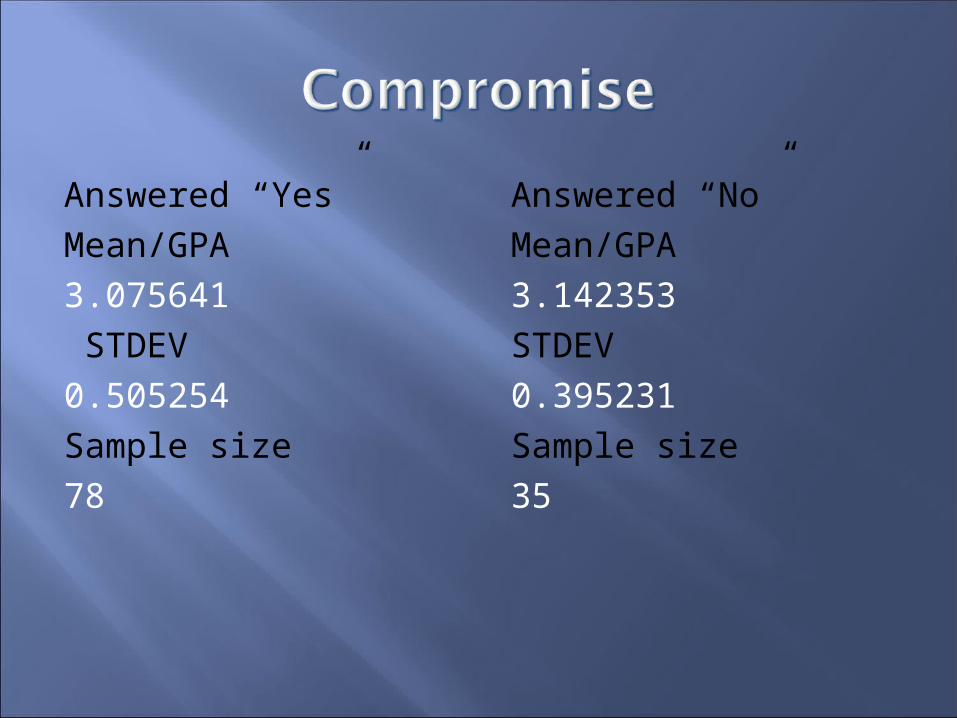
Answered “Yes” Mean/GPA 3.075641 STDEV 0.505254 Sample size 78
Answered “No” Mean/GPA 3.142353 STDEV 0.395231 Sample size 35
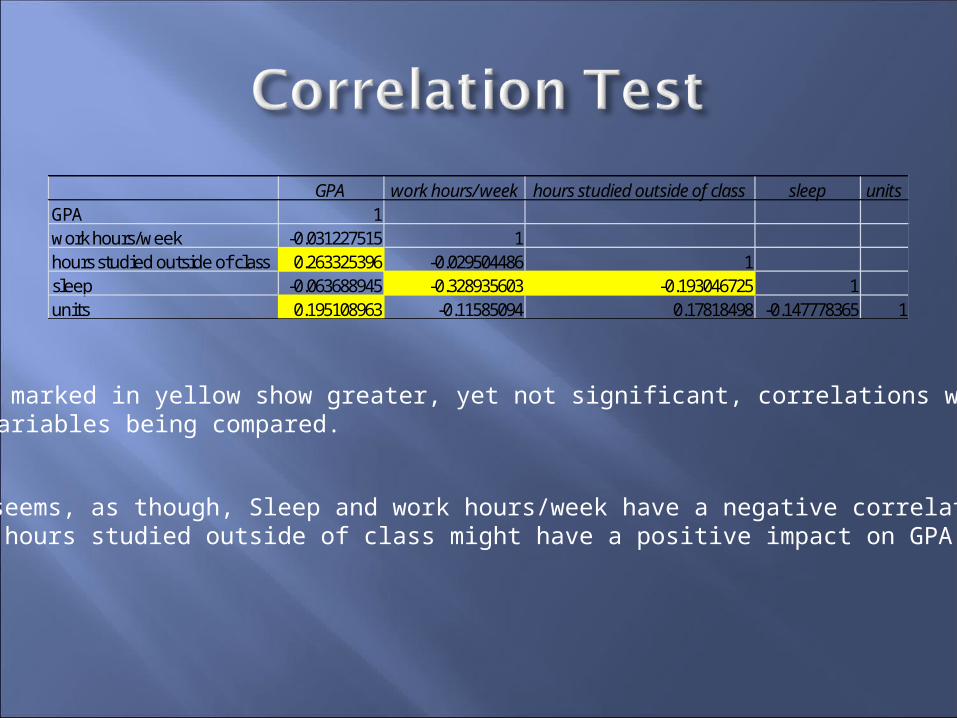
GPA work hours/week hours studied outside of class sleep unitsGPA 1work hours/week -0.031227515 1hours studied outside of class 0.263325396 -0.029504486 1sleep -0.063688945 -0.328935603 -0.193046725 1units 0.195108963 -0.11585094 0.17818498 -0.147778365 1
Boxes marked in yellow show greater, yet not significant, correlations with the variables being compared.
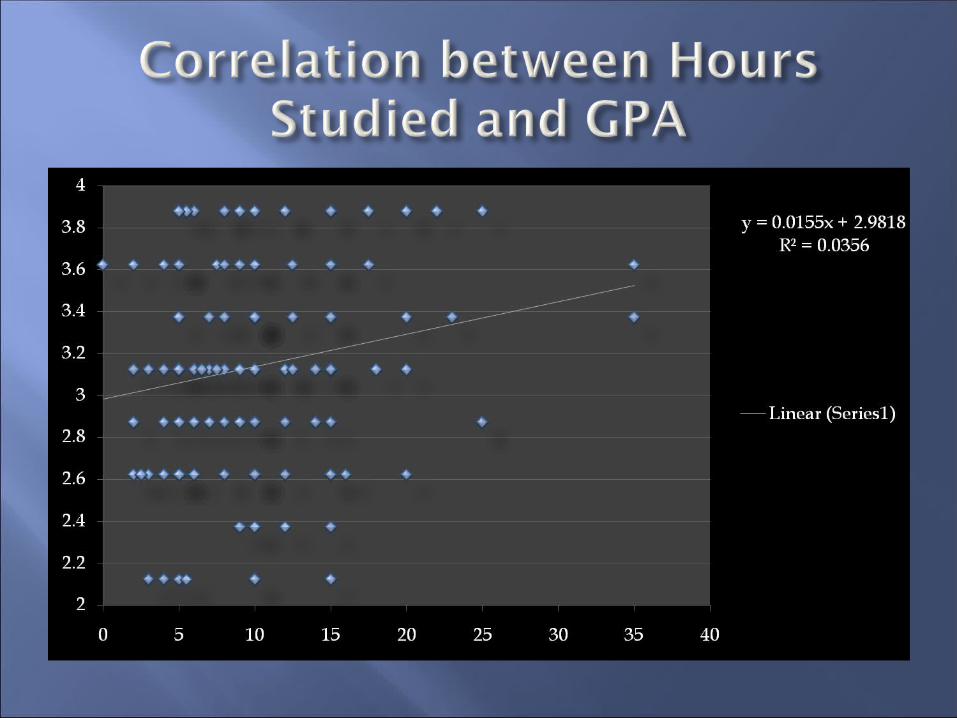
It seems, as though, Sleep and work hours/week have a negative correlation and hours studied outside of class might have a positive impact on GPA.
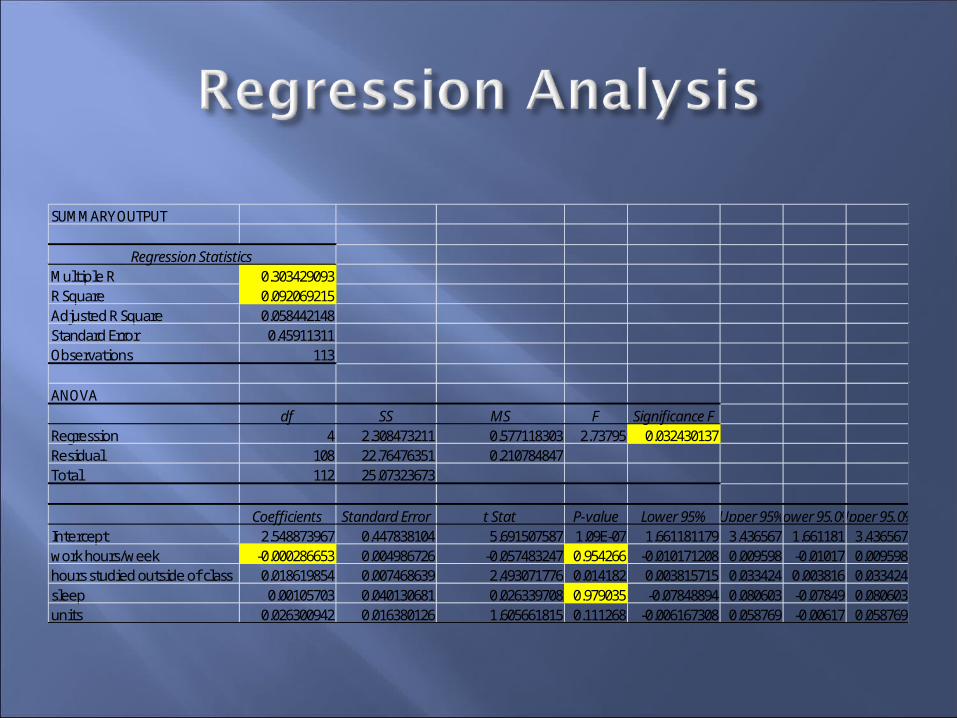
SUMMARY OUTPUT
Regression StatisticsMultiple R 0.303429093R Square 0.092069215Adjusted R Square 0.058442148Standard Error 0.45911311Observations 113
ANOVAdf SS MS F Significance F
Regression 4 2.308473211 0.577118303 2.73795 0.032430137Residual 108 22.76476351 0.210784847Total 112 25.07323673
Coefficients Standard Error t Stat P-value Lower 95% Upper 95%Lower 95.0%Upper 95.0%Intercept 2.548873967 0.447838104 5.691507587 1.09E-07 1.661181179 3.436567 1.661181 3.436567work hours/week -0.000286653 0.004986726 -0.057483247 0.954266 -0.010171208 0.009598 -0.01017 0.009598hours studied outside of class 0.018619854 0.007468639 2.493071776 0.014182 0.003815715 0.033424 0.003816 0.033424sleep 0.00105703 0.040130681 0.026339708 0.979035 -0.07848894 0.080603 -0.07849 0.080603units 0.026300942 0.016380126 1.605661815 0.111268 -0.006167308 0.058769 -0.00617 0.058769
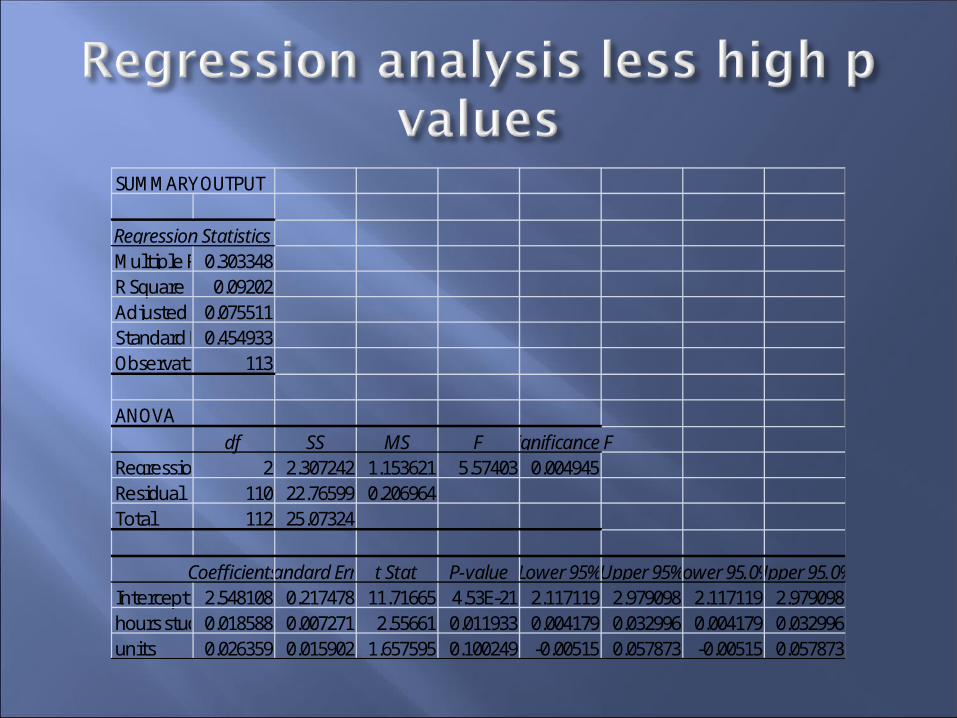
SUMMARY OUTPUT
Regression StatisticsMultiple R 0.303348R Square 0.09202Adjusted R Square0.075511Standard Error0.454933Observations 113
ANOVAdf SS MS F Significance F
Regression 2 2.307242 1.153621 5.57403 0.004945Residual 110 22.76599 0.206964Total 112 25.07324
CoefficientsStandard Error t Stat P-value Lower 95%Upper 95%Lower 95.0%Upper 95.0%Intercept 2.548108 0.217478 11.71665 4.53E-21 2.117119 2.979098 2.117119 2.979098hours studied outside of class0.018588 0.007271 2.55661 0.011933 0.004179 0.032996 0.004179 0.032996units 0.026359 0.015902 1.657595 0.100249 -0.00515 0.057873 -0.00515 0.057873
t Test for Differences in Two Means
Hypothesized Difference 0Level of Significance 0.05
Population 1 SampleSample Size 28Sample Mean 3.327Sample Standard Deviation 0.32
Population 2 SampleSample Size 113Sample Mean 3.09Sample Standard Deviation 0.6
Population 1 Sample Degrees of Freedom 27Population 2 Sample Degrees of Freedom 112Total Degrees of Freedom 139Pooled Variance 0.309963Difference in Sample Means 0.237t Test Statistic 2.016519
Upper-Tail TestUpper Critical Value 1.65589p -Value 0.022836
Reject the null hypothesis
Data
Intermediate Calculations
Sample 1: GPA (non employed)
Sample 2: GPA (employed)
Attempted to find a difference greater than 0.
Result: t-value was greater than upper critical value making us reject the null hypothesis.
Analyzed and observed:
-The difference in hours studied per week between employed and unemployed students
-The difference in hours of sleep per night between employed and unemployed students
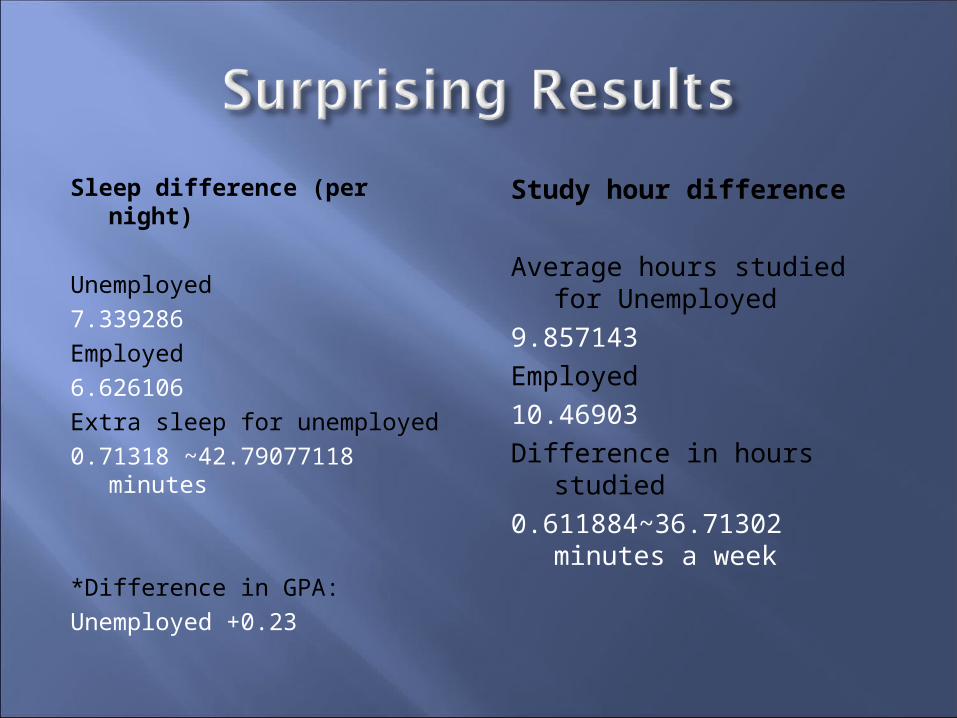
Sleep difference (per night)
Unemployed7.339286 Employed6.626106 Extra sleep for unemployed 0.71318 ~42.79077118
minutes
*Difference in GPA: Unemployed +0.23
Study hour difference
Average hours studied for Unemployed
9.857143 Employed10.46903 Difference in hours studied 0.611884~36.71302
minutes a week
With employed students studying longer per week than unemployed students, but sleeping around 45 minutes less per night, we believe that their studying is being done at the expense of their sleep.
Unemployed students have the privilege of a higher probability of studying in the day while employed students are working.
Studies have shown that studying in the day proves to be more effective than studying through the night.
Employed students:-study for more hours but are losing sleep
due to their late night studyingResult: -lower GPA due to lower functioning and
study habits that prove to be detrimental when compared to unemployed students.
After extensive research and data analysis, as a group, we believe that employed students have, on average, a lower GPA than unemployed students.
Our correlation and regression analysis doesn’t clearlydistinguish the reason for the lower GPA among employed students, yet it shows that some independent variables are more significant than others.
We recommend that employed students cut down there work hours as much as possible to help gain more study hours during the day.
This will help employed students retain information quicker when studying and invest more time into their sleep.
How many hours do you study outside of class per week?
Correction:How many hours do you study outside of
class per week?-and-At what time of day do you usually study?