Embed Size (px)
Citation preview

��
�
Study on Telescopic Walkway Design of Jetty Gangway
by
P Dhinesh Kumar A/L Panneerchelvam
Dissertation submitted in partial fulfilment of
the requirements for the
Bachelor of Engineering (Hons)
(Mechanical Engineering)
JANUARY 2009
Universiti Teknologi PETRONAS
Bandar Seri Iskandar
31750 Tronoh
Perak Darul Ridzuan

���
�
CERTIFICATION OF APPROVAL
Study on Telescopic Walkway Design of Jetty Gangway
by
P Dhinesh Kumar A/L Panneerchelvam
A project dissertation submitted to the
Mechanical Engineering Programme
Universiti Teknologi PETRONAS
in partial fulfilment of the requirement for the
BACHELOR OF ENGINEERING (Hons)
(MECHANICAL ENGINEERING)
Approved by,
_____________________
(Ir. Idris Ibrahim)
UNIVERSITI TEKNOLOGI PETRONAS
TRONOH, PERAK
January 2009

����
�
CERTIFICATION OF ORIGINALITY
This is to certify that I am responsible for the work submitted in this project, that the
original work is my own except as specified in the references and acknowledgements,
and that the original work contained herein have not been undertaken or done by
unspecified sources or persons.
___________________________________________
P DHINESH KUMAR A/L PANNEERCHELVAM

���
�
ACKNOWLEDGEMENTS
First of all, I would like to express my sincerest gratitude to my thesis
supervisor, Ir. Idris bin Ibrahim, for his warm-hearted encouragement and insightful
guidance.
I would also like to express my appreciation to Ir. Dr. Shaharin Anwar, Dr. Azmi
Wahab, Dr. Masri Baharom and Mr. Azman Zainuddin for their valuable time,
encouragements and advises.
Special thanks are particularly due to the following persons, for without their kind
generosity and support in providing me with the various technical papers and theses, it
would not have been possible for me to complete this thesis.
Mr. Anantharajah Sivalingam Esso Port Dickson Refinery
Mr. Nawawi Hussin Esso Port Dickson Refinery
Mr. K.P. Selvam Intesmal Group
Mr. Ee Hock Leong Post Shipyard & Engineering Sdn. Bhd
Dr. Ng Kee Ee Setsco Services Pte. Ltd
Last but not least, I would also like to express my sincerest gratitude to my mentor and
academic advisor, Dr. Anwar Raja, PETROTEL Malaysia, for his kind and patient
support during the years 2005 – 2007. No words can describe my utmost and profound
gratitude to him and to his family. All contributions have been most meaningful to me
and your support gave me the strength to persevere. Thank you all very much.
P Dhinesh Kumar Panneerchlvam
��
�
ABSTRACT
This project studies on the telescopic walkway design of the jetty gangway used in the
oil and gas industry jetties. The objective of the project is to conduct study on the
optimal design parameters for the telescopic walkway of gangway which suits the
operational conditions at various jetties of the oil and gas companies in the South East
Asia region. The limitations with respect to various marine terminal aspects are studied
and the drawbacks are analyzed. Besides, the tidal conditions in the South East Asia
region are surveyed to obtain the range of tidal conditions that the design must comply
with. Upon gathering data regarding the standard structural beams which are
appropriate for the design, static load analysis is done and the data is incorporated into a
Microsoft Excel worksheet. This worksheet is a primary tool to analyze different
parameters of the beams and its stress distributions. The study managed to produce
results on the shear force, bending moments, shear stress and bending stress which
would be essential to understand how telescopic beams are subjected to stress
distributions. The study on the tidal conditions on the other hand has revealed the range
of beam length that can be standardized for the South East Asia region.

���
�
TABLE OF CONTENTS
CONTENTS PAGE
PAGE TITLE …………………………………………………………...……….i
ACKNOWLEDGMENT …………………………..……………………………ii
ABSTRACT ……………………………………………………………………iii
TABLE OF CONTENTS ……………………………………………………iv-vi
LIST OF TABLES ………………………………..……………………………vii
LIST OF FIGURES ………………………...………………………………viii-ix
CHAPTER 1 – INTRODUCTION ………………………...………………….1
1.1 BACKGROUND STUDY…………………………………...………………1
1.2 PROBLEM STATEMENT ………………………………...…..……………2
1.3 OBJECTIVES ………………………………………………...……..………2
1.2 SCOPE OF STUDY ……………………………………………...………….2
�
�
CHAPTER 2 – LITERATURE REVIEW …………...……………………….4
2.1 TYPES OF SHORE BASED GANGWAYS …………………..……………6
2.2 MOBILE GANGWAY SYSTEMS……………………………….…………6
2.2.1 Conventional …………………………………………..………………..…6
2.2.2 Platform Mounted …………………………………….……………...……7
2.2.3 Carriage Mounted………………………………………………….………7
2.3 STATIONARY GANGWAY SYSTEMS…………………...………………7
2.3.1 Column mounted ………………………………………………..…………7
2.3.2 Tower Mounted………………………………………………….…………7
2.3.3 Shore Accommodation Ladder…………………………..………...………8
2.4 DESIGN OPERATING ENVELOPE………………………………………11
2.5 DESIGN CRITERIA……………………………………….………………12

����
�
2.5.1 General Design Requirements……………………………………………12
2.5.2 Load conditions...……………………………………..………….………12
2.5.3 Self weight load……………………………………….………….………12
2.5.4 Life load…………………………………………………………..………13
2.5.5 Wind load………………………………………..………………..………13
2.5.6 Earthquake load…………………………………………………...………13
2.6 MATERIALS……………………………………………………….………14
2.7 MANUEVERING AND CONTROL SYSTEMS……………….…………15
2.8 ELECTRICAL ISOLATION………………………………………………16
2.9 WELDING……………………………………………….…………………16
2.10 INSTALLATION……………………………………….…………………16
2.11 MAINTENANCE…………………………………………………………17
CHAPTER 3 – THEORY…………………………….………………………18
3.1 BENDING CAPACITY OF STEEL BEAMS ……………….……………18
3.2 SHEAR CAPACITY OF STEEL BEAMS…………………………………19
3.2.1 Convention……………………………………………….….……………21
3.2.2 Normal Convention ……………………………….…………...…………22
3.2.3 Concrete Design Convention……………………………………..………22
3.2.4 Vertical and Angled Members…………………….…….…………..……22
3.2.5 Procedure…………………………………………………………………23
3.2.6 Loading Diagram………………………………………..……………..…23
3.2.7 Calculating the Shear and Moment………………………..……………...23
3.2.8 Drawing the Shear and Moment Diagrams……………….………………24
3.2.9 Relationships between Load, Shear, and Moment Diagrams…………….25
CHAPTER 4 – METHODOLOGY …………………………….……………26

�����
�
CHAPTER 5 – RESULTS AND DISCUSSIONS...............................................28
5.1 STATIC LOADING ANALYSIS………………………………....…………28
5.2 CASE 1 - THE WALKWAYS FULLY RETRACTED………….……....…..30
5.2.1 Calculation for shear force and bending moment………….…………...…..32
5.2.2 Results of analysis on Case 1……………………………….………………33
5.3 CASE 2 - WALKWAY IS HALF-EXTENDED…………………………..…37
5.3.1 Calculation for shear force and bending moment…………………………..39
5.3.1 Results of analysis on Case 2…………………………………………...…..41
5.4 CASE 3 - WALKWAY IS THREE QUARTER – EXTENDED…………….46
5.4.1 Calculation for shear force and bending moment…………………………..47
5.4.2 Results of analysis on Case 3…………………………………….……..…..50
�
CHAPTER 6 – CONCLUSIONS AND RECOMMENDATIONS………..….60
REFERENCE……………………………………………………………………62
APPENDICES .....................................................................................................63
APPENDIX A – Types of Gangway ………………………………………..……63
APPENDIX B – Data of Tidal Conditions In South East Asia…………………..70
APPENDIX C – Microsoft Excel Worksheet For Beams Combination For
Telescopic Walkway Stress Analysis…………….………………………...…….83
APPENDIX D – ANSYS output window………………………………………...88
���
�
�
LIST OF FIGURES
FIGURE TITLE PAGE
FIGURE 2.1 Gangway used in ExxonMobil Refinery Jetty in Wakayama,
Japan…………………………………………………..………………..5
FIGURE 2.1 Gangway used in ExxonMobil Refinery Jetty in Sriracha,
Thailand………………………………………..………………………..5
FIGURE 2.1 Unsafe action taken by a jetty crew to board onto ship’s
deck………………………………………..…………………………….6
FIGURE 3.1 Load orientation on an I-beam…………………….….……………….18
FIGURE 3.2 Lateral torsional buckling……………………………………………..18
FIGURE 3.3 Restraint at support……………………………………………………19
FIGURE 3.4 Rotational end restraint………………………………...……………...19
FIGURE 3.5 Initially pure shear is developed within the unbuckled web…………..20
FIGURE 3.6 A diagonal tension field is developed when the web has
buckled…………………………………………………………..……20
FIGURE 3.7 Plastic hinges develop in the flanges which produce a
mechanism for collapse to occur………………………………...…....20
FIGURE 3.8 Normal positive shear force convention (left) and normal
bending moment convention…………………………………...……..21
FIGURE 4.1 Methodology flowchart of the project………………………………..27
FIGURE 5.1 Components of walkway included in static load analysis……….…....28
FIGURE 5.2 Orientation of the walkway when fully retracted……………..………30
FIGURE 5.3 Loads acting on individual walkways of retracted walkway…….…...31
FIGURE 5.4 Shear force variation of the telescopic walkway when the
walkway is fully retracted…………………………….………..……33
FIGURE 5.5 Bending moment variation of the telescopic walkway when the
walkway is fully retracted………………………………..……………34

��
�
FIGURE 5.6 Shear Stress variation of the telescopic walkway when the
walkway is fully retracted………………………………...………….34
FIGURE 5.7 Bending Stress variation of the telescopic walkway when the
walkway is fully retracted………………………….…………….…..35
FIGURE 5.8 Shear force variation of the main walkway when the walkway
is fully retracted……………………………………………….….….35
FIGURE 5.9 Bending moment variation of the main walkway when the
walkway is fully retracted…………………………………………....36
FIGURE 5.10 Shear stress variation of the main walkway when the walkway
is fully retracted………………………………….…………………..36
FIGURE 5.11 Bending Stress variation of the main walkway when the
walkway is fully retracted……………………………..……………..37
FIGURE 5.12 Orientation of the walkway when the walkway is half extended……37
FIGURE 5.13 Loads acting on individual walkway when the walkway
is half-extended…………………………………………………...…..38
FIGURE 5.14 Shear force variation of the telescopic walkway when the
walkway is half extended…………………….……………….……...41
FIGURE 5.15 Bending moment variation of the telescopic walkway
when the walkway is half extended……………………….………….42
FIGURE 5.16 Bending stress variation of the telescopic walkway when the
walkway is half extended……………………………………….……42
FIGURE 5.17 Shear stress variation of the telescopic walkway when the
walkway is half extended…………………………………………….43
FIGURE 5.18 Shear force variation of the main walkway when the walkway
is half extended………………………………………………………43
FIGURE 5.19 Bending moment variation of the main walkway when the
walkway is half extended…………………………….……………….44
FIGURE 5.20 Bending stress variation of the main walkway when the walkway
is half extended…………………………………….………………...44
FIGURE 5.21 Shear stress variation of the main walkway when the
walkway is half extended………………………….………………....45

���
�
FIGURE 5.22 Orientation of the walkway when the walkway is
three-quarter extended…………………………….……………..…..46
FIGURE 5.23 Loads acting on the walkway when the walkway is
three-quarter extended………………………………..………………46
FIGURE 5.24 Shear force variation of the telescopic walkway when the
walkway is three quarter extended…………………….………….….50
FIGURE 5.25 Shear force variation of the telescopic walkway when
the walkway is three quarter extended………………….……………50
FIGURE 5.26 Shear force variation of the telescopic walkway when the
walkway is three quarter extended……………………….…………..51
FIGURE 5.27 Shear force variation of the telescopic walkway when the
walkway is three quarter extended……………………………………51
FIGURE 5.28 Shear force variation of the telescopic walkway when the
walkway is three quarter extended……………………...……….……52
FIGURE 5.29 Shear force variation of the telescopic walkway when the
walkway is three quarter extended…………………………....………52
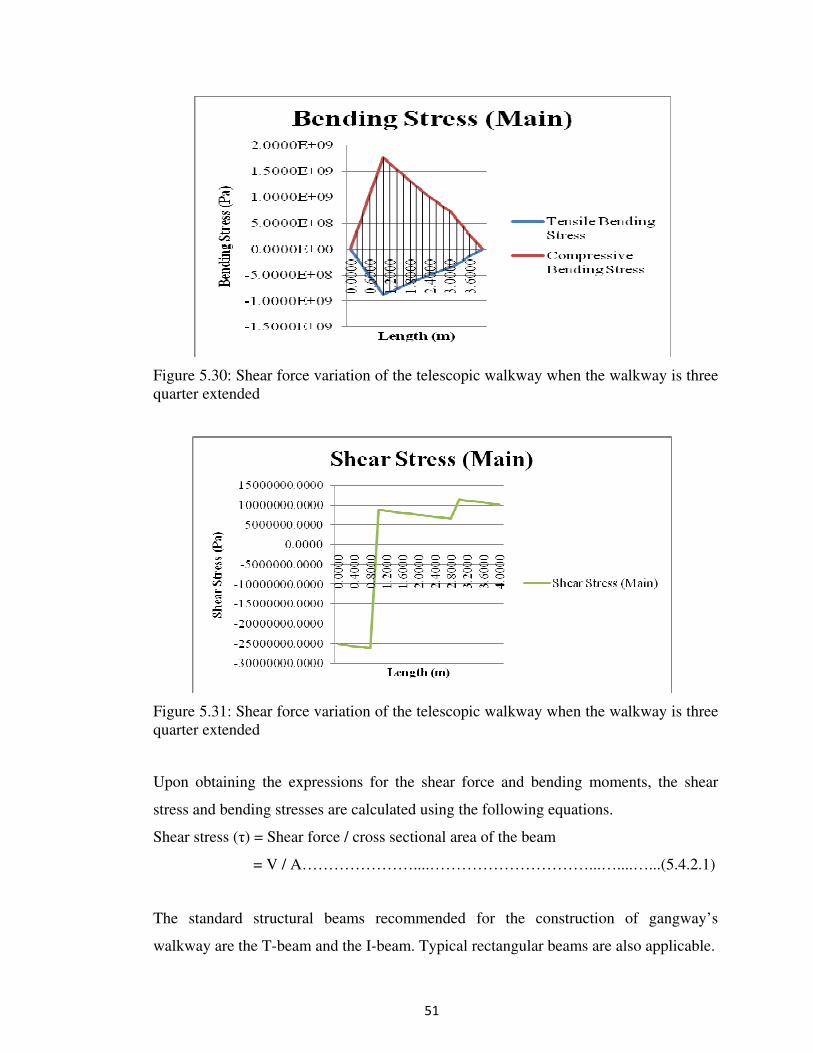
FIGURE 5.30 Shear force variation of the telescopic walkway when the
walkway is three quarter extended…………………….………...……53
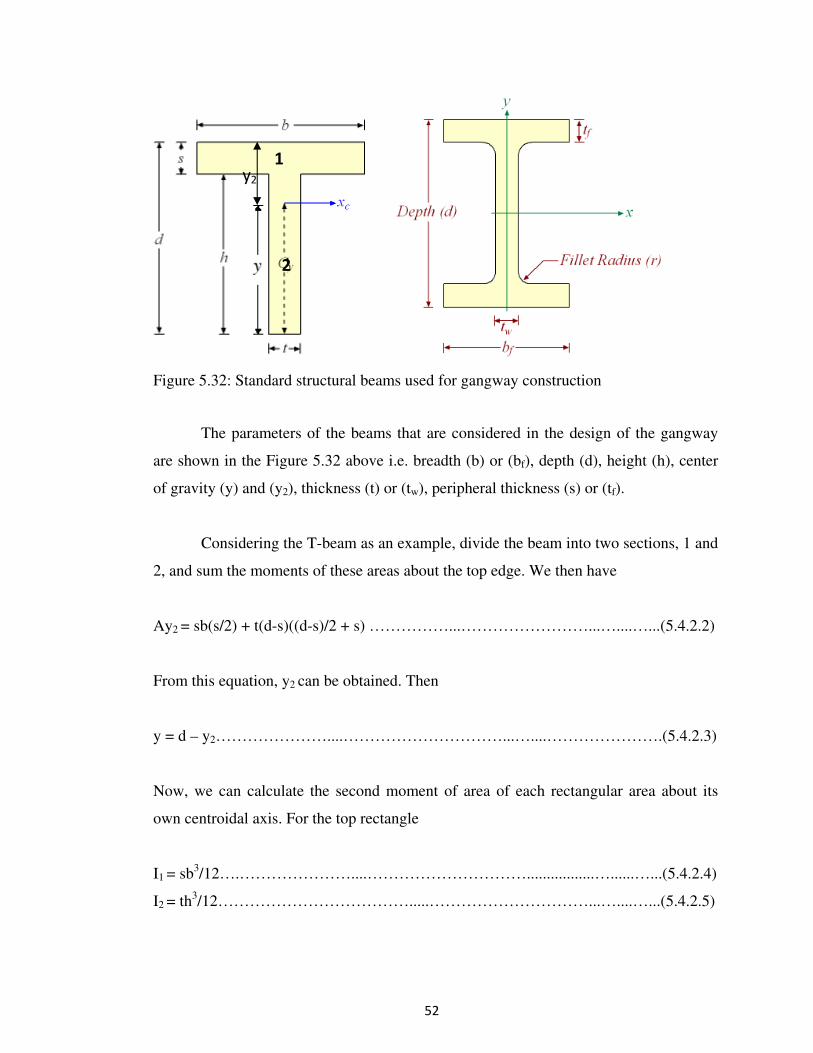
FIGURE 5.31 Shear force variation of the telescopic walkway when the
walkway is three quarter extended……………………..………….….53
FIGURE 5.32 Standard structural beams used for gangway construction…………...54
FIGURE 5.33 Microsoft Excel worksheet for studying the standard
structural beams …………………………………………….….……56
FIGURE 5.34 Parameters used for the validation of the Excel worksheet….….……57
FIGURE 5.35 Meshing diagram of the T-beam……………………………………..57
FIGURE 5.36 Stress variation on the T-beam……………………………...………..58
FIGURE 5.37 Illustration of deck elevations with respect to design vessel size….…59

����
�
LIST OF TABLES
TABLE TITLE PAGE
TABLE 2.1 Lists of the various types of gangway systems, the range of
vessel sizes they can typical accommodate, and their advantages
and disadvantages…………………………………………..…….……10
TABLE 2.2 Types of gangway loads…………………………………….…………12
TABLE 5.1 Vessel depth, draft and deck elevation in South East Asia seas……....58
TABLE B-1 High and low tide levels for Cendering ………………….……………72
TABLE B-2 High and low tide levels for Geting ………………………...…………72
TABLE B-3 High and low tide levels for Johor Bahru …………………..…………73
TABLE B-4 High and low tide levels for Kota Kinabalu …………………..………73
TABLE B-5 High and low tide levels for Kudat ……………………………………74
TABLE B-6 High and low tide levels for Kukup……………………………………74
TABLE B-7 High and low tide levels for Labuan……………………………...……75
TABLE B-8 High and low tide levels for Lahad Datu ……………………..………75
TABLE B-9 High and low tide levels for Langkawi ………………………….……76
TABLE B-10 High and low tide levels for Lumut ………………………..…………76
TABLE B-11 High and low tide levels for Miri …………………………….………77
TABLE B-12 High and low tide levels for Pelabuhan Kelang …………...…………77
TABLE B-13 High and low tide levels for Pulau Lakei …………….………………78
TABLE B-14 High and low tide levels for Pulau Pinang ……………...……………78

�����
�
TABLE B-15 High and low tide levels for Pulau Tioman …………………….……79
TABLE B-16 High and low tide levels for Sandakan ……………………………….79
TABLE B-17 High and low tide levels for Sejingkat ………………………….……80
TABLE B-18 High and low tide levels for Tanjung Gelang ……………..…………80
TABLE B-19 High and low tide levels for Tanjung Keling …………...……………81
TABLE B-20 High and low tide levels for Tanjung Sedili ……………….…………81
TABLE B-21 High and low tide levels for Tawau…………………………………..82

��
�
CHAPTER 1
INTRODUCTION
1.1 BACKGROUND STUDY
Marine terminal operations require that shore personnel periodically board
vessels at their terminal. For example, after the vessel first moors, the berth operator or
another appropriate shore representative boards the vessel to complete a ship/shore
safety checklist and to conduct a pre-cargo transfer conference. While the vessel is at
the berth, shore personnel will periodically board the vessel to recheck certain items on
the ship/shore safety checklist. Shore personnel also are typically involved in measuring
and sampling the vessel's cargo tanks at certain times in the cargo transfer procedure.
Either a ship mounted or shore based gangway can be used to provide a means for
personnel to pass between a moored ship and the deck of a conventional pier or sea
island. Every ship will have some form of gangway. Larger vessels, normally those
above 10,000 dwt, will have a permanently mounted, power operated gangway. Smaller
vessels and barges may only carry a manual gangway.
However, ship gangway systems can be operationally limited due to design,
damage, equipment malfunction, or space limitations on the berth deck to land the
gangway. In addition, local tidal conditions or the overall pier layout may restrict the
use of the ship's gangway.
�
1.2 PROBLEM STATEMENT
Many jetties of the oil and gas (O&G) industries are facing challenges in
operating the gangways which are used by berth personnel, ship crews and technicians
��
�
to get on board and off board of the anchoring tankers. The existing gangway designs
have limited ability to fulfill the operational requirements of the jetties. These designs
are only functional for a narrow size range of ships at berth. In addition, the existing
gangway designs also pose hazard for the berth personnel when the gangway is in use.
1.3 OBJECTIVES
The objective of this project is to conduct a study on the design of the telescopic
walkway of a gangway that suits most of the operational conditions of the jetties and
applicable to a wide range of jetty parameters as well as tidal conditions. This project
therefore, aims to conduct study on the static load analysis which provides insightful
design parameters for the development of detailed design of a jetty gangway. This study
also aims to provide sufficient information to configure ultimate solution to the
shortcomings faced by the O & G companies, berth personnel and ship crews.
Furthermore, the study is aimed to be beneficial for the future studies and development
of telescopic walkway designs.
1.4 SCOPE OF STUDY
The study on gangways may vary from one region to another. This is because,
different parts of the world has different sea conditions, wind speed, tidal condition and
operating envelope. Therefore, in this project, the scope of study of the jetty gangway
design has been narrowed down to the South East Asian region. This means that the
study on the telescopic walkway of this project will account for the operating conditions
of oil and gas industry jetties around the South East Asia region. Thus, tidal conditions
and wind speed in this region will be studied to aid the designing process. Engineering
analysis is done for the static loading conditions to study the shear force, bending
moments, shear stress and bending stress distribution. The ANSYS software is used to
conduct stress analysis apart from the conventional stress calculation method.

��
�
CHAPTER 2
LITERATURE REVIEW
The gangway is a bridge-like structure used at berth to access the ship’s deck
from the jetty and vice versa. The present invention relates to a so-called gangway that
is particularly suited for embarking on ships that have to dock on a floating pontoon
such as used, for example in seaports, where the tidal currents cause noticeable
differences in the level of the pontoon in relation to the wall of the jetty.
The gangway is comprised of two parallel sides, on which steps are arranged
with a defined spacing from each other, and on which handrails are movably hinged on
both sides on a railing. The handrails and the sides form a parallelogram with each
inclination and the sides each are supported at the lower end on a roller and rotatable
base secured at the upper ends. The trapezoidal steps are flexibly suspended with
spacing from the sites in which the sides are secured. It was found that said known
gangway is afflicted with the drawback that the runners, which are secured on the
undersides of the sides, have the same track width as the sides over the full length. This
may cause damage to the stairway, which, under normal operating conditions,
compensates listings of the pontoon of up to 12° when listings of the pontoon in excess
of 6° occur at high tide.
Many small jetties in the Asia pacific region are facing obstacles in operating
their shore based (stationary) gangways due to certain limitations. The limitations vary
from one jetty to another and are illustrated in the following diagrams:

��
�
Figure 2.1: Gangway used in ExxonMobil Refinery Jetty in Wakayama, Japan
[Courtesy of Esso Port Dickson Refinery]
Figure 2.2: Gangway used in ExxonMobil Refinery Jetty in Sriracha, Thailand
[Courtesy of Esso Port Dickson Refinery]

�
�
Figure 2.3: Unsafe action taken by a jetty crew to board onto ship’s deck
[Courtesy of Esso Port Dickson Refinery]
2.1 TYPES OF SHORE BASED GANGWAYS
Shore gangway systems can generally fall into one of two categories depending
on how the onshore end of the gangway is fixed to the berth: "mobile systems" and
"stationary gangway systems". Brief descriptions of each type of system are given
below.
2.2 MOBILE GANGWAY SYSTEMS
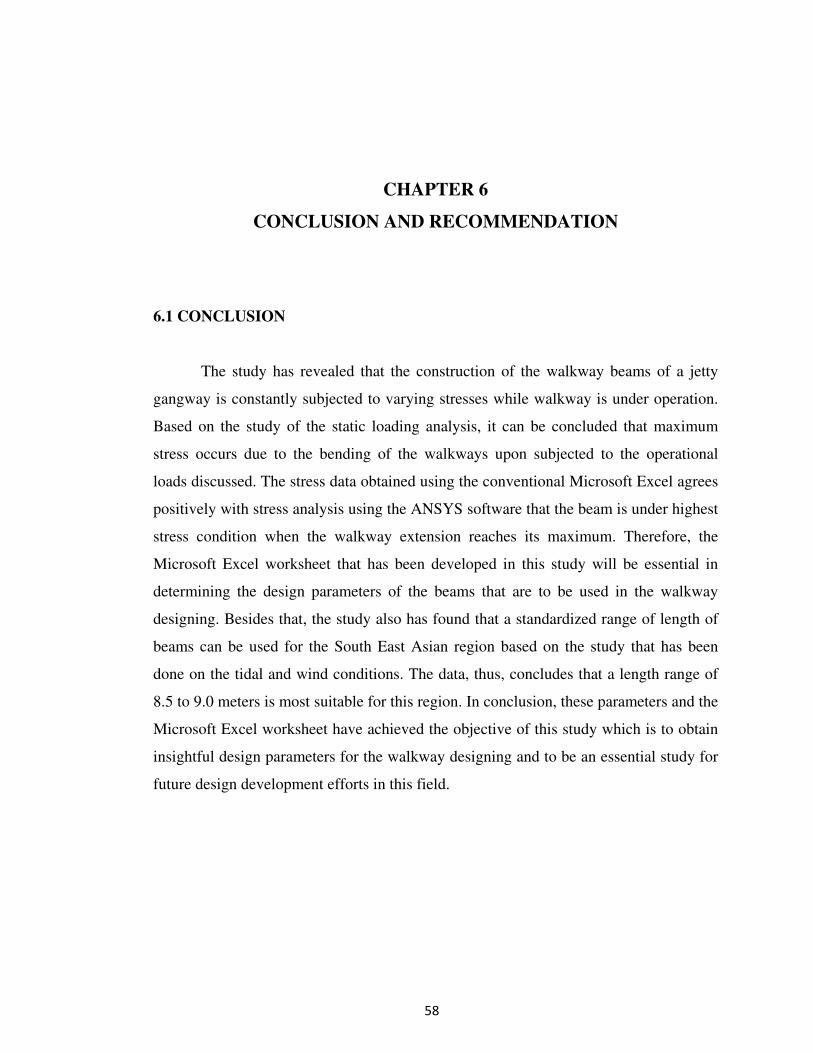
2.2.1 Conventional
The simplest type of gangway system, consisting of a fixed length walkway with
handrails and wheels or a roller on the shore end with wheels or gunwale clips at the
ship end. This gangway moved about manually or with the assistance of a shore crane.
�
�
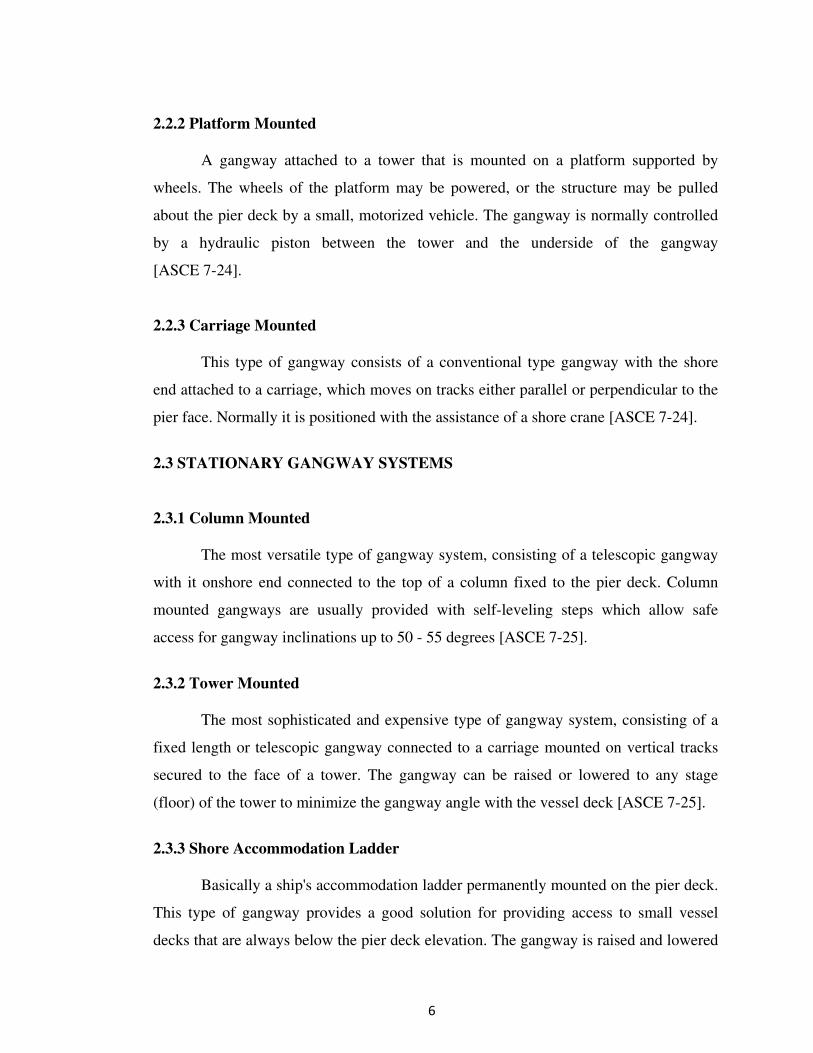
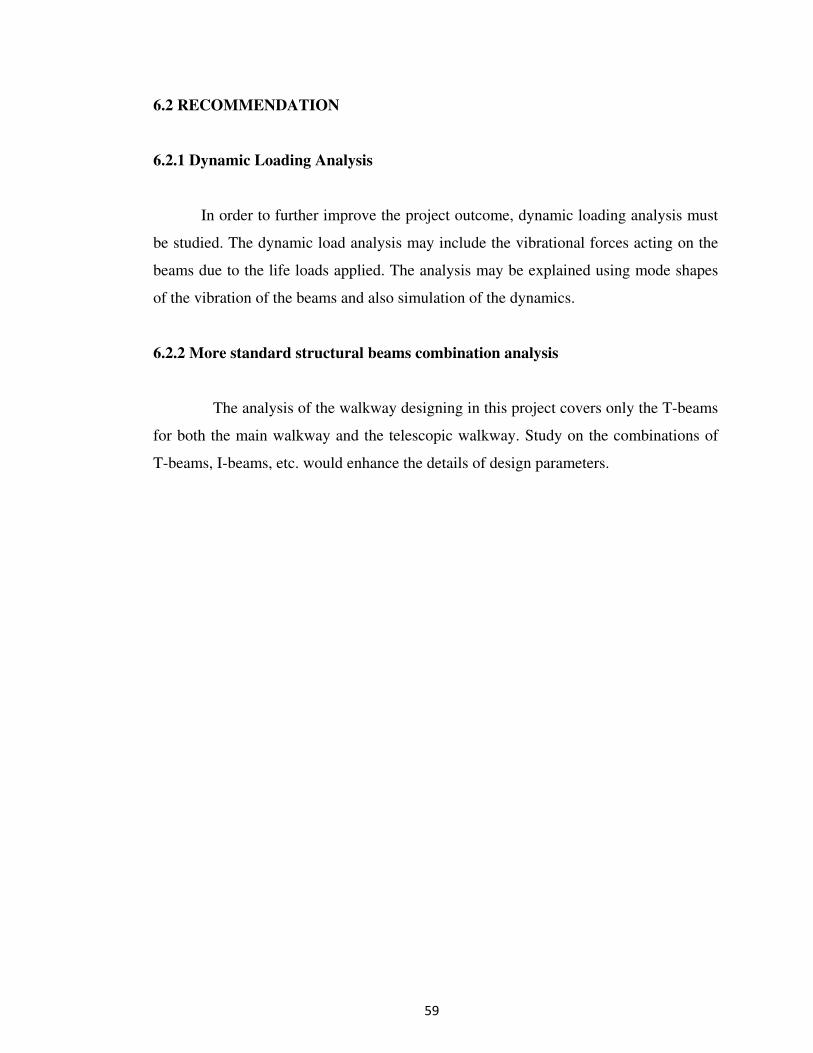
2.2.2 Platform Mounted
A gangway attached to a tower that is mounted on a platform supported by
wheels. The wheels of the platform may be powered, or the structure may be pulled
about the pier deck by a small, motorized vehicle. The gangway is normally controlled
by a hydraulic piston between the tower and the underside of the gangway
[ASCE 7-24].
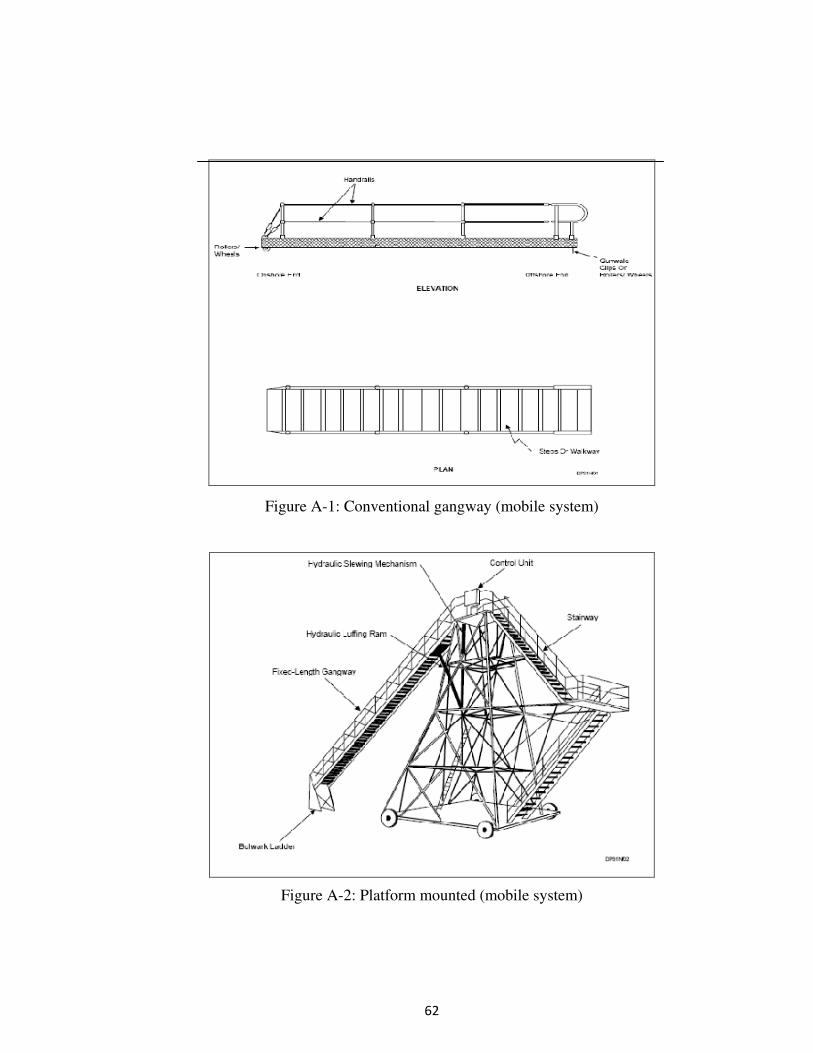
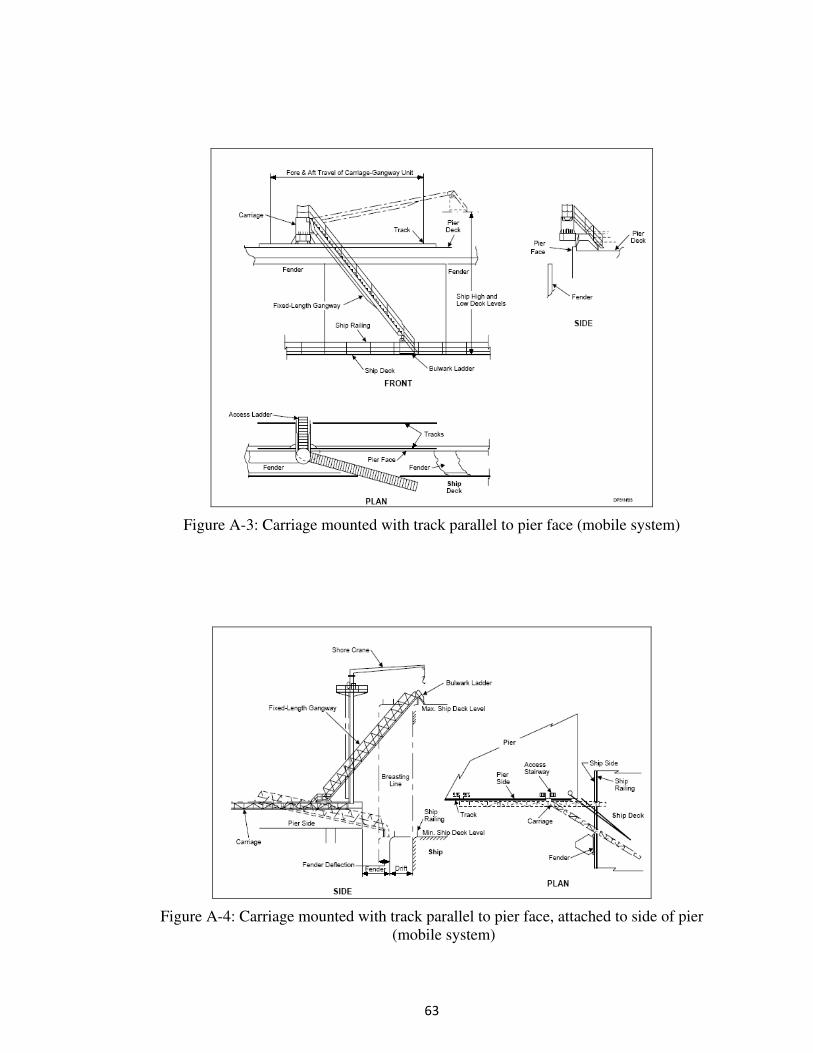
2.2.3 Carriage Mounted
This type of gangway consists of a conventional type gangway with the shore
end attached to a carriage, which moves on tracks either parallel or perpendicular to the
pier face. Normally it is positioned with the assistance of a shore crane [ASCE 7-24].
2.3 STATIONARY GANGWAY SYSTEMS
2.3.1 Column Mounted
The most versatile type of gangway system, consisting of a telescopic gangway
with it onshore end connected to the top of a column fixed to the pier deck. Column
mounted gangways are usually provided with self-leveling steps which allow safe
access for gangway inclinations up to 50 - 55 degrees [ASCE 7-25].
2.3.2 Tower Mounted
The most sophisticated and expensive type of gangway system, consisting of a
fixed length or telescopic gangway connected to a carriage mounted on vertical tracks
secured to the face of a tower. The gangway can be raised or lowered to any stage
(floor) of the tower to minimize the gangway angle with the vessel deck [ASCE 7-25].
2.3.3 Shore Accommodation Ladder
Basically a ship's accommodation ladder permanently mounted on the pier deck.
This type of gangway provides a good solution for providing access to small vessel
decks that are always below the pier deck elevation. The gangway is raised and lowered

��
�
by its own motorized derrick. This system is unique in that the ship end does not
actually sit on the vessel deck. Rather it is held alongside the vessel at the proper
elevation by the gangway derrick. The operator must be periodically reposition the
gangway as the vessel changes draft or the tide changes the vessel deck elevation
relative to the pier deck [ASCE 7-25].
.
Ship/shore access for smaller vessels can be more complex, sometimes requiring
that two separate gangways be provided, one for use when the vessel deck is below the
pier deck, and one for use when the vessel deck is above the pier deck. In this case, a
conventional gangway may be specified for use when the vessel deck is at or above the
pier deck, and a shore accommodation type gangway installed for use when the vessel
deck is below the pier deck. For locations where there is negligible tidal range (an
infrequent occurrence), a small column mounted gangway can be used for vessels less
than 10 kdwt [ASCE 7-27].
When selecting a gangway for existing facilities, the space available and the
load carrying capacity of the pier deck are the most significant factors affecting the
choice of gangway. Detailed drawings of the pier should be provided to the vendor
illustrating the open areas on the pier for locating a shore-based gangway. A vendor
may be able to use existing structures and equipment on the pier deck, such as a hose
tower or shore crane, in the gangway design. The dimensions, locations on the pier, and
design load capacities of such structures and equipment should be given to the vendor.
The use of existing structures or equipment may lower the total investment cost for a
gangway. However, checks must be made to insure that the existing structures or
equipment have adequate capacity for the additional loads imposed by the gangway
[ASCE 7-27

��
�
Table 2.1: Lists of the various types of gangway systems, the range of vessel sizes they can typical accommodate, and their
advantages and disadvantages. [Based on American Society of Civil Engineers Code 7-30]

�
�
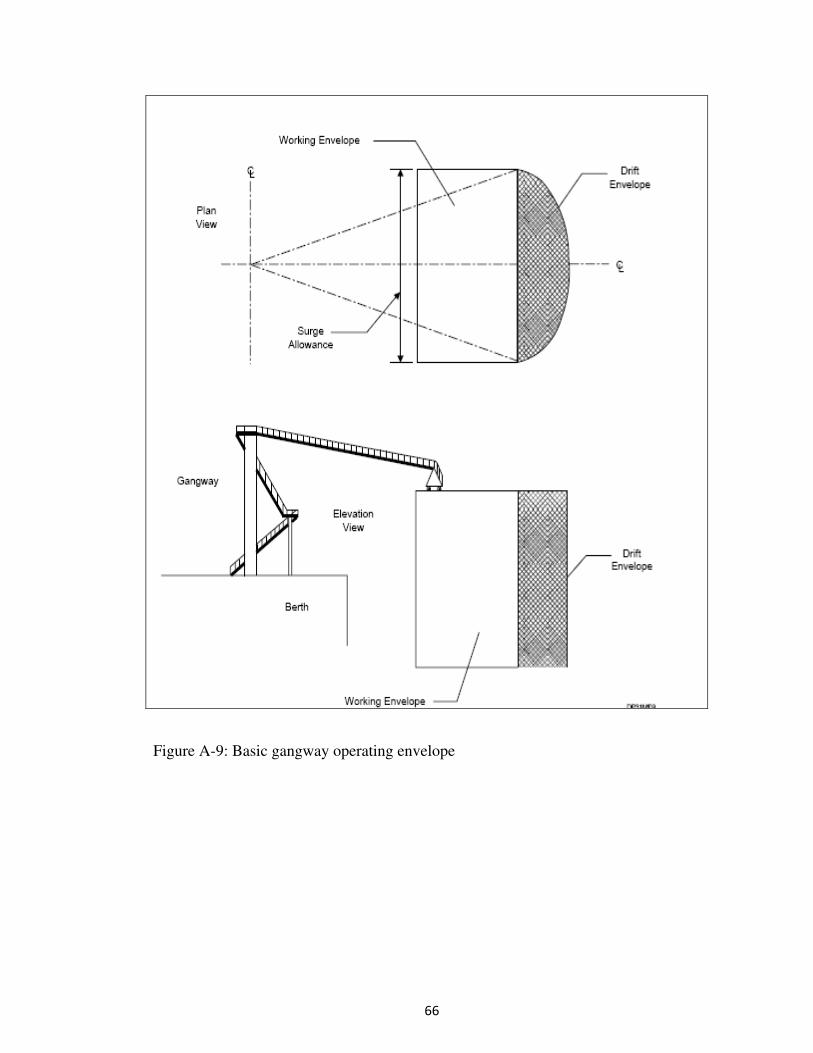
2.4 DESIGN OF OPERATING ENVELOPE
The operating envelope of a gangway significantly influences the type and
design of gangway that might be proposed by a vendor. A shore-based gangway
operating envelope is defined as that volume in space within which the ship's end of the
gangway must be able to operate. At all positions within the envelope, the gangway
must clear the ship's rail. The operating envelope takes into consideration the maximum
and minimum freeboard of the maximum and minimum sized ship (based on tidal
variations and changes in ship draft), as well as a safety allowance for ship surge along
the pier face and drift away from the pier.
A basic gangway operating envelope is shown in APPENDIX A. The specific
information that defines the operating envelope is shown in APPENDIX A. If a shore
accommodation ladder is used, only the upper and lower bounds of the envelope need
be considered, as this type of gangway does not actually cross over the ship's rail. Refer
to APPENDIX A for the types of gangway.
The height of the berth platform deck above low, low water, fender depth, and
water level elevations should be readily available from the berth elevation drawings or
can be requested directly from the operating affiliate. The height of the ship's rail is
normally taken as 1.2 meters and is not normally a function of ship size. Gangway drift
allowance is normally taken as 3 m (10 ft) in all directions (off the berth and both
forward and aft surge along the berth).The gangway operating allowance is dependent
on the size of the vessel and can vary significantly from one vessel size to another. It is
important to discuss this variable with the operating affiliate and the operating affiliate's
marine depart [BS BSI MA 78 – 15].

���
�
2.5 DESIGN CRITERIA
2.5.1 General Design Requirements
Gangways must provide safe footing at all operating inclinations. Generally,
gangways should not be used at angles of inclination greater than 35 degrees. At sites
that require a greater angle of inclination than 35 degrees, a powered gangway with
"self-leveling steps" should be provided [ASCE 7-28].
All gangways should meet the following general design criteria:
a. Minimum walkway width of 2 ft (0.6 m) for gangways less than 13 ft (4 m) in length
and 3.2 ft (1 m) width for longer gangways.
b. Continuous handrail height of 3.9 ft (1.2 m), including the "step-down" from the
gangway walkway to the vessel deck (if provided).
c. Store behind deflected fender face.
d. Designed for a specified operating envelope.
2.5.2 Load Conditions
There are four load sources that must be considered in the design of a marine
gangway. The basis for the selection of these loads must be developed during the design
basis memorandum or design specification preparation phase of a project [ASCE 7-34].
Table 2.2: Types of gangway loads
2.5.3 Self-Weight Load
Self-Weight Load is the gravity loading acting on the mass of the individual
components and members that make up the complete gangway. For gangways to be
Type of load Abbreviation
Self-weight-load DL
Life load LL
Wind load WL
Earthquake load EL

���
�
installed in locations that experience ambient temperatures below freezing, the self
weight load should include a specified ice build up (ice specific gravity = 0.80) of at
least 1 inch (2.5 mm). For arms to be installed in areas of especially severe cold weather
conditions, additional ice build up may be specified after consultation with the
operating affiliate or local project team [ASCE 7-34].
.
2.5.4 Live Load
Live loading (personnel using the gangway) only applies to the operating load
condition. All gangway walkways should be designed for a minimum operating load of
2.4 kN/m. Handrails should be designed for a load of 1.2 kN/m [ASCE 7-34].
.
2.5.5 Wind Load
Wind load is the air pressure due to wind acting on the surface of the gangway
(including any ice build-up). The wind pressures should be based on the calculation
procedures in and ASCE 7, Minimum Design Loads for Buildings and Other Structures.
Wind loading is based on the design wind (fastest mile wind speed) which has
been established for the site. The magnitude of the wind pressure also depends on the
surface roughness and topography of the site, and the geometric shape and height of the
gangway. These design wind speeds are applicable only when the gangway is in the
stored position.
The maximum wind speed for the gangway in the operating condition
(maneuvering or resting on the ship's deck) is 56 mph (25 m/sec). However, in all cases
the operating wind speed should be higher than the mooring system wind limit to ensure
the safety of shore personnel who may need to board the vessel to disconnect loading
arms or hoses in high wind conditions.

���
�
2.5.6 Earthquake Load
Earthquake Load is the load generated due to rapid horizontal motions of the
gangway structure base due to ground movement in an earthquake. The magnitude of
earthquake for which the gangway must be designed is described in terms of a Seismic
Coefficient. Offsite Design Practice, Seismic Design should be consulted to determine
the appropriate Seismic Coefficient to specify in the marine loading arm design
specification
2.6 MATERIALS
Gangways may be constructed in steel, aluminum, or a combination of steel and
aluminum. Usual practice is to construct manual gangways entirely from aluminum.
Aluminum manual gangways designed for small vessels are often light enough to be
handled by one or two men. Aluminum extrusions for gangway structures shall be
aluminum alloy 6061-T6, 6063-T5 and 6063-T6 and the stainless steel fasteners shall be
grade 304 [Federal Specification QQ-A-200].
Rollers used at the end of the gangway shall be ultra high molecular weight
polyethylene (UHMW) with black ultra violet light inhibitor added. Manual gangways
constructed in steel are acceptable, but are usually too heavy to be moved by hand, and
therefore often require a crane to maneuver them onto or off of a vessel.
Powered gangway support structures are usually constructed in steel, with the
walkway from the support structure to the ship constructed in aluminum to minimize
the gravity loading applied to the support structure and the size of the hydraulic control
system required to maneuver the walkway to and from the vessel. Where steel and
aluminum is used in combination, special care must be taken at the interface of the two
materials to avoid the potential for "galvanic" corrosion.

���
�
2.7 MANEUVERING AND CONTROL SYSTEMS
Powered gangways may be maneuvered by a variety of means. Both column
mounted gangways and tower mounted gangways are classified as stationary systems.
Only the actual walkway to the ship is maneuvered. The walkway of a column mounted
gangway is normally maneuvered with large diameter hydraulic pistons. The walkway
of a tower mounted gangway uses a system of winches and lifting cables. The winches
are often electrically driven, but may be hydraulic or air driven. Mobile gangway
systems, such as a platform mounted gangway, normally have less sophisticated
maneuvering and control systems. A typical platform mounted gangway is moved about
the berth deck by a small, motorized vehicle such as a "fort lift" truck. Alternatively,
platform mounted gangways have been provided with electrically driven wheels.
Control systems for powered gangways may be either electro-hydraulic or
totally hydraulic. Electro-hydraulic systems are more expensive but provide more
reliability and less maintenance. Powered gangways should provide for control of all
motions of the gangway (luffing, slewing, telescoping, and transversing). To provide an
adequate factor of safety, the hydraulic components of the gangway maneuvering and
control system should be sized taking into account accelerative loads and 110% of the
operating design wind load [ASCE 7 – 44].
The hydraulic cylinders shall be fed by several hydraulic pumps to guarantee
100% operation Hydraulic lift cylinders shall be designed in compliance with Det
Norske Veritas (DNV) standards. Limit switches can be attached to the PLC, warning
light or traffic gate. This simple yet effective device warns operators that the gangway
is out of the stored locked position, preventing drive-offs with the equipment down on
vehicles and damage during rail switches.

���
�
2.8 ELECTRICAL ISOLATION
The underside of aluminum gangways should be protected with a hard plastic or
wooden strip to prevent the gangway from becoming an electrical path between the ship
and shore. If wheels are fitted at one end of the gangway, they should be made of a non-
conductive material such as hard rubber.
Aluminum is an excellent conductor of electricity. It is important to prevent an
electrical path through the gangway to avoid potential sparking when setting or
removing the gangway from the ship. An electrical connection between the ship and the
shore can also cause a large drain on the terminal's cathodic protection system. In
addition to the above, aluminum equipment dragged or rubbed across rusty steel may
leave a smear. If a dropped steel object, such as a tool for example, strikes this smear,
an incendive spark can be generated.
2.9 WELDING
All connections to be welded shall be of new material, clean and free of any
contaminants. All joints shall fit properly and be prepared for the appropriate weld as
described in the shop drawings. All welding shall be performed by currently certified
welders, per AWS D1.2- 97' for structural aluminum and per AWS D1.1-2000 for
structural Steel. Welder’s proof of certification shall be provided upon request. Weld
procedure qualifications shall be kept on file.
2.10 INSTALLATION
The gangway shall be installed on the floating dock and the toe end adjusted as
to allow the dock system free movement to travel the full range of water levels without
binding or stressing the gangway or dock system. The gangway roller guide tracks shall
be adjusted to suit the full range of lateral movement of the rollers and shall be
��
�
adequately secured to the dock surface. The gangway shore mount shall be installed as
per the project specifications.
2.11 MAINTENANCE
All machinery requires periodic maintenance to ensure safe operation. By using
only the best materials and components, together with intelligent design and
maintenance training, the level of maintenance is reduced
�
�
�
�
�
�
�
�
�
�
�
�
�
�
�
�
�
�
�
�
�
�
�

��
�
�
�
�
CHAPTER 3
THEORY
3.1 BENDING CAPACITY OF STEEL BEAMS
Beams in bending develop tension and compression in their flanges. The
bending capacity of the beam is limited by how much force can be carried by each
flange.
Figure 3.1: Load orientation on an I-beam
The tension flange acts like the string in an archer's bow and the maximum force
that can be developed is limited only by the yield stress of the flange material.
The compression flange acts like a strut and is susceptible to buckling before yield
stress can be developed. Unless the compression flange is fully restrained then the beam
may fail by lateral torsional buckling.
Figure 3.2: Lateral torsional buckling.

���
�
All beams to be restrained at their supports [BSI 78 - Clause 9.6.1].
The restraint is required to hold the compression flange in place and is usually provided
at the support by use of the bearing stiffeners and a suitable bearing [BSI 78 - Clause
9.12.5].
Figure 3.3: Restraint at support
The design procedure for checking a beam section is:
Determine the effective length (le) based on the support condition of the
compression flange. The compression flange must be supported laterally at the beams'
supports. This ensures that the compression flange can be assumed to have at least a
pinned end support so the maximum stiffness, k1 that may be assumed is 1.0 for non-
cantilever beams. If end diaphragms are provided to prevent the compression flange
from rotating in plan then a smaller value of k1 can be used. [BSI 78 - Clause 9.6.2].
Figure 3.4: Rotational end restraint
3.2 SHEAR CAPACITY OF STEEL BEAMS
The beams must be designed to fail at Ultimate Limit State.
Shear failure of a beam, with transverse web stiffeners, develops in three stages:

���
�
Figure 3.5: Stage1- Initially pure shear is developed within the unbuckled web.
Figure 3.6: Stage2 - A diagonal tension field is developed when the web has buckled.
Figure 3.7: Stage3 - Plastic hinges develop in the flanges which produce a mechanism
for collapse to occur.
When the web buckles, at the limit of stage 1, the diagonal compressive stress
in the web is assumed to be at its maximum. The diagonal tensile stress is usually far
from its maximum at this stage. If transverse web stiffeners are provided, then the
beam can carry additional load by truss action. The web forms the tie members of the
truss (with its spare tensile capacity), whilst the transverse stiffeners form the strut
members.
The top and bottom flanges act as the top and bottom chords of the truss.
Bending of these members is increased as the tension in the web increases. Failure
occurs when plastic hinges form in the flanges to produce a mechanism (stage 3). The
term mfw in the graphs represents the plastic moment of resistance of the flanges.

� �
�
Shear and bending moment diagrams are analytical tools used in conjunction
with structural analysis to help perform structural design by determining the value of
shear force and bending moment at a given point of an element. Using these diagrams
the type and size of a member of a given material can be easily determined. Another
application of shear and moment diagrams is that the deflection can be easily
determined using either the moment area method or the conjugate beam method.
3.2.1 Normal Convention
The normal convention used in most engineering applications is to label a
positive shear force one that spins an element clockwise (up on the left, and down on
the right). Likewise the normal convention for a positive bending moment is to warp the
element in a "u" shape manner (Clockwise on the left and counterclockwise on the
right).
Figure 3.8: Normal positive shear force convention (left) and normal bending moment
convention (right).
This convention was selected to simplify the analysis of beams. Since a
horizontal member is usually analyzed from left to right and positive in the vertical
direction is normally taken to be up, the positive shear convention was chosen to be up
from the left, and to make all drawings consistent down from the right. The positive
bending convention was chosen such that a positive shear force would tend to create a
positive moment.
���
�
3.2.2 Concrete Design Convention
An exception to using the normal convention is used when designing concrete
structures. Since concrete is weak in tension the most important part of designing a
member with a high bending moment is to show whether the top or bottom of the
concrete member is in tension. Because of this the positive moment diagram is always
drawn such that the tension on top is defined to be positive. This is opposite of the
normal convention. The shear convention for reinforced concrete remains the same as
the normal convention.
3.2.3 Vertical and Angled Members
For vertical members deciding the convention is to start from the bottom and
move up in the same way that horizontal members start from the left and move to the
right. In this way a force pushing to the left from the bottom will inspire a positive shear
moment which will also be drawn to the left. For angled members if there is a conflict
of interest between the normal convention and the vertical convention most often an
engineer will follow the normal or horizontal reaction but either can be followed and the
engineer should make note of which convention they are following. For concrete in
either vertical or angled members the shear diagrams are drawn as stated above but the
moment diagram should be drawn to show which side the tension of the member will be
on.
3.2.4 Procedure
There are three major steps to constructing the shear and moment diagrams. The
first is to construct a loading diagram, the second is to calculate the shear force and the
bending moment as a function of the position of the beam, and the third is to draw the
shear and moment diagrams.

���
�
3.2.5 Loading Diagram
A loading diagram shows all loads applied to the beam which includes the
service loads as well as the reaction loads. The service loads are loads put on the
building during its use these include dead, live, roof live, snow, wind, earthquake, and
other types of load. In practice these loads are factored in a way such that they place the
maximum reasonable stresses on a structure. From the service loads and the structural
configuration the reaction loads can be determined using one several structural analysis
methods including finite element method and static analysis. Once the reaction loads
have been determined the loading diagram can be drawn.
3.2.6 Calculating the Shear and Moment
With the loading diagram drawn the next step is to find the value of the shear
force and moment at any given point along the element. For a horizontal beam one way
to perform this is at any point to "chop off" the right end of the beam and calculate the
internal shear force needed to keep the left portion of the beam in static equilibrium.
That internal shear force is the value of the shear force needed to plot on the shear
diagram. The moment is done in similar method by "chopping off" one end and
calculating the bending moment at that point but will generally be more complicated.
Both the shear and moment functions should be written as stepwise functions with
respect to position on the beam.
3.2.7 Drawing the Shear and Moment Diagrams
After the value of the shear force and bending moment diagram are defined for
all regions of the member the diagrams can finally be drawn. Important positions where
maximum or minimum values of shear force or bending moment occur should be
dimensioned from one end of the member noted with a dimension. Normally the shear
diagram is drawn directly below the loading diagram with the moment diagram drawn
directly beneath the shear diagram to show which points on the shear and moment
diagrams line up with the different loadings that the member is subjected to. The step
���
�
functions and any calculations are usually written out below the shear and moment
diagrams.
3.2.8 Relationships between Load, Shear, and Moment Diagrams
Since this method can easily become unnecessarily complicated with relatively
simple problems, it can be quite helpful to understand different relations between the
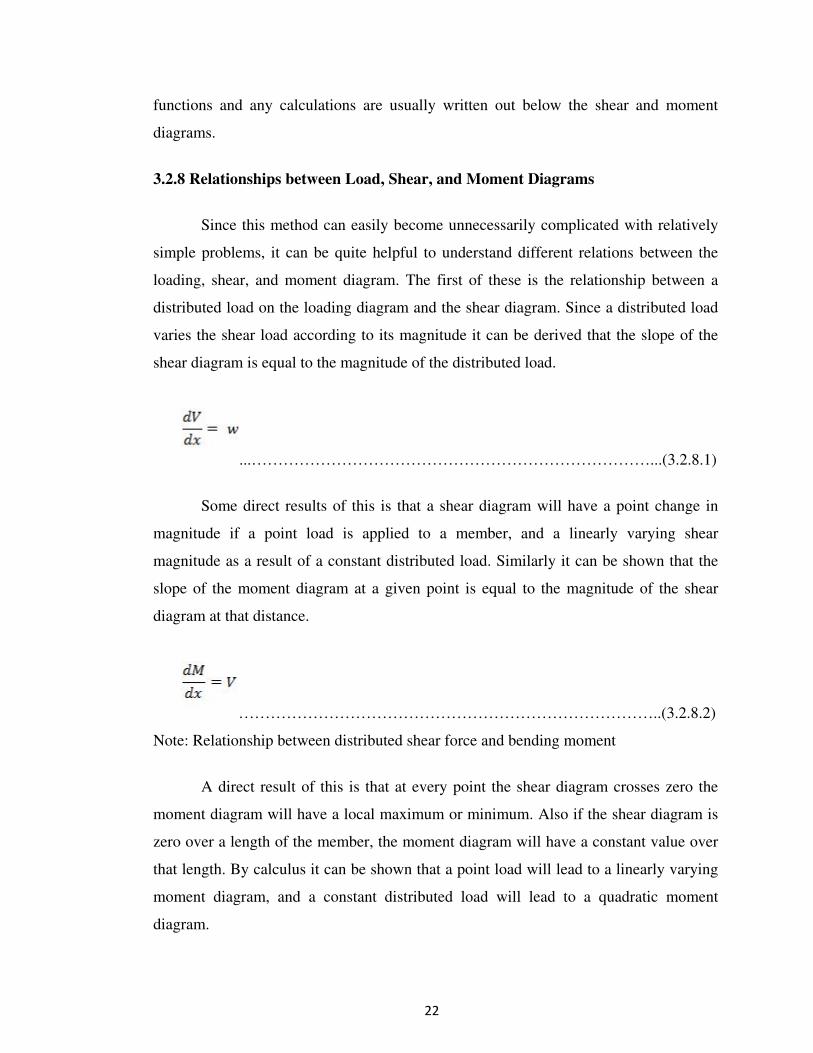
loading, shear, and moment diagram. The first of these is the relationship between a
distributed load on the loading diagram and the shear diagram. Since a distributed load
varies the shear load according to its magnitude it can be derived that the slope of the
shear diagram is equal to the magnitude of the distributed load.
...…………………………………………………………………...(3.2.8.1)
Some direct results of this is that a shear diagram will have a point change in
magnitude if a point load is applied to a member, and a linearly varying shear
magnitude as a result of a constant distributed load. Similarly it can be shown that the
slope of the moment diagram at a given point is equal to the magnitude of the shear
diagram at that distance.
……………………………………………………………………..(3.2.8.2)
Note: Relationship between distributed shear force and bending moment
A direct result of this is that at every point the shear diagram crosses zero the
moment diagram will have a local maximum or minimum. Also if the shear diagram is
zero over a length of the member, the moment diagram will have a constant value over
that length. By calculus it can be shown that a point load will lead to a linearly varying
moment diagram, and a constant distributed load will lead to a quadratic moment
diagram.

���
�
3.2.9 Practical Considerations
In practical applications the entire stepwise function is rarely written out. The
only parts of the stepwise function that would be written out are the moment equations
in a nonlinear portion of the moment diagram; this occurs whenever a distributed load is
applied to the member. For constant portions the value of the shear and/or moment
diagram is written right on the diagram, and for linearly varying portions of a member
the beginning value, end value, and slope or the portion of the member are all that are
required

���
�
�
�
�
CHAPTER 4
METHODOLOGY
�
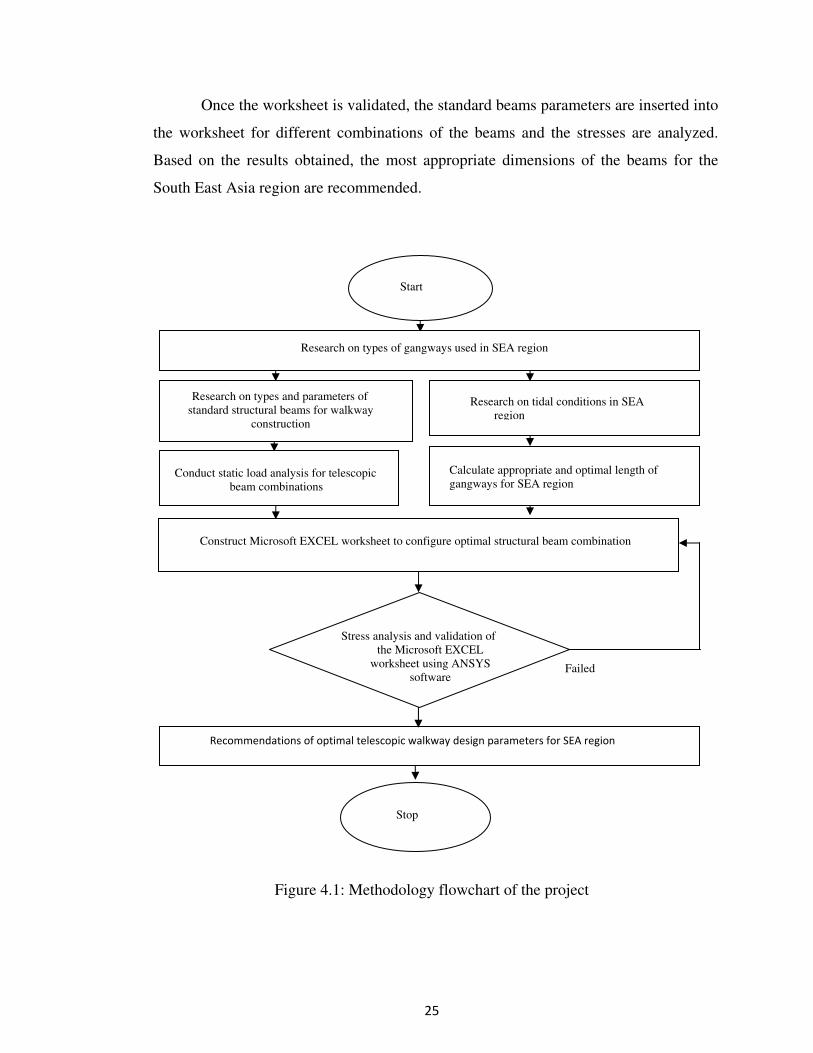
The flowchart in Figure 4.1 shows the methodology of the project. The project is
initiated with a literature review of the types of gangways that are being used in the
South East Asia region. Then, standard structural beams that can be used to build the
telescopic walkways for the design are studied.
On the other hand, the tidal conditions in South East Asia region are studied in
order to configure the operating envelope of the gangway. The study on the tidal
conditions will assist in the determination of the types of vessels that anchor at jetties in
this region and would enable to outline the range of required length of the beams for the
telescopic walkway construction.
Once the types of standard beams have been studied, the beams are then paired
into different combinations to analyze the bending and shear stresses. This would be
essential to determine the best combination of beam designs for the telescopic walkway.
Then, load analysis is assimilated into a Microsoft Excel worksheet and the variation of
the stresses along the length of the beams is analyzed.
To check for the accountability of the worksheet, the beams are analyzed using
the ANSYS software for the stress variation. The values obtained form the Excel
worksheet and the ANSYS software is compared. The validity of the Excel worksheet is
approved if the values match. However, if the values do not match, the calculations
used for the worksheet will be amended accordingly and re-analyzed using the ANSYS
software.
��
�
Once the worksheet is validated, the standard beams parameters are inserted into
the worksheet for different combinations of the beams and the stresses are analyzed.
Based on the results obtained, the most appropriate dimensions of the beams for the
South East Asia region are recommended.
�
�
�
�
�
�
�
�
�
�
�
�
�
�
�
�
�
�
�
�
�
�
�
�
�
�
Figure 4.1: Methodology flowchart of the project
�
�
Failed
Stop
Conduct static load analysis for telescopic
beam combinations
Start
Construct Microsoft EXCEL worksheet to configure optimal structural beam combination
Research on tidal conditions in SEA
region
Calculate appropriate and optimal length of
gangways for SEA region
Research on types of gangways used in SEA region
Research on types and parameters of
standard structural beams for walkway
construction
Stress analysis and validation of
the Microsoft EXCEL
worksheet using ANSYS
software
������������������������������������������������������� ����� ���� �!"#� ������
�
��
�
�
CHAPTER 5
RESULTS AND DISCUSSION
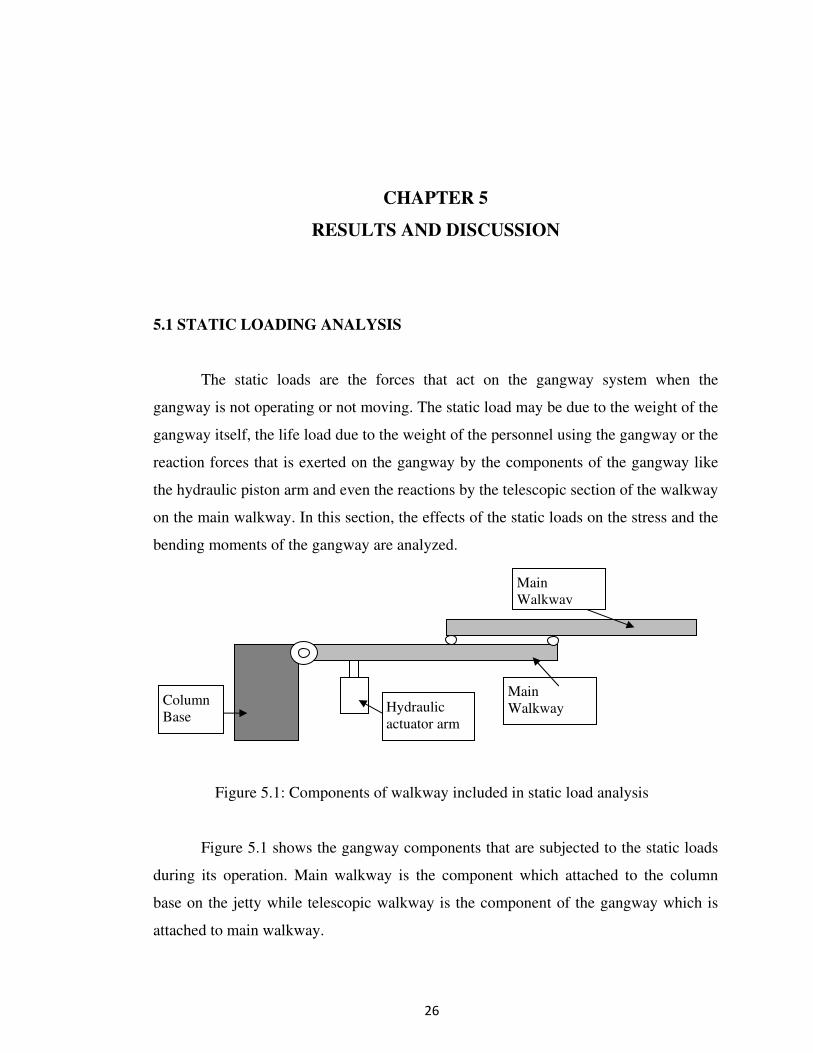
5.1 STATIC LOADING ANALYSIS
The static loads are the forces that act on the gangway system when the
gangway is not operating or not moving. The static load may be due to the weight of the
gangway itself, the life load due to the weight of the personnel using the gangway or the
reaction forces that is exerted on the gangway by the components of the gangway like
the hydraulic piston arm and even the reactions by the telescopic section of the walkway
on the main walkway. In this section, the effects of the static loads on the stress and the
bending moments of the gangway are analyzed.
Figure 5.1: Components of walkway included in static load analysis
Figure 5.1 shows the gangway components that are subjected to the static loads
during its operation. Main walkway is the component which attached to the column
base on the jetty while telescopic walkway is the component of the gangway which is
attached to main walkway.
Column
Base Hydraulic
actuator arm
support
Main
Walkway
Main
Walkway

���
�
WA is the weight of mainwalkway and the telescopic walkway respectively. A
distributed load of 2400 N/m is exerted on the whole length of the walkway due to the
live load of the walkway which is the load caused by the personel using the walkway.
This is also in accordance with the requirements in
ASCE 7.
The following terms are used to represent the loads that act on the walkway:
Ny1 - Normal reaction at the hinge in the Y direction
Ny2 - Normal reaction exerted by the weight of the telescopic walkway in Y direction
Ny3 - Normal reaction exerted by the weight of the telescopic walkway in Y direction
Wd - Distributed load that acts on the walkway as required by ASCE 7
Nsupport - Reaction force exerted by the support arm to counter the weight and moments.
NOTE: The support could be a hydraulic actuator arm or metallic cable hooked up to
pulleys.
The expressions of reaction forces that have been obtained are applied in the
analysis of stress and bending moments of these segments of the walkway. The shear
force and bending moment analysis of the beams require the application of sectional
weights of the beams because every inch of the beam will be subjected to weight. The
sectional loads that are applied on the beams are shown below:
For the main beam, let the length of the beam as L . The weight of the beam is equals to
the product of density (�), cross sectional area (A), length L and the gravitational
acceleration, g of 9.81 ms-2
. Therefore, the sectional weight of the beam is
WA = �gAL………………………………………………………………………...(5.1.1)
The weight of the beam is distributed along the beam’s length and acts together with the
standard required distributed load of 2400 N/m as WA /L. Similarly, the distributed load
will be as below:
�
���
�
Wd = 2400L………………………………………………………………………...(5.1.2)
Therefore, the combination of the weight and the distributed load contributes to the
following load:
Total distributed load = (WA /L + Wd) (L)…………………………………………(5.1.3)
The analysis of the shear force, bending moment, shear stress and the bending stress are
done by considering three cases of the walkway extension length. The first case
discusses the analysis for fully retracted walkway; the second case discusses analysis of
the half-extended walkway and the third case discusses analysis of three-quarter
extended walkway.
The three cases of analysis mentioned are discussed in the following analyses:
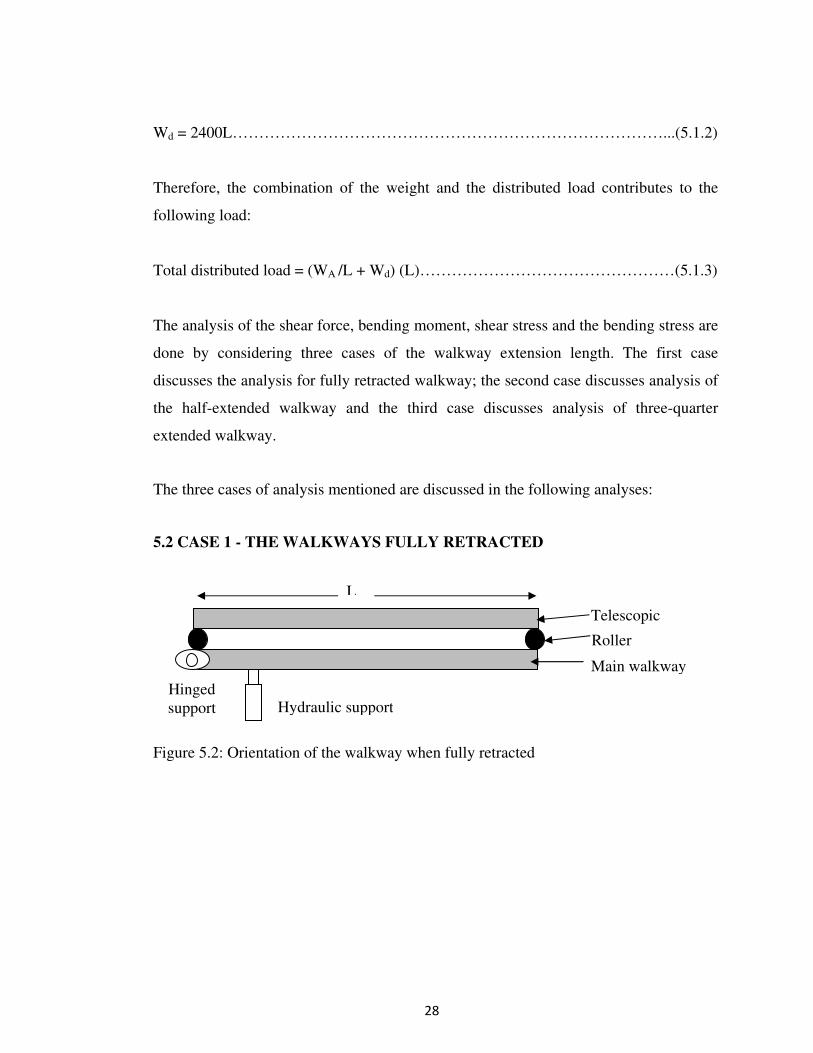
5.2 CASE 1 - THE WALKWAYS FULLY RETRACTED
Figure 5.2: Orientation of the walkway when fully retracted
Telescopic
Main walkway
Hydraulic support Hinged
support
Roller
L

� �
�
Figure 5.3: Loads acting on individual walkways of retracted walkway
2400+(WA / L) N/m
Ny1
Ny2
Ny3 Nsupport
L/4
2400+(WA / L) N/m
Calculation for reaction forces:
a) For telescopic walkway:
+�� Fy = 0;
Ny1 + Ny2 = [2400 + (WA / L)](L)
Ny1 = [2400+ (WA / L)] (L) – Ny2………………………………………………….(5.2.1)
+ M =0;
Ny2 (L) = [2400 + (WA / L)](L/2)
Ny2 =2(L) [2400 + (WA / L)]…………………………………..……….…………..(5.2.2)
b) For Main walkway:
+�� Fy = 0;
Ny3 + Nsupport = [2400 + (WA / L)](L) + Ny1 + Ny2
Ny3 = [2400 + (WA / L)] (L) + Ny1 + Ny2 - Nsupport ……………………………………………...(5.2.3)
+ M =0;
Nsupport(L/4) = [2400+(WA / L)](L) (L/2) + Ny2(L)
Nsupport = 2(L) [2400 + (WA / L)] + 4Ny2………………..…………………………(5.2.1)

���
�
5.2.1 Calculation for shear force and bending moment
a) Telescopic Walkway
b) Main walkway
For 0 � u < L/4
Ny1
V
M
u
Wd
u
Ny3
$�
Ny1
V
%�
Wdu
Shear force and bending moment:
+�� Fy = 0;
V = Ny3 - [2400+ (WA / L)] u - Ny1…………..…..(5.2.1.3)
+ M =0;
M = Vu + [2400+ (WA / L)] u (u/2)
M = Vu + [2400+ (WA / L)] u2/2…………………..(5.2.1.4)
Shear force and bending moment:
+�� Fy = 0;
V = Ny1 – [2400+ (WA / L)] u ……………………………………..…………..(5.2.1.1)
+ M =0;
M = Vu + [2400+ (WA / L)] (u/2)……………………………………..………..(5.2.1.2)
���
�
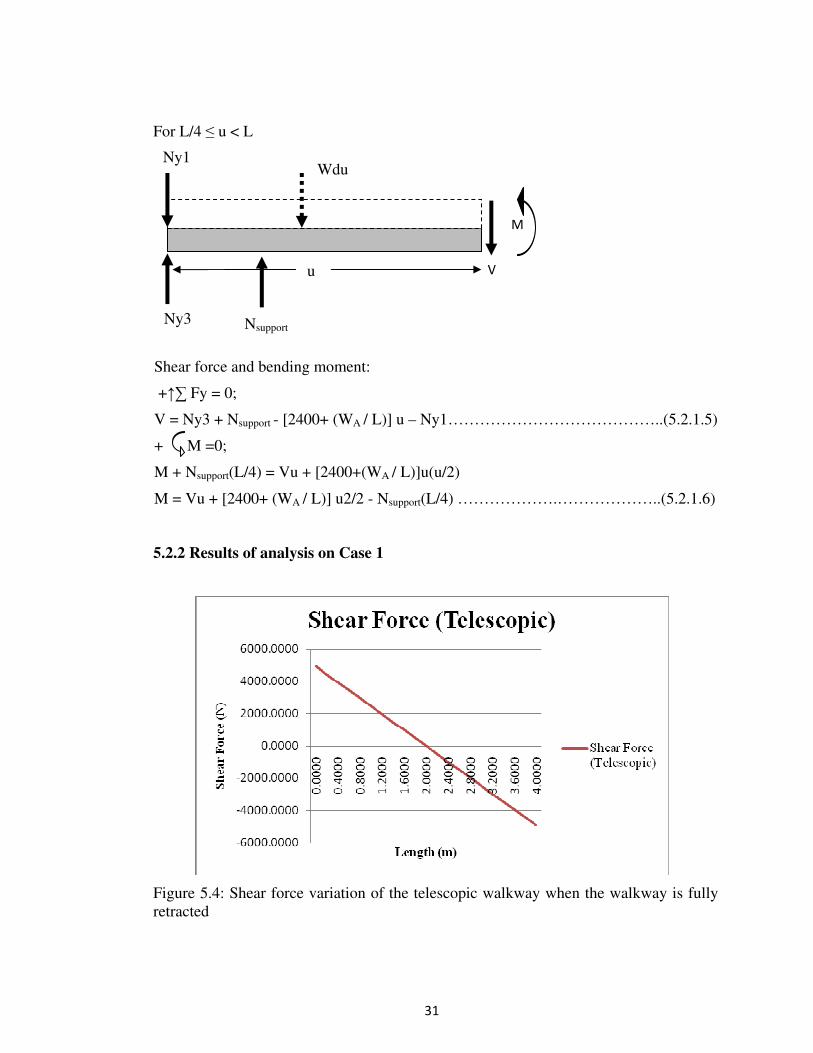
For L/4 � u < L
5.2.2 Results of analysis on Case 1
�
�
Figure 5.4: Shear force variation of the telescopic walkway when the walkway is fully
retracted
Ny1
Wdu
&�
%�
u
Ny3
Nsupport
Shear force and bending moment:
+�� Fy = 0;
V = Ny3 + Nsupport - [2400+ (WA / L)] u – Ny1…………………………………..(5.2.1.5)
+ M =0;
M + Nsupport(L/4) = Vu + [2400+(WA / L)]u(u/2)
M = Vu + [2400+ (WA / L)] u2/2 - Nsupport(L/4) ……………….………………..(5.2.1.6)

���
�
Figure 5.5: Bending moment variation of the telescopic walkway when the walkway is
fully retracted
�
Figure 5.6: Shear Stress variation of the telescopic walkway when the walkway is fully
retracted

���
�
�
Figure 5.7: Bending Stress variation of the telescopic walkway when the walkway is
fully retracted
�
Figure 5.8: Shear force variation of the main walkway when the walkway is fully
retracted

���
�
�
Figure 5.9: Bending moment variation of the main walkway when the walkway is fully
retracted
�
Figure 5.10: Shear stress variation of the main walkway when the walkway is fully
retracted

��
�
�
Figure 5.11: Bending Stress variation of the main walkway when the walkway is fully
retracted
5.3 CASE 2 - WALKWAY IS HALF-EXTENDED
Figure 5.12: Orientation of the walkway when the walkway is half extended

��
�
Figure 5.13: Loads acting on individual walkway when the walkway is half-extended
Ny1
Ny
Ny3 Nsupport
2400+(WA / L) N/m
2400+(WA / L)
Calculation for reaction forces:
a) For telescopic walkway:
+�� Fy = 0;
Ny1 + Ny2 = [2400 + (WA / L)] (L)
Ny1 = [2400 + (WA / L)] (L) – Ny2………………………………………………..(5.3.1)
+ M =0;
Ny2 (L) = [2400 + (WA / L)] (L) (L/2)
Ny2 = [2400 + (WA / L)] (L)/2……………….………………………………...…..(5.3.2)
b) For Main walkway:
+�� Fy = 0;
Ny3 + Nsupport = [2400 + (WA / L)] (L) + Ny1 + Ny2
Ny3 = [2400 + (WA / L)] (L) + Ny1 + Ny2 - Nsupport……………………………..(5.3.3)
+ M =0;
Nsupport(L/4) = [2400 + (WA / L)] (L) (L/2) + Ny2(L) + Ny1 (L/2)
Nsupport = 2(L) [2400 + (WA / L)] + 4(Ny2) + 2(Ny1) ……………………………..(5.3.4)

���
�
5.3.1 Calculation for shear force and bending moment
a) Telescopic walkway
For 0 � u < L/2
For L/2 � u < L
Wdu
u
V
M
Ny1
Wdu
V
M
$�
Ny
Ny1
Shear force and bending moment
calculation:
+�� Fy = 0;
V = Ny1 – [2400 + (WA / L)] u.......(5.3.1.1)
+ M =0;
M = Vu +[2400 + (WA / L)] (u/2)
M = Vu + [2400 + (WA / L)] u2/2…(5.3.1.2)
Shear force and bending moment calculation:
+�� Fy = 0;
V = Ny1 + Ny2 – [2400 + (WA / L)] u………………………….……….............(5.3.1.3)
+ M =0;
M + Ny2 (L/2)= Vu + [2400 + (WA / L)] u(u/2)
M = Vu + [2400 + (WA / L)] u2/2
– Ny2 (L/2) .....................................................(5.3.1.4)
���
�
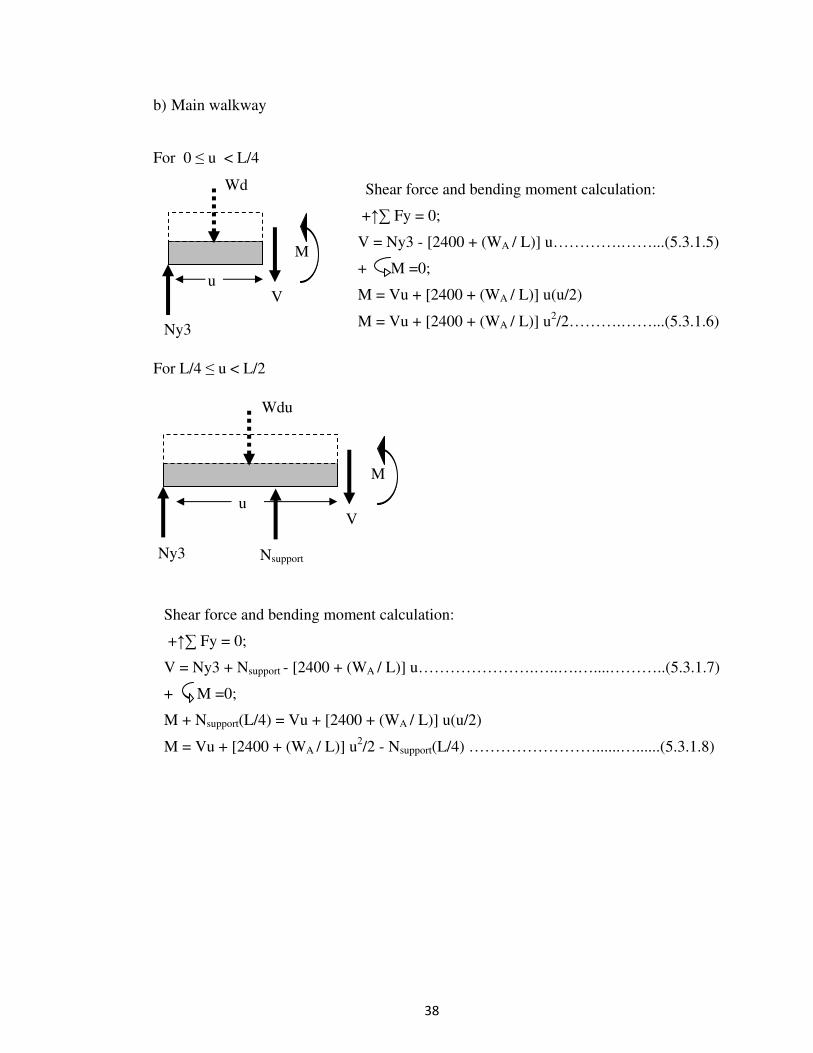
b) Main walkway
For 0 � u < L/4
For L/4 � u < L/2
Wd
u
Ny3
u
V
M
u
V
M
Wdu
Ny3
Nsupport
Shear force and bending moment calculation:
+�� Fy = 0;
V = Ny3 - [2400 + (WA / L)] u………….……...(5.3.1.5)
+ M =0;
M = Vu + [2400 + (WA / L)] u(u/2)
M = Vu + [2400 + (WA / L)] u2/2……….……...(5.3.1.6)
Shear force and bending moment calculation:
+�� Fy = 0;
V = Ny3 + Nsupport - [2400 + (WA / L)] u………………….…..….…....………..(5.3.1.7)
+ M =0;
M + Nsupport(L/4) = Vu + [2400 + (WA / L)] u(u/2)
M = Vu + [2400 + (WA / L)] u2/2 - Nsupport(L/4) ……………………......…......(5.3.1.8)

� �
�
For L/2 � u < L
5.3.1 Results of analysis on Case 2
�
Figure 5.14: Shear force variation of the telescopic walkway when the walkway is half
extended
V
M
Ny3
Nsupport
Wdu
Ny1
u
Shear force and bending moment calculation:
+�� Fy = 0;
V = Ny3 + Nsupport - [2400 + (WA / L)] u – Ny1……………………..……….…...(5.3.1.9)
+ M =0;
M + Nsupport(L/4) = Vu + [2400 + (WA / L)] u(u/2) + Ny1(L/2)
M = Vu + [2400 + (WA / L)] u2/2 - Nsupport(L/4) – Ny1(L/2) ……………..….....(5.3.1.10)

���
�
�
Figure 5.15: Bending moment variation of the telescopic walkway when the walkway
is half extended
�
Figure 5.16: Bending stress variation of the telescopic walkway when the walkway is
half extended
� � �
Length (m)�
Ben
din
g S
tres
s (P
a)�

���
�
�
Figure 5.17: Shear stress variation of the telescopic walkway when the walkway is half
extended
�
�
Figure 5.18: Shear force variation of the main walkway when the walkway is half
extended
�

���
�
�
Figure 5.19: Bending moment variation of the main walkway when the walkway is half
extended
�
�
�
Figure 5.20: Bending stress variation of the main walkway when the walkway is half
extended
�
���
�
�
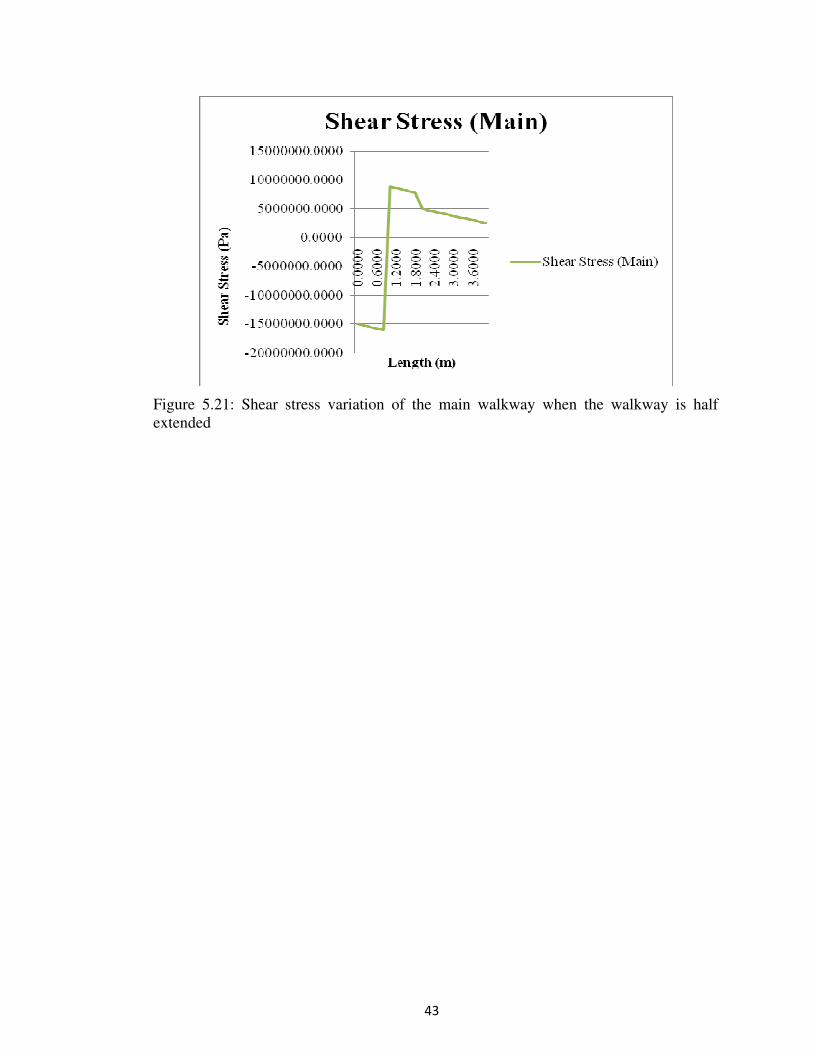
Figure 5.21: Shear stress variation of the main walkway when the walkway is half
extended
�

���
�
5.4 CASE 3 - WALKWAY IS THREE QUARTER – EXTENDED
Figure 5.22: Orientation of the walkway when the walkway is three-quarter extended
Figure 5.23: Loads acting on the walkway when the walkway is three-quarter extended
Ny1
Ny2
Ny3
Nsupport
2400+(WA / L) N/m
2400+(WA / L) N/m
��
�
5.4.1 Calculation for shear force and bending moment
a) Telescopic walkway:
For 0 � u < L/4
Wd
u
u
V
M
Ny1
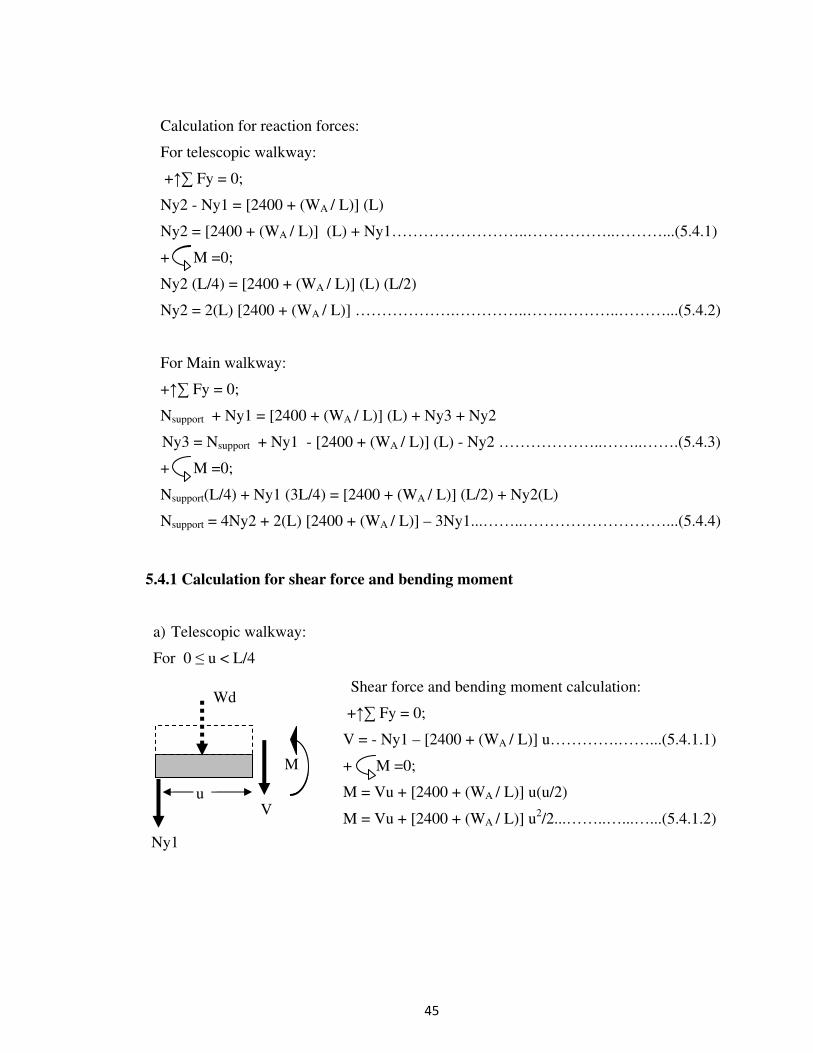
Calculation for reaction forces:
For telescopic walkway:
+�� Fy = 0;
Ny2 - Ny1 = [2400 + (WA / L)] (L)
Ny2 = [2400 + (WA / L)] (L) + Ny1……………………..……………..………...(5.4.1)
+ M =0;
Ny2 (L/4) = [2400 + (WA / L)] (L) (L/2)
Ny2 = 2(L) [2400 + (WA / L)] ……………….…………..…….………..………...(5.4.2)
For Main walkway:
+�� Fy = 0;
Nsupport + Ny1 = [2400 + (WA / L)] (L) + Ny3 + Ny2
Ny3 = Nsupport + Ny1 - [2400 + (WA / L)] (L) - Ny2 ………………..……..…….(5.4.3)
+ M =0;
Nsupport(L/4) + Ny1 (3L/4) = [2400 + (WA / L)] (L/2) + Ny2(L)
Nsupport = 4Ny2 + 2(L) [2400 + (WA / L)] – 3Ny1...……..………………………...(5.4.4)
Shear force and bending moment calculation:
+�� Fy = 0;
V = - Ny1 – [2400 + (WA / L)] u………….……...(5.4.1.1)
+ M =0;
M = Vu + [2400 + (WA / L)] u(u/2)
M = Vu + [2400 + (WA / L)] u2/2...……..…...…...(5.4.1.2)
��
�
For L/4 � u < L
b) Main walkway
For 0 � u < L/4
Wd
u
V
M
u
Ny
Ny1
Wd
u
u
V
M
Ny3
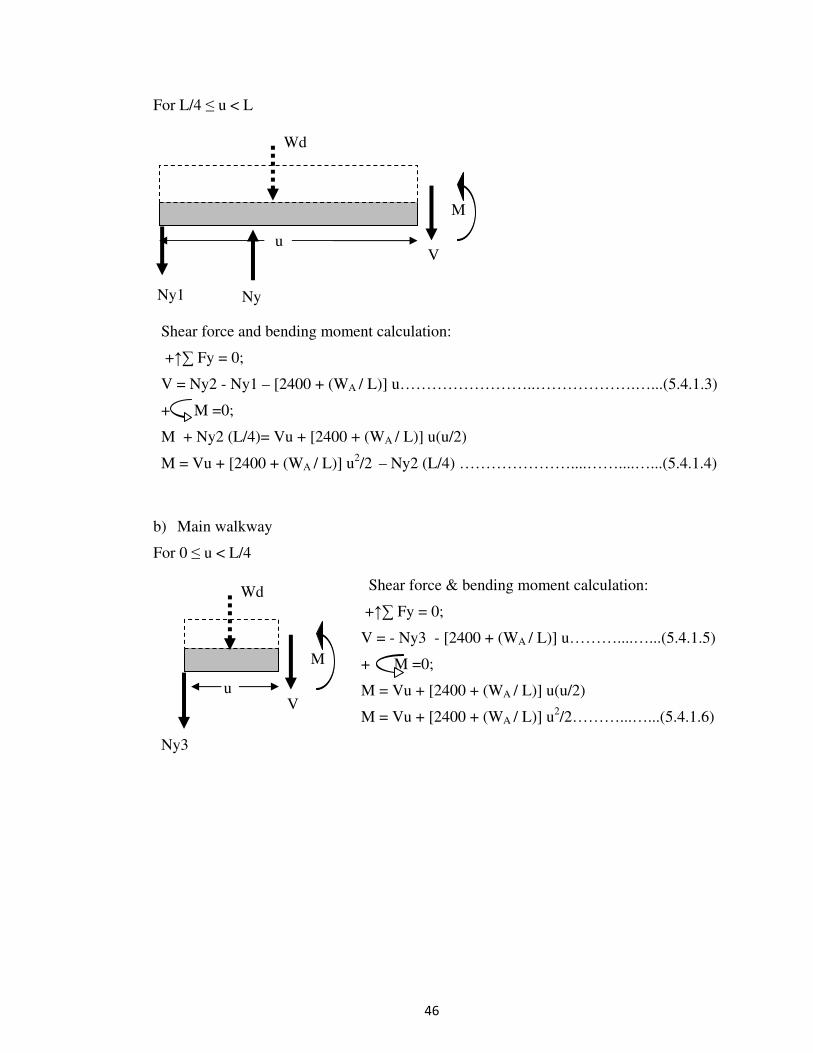
Shear force & bending moment calculation:
+�� Fy = 0;
V = - Ny3 - [2400 + (WA / L)] u………....…...(5.4.1.5)
+ M =0;
M = Vu + [2400 + (WA / L)] u(u/2)
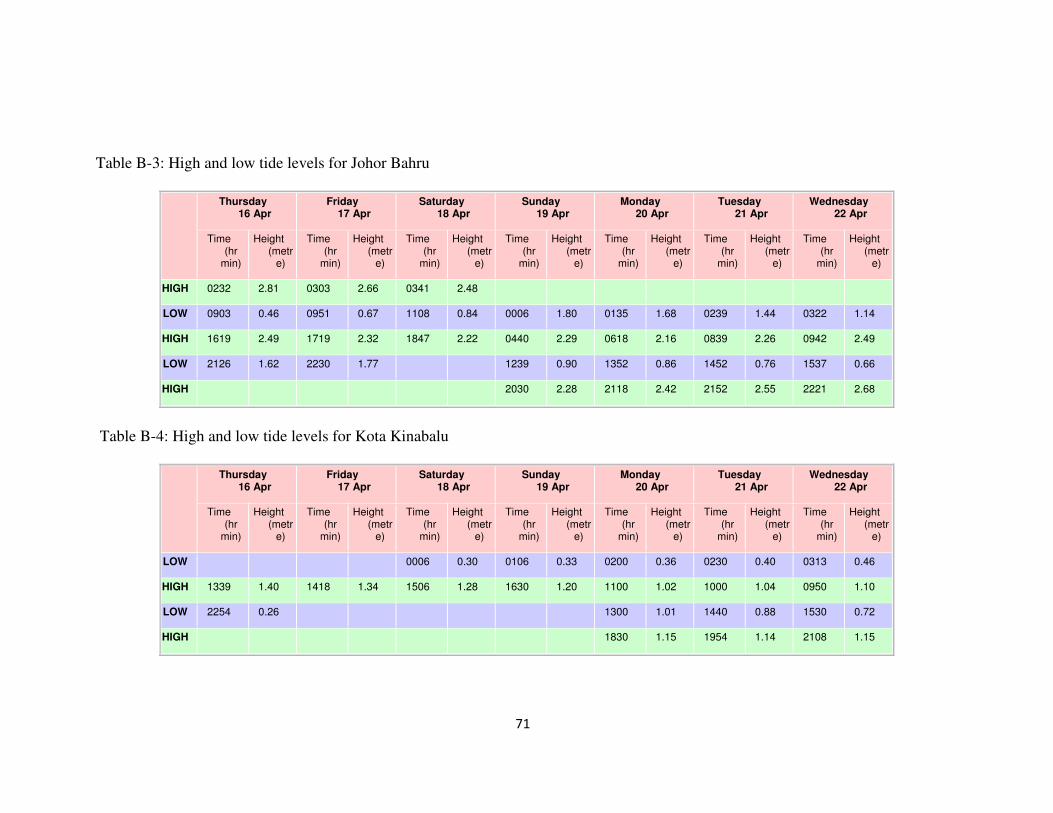
M = Vu + [2400 + (WA / L)] u2/2………...…...(5.4.1.6)
Shear force and bending moment calculation:
+�� Fy = 0;
V = Ny2 - Ny1 – [2400 + (WA / L)] u……………………..……………….…...(5.4.1.3)
+ M =0;
M + Ny2 (L/4)= Vu + [2400 + (WA / L)] u(u/2)
M = Vu + [2400 + (WA / L)] u2/2
– Ny2 (L/4) …………………....……....…...(5.4.1.4)
���
�
For L/4 � u < 3L/4
For 3L/4 � u < L
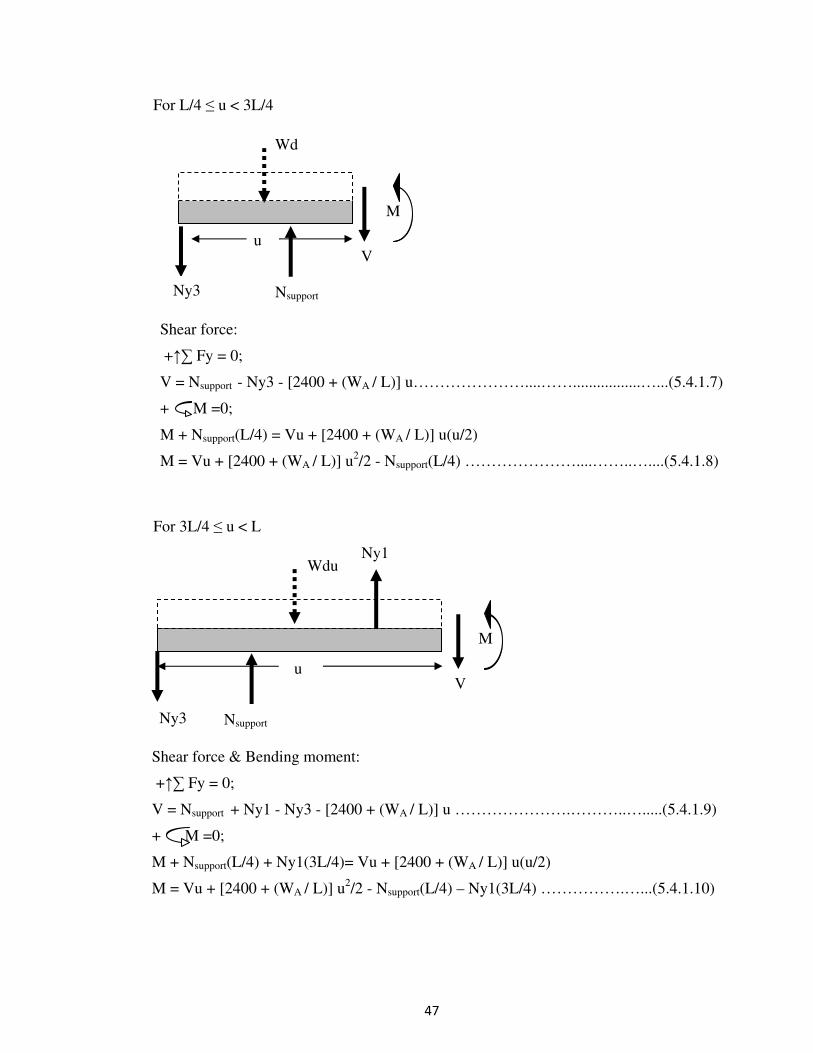
u
V
M
Wd
u
Ny3
Nsupport
V
M
Ny3
Nsupport
Wdu
Ny1
u
Shear force & Bending moment:
+�� Fy = 0;
V = Nsupport + Ny1 - Ny3 - [2400 + (WA / L)] u ………………….………..….....(5.4.1.9)
+ M =0;
M + Nsupport(L/4) + Ny1(3L/4)= Vu + [2400 + (WA / L)] u(u/2)
M = Vu + [2400 + (WA / L)] u2/2 - Nsupport(L/4) – Ny1(3L/4) …………….…...(5.4.1.10)
Shear force:
+�� Fy = 0;
V = Nsupport - Ny3 - [2400 + (WA / L)] u…………………....…….................…...(5.4.1.7)
+ M =0;
M + Nsupport(L/4) = Vu + [2400 + (WA / L)] u(u/2)
M = Vu + [2400 + (WA / L)] u2/2 - Nsupport(L/4) …………………....……..…....(5.4.1.8)

���
�
5.4.2 Results of analysis on Case 3
�
Figure 5.24: Shear force variation of the telescopic walkway when the walkway is three
quarter extended
Figure 5.25: Shear force variation of the telescopic walkway when the walkway is three
quarter extended
�

� �
�
�
Figure 5.26: Shear force variation of the telescopic walkway when the walkway is three
quarter extended
�
�
Figure 5.27: Shear force variation of the telescopic walkway when the walkway is three
quarter extended
�

��
�
�
Figure 5.28: Shear force variation of the telescopic walkway when the walkway is three
quarter extended
�
�
�
Figure 5.29: Shear force variation of the telescopic walkway when the walkway is three
quarter extended
�
��
�
�
Figure 5.30: Shear force variation of the telescopic walkway when the walkway is three
quarter extended
�
�
Figure 5.31: Shear force variation of the telescopic walkway when the walkway is three
quarter extended
�
Upon obtaining the expressions for the shear force and bending moments, the shear
stress and bending stresses are calculated using the following equations.
Shear stress (�) = Shear force / cross sectional area of the beam
= V / A…………………....…………………………...…....…...(5.4.2.1)
The standard structural beams recommended for the construction of gangway’s
walkway are the T-beam and the I-beam. Typical rectangular beams are also applicable.
��
�
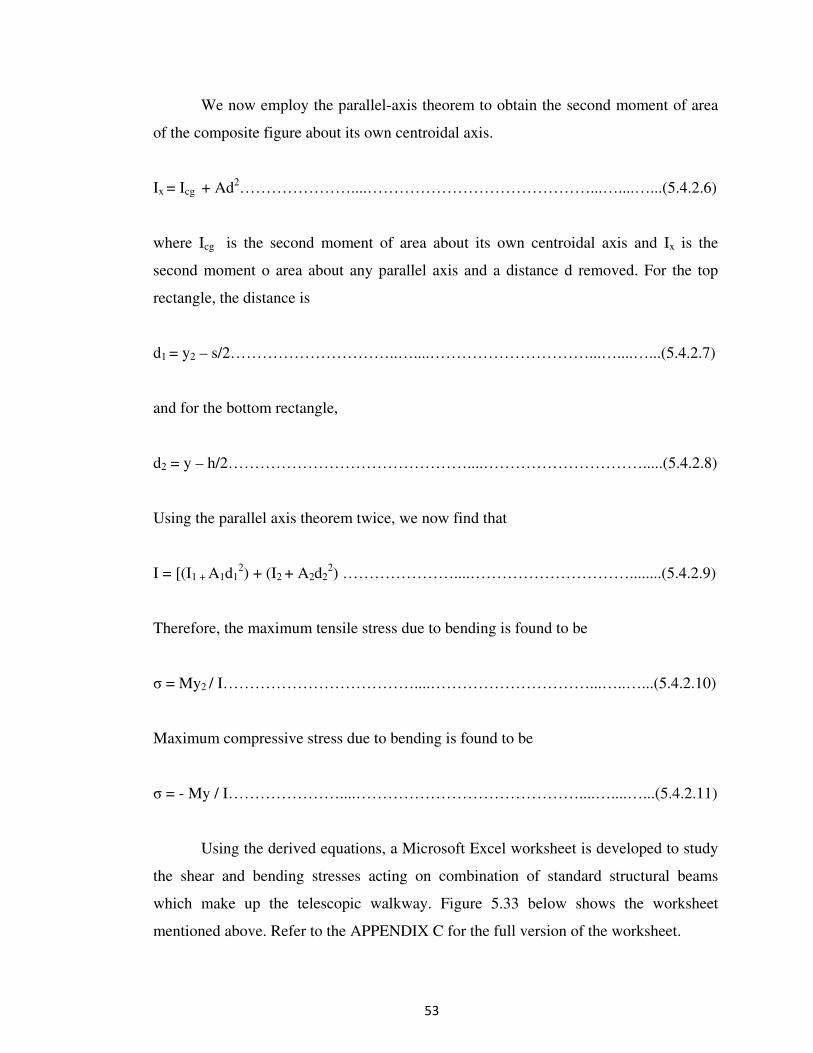
Figure 5.32: Standard structural beams used for gangway construction
The parameters of the beams that are considered in the design of the gangway
are shown in the Figure 5.32 above i.e. breadth (b) or (bf), depth (d), height (h), center
of gravity (y) and (y2), thickness (t) or (tw), peripheral thickness (s) or (tf).
Considering the T-beam as an example, divide the beam into two sections, 1 and
2, and sum the moments of these areas about the top edge. We then have
Ay2 = sb(s/2) + t(d-s)((d-s)/2 + s) ……………...……………………...…....…...(5.4.2.2)
From this equation, y2 can be obtained. Then
y = d – y2…………………....…………………………...…....………………….(5.4.2.3)
Now, we can calculate the second moment of area of each rectangular area about its
own centroidal axis. For the top rectangle
I1 = sb3/12….…………………....………………………….................…......…...(5.4.2.4)
I2 = th3/12……………………………….....…………………………...…....…...(5.4.2.5)
���
��
����
��
�
We now employ the parallel-axis theorem to obtain the second moment of area
of the composite figure about its own centroidal axis.
Ix = Icg + Ad2…………………....……………………………………...…....…...(5.4.2.6)
where Icg is the second moment of area about its own centroidal axis and Ix is the
second moment o area about any parallel axis and a distance d removed. For the top
rectangle, the distance is
d1 = y2 – s/2…………………………..…....…………………………...…....…...(5.4.2.7)
and for the bottom rectangle,
d2 = y – h/2………………………………………....………………………….....(5.4.2.8)
Using the parallel axis theorem twice, we now find that
I = [(I1 + A1d12) + (I2 + A2d2
2) …………………....…………………………........(5.4.2.9)
Therefore, the maximum tensile stress due to bending is found to be
� = My2 / I………………………………....…………………………...…..…...(5.4.2.10)
Maximum compressive stress due to bending is found to be
� = - My / I…………………....……………………………………....…....…...(5.4.2.11)
Using the derived equations, a Microsoft Excel worksheet is developed to study
the shear and bending stresses acting on combination of standard structural beams
which make up the telescopic walkway. Figure 5.33 below shows the worksheet
mentioned above. Refer to the APPENDIX C for the full version of the worksheet.

��
�
Figure 5.33: Microsoft Excel worksheet for studying the standard structural beams
combination
The parameters of the standard beams are inserted into the appropriate tabs of
the worksheet. The worksheet then calculates the shear and bending stress of the beams.
Various combinations of the beams can be analyzed using the worksheet to obtain an
optimal beam combination depending on the stakeholders’ requirements.
In order to validate the worksheet, the parameters of a T-beam are inserted into
the worksheet and the same parameters are analyzed using the ANSYS software. The
result of the stress analysis using ANSYS is shown in the figures below:
The beam parameters that are used for the Excel worksheet validation is based on the T-
beam and with assumption that both beams used for the telescopic walkway
construction to be square T-beams.

�
�
Figure 5.34: Parameters used for the validation of the Excel worksheet
Figure 5.35: Meshing diagram of the T-beam
�'(�
�'(�
�(�
�(�

�
�
Figure 5.36: Stress variation on the T-beam
The maximum stress acting on the beam obtained from the Excel worksheet
matches with the stress value obtained from the analysis using ANSYS which is 50
GPa. Therefore, the Excel worksheet is validated and can be applied to analyze the
beam combinations.
The length of the beams that is used to be inserted in the stress analysis is
obtained from the study of the operating envelop of the gangways in the South East
Asian tidal conditions. Refer to APPENDIX B for the report on the tidal conditions of
the seas in South East Asia. The tidal conditions in South East Asia with respect to the
design of vessel size are summarized in the following table and illustrated in Figure 37.
Table 5.1: Vessel depth, draft and deck elevation in South East Asia seas
��
�
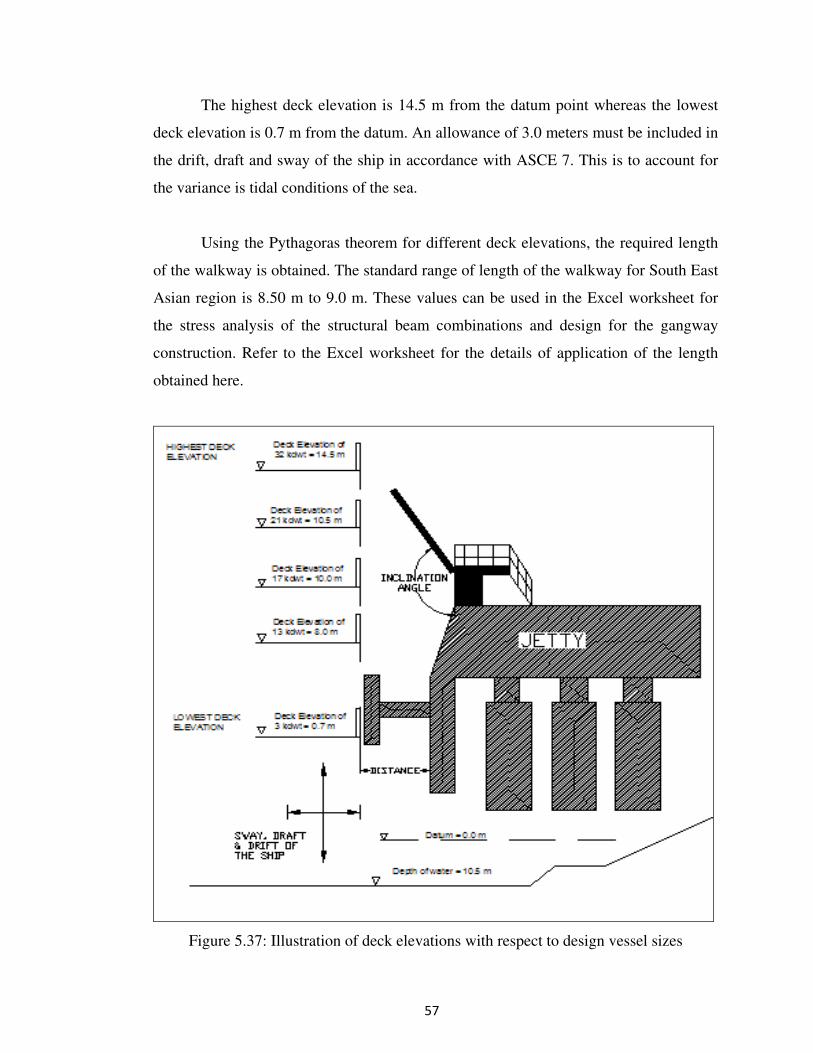
The highest deck elevation is 14.5 m from the datum point whereas the lowest
deck elevation is 0.7 m from the datum. An allowance of 3.0 meters must be included in
the drift, draft and sway of the ship in accordance with ASCE 7. This is to account for
the variance is tidal conditions of the sea.
Using the Pythagoras theorem for different deck elevations, the required length
of the walkway is obtained. The standard range of length of the walkway for South East
Asian region is 8.50 m to 9.0 m. These values can be used in the Excel worksheet for
the stress analysis of the structural beam combinations and design for the gangway
construction. Refer to the Excel worksheet for the details of application of the length
obtained here.
Figure 5.37: Illustration of deck elevations with respect to design vessel sizes
��
�
CHAPTER 6
CONCLUSION AND RECOMMENDATION
6.1 CONCLUSION
The study has revealed that the construction of the walkway beams of a jetty
gangway is constantly subjected to varying stresses while walkway is under operation.
Based on the study of the static loading analysis, it can be concluded that maximum
stress occurs due to the bending of the walkways upon subjected to the operational
loads discussed. The stress data obtained using the conventional Microsoft Excel agrees
positively with stress analysis using the ANSYS software that the beam is under highest
stress condition when the walkway extension reaches its maximum. Therefore, the
Microsoft Excel worksheet that has been developed in this study will be essential in
determining the design parameters of the beams that are to be used in the walkway
designing. Besides that, the study also has found that a standardized range of length of
beams can be used for the South East Asian region based on the study that has been
done on the tidal and wind conditions. The data, thus, concludes that a length range of
8.5 to 9.0 meters is most suitable for this region. In conclusion, these parameters and the
Microsoft Excel worksheet have achieved the objective of this study which is to obtain
insightful design parameters for the walkway designing and to be an essential study for
future design development efforts in this field.
�
�
6.2 RECOMMENDATION
6.2.1 Dynamic Loading Analysis
In order to further improve the project outcome, dynamic loading analysis must
be studied. The dynamic load analysis may include the vibrational forces acting on the
beams due to the life loads applied. The analysis may be explained using mode shapes
of the vibration of the beams and also simulation of the dynamics.
6.2.2 More standard structural beams combination analysis
The analysis of the walkway designing in this project covers only the T-beams
for both the main walkway and the telescopic walkway. Study on the combinations of
T-beams, I-beams, etc. would enhance the details of design parameters.

��
�
REFERENCES
[1] American Standards of Civil Engineers (ASCE)-7, Design of Buildings and
Other Structures, Second Edition
[2] Thompson E.G., 2005, “Introduction To The Finite Element Method”, Theory,
Programming, and Applications,Wiley, USA
[3] Meguid, S.A. and Zhu, Z.H., 1995, "A novel finite element for treating
inhomogeneous solids," International Journal Numerical Methods
Engineering 38 (2): 1579-1592
[4] BS BSI MA 78, Design of Aluminum Gangways
[5] http://www.freepatononline.com/gangway
[6] http://www.sciencedirect.com/gangway
[7] http://www.patentstorm.us/patents/611769.html
[8] http://www.mantleramp.com/technical.html
[9] http://www.fmctechnologies.com/global/gangway
[10] http://www.australasianjettys.com.au/boatlifts.html
[11] http://www.scopus.com/gangway

��
�
APPENDIX A
TYPES OF GANGWAYS
��
�
Figure A-1: Conventional gangway (mobile system)
Figure A-2: Platform mounted (mobile system)
��
�
Figure A-3: Carriage mounted with track parallel to pier face (mobile system)
Figure A-4: Carriage mounted with track parallel to pier face, attached to side of pier
(mobile system)

��
�
Figure A-5: Shore accommodation ladder (stationary system)
Figure A-6: Front mounted shore access ladder (stationary system)
�
�
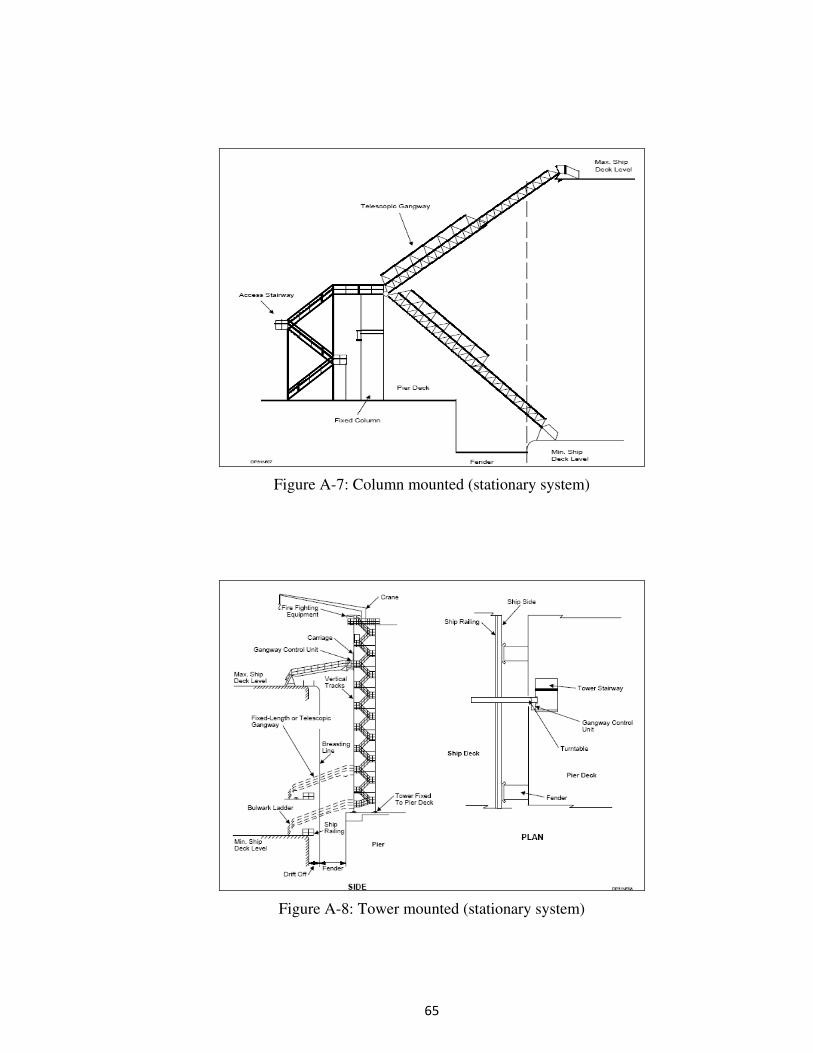
Figure A-7: Column mounted (stationary system)
Figure A-8: Tower mounted (stationary system)
�
�
Figure A-9: Basic gangway operating envelope

��
�
Figure A-10: Design operating envelope data
��
�
APPENDIX B
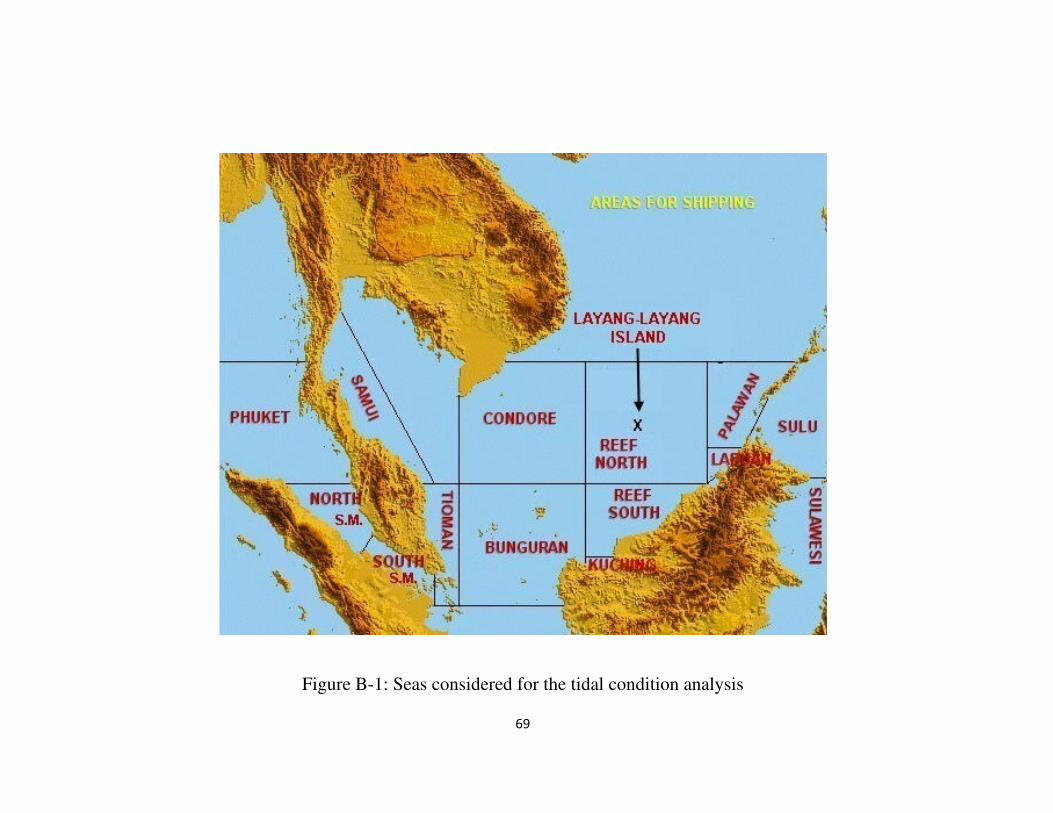
DATA OF TIDAL CONDITIONS IN SOUTH EAST ASIA
�
�
Figure B-1: Seas considered for the tidal condition analysis

���
�
Table B-1: High and low tide levels for Cendering
Thursday 16 Apr
Friday 17 Apr
Saturday 18 Apr
Sunday 19 Apr
Monday 20 Apr
Tuesday 21 Apr
Wednesday 22 Apr
Time (hr
min)
Height (metr
e)
Time (hr
min)
Height (metr
e)
Time (hr
min)
Height (metr
e)
Time (hr
min)
Height (metr
e)
Time (hr
min)
Height (metr
e)
Time (hr
min)
Height (metr
e)
Time (hr
min)
Height (metr
e)
LOW 0430 0.37 0456 0.42 0515 0.50 0530 0.60 0530 0.73 0142 0.74 0122 0.68
HIGH 1348 1.94 1445 1.89 1547 1.85 1645 1.81 1730 1.76 0650 0.91 0718 1.11
LOW 0950 0.86 1142 0.91
HIGH 1810 1.69 1837 1.60
Table B-2: High and low tide levels for Geting
Thursday 16 Apr
Friday 17 Apr
Saturday 18 Apr
Sunday 19 Apr
Monday 20 Apr
Tuesday 21 Apr
Wednesday 22 Apr
Time (hr
min)
Height (metr
e)
Time (hr
min)
Height (metr
e)
Time (hr
min)
Height (metr
e)
Time (hr
min)
Height (metr
e)
Time (hr
min)
Height (metr
e)
Time (hr
min)
Height (metr
e)
Time (hr
min)
Height (metr
e)
LOW 0410 0.18 0400 0.20 0350 0.22 0300 0.25 0150 0.24 0142 0.22 0130 0.19
HIGH 1330 0.96 1430 0.93 1530 0.90 1645 0.88 1740 0.86 1818 0.83 0800 0.57
LOW 1230 0.47
HIGH 1856 0.80
���
�
Table B-3: High and low tide levels for Johor Bahru
Thursday 16 Apr
Friday 17 Apr
Saturday 18 Apr
Sunday 19 Apr
Monday 20 Apr
Tuesday 21 Apr
Wednesday 22 Apr
Time (hr
min)
Height (metr
e)
Time (hr
min)
Height (metr
e)
Time (hr
min)
Height (metr
e)
Time (hr
min)
Height (metr
e)
Time (hr
min)
Height (metr
e)
Time (hr
min)
Height (metr
e)
Time (hr
min)
Height (metr
e)
HIGH 0232 2.81 0303 2.66 0341 2.48
LOW 0903 0.46 0951 0.67 1108 0.84 0006 1.80 0135 1.68 0239 1.44 0322 1.14
HIGH 1619 2.49 1719 2.32 1847 2.22 0440 2.29 0618 2.16 0839 2.26 0942 2.49
LOW 2126 1.62 2230 1.77 1239 0.90 1352 0.86 1452 0.76 1537 0.66
HIGH 2030 2.28 2118 2.42 2152 2.55 2221 2.68
Table B-4: High and low tide levels for Kota Kinabalu
Thursday 16 Apr
Friday 17 Apr
Saturday 18 Apr
Sunday 19 Apr
Monday 20 Apr
Tuesday 21 Apr
Wednesday 22 Apr
Time (hr
min)
Height (metr
e)
Time (hr
min)
Height (metr
e)
Time (hr
min)
Height (metr
e)
Time (hr
min)
Height (metr
e)
Time (hr
min)
Height (metr
e)
Time (hr
min)
Height (metr
e)
Time (hr
min)
Height (metr
e)
LOW 0006 0.30 0106 0.33 0200 0.36 0230 0.40 0313 0.46
HIGH 1339 1.40 1418 1.34 1506 1.28 1630 1.20 1100 1.02 1000 1.04 0950 1.10
LOW 2254 0.26 1300 1.01 1440 0.88 1530 0.72
HIGH 1830 1.15 1954 1.14 2108 1.15

���
�
Table B-5: High and low tide levels for Kudat
Thursday 16 Apr
Friday 17 Apr
Saturday 18 Apr
Sunday 19 Apr
Monday 20 Apr
Tuesday 21 Apr
Wednesday 22 Apr
Time (hr
min)
Height (metr
e)
Time (hr
min)
Height (metr
e)
Time (hr
min)
Height (metr
e)
Time (hr
min)
Height (metr
e)
Time (hr
min)
Height (metr
e)
Time (hr
min)
Height (metr
e)
Time (hr
min)
Height (metr
e)
LOW 0106 0.42 0200 0.43 0239 0.46 0310 0.50
HIGH 1336 1.71 1406 1.62 1500 1.53 1630 1.43 1830 1.40 1000 1.21 0947 1.28
LOW 2230 0.36 2354 0.40 1418 1.04 1513 0.86
HIGH 1950 1.39 2100 1.40
Table B-6: High and low tide levels for Kukup
Thursday 16 Apr
Friday 17 Apr
Saturday 18 Apr
Sunday 19 Apr
Monday 20 Apr
Tuesday 21 Apr
Wednesday 22 Apr
Time (hr
min)
Height (metr
e)
Time (hr
min)
Height (metr
e)
Time (hr
min)
Height (metr
e)
Time (hr
min)
Height (metr
e)
Time (hr
min)
Height (metr
e)
Time (hr
min)
Height (metr
e)
Time (hr
min)
Height (metr
e)
HIGH 0221 3.22 0300 3.02 0354 2.77 0530 2.57
LOW 0927 0.87 1011 1.08 1130 1.24 1324 1.21 0030 1.52 0218 1.33 0327 1.07
HIGH 1507 2.08 1552 1.84 1754 1.70 1954 1.85 0719 2.61 0823 2.76 0911 2.90
LOW 2046 0.98 2117 1.19 2213 1.42 1435 1.07 1519 0.92 1555 0.80
HIGH 2044 2.13 2116 2.46 2144 2.77
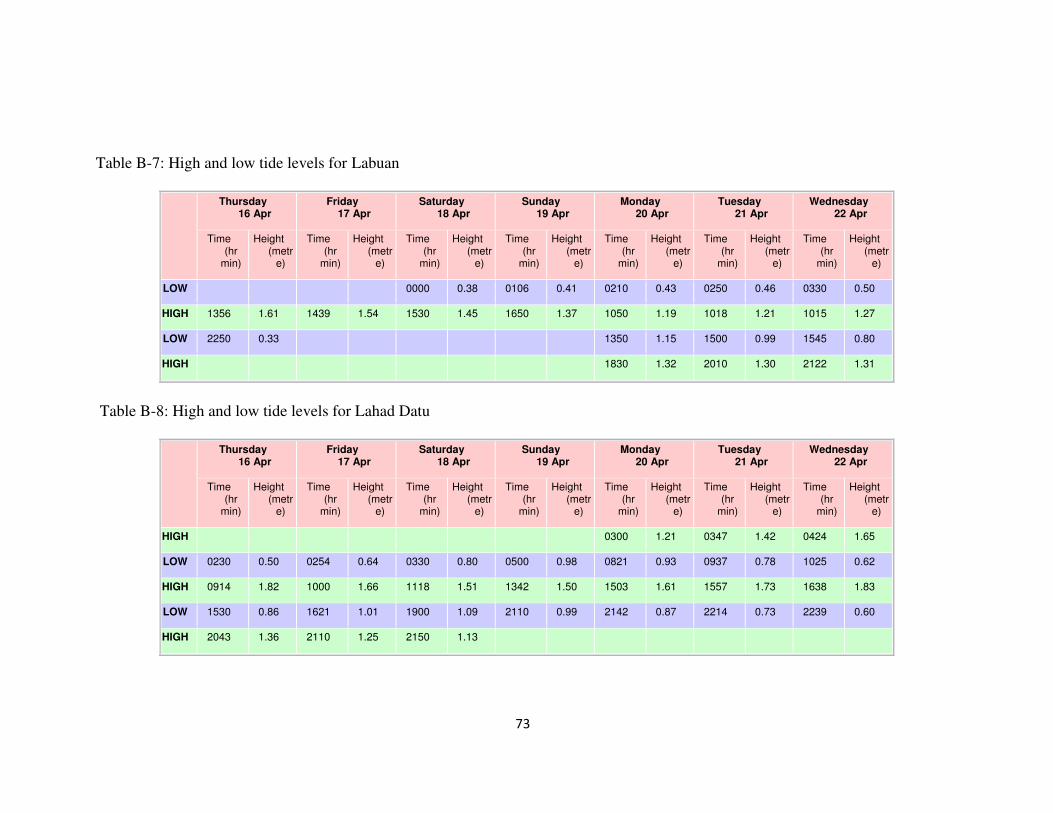
���
�
Table B-7: High and low tide levels for Labuan
Thursday 16 Apr
Friday 17 Apr
Saturday 18 Apr
Sunday 19 Apr
Monday 20 Apr
Tuesday 21 Apr
Wednesday 22 Apr
Time (hr
min)
Height (metr
e)
Time (hr
min)
Height (metr
e)
Time (hr
min)
Height (metr
e)
Time (hr
min)
Height (metr
e)
Time (hr
min)
Height (metr
e)
Time (hr
min)
Height (metr
e)
Time (hr
min)
Height (metr
e)
LOW 0000 0.38 0106 0.41 0210 0.43 0250 0.46 0330 0.50
HIGH 1356 1.61 1439 1.54 1530 1.45 1650 1.37 1050 1.19 1018 1.21 1015 1.27
LOW 2250 0.33 1350 1.15 1500 0.99 1545 0.80
HIGH 1830 1.32 2010 1.30 2122 1.31
Table B-8: High and low tide levels for Lahad Datu
Thursday 16 Apr
Friday 17 Apr
Saturday 18 Apr
Sunday 19 Apr
Monday 20 Apr
Tuesday 21 Apr
Wednesday 22 Apr
Time (hr
min)
Height (metr
e)
Time (hr
min)
Height (metr
e)
Time (hr
min)
Height (metr
e)
Time (hr
min)
Height (metr
e)
Time (hr
min)
Height (metr
e)
Time (hr
min)
Height (metr
e)
Time (hr
min)
Height (metr
e)
HIGH 0300 1.21 0347 1.42 0424 1.65
LOW 0230 0.50 0254 0.64 0330 0.80 0500 0.98 0821 0.93 0937 0.78 1025 0.62
HIGH 0914 1.82 1000 1.66 1118 1.51 1342 1.50 1503 1.61 1557 1.73 1638 1.83
LOW 1530 0.86 1621 1.01 1900 1.09 2110 0.99 2142 0.87 2214 0.73 2239 0.60
HIGH 2043 1.36 2110 1.25 2150 1.13

���
�
Table B-9: High and low tide levels for Langkawi
Thursday 16 Apr
Friday 17 Apr
Saturday 18 Apr
Sunday 19 Apr
Monday 20 Apr
Tuesday 21 Apr
Wednesday 22 Apr
Time (hr
min)
Height (metr
e)
Time (hr
min)
Height (metr
e)
Time (hr
min)
Height (metr
e)
Time (hr
min)
Height (metr
e)
Time (hr
min)
Height (metr
e)
Time (hr
min)
Height (metr
e)
Time (hr
min)
Height (metr
e)
HIGH 0315 1.94 0354 1.73 0515 1.55
LOW 0856 0.86 0924 1.08 1030 1.32 0130 1.14 0303 0.96 0347 0.76 0421 0.56
HIGH 1530 2.22 1605 2.01 1720 1.82 0845 1.61 0946 1.86 1015 2.12 1046 2.39
LOW 2145 0.90 2252 1.08 1345 1.38 1518 1.20 1605 0.97 1646 0.74
HIGH 1956 1.82 2120 2.02 2204 2.24 2244 2.44
Table B-10: High and low tide levels for Lumut
Thursday 16 Apr
Friday 17 Apr
Saturday 18 Apr
Sunday 19 Apr
Monday 20 Apr
Tuesday 21 Apr
Wednesday 22 Apr
Time (hr
min)
Height (metr
e)
Time (hr
min)
Height (metr
e)
Time (hr
min)
Height (metr
e)
Time (hr
min)
Height (metr
e)
Time (hr
min)
Height (metr
e)
Time (hr
min)
Height (metr
e)
Time (hr
min)
Height (metr
e)
HIGH 0008 1.56 0120 1.72 0210 1.89
LOW 0143 0.52 0221 0.68 0318 0.83 0457 0.89 0630 0.82 0730 0.66 0819 0.50
HIGH 0804 1.83 0857 1.73 1022 1.68 1213 1.75 1320 1.93 1408 2.12 1445 2.31
LOW 1356 0.90 1452 1.06 1640 1.15 1839 1.08 1945 0.92 2030 0.75 2105 0.57
HIGH 1948 1.86 2042 1.66 2213 1.53

��
�
Table B-11: High and low tide levels for Miri
Thursday 16 Apr
Friday 17 Apr
Saturday 18 Apr
Sunday 19 Apr
Monday 20 Apr
Tuesday 21 Apr
Wednesday 22 Apr
Time (hr
min)
Height (metr
e)
Time (hr
min)
Height (metr
e)
Time (hr
min)
Height (metr
e)
Time (hr
min)
Height (metr
e)
Time (hr
min)
Height (metr
e)
Time (hr
min)
Height (metr
e)
Time (hr
min)
Height (metr
e)
LOW 0000 0.31 0110 0.34 0200 0.37 0230 0.41 0306 0.48 0330 0.57
HIGH 1330 1.54 1415 1.47 1500 1.39 1600 1.30 1200 1.15 1115 1.11 1042 1.11
LOW 1330 1.14 1500 1.00 1554 0.82
HIGH 1800 1.22 2000 1.17 2140 1.14
Table B-12: High and low tide levels for Pelabuhan Kelang
Thursday 16 Apr
Friday 17 Apr
Saturday 18 Apr
Sunday 19 Apr
Monday 20 Apr
Tuesday 21 Apr
Wednesday 22 Apr
Time (hr
min)
Height (metr
e)
Time (hr
min)
Height (metr
e)
Time (hr
min)
Height (metr
e)
Time (hr
min)
Height (metr
e)
Time (hr
min)
Height (metr
e)
Time (hr
min)
Height (metr
e)
Time (hr
min)
Height (metr
e)
HIGH 0000 2.68 0150 2.79 0252 3.06 0340 3.38
LOW 0309 0.91 0339 1.25 0423 1.60 0622 1.80 0807 1.62 0914 1.29 1004 0.93
HIGH 0913 3.43 0952 3.16 1100 2.92 1302 2.91 1422 3.18 1520 3.53 1606 3.87
LOW 1515 1.21 1559 1.53 1730 1.81 1947 1.74 2103 1.46 2159 1.14 2245 0.80
HIGH 2125 3.27 2215 2.92

��
�
Table B-13: High and low tide levels for Pulau Lakei
Thursday 16 Apr
Friday 17 Apr
Saturday 18 Apr
Sunday 19 Apr
Monday 20 Apr
Tuesday 21 Apr
Wednesday 22 Apr
Time (hr
min)
Height (metr
e)
Time (hr
min)
Height (metr
e)
Time (hr
min)
Height (metr
e)
Time (hr
min)
Height (metr
e)
Time (hr
min)
Height (metr
e)
Time (hr
min)
Height (metr
e)
Time (hr
min)
Height (metr
e)
HIGH 0057 3.00 0200 3.30
LOW 0154 0.68 0238 0.89 0336 1.10 0446 1.26 0602 1.33 0709 1.30 0805 1.22
HIGH 0903 3.76 1001 3.64 1109 3.59 1216 3.64 1314 3.74 1357 3.86 1432 3.97
LOW 1444 2.13 1552 2.27 1721 2.26 1839 2.09 1939 1.81 2019 1.48 2052 1.12
HIGH 1944 3.16 2038 2.95 2156 2.80 2337 2.81
Table B-14: High and low tide levels for Pulau Pinang
Thursday 16 Apr
Friday 17 Apr
Saturday 18 Apr
Sunday 19 Apr
Monday 20 Apr
Tuesday 21 Apr
Wednesday 22 Apr
Time (hr
min)
Height (metr
e)
Time (hr
min)
Height (metr
e)
Time (hr
min)
Height (metr
e)
Time (hr
min)
Height (metr
e)
Time (hr
min)
Height (metr
e)
Time (hr
min)
Height (metr
e)
Time (hr
min)
Height (metr
e)
HIGH 0423 1.50 0518 1.35
LOW 1000 0.80 1020 1.00 0010 0.87 0250 0.90 0421 0.76 0500 0.59 0534 0.43
HIGH 1617 1.75 1654 1.58 0730 1.26 1030 1.39 1100 1.58 1121 1.77 1147 1.94
LOW 2308 0.73 1130 1.19 1600 1.20 1657 1.03 1734 0.85 1809 0.66
HIGH 1830 1.43 2100 1.45 2212 1.59 2258 1.76 2334 1.91

���
�
Table B-15: High and low tide levels for Pulau Tioman
Thursday 16 Apr
Friday 17 Apr
Saturday 18 Apr
Sunday 19 Apr
Monday 20 Apr
Tuesday 21 Apr
Wednesday 22 Apr
Time (hr
min)
Height (metr
e)
Time (hr
min)
Height (metr
e)
Time (hr
min)
Height (metr
e)
Time (hr
min)
Height (metr
e)
Time (hr
min)
Height (metr
e)
Time (hr
min)
Height (metr
e)
Time (hr
min)
Height (metr
e)
HIGH 0023 1.64 0056 1.54 0150 1.45
LOW 0656 0.47 0735 0.59 0830 0.72 0020 1.29 0108 1.17 0130 1.04 0158 0.91
HIGH 1450 2.42 1541 2.34 1642 2.27 0330 1.37 0530 1.42 0654 1.60 0751 1.83
LOW 2130 1.39 2300 1.37 0942 0.85 1103 0.93 1230 0.95 1330 0.91
HIGH 1742 2.23 1835 2.20 1917 2.18 1954 2.13
Table B-16: High and low tide levels for Sandakan
Thursday 16 Apr
Friday 17 Apr
Saturday 18 Apr
Sunday 19 Apr
Monday 20 Apr
Tuesday 21 Apr
Wednesday 22 Apr
Time (hr
min)
Height (metr
e)
Time (hr
min)
Height (metr
e)
Time (hr
min)
Height (metr
e)
Time (hr
min)
Height (metr
e)
Time (hr
min)
Height (metr
e)
Time (hr
min)
Height (metr
e)
Time (hr
min)
Height (metr
e)
HIGH 0330 1.02 1500 1.93 1606 1.78
LOW 0550 0.99 2306 0.69 0130 0.67 0230 0.61 0302 0.56 0330 0.55
HIGH 1419 2.08 1747 1.69 1045 1.42 1013 1.49 1008 1.59
LOW 2130 0.60 1418 1.29 1503 1.07 1541 0.84
HIGH 1922 1.70 2045 1.74 2146 1.78

���
�
Table B-17: High and low tide levels for Sejingkat
Thursday 16 Apr
Friday 17 Apr
Saturday 18 Apr
Sunday 19 Apr
Monday 20 Apr
Tuesday 21 Apr
Wednesday 22 Apr
Time (hr
min)
Height (metr
e)
Time (hr
min)
Height (metr
e)
Time (hr
min)
Height (metr
e)
Time (hr
min)
Height (metr
e)
Time (hr
min)
Height (metr
e)
Time (hr
min)
Height (metr
e)
Time (hr
min)
Height (metr
e)
HIGH 0059 3.76 0203 4.05
LOW 0225 0.77 0305 1.01 0357 1.25 0503 1.43 0616 1.49 0724 1.44 0823 1.32
HIGH 0921 4.53 1013 4.33 1113 4.21 1218 4.20 1315 4.30 1405 4.44 1445 4.60
LOW 1502 1.91 1558 2.12 1707 2.23 1821 2.16 1926 1.94 2019 1.62 2103 1.25
HIGH 2026 4.05 2116 3.80 2224 3.61 2346 3.60
Table B-18: High and low tide levels for Tanjung Gelang
Thursday 16 Apr
Friday 17 Apr
Saturday 18 Apr
Sunday 19 Apr
Monday 20 Apr
Tuesday 21 Apr
Wednesday 22 Apr
Time (hr
min)
Height (metr
e)
Time (hr
min)
Height (metr
e)
Time (hr
min)
Height (metr
e)
Time (hr
min)
Height (metr
e)
Time (hr
min)
Height (metr
e)
Time (hr
min)
Height (metr
e)
Time (hr
min)
Height (metr
e)
LOW 0600 0.50 0636 0.61 0721 0.76 0830 0.90 0154 1.14 0147 1.05 0157 0.95
HIGH 1426 2.54 1521 2.48 1620 2.43 1720 2.40 0530 1.24 0656 1.45 0745 1.70
LOW 1010 1.03 1141 1.07 1250 1.08
HIGH 1814 2.35 1853 2.30 1930 2.22

� �
�
Table B-19: High and low tide levels for Tanjung Keling
Thursday 16 Apr
Friday 17 Apr
Saturday 18 Apr
Sunday 19 Apr
Monday 20 Apr
Tuesday 21 Apr
Wednesday 22 Apr
Time (hr
min)
Height (metr
e)
Time (hr
min)
Height (metr
e)
Time (hr
min)
Height (metr
e)
Time (hr
min)
Height (metr
e)
Time (hr
min)
Height (metr
e)
Time (hr
min)
Height (metr
e)
Time (hr
min)
Height (metr
e)
HIGH 0009 1.76 0130 1.59 0342 1.54 0500 1.63 0543 1.72
LOW 0557 0.87 0640 1.04 0800 1.16 1050 1.11 1130 0.98 1157 0.82 0012 0.50
HIGH 1108 1.45 1137 1.35 1200 1.25 1510 1.21 1654 1.42 1749 1.68 0613 1.79
LOW 1734 0.34 1824 0.47 1938 0.60 2145 0.65 2310 0.57 1225 0.65
HIGH 1824 1.93
Table B-20: High and low tide levels for Tanjung Sedili
Thursday 16 Apr
Friday 17 Apr
Saturday 18 Apr
Sunday 19 Apr
Monday 20 Apr
Tuesday 21 Apr
Wednesday 22 Apr
Time (hr
min)
Height (metr
e)
Time (hr
min)
Height (metr
e)
Time (hr
min)
Height (metr
e)
Time (hr
min)
Height (metr
e)
Time (hr
min)
Height (metr
e)
Time (hr
min)
Height (metr
e)
Time (hr
min)
Height (metr
e)
HIGH 0037 1.56 0110 1.49 0154 1.41
LOW 0756 0.28 0839 0.36 0930 0.48 0018 1.25 0120 1.14 0200 1.00 0235 0.85
HIGH 1526 2.10 1625 2.03 1720 1.99 0330 1.32 0518 1.32 0656 1.44 0803 1.63
LOW 2130 1.30 2250 1.31 1036 0.59 1152 0.69 1312 0.73 1416 0.74
HIGH 1824 1.96 1915 1.94 1957 1.92 2030 1.90

���
�
Table B-21: High and low tide levels for Tawau
Thursday 16 Apr
Friday 17 Apr
Saturday 18 Apr
Sunday 19 Apr
Monday 20 Apr
Tuesday 21 Apr
Wednesday 22 Apr
Time
(hr min)
Height (metre)
Time (hr min)
Height (metre)
Time (hr min)
Height (metre)
Time (hr min)
Height (metre)
Time (hr min)
Height (metre)
Time (hr min)
Height (metre)
Time (hr min)
Height (metre)
HIGH 0015 1.78 0340 1.98 0415 2.27 0443 2.57
LOW 0235 0.89 0257 1.13 0319 1.39 0530 1.67 0903 1.49 0956 1.18 1032 0.87
HIGH 0933 2.77 1009 2.54 1112 2.32 1313 2.22 1517 2.36 1614 2.58 1655 2.78
LOW 1537 1.06 1625 1.32 1845 1.50 2103 1.37 2151 1.14 2223 0.90 2251 0.68
HIGH 2138 2.14 2217 1.93
���
�
APPENDIX C
MICROSOFT EXCEL WORKSHEET FOR BEAMS
COMBINATION FOR TELESCOPIC WALKWAY STRESS
ANALYSIS

���
�
�� ��
���������� ��
�����
����
�� �������
�������
�������������� �
��� ���� �������������� ��������� ���
���� ����
������
���������
!��"����
������
���
������
���� �
��#��
��� ����
���� �
"$�����
!��"��
�����
%��
&���
� �'��
���� �
"$�����
!��"��
�����
%�� ��(�
���$��
���
)�����
����
������
���������
!��"����
������
���
������
���� �
��#��
���
����
����
�
"$��
���
!��
"����
��#
��
&���
� �'��
���� �
"$�����
!��"��
��
��#��
�'���
�� '�����
��'��
��
��'�
���
��'��
�� �'�����
����'� �
�
�'����
")���
�'����
")���
*
�� �'�
�
����'
�����
*
�� �'�
� �'����� +,-&.�/�
+,-&
.�/�
+,-&.�
/�
�'��
�� �'����
���'��
� �
��'
���
��'��
��� ����'�����
�� �'� �
��
�'����
")���
*
'���
"*���
*
���� '�
����
��� �'
�����
*
��� '�
���� *�����'���� +,-&.�/�
+,-&
.�/�
+,-&.�
/�
�'��
�� �'����
���'�
���
���'
�� �
���'��
� ��� '�����
�����'���
��
�'���
")���
*
�'���
"*���
*
���'�
��
� ��'
����
*
� ��'�
�� *����'����� +,-&.�/�
+,-&
.�/�
+,-&.�
/�
�'��
�� �'����
���'�
���
���'�
����
����'��
�� ��'�����
����'��
��
�'����
")���
*
�'���
"*���
*
����'�
���
� ��'
���
*
����'�
��� *�����'� �� +,-&.�/�
+,-&
.�/�
+,-&.�
/�
�'���
�� �'�����
���'
�
�'
����
���' �
��� ��� '�����
��� �'��
�
�'���
")���
*
�'��
"*���
*
���'�
����
����'
����
*
���'�
���� *����'����� +,-&.�/�
+,-&
.�/�
+,-&.�
/�
�'��
�� �'����
���'��
��
����'
���
���'�
��� � �'��� ����'���
�'�
")���
*
�'���
"*���
*
�� �'�
����
����'
���
*
�� �'�
���� *� '� �� +,-&.�/�
+,-&
.�/�
+,-&.�
/�
�'��
�� �'����
����'�
� �
�� ��'
�����
*
���'��
�� ���'���� * ��'�����
�'���
")���
*
�'
"*���
*
� ��'
����
����'
�� ��
*
���'
���� * ��'� �� +,-&.�/�
+,-&
.�/�
+,-&.�
/�
�'��
�� �'����
���'
��
����'
����
*
���'��
�� �� �'�� ��
*
���'�� ��
�' ���
"*���
*
�'��
"*���
*
���'
���
� '
����
*
�� �'
��� *������'���� +,-&.�/�
+,-&
.�/�
+,-&.�
/�
�'���
�� �'�����
��'�
� �
���'
�����
*
���' �
��� *����'���
*
�� '��
��
*
'���
"*���
'���
"*���
*
����'
����
���'
� ��
*
����'
���� *��� �'����� +,-&.�/�
+,-&
.�/�
+,-&.�
/�

���
�
�'��
��
�'����
�� �'
��
�� �'
����
*
� �'��
��� *���'���
*
��� �'��
��
*
�'��
")���
�'���
"*���
*
���'
���
������
'��� �
*
����'
��� *�����'��� +,-&.�/�
+,-&
.�/�
+,-&.�
/�
�'��
�� �'���� �'�����
����'
�����
*
��'��
�� * �'����
*
����'� �
�
*
'��
")���
'��
"*���
*
� ���'�
� ��
����
'����
*
����'�
� �� *����'���� +,-&.�/�
+,-&
.�/�
+,-&.�
/�
�'��
�� �'����
*
����' �
��
���� '
����
*
�����'�
��� *���'����
*
���'��
�
*
'����
")���
�'����
"*���
*
��� '�
���
�����
' ���
*
� '�
��� *����� '���� +,-&.�/�
+,-&
.�/�
+,-&.�
/�
�'���
�� �'�����
*
����'��
���
� ��'
����
*
�����'
��� *���'� ��
*
����'���
��
*
�'��
")���
�'��
"*���
*
���'�
��
���� �
' �� �
*
���'�
�� *�����'� � � +,-&.�/�
+,-&
.�/�
+,-&.�
/�
�'��
�� �'����
*
�'�
���
����'
����
*
���'
�� *��� �'���
*
��� �'��
��
*
�'��
")���
�'�� �
"*���
*
����'�
�� �
������
'�� ��
*
���'�
�� � *���� �' ��� +,-&.�/�
+,-&
.�/�
+,-&.�
/�
�'��
�� �'����
*
����'�
��
���'
����
*
�� ��'�
�� *����' ���
*
� ���'� �
��
*
�'����
")���
�' ��
"*���
*
���'�
���
�����
'���
*
��� ��'
���� *�� �'��� � +,-&.�/�
+,-&
.�/�
+,-&.�
/�
�'��
�� �'����
*
����'�
����
���'
���
*
��� '�
���� *�� ��'��� �
*
��� ��'�
��
*
�'���
")���
�'�� �
"*���
*
���'
���
���
'�����
*
�����'
��� *����'�� � +,-&.�/�
+,-&
.�/�
+,-&.�
/�
�'���
�� �'�����
*
�� �'�
�
�����'
�����
*
����'�
���� *�����'�����
*
�� ����'��
��
*
' ��
")���
'����
"*���
*
���� �'
�� �
�� ��
'����
*
���� �'
�� � *��� � '� � +,-&.�/�
+,-&
.�/�
+,-&.�
/�
�'��
�� �'����
*
��� '�
����
����'
���
*
�����'�
�� � *�� �'����
*
�����'��
�
*
�'���
")���
'��
"*���
*
�����'
�� ��
������
'� ��
*
�����'
�� �� *�����'��� +,-&.�/�
+,-&
.�/�
+,-&.�
/�
�'��
�� �'����
*
����'�
� ��
���'
����
*
����'�
�� *���'�� ��
*
�� � ��'��
�
*
�'���
")���
�'���
")���
*
�� �� '
���
�����
'�����
*
���� '
��� *����'���� +,-&.�/�
+,-&
.�/�
+,-&.�
/�
�'��
�� �'����
*
������'
��
�����
'����
*
����'
��� *�� �'���
*
�����'��
���
*
�'���
")���
�' �
")���
*
����'
�����
��� ��
'����
*
����'
����� *���'���� +,-&.�/�
+,-&
.�/�
+,-&.�
/�
'���
�� �'����� +,-&.�/� +,-&.�/� +,-&.�/� +,-&.�/� +,-&.�/�
+,-&.�
/�
+,-&.�
/� +,-&.�/� +,-&.�/� +,-&.�/� +,-&.�/� +,-&.�/�
+,-&
.�/�
+,-&.�
/�
�
�
�
�
Table continued

���
�
�� ��
��������� ��
�����
����
�� �������
�������
�������������� ���� ���� �������������� ��������� ���
���� ����
������
���������
!��"����
������
���
���������� �
��#��
���
����
����
�
"$��
���
!��
"����
���
%��
&���
� �'��
���� �
"$�����
!��"��
�����
%�� ��(�
���$��
���
)������
���
������
���������
!��"����
������
���
���������� �
��#��
���
����
����
�
"$��
���
!��
"����
��#
��
&���
� �'��
���� �
"$�����
!��"��
��
��#��
�'���
�� '�����
���'��
���
���'�
����
���'���
�� �'����� +,-&.�/�
+,-&
.�/� +,-&.�/�
*
����'
�����
����'
�����
*
����'��
��� �'����� +,-&.�/�
+,-&
.�/� +,-&.�/�
�'��
�� �'����
��'��
��
��'�
� �
���'���
� ���'��� +,-&.�/�
+,-&
.�/� +,-&.�/�
*
� ���'
�����
����'
�����
*
� ��'��
��� * ��'����� +,-&.�/�
+,-&
.�/� +,-&.�/�
�'��
�� �'����
���'��
���
'
��
����'���
�� ��'�� +,-&.�/�
+,-&
.�/� +,-&.�/�
*
�����'
�����
���'
�����
*
�����'��
��� *�����'����� +,-&.�/�
+,-&
.�/� +,-&.�/�
�'��
�� �'����
� ��'��
�
���'�
���
����'��
� ����'����� +,-&.�/�
+,-&
.�/� +,-&.�/�
*
����'
�����
���'
�����
*
����'��
��� *����'����� +,-&.�/�
+,-&
.�/� +,-&.�/�
�'���
�� �'�����
���'��
���
���'�
����
����'���
�� ����'����� +,-&.�/�
+,-&
.�/� +,-&.�/�
*
�����'
�����
�����'
�����
*
����'��
��� *� ���'����� +,-&.�/�
+,-&
.�/� +,-&.�/�
�'��
�� �'����
����'��
���
����'�
����
����'���
�� ���'����� +,-&.�/�
+,-&
.�/� +,-&.�/�
*
����'
�����
����'
�����
*
����'��
��� *�'����� +,-&.�/�
+,-&
.�/� +,-&.�/�
�'��
�� �'����
����'�
���
���'�
���
*
���'���� ����'���� +,-&.�/�
+,-&
.�/� +,-&.�/�
*
����'
�����
�����'
�����
*
���'��
��� *�����'����� +,-&.�/�
+,-&
.�/� +,-&.�/�
�'��
�� �'����
�� '��
���
���'�
��
*
����'�
�� ����'���� +,-&.�/�
+,-&
.�/� +,-&.�/�
*
����'
�����
�����'
�����
*
����'��
��� *�����'����� +,-&.�/�
+,-&
.�/� +,-&.�/�
�'���
�� �'�����
����'��
���
�����'
�����
*
����'���
�� *���'����� +,-&.�/�
+,-&
.�/� +,-&.�/�
*
����'
�����
�����'
�����
*
����'��
��� *������'����� +,-&.�/�
+,-&
.�/� +,-&.�/�

��
�
�'��
��
�'����
�� �' �
��
�� � '
� � �
*
��� '� �
� *���'��� +,-&.�/�
+,-&
.�/� +,-&.�/�
*
����'
�����
�����'
�����
*
����'��
��� *�����'����� +,-&.�/�
+,-&
.�/� +,-&.�/�
�'��
�� �'���� �'�����
�����'
�����
*
���'���
�� *���'����� +,-&.�/�
+,-&
.�/� +,-&.�/�
*
���'
�����
����'
�����
*
�����'��
��� *�����'����� +,-&.�/�
+,-&
.�/� +,-&.�/�
�'��
�� �'����
*
����'��
���
�����'
�����
*
� ��'���
�� *�����'�� +,-&.�/�
+,-&
.�/� +,-&.�/�
*
���'
�����
����'
�����
*
���'��
��� *� ���'����� +,-&.�/�
+,-&
.�/� +,-&.�/�
�'���
�� �'�����
*
����'��
���
����'
�����
*
�����'��
��� *� ���'����� +,-&.�/�
+,-&
.�/� +,-&.�/�
*
�����'
�����
���'
�����
*
� ���'��
��� *�����'����� +,-&.�/�
+,-&
.�/� +,-&.�/�
�'��
�� �'����
*
���'�
���
�����'
����
*
�� ��'�
��� *� �� '���� +,-&.�/�
+,-&
.�/� +,-&.�/�
*
����'
�����
���'
�����
*
�����'��
��� *���'����� +,-&.�/�
+,-&
.�/� +,-&.�/�
�'��
�� �'����
*
����'��
���
�����'
�����
*
����'��
��� *�����'����� +,-&.�/�
+,-&
.�/� +,-&.�/�
*
�����'
�����
������
'�����
*
����'��
��� *������'����� +,-&.�/�
+,-&
.�/� +,-&.�/�
�'��
�� �'����
*
�����'�
����
�����'
�����
*
�����'��
��� *���'����� +,-&.�/�
+,-&
.�/� +,-&.�/�
*
�����'
�����
�����
'�����
*
����'��
��� *����'����� +,-&.�/�
+,-&
.�/� +,-&.�/�
�'���
�� �'�����
*
�����'�
����
�����'
�����
*
����'��
��� * ����'����� +,-&.�/�
+,-&
.�/� +,-&.�/�
*
�����'
�����
������
'�����
*
���'��
��� *����'����� +,-&.�/�
+,-&
.�/� +,-&.�/�
�'��
�� �'����
*
�����'�
����
�����'
�����
*
�����'��
��� *����'����� +,-&.�/�
+,-&
.�/� +,-&.�/�
*
�����'
�����
������
'�����
*
����'��
��� *� ���'����� +,-&.�/�
+,-&
.�/� +,-&.�/�
�'��
�� �'����
*
�����'�
����
����'
�����
*
����'��
��� *������'����� +,-&.�/�
+,-&
.�/� +,-&.�/�
*
����'
�����
������
'�����
*
������'�
���� *�� ���'����� +,-&.�/�
+,-&
.�/� +,-&.�/�
�'��
�� �'����
*
������'
�����
������
'�����
*
�� ���'�
���� *����'����� +,-&.�/�
+,-&
.�/� +,-&.�/�
*
����'
�����
������
'�����
*
������'�
���� *����'����� +,-&.�/�
+,-&
.�/� +,-&.�/�
'���
�� �'����� +,-&.�/� +,-&.�/� +,-&.�/� +,-&.�/� +,-&.�/�
+,-&
.�/� +,-&.�/�
+,-&.�
/� +,-&.�/� +,-&.�/� +,-&.�/� +,-&.�/�
+,-&
.�/� +,-&.�/�
�
Table continued

��
�
APPENDIX D
ANSYS OUTPUT WINDOW

���
�

���
�

� �
�


![Anil Kumar Jaiswal (MBA Dissertation/Project) - 2010 [Bad Debts Reduction in EBU Segment]](https://img.pdfslide.net/doc/110x75/5527bc65497959ec0f8b4ac8/anil-kumar-jaiswal-mba-dissertationproject-2010-bad-debts-reduction-in-ebu-segment.jpg)

