Embed Size (px)
Citation preview

Evaluation of Shallow Soil Geochemical Data from
Boliden Tara Mines’ Prospecting Licence
Areas 3545 & 3488 using an
Integrated Factor Analysis & GIS Method
by
Raymond E. Healy
Consulting Geologist
E-mail: [email protected]
May 22nd 2014

R. E. Healy, 2014 Evaluation of Soil Geochemical Data from Boliden’s PL Areas 3545 & 3488
1 Contains Ordnance Survey Ireland data © OSi 2012.
DECLARATION
This project was undertaken by Raymond E. Healy, who alone discharged all aspects
of the research, including preparation of this report, which is his sole responsibility. Mr. Healy
formerly operated as the consulting firm Minoretek in Winnipeg, Manitoba, Canada, where
he held the professional designation of P.Geo. Mr. Healy has over twenty years experience in
mining and exploration geology, principally in the field of applied mineralogy.
This report was prepared using data under licence from the Geological Survey of
Ireland (GSI), the Central Statistics Office (CSO), the Environmental Protection Authority
(EPA), and the Ordinance Survey of Ireland (OSI)1.
The findings in this report reflect Mr. Healy’s best judgement based on the analysis of
the data and other information available at the time of writing, and he reserves the right to
revise these findings if further information germane to the subject should subsequently come
to light. Use of this report is predicated on the reader’s understanding and acceptance of the
foregoing, and the copyright statement below.
Signed:
Copyright (c) 2014 by Raymond E. Healy.
This report is made available under the terms of the Creative Commons
Attribution-ShareAlike 3.0 License http://creativecommons.org/licenses/by-sa/3.0/

R. E. Healy, 2014 Evaluation of Soil Geochemical Data from Boliden’s PL Areas 3545 & 3488
TABLE OF CONTENTS
1. ABSTRACT . . . . . . . . . . . . . . . . . . . . . . . . . . . . . . . . . . . . . . . . . . . . . . . . . 1
2. INTRODUCTION . . . . . . . . . . . . . . . . . . . . . . . . . . . . . . . . . . . . . . . . . . . . 2
3. METHOD - INTEGRATED USE OF FACTOR ANALYSIS AND GIS . . . . . . . 6
4. LOCAL GEOLOGY . . . . . . . . . . . . . . . . . . . . . . . . . . . . . . . . . . . . . . . . . . . 9
5. COOLTOMIN GEOCHEMICAL DATA SET . . . . . . . . . . . . . . . . . . . . . . . . 15
5.1. STATISTICAL ANALYSIS . . . . . . . . . . . . . . . . . . . . . . . . . . . . . . 16
5.1.1 Correlation Analysis . . . . . . . . . . . . . . . . . . . . . . . . . . 21
5.1.2. Factor Analysis . . . . . . . . . . . . . . . . . . . . . . . . . . . . . . 23
5.2. SPATIAL ANALYSIS . . . . . . . . . . . . . . . . . . . . . . . . . . . . . . . . . . 32
5.2.1. Soil Maps . . . . . . . . . . . . . . . . . . . . . . . . . . . . . . . . . . . 33
5.2.2. Effect of Undetermined Components in Soil . . . . . 35
5.2.3. Metal Dispersion and Sampling . . . . . . . . . . . . . . . . 37
5.2.4. Spatial Modelling of Factor Scores . . . . . . . . . . . . . . 38
6. DISCUSSION AND CONCLUSIONS . . . . . . . . . . . . . . . . . . . . . . . . . . . . . 48
7. REFERENCES . . . . . . . . . . . . . . . . . . . . . . . . . . . . . . . . . . . . . . . . . . . . . . 54
8. APPENDIX . . . . . . . . . . . . . . . . . . . . . . . . . . . . . . . . . . . . . . . . . . . . . . . . 61

R. E. Healy, 2014 Evaluation of Soil Geochemical Data from Boliden’s PL Areas 3545 & 3488
1
1. ABSTRACT
A geochemical data set from a study area straddling PL Areas 3545 and 3488, from the
southwestern end of the Irish orefield, was interrogated using an integrated Factor Analysis and GIS method.
Ten factors were extracted from the data set of 42 inorganic elements in 1,421 soil samples. The factors
constitute geochemical associations that reflect underlying geochemical processes, including ore-forming and
secondary dispersion processes, related to Irish Type carbonate-hosted Zn-Pb mineralization. The spatial
distribution of the factors was mapped by interpolating the factor scores using Ordinary Kriging.
Five pedogenic factors were identified, including the overwhelmingly dominant F1, which is
attributed to variable clay-oxide contents due to podzolisation. F3 has significant loadings for Ca, Mg, Sr, Ca
and La, and describes variation in the leaching of elements associated with carbonates, and retention of
elements associated with resistate minerals, due to gleisation. F4 has significant loadings for Fe, Co, Mn and
Ni, and reflects the variation in the content of Fe-Mn oxides-hydroxides, which co-precipitate and scavenge
Co and Ni. Two other pedogenic factors describe variation in Y (F7), and in Ge and Tl (F9), whilst F10 is the
only anthropogenic factor identified, and likely describes the application of P in fertiliser and sludge.
Two ore-related factors are identified. F2 has significant loadings for Bi, Cu, Pb, Sb, Sn, Te and Zn,
and reflects the signature of Irish Type Zn-Pb mineralisation due to mechanical dispersion in till of ore-related
elements with low mobility in an alkaline secondary environment. F6 is also an ore-related factor, with
significant loadings for As and Sb, and shows numerous minor peaks clustered in a arc west and south of the
major F2 anomaly at Cooltomin. The major F6 anomaly coincides with the northern end of the Cooltomin F2
anomaly. Differences in the distributions of F2 and F6 are not explicable by secondary mechanical or
hydromorphic dispersion, and likely reflect the greater primary dispersion of As and Sb as highly
differentiated vein mineralisation. Two ‘possibly’ ore-related factors are identified. F5 has significant loadings
for S, Se and U, with minor loadings for Cd, Mo and V. This is an association of elements that are very mobile
in oxidising alkaline environment, but for which reducing conditions, such as in gleys and peaty soils, act as a
geochemical barrier, giving rise as ‘false' anomalies. All F5 anomalies are potentially explicable in terms of
‘false' anomalies. F8 has a single significant loading for Cd. F8 peaks coincide largely with areas which form
geochemical barriers to Cd (e.g., gleys) generating ‘false' anomalies, characteristically without associated Zn.
The F2 scores show a strong anomaly centred on Irish Grid Ref. 131700,144550 at Cooltomin. The
anomaly extends 900m in a N-S direction, and most probably overlies subcroping mineralisation, or is
displaced laterally by glacial movement and/or soil creep, and presents a highly prospective target. Other
prospective targets include: (1) minor anomaly overlying Rathkeale Beds at Gortroe (131100,143100); (2)
cluster of satellite anomalies on the Waulsortian-Rathkeale contact west of Cooltomin (centred at 131100,
144250), especially given the association with a major NE fault, and the latter's association with volcanics;
and (3) minor anomaly overlying Rathkeale Beds at Ranahan (132150,143250). The principal F5 peak at
132850,144075 is probably a ‘false’ anomaly, but cannot be rejected given the association with a major fault
which likely acted as conduits for mineralising fluids.
The soil samples were taken from the A horizon, and are thus shallow and vulnerable to several
deleterious effects, which can obscure the signature of mineralisation. Some anomalous features in the data
are attributable to soil type effects and possibly anthropogenic effects associated with shallow samples. The
geochemical method employed is a partial extraction, and does not include silicate minerals that are
insoluble during acid digestion (e.g., quartz) or organic matter. These unanalysed and gravimetrically
significant soil components are a determinant in the chemical and factor analysis. Calculation of Total
Normative Mineralogy allowed identification of soils with high contents of unanalysed components, such as
at Ardlaman, and which cannot be explained on the basis of the indicated soil types. Imprecise sampling of
the A horizon can generate variable organic content, highlighting the sensitivity of shallow soil sampling.
The study has shown that Factor Analysis integrated with GIS is a powerful technique for
interrogating geochemical data, and has the potential to be extremely useful in geochemical surveying
applied to mineral exploration. The superior spatial definition and pattern recognition afforded by the
technique, can discriminate the signatures due to ore-forming processes or secondary dispersion of
mineralisation, and thereby potentially enhance anomaly detection and target generation.

R. E. Healy, 2014 Evaluation of Soil Geochemical Data from Boliden’s PL Areas 3545 & 3488
2
2. INTRODUCTION
Geochemistry is widely used in geology, soil science, and in the wider environmental
sciences. Conventional treatment of geochemical data focusses predominantly on descriptive,
univariate and bivariate statistical techniques that evaluate the characteristics of individual
elements or element pairs in isolation. Using the geo-coordinates of the samples, the spatial
distribution of individual elemental concentrations or ratios of elemental concentrations are
also routinely rendered as maps and sections.
Geochemical data sets are intrinsically multivariate, and the full potential of these
data sets, which is typically obscured by complex inter-element relationships and
associations, can only be identified by multivariate statistical techniques. Multivariate
statistical techniques such as Factor Analysis (FA) offer a more integrated approach to
multi-element analysis, in which the inter-relationships of all the elements in a data set are
modelled simultaneously. FA attempts to resolve the structure within the correlation
coefficient matrix by clustering a large number of elements into a small number of
uncorrelated, generalised factors, each of which describes significant variation in the data
(Davis 1986). The extracted factors constitute geochemical associations that describe the
variation in the raw data, and are interpreted to reflect underlying geochemical processes.
Factor scores describe the degree to which the factors are expressed in the
composition of the samples (Davis 1986). The scores are thus estimates of the contribution of
the factors to each original variable and can be calculated for each sample. In practise it may
be possible to classify the samples into coherent groups on the basis of the factor scores of
each sample using appropriate scatter plots (Healy & Petruk 1994). Importantly, rather than
mapping the distribution of individual elements or element pairs, the expression of
geochemical processes as described by the factors can be mapped on the basis of the spatial
distribution of factor scores.
Using an integrated Factor Analysis & GIS method, Healy (2013) investigated the
Dublin Surge data set, which consists of elemental concentrations for 31 inorganic elements
in 1,058 topsoil samples from across the Greater Dublin Area (Glennon et al. 2012). The
Dublin Surge project is a baseline study of heavy metals and persistent organic pollutants in
the topsoils in the Greater Dublin Area. The Factor Analysis & GIS method discriminated six
coherent geochemical associations from the data set, and allowed spatial modelling of the
expression of the underlying geochemical processes.
The superior spatial definition and pattern recognition provided by the method is
potentially exploitable for target identification in mineral exploration applications. The
capability of the method to extract the signature of individual geochemical processes offers
the potential to isolate the signature of ore-forming processes from the masking effects of
other geochemical processes, and thus allow improved target identification through the more
precise modelling of its spatial distribution.

R. E. Healy, 2014 Evaluation of Soil Geochemical Data from Boliden’s PL Areas 3545 & 3488
3
Geochemistry is one of the four principal tools used in exploration for buried mineral
deposits, a multi-disciplinary exercise that also uses geophysics, remote sensing and
geological mapping. Geochemical anomalies are often expressed by more than one element,
reflecting suites of associated elements specific to the ore-forming process of each type of
ore deposit (McQueen 2008). However, differences in geological, geomorphological and
environmental settings can impart unique surface geochemical signatures to individual
deposits. Consequently, geochemical prospecting demands rigorous analysis, not least to
extract the signatures due to regolith and pedogenic processes, soil type effects or
anthropogenic effects. The utility of exploration geochemistry has been demonstrated in
terrain with thick, transported glacial cover, such as Canada and Ireland (Levinson 1974,
McClenaghan 2007, DCMNR 2006). Indeed, geochemistry has played a critical role in the
discovery of each of the major Irish base metal deposits (i.e., Silvermines in 1963, Gortdrum
in 1966, Tynagh in 1967, Navan in 1970, Galmoy in 1986, and Lisheen in 1990), and often
using shallow soil geochemistry (DCMNR 2006, Ashton 2006).
Boliden Tara Mines, hereinafter referred to as Boliden, agreed to trial the integrated
Factor Analysis and GIS method on a geochemical data set from Prospecting Licence Areas
3545 and 3488 at the southwestern terminus of the Irish Orefield, immediately northwest of
Rathkeale, Co. Limerick (See Fig. 1). Boliden holds these Licence Areas in order to explore for
Irish Type carbonate-hosted Zn-Pb mineralisation, specifically targeting “base-of-Waulsortain
hosted zinc-lead mineralisation related to early Visean faulting” (Tara Mines 2004). The two
Prospecting Licence areas are contiguous, and lie within the Navan-Silvermines mineral trend,
approximately 9km south of the Courtbrown Zn-Pb deposit. Weakly disseminated Ag, As, Cd,
Cu, Fe, Pb, Sb and Zn sulfide mineralisation has been intersected by drilling, and is hosted
principally in Waulsortian Reef Limestone, and secondarily in Rathkeale Beds and Ballysteen
Limestone, with associated enrichments of Hg, Mo, Te, Tl, W, Th and U (Blakeman pers.
comm. 2014). Blakeman also notes that multi-element soil anomalies exhibit strong structural
control, and are dominated by Pb, Zn and minor Cu values, with attendant As, Cd and Sb.
The study area measures roughly 2 x 4 kms, and comprises 41 N-S oriented sampling
traverses spaced 100m apart with sampling approximately every 50m (See Fig. 2). The
traverses transect the roughly east-west trending contact between Waulsortian limestones
and the Rathkeale Formation. The sampling is not uniform throughout the study area, with
several un-sampled sections, particularly in the southeast of the study area. Although these
represent significant deviations from systematic sampling, Kriging is effective in interpolating
the results from non-random and clustered samples. The soil samples were collected by hand
auger, consistently from the shallow A horizon of the soil.
The data set as received from Boliden consists of elemental concentrations for 46
inorganic elements in 1,421 topsoil samples, and for convenience is hereafter referred to as
the Cooltomin geochemical data set.

R. E. Healy, 2014 Evaluation of Soil Geochemical Data from Boliden’s PL Areas 3545 & 3488
4
Figure 1. General geology map of the southwestern end of the Irish orefield (See inset for approximate location), showing the boundaries of the
prospecting licence areas. Note that the study area (i.e., hatched area outlined in red) is located in prospecting licence areas 3545 and 3488 at the centre of
the map, northwest of Rathkeale. Data from Geological Survey of Ireland, Ordnance Survey of Ireland, and the Central Statistics Office.

R. E. Healy, 2014 Evaluation of Soil Geochemical Data from Boliden’s PL Areas 3545 & 3488
5
Figure 2. Map of the study area straddling the boundary between Prospecting Licence Areas 3545 and 3488, and showing the 1,421 sampling points along 41 N-S
oriented traverses. The boundary of the study area is outlined in red. Contacts of the major geological units, namely Durnish Fm. (DU), Rathkeale Fm. (RK), Visean
Limestones (VIS), and Waulsortian Limestones (WA) are shown in red-brown. Boundaries of the Rathkeale urban area is just visible in dark grey (bottom right
corner). Data from Boliden Tara Mines, Geological Survey of Ireland, Ordnance Survey of Ireland, Central Statistics Office, Open Street Map, and Google Earth.

R. E. Healy, 2014 Evaluation of Soil Geochemical Data from Boliden’s PL Areas 3545 & 3488
6
3. METHOD - INTEGRATED USE OF FACTOR ANALYSIS AND GIS
Factor analysis is a statistical method for discerning the regularity and order of
phenomena, and as such uncovers the underlying or latent structure in observed data
(Rummel 2012, and Garson 2012). Because factor analysis reduces attribute space from a
large number of observed variables to a smaller number of factors, it is widely used in
disciplines where large quantities of data are analysed, such as the social, behavioural and
physical sciences, including geology and geochemistry.
Factor analysis is a broad term for a set of allied statistical procedures that describe
observed variables in terms of a smaller number of variables or factors (Yang 2009). The term
has come to include principal component analysis (PCA) and common or principal factor
analysis (FA), and these two methods are commonly confused. Although both methods use
extraction and rotation procedures, and both explain observed variables using fewer derived
variables, the two methods are substantively different in mathematical expression and
purpose. Demsar et al. (2012) compare the two methods by stating that FA creates a model
of the lower dimensional space, whilst PCA produces a data-driven, linear projection. Yang
(2009) states that PCA is not a true factor analysis, whilst Davies (1986) states that PCA is not
a statistical procedure, but rather a mathematical manipulation.
Common variance is that fraction of variance in an observed variable that is shared
with other observed variables, whilst unique variance is specific to that observed variable, and
error variance comprises the residual (Yang 2009). FA differentiates the fractions of common
variance, specifically excluding unique and error variance, as it is a correlation-focussed
method. Consequently, FA resolves the structure within the correlation coefficient matrix by
clustering a large number of elements into a small number of uncorrelated, generalised
factors, each of which describes significant variance in the data (Davis 1986). The objective of
FA is to reveal the latent structure expressed in the observed variables, and so FA treats
observed variables as a function of the unobserved underlying factors (Yang 2009).
In Exploratory Factor Analysis (EFA) the analyst refrains from à priori constructs, and
undertakes the analysis to intuit the factor structure, rather than impose a preconceived
structure (Garson 2012). The exploration is an iterative process of applying alternative
analytical parameters, such as extraction methods, numbers of factors, rotation methods,
etc., until convergence on a viable solution is achieved. The analyst applies multiple criteria,
such as Kaiser criterion, scree tests, proportion of explained variance, communalities, degree
of cross-loading and comprehensibility, where the latter includes heuristic, domain-specific
criteria (Garson 2012 and Yang 2009). Thus, the intermediate results drive the outcome of the
analysis, revealing the underlying structure of common factors that is manifest in the
interrelationships among the observed variables (Yang 2009). This multi-faceted decision-
making process is guided by the over-arching purpose of achieving interpretable parsimony.
There are two principal products of a factor analysis, namely the factor matrix and
factor scores. The principal output from factor analysis is the factor matrix, where each factor

R. E. Healy, 2014 Evaluation of Soil Geochemical Data from Boliden’s PL Areas 3545 & 3488
7
bears a factor loading for each observed variable. A factor loading is the correlation between
the observed variable and the factor, and is analogous to the Pearson’s r correlation
coefficient (Garson 2012). The square of the loading is the proportion of the variance in the
variable explained by the factor (Davis 1986). Thus, the sum of the squares of the loadings for
all variables on a factor indicates the proportion of variance explained by that factor.
Similarly, the sum of the squares of the loadings for a given variable, called the communality,
indicates the proportion of variance in that variable explained by all of the factors.
Maximising factor simplicity with the fewest number of factors, each with high factor
loadings for highly correlated variables, and low factor loadings for the remaining variables, is
expected to deliver optimum factor comprehensibility. The attainment of simple structure is
measurable using various metrics, including simplicity indices (Lorenzo-Seva 2003). Garson
(2012) observes that the inferential process of interpreting and naming factors, based on the
principal variables that load heavily onto the factors, can be fraught with subjectivity, and is
dependent on the expertise of the domain expert.
The second significant output of an analysis is the factor scores. These are scores for
each case or observation (e.g., soil sample) on each factor, or more precisely, estimates of the
contribution of each factor to each observation. Hoffman (2011) cautions against the use of
factor scores because of the issue of factor score indeterminacy. Indeterminancy flows from
the common factor model, in which parameters are not uniquely defined, such that no unique
factor solution exists (Grice 2002, DiStefano et al. 2009). By corollary, factor scores based on
factors are also not uniquely defined, and are thus indeterminate. DiStefano et al. (2009)
conclude that the common ‘refined’ methods of calculating factor scores, including that of
Ten Berge et al. (1999), which is used by the program Factor 8.10 (Lorenzo-Seva & Ferrando
2012), are affected by indeterminacy. Grice (2002) and DiStefano et al. (2009) stress the
importance of investigating the stability of the factor structure and degree of factor score
indeterminacy. In this study, it was found that the factor models gave relatively stable
solutions, and that the factor scores are rational and reproducible (See Subsection 4.1.2.
Factor Analysis). However, factor models for different numbers of extracted factors logically
gave variable factor solutions. It is considered that minimising the negative affects of factor
score indeterminacy is predicated on the validity of the interpretations of the domain expert
during the iterative process of converging on the final factor model.
As factors are underlying constructs that influence the expression of observed
variables (Suhr 2005), factors extracted from geochemical data constitute geochemical
associations that reflect the underlying geochemical processes. Consequently, the factor
scores describe the degree to which the geochemical processes are expressed in the
composition of the samples (Davis 1986). DiStefano et al. (2009), Garson (2012) and Rummell
(2012) note that factor scores are often used as new variables in subsequent analysis or
modelling, which is the primary purpose of this study. Crucially, the spatial distribution of the
factor scores allows the expression of geochemical processes, as described by the factors, to
be modelled, mapped and analysed using GIS technology.

R. E. Healy, 2014 Evaluation of Soil Geochemical Data from Boliden’s PL Areas 3545 & 3488
8
A geographic object or entity can be defined in terms of its spatial location, attribute
(including dimension or geometry) and time. Spatial data represents locational information or
“the where”. Attribute data is non-spatial information that is a characteristic of the entity,
and represents “the what”, such as a name, label, description, classification, measure, etc.
Thus, geographic data contain attribute, spatial, and possibly temporal components, based on
the specifications of the relevant spatial data model, and are typically stored as x,y
coordinates, possibly dates/times, and one or more attributes. The data space can thus be
deconstructed into n-dimensional attribute space (i.e., n = no. of variables), 3-dimensional
geographic space (i.e., x,y,z coordinates), and 1-dimensional temporal space, where the latter
space-time components form the reference framework for the attribute space (Demsar et al.
2012). Unlike relational databases, GIS can relate otherwise disparate data using spatial, and
increasingly spatio-temporal, location as the primary index variable for referencing the
attribute data, such that any observed property that has an associated location can be
interrogated by GIS.
In their overview of the multivariate statistical techniques used across disciplines in
soil studies, Mostert et al. (2010) report that PCA is the ‘workhorse’ of multivariate analysis of
soils, and is often combined with other techniques, particularly Cluster Analysis (CA). As
stated earlier, factor analysis is a broad term for a set of allied statistical procedures which
typically include common factor analysis (FA) and principal component analysis (PCA). By
extension, the work of Demsar et al. (2012) on the use of PCA on spatial data is instructive
here, and provides a framework for categorising the possible application of FA on spatial data
into: (1) Non-Spatial Approach, using standard non-spatial FA on spatial data; and (2) Spatial
Approach using FA adapted for spatial effects. An examination of the latter Spatial Approach
to FA of spatial data is beyond the scope of this study, and is not considered further here.
The non-spatial approach to FA avoids issues related to the non-stochastic character
of spatial data (e.g., spatial autocorrelation), by using standard FA on attribute space only,
commonly as a precursor to spatial modelling and analysis. The entire data set is processed by
FA, and gives global results without consideration of spatial effects (i.e., analysed with a
statistical program, not GIS). Extending the framework of Demsar et al. (2012), the Integrated
FA & GIS method used here falls into the Spatial Objects FA subcategory of the non-spatial
approach. Spatial Objects FA pertains to factor analysis on data related to spatial objects, such
as sampling points analogous to the ‘Discrete Objects’ conceptual model of geographic
variation. A Spatial Objects FA can be spatially modelled and analysed using factor scores,
which are the transformed attribute data values corresponding to each spatial location. This
subcategory is the predominant form of FA used on spatial data in the geosciences, including
the application in this study. The use of the non-spatial approach to factor analysis integrated
with GIS exploits the power and resilience of a well established, statistical method to analyse
data globally (i.e., non-spatially), coupled with the capabilities for subsequent spatial
modelling and analysis by GIS. This approach has been employed in numerous applications,
including mineral exploration (De Vivo et al. 1998, Singh et al. 2002, Harraz et al. 2012, and
Yousefi et al. 2012), and geology and mining geology (Lado et al. 2008, Perrotta et al. 2008,
and Healy 2013).

R. E. Healy, 2014 Evaluation of Soil Geochemical Data from Boliden’s PL Areas 3545 & 3488
2The early Carboniferous is taken to correspond to the former Lower Carboniferous or Dinantian
Series, which are now obsolete terms (Heckel & Clayton 2006). The period corresponds to the
Tournaisian (359-345 Ma) and Visean (345-326 Ma) Stages of the Mississippian Subsystem. The
Tournaisian is subdivided into the Hasarian, Ivorian and the lower part of the Chadian Substages, as
the Chadian straddles the boundary with the Visean. The Visean is subdivided into the upper part of
the Chadian, and the Arundian, Holkerian, Asbian and Brigantian Substages. The Courceyan
corresponds to the two lower Substages of the Tournaisian (i.e., Hasarian and Ivorian).
9
4. LOCAL GEOLOGY
Ireland is the largest zinc producer in Europe, and since the mid-1960's has witnessed
the development of five major Zn-Pb mines, namely Tynagh, Silvermines, Lisheen, Galmoy
and the giant Navan deposit (i.e., . 105Mt at 8.1% Zn and 2.0% Pb; Ashton et al. 2010). This
world class Zn-Pb province, known as the Irish Orefield, hosts deposits that are referred to as
Irish-Type Carbonate-Hosted Zn-Pb deposits, and which have characteristics common to both
Mississippi Valley-Type (MVT) and sedimentary exhalative (SEDEX) deposits. There is a
developing consensus that the deposits formed, not by exhalation onto the palaeo-seafloor
(i.e., a syn-sedimentary model), but rather by replacement of carbonate hostrocks that were
previously subjected to regional dolotomisation (Wilkinson et al. 2010, Hitzman et al. 2002).
The sulfide mineralisation is commonly associated with the development of black matrix
breccia (BMB), supporting a post-lithification, epigenetic ore model.
The deposits form typically stratabound lenses within shallow marine carbonates of
Courceyan to Chadian age (i.e., early Carboniferous2), and their distribution is both
stratigraphically and structurally controlled. The deposits occur in the Waulsortian mudbank
complexes of south and central Ireland or in the Navan Group of north central Ireland (See
Fig. 3). Blaney & Redmond (2010) note that the Waulsortian and Navan Group tend to be the
stratigraphically lowest, non-argillaceous, carbonate units occurring locally at each deposit.
The deposits are also located adjacent to major normal faults bounding the margins of
sedimentary basins. These NE-trending listric faults are Caledonian structures reactivated
during early Carboniferous extensional tectonics, and provided conduits for the hydrothermal
ore-forming fluids (Wilkinson et al. 2010). The latter authors report that precipitation of ore
occurred when upwelling, high temperature (i.e., 130-240OC), moderate salinity (i.e., 8-19%
NaCl equiv.), metal-bearing fluids mixed with low temperature, high salinity brines containing
reduced sulphur, preferentially within more permeable Carboniferous horizons.
Irish-Type mineralisation has been known to occur in the Limerick area since the
discovery of sub-economic deposits at Courtbrown and Carrickittle in the 1960s. However,
with the recent discovery of major Zn-Pb deposits at Pallas Green and Stonepark, the Limerick
Basin has emerged as an important sub-district of the Irish Orefield, and the focus of
considerable exploration activity (Wilkinson et al. 2010, Blaney & Redmond 2010).

R. E. Healy, 2014 Evaluation of Soil Geochemical Data from Boliden’s PL Areas 3545 & 3488
10
Figure 3. Idealised section showing stratigraphic extent of carbonate-hosted Zn-Pb
deposits in Irish Orefield. Redrawn from EMD (2006).
The early Carboniferous sequence of carbonates that are host to the Irish-Type
deposits were laid down by a northward-advancing, marine transgression of a shallow tropical
sea across the Old Red Sandstone continent. The Limerick Basin (also known as the Shannon
Trough or Basin) and the Dublin Basin are intra-cratonic, sedimentary basins that developed in
response to crustal extension during the early Carboniferous. The Limerick Basin has an axial
Caledonide trend, but is closed to the northeast, separating it from the largely coeval Dublin
Basin. A thick succession of sediments and volcanics (i.e., .3km) were deposited during the
Tournaisian, Visean and Namurian on the southern side of the Limerick Basin (Redmond 2010,
Holdstock 2004). Significant volcanic activity occurred within the Limerick Basin during the
early Carboniferous, and there is an atypically close association between igneous rocks and
Irish-Type deposits within the basin (Redmond 2010).
The study area lies on the southern margin of the Limerick Basin, and at the western
end of the ENE-trending Rathkeale syncline (See Fig. 1). In the late Carboniferous, broad open
folding developed on a regional scale during the Hercynian orogeny, resulting in ENE-trending
synclines (e.g., Rathkeale) and anticlines (e.g., Ballingarry) in much of Munster. The simplified
early Carboniferous stratigraphy occurring in the general locality is shown in Figure 4, and
summarised below, based largely on Sleeman & Prachet (1999) and Tara Mines (2004), but
without explicit individual references.
The Devonian to earliest Courceyan Old Red Sandstone (ORS), which forms the base
of the stratigraphy, occurs as an inlier south of Rathkeale, due to the anticline formed by ENE
trending folding of Hercynian age. As the Carboniferous marine transgression advanced
northward, the ORS was overlain by a thin sequence of shallow water sandstones and

R. E. Healy, 2014 Evaluation of Soil Geochemical Data from Boliden’s PL Areas 3545 & 3488
11
Figure 4. Early Carboniferous stratigraphy of
the Rathkeale area. Modified from Tara
Mines (2004). Colours scheme same as for
Fig. 1.
mudstones of the Lower Limestone Shale (early
Courceyan). These are succeeded by the Ballysteen
Fm. (mid-Courceyan), a thick (i.e., approx. 250m)
sequence of argillaceous bioclastic limestone, which
becomes increasingly argillaceous upwards.
The Ballysteen Fm. is succeeded by a very
thick (i.e., approx. 1km) sequence of Waulsortian
Limestones (late Courceyan to Chadian), reflecting
rapid deepening of the Limerick Basin. The main
lithology of the Waulsortian are pale-grey, massive,
unbedded, biomicrite wackestone, with abundant
crinoids and bryozoa, and often with the distinctive
stromatactis structure. The Waulsortian formed
steep carbonate mudmounds or banks in the
increasingly less energetic environment presented by
the northward retreating shoreline. The banks were
commonly separated by dark-grey, argillaceous,
shelve limestones, although the banks did coalesce
into continuous sheets covering much of the area.
The banks represent carbonate accumulations that
developed on regional scale carbonate ramps with
depths range from approximately 300m to 100m,
below the wave base and largely in the aphotic zone
of a tropical sea. Although the banks lacked a
framework building organism, unlike modern day
coral reefs, the initial gel-like cohesion of the muds
allowed steep depositional slopes (Lees 2006).
The Rathkeale Fm. (Arundian) succeeds the
Waulsortian, and consists of a thick (i.e., #460m)
succession of dark, non-fossiliferous, argillaceous
limestones and shaly mudstones. These basinal
sediments were deposited during a period of ramp
sedimentation, with the Rathkeale Fm. representing the outer ramp facies to the west. The
Rathkeale Fm. locally exhibits tight folding and cleavage development, but this deformation
does not penetrate into the underlying Waulsortian, suggesting that the top of the
Waulsortian may have acted as decollement. In contrast, Blakeman (pers. comm. 2014)
reports that the contact between the Waulsortian and Rathkeale Fm. is an inverted faulted
contact within the study area, but elsewhere is a gradational contact.

R. E. Healy, 2014 Evaluation of Soil Geochemical Data from Boliden’s PL Areas 3545 & 3488
12
The Rathkeale Fm. shoals upwards into the overlying Durnish Fm. (Holkerian to
Asbian), which consists of a thick sequence (i.e., 300m) of dark, cherty blue-black bioclastic
limestones, representing a mid ramp facies. The Durnish Fm. is succeeded by the Shanagolden
Fm. (late Asbian), a thin (i.e., 75m) sequence of well-bedded, micritic limestones, representing
carbonate deposition in gradually deepening water, corresponding to a mid to outer ramp
facies. This is overlain by the Parsonage Beds, a thin unit (i.e., 24m) of shallow-water micrites,
and the Corgrig Lodge Beds, a thin unit (i.e., 6m) of limestones and shales, which represent
the top of the Visean. A band of rocks identified as Visean Limestones (Undifferentiated)
occur immediately to the southwest of the study area and extend south beyond Newcastle.
This early Carboniferous stratigraphy is overlain by a thick succession of Namurian
sediments (i.e., including the Clare Shale Fm., the Shannon Group and the Central Clare
Group, the Gull Island Fm., and the Tullig Sandstone), which are shown lying off to the west in
Figure 1. Also shown west of the study area at Shanagolden East and Carron’s House are
volcanics, which are Visean age volcanoclastics, and reflect significant volcanic activity on the
margins of the Limerick Basin. It is noteworthy that there is a close spatial association of the
volcanics with the major ENE-trending fault that extends into the study area.
The gross stratigraphy within the immediate study area is simple, with Waulsortian
Limestone overlain by Rathkeale Fm. and minor Durnish Fm. in the axis of the Rathkeale
syncline. Blakeman (pers. comm. 2014) reports that the roughly E-W trending, contact
between the Waulsortian and the Rathkeale Fm. is a fault contact, which is offset by NW
faults, and with mineralisation apparently concentrated at these structural intersections.
Overburden thicknesses in the study area vary from 3 to 9m, and underlie well-
drained arable and dairy farmland with few marshy areas (Blakeman pers. comm. 2014). The
overburden consists dominantly of glacial till derived from Carboniferous limestone, with
lesser amounts of alluvium and rock subcrop, including karstified rock, and minute pockets of
cutaway peat, fen and undifferentiated lake sediments (See Fig. 5). The till was deposited in
the Pleistocene, most probably during last great advance of the British-Irish Ice Sheet around
25,000 BP (i.e., the late Midlandian stage), prior to initiation of deglaciation around 20,000 BP
(Coxon & McCarron 2009). These author note that ice sheet dispersal centres formed in the
northern half of the country, with the direction of ice movement radiating outwards, which
gave rise to ice movement in an approximately southwestern direction within the study area.
The topsoil in the study area is typical of dry mineral soils found in the flat and
undulating lowlands (Gardiner & Radford 1980). The topsoil consists dominantly of grey
brown podzolics and brown earths (derived from calcareous parent material), with lesser
rendzinas and lithosols, mineral alluvium, and surface water and groundwater gleys, and
minute pockets of cutaway peat and undifferentiated lake sediments (See Fig. 6).

R. E. Healy, 2014 Evaluation of Soil Geochemical Data from Boliden’s PL Areas 3545 & 3488
13
Figure 5. Subsoil map of study area within Prospecting Licence Areas 3545 and 3488. The boundary of the study area is outlined in red. Relevant subsoil
map codes (e.g., Tls denotes Till derived from Carboniferous Limestone) are from Fealy & Green (2009), are discussed in the text and listed in Table 1 of
the Appendix. Data from Environmental Protection Agency, Ordnance Survey of Ireland, and the Central Statistics Office.

R. E. Healy, 2014 Evaluation of Soil Geochemical Data from Boliden’s PL Areas 3545 & 3488
14
Figure 6. Soil map of study are within Prospecting Licence block. The boundary of the study area is outlined in red. Relevant soil map codes (e.g.,
BminDW denotes Grey Brown Podzolics and Brown Earths derived from mainly calcareous parent material) are from Fealy & Green (2009), are
discussed in the text, and are listed in Table 1 of the Appendix. Data from Environmental Protection Agency, Ordnance Survey of Ireland, and the Central
Statistics Office.

R. E. Healy, 2014 Evaluation of Soil Geochemical Data from Boliden’s PL Areas 3545 & 3488
3 This report contains Ordnance Survey Ireland data © OSi 2012.
4http://www.openstreetmap.org/
5http://gis.dcenr.gov.ie/imf/imf.jsp?site=ExplorationCompanyReports
15
5. COOLTOMIN GEOCHEMICAL DATA SET
The soil samples were collected from the A horizon by hand auguring, and each
sample was analysed by ALS Laboratories. The concentration of 45 inorganic elements in each
of the 1,421 samples were determined using an in-house multi-acid digestion technique,
followed by analysis using inductively coupled plasma-atomic emission spectrometry
(ICP-AES). The acid digestion is only a partial extraction technique that does not dissolve all
silicates, and is thus indeterminate for Si. Au was determined by fire assay. Data pertaining to
analysis of standards, duplicates, detection limits, etc. were also provided.
Two types of data are also appended to the row of each sample in the Cooltomin data
set. These are: (1) spatial data in the form of x,y coordinates in metres (i.e., Irish National Grid
coordinates); and (2) other attribute data (e.g., sample name, location description, sample
type, analytical batch, etc.). Spatial data were also downloaded from: (1) CSO - boundary map
of electoral divisions, boundary map of city and towns, and map of primary national roads
(Central Statistics Office 2013); (2) EPA - soil, subsoil and Corine maps of Ireland
(Environmental Protection Agency 2013); and (3) GSI - 1:100,000 geological bedrock map of
Ireland, and boundary map of prospecting licence areas (Geological Survey of Ireland 2013);
and include data from the Ordinance Survey of Ireland (OSI)3.
In addition, the trace of the Deel River within the study area was digitised using
Google Earth (approximate accuracy of ± 25m), while the road network within the study area
was exported from Open Street Map4, as discrete points with x,y coordinates, which were
subsequently edited into line segments to represent the road network. Also, the approximate
x,y coordinates of several drillholes and points of interest (e.g., Courtbrown Zn-Pb deposit,
drillhole CT1, 3488/15 and Ovoca A & B anomalies) were estimated from maps associated
with various progress, renewal and moratorium reports for the two Prospecting Licence Areas
at the Geological Survey Ireland website5. These reference data were principally used to give
geographic context to the various renderings of the factor score data.
The Open Source executable program called Factor 8.10 (Lorenzo-Seva & Ferrando
2006, 2012), which runs in the Windows NT and 7 environment, was downloaded and
installed. Factor is an exploratory factor analysis program, and performs correlation and
factor analysis. The program lacks a null data function, so values of half the limit of detection
(i.e., HLD) of each element were retained for 'not detected' values.

R. E. Healy, 2014 Evaluation of Soil Geochemical Data from Boliden’s PL Areas 3545 & 3488
16
5.1. STATISTICAL ANALYSIS
Univariate statistical analysis is typically the first procedure used to quantitatively
explore raw data, including the process of data verification and data scrubbing or cleansing.
Because univariate statistics treats variables individually using descriptive measures, such as
mean, standard deviation, variance, student’s t, etc., these techniques are most useful in the
analysis of simple systems. However, univariate statistics fall short in the analysis of complex
systems, as they treat variables as being independent, and thus cannot detect or analyse the
relationship between variables, known as covariance. Thus, univariate statistics are commonly
used as a prelude to multivariate statistical analysis.
The Cooltomin dat set contains concentrations for 46 inorganic elements in 1,421
samples. A cursory examination of the data set showed that Au and B concentrations are
available for only 160 samples, whereas very high proportions (i.e., >50%) of the samples
yielded Ag and Hg concentrations that are below the respective limits of detection. Ten other
elements show concentrations in one or more samples with values less than the limit of
detection (See Table 1). These ‘left-censored’ data are most commonly handled by imputing
a value by substitution, such as LLD/2 (i.e., half the limit of detection or HLD) or LLD/%2.
Hewett & Ganser (2007) state that the US EPA recommends using substitution methods when
the percent censored data is <15%, and other methods such as maximum likelihood
estimation (MLE) when the percent censored data is >15%. In this study, elements with
greater than 20% censored data were rejected from further analysis (i.e., Au, Ag, B and Hg).
Although retained, Se (19.6%), W (9.5%), Ta (8.0%) and Te (7.1%) exhibit significant
percentages of censored data, which is considered in the context of the interpretation of the
results for these elements. The respective HLD was used for all retained censored data.
Many statistical procedures assume that the variables are distributed normally, such
that significant deviations from normality can increase the likelihood of Type I or II errors, in
which the acceptance of false or rejection of true outcomes occurs. Deviations from
normality can be due to data entry errors and missing data values (e.g., -999), as well as the
valid reasons of outliers and the nature of the variable itself (Osborne 2002). Outliers
represent extreme values relative to the rest of the sample, and may be artifacts generated
during sampling, analysis or may be real. In the case of mineral exploration, outliers may
represent real values corresponding to elemental enrichment related to mineralisation, which
manifests as a bimodal distribution, and which constitutes a mixture of two unimodal
distributions. Removal of such outliers is implicitly contraindicated, as identifying anomalous
values indicative of mineralisation is a primary objective in exploration geochemistry (or
contamination in environmental geochemistry), and can potentially be mitigated by
transformation, if necessary. As the current multivariate analysis was intended to be
exploratory, outliers were not removed from the data set, in order to avert the induction of
bias and the potential deletion of real variance. Because standardisation is built into the

R. E. Healy, 2014 Evaluation of Soil Geochemical Data from Boliden’s PL Areas 3545 & 3488
17
factor analysis technique, the data was not standardised as this has no affect on the factor
results.
Although Reimann et al. (2011) state that data normality is not essential for principal
factor analysis, they argue that transformation may be indicated in order to ensure all
variables approximate to normal distributions. Filzmoser et al. (2009) state that using raw
data or improperly transformed data leads to biased results from factor analysis. In contrast,
Stanley (2006) argues that as most geochemical distributions are multi-modal, transformation
for the purpose of achieving normality is “neither generally achievable nor justified”. Garson
(2012) states that the assumption of normality pertains to significance testing of coefficients,
whereas communality is the inherent measure of ‘goodness of fit’ and indicates those
variables to reject in factor analysis. As the construction of confidence intervals around the
model parameters, or computation of significance tests are not a requirement here, the
assumption of normality is obviated. Two common types of transformation (i.e., square root
and log transformation) were trialed on the current data set, and gave Factor Analysis results
with largely comparable factors to the analysis of the untreated data set, but with some loss
of resolution. Osborne (2002) notes that as transformation alters the nature of variables, it
should not be used unless there is an overriding reason. Consequently, the current data set
was not transformed. As will be seen below (See Section 5.1.2 Factor Analysis), those
elements with distributions exhibiting high skewness and kurtosis (e.g., Na, Ba, Hg, Sn and U),
gave low communalities during Factor Analysis, confirming the above assertion of Garson.
Summary statistics for the Cooltomin data are given in Table 1. The coefficient of
variation [CoV = (std dev / mean) * 100] is a measure of the relative variance exhibited by an
element’s distribution. Interestingly, with the exception of Ca, only the ore-related elements
Cu, Mo, Se, Te and Zn all exhibit CoV values above 100, whilst Cd, Sn and U exhibit values
above 90. Average Enrichment Factors (EF) were also calculated for each element using Al as
the reference element, according to the method of Tasic et al. (2008). These authors state
that EF values close to unity indicate crustal sources, whereas values in excess of 1 indicate
significant fractions from non-crustal sources (i.e., anthropogenic). Healy (2013) found that
EF values in excess of 5 strongly indicated elements of anthropogenic origin, such as Hg, Cd,
Pb, Mo, As and Zn in the Dublin Surge data set. Only Cd, As and Mo exhibit EF’s with values in
excess of 5 (See Table 1), and this enrichment is interpreted to be indicative of contributions
from ore-forming and hypergene processes, rather than anthropogenic processes. By
definition, ore-forming processes are those that sufficiently concentrate useful elements into
accessible parts of the Earth’s crust so as to be profitably extracted, and are thus processes
that give rise to substantial enrichment of ore-related elements.

R. E. Healy, 2014 Evaluation of Soil Geochemical Data from Boliden’s PL Areas 3545 & 3488
18
Table 2 presents the median concentrations of the 42 elements in the Cooltomin soil
samples, the global reference soil of De Caritat et al. (2012), as well as in the Dublin Surge soil
samples (Healy 2013). The most notable feature amongst the major elements is the high Ca
contents relative to the reference soil, reflecting the predominance of limestone as the
parent material of the Cooltomin soils, whether derived directly from bedrock or indirectly
from till. The median Ca content of the Cooltomin soils is 1.55% Ca, which is higher than the
median Ca value of 0.57% Ca for the reference soil by approximately a factor of three. The
maximum Ca concentration of 35.98% Ca approximates to 90 wt% calcite, the most likely Ca
host mineral (may also include some dolomite, gypsum or apatite), and is considered
anomalously calcareous.
The median Al content of the Cooltomin soils is 4.56% Al, which is of a comparable
order as the median Al value of 4.92% Al for the reference soil, and translates to median clay
contents of less than approximately 40% in the Cooltomin soils. The median Mn contents of
the Cooltomin soils (i.e., 1,516 ppm Mn) is significantly higher than that of the reference soil
(i.e., 465 ppm Mn), and is consistent with the high pH and oxidising conditions of well
drained, carbonate-rich soils. Interestingly, despite the known association of Ba with the Irish
Type carbonate-hosted Zn-Pb deposits, the median Ba contents of Cooltomin soils is
moderately depleted relative to the reference soil (i.e., 233 and 353 ppm Ba, respectively).
The depleted Ba contents reflect the high proportion of carbonate source rocks, relative to
siliciclastic or argillaceous source rocks, where the latter tend to be enriched in Ba.
The ore-related elements As, Cd, Mo, Pb and Zn have median contents in Cooltomin
soils that are elevated by a factor of 3 or more relative to the reference soil. The median
contents of Bi and Cu are only moderately elevated (i.e., #2) relative to the reference soil,
whilst those of Sb, Se, Sn, Te, U and W are indeterminate. Nonetheless, it is apparent that the
data set has captured the geochemical signature of mineralisation for a significant number of
elements with affinity to Irish Type carbonate hosted Zn-Pb ore.

R. E. Healy, 2014 Evaluation of Soil Geochemical Data from Boliden’s PL Areas 3545 & 3488
19
Table 1. Summary Statistics for 42 Inorganic Elements in the Cooltomin Data Set
Element Units Max. Min. Mean Median Std.
Dev.
CoV Enrich.
Factor
LLD No.
HLD
Al % 7.77 0.14 4.20 4.56 1.22 29.16 1.00 0.01 0
Fe % 6.15 0.10 2.58 2.69 0.61 23.61 1.22 0.01 0
Mg % 4.10 0.12 0.60 0.52 0.32 53.09 1.34 0.01 0
Ca % 35.98 0.11 3.44 1.55 5.45 158.51 2.93 0.01 0
K % 2.77 0.03 1.13 1.25 0.39 34.49 1.01 0.01 0
Na % 0.42 0.01 0.22 0.24 0.09 39.07 0.63 0.01 0
P % 0.54 0.01 0.12 0.11 0.05 39.13 2.28 0.00 0
S % 0.69 0.02 0.09 0.08 0.06 65.77 0.01 0
As ppm 426.10 0.90 43.75 39.70 27.72 63.35 8.57 0.20 0
Ba ppm 435.00 38.00 218.22 233.00 64.45 29.54 0.71 2.00 0
Bi ppm 2.50 0.02 0.20 0.20 0.12 58.77 1.44 0.05 29
Cd ppm 38.27 0.16 1.93 1.69 1.87 96.59 18.23 0.02 0
Ce ppm 70.77 1.40 49.13 51.90 11.43 23.26 1.10 0.10 0
Co ppm 46.20 0.40 14.95 15.10 4.48 29.93 1.81 0.10 0
Cr ppm 108.33 2.00 55.48 60.00 15.36 27.69 1.16 2.00 0
Cu ppm 881.90 1.90 28.25 24.60 34.01 120.40 2.04 0.20 0
Ga ppm 18.54 0.05 10.18 11.10 3.01 29.56 0.21 0.10 1
Ge ppm 4.80 0.05 1.61 1.20 1.08 66.89 0.10 38
La ppm 42.80 0.90 30.40 32.20 6.97 22.92 2.48 0.50 0
Li ppm 514.00 1.00 30.43 31.15 19.08 62.69 3.73 2.00 11
Mn ppm 4310.86 39.00 1381.14 1516.00 661.44 47.89 3.52 5.00 0
Mo ppm 41.06 0.06 1.66 1.45 1.69 101.36 5.21 0.05 0
Nb ppm 15.24 0.12 7.08 7.61 3.21 45.36 0.75 0.05 0
Ni ppm 152.30 4.10 53.38 54.50 12.76 23.90 3.27 0.20 0
Pb ppm 1151.80 1.60 68.07 66.20 43.34 63.67 4.20 0.20 0
Rb ppm 169.90 0.05 87.77 97.30 30.02 34.20 1.67 0.10 0
Sb ppm 22.88 0.07 1.65 1.56 1.11 67.27 0.05 0
Sc ppm 16.80 0.20 7.82 8.30 2.29 29.32 0.10 0
Se ppm 27.32 0.25 1.78 1.01 2.75 154.61 0.50 279
Sn ppm 31.50 0.10 1.49 1.50 1.38 92.67 0.20 10
Sr ppm 600.00 13.97 58.37 46.00 48.18 82.55 0.58 2.00 0
Ta ppm 1.86 0.01 0.53 0.54 0.29 54.23 0.01 113
Te ppm 2.21 0.01 0.09 0.08 0.11 116.38 0.05 101
Th ppm 11.60 0.20 5.80 6.30 1.82 31.47 0.85 0.01 0
Ti ppm 3706.00 42.10 2177.52 2469.68 850.94 39.08 0.74 10.00 0
Tl ppm 8.23 0.11 1.89 1.91 0.95 49.95 0.02 0
U ppm 40.72 0.30 2.34 2.10 2.19 93.81 0.10 0
V ppm 181.00 1.00 60.73 63.00 19.36 31.87 1.08 2.00 2
W ppm 4.60 0.05 0.87 0.90 0.40 45.34 0.10 135
Y ppm 56.00 1.20 32.23 33.80 8.77 27.21 1.46 0.10 0
Zn ppm 7222.00 7.60 172.99 167.90 195.75 113.16 3.85 0.20 0
Zr ppm 113.00 2.00 72.09 82.00 27.34 37.93 0.31 1.00 0
Notes: 1. Ag, Au, Be and Hg are rejected for high proportions (i.e., >20%) of censored values.
2. Coefficient of variation (CV) calculated as: CV = (std. dev. / mean) * 100.
3. Enrichment Factor calculated from EF = (Esample/Rsample)/(Ecrust/Rcrust), using Al as the
reference element, after method of Tasic et al. (2008).
4. ‘LLD’ denotes lower limit of detection.
5. ‘No. HLD’ denotes number of values undetected, and given value of half limit of detection.

R. E. Healy, 2014 Evaluation of Soil Geochemical Data from Boliden’s PL Areas 3545 & 3488
20
Table 2. Median Abundances of Inorganic Elements in the Cooltomin Soils,
Preliminary Empirical Global Reference Soil, and Dublin Surge Soils.
Element Units Cooltomin Global Soil Dublin Surge
Al % 4.56 4.92 2.88
Fe % 2.69 2.38 2.21
Mg % 0.52 0.42 0.43
Ca % 1.55 0.57 3.73
K % 1.25 1.33 0.74
Na % 0.24 0.41 0.07
P % 0.11 0.05 0.1
S % 0.08 na. na.
As ppm 39.7 5.0 13.4
Ba ppm 233 353 175
Bi ppm 0.20 0.15 na.
Cd ppm 1.69 0.10 1.70
Ce ppm 51.9 51.0 31.9
Co ppm 15.1 9.0 9.6
Cr ppm 60.0 56.0 44.3
Cu ppm 24.6 13.0 35.0
Ga ppm 11.1 11.0 na.
Ge ppm 1.2 na. na.
La ppm 32.2 14 17.8
Li ppm 31.1 9.0 28.4
Mn ppm 1516 465 946
Mo ppm 1.5 0.3 1.5
Nb ppm 7.61 na. na.
Ni ppm 54.5 18.0 41.0
Pb ppm 66.2 17.0 73.7
Rb ppm 97.3 63 na.
Sb ppm 1.56 na. na.
Sc ppm 8.30 na. 6.10
Se ppm 1.01 na. na.
Sn ppm 1.50 na. na.
Sr ppm 46.0 85.0 127.0
Ta ppm 0.54 na. na.
Te ppm 0.08 na. na.
Th ppm 6.3 8.0 na.
Ti ppm 2470 3597 201
Tl ppm 1.91 na. na.
U ppm 2.10 na. na.
V ppm 63.0 63.0 72.1
W ppm 0.9 na. na.
Y ppm 33.8 25.0 14.9
Zn ppm 167.9 47.0 172.0
Zr ppm 82.0 284.0 12.9
Notes: 1. “na” denotes not available.
2. Data for Preliminary Empirical Global Soil from De Caritat et al. (2012), and for Dublin
Surge from Healy (2013).

R. E. Healy, 2014 Evaluation of Soil Geochemical Data from Boliden’s PL Areas 3545 & 3488
21
5.1.1 Correlation Analysis
A correlation coefficient matrix was constructed by Factor 8.10 as an initial step in the
factor analysis. The correlation coefficient matrix allows the inter-relationships of the
elements to be simplified by revealing the strength of the linear relationship between pairs of
elements. For a sample size of 1,421 observations, correlation coefficients or r-values less
than approximately 0.10 are not significantly different from zero at the 95% confidence limits.
However, even an r-value of 0.450 indicates that only 20% of the total variance in X and Y can
be explained by their linear relationship.
Over 250 r-values greater than 0.450 were obtained, whether negative of positive,
and indicate significant linear relationship for the respective element pairs (See Table 3). Of
these, 94 r-values are greater than 0.750, and thus indicate very strong linear relationships
between the respective element pairs. Most of these element pairs are identified as
belonging to a dominant Al association of 21 elements (i.e., Al, Fe, K, Na, Ba, Ce, Co, Cr, Ga,
Ge, Nb, Ni, Rb, Sc, Ta, Th, Tl, V, W, Y and Zr). Numerous element pairs exhibiting significant
negative r-values are revealed, most of which are element pairs involving either Ca or Sr with
elements of the Al association, except for two element pairs involving S with Ce and La.
The multitude of significant r-values is bewildering, and unhelpful in extracting
coherence from the complexity of the data set. Nonetheless, several observations can be
made. As stated above, the bulk of the r-values >0.750 refer to strongly and positively
covarying inter-relationships between 21 elements of an Al association (i.e., Al, Fe, K, Na, Ba,
Ce, Co, Cr, Ga, Ge, Nb, Ni, Rb, Sc, Ta, Th, Tl, V, W, Y and Zr), and reflecting a clay-oxide-
hydroxide association, probably derived from siliciclastics. The remaining r-values >0.750
refer to multi-element associations dominated by: (1) Zn with Bi, Cu, Mo, Pb, Sb, Sn and Te,
probably reflecting an ore association; (2) Ca with Sr, probably reflecting a limestone
association; (3) S with Se and U; (4) As with Sb; (5) Mn with Co; and (6) Cd with Se. Several
elements occur in more than one association, suggesting significant fractionation of the
variance in these elements generated by the influence of multiple geochemical processes. The
distinct negative covariance between elements of the Al and Ca associations suggests that the
soils are strongly differentiated between those principally derived from siliciclastic sediments
and limestone, respectively. These associations of positively covarying elements are
interpreted to reflect significant underlying geochemical processes, and form the core of
some of the factors extracted during factor analysis (See 5.1.2. Factor Analysis).
P and Li exhibit no significant r-values, indicating that these two elements do not
covary significantly, whether positively or negatively, with any of the other 40 elements. This
lack of significant covariance suggests the occurrence of these elements is controlled by
highly differentiated geochemical processes, possibly even of anthropogenic origin. These two
elements exhibit moderately elevated CoV values (i.e., 39 and 63, respectively) and EF values
(i.e., 2.28 and 3.73, respectively), which are not indicative of anthropogenic origin (See Table
1). Healy (2013) observed a strong association of Li and Be in the Dublin Surge data set, but is
indeterminate here, as Be was not analysed and relationships outside the data set are not
testable.

R. E. Healy, 2014 Evaluation of Soil Geochemical Data from Boliden’s PL Areas 3545 & 3488
22
Table 3. Correlation Coefficient Matrix for 42 Inorganic Elements in Cooltomin Data Set
Al Fe Mg Ca K Na P S As Ba Bi Cd Ce Co Cr Cu Ga Ge La Li Mn Mo Nb Ni Pb Rb Sb Sc Se Sn Sr Ta Te Th Ti Tl U V W Y Zn Zr
Al 1.000
Fe 0.635 1.000
Mg -0.047 -0.334 1.000
Ca -0.597 -0.727 0.425 1.000
K 0.917 0.487 0.041 -0.460 1.000
Na 0.820 0.358 -0.035 -0.449 0.866 1.000
P 0.005 0.176 0.006 -0.215 0.018 -0.115 1.000
S -0.402 -0.305 0.115 0.294 -0.424 -0.396 0.291 1.000
As 0.117 0.288 -0.018 -0.156 0.098 -0.002 0.122 0.054 1.000
Ba 0.964 0.642 -0.067 -0.543 0.902 0.793 0.015 -0.380 0.110 1.000
Bi 0.360 0.317 -0.053 -0.275 0.324 0.233 0.180 -0.078 0.182 0.361 1.000
Cd -0.029 0.051 -0.058 -0.024 -0.113 -0.079 0.131 0.428 0.103 -0.021 0.001 1.000
Ce 0.710 0.804 -0.367 -0.844 0.567 0.444 0.123 -0.516 0.144 0.665 0.334 -0.059 1.000
Co 0.571 0.811 -0.268 -0.589 0.437 0.307 0.191 -0.230 0.234 0.591 0.334 0.179 0.721 1.000
Cr 0.948 0.603 -0.065 -0.585 0.851 0.794 0.015 -0.329 0.132 0.910 0.349 0.060 0.672 0.546 1.000
Cu 0.075 0.075 0.018 -0.046 0.062 0.031 0.103 0.220 0.120 0.119 0.379 0.251 0.024 0.062 0.122 1.000
Ga 0.973 0.630 -0.084 -0.615 0.902 0.817 -0.016 -0.420 0.117 0.946 0.370 -0.013 0.718 0.592 0.920 0.079 1.000
Ge 0.532 0.310 -0.076 -0.323 0.543 0.488 -0.061 -0.251 0.141 0.517 0.258 -0.024 0.280 0.269 0.482 0.053 0.552 1.000
La 0.814 0.775 -0.271 -0.798 0.678 0.556 0.093 -0.484 0.179 0.754 0.356 -0.009 0.913 0.704 0.792 0.045 0.820 0.499 1.000
Li 0.426 0.269 0.005 -0.260 0.365 0.342 0.015 -0.151 0.047 0.404 0.154 -0.005 0.308 0.263 0.414 0.034 0.425 0.189 0.344 1.000
Mn 0.263 0.626 -0.311 -0.453 0.252 0.167 0.215 -0.365 0.082 0.287 0.153 -0.056 0.593 0.607 0.196 -0.065 0.268 0.080 0.497 0.056 1.000
Mo 0.012 0.240 -0.146 -0.082 -0.046 -0.015 0.102 0.239 0.091 0.062 0.368 0.344 0.019 0.260 0.048 0.477 0.033 0.022 0.034 0.026 0.026 1.000
Nb 0.767 0.350 -0.078 -0.431 0.778 0.862 -0.081 -0.354 -0.010 0.741 0.212 -0.028 0.477 0.380 0.806 0.030 0.758 0.368 0.564 0.315 0.182 -0.007 1.000
Ni 0.686 0.730 -0.197 -0.594 0.569 0.391 0.203 -0.111 0.346 0.661 0.316 0.280 0.704 0.800 0.688 0.148 0.689 0.363 0.770 0.304 0.419 0.164 0.434 1.000
Pb 0.240 0.289 -0.046 -0.244 0.216 0.122 0.204 -0.029 0.364 0.244 0.568 -0.002 0.295 0.274 0.230 0.492 0.231 0.160 0.296 0.086 0.209 0.424 0.101 0.308 1.000
Rb 0.901 0.576 -0.065 -0.543 0.932 0.795 0.049 -0.478 0.111 0.871 0.365 -0.126 0.664 0.524 0.848 0.011 0.895 0.567 0.781 0.353 0.389 -0.016 0.748 0.614 0.254 1.000
Sb 0.227 0.228 0.073 -0.107 0.204 0.125 0.098 0.135 0.498 0.246 0.456 0.217 0.130 0.267 0.289 0.596 0.230 0.160 0.213 0.093 0.043 0.405 0.154 0.366 0.653 0.181 1.000
Sc 0.936 0.655 -0.084 -0.597 0.830 0.719 0.016 -0.381 0.151 0.901 0.401 0.035 0.720 0.632 0.927 0.092 0.941 0.614 0.864 0.405 0.272 0.070 0.722 0.734 0.263 0.878 0.282 1.000
Se -0.259 -0.123 0.045 0.186 -0.357 -0.293 0.063 0.803 0.041 -0.225 0.017 0.557 -0.369 -0.055 -0.168 0.332 -0.265 -0.082 -0.306 -0.081 -0.358 0.453 -0.257 0.023 0.064 -0.398 0.249 -0.187 1.000
Sn 0.253 0.186 -0.026 -0.151 0.256 0.220 0.054 -0.025 0.045 0.281 0.427 0.000 0.163 0.155 0.252 0.493 0.257 0.208 0.203 0.095 0.078 0.355 0.219 0.172 0.459 0.260 0.378 0.273 0.075 1.000
Sr -0.450 -0.626 0.283 0.867 -0.329 -0.256 -0.262 0.215 -0.177 -0.387 -0.231 -0.016 -0.737 -0.515 -0.427 -0.041 -0.461 -0.208 -0.667 -0.199 -0.413 -0.039 -0.267 -0.513 -0.230 -0.414 -0.113 -0.453 0.171 -0.109 1.000
Ta 0.662 0.293 -0.054 -0.358 0.704 0.816 -0.087 -0.310 -0.053 0.627 0.165 -0.039 0.398 0.294 0.669 0.041 0.641 0.411 0.429 0.271 0.173 -0.001 0.808 0.330 0.072 0.639 0.081 0.578 -0.183 0.158 -0.197 1.000
Te -0.019 -0.159 0.265 0.277 0.036 0.064 -0.088 0.038 -0.074 -0.006 0.200 -0.011 -0.189 -0.114 -0.025 0.287 -0.032 0.002 -0.127 -0.038 -0.091 0.269 0.016 -0.111 0.273 0.011 0.239 -0.018 0.144 0.255 0.336 0.114 1.000
Th 0.924 0.570 -0.098 -0.582 0.876 0.845 -0.035 -0.441 0.092 0.890 0.375 -0.031 0.670 0.563 0.895 0.063 0.932 0.602 0.791 0.388 0.277 0.032 0.843 0.617 0.216 0.891 0.223 0.918 -0.275 0.267 -0.422 0.747 0.005 1.000
Ti 0.936 0.456 0.013 -0.455 0.905 0.884 -0.056 -0.351 0.089 0.915 0.324 -0.020 0.515 0.451 0.893 0.076 0.919 0.576 0.683 0.389 0.126 0.029 0.820 0.564 0.186 0.864 0.224 0.877 -0.217 0.259 -0.300 0.680 0.045 0.906 1.000
Tl 0.435 0.122 0.212 -0.012 0.376 0.259 0.012 0.051 0.271 0.392 0.264 0.167 0.072 0.199 0.431 0.143 0.414 0.515 0.286 0.201 -0.169 0.053 0.149 0.353 0.164 0.388 0.296 0.501 0.130 0.149 -0.020 0.193 0.160 0.403 0.480 1.000
U 0.101 0.147 -0.119 -0.132 -0.026 0.029 0.081 0.495 0.032 0.114 0.057 0.379 0.003 0.166 0.152 0.163 0.111 0.052 0.058 0.061 -0.147 0.330 0.082 0.242 0.010 -0.047 0.124 0.147 0.667 0.035 -0.072 0.034 -0.043 0.100 0.110 0.087 1.000
V 0.849 0.613 -0.129 -0.564 0.693 0.679 0.060 -0.215 0.120 0.837 0.304 0.195 0.600 0.605 0.869 0.150 0.840 0.438 0.707 0.392 0.168 0.208 0.679 0.682 0.198 0.676 0.265 0.836 0.011 0.209 -0.398 0.576 -0.034 0.792 0.814 0.379 0.329 1.000
W 0.728 0.361 0.033 -0.315 0.709 0.679 -0.021 -0.230 0.102 0.709 0.364 0.030 0.376 0.406 0.718 0.143 0.734 0.582 0.547 0.291 0.079 0.120 0.642 0.477 0.226 0.701 0.296 0.738 -0.089 0.292 -0.197 0.584 0.150 0.771 0.791 0.502 0.109 0.663 1.000
Y 0.709 0.639 -0.125 -0.580 0.555 0.380 0.169 -0.235 0.287 0.635 0.393 0.133 0.715 0.638 0.724 0.116 0.700 0.432 0.865 0.318 0.322 0.070 0.397 0.785 0.321 0.646 0.358 0.795 -0.113 0.172 -0.510 0.215 -0.082 0.636 0.612 0.467 0.146 0.636 0.532 1.000
Zn 0.159 0.201 -0.059 -0.147 0.145 0.125 0.159 0.020 0.107 0.184 0.591 0.018 0.176 0.195 0.162 0.584 0.153 0.042 0.164 0.068 0.156 0.606 0.119 0.171 0.727 0.170 0.551 0.166 0.148 0.558 -0.120 0.104 0.465 0.154 0.138 0.069 0.004 0.142 0.203 0.168 1.000
Zr 0.923 0.454 -0.003 -0.466 0.921 0.903 -0.040 -0.360 0.096 0.898 0.313 -0.026 0.527 0.447 0.869 0.085 0.911 0.575 0.683 0.376 0.180 0.007 0.832 0.574 0.195 0.868 0.229 0.854 -0.251 0.253 -0.313 0.714 0.043 0.907 0.979 0.437 0.083 0.778 0.768 0.604 0.142 1.000
Notes: Significant positive r-values (> +0.450) for geochemical associations dominated by Al, Zn, Ca, S, As, Mn and Cd are indicated by colour.

R. E. Healy, 2014 Evaluation of Soil Geochemical Data from Boliden’s PL Areas 3545 & 3488
23
5.1.2. Factor Analysis
As stated earlier, the factor solution was converged upon using iterative analyses and
applying multiple criteria. Between 6 and 14 factors were extracted for two extraction
methods (i.e., MRFA and PCA), and multiple iterations using different rotations methods were
also tested. For the purpose of interpretation an arbitrary cut-off is adopted (i.e., ±0.450;
same as for the analogous r-values), below which the factor loadings are considered much
less significant (Harbaugh & Merriam 1968).
A solution based on ten factors extracted using Minimum Rank Factor Analysis
(MRFA) and Varimax orthogonal rotation was adopted (See Table 4). This model explained
80.3% of the total variance and 91.1% of the common variance, with good reliability
estimates (i.e., mean = 0.892), on 10 latent variables (i.e., factors) versus the original 42
observed variables. A plot of some of the metrics used in this decision-making process is
shown in Figure 7. All the factor models (i.e., from 6 to 14 factors) extracted significant
negative factor loadings for Ca and Sr, whilst the factors models with 6 to 10 factors extracted
additional significant negative factor loadings on Mg and Te. The attainment of simple
structure is defined as the extraction of a small number of factors with high loadings for
certain elements and low loadings for other elements. Negative factor loadings can be an
indication of an inferior factor solution, although factor loadings are correlation coefficients
analogous to Pearson’s r, between the original variable (i.e., element) and the new variable
(i.e., factor), and thus can have a negative sign indicative of inverse relationships.
Although the 8 factor model showed superior performance on several metrics,
particularly root mean square residual (RMSR) and Bentler’s simplicity index, the 10 factor
model was adopted as it reflected reasonable attainment of simple structure and geological
interpretability. Although there were only minor differences in the significant factor loadings
on the Zn factor (i.e., for Bi, Cu, Mo, Pb, Sb, Sn, Te and Zn) in all 9 models, the 10 factor model
was adopted as it also explained a greater proportion of the total variance with higher
reliability, and yielded superior communalities for elements across all factors. Thus, the
adopted factor model is a compromise solution between the potentially competing objectives
of attaining simplicity and parsimony versus achieving geological interpretability.
From Table 5 it is apparent that Li and Sn are both poorly resolved by the factor
analysis with very low explained variance (i.e., low communalities of 0.195 and 0.441,
respectively). This reflects the lack of common variance in these elements, as is apparent in
the correlation coefficient matrix with no significant r-values for Li, and only one minor
significant r-value for Sn (i.e., 0.558). Furthermore, Mg, Bi and Te each exhibit only
moderately significant communalities (i.e., >0.450 and <0.600), indicating that the variance in
these elements is only moderately resolved by the factor analysis. As factor analysis only
resolves the structure in common variance, and rejects unique and error variance, it cannot
resolve the bulk of the variance in these elements.

R. E. Healy, 2014 Evaluation of Soil Geochemical Data from Boliden’s PL Areas 3545 & 3488
24
F-6 F-7 F-8 F-9 F-10 F-11 F-12 F-13 F-14
0.00
0.10
0.20
0.30
0.40
0.50
0.60
0.70
0.80
0.90
1.00
Main Parameters Used in Selection of Factor Analysis Model
Variance (100s) Prop. Common Variance Mean Reliability
Bentler's Simplicity Root Mean Square Residual No. Low Communalities (10s)
No. Sig. -ve Loadings No. Sig. +ve Loadings Zn Factor Reliability
Figure 7. Plot of metrics used in decision-making process to select factor
analysis model solution. Note inflexion points in multiple curves, particularly at
8, 10 and 12 factors.
The adopted factor analysis model reveals that the fundamental geochemical
character of the soils is defined by ten multi-element factors, and which are interpreted to
constitute geochemical associations that reflect significant underlying geochemical processes
in the soil formation (See Tables 5 and 6). The ten factors account for 91.1% of the common
variance and 80.3% of the total variance in the data set. Three associations dominate,
accounting for 66.5% of the common variance and 53.4% of the total variance in the data set,
and initially could be identified as clay-oxide-hydroxide, lime and ore associations.
Table 4. Principal Metrics Used in Selection of Factor Analysis Model
Factor
Model
Variance Proportion
of
Common
Variance
Mean
Reliability
Zn Factor
Reliability
Bentler's
Simplicity
RMSR No. of Low
Comm.
No. of
Significant
-ve
Loadings
No. of
Significant
+ve
Loadings
F-6 30.801 0.834 0.918 0.938 0.692 0.030 4 4 42
F-7 31.657 0.857 0.903 0.938 0.663 0.026 4 4 42
F-8 32.443 0.878 0.891 0.943 0.632 0.022 2 4 44
F-9 33.141 0.896 0.888 0.944 0.554 0.019 2 4 45
F-10 33.743 0.911 0.892 0.944 0.533 0.017 2 4 44
F-11 34.157 0.921 0.877 0.944 0.542 0.015 1 3 44
F-12 34.556 0.931 0.879 0.946 0.500 0.013 1 2 47
F-13 34.924 0.943 0.867 0.956 0.296 0.012 1 2 46
F-14 35.222 0.950 0.864 0.962 0.231 0.010 1 2 48
Note: 1. “RMSR” denotes root mean square residual.
2. “Comm.”denotes communalities.

R. E. Healy, 2014 Evaluation of Soil Geochemical Data from Boliden’s PL Areas 3545 & 3488
25
Table 5. Principal Factor Matrix for the Cooltomin Data Set
Element F1 F2 F3 F4 F5 F6 F7 F8 F9 F10 Comm.
Al 0.943 0.057 0.184 0.145 -0.040 0.034 0.155 -0.036 0.013 0.004 0.976
Fe 0.442 0.109 0.437 0.674 0.055 0.132 0.084 -0.054 0.001 -0.037 0.884
Mg 0.045 -0.003 -0.493 -0.301 -0.063 0.071 0.290 -0.026 -0.123 0.284 0.525
Ca -0.440 -0.061 -0.826 -0.236 0.011 -0.009 0.054 -0.001 -0.017 -0.048 0.941
K 0.926 0.060 0.036 0.071 -0.171 0.053 -0.015 -0.065 0.052 0.123 0.922
Na 0.910 0.033 0.032 -0.057 -0.105 -0.032 -0.266 -0.019 0.007 -0.033 0.918
P -0.063 0.121 0.214 0.168 0.124 0.034 0.034 0.040 -0.016 0.729 0.644
S -0.347 0.050 -0.132 -0.179 0.738 0.095 -0.019 0.166 -0.017 0.344 0.873
As 0.038 0.107 0.093 0.138 0.032 0.824 0.045 0.012 0.098 0.033 0.733
Ba 0.915 0.092 0.123 0.203 -0.004 0.028 0.106 -0.054 0.000 -0.007 0.917
Bi 0.281 0.589 0.126 0.109 0.016 0.069 0.123 -0.071 0.145 0.094 0.509
Cd -0.019 0.039 0.016 0.077 0.388 0.046 0.027 0.893 0.011 0.028 0.960
Ce 0.522 0.089 0.621 0.449 -0.216 -0.004 0.149 -0.010 -0.081 -0.053 0.946
Co 0.434 0.100 0.263 0.739 0.080 0.109 0.122 0.113 0.005 0.015 0.860
Cr 0.925 0.071 0.202 0.091 0.027 0.069 0.150 0.061 -0.046 -0.026 0.944
Cu 0.053 0.707 0.042 -0.135 0.186 0.096 0.035 0.214 -0.033 -0.012 0.615
Ga 0.926 0.061 0.212 0.156 -0.043 0.028 0.137 -0.018 0.047 -0.039 0.956
Ge 0.532 0.028 0.092 0.010 -0.008 0.074 -0.004 -0.024 0.690 -0.064 0.779
La 0.664 0.078 0.513 0.367 -0.155 0.037 0.251 0.034 0.111 -0.054 0.950
Li 0.403 0.015 0.097 0.038 0.026 0.010 0.133 -0.020 -0.053 -0.005 0.195
Mn 0.122 0.075 0.244 0.756 -0.323 -0.024 -0.175 0.020 -0.022 0.160 0.814
Mo -0.017 0.619 0.004 0.217 0.406 -0.051 -0.076 0.146 0.035 -0.122 0.641
Nb 0.878 0.023 0.061 -0.004 -0.066 -0.020 -0.281 0.048 -0.151 -0.051 0.887
Ni 0.558 0.074 0.295 0.492 0.142 0.255 0.244 0.215 0.023 0.074 0.843
Pb 0.130 0.748 0.135 0.122 -0.030 0.299 0.052 -0.069 0.046 0.093 0.718
Rb 0.871 0.076 0.129 0.208 -0.221 0.016 0.032 -0.071 0.152 0.114 0.916
Sb 0.190 0.632 -0.015 0.016 0.119 0.569 0.099 0.162 -0.024 -0.011 0.811
Sc 0.879 0.084 0.213 0.209 -0.001 0.046 0.244 0.022 0.159 -0.046 0.958
Se -0.215 0.184 -0.110 -0.069 0.880 0.029 0.030 0.243 0.053 -0.023 0.935
Sn 0.226 0.611 0.048 -0.026 0.025 -0.051 -0.013 -0.028 0.097 0.002 0.441
Sr -0.277 -0.047 -0.823 -0.171 0.051 -0.071 -0.046 -0.009 0.010 -0.174 0.826
Ta 0.780 0.023 -0.024 0.007 -0.062 -0.071 -0.432 0.058 0.007 -0.012 0.809
Te 0.052 0.492 -0.466 -0.029 -0.023 -0.139 0.032 0.007 0.031 -0.024 0.485
Th 0.929 0.070 0.170 0.136 -0.071 0.009 -0.019 -0.002 0.132 -0.047 0.940
Ti 0.967 0.049 0.031 0.007 -0.004 0.033 0.056 -0.018 0.093 -0.016 0.952
Tl 0.425 0.066 -0.194 -0.086 0.122 0.228 0.414 0.133 0.507 0.088 0.751
U 0.122 -0.007 0.106 0.060 0.796 -0.018 0.009 0.072 -0.033 -0.061 0.674
V 0.821 0.061 0.200 0.190 0.247 0.023 0.127 0.102 -0.047 -0.088 0.852
W 0.775 0.159 -0.055 0.035 0.040 0.037 0.050 0.027 0.264 0.000 0.706
Y 0.563 0.103 0.352 0.299 -0.012 0.183 0.518 0.128 0.138 0.045 0.880
Zn 0.091 0.943 0.025 0.102 0.016 -0.042 -0.031 -0.047 -0.025 0.051 0.917
Zr 0.960 0.051 0.041 0.021 -0.050 0.051 -0.014 0.002 0.087 0.019 0.940
Variance 15.057 3.905 3.467 2.867 2.735 1.368 1.283 1.132 1.025 0.904 33.743
%CommonVariance
44.62 11.57 10.28 8.50 8.11 4.06 3.80 3.36 3.04 2.68
Cumulative%Variance
44.62 56.19 66.46 74.97 83.07 87.13 90.92 94.28 97.32 100.00
ReliabilityEstimate
0.991 0.944 0.930 0.891 0.935 0.818 0.877 0.932 0.815 0.786
Notes: 1. ‘Comm.’ denotes communality, the fraction of explained variance in an element.
2. Significant loadings (>0.450) coloured using scheme applied to correlation coefficients in
order to identify geochemical associations (See Table 3).
3. Red colour applied to communalities indicates <0.450 values.

R. E. Healy, 2014 Evaluation of Soil Geochemical Data from Boliden’s PL Areas 3545 & 3488
26
The factors are named on the basis of interpreted geochemical association or soil-
forming process, or after the dominant constituent element.
Factor 1 is the dominant factor accounting for 44.6% of the common variance and
35.9% of the total variance in the data set, and includes significant loadings for Al, K, Na, Ba,
Ce, Cr, Ga, Ge, La, Nb, Ni, Rb, Sc, Ta, Th, Ti, V, W, Y and Zr. Of the 21 elements identified using
correlation coefficients as occurring in the Al association, only Fe has been reclassified into
another association. Notably, Fe gave a loading of 0.444, and thus has a minor, yet
gravimetrically significant fraction of variance incorporated into Factor 1. Most of these
elements in Factor 1 are defined as lithophile elements (i.e., silicate affinity: Al, K, Na, Ba, Ce,
Cr, La, Nb, Rb, Sc, Ta, Th, Ti, V, W, Y and Zr.), with one siderophile element (i.e., oxide affinity:
Ni), and two chalcophile elements (i.e., sulfide affinity: Ga and Ge).
From the elemental abundances in Table 2, it is apparent that the gravimetrically
predominant elements are Al, K and Fe, even though the latter is not classified sensu stricto as
an association element. These elements indicate that the host mineralogy of the association
is non-refractory during acid digestion, such as clays and oxide/hydroxides, and which is
probably derived from the siliciclastics component in the soils. Notably, Mg does not load
onto Factor 1 (i.e., 0.045), whilst Ca has a near-significant negative loading (i.e., -0.440),
suggesting this association lacks any significant carbonate component. Although Ba is typically
associated with Irish Type ores, Ba loads very strongly on to Factor 1 (i.e., 0.915). This
indicates that the Ba signature is not ore-related, but more probably reflects an argillaceous
detrital component, probably represented in the weathered environment by Ba-rich clays.
McLean & Bledsoe (1992) report that the relative affinity of montmorillonite for alkaline
earths is Ba > Sr > Ca > Mg, confirming the affinity of Ba for the clay fraction.
Factor 1 is an association of elements hosted in clays and oxides-hydroxides that are
variably retained in the A horizon of the soils. The factor is interpreted to represent the
principal effect of the podzolisation process on the A horizon, namely the elluviation of clay
and oxides. In soils generated overwhelmingly from limestone till, the factor thus describes
the range in clay and oxide content of the soil A horizon from, for example, Gleys to Brown
Earths to Grey Brown Podzolics. High factor scores correlate with high clay and oxide
retention in the A horizon, and hence increased podzolisation. Although not the product of
podzolisation, Lithosols lie on the extreme low end of the range in Factor 1 scores. The parent
material of Lithosols is limestone bedrock, not till, and thus lacks significant clay or oxide-
hydroxide content.
Factor 2 accounts for 11.6% of the common variance and 9.30% of the total variance
in the data set, and includes significant loadings for Bi, Cu, Mo, Pb, Sb, Sn, Te and Zn. Seven of
these elements are defined as chalcophile elements (i.e., Bi, Cu, Pb, Sb, Sn, Te and Zn), with
one siderophile element (i.e., Mo). The elements strongly loaded onto Factor 2 include 6 of
the elements that Blakeman (pers. comm. 2014) states occur in, or are associated with, the
R. E. Healy, 2014 Evaluation of Soil Geochemical Data from Boliden’s PL Areas 3545 & 3488
27
mineralisation (i.e., Ag, As, Cd, Cu, Fe, Pb, Sb, Zn, Hg, Mo, Te, Th, Tl, W and U), albeit Ag and
Hg were not included in the factor analysis. Factor 2 is interpreted to reflect the dominant
signature in the secondary environment of carbonate hosted Zn-Pb mineralisation, and is
identified as an ore association.
The dominant soil types in the study area are Grey Brown Podzolics and Brown
Earths, which are well drained and derived from calcareous parent material. Most elements
of the association are characterised by low mobility in a secondary environment with
oxidising, alkaline conditions, and in the presence of carbonate (Levinson 1974). Although Cu
and Mo have very similar mobilities in the primary environment, unlike Cu, Mo is mobile in
oxidising alkaline secondary environment, except critically in the presence of carbonate (i.e.,
forms insoluble carbonate). Sn is essentially immobile in the secondary environment due to
the refractory character of the principal Sn-bearing ore minerals (e.g., cassiterite) and rock-
forming minerals (e.g., sphene or magnetite) and their strong tendency to become resistate
minerals (Salminen 2005). Thus, the factor encompasses ore-related elements with low
mobility in the prevailing secondary environment, and describes the variation in
concentrations of these elements in the A horizon due to localised (i.e., strongly spatially
controlled) primary and secondary dispersal. The lack of Cd covariance with Zn and other
elements of Factor 2 reflects the differential mobility of Cd in the alkaline secondary
environment, and negates its use here in the validation of Zn anomalies as suggested by
Salminen (2005).
Factor 3 accounts for 10.3% of the common variance and 8.25% of the total variance
in the data set, and includes significant negative loadings for Ca, Mg, Sr and Te, and significant
positive loadings for Ce and La. Five of these elements are defined as lithophile elements (i.e.,
Ca, Mg, Sr, Ce and La), with one chalcophile element (i.e., Te). The highest loadings are for the
two alkaline earths Ca and Sr (i.e., -0.826 and -0.823, respectively), which indicate a limestone
signature, given the strong tendency of Sr for diadochic substitution with Ca in carbonates.
The weak significant loading on Mg (i.e., -0.493) is consistent with Mg in calcite, or more
probably dolomite. The weak significant loading for Te (i.e., -0.466) is considered potentially
spurious, particularly in the context of the significant percentage of censored Te data, and the
fact that Te exhibits only a single weak significant correlation coefficient (i.e., 0.465 with Zn).
Ce and La exhibit significant positive loadings, which thus have an inverse relationship to Ca,
Sr and Mg. Ce and La tend to concentrate in resistate minerals such as monazite (Salminen
2005). Ce and La are also significantly loaded on to Factor 1, and their inverse relationship to
Ca, Sr and Mg further suggests a limestone signature. Because Varimax factor rotation is
orthogonal, and generates factors that are uncorrelated, oblique factor rotation may have
been preferable to describe the relationship between Factors 1 and 2.
Factor 3 is an association of elements characteristic of limestone that are variably
leached or retained in the A horizon of the soils. The factor is interpreted to represent the
effects of the major soil-forming process gleisation on the A horizon. Gleisation is caused by

R. E. Healy, 2014 Evaluation of Soil Geochemical Data from Boliden’s PL Areas 3545 & 3488
28
waterlogging, which reduces water movement and leaching, and is associated with the
development of anaerobic, reducing conditions. The factor describes variation in the leaching
of elements associated with carbonates (i.e., Ca, Mg and Sr), and retention of elements
associated with resistate minerals (e.g., Ce and La) in the A horizon due to the process of
gleisation. Ca and Mg tend to be the first elements to be leached during soil formation, and
their retention in the A horizon is indicative of the limited leaching regime in gley soils.
Given that the soils in the study area are generated overwhelmingly from limestone
till, Factor 3 is not a limestone signature, but rather a lime or gley signature, where high
Factor 3 scores are indicative of high Ca retention due to gleisation. Factors 1 and 3, which by
definition are uncorrelated, are interpreted to represent the effects of two major soil-forming
processes on the A horizon, and their non-antithetic relationship is consistent with being two
of many competing soil-forming processes acting simultaneously upon the soils.
Factor 4 accounts for 8.50% of the common variance and 6.83% of the total variance
in the data set, and includes significant loadings for Fe, Co, Mn and Ni. Three of these
elements are defined as siderophile elements (i.e., Fe, Co and Ni), with one lithophile element
(i.e., Mn). Fe and Mn are well known to occur together in the secondary environment as
oxides and hydroxides. These oxides-hydroxides are insoluble in all but the most acidic and
reducing conditions found in the weathering environment, and tend to co-precipitate Co and
Ni (Levinson 1974, Salminen 2005). In addition, Co and Ni have a strong affinity for these
oxides-hydroxides, which through adsorption, scavenge Co and Ni that might otherwise
remain in solution, if conditions are acidic or oxidising. Interestingly, Ce, La and Y, which tend
to occur in resistate minerals and are essentially immobile in the secondary environment, give
minor but non-significant loadings on Factor 4.
Fe-Mn oxides-hydroxides are essentially ubiquitous in soils, commonly occurring as
coatings with high surface areas, and are a major soil surface controlling metal mobility in
soils, and the principal control on the fixation of Co, Ni, Cu and Zn in soils (Jenne 1968, Young
2010). Numerous adsorption sequences have been established from experimental work,
indicating relative affinity amongst heavy metals, such as Hg, Pb, Cu, Zn, Co, Ni and Cd for the
many specific Fe-Mn oxides-hydroxide species, and tend to confirm the similarity of
behaviour of Co and Ni (Levinson 1974, Young 2010). There are numerous factors influencing
the adsorption of the heavy metals, including concentration of the specific metal, the amount
and strength of organic chelates and complex-forming ions in solution, pH, and presence of
clays and carbonates (Jenne 1968).
Factor 4 is an association of elements characteristic of Fe-Mn oxides-hydroxides that
are variably concentrated in the A horizon of the soils. The factor is interpreted to represent
the variable concentration of Fe-Mn oxides-hydroxides in the A horizon. Mn and particularly
Fe are very insoluble in the secondary environment and tend to be concentrated in the A
horizon, along with resistate minerals, by elluviation of other soil components. Thus, Factor 4

R. E. Healy, 2014 Evaluation of Soil Geochemical Data from Boliden’s PL Areas 3545 & 3488
29
seems to represent the fraction of Fe, Mn, Co and Ni bound in Fe-Mn oxides-hydroxides, and
which is largely unaffected by podzolisation, although intense podzolisation would also leach
Fe and Mn.
Factor 5 accounts for 8.11% of the common variance and 6.51% of the total variance
in the data set, and includes significant loadings for S, Se and U. Two of these elements are
defined as chalcophile elements (i.e., S and Se), with one lithophile element (i.e., U). Mo, Cd
and V also show minor but non-significant loadings on the factor (i.e., 0.388, 0.406, 0.247
respectively). S, Se, U, Mo and V (but not Cd) are characterised by very high mobility in the
secondary environment, particularly when neutral to alkaline, but exhibit very low mobility in
reducing environments (Levinson 1974, Salminen 2005). Cd exhibits medium mobility under
most conditions, except reducing conditions, where it also becomes immobile.
Despite their high mobility, reducing conditions are a geochemical barrier to S, Se and
U, and can cause precipitation in significant concentrations as ‘false’ or non-significant
anomalies, which are also typically laterally displaced from their source (Levinson 1974).
Although U can be precipitated by adsorption onto organics, clays and Fe-Mn oxides or by
formation of insoluble compounds in certain oxidising conditions, the association of U with S,
Se, Mo and V is typical of “roll-front” U deposits, formed at the interface of oxidising and
reducing groundwaters (EPA 1995). Thus, Factor 5 seems to encompass elements that are
very mobile in the oxidising alkaline secondary environment, but which rapidly precipitate
due to contact with reducing conditions. Such conditions may occur in organic-rich or peaty
soils and peat in fens or bogs, or where oxidised alkaline conditions encounter seepage of
reduced groundwater, possibly along faults or at a break of slope. The factor is interpreted as
an association of very mobile elements precipitated under reducing conditions probably
associated with abundant organics. Unfortunately, as the organic content of the soils was not
determined, the relationship of the elements loading on the Factor 5 to the organic content is
outside the data set, and is untestable. Nonetheless, this factor is referred to as a reduction
barrier association, and importantly has the potential to generate false anomalies.
Factor 6 accounts for 4.06% of the common variance and 3.26% of the total variance
in the data set, and includes significant loadings for As and Sb. Both of these elements are
metalloids, are defined as chalcophile elements, and exhibit most similar geochemical
behaviour. However, As exhibits medium mobility, whereas Sb exhibits low mobility in the
secondary environment, except under reducing conditions where both elements become
immobile (Levinson 1974). The lower mobility of Sb relative to As in oxidising alkaline
conditions probably explains the additional association of Sb with the less mobile ore-related
elements of Factor 2. Notably, As exhibits a strong significant loading on the factor (i.e.,
0.824), whereas Sb exhibits a moderate significant loading (i.e., 0.569), due to the masking
effect of an even greater fraction of the variance in Sb being assigned to Factor 2. According
to Levinson (1974) As and Sb are both highly mobile in the primary environment and tend to
concentrate in the late differentiates and laterally distal from the source (i.e., large primary

R. E. Healy, 2014 Evaluation of Soil Geochemical Data from Boliden’s PL Areas 3545 & 3488
30
haloes around ore). Thus, Factor 6 may reflect both primary differentiation and differential
secondary mobility of As and Sb relative to the other ore-related elements of Factor 2. An
intersection of vein sulfides grading 14% As (Blakeman, pers. comm. 2014) suggests that
Factor 6 may reflect primary dispersion as highly differentiated vein mineralisation.
Factor 7 accounts for 3.80% of the common variance and 3.05% of the total variance
in the data set, and includes a single significant loading for Y (i.e., 0.518). Y is a lithophile
element with geochemical behaviour similar to the heavier REEs, exhibiting low mobility in all
secondary environments, and tending to concentrate in resistate minerals such as xenotime
and zircon (Salminen 2005). There are also minor but non-significant positive loadings for Mg
and Tl and negative loadings for Ta and Nb. The mechanism of Factor 7 seems indeterminate,
although the abundance of resistate minerals containing Y in the A horizon are expected to
increase with increasing siliciclastic component in the soil, or by elluviation due to
podzolisation.
Factor 8 accounts for 3.36% of the common variance and 2.70% of the total variance
in the data set, and includes a single strong significant loading for Cd (i.e., 0.893). Cd is a
chalcophile element with geochemical behaviour similar to Zn, but has medium mobility in
the secondary environment (Levinson 1974). Although the solubility of Cd is largely
unaffected by Eh, Cd has a strong affinity for organic matter, and thus becomes immobile in
reducing environments associated with organics (Salminen 2005). Although Cd has a strong
affinity for Fe-Mn oxides-hydroxides (Young 2010), the dominant fraction of Cd, which is
associated with Factor 8, is unrelated to Fe and Mn, but rather is probably related to organics
or another unidentified factor in the soil.
Because of its strong chalcophile affinities, Cd generally occurs in sulfides, particularly
sphalerite, and the presence of Cd may be used to validate uncertain Zn anomalies (Salminen
(2005). Sphalerite formed at lower temperatures can accommodate higher Cd contents,
resulting in Zn/Cd ratios typically in the range of 200 to 400 for SEDEX and VHMS deposits.
Furthermore, Cd is more chalcophile than Zn, resulting in high Zn/Cd ratios for magmatic
rocks (i.e., 500). The Zn/Cd ratios of approximately 100 at Cooltomin may thus suggest
anomalous enrichment in Cd. Importantly, phosphate fertilisers and sewage sludge both
contain elevated levels of Cd, which when spread on land, act as significant sources of Cd in
soil (Van Kauwenbergh 2002, Salminen 2005). Such an anthropogenic component to Cd might
mask the natural geochemical association of Cd, including any association with ore, and
probably negates its use in validating Zn anomalies.
Factor 9 accounts for 3.04% of the common variance and 2.44% of the total variance
in the data set, and includes significant loadings for Ge and Tl (i.e., 0.690 and 0.507,
respectively). Ge and Tl are chalcophile elements, but also exhibit strong organophile
properties. Both elements occur at high levels in sphalerite and galena, particularly Ge in low
temperature varieties (Salminen 2005). Ge and Tl enrichment is associated with hydrothermal

R. E. Healy, 2014 Evaluation of Soil Geochemical Data from Boliden’s PL Areas 3545 & 3488
31
fluids in the Red Dog Zn-Pb-Ag deposits, Alaska (Slack et al. 2004), whilst Tl enrichment is
associated with mineralisation at Cooltomin (Blakeman, pers. comm. 2014). These elements
exhibit variable mobility in the secondary environment, but are both readily fixed by Fe-Mn
oxides-hydroxides and organic matter, particularly in reducing conditions (Levinson 1974).
Nonetheless, as the primary deportment of Ge and Tl is not known, and their behaviour in the
secondary environment is poorly understood, the mechanism of Factor 9 is indeterminate.
Factor 10 accounts for 2.68% of the common variance and 2.15% of the total variance
in the data set, and includes a single strong significant loading for P (i.e., 0.729). P is a
siderophile element with lithophile and organophile properties depending on prevailing
conditions. P almost exclusively occurs as orthophosphate (i.e., PO43-), and principally occurs
in apatite, monazite and xenotime, or as a trace element in many rock-forming minerals
(Salminen 2005). The latter author reports that P exhibits low mobility in the secondary
environment, as it is readily adsorbed or fixed by clays and hydrous oxides of Fe and Al to
form insoluble Al and Fe phosphates in acid soils. In alkaline soils P is fixed by CaCO3 to form
progressively insoluble Ca phosphates from simple mono- and di-calcium phosphates (e.g.,
monetite or brushite) to apatite.
Because of the process of fixation, P becomes unavailable for plant take-up, and is
regularly reapplied to agricultural land. P is applied to agricultural land by spreading
phosphate fertilisers and sewage sludge (or slurry), which is also P-rich (i.e., #4% of dried
matter; O’Riordan et al. 1986). If this anthropogenic component of P is dominant in the soils
of the study area, then Factor 10 may simply be an expression of the intensity of agriculture,
specifically fertiliser and sludge use.
Table 6. Summary of the Factors and Geochemical Associations
Factor Elements Association
F 1 Al, K, Na, Ba, Ce, Cr, Ga, Ge, La, Nb, Ni, Rb, Sc, Ta, Th, Ti, V, W, Y, Zr Clay/Oxide
F 2 Bi, Cu, Mo, Pb, Sb, Sn, Te, Zn Ore
F 3 Ca, Mg, Sr, Ce, La, Te Lime or Gley
F 4 Fe, Mn, Co, Ni Fe-Mn-Oxides
F 5 S, Se, U Reduction Barrier
F6 As, Sb Metalloid
F7 Y Yttrium
F8 Cd Cadmium
F9 Ge, Tl Germanium
F10 P Phosphorus
Note: Ce, La, Ni, Sb and Te are the only elements to load significantly on more than one factor.

R. E. Healy, 2014 Evaluation of Soil Geochemical Data from Boliden’s PL Areas 3545 & 3488
32
5.2. SPATIAL ANALYSIS
In addition to factor loadings extracted for the 42 elements, factor scores were also
calculated for each of the 1,421 soil samples. Factors extracted from geochemical data
constitute geochemical associations that reflect the underlying geochemical processes. Factor
scores are estimates of the contribution of the factors to each original variable (i.e., element
concentration in a sample), and thus describe the degree to which the geochemical processes
are expressed in the composition of the samples (Davis 1986). Thus, the spatial distribution of
the factor scores allows the expression of geochemical processes, as described by the factors,
to be modelled with GIS.
The GIS analysis was done using ArcMap 10.2, a proprietary product from Esri (Esri
2012). The principal feature employed is spatial interpolation to generate prediction surfaces
from the factor scores using the Geostatistical Extension. A companion program of ArcMap
from the ArcGIS suite of programs, called ArcScene, was used to generate 3-D surface
diagrams of the spatial distribution of factor scores.
The factor scores were imported into ArcMap, with each sample represented by a
sample label, a pair of X,Y coordinates for the sample point in the form of Irish Grid (i.e.,
spatial data), and ten factor scores (i.e., attribute data). Attribute data values can be
considered as representing scattered points on hypothetical continuous attribute surfaces.
Spatial interpolation computes a continuous raster surface of predicted values from
geospatially referenced attribute data, such as factor scores, from a smaller number of
sample data points, which may be stratified, clustered or randomly distributed.
There are numerous interpolation methods, each of which is appropriate to particular
data sets because of the built-in assumptions and algorithm design for estimating new values.
Glennon et al. (2012) and Healy (2013) used Ordinary Kriging to interpolate the Surge
inorganic geochemical data, and the same method was employed here. Kriging is an advanced
geostatistical procedure based on statistical models that generates an estimated surface from
a set of points with z values, where the z-values correspond to geochemical data, or in this
case its derivative, factor scores. In addition to generating the predicted surfaces,
geostatistical methods can also measure the accuracy of the predictions. Kriging is useful
when there is a spatially directional bias or anisotropy in the data, and is commonly used for
modelling in soil science and geology. The raster surfaces for the ten sets of factor scores are
each projected in the Irish National Grid TM65, and are given in Figures 1 to 10 of the
Appendix.

R. E. Healy, 2014 Evaluation of Soil Geochemical Data from Boliden’s PL Areas 3545 & 3488
33
5.2.1. Soil Maps
A map of the study area showing the location of the townlands, which are used for
geographic reference in the following discussion is given in Figure 11 of the Appendix. The
drainage pattern in the wider area consists of subparallel rivers and streams running north to
the Shannon Estuary. Three rivers/streams transect the study area (See Fig. 12 of the
Appendix). On the east side of the study area, the River Deel runs north from Rathkeale to
Askeaton and ultimately into the Shannon Estuary at Shannon View. A significant unnamed
tributary of the Deel runs from Lisnacullia to join the Deel at Ardgoulbeg, and is named the
Lisnacullia Stream for convenience. On the west side of the study area, the River Ahacronane
runs in an arc from the southwest corner of the study area in the townland of Ballynisky
through the townlands of Lissatotan and Cooltomin to the northwest corner of the study area
at Creeves, ultimately draining into the Shannon Estuary at Aughinish West. In the centre of
the study area, an unnamed stream runs through the centre of the study area from Ranahan
to Ballinloughane, and ultimately drains into the Shannon Estuary at Cahergal. This stream is
named the Ranahan Stream for convenience. Only the River Deel was digitised using Google
Earth, and thus spatial data are not available for the River Ahacronane or the Ranahan and
Lisnacullia streams, the three of which are little more than ‘wet’ drainage ditches. The reader
is encouraged to become familiar with the location of the townlands, rivers and streams in
the study area prior to proceeding further (See Figs. 11 and 12 of the Appendix).
In 1960, the newly constituted An Foras Taluntais (i.e., precursor of Teagasc) began a
National Soil Survey (NSS), and published a county survey series initially with Co. Wexford,
and secondly with Co. Limerick. The soil map of Co. Limerick with accompanying Soil Survey
Bulletin No. 16 was published by Finch & Ryan (1966), and was compiled by surveying and
mapping using direct visual inspection, profile pits and laboratory analysis. The soil map was
developed on a nominal working scale of 1:10,560, condensed down to a publication scale of
1:126,720, and maps the distribution of soil types based on the classification of the Great Soil
Groups of Ireland. This map provides detailed discrimination of Grey Brown Podzolics from
Brown Earths as separate soil groups, each comprised of several individual soil series (See Fig.
13 of Appendix).
The 2nd Edition of the General Soil Map of Ireland with accompanying Soil Survey
Bulletin No. 36 was published by Gardiner & Radford (1980). The map has a publication scale
of 1:575,000, and only discriminates Brown Earths and Rendzinas (33) and Minimal Grey
Brown Podzolics (34) within the study area (See Fig. 14 of Appendix). This small scale results
in generalised features that provide inadequate geographic reference to allow useful spatial
data for the two soil types identified in the study area to be extracted. When the NSS was
wound down in 1988, it had thus produced a national map at general reconnaissance scale of
1:575,000 scale, and county maps at a detailed reconnaissance scale of 1:126,720 for less
than half of the country.

R. E. Healy, 2014 Evaluation of Soil Geochemical Data from Boliden’s PL Areas 3545 & 3488
34
Driven by a requirement arising from the EU Water Framework Directive 2000 to
establish nationwide soil and subsoil maps by a consistent, standardised method, Teagasc and
the EPA initiated a Soil and Subsoil Mapping Project, the final report for which was published
by Fealy & Green (2009). The soil map of every county in Ireland were compiled by a remote
sensing and GIS-based methodology. Soil type was predicted using key soil factors (e.g.,
vegetation) and geology (e.g., parent material) and topography (e.g., slope), and using a
qualitative, expert-based classification system. In order to map all the soil variants in a single
national soil map, the classification system of soil types had to be highly simplified relative to
previous soil surveys, but retained a close relationship to the Great Soil Groups in Ireland, and
thus facilitates higher level interpretation. Although the soil map has a maximum online scale
of 1:2,000, the nominal working scale of 1:100,000-150,000 was used during map
preparation.
The Teagasc/EPA Soil Map is cartographically detailed, but is categorically simplified,
and for example, does not discriminate between Grey Brown Podzolics and Brown Earths, the
two dominant soil types in the study area, but instead maps these as a single soil type (See
Fig. 6). Nonetheless, because the Teagasc/EPA National Soil Map is cartographically complex,
offering superior spatial definition and geo-referencing, the spatial distribution of the factor
score data is interpreted with reference to it. Supplementary interpretation relating to the
distribution of certain soil types is based on the Soil Map of Limerick (Finch & Ryan 1966), and
the projection of this onto the study area (See Fig. 15 of the Appendix).
The dominant soil type in the study area is given as BminDW (See Fig. 6), which
consists of Grey Brown Podzolics and Brown Earths (See Table 1 of Appendix). Grey Brown
Podzolics usually form from calcareous parent material, which limits the process of
podzolisation, resulting in less leaching and elluviation of clays from the A horizon. Brown
Earths are acidic soils that tend to occur on lime-deficient parent materials, but can occur on
lime-rich parent materials, and exhibit some leaching of soluble elements, such as Ca and Mg.
There are three other significant soil types in the study area: (1) BminSW (i.e., Rendzinas and
Lithosols) are shallow well drained soils derived mainly from non-calcareous parent material;
(2) BminPD (i.e., Surface Water and Groundwater Gleys) are deep poorly drained soils derived
mainly from calcareous parent material; and (3) AlluvMin (i.e., Mineral Alluvium) is a recent
deposit consisting generally of well sorted and bedded gravel and sand with minor fractions of
clay and silt, and 10-30% organic material (Fealy & Green 2009). The alluvium deposits form
when rivers meander across their valleys and flood over their floodplains.

R. E. Healy, 2014 Evaluation of Soil Geochemical Data from Boliden’s PL Areas 3545 & 3488
35
5.2.2. Effect of Undetermined Components in Soil
The soil samples used in this study are considered shallow as they were collected
from the A horizon, which typically is heavily leached, and normally regarded as a poor
sampling horizon (Levinson 1974). The geochemical compositions, and the factor analysis
derived therefrom, apply to the A horizon specifically, and the unique set of soil-forming
processes that are acting upon that horizon. Consideration needs to be given to: (1) the
dilutant or contaminant effect of significant transported components in soils, such as alluvium
(McQueen 2009); (2) the strong effect of organics in marshy and peaty soils, especially fens
and bogs; (3) the affect of anthropogenic processes on shallow soils, including intensive
agriculture and pollution, given the proximity to the urban area of Rathkeale; and (4)
identifying primary dispersion through up to 9m of transported overburden.
The geochemical analysis is a partial extraction, and does not include silicate minerals
that are insoluble (i.e., refractory) during acid digestion (e.g., quartz). Similarly, the organic
content, which is a significant component of the A horizon, is not measured. Thus, significant
gravimetric components of the soil are not included in the geochemical compositions. Whilst
the magnitude of these refractory and organic components may not affect the relationships
between elements in a given sample, it does affect these relationships between samples, and
is thus a determinant in the factor analysis. An increase in the sand or peaty component in the
soil, will depress the abundances of the other soil components, such as clays, carbonates,
oxides and hydroxides (i.e., the analysed aliquot), and the measured chemical signature due
to these minerals.
In order to determine whether there are any significant effects from undetermined
mineral components on the spatial distribution of the factor scores, a total simplified
normative mineralogical composition was calculated for each sample. The normative
mineralogy is based on the concentration of four major elements (i.e., Al, Fe, Mg and Ca) and
simple assumed mineral compositions, and is thus considered indicative only. The four
mineral components are: (1) clay assuming a mean content of 15% Al; (2) Fe-hydroxide
assuming a mean content of 40% Fe; (3) dolomite assuming a mean content of 15% Mg; and
(4) calcite assuming a mean content of 40% Ca. The four normative contents were combined
and the totals were interpolated across the study area and rendered as a map (See Fig. 8).
Areas of the map with low totals (i.e., coloured blue) indicate significant contents of organics
and/or quartz (or other refractory minerals during acid digestion).
The most distinctive feature of Figure 8 is the area in Ardlaman that exhibits
uniformly low Total Normative Mineralogy, and which almost precisely coincides with
correspondingly distinctive areas in the spatial distribution of Factor 1 and 3 scores (See Figs.
1 and 3 of the Appendix). This observation suggests that the samples in the Ardlaman area
contain high quartzose and/or organic contents, which are thus in conflict with the soil maps

R. E. Healy, 2014 Evaluation of Soil Geochemical Data from Boliden’s PL Areas 3545 & 3488
36
Figure 8. Map of Total Simple Normative Mineralogy across study area, which was calculated from
concentrations of the major elements Al, Fe, Mg and Ca, and simple assumed mineral compositions.
Data from this study, Geological Survey of Ireland, Central Statistics Office, Ordinance Survey of
Ireland, Open Street Map and Google Earth.
and indicated soil types, and this has a significant bearing on the interpretation of Factors 1
and 3 (See Section 5.2.2. Spatial Modelling of Factor Scores).
High organic contents may relate to excessively shallow sampling, but the magnitude
of the low totals in the Ardlaman area (i.e., 16.9 to 40.8%) argues against such an explanation.
The low totals might also reflect a large fraction of silicate minerals other than quartz that are
refractory during acid digestion. If significant proportions of rock-forming minerals are not
soluble during acid digestion, the value in determining and certifying the Al concentrations in
soil samples is questionable. Irrespective, a large fraction of quartz or refractory silicates in
the Ardlaman area would signify a change in soil type that is not reflected in the soil maps.
The Soil Map of Limerick (Finch & Ryan 1966) indicates a tongue of Lithosol in the Ardlaman
area, but this being derived in situ directly from limestone bedrock, would be expected to
carry minor silicates, and hence give high normative totals. In contrast, the Soil Map of Ireland
(Fealy & Green 2009) indicates the occurrence of undifferentiated Brown Earths and Grey
Brown Podzolics. Thus, the soil maps do not explain the composition of soils observed at
Ardlaman, which may reflect changes in parent material, soil type effects or sampling error.

R. E. Healy, 2014 Evaluation of Soil Geochemical Data from Boliden’s PL Areas 3545 & 3488
37
5.2.3. Metal Dispersion and Sampling
The concentration of a specific metal in soils is the result of a complex set of
processes that influenced the dispersion of that metal in the primary and secondary
environment, where the latter is defined here as the zone of oxidation and weathering.
Processes such as sedimentary deposition, burial diagenesis, deformation and faulting, and
magmatic and hydrothermal activity effect control in the primary environment, whilst
glaciation (primarily mechanical) and soil-forming processes (primarily chemical) effect
control in the secondary environment. Secondary dispersion results in the redistribution of
the primary distribution of elements in unweathered rock. Because the physico-chemical
conditions of the primary and secondary environments differ significantly, elements exhibit
differential mobility between these two environments, resulting in disparate elemental
distributions and geochemical associations.
Chemical, biological, mechanical and environmental factors control soil systems, and
thus affect the secondary dispersion of individual elements. Some of the more important
factors are: (1) bulk composition and mineralogical character of material; (2) Eh and pH
conditions; (3) mobility of elements and their compounds in presence of organics; (4)
presence of media capable of limiting dispersion through precipitation (e.g., carbonates and
bacteria); (5) vegetation and micro-organisms (e.g., role in production of humus and
oxidation-reduction); (6) mechanical dispersion (e.g., by gravity movement, surface water,
glaciation and bioturbation); (7) climate; (8) topography; and (9) time (Levinson 1974).
According to Shuman (1991), metals occur in specific forms or ‘pools’ in soil, and these are:
(a) dissolved in solution; (b) exchange sites on inorganic soil constituents; (c) adsorbed on
inorganic soils constituents; (d) associated with insoluble organic matter; precipitated as pure
or mixed solids; (e) in the structure of secondary minerals; and (f) in the structure of primary
minerals. As soil systems are dynamic and highly complex, with multiple components and
processes, perturbations in the system can cause metal redistribution between the ‘pools’.
Differences in geological, geomorphological and environmental settings impart
unique surface geochemical signatures to individual deposits. Anthropogenic effects due to
activities such as agriculture, vehicular traffic or industrial pollution are also superimposed on
the geogenic domain. In glaciated terrain, till sampling at depths of typically >0.75m is often
preferred to mitigate changes in geochemistry due to pedogenic and possibly anthropogenic
processes (McClenaghan 2007). Near-surface soils are more suitable than tills for detailed
geochemical sampling at the property scale, partly for reasons of sampling speed and cost
(Cook & Dunn 2007), but are more removed from the bedrock source and vulnerable to
anthropogenic effects. These shallow soil samples (i.e., <0.5m) are also vulnerable to changes
in geochemistry associated with soils types, and this mixing of sample media introduces
significant noise into the data (Hamilton 2007). Nonetheless, soil sampling is generally
recommended in areas with soil developed over transported overburden with depths of less
than 5m (McQueen 2009). However, the analyst must be cognisant of variation in the data
due to the array of regolith and pedogenic processes, soil type effects and anthropogenic
effects, to which the chosen method of geochemical prospecting is sensitive.

R. E. Healy, 2014 Evaluation of Soil Geochemical Data from Boliden’s PL Areas 3545 & 3488
38
Figure 9. 3D surface diagram of Factor 1 scores across the study area. Areas of high
factor scores are in red and brown; intermediate scores in light yellow and blue; and
low scores in dark blues. Viewpoint is from the SSE.
5.2.4. Spatial Modelling of Factor Scores
Factor 1 is the dominant factor accounting for 35.9% of the total variance in the data
set, and includes significant loadings for Al, Na, Ba, Ce, Cr, Ga, Ge, La, Nb, Ni, Rb, Sc, Ta, Th, Ti,
V, W, Y and Zr. Although Fe only has a minor non-significant loading on Factor 1, the
gravimetrically significant elements (i.e., >1wt%) associated with Factor 1 are the major
elements Al, K and Fe. Factor 1 suggests a clay plus oxide/hydroxide association, most
probably derived from the detrital or siliciclastic component in the soil parent material.
Much of the study area exhibits intermediate values for Factor 1, with high values
concentrated in Ardgoulbeg, Cloghanarold in the east, and near Creeves in the northwest (See
Fig. 1 of the Appendix, and Fig. 9). The most conspicuous feature is a rectangular area of
uniformly low Factor 1 scores in Ardlaman, and extending SSW to Ranahan, coincident with
the Ranahan stream and the occurrence of gleys and cutover peat. An area of low factor
scores also occurs near Lisnacullia, and is partly coincident with the Lisnacullia stream, whilst
a ‘boudinage-like’ string of low values is largely coincident with the arc of the River
Ahacronane. Both of these areas also coincide with the occurrence of alluvium and/or gleys.
The River Deel is associated with significant deposits of coincident alluvium, but is not
generally coincident with low Factor 1 scores.
It is clear that the A horizon across most of the study area is relatively clay-oxide-rich,
albeit distinct areas with significantly clay-oxide-depleted A horizons are observed. A
consistent relationship of Factor 1 scores with soil types seems apparent, with reasonable

R. E. Healy, 2014 Evaluation of Soil Geochemical Data from Boliden’s PL Areas 3545 & 3488
39
coincidence between areas with low Factor 1 scores and the occurrence of Alluvium and
Gleys. High Factor 1 scores correspond to high clay-oxide contents in the A horizon, which for
most of the soils in the study area, equates with the intensity of podzolisation. As
podzolisation develops in limestone-rich till, carbonates are initially elluviated, preferentially
elevating the clay-oxide content of the A horizon from that of Gleys to Brown Earths to Grey
Brown Podzolics. Interestingly, areas identified as Grey Brown Podzolics in the Soil Map of Co.
Limerick (Finch & Ryan 1966) cannot be consistently discriminated from those of Brown
Earths on the basis of Factor 1 scores (e.g., Compare Factor 1 scores for Ardgoulbeg and
Ballynisky areas with soil types observed in Fig. 15 of the Appendix).
The distinct rectangular area of uniformly low Factor 1 scores in the Ardlaman area
appears not to correspond Alluvium and Gleys, but to an area of Lithosol identified in the Soil
Map of Co. Limerick (Finch & Ryan 1966), but which is not discriminated in more recent Soil
Maps of Ireland (Gardiner & Radford 1980, Fealy & Green 2009). Compare Figure 6, and
Figures 13, 14 and 15 of the Appendix. The low Factor 1 scores of the possible Lithosols
cannot be attributable to impeded podzolisation (as in Gleys), but instead might reflect the
lack of clay-oxide content in the limestone bedrock parent material. However, the spatial
distribution of the Total Normative Mineralogy (See Fig. 8) explains the low Factor 1 scores at
Ardlaman on the basis of undetermined components, namely high quartzose and/or organic
contents. Thus, Factor 1 is an association of elements associated with increasing clay and
oxide contents of the A horizon with increasing podzolisation, although low Factor 1 scores
can also reflect elevated content of undetermined components.
Factor 2 accounts for 9.30% of the total variance in the data set, and has significant
loadings for Bi, Cu, Pb, Sb, Sn, Te and Zn. This factor is interpreted to reflect the signature of
Zn-Pb mineralisation in an alkaline secondary environment due to ore-related elements with
low mobility, and is identified as an ore association. The Factor 2 scores show a strong high
value anomaly centred on Irish Grid Reference 131700,144550 at Cooltomin, with minor
satellite anomalies slightly further to the west, and also to the south at Gortroe (See Fig. 2 of
Appendix and Fig. 10). The Cooltomin anomaly has a N-S orientation, extending for 900m
north from near the Waulsortian-Rathkeale contact at 144200N to 145100N. The anomaly is
interpreted to reflect secondary dispersion in till of low mobility ore-related elements
associated with Irish Type mineralisation. The low mobility of the elements associated with
Factor 2 in alkaline secondary environments suggests that the anomaly is not hydromorphic.
The anomaly most probably overlies subcroping mineralisation, or is displaced laterally by soil
creep and/or glacial movement, and presents a highly prospective target for exploration.

R. E. Healy, 2014 Evaluation of Soil Geochemical Data from Boliden’s PL Areas 3545 & 3488
40
Figure 10. 3D surface diagram of Factor 2 scores across the study area. Areas of high
factor scores are in red and brown; intermediate scores in light yellow and blue; and
low scores in dark blues. Viewpoint is from the SSE.
It is apparent from Fig. 2 of the Appendix that the distribution of Factor 2 scores also
indicates a N-E trend, which may reflect leakage of mineralising fluids along a set of NE
trending faults, or possibly also the likely direction of Midlandian ice movement, and thus the
direction of mechanical dispersal within the till. The eastern side of the study area shows
uniformly low values, except in the vicinity of the Ovoca B anomaly, and a NE trending linear
feature slightly further to the southwest at Curraghnadeely. These two areas have been
explored with DDHs 3488/3 and 3488/9, respectively (Tara Mines 1997, 2002). Other
prospective targets include: (1) the minor anomaly overlying Rathkeale Beds at Gortroe (i.e.,
131100,143100); (2) cluster of satellite anomalies on the Waulsortian-Rathkeale contact west
of Cooltomin (i.e., centred at 131100,144250), especially given the association with a major
NE fault, and the latter’s association with volcanics; and (3) minor anomaly overlying
Rathkeale Beds at Ranahan (i.e., 132150,143250), which is on a NE trend associated with a
major NE trending fault and DDH 3488/15 (See Fig. 2 of the Appendix).
Factor 3 accounts for 8.25% of the total variance in the data set, and includes
significant negative loadings for Ca, Mg, Sr and Te, and significant positive loadings for Ce and
La. Although the loadings for the Ca, Sr and Mg suggest a limestone signature, Factor 3 is
interpreted to be an association of elements that are variably retained in the A horizon of the
soils as a result of being subjected to gleisation. Gleisation is caused by waterlogging and
reduced water movement and leaching, and is associated with the development of anaerobic,
reducing conditions. The factor describes variation in the leaching of elements associated
with carbonates (i.e., Ca, Mg and Sr), and retention of elements associated with resistate
minerals (e.g., Ce and La) in the A horizon. Because Ca, Sr and Mg are negatively correlated
with Factor 3 (i.e., exhibit significant negative loadings on Factor 3), low factor scores are
indicative of high Ca, Sr and Mg retention in the A horizon due to gleisation. Thus, red colours

R. E. Healy, 2014 Evaluation of Soil Geochemical Data from Boliden’s PL Areas 3545 & 3488
41
denote high Factor 3 scores but low values for Ca, Sr and Mg, whilst blue colours denote low
Factor 3 scores but high values for Ca, Sr and Mg (See Fig. 3 of the Appendix). Consequently,
the red symbology is unusually indicative of low concentrations of the significant elements
associated with the Factor (i.e., Ca, Sr and Mg in this case).
The spatial distribution of Factor 3 scores across the study area is irregular and
clustered, with low factor scores concentrated in Ranahan, Lissatotan-Creeves, Lisnacullia and
Curraghnadeely (See Fig. 3 of the Appendix). The area of low scores at Ranahan coincides with
the Ranahan stream and the occurrence of gleys and cutover peat, as well as with the
extension of the Factor 1 Ardlaman low (See Fig. 1 of Appendix, and Fig. 9). In addition, the
area of low Factor 3 scores at Lisnacullia also coincides with an area of low Factor 1 scores,
whilst the areas of low Factor 3 scores in the Lissatotan-Creeves area coincide with the
‘boudinage-like’ string of low Factor 1 scores occurring along the arc of the River Ahacronane.
Although Factors 1 and 3 are by definition uncorrelated, they exhibit sympathetic behaviour
in many areas, reflecting the opposing effects of podzolisation (increases with Factor 1) and
gleisation (decreases with Factor 3).
However, the area of low Factor 3 scores at Curraghnadeely coincides with an area of
high Factor 1 scores. Similarly, the distinctive rectangular area of low Factor 1 scores at
Ardlaman almost precisely coincides with an area of high Factor 3 scores. Thus, this latter
area exhibits low concentrations of elements associated with both Factors 1 and 3, the two
factors associated with opposing soil-forming processes (i.e., podzolisation and gleisation) and
with the dominant major elements Al, Fe, Mg and Ca. However, it has been previously shown
that this area exhibits low Total Normative Mineralogy (See Fig. 8), and thus it is interpreted
that the soils in Ardlaman contain elevated abundances of soil components outside the data
set (i.e., quartz or organics) causing conflicting Factor 1 and 3 scores.
Factor 4 accounts for 6.83% of the total variance in the data set, and includes
significant loadings for Fe, Co, Mn and Ni. Fe and Mn occur together in the secondary
environment as oxides and hydroxides, and are essentially ubiquitous in soils. These oxides-
hydroxides are insoluble in all but the most acidic and reducing conditions found in the
weathering environment, and tend to co-precipitate or scavenge Co and Ni (Levinson 1974,
Salminen 2005). Factor 4 is interpreted as an association elements related to Fe-Mn oxides-
hydroxides that are concentrated in the A horizon due to the elluviation of other components
in the soil.
The spatial distribution of Factor 4 is relatively dispersed, with a low tendency for
clustering (See Fig. 4 of the Appendix, and Fig. 11). Areas of low Factor 4 scores generally
coincide with areas of Gley (e.g., Ranahan), where the prevailing reducing conditions could
give rise to increased relative mobility of Fe and Mn. Interestingly, the areas of highest Factor
4 scores seem to cluster along the Waulsortian Rathkeale contact (including Ardlaman), and
over the Durnish Fm., perhaps reflecting a higher primary Fe-Mn signature.

R. E. Healy, 2014 Evaluation of Soil Geochemical Data from Boliden’s PL Areas 3545 & 3488
42
Figure 11. 3D surface diagram of Factor 4 scores across the study area. Areas of high
factor scores are in red and brown; intermediate scores in light yellow and blue; and
low scores in dark blues. Viewpoint is from the SSE.
Factor 5 accounts for 6.51% of the total variance in the data set, and includes
significant loadings for S, Se and U, and minor non-significant loadings for Cd, Mo and V. With
the exception of Cd, these elements are characterised by very high mobility in the secondary
environment, particularly when neutral to alkaline, but exhibit very low mobility in reducing
environments (Levinson 1974, Salminen 2005). The association of U with S, Se, Mo and V is
typical of “roll-front” U deposits, formed at the interface of oxidising and reducing
groundwaters (EPA 1995). Factor 5 encompasses elements that are very mobile in the
oxidising alkaline environment, but for which reducing conditions act as a geochemical
barrier, causing rapid precipitation, potentially in concentrations as ‘false’ anomalies.
Reducing conditions can occur in organic-rich or peaty soils and peat in fens or bogs, or where
oxidised alkaline conditions encounter seepage of reduced groundwater.
The spatial distribution of Factor 5 is highly clustered, with five distinct peaks on a
relatively uniform background (See Fig. 5 of the Appendix, and Fig. 12). Interestingly, the
rectangular area of low Factor 1 and high Factor 3 scores at Ardlaman recurs with an area of
low Factor 5 scores, although the strongest Factor 5 peak occurs in this area (i.e., at 132850,
144075). This anomaly straddles the Waulsortian Rathkeale contact, and overlies a wedge of
Rathkeale Beds bounded to the north by major NE and NW trending faults (See Tara Mines
2002). However, the anomaly coincides with an area of gleys and cutaway peat, indicating a
strongly reducing secondary environment capable of precipitating the associated S, Se and U.
The string of three peaks arcing from Lissatotan to Creeves is largely coincident the River
Ahacronane flood plain and the occurrence of gleys and alluvium. Similarly, the truncated
anomaly at Lisnacullia coincides with areas of gleys and alluvium associated with the
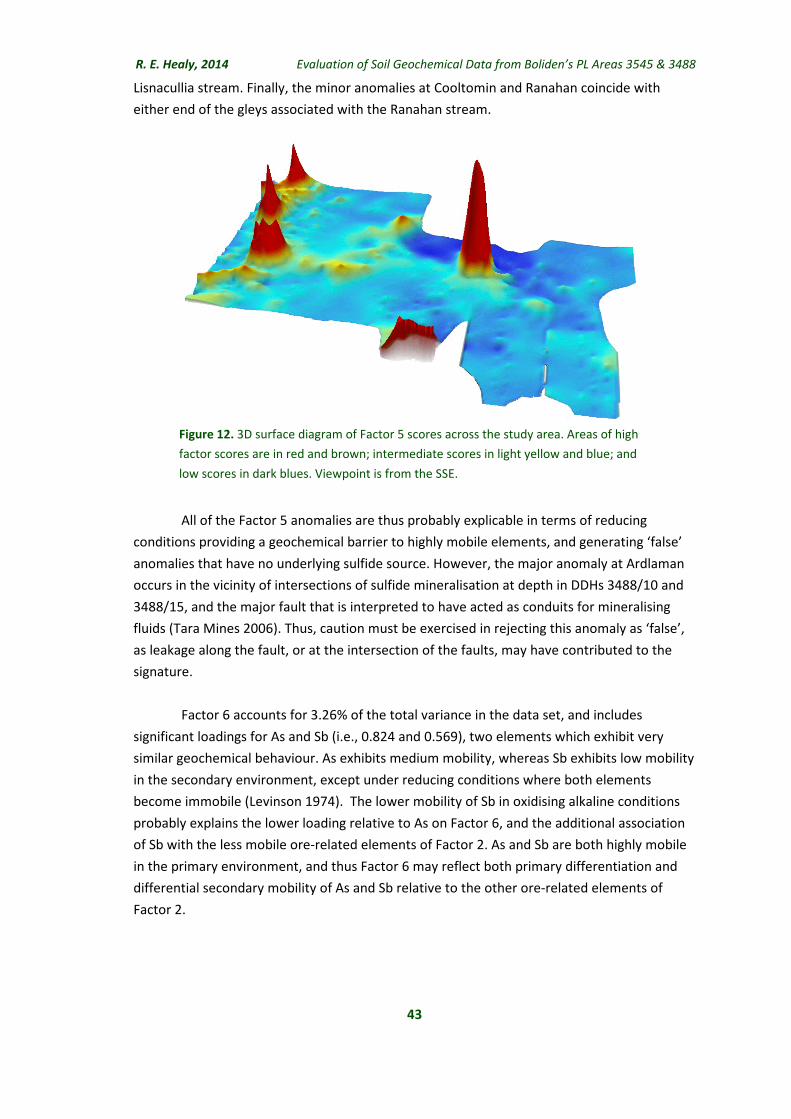
R. E. Healy, 2014 Evaluation of Soil Geochemical Data from Boliden’s PL Areas 3545 & 3488
43
Figure 12. 3D surface diagram of Factor 5 scores across the study area. Areas of high
factor scores are in red and brown; intermediate scores in light yellow and blue; and
low scores in dark blues. Viewpoint is from the SSE.
Lisnacullia stream. Finally, the minor anomalies at Cooltomin and Ranahan coincide with
either end of the gleys associated with the Ranahan stream.
All of the Factor 5 anomalies are thus probably explicable in terms of reducing
conditions providing a geochemical barrier to highly mobile elements, and generating ‘false’
anomalies that have no underlying sulfide source. However, the major anomaly at Ardlaman
occurs in the vicinity of intersections of sulfide mineralisation at depth in DDHs 3488/10 and
3488/15, and the major fault that is interpreted to have acted as conduits for mineralising
fluids (Tara Mines 2006). Thus, caution must be exercised in rejecting this anomaly as ‘false’,
as leakage along the fault, or at the intersection of the faults, may have contributed to the
signature.
Factor 6 accounts for 3.26% of the total variance in the data set, and includes
significant loadings for As and Sb (i.e., 0.824 and 0.569), two elements which exhibit very
similar geochemical behaviour. As exhibits medium mobility, whereas Sb exhibits low mobility
in the secondary environment, except under reducing conditions where both elements
become immobile (Levinson 1974). The lower mobility of Sb in oxidising alkaline conditions
probably explains the lower loading relative to As on Factor 6, and the additional association
of Sb with the less mobile ore-related elements of Factor 2. As and Sb are both highly mobile
in the primary environment, and thus Factor 6 may reflect both primary differentiation and
differential secondary mobility of As and Sb relative to the other ore-related elements of
Factor 2.

R. E. Healy, 2014 Evaluation of Soil Geochemical Data from Boliden’s PL Areas 3545 & 3488
44
Figure 13. 3D surface diagram of Factor 6 scores across the study area. Areas of high
factor scores are in red and brown; intermediate scores in light yellow and blue; and
low scores in dark blues. Viewpoint is from the SSE.
The spatial distribution of Factor 6 is clustered with numerous minor peaks on a
relatively uniform background (See Fig. 6 of the Appendix, and Fig. 13). The eastern half of the
study area exhibits largely background values, whilst numerous minor peaks cluster in a broad
arc distally west and south of the Cooltomin Factor 2 anomaly. The most prominent Factor 6
anomaly (i.e., centred at 131700, 145000) coincides with the northern end of the Cooltomin
Factor 2 anomaly, whilst there is considerable coincidence of other Factor 2 and 6 anomalies,
such as at Lissatotan and Ranahan, but not at Gortroe or Curraghnadeely. The differences in
the distributions of Factors 2 and 6 cannot be readily explained by secondary mechanical
dispersion from glacial movement or hydromorphic dispersion, but rather by primary
dispersion. The proximity of many Factor 6 anomalies to the Waulsortian Rathkeale contact
and to a major NE trending fault is considered significant. Factor 6 probably reflects primary
dispersion as highly differentiated vein mineralisation, such as the intersection of vein sulfides
grading 14% As (Blakeman, pers. comm. 2014).
Factor 7 accounts for 3.05% of the total variance in the data set, and includes a single
moderate significant loading for Y (i.e., 0.518). Y has geochemical behaviour similar to the
heavier REEs, exhibiting low mobility in all secondary environments, and tending to
concentrate in resistate minerals such as xenotime and zircon (Salminen 2005). The
mechanism of Factor 7 may reflect the abundance of Y-bearing resistate minerals in the A
horizon, which is expected to increase with increasing siliciclastic component in the soil, or by
increasing elluviation.

R. E. Healy, 2014 Evaluation of Soil Geochemical Data from Boliden’s PL Areas 3545 & 3488
45
The spatial distribution of Factor 7 is diffusely clustered with low values in the east
grading to high values in the west of the study area (See Fig. 7 of the Appendix). This spatial
pattern is indicative of increased detrital input to the study area from erosion of Namurian
siliciclastics, including sandstones, shales and volcanics, on elevated ground to the west (i.e.,
near Kilcolman). Notably, there is a stepwise reduction in Factor 7 scores across the
Lisnacullia stream at Riddlestown and Kilcool, and again across the River Deel at Ardgoulbeg,
where the factor scores are uniformly low. Because the spatial distribution of Factor 7 is
constrained by the extant drainage patterns, an influx of resistate minerals associated with
erosion of Namurian siliciclastics to the west is indicated as the mechanism underlying Factor
7.
Factor 8 accounts for 2.70% of the total variance in the data set, and includes a single
strong significant loading for Cd (i.e., 0.893). Cd has medium mobility in an alkaline secondary
environment, but becomes immobile in reducing environments associated with organics
(Levinson 1974, Salminen 2005). Although Cd has a strong affinity for Fe-Mn oxides-
hydroxides (Young 2010), the dominant fraction of Cd, which is associated with Factor 8, is
unrelated to Fe and Mn. The differential mobility of Cd and Zn specifically in alkaline
secondary environments, appears to have caused a significant divergence in their behaviour,
and the displacement of Cd from the suite of low mobility, ore-related elements associated
with Factor 2. Factor 8 probably reflects precipitation of Cd by organics, or possibly other
factors in the soil, such as Cd-rich phosphate fertilisers and sewage sludge (Van Kauwenbergh
2002, Salminen 2005). Anthropogenic Cd could mask the natural geochemical associations of
Cd, including any association with Irish Type mineralization.
The spatial distribution of Factor 8 is highly clustered with four distinct peaks on a
relatively uniform background (See Fig. 8 of the Appendix, and Fig 14). The most prominent
peak is truncated by the edge of the study area at Lisnacullia, and coincides with the
truncated Factor 5 peak, and distinct lows in Factor 1 and 6 values. This is an area of gleys and
alluvium associated with the Lisnacullia stream, and is interpreted to be a geochemical barrier
to Cd as a consequence of reducing conditions. The minor peak at Ranahan also coincides
with an area of gleys
The minor Factor 8 peak at Cooltomin coincides with the principal Factor 6 (As+Sb)
peak, and the north end of the principal Factor 2 (Ore) peak. Similarly, the minor peak near
Kilcool is coincident with an area of cutaway peat, but also straddles the Waulsortian
Rathkeale contact, and is in line with a major NE trending fault. Although coincident with
areas of gleys or peat, the provenance of these two peaks are uncertain, whether reflecting
primary dispersion, or precipitation as ‘false’ anomalies by organics and reducing conditions in
the secondary environment. Nonetheless, anomalous Cd without associated Zn should be
viewed as questionable hydromorphic anomalies, whilst a contribution from anthropogenic
sources must also be considered.

R. E. Healy, 2014 Evaluation of Soil Geochemical Data from Boliden’s PL Areas 3545 & 3488
46
Figure 14. 3D surface diagram of Factor 8 scores across the study area. Areas of high
factor scores are in red and brown; intermediate scores in light yellow and blue; and
low scores in dark blues. Viewpoint is from the SSE.
Factor 9 accounts for 2.44% of the total variance in the data set, and includes
significant loadings for Ge and Tl (i.e., 0.690 and 0.507, respectively). Ge and Tl enrichment is
associated with hydrothermal fluids in the Red Dog Zn-Pb-Ag deposits, Alaska (Slack et al.
2004), and Tl enrichment is associated with mineralisation in the vicinity of the study area
(Blakeman, pers. comm. 2014). These elements exhibit variable mobility in the secondary
environment, but are both readily fixed by Fe-Mn oxides-hydroxides and organic matter
(Levinson 1974).
The spatial distribution of Factor 9 is strongly differentiated with a broad area of high
values in the southwest at Ballynisky, grading to low values in the north and east (See Fig. 9 of
the Appendix, and Fig. 15). These two chalcophile elements are expected to occur in sulfides
in the primary environment, whilst they exhibit variable mobility in the secondary
environment, but are both readily fixed by Fe-Mn oxides-hydroxides and organics (Levinson
1974). The spatial pattern of Factor 9 suggests a source to the southwest of the study area,
whether primary such as Ge and Tl associated with mineralisation, or secondary due to
mechanical dispersion by fluvial processes. The Factor 9 scores appear to be restricted by the
Lisnacullia stream, east of which the factor scores are almost uniformly low. Whilst the
secondary mineralogical deportment of Ge and Tl is unknown, fluvial deposition is indicated
as the process underlying Factor 9, by the control exerted by the extant drainage pattern on
its spatial distribution (i.e., similar to Factor 7). However, given the known association of Ge
and Tl with some SEDEX deposits, an association of Factor 9 with mineralisation cannot be
completely discounted.

R. E. Healy, 2014 Evaluation of Soil Geochemical Data from Boliden’s PL Areas 3545 & 3488
47
Figure 15. 3D surface diagram of Factor 9 scores across the study area. Areas of high
factor scores are in red and brown; intermediate scores in light yellow and blue; and
low scores in dark blues. Viewpoint is from the SSE.
Factor 10 accounts for 2.15% of the total variance in the data set, and includes a
single strong significant loading for P (i.e., 0.729). P exhibits low mobility in the secondary
environment, as it is readily fixed by clays and hydrous oxides of Fe and Al to form insoluble Al
and Fe phosphates in acid soils, and by CaCO3 in alkaline soils. Because of this process of
fixation, P becomes unavailable for plant take-up, and is therefore regularly reapplied to
agricultural land using phosphate fertilisers and sewage sludge (or slurry).
The spatial distribution of Factor 10 is shown in Fig. 10 of the Appendix, and is
diffusely clustered, with no consistent pattern relating to drainage, soil or bedrock geology. A
cursory examination of Google Maps in Satellite View confirms firstly the use of slurry
spreading within the study area, and secondly intensive farming with high quality grass crops,
and the cutting of grass for silage. Maintaining soil P, K and lime levels is considered essential
for such high quality grass crops and silage production, and organic manures are very
effective in balancing soil P. Factor 10 is interpreted as anthropogenic, and constitutes the
expression of the intensity of agriculture, specifically fertiliser and sludge use, which likely
masks any spatial pattern in the natural distribution of P.

R. E. Healy, 2014 Evaluation of Soil Geochemical Data from Boliden’s PL Areas 3545 & 3488
48
6. DISCUSSION AND CONCLUSIONS
The Cooltomin geochemical data set is a set of concentrations for 46 inorganic
elements in 1,421 A horizon soil samples from a study area straddling the contiguous
Prospecting License Areas 3488 and 3545 in Co. Limerick. Four of the elements (i.e., Au, Ag,
Hg and B) had excessive proportions of censored data (i.e., >20%) and were rejected from
further analysis. The reduced data set was explored using Factor Analysis integrated with GIS.
A factor model using the MRFA extraction method, coupled with Varimax orthogonal rotation
was adopted and extracted ten generalised factors, and calculated factor scores for each
sample. The factor scores were interpolated using Ordinary Kriging to generate a raster
surface for each of the ten factors. Because each of the raster surfaces is based on
multivariate data, and because factor analysis excludes unique and error variance, the
accuracy and spatial definition of the surfaces are considered superior to that of the
constituent univariate data from which these are derived. The raster surfaces were used to
render a set of thematic maps and selected 3D surface diagrams, which reveal the spatial
expression of geochemical processes acting on the soils of the study area.
The extracted factors constitute geochemical associations that describe the variation
in the raw data, and are interpreted to reflect underlying geochemical processes that have
acted on the composition of the soils. The ten factors, named according to their dominant
elemental associations, are:
Ore Related Factors
F2 (Ore): Bi, Cu, Pb, Sb, Sn, Te and Zn.
Factor 2 accounts for 9.30% of the total variance in the data set, with significant loadings for
Bi, Cu, Pb, Sb, Sn, Te and Zn, which with the exception of Bi and Sn, are all identified as
associated with mineralisation by Blakeman. Thus, Factor 2 reflects the signature of Irish Type
Zn-Pb mineralisation due to non-hydromorphic, secondary dispersion in till of ore-related
elements with low mobility in an alkaline secondary environment. The Factor 2 scores show a
strong high value anomaly centred on Irish Grid Reference 131700, 144550 at Cooltomin, with
minor satellite anomalies slightly further west and south. The Cooltomin anomaly has a N-S
orientation, extending for 900m north from near the Waulsortian-Rathkeale contact at
144200N to 145100N. The Cooltomin anomaly most probably overlies subcroping
mineralisation, or is displaced laterally by glacial movement and/or soil creep, and presents a
highly prospective target for exploration. The distribution of Factor 2 scores also indicates a
N-E trend, which may reflect control of NE trending faults on mineralising fluids, or possibly
direction of mechanical dispersal within the till by Midlandian ice movement. The association
of Ag and Hg with the mineralisation is indeterminate as these two elements were excluded
from the factor analysis due to high proportions of censored data.

R. E. Healy, 2014 Evaluation of Soil Geochemical Data from Boliden’s PL Areas 3545 & 3488
49
F6 (Metalloid): As and Sb.
Factor 6 accounts for 3.26% of the total variance in the data set, with significant loadings for
As and Sb. The lower mobility of Sb relative to As in oxidising alkaline conditions probably
explains the greater association of Sb with low mobility ore-related elements of Factor 2, and
of As with Factor 6. Given that As and Sb are both highly mobile in the primary environment,
Factor 6 may reflect both primary differentiation and differential secondary mobility of As and
Sb relative to the other ore-related elements of Factor 2. Factor 6 exhibits numerous minor
peaks clustered in a broad arc distally west and south of the Cooltomin Factor 2 anomaly. The
most prominent Factor 6 anomaly (i.e., centred at 131700, 145000) coincides with the
northern end of the Cooltomin Factor 2 anomaly, whilst there is considerable coincidence of
other Factor 2 and 6 anomalies. Nonetheless, differences in the distributions of Factors 2 and
6 cannot be readily explained by secondary mechanical dispersion from glacial movement or
hydromorphic dispersion. The proximity of many Factor 6 anomalies to the Waulsortian
Rathkeale contact and to a major NE trending fault is considered significant, and suggests that
Factor 6 may reflect greater primary dispersion as highly differentiated vein mineralisation.
Possibly Ore Related Factors
F5 (Reduction Barrier): S, Se and U.
Factor 5 accounts for 6.51% of the total variance in the data set, and includes significant
loadings for S, Se and U, with minor loadings for Cd, Mo and V. Except for Cd, these elements
show very high mobility in the secondary environment, but exhibit very low mobility in
reducing environments. The association of U with S, Se, Mo and V is typical of "roll-front" U
deposits, and suggests an association of elements that are very mobile in oxidising alkaline
environment, but for which reducing conditions act as a geochemical barrier, causing rapid
precipitation, potentially in concentrations as ‘false' anomalies. Reducing conditions can occur
in organic-rich or peaty soils and peat, or where oxidised alkaline conditions encounter
seepage of reduced groundwater. Factor 5 is characterised by five distinct peaks over a
relatively uniform background. The strongest peak straddles the Waulsortian Rathkeale
contact, and overlies a wedge of Rathkeale Beds bounded to the north by major NE and NW
trending faults. However, the anomaly coincides with an area of gleys and cutaway peat,
indicating a strongly reducing secondary environment. Indeed, all of the Factor 5 anomalies
are explicable in terms of reducing conditions providing a geochemical barrier, and generating
‘false' anomalies that have no underlying sulfide source. However, the major anomaly at
132850, 144075 occurs in the vicinity of intersections of sulfide mineralisation at depth in
DDHs 3488/10 and 3488/15, and the major fault that is interpreted to have acted as conduits
for mineralising fluids. Thus, caution must be exercised in rejecting this anomaly as ‘false', as
leakage along the fault, or at the intersection of the faults, may have contributed to the
signature.
F8 (Cd): Cd
Factor 8 accounts for 2.70% of the total variance in the data set, and has a single significant
loading for Cd. Cd has medium mobility in an alkaline secondary environment, but becomes

R. E. Healy, 2014 Evaluation of Soil Geochemical Data from Boliden’s PL Areas 3545 & 3488
50
immobile in reducing environments associated with organics. The differential mobility of Cd
and Zn specifically in alkaline secondary environments, appears to have caused a significant
divergence in their behaviour, and the displacement of Cd from the suite of low mobility,
ore-related elements associated with Factor 2. Factor 8 probably reflects precipitation of Cd
by organics, although there may also be a component related to other soil factors, such as
Cd-rich phosphate fertilisers and sewage sludge. The Factor 8 peaks generally coincide with
areas of gleys, peat and alluvium, which are interpreted to be geochemical barriers to Cd.
However, the provenance of the peaks at Cooltomin and Kilcool in particular are uncertain,
whether reflecting primary dispersion or precipitation as ‘false' anomalies. Nonetheless,
anomalous Cd without associated Zn should be viewed as questionable hydromorphic
anomalies.
Pedogenic Factors
F1 (Clay-Oxide): Al, Na, Ba, Ce, Cr, Ga, Ge, La, Nb, Ni, Rb, Sc, Ta, Th, Ti, V, W, Y and Zr. Factor
1 accounts for 35.9% of the variance in the data set, has significant loadings for 19 elements,
and is the overwhelmingly dominant factor. Although Fe does not have a significant loading
on Factor 1, the gravimetrically significant elements associated with the factor are Al, K and
Fe. Factor 1 reflects a clay plus oxide-hydroxide association, most probably derived from the
detrital component in the soil parent material. The A horizon across most of the study area is
relatively clay-oxide-rich, albeit with distinct areas with significantly clay-oxide-depleted A
horizons. A relatively consistent relationship of Factor 1 scores with soil types seems
apparent, with reasonable coincidence between areas with low Factor 1 scores and the
occurrence of Alluvium and Gleys, or elevated contents of undetermined components. Factor
1 is an association of elements associated with increasing clay and oxide contents of the A
horizon with increasing podzolisation from that of Gleys to Brown Earths to Grey Brown
Podzolics.
F3 (Gley): Ca, Mg, Sr, Te, Ce and La.
Factor 3 accounts for 8.25% of the total variance in the data set, and includes significant
negative loadings for Ca, Mg, Sr, Te, and positive loadings for Ce and La. The factor describes
variation in the leaching of elements associated with carbonates (i.e., Ca, Mg and Sr), and
retention of elements associated with resistate minerals (e.g., Ce and La) in the A horizon.
Factor 3 is thus interpreted to be an association of elements that are variably retained in the
A horizon of the soils due to gleisation. Because Ca, Sr and Mg are negatively correlated with
Factor 3, low factor scores are indicative of high Ca, Sr and Mg retention in the A horizon due
to gleisation, which is typically associated with the occurrence of gleys, cutover peat and
alluvium. Factors 1 and 3 exhibit sympathetic behaviour in most areas, reflecting the opposing
effects of podzolisation (increases with Factor 1) and gleisation (decrease with Factor 3).
Unusually however, the Ardlaman area exhibits low concentrations of elements associated
with both Factors 1 and 3, the two factors associated with above opposing soil-forming
processes, and with the dominant major elements Al, Fe, Mg and Ca. However, it is
interpreted that the soils in Ardlaman contain elevated abundances of undetermined soil

R. E. Healy, 2014 Evaluation of Soil Geochemical Data from Boliden’s PL Areas 3545 & 3488
51
components (i.e., quartz and/or organics), conflating the relationship between Factor 1 and 3
scores.
F4 (Fe-Mn Oxide-Hydroxide): Fe, Mn, Co and Ni.
Factor 4 accounts for 6.83% of the total variance in the data set, and includes significant
loadings for Fe, Co, Mn and Ni. Fe and Mn occur together in the secondary environment as
oxides and hydroxides, and are essentially ubiquitous in soils. These oxides-hydroxides are
largely insoluble in the weathering environment, and tend to co-precipitate or scavenge Co
and Ni. Factor 4 is interpreted as an association of elements related to Fe-Mn
oxides-hydroxides that are concentrated in the A horizon due to the elluviation of other
components in the soil. Areas of low Factor 4 scores generally coincide with areas of Gley,
where the prevailing reducing conditions could give rise to decreased elluviation and
increased relative mobility of Fe and Mn.
F7 (Y): Y.
Factor 7 accounts for 3.05% of the total variance in the data set, and includes a single
moderate significant loading for Y. Y exhibits low mobility in all secondary environments, and
tends to concentrate in resistate minerals such as xenotime and zircon. Factor 7 seems to
reflect the abundance of Y-bearing resistate minerals in the A horizon, which would increase
with increasing siliciclastic component in the soil, or by increasing elluviation. The spatial
distribution of Factor 7 with low values in the east grading to high values in the west is
suggestive of increased detrital input to the study area from erosion of Namurian siliciclastics
to the west. There is a stepwise reduction in Factor 7 scores across the Lisnacullia stream and
again the River Deel. The apparent control of the extant drainage patterns on the spatial
distribution of Factor 7 indicates that the mechanism underlying Factor 7 is an influx of
resistate minerals associated with erosion of Namurian siliciclastics.
F9 (Ge): Ge and Tl.
Factor 9 accounts for 2.44% of the total variance in the data set, and includes significant
loadings for Ge and Tl. These two elements are expected to occur as sulfides in the primary
environment, and exhibit variable mobility in the secondary environment, although both are
readily fixed by Fe-Mn oxides-hydroxides and organic matter. Ge and Tl enrichment is
associated with some SEDEX deposits, and an association of Tl enrichment with mineralisation
in the vicinity of the study area has been indicated previously. The spatial distribution of
Factor 9 shows a broad area of high values in the southwest at Ballynisky, grading to low
values in the north and east. This pattern suggests a source to the southwest of the study
area, whether primary such as Ge and Tl associated with mineralisation, or secondary due to
mechanical dispersion by fluvial processes. The Factor 9 scores appear to be restricted by the
Lisnacullia stream, and this control by the extant drainage pattern on the spatial distribution
of Factor 9, indicates fluvial deposition as the underlying process. Thus, an association of Ge
and Tl with mineralisation is not indicated, but cannot be completely discounted.

R. E. Healy, 2014 Evaluation of Soil Geochemical Data from Boliden’s PL Areas 3545 & 3488
52
Anthropogenic Factors
F10 (P): P.
Factor 10 accounts for 2.15% of the total variance in the data set, and includes a single strong
significant loading for P, which exhibits low mobility in the secondary environment. P is
readily fixed by clays and hydrous oxides of Fe and Al to form insoluble Al and Fe phosphates
in acid soils, and by CaCO3 in alkaline soils. Because of this process of fixation, P becomes
unavailable for plant take-up, and is therefore regularly reapplied to agricultural land using
phosphate fertilisers and sewage sludge (or slurry). The spatial distribution of Factor 10 shows
no consistent pattern relating to drainage, soil or bedrock geology. Consequently, Factor 10 is
interpreted as anthropogenic, and constitutes the expression of the intensity of agriculture
practices, specifically fertiliser and sludge use.
The soil samples used in this study are considered shallow as they were collected
from the A horizon, which is ‘normally’ strongly leached and regarded as a poor sampling
horizon. The geochemical compositions, and the factor analysis derived therefrom, apply to
the A horizon specifically, and the unique set of soil-forming processes that are acting upon
that horizon. Such samples are particularly vulnerable to: (1) modifying effects of significant
transported components in the soil (e.g., alluvium); (2) soil type effects (e.g., reducing
conditions of gleys and peaty soils); (3) the affects of anthropogenic processes, including
intensive agriculture and pollution; and (4) increased difficulty discerning primary dispersion
through significant thicknesses of transported overburden. Many of the anomalous features
in the data set are attributable to soil type effects (e.g., Factors 3 and 5) and anthropogenic
effects (e.g., Factor 10) associated with shallow samples, and which tend to conflate and
obscure the geochemical signature of mineralisation. It may be useful to consider sampling a
deeper soil horizon or even the underlying till, particularly where numerous soil types with
widely differing geochemical characteristics are encountered within a study area.
Supplementary
The method of geochemical analysis employed in this study is a partial extraction, and
therefore does not include silicate minerals that are insoluble (i.e., refractory) during acid
digestion (e.g., quartz). Similarly, the organic content, which is a significant component of the
A horizon, is not measured. Thus, significant gravimetric components of the soil are not
included in the geochemical compositions. These refractory and organic components affect
the relationship between samples, and are thus a determinant in the factor analysis. For
example, an increase in the quartzose or peaty component in the soil will depress the
abundances of the analysed soil components, and the measured chemical signature due to
these minerals (e.g., clays, carbonates, etc.).
Unusually, the Ardlaman area exhibited simultaneously low Factor 1 and high Factor 3
scores, indicating low of contents of Al, Fe, Mg and Ca, the dominant major elements in the
soils, and the main associated elements in the two principal and opposing pedogenic
processes (i.e., podzolisation and gleisation). In order to explain this anomaly, the effect of

R. E. Healy, 2014 Evaluation of Soil Geochemical Data from Boliden’s PL Areas 3545 & 3488
53
undetermined mineral components on the spatial distribution of the factor scores was
investigated. A Total Normative Mineralogical Composition based on the concentration of the
four major elements (i.e., Al, Fe, Mg and Ca) and simple assumed mineral compositions, was
calculated. The four normative contents were combined and the totals were interpolated and
rendered across the study area. An area of low Total Normative Mineralogy was identified,
which almost precisely corresponds to the distinctive area of low Factor 1 and high Factor 3
scores. This observation indicates that the soils in the Ardlaman area cannot be explained on
the basis of the indicated soil types, including Lithosol, and instead contain high quartzose
and/or organic contents. Although unlikely here, high organic contents could reflect failure to
consistently sample the same A horizon, and again highlights the sensitivity of shallow soil
sampling.
Factor 2, with its associated elements of Bi, Cu, Pb, Sb, Sn, Te and Zn, reflects the
signature of Irish Type Zn-Pb mineralisation dispersed in soils developed on glacial till of
predominantly limestone origin. A strong Factor 2 anomaly is centred on Irish Grid Reference
131700, 144550 at Cooltomin. The Cooltomin anomaly has a N-S orientation, extending for
900m north from near the Waulsortian-Rathkeale contact at 144200N to 145100N, although
the main peak has a N-S length of 325m. The Cooltomin anomaly most probably overlies
subcroping mineralisation, or is displaced laterally by glacial movement and/or soil creep, and
presents a highly prospective target for exploration. It is considered that this anomaly offers
the potential of a more lucrative target than the Factor 5 anomaly in Ardlaman area (i.e., at
132850, 144075), which probably constitutes a ‘false’ anomaly. Other prospective targets
include: (1) the minor anomaly overlying Rathkeale Beds at Gortroe (i.e., 131100,143100); (2)
cluster of satellite anomalies on the Waulsortian-Rathkeale contact west of Cooltomin (i.e.,
centred at 131100,144250), especially given the association with a major NE fault, and the
latter's association with volcanics; and (3) minor anomaly overlying Rathkeale Beds at
Ranahan (i.e., 132150,143250), which is on a NE trend associated with a major NE trending
fault and DDH 3488/15.
This study has demonstrated that Factor Analysis integrated with GIS is a powerful
technique for interrogating geochemical data, and has the potential to be extremely useful in
geochemical surveying applied to mineral exploration. The superior spatial definition and
pattern recognition afforded by the technique, can discriminate the signatures due to ore-
forming processes or secondary dispersion of mineralisation, and thereby enhance anomaly
detection and target generation. The method is recommended for the interrogation of data
derived from soil, till or litho- geochemistry, on a reconnaissance and more particularly on a
detailed, property-scale level.
The method is probably most effective as a geochemical orientation technique to
determine the processes operating on soils and shaping the observed geochemical signatures.
It can be deployed as an exploratory tool to establish the geochemical processes operating
within a new study area, or to reveal hitherto unexplained structure retrospectively on
previously studied areas which had proved problematic using more conventional methods.

R. E. Healy, 2014 Evaluation of Soil Geochemical Data from Boliden’s PL Areas 3545 & 3488
54
7. REFERENCES
Ashton, J. (2006). Exploration in Ireland - the Future ? IGI Annual Conference, Dublin, [online]
available: http://www.igi.ie/assets/files/Natural%20Resources/JHAshton.pdf
[accessed: 5 Jan 2013]
Ashton, J., Blakeman, R., Geraghty, J., Beach, A., Coller, D., Philcox, M., Boyce, A. & Wilkinson,
J.J. (2010). The giant Navan carbonate-hosted Zn-Pb deposit - A review, In Archibald,
S.M. (Ed.) Proc. of Zinc 2010 Meeting, Cork, Irish Assoc. for Econ. Geol., 97-102
Blaney, D. & Redmond, P. (2010). The Limerick Basin - an important emerging sub-district of
the Irish Orefield, In Archibald, S.M. (Ed.) Proc. of Zinc 2010 Meeting, Cork, Irish
Assoc. for Econ. Geol., 103-108
Central Statistics Office (2012) Census: 2011 census boundary files, Central Statistics Office
Ireland, [online] available:
http://www.cso.ie/en/census/census2011reports/census2011boundaryfiles/
[accessed: 5 Jan 2013]
Cook, S.J. & Dunn, C.E. (2007) A Comparative Assessment of Soil Geochemical Methods for
Detecting Buried Mineral Deposits – 3Ts Au-Ag Prospect, Central British Columbia,
The Cordilleran Geochemistry Project, Geoscience BC Report 2007-7, Geoscience BC,
Vancouver, B.C., Canada, 225 p.
Coxon, P. & McCarron, S.G. (2009). Cenozoic: Tertiary and Quaternary (until 11,700 years
before 2000), Chapter 15, In Geology of Ireland, 2nd Edition, (Eds. Holland, C.H. &
Sanders, I.S.), 355-396.
Davis, J.C. (1986) Statistics and data analysis in geology, 2nd Ed., New York: Wiley, 646 p.
De Caritat, P., Reimann, C., NGSA Project Team, & GEMAS Project Team (2012) Comparing
results from two continental geochemical surveys to world soil composition and
deriving Predicted Empirical Global Soil (PEGS2) reference values. Earth & Planetary
Sci. Let., Vol. 319-320, 269-276
DCMNR (2006) Zinc and lead in Ireland, Exploration and Mining Division Ireland, Dept. of
Communications, Marine & Natural Resources, 6 p. [online] available:
http://www.mineralsireland.ie/NR/rdonlyres/CA014199-51D7-4081-A72F-EFE94A969
523/0/Zinc_Lead06_150dpi.pdf [accessed: 13 Nov 2011]

R. E. Healy, 2014 Evaluation of Soil Geochemical Data from Boliden’s PL Areas 3545 & 3488
55
De Vivo, B., Boni, M. Costabile, S. (1998) Formational anomalies versus mining pollution:
geochemical risk maps of Sardinia, Italy, Jour. of Geochemical Exploration, 64,
321–337
Demsar, U., Harris, P., Brunsdon, C., Fotheringham, A.S. & McLoone, S. (2012) Principal
component analysis on spatial data: An overview, Annals of the Association of
American Geographers, [online] available:
http://dx.doi.org/10.1080/00045608.2012.689236 [accessed: 22 Mar 2013]
DiStefano, C., Zhu, M. & Mindrila, D. (2009) Understanding and using factor scores:
Considerations for the applied researcher, Practical Assessment, Research &
Evaluation, 14, 20, 11 p. [online] available: http://pareonline.net/pdf/v14n20.pdf
[accessed: 1 Feb 2013]
Environmental Protection Agency (2013) Spatial data for soil, subsoil and Corine, EPA Envision
GeoPortal, [online] available: http://gis.epa.ie/DataDownload.aspx [accessed: 24 Feb
2013]
Environmental Protection Agency (2006) Data Quality Assessment. Statistical Methods for
Practitioners, EPA/QA/G-9S, US EPA, 198 p. [online] available:
http://www.epa.gov/quality/qs-docs/g9s-final.pdf [accessed: 14 Mar 2014]
Environmental Protection Agency (1995) Extraction and beneficiation of ores and minerals,
Vol. 5, Uranium, EPA-530/R-94-033, 74 p. [online] available:
http://www.epa.gov/osw/nonhaz/industrial/special/mining/techdocs/uranium.pdf
[accessed: 26 Feb 2014]
Esri (2012) What’s new in ArcGIS 10.1, 169 p. [online] available:
http://resources.arcgis.com/en/help/pdf/whats_new_in_arcgis.pdf [accessed: 5 Jan
2013]
Fealy, R. & Green, S. (2009) Teagasc-EPA soils and subsoils mapping project: Final report,
Environmental Protection Agency, Johnstown Castle, Co. Wexford, Ireland, 126p.
Filzmoser, P., Hron, K., Reimann, C. & Garrett, R. (2009) Robust factor analysis for
compositional data, Computers & Geosciences, Vol. 35, 1854-1861.
Finch, T.F. & Ryan, P. (1966). Soils of Co. Limerick, Soil Survey Bulletin No. 16, An Foras
Taluntais, 199 p., and accompanying Soil map of Co. Limerick (Scale 1:126,720),
[online] available: http://agresearch.teagasc.ie/johnstown/Soil_maps.asp [accessed:
25 Apr 2014]

R. E. Healy, 2014 Evaluation of Soil Geochemical Data from Boliden’s PL Areas 3545 & 3488
56
Gardiner, M.J. & Radford, T. (1980) Soil associations of Ireland and their land use potential:
Explanatory bulletin to soil map of Ireland, Soil Survey Bulletin No. 36, An Foras
Taluntais, 142 p., and accompanying General soil map of Ireland 2nd Ed., (Scale
1:575,000), [online] available: http://agresearch.teagasc.ie/johnstown/Soil_maps.asp
[accessed: 5 Mar 2013]
Garson, D.G. (2012) Factor Analysis, Blue Book Series, Statistical Associates Publishing, 73 p.
[online] available: http://www.statisticalassociates.com/ [accessed: 11 Dec 2012]
Geological Survey of Ireland (2013) Online Mapping, Geological Survey of Ireland [online]
available: http://www.gsi.ie/Mapping.htm [accessed: 5 Jan 2013]
Glennon, M., Scanlon, R.P., O’Connor, P.J., Finne, T.E., Andersson, M., Eggen, O., Jensen,
H.K.B. & Ottesen, R.T. (2012) Surge Project: Geochemical baseline for heavy metals
and organic pollutants in topsoils in the greater Dublin area, Dublin: Geological Survey
of Ireland, 184 p.
Grice, J.W. (2002) Resources for Computing and Evaluating Factor Scores [online] available:
http://psychology.okstate.edu/faculty/jgrice/factorscores/index.html#A [accessed: 25
Jan 2013]
Harbaugh, J.W. & Merriam, D.F. (1968) Computer applications in stratigraphic analysis, New
York: Wiley. 282 p.
Harraz, H.Z., Hamdy, M.M., El-Mamoney, M.H. (2012) Multi-element association analysis of
stream sediment geochemistry data for predicting gold deposits in Barramiya gold
mine, Eastern Desert, Egypt, Jour. African Earth Sciences, 68, 1–14
Healy, R.E. (2013) Integration of Factor Analysis and GIS in Spatial Modelling of the Dublin
Surge Geochemical Data Set, 59 p. [online] available:
https://independent.academia.edu/RaymondHealy
Healy, R.E. & Petruk, W. (1994) The mineral characteristics that affect metal recoveries from
Cu, Zn, Pb and Ag ores in Manitoba, Part VII, Ore petrology of the Namew Lake Ni-Cu
deposit, Flin Flon, Manitoba, Man.-Federal Govt. MDA Report, Contract No.
065Q.23440-6-9190, CANMET Investigation Rep. MRP/MSL 94-10(IR), 188 p.
Heckel, P.H. & Clayton, G. (2006) The Carboniferous System. Use of the new official names for
the subsystems, series, and stages, Geologica Acta, 4, 3, 403-407
Hewett, P. & Ganser, G.H. (2007) A comparison of several methods for analyzing censored
data. Am. Occup. Hyg., Vol. 51, No. 7, 611-632

R. E. Healy, 2014 Evaluation of Soil Geochemical Data from Boliden’s PL Areas 3545 & 3488
57
Hitzman, M.W., Redmond, P.B. & Beaty, D.W. (2002) The carbonate-hosted Lisheen Zn-Pb-Ag
deposit, County Tipperary, Ireland, Econ. Geol., Vol. 97, 1627-1655
Hoffman, L. (2011) Exploratory factor analysis and principal component analysis, 44 p.,
[online] available: http://psych.unl.edu/psycrs/948_2011/2b_EFA_PCA.pdf [accessed:
12 Dec 2012]
Hopke, P. K. (2001) A guide to positive matrix factorization [online] available:
ftp://ftp.clarkson.edu/users/p/h/phopke/IAEA/PMF-Guidance.pdf [accessed: 5 Apr
2013]
Jenne, E.A. (1968) Controls on Mn, Fe, Co, Ni, Cu and Zn concentrations in soils and water:
Significant role of hydrous Mn and Fe oxides, In Trace inorganics in water, Chapter 21,
337-387
Lado, L.R., Hengl, T. & Reuter, H. (2008) Heavy metals in European soils: A geostatistical
analysis of the FOREGS geochemical database, Geoderma, 148, 189-199
Levinson, A.A. (1974) Introduction to Exploration Geochemistry, 2nd Ed., Applied Publishing
Ltd., Wilmette, Illinois, USA, 924 p.
Lorenzo-Seva, U. (2003) A factor simplicity index. Psychometrika, 68, 1, 49-60
Lorenzo-Seva, U. & Ferrando, P.J. (2006) FACTOR: A computer program to fit the exploratory
factor analysis model. Behavioral Research Methods, Instruments and Computers, 38,
1, 88-91.
Lorenzo-Seva, U. & Ferrando, P.J. (2012) Factor 8.10. Rovira i Virgili University, Tarragona,
Spain, [online] available: http://psico.fcep.urv.es/utilitats/factor/index.html
[accessed: 5 Dec 2012]
McInerney, D. (2009) Introduction to spatial data types, [online] available:
http://www.ucd.ie/sumschol/pdf/dmci_spatial-data-types.pdf [accessed: 12 Feb
2013]
McLean, J.E. & Bledsoe, B.E. (1992) Behavior of metals in soil. Ground Water Issue,
EPA/540/S-92/018, US EPA, 25 p. [online] available:
www.epa.gov/superfund/remedytech/tsp/download/issue14.pdf [accessed: 10 Apr
2014]
McClenaghan, M.B. (2007) Till geochemical and heavy mineral exploration methods in
glaciated terrain. Workshop 2: Exploration Geochemistry - Basic Principles and
R. E. Healy, 2014 Evaluation of Soil Geochemical Data from Boliden’s PL Areas 3545 & 3488
58
Concepts, Exploration 07, 5th Decennial Int. Conf. On Mineral Exploration, Toronto,
Canada
McQueen, K.G. (2005) Ore deposit types and their primary expression,
http://crcleme.org.au/RegExpOre/1-oredeposits.pdf [online] available: [accessed: 14
Mar 2014]
McQueen, K.G. (2009) Recommended procedures for geochemical sampling and analysis,
http://crcleme.org.au/Pubs/guides/curnamona/geochem_sampling_proc.pdf [online]
available: [accessed: 14 Mar 2014]
Mostert, M.M.R., Ayoko, G.A. Kokot, S. (2010) Application of chemometrics to analysis of soil
pollutants, Trends in Analytical Chemistry, 29, 5, 430-445
O’Riordan, E.G., Dodd, V.A., Tunney, H. & Fleming, G.A. (1986) The chemical composition of
Irish sewage sludge: 2. Phosphorus, potassium, magnesium, calcium and sodium
contents, Irish Jour. of Agricultural Research, 25, 2, 231-237
Osborne, J. (2002) Notes on the use of data transformations, Practical Assessment, Research
& Evaluation, 8, 6, [online] available: http://www.pareonline.net/getvn.asp?v=8&n=6
[accessed: 17 Dec 2014]
Paatero, P. (1997) Least squares formulation of robust non-negative factor analysis,
Chemometrics and Intelligent Laboratory Systems, 37, 23-35
Perrotta, M.M., Almeida, T.I.R., Andrade, J.B.F., Souza Filho, C.R., Rizzotto, G.J., Santos,
M.G.M. (2008) Remote sensing geobotany and airborne gamma-ray data applied to
geological mapping within Terra Firme Brazilian Amazon forest: A comparative study
in the Guapore Valley (Mato Grosso State, Brazil), International Archives of the
Photogrammetry, Remote Sensing and Spatial Information Sciences, Beijing, 37, B8,
1275-1280
Redmond, P.B. (2010) The Limerick basin: An important emerging subdistrict of the Irish Zn-Pb
orefield, SEG Newsletter, No. 82, July 2010, 6p.
Reimann, C., Filzmoser, P., Garrett, R. & Dutter, R. (2011) Statistical data analysis explained:
Applied environmental statistics with R, John Wiley & Sons, Chichester, England, 362
p.
Rummel, R.J. (2012) Understanding factor analysis, [online] available:
http://www.hawaii.edu/powerkills/UFA.HTM#31 [accessed: 10 Dec 2012]

R. E. Healy, 2014 Evaluation of Soil Geochemical Data from Boliden’s PL Areas 3545 & 3488
59
Salminen, R. (2005) Geochemical Atlas of Europe, Part 1, Background Information,
Methodology and Maps, Chief Editor, [online] available:
http://weppi.gtk.fi/publ/foregsatlas/index.php [accessed: 30 Jan 2014]
Sevastopulo, G.D. & Wyse Jackson, P.N. (2009) Chapter 10. Carboniferous: Mississippian
(Tournasian and Viséan), In The geology of Ireland, Eds. Holland, C.H. & Sanders, I.S.,
2nd Ed., Dunedin Academic Press, Edinburgh, Scotland, 568 p.
Shuman, L.M. (1991) Chemical forms of micronutrients in soils, In Mortvedt, J.J. (Ed.)
Micronutrients in agriculture, Book Series No. 4, Soil Soc. America, Madison, WI, USA,
Singh, R.V., Sinha, R.M., Bisht, B.S. & Banerjee, D.C. (2002) Hydrogeochemical exploration for
unconformity-related uranium mineralization: example from Palnadu sub-basin,
Cuddapah Basin, Andhra Pradesh, India, Jour. Geochemical Exploration, 76, 71-92
Slack, J.F., Kelley, K.D., Anderson, V.M., Clark, J.L. & Ayuso, R.A. (2004). Multistage
hydrothermal silicification and Fe-Tl-As-Sb-Ge-REE in the Red Dog Zn-Pb-Ag district,
Northern Alaska: Geochemistry, Origin and Exploration Applications, Econ. Geol., Vol.
99, 1481-1508.
Stanley, C.R. (2006) Numerical transformation of geochemical data: 1. Maximizing
geochemical contrast to facilitate information extraction and improve data
presentation, Geochemistry: Exploration, Environment, Analysis, 6, 69-78
Suhr, D.D. (2005) Principal component analysis vs. exploratory factor analysis, Paper 203-30,
In Proceedings of the SUGI 30 Conference, 11 p. [online] available:
http://www2.sas.com/proceedings/sugi30/203-30.pdf [accessed: 12 Dec 2012]
Tara Mines (1995 to 2002) Annual renewal reports PL. 3488 Co. Limerick [online] available:
http://gis.dcenr.gov.ie/imf/imf.jsp?site=ExplorationCompanyReports [accessed: 14
Feb 2014]
Tara Mines (2003 to 2004) Annual moratorium reports for the ‘Adare Block’, Co. Limerick,
[online] available:
http://gis.dcenr.gov.ie/imf/imf.jsp?site=ExplorationCompanyReports [accessed: 14
Feb 2014]
Tara Mines (2006) Exploration work report: Prospecting Licence 3488, Co. Limerick, [online]
available: http://gis.dcenr.gov.ie/imf/imf.jsp?site=ExplorationCompanyReports
[accessed: 14 Feb 2014]

R. E. Healy, 2014 Evaluation of Soil Geochemical Data from Boliden’s PL Areas 3545 & 3488
60
Tasic, M., Rajsic, S., Tomasevic, M., Mijic, Z., Anicic, M., Novakovic, V., Markovic, D.M.,
Markovic, D.A., Lazic, L., Radenkovic, M. & Joksic, J. (2008) Assessment of air quality in
an urban area of Belgrade, Serbia, In Environmental Technologies, Ed. E. Burcu
Ozkaraova Gungor, 209-245 [online] available:
http://www.intechopen.com/books/environmental_technologies/assessment_of_air
_quality_in_an_urban_area_of_belgrade_serbia [accessed: 15 Oct 2013]
Ten Berge, J.M.F., Krijnen, W., Wansbeek, T. & Shapiro, A.(1999) Some new results on
correlation-preserving factor scores prediction methods. Linear algebra and its
applications, 289, 311-318.
Van Kauwenbergh, S.J. (2002) Cadmium content of phosphate rocks and fertilizers, IFA Tech.
Conf. Chennai, India, 32 p.
Walshaw, R.D., Menuge, J.F. & Tyrrell, S. (2006) Metal sources of the Navan carbonate-hosted
base metal deposit, Ireland: Nd and Sr isotopic evidence for deep hydrothermal
convection, Mineral. Deposita, 41, 80-819
Wilkinson, J.J., Redmond, P.B. & Hitzman, M.W. (2010). The Irish Zn-Pb Orefield: The view
from 2010, In Archibald, S.M. (Ed.) Proc. of Zinc 2010 Meeting, Cork, Irish Assoc. for
Econ. Geol., 91-96
Wilkinson, J.J., Everett, C.E., Boyce, A.J., Gleeson, S.A. & Rye, D.M. (2005) Intracratonic crustal
seawater circulation and the genesis of subseafloor zinc-lead mineralization in the
Irish orefield, Geology, 33, 10, 805-808
Yang, B. (2009) Factor Analysis Methods, Chapter 11, In Research in organizations:
Foundations and methods of inquiry, Eds. Swanson, R.A. & Holton E.F., San Francisco:
Berrett-Koehler Publishers, 181-199.
Young, S.D. (2010) Chemistry of heavy metals and metalloids in soils, In Alloway, B.J., (Ed.)
Heavy metals in soils: Trace metals and metalloids in soils and their bioavailability, 3rd
Ed., Springer, 51-96
Yousefi, M., Kamkar-Rouhani, A. & Carranza, E.J.M. (2012) Geochemical mineralization
probability index (GMPI): A new approach to generate enhanced stream sediment
geochemical evidential map for increasing probability of success in mineral potential
mapping. Jour. Geochemical Exploration, 115, 24-35

R. E. Healy, 2014 Evaluation of Soil Geochemical Data from Boliden’s PL Areas 3545 & 3488
61
8. APPENDIX