Embed Size (px)
Citation preview

Non-isothermal reaction of iron ore-coal mixtures
by
Theresa Coetsee
Submitted in partial fulfilment of the requirements for the degree
Philosophiae Doctor (Metallurgical Engineering)
in the Faculty of Engineering, Built Environment and Information Technology, University of Pretoria
Supervisor: Professor P.C. Pistorius
September 2007
©© UUnniivveerrssiittyy ooff PPrreettoorriiaa

ii
O P G E D R A A A N :
Frik de Bruin, my sielsgenoot, dankie vir jou geduld en ondersteuning.
Eoudia en Hannes Coetsee, my ouers, dankie vir die lewenskans wat jul my gegee het.

iii
A C K N O W L E D G E M E N T S
• Our Creator Jesus Christ, we are only instruments in His great plan.
• Frik de Bruin who taught me that problems are only opportunities awaiting our attention.
Without your persistence this project would not be completed.
• Prof. Chris Pistorius who initiated this project years ago, and provided education and
guidance to me to be able to attempt and complete this project.
• Yskor, which became Kumba Resources, and is now Exxaro Resources, for financial
support of this project.
• Exxaro colleagues who provided technical assistance and support on this project.
• Carel Coetzee of IMMRI at the University of Pretoria, for SEM analyses.
S.D.G.

iv
Non-isothermal reaction of iron ore-coal mixtures by
Theresa Coetsee Supervisor: Professor P.C. Pistorius
Department of Material Science and Metallurgical Engineering Philosophiae Doctor (Metallurgical Engineering)
ABSTRACT Extensive work is reported in literature on the reduction of iron oxides with carbonaceous reductants.
Most of this work considered isothermal reaction of the material mixture, although as shown in some
studies, isothermal reaction conditions are not often the norm because of sample size and heating
arrangement in the experiment. In industrial processes, such as the rotary hearth type processes and the
IFCON® process for iron ore reduction, the norm is non-isothermal reaction. Simulation of industrial
processes should take non-isothermal reaction into account if the heat transfer effects within the
process are to be investigated. To avoid the complications of coal volatiles in the experimental set-up,
few studies were done with coal as reductant. The primary aim of the work presented here is to
quantify radiation heat transfer to the surface of an iron ore and coal mixture heated uni-directionally
from the sample surface to show the importance of heat transfer in the IFCON® process. Secondary
aim of this work are to show the effects of layer thickness, coal volatiles, phase chemistry and particle
size in this reaction system. The experimental set-up consists of a tube furnace modified to transport
the sample into and out of the experimental tube furnace heating zone under a protected atmosphere,
whilst the product gas is analysed throughout the experiment by quadropole mass spectrometer. The
sample surface temperature, heating zone temperatures and material bed temperatures were measured
throughout the experiment. A sample cutter-splitter was developed to divide the reacted sample into
three horizontal segments for chemical analyses. The sample surface temperature and the heating zone
temperatures were used as inputs to a radiation network calculation to quantify radiation heat
transferred to the sample surface. The radiation network calculation was calibrated against heat-mass
balance calculations for pre-reduced ore and graphite samples reacted at furnace temperatures of 1300,
1400 and 1500°C. The results show that radiative and conduction heat transfer control prevails for 16
mm to 40 mm material layers heated uni-directionally from the material layer surface. It is shown that
coal volatiles contribute to reduction in the stagnant material layer. Also, smaller particle sizes result
in increased reaction rates because of a decrease in the diffusion limited effects which were seen in
reaction of the base size of coal and ore particles.
Keywords: heat transfer, uni-directionally, radiation network, radiation, conduction, coal, iron ore,
temperature, furnace, material layer

v
Nie-isotermiese reaksie van ystererts-steenkool mengsels deur
Theresa Coetsee Promotor: Professor P.C. Pistorius
Departement Materiaalkunde en Metallurgiese Ingenieurswese Philosophiae Doctor (Metallurgiese Ingenieurswese)
OPSOMMING ‘n Groot aantal studies in die literatuur handel oor die reduksie van ysteroksied met koolstof. In die
meeste studies word verhitting van die mengsel beskou as isotermies. Sommige studies toon egter dat
isotermiese verhitting selde plaasvind as gevolg van monstergrootte en verhittingsmetode soos
aangewend in die eksperimentele opstelling. In industriële prosesse waarin ystererts gereduseer word,
soos die roterende herd tipe prosesse en die IFCON® proses is nie-isotermiese reaksie die norm. In die
simulasie van industriële prosesse behoort nie-isotermiese reaksie in oorweging geneem te word om
die effek van hitteoordrag te ondersoek. Min studies is gedoen waarin steenkool as reduktant
aangewend is omdat die teenwoordigheid van steenkoolvlugstowwe ’n komplekse opstelling vereis.
Die primêre doelwit van hierdie studie is om stralingshitteoordrag na die monsteroppervlak van ‘n
ystererts-steenkool mengsel, eendimensioneel verhit vanaf die monsteroppervlak, te kwantifiseer om
daardeur aan te toon dat hitteoordrag belangrik is in die IFCON® proses. Die sekondêre doelwit van
die studie is om die invloed van laagdikte, steenkoolvlugstowwe, fasechemie en partikelgrootte in
hierdie reaksiesisteem aan te toon. Die eksperimentele opstelling bestaan uit ‘n buisoond wat aangepas
is om die monster onder ‘n beskermende atmosfeer in en uit die warm sone van die oond te verplaas
met deurlopende produkgasanalises deur middel van ‘n massaspektrometer. Die monsteroppervlak-
temperatuur, verhittings sone temperature en temperture in die materiaallaag is deurlopend in die
eksperiment gemeet. ‘n Monster snyer-verdeler is ontwikkel om die gereageerde monster in drie
horisontale segmente te verdeel vir chemiese analises. Die monsteroppervlak-temperatuur en die
verhittings sone temperature dien as insetparameters tot ‘n stralingsnetwerk berekening waarmee
hitteoordrag na die monsteroppervlak bereken word. Die stralingsnetwerk berekening is gekalibreer
teenoor die massa-hitte balans berekening vir voorgereduseerde ystererts-grafiet monsters gereageer
teen 1300, 1400 en 1500°C. Die resultate toon dat stralings- en geleidings hitteoordragbeheer
plaasvind vir materiaal laagdiktes van 16 mm tot 40 mm. Die resultate toon dat steenkoolvlugstowwe
bydra tot reduksie in ‘n stagnante ystererts-steenkool materiaal laag. Reaksie van kleiner partikels toon
verhoogte reaksietempo as gevolg van ‘n afname in diffusie beperkende effekte, soos waargeneem in
reaksie van die basis partikelgrootte vir steenkool en ystererts.
Sleutelwoorde: Hitteoordrag, eendimensioneel, stralingsnetwerk, straling, geleiding, steenkool,
ystererts, temperatuur, oond, materiaallaag

vi
TABLE OF CONTENTS Introduction………………………………...............…………………………………………………...… 1. Chapter I: Literature Survey………………………...………………………………………………… 3. 1.1. Background………………….…………………………………………………………………...……… 3. 1.2. Iron Ore Reduction with Coal/Carbon…………………………………………………………...……… 4. 1.3. Indicators for Heat Transfer Control……………………………………………………………...……… 11. 1.4. Chemical Reaction Rates………………………………………………………………………...……… 13. 1.4.1. Reduction……………………………………………………………………………………….… 13. 1.4.2. Gasification……………………………………………………………………………………….. 15. 1.5. Conclusion…………………………………………………………………………………….………… 19. Chapter II: Experimental………………………………………...………………….……..…………… 20. 2.1. Experimental Set-up……………………………………………………………………………...……… 20. 2.1.1. Furnace………………………………………………………………………………………….… 20. 2.1.2. Gas Lines………………………………………………………………………………………….. 26. 2.2. Calibration…………………………………………………………………………………….………… 30. 2.2.1. Radiation Network………………………………………………………………………………… 30. 2.2.2. Emissivity Measurements…………………………………………...………………..…………… 32. 2.2.3. Sample Surface Temperature Measurement………………………………………………….…… 33. 2.2.4. Calibration of Radiation Network Calculation ………………………...………………...……… 35. 2.3. Conclusion………………………………………………………………………...………..…………… 57. Chapter III: Results and Discussion…………………………………………………………….......… 58. 3.1. Introduction………………………………………...……………………………………………….…… 58. 3.2. Effect of Increased Heat Transfer…………………………..…………………………………………… 61. 3.3. Effect of Layer Thickness………………………………………………………………………...……… 70. 3.4. Effect of Volatiles in Coal………………………………………………………………………………... 77. 3.5. Phase chemistry of Metal and Oxide Phases……………...……………………………………….…… 91. 3.6. Effect of Particle Size……………………………………………………………………………….…… 100.3.7. Conclusions and Future Work…...……………………………...…………………………………..…… 105.Chapter IV: References……………………………………………………………………………..…… 107.Chapter V: Appendices…………………………………………………………………………..……… 117.Appendix I: Gas retention times for samples & Product gas calculations…………………………….……… 118.Appendix II: View factor calculations for radiation network……………………………………………...…… 121.Appendix III: Surface temperature measurements for Alumina samples………………………………......… 124.Appendix IV: Chemical analyses of input materials……………………………………………………......… 127.Appendix V: Mass measurements of sand samples divided in Sample Cutter-Splitter………………….…… 129.Appendix VI: Calibration sample masses and analyses & Incremental heat-mass balance ……………....… 130. calculation sheets for sample 1400C Appendix VII: Mass and Heat Balance equations…………………………………………….……………… 140.Appendix VIII: Experimental data graphs…………………………………………………………..………… 145.Appendix IX: Calculation of %Carbon consumption, %Reduction and Total mass loss…………...………… 193.Appendix X: Graphs of total mass loss, oxygen removed and carbon remaining in sample………………… 195.Appendix XI: Sample masses and analyses for coal-ore and coal-char experiments…………...……...…… 204.Appendix XII: Calculation of equilibrium %CO in CO-CO2 gas…………………………………….………… 212.

1
INTRODUCTION
The use of coal instead of coke as reductant in the iron and steel industry has become more important
because this industry realised that coking coal supply could soon be less than demand (Nashan et al.,
2000). Furthermore, the future trend is expected to tend toward process consolidation by reducing the
number of reactors needed to produce steel from raw material (Wiesinger, 2000). Accompanied with
the trend in coal usage has emerged several processes that use iron ore fines, which are not compatible
with older iron making technologies when not agglomerated or pelletised (Sarma and Fruehan, 1998).
Most of these processes use natural gas to reduce fine iron ore to directly reduced iron (DRI). A few
processes that use coal as reductant to produce DRI have been developed. These are the rotary kiln
type processes: SL/RN (Bornman and Ackerman, 1993), Accar (Rierson, 1993), Davy DRC (Haworth
et al., 1995) and rotary hearth based processes: Fastmet (Hoffman and Harada, 1997) and Comet
(Borlée et al., 1999) processes. Of these processes, only the rotary kiln type processes have been
commercialised on a large scale. The only commercially established coal based process to produce hot
metal is the Corex process (Flickenschild et al., 1996). Other hot metal processes have been
developed: AISI (Aukrust, 1992), Hismelt® (Cusack et al., 1995), Dios (Saito, 1992), Romelt
(Romenets et al., 1999), Ausmelt (Floyd, 2000) and Technored (Contrucci, 2000). The first
commercial Hismelt® plant has been successfully hot commissioned in October 2005 in Kwinana,
Western Australia and production will be ramped up to full capacity over three years to 800 000 t/year
(Rio Tinto News Release, 2006).
Thus, it is evident from the development of the above mentioned processes that the use of coal and
iron ore fines is becoming more important as traditionally used feed stocks of iron ore and coal are
depleted. Only the Comet (Borlée et al., 1999) process uses coal and iron ore fines in a fixed material
bed, although in alternate layers, to produce DRI. The hot metal production processes do use coal and
iron ore fines, but these raw materials are reacted through bath smelting.
The IFCON® process is a direct steelmaking process reacting iron ore fines and coal in a single vessel
to produce crude liquid steel. Material mixture of ore fines, coal and fluxes of -10 mm is fed onto the
liquid metal bath to form heaps floating on the metal bath. The freeboard is heated by combustion of
natural gas and an air and oxygen blast blown into the freeboard via burners. In addition to the natural
gas that is combusted in the freeboard, the coal volatiles and reduction product gas from the heaps are
combusted to generate heat in the freeboard. The upper portion of the heap where solid state reduction
takes place is heated by fossil fuel energy generated in the freeboard. The bottom ends of the heaps are
heated from the metal bath, which is in turn heated by inductors.

2
As identified by Pistorius (2005) ore-carbon/coal reaction systems form the third type of heat transfer
control in which there is a band of reaction temperatures in which the process can take place, if no
bulk melting of reactants and products takes place. Most of the work done on mixtures of carbon/coal
and iron ore (as reported in the literature) was done with the intent of isothermal reaction, but the use
of relatively large sample sizes and/or heat transfer hampering sample containment arrangements
resulted in non-isothermal reaction. Therefore, the non-isothermal treatment of the samples was not
taken into account, and reaction data from the experiments was used to calculate apparent activation
energies at the furnace temperatures. From the magnitude of the apparent activation energies
conclusions were made as to the rate controlling mechanism in the experiment. Seaton et al. (1983)
were the first to highlight the problem of using chemical kinetics alone to make conclusions on the
rate controlling step when the mixed ore-carbon/coal sample is reacted non-isothermally.
As pointed out by Vankateswaran and Brimacombe (1977) a lot of work is required to obtain all the
necessary detailed fundamental information to describe the process progress in a mixed bed system so
that an empirical approach to reaction rate measurements is more effective. Therefore a realistic
simulation experiment is required in which the heat transfer rate is quantified from measurement of
temperature and reaction extent as functions of reaction time and position within the sample material.
Here the development of such a simulation experiment for the solid state reduction under
unidirectional radiative heating is described, and results reported and interpreted. The information
gained from such an experiment should provide enough information to use in validation of
mathematical models that can then be used for process design and testing process sensitivities.

3
CHAPTER I
LITERATURE SURVEY
1.1. Background The IFCON® process (U.S. Patents 5411570, 6146437, 6537342) is a direct steelmaking process
reacting iron ore fines, coal and fluxes in a single vessel to produce crude liquid steel of ~0.1%C. The
furnace cross section is shown diagrammatically in Fig. 1, and indicates the three main phase
volumes: freeboard, heaps, and metal bath. The material mixture of ore fines, coal and fluxes of -10
mm is fed onto the liquid metal bath to form heaps floating on the metal bath. The freeboard is heated
by combustion of natural gas and an air and oxygen blast blown into the freeboard via burners. In
addition to the natural gas combusted in the freeboard, coal volatiles and reduction product gas from
the heaps are combusted to generate heat in the freeboard, which in turn heats the heap surface. This
upper section of the heap, where solid state reduction takes place, is heated by fossil fuel energy. Solid
state reduction of the iron ore takes place at the heap surface, within the top 20-25 mm layer of
material mixture. The material at the heap surface can be heated to temperatures the order of 1400°C,
or higher, provided the furnace refractories are not damaged and the iron product remains in the solid
state to be melted at the interface between the heap bottom and the metal bath.
Fig. 1: IFCON® furnace cross section

4
The bottom portions of the heaps are heated from the metal bath, which is in turn heated by inductors.
The energy input to the metal bath is regulated to maintain the desired metal bath temperature whilst
providing sufficient energy for final reduction and melting of the heaps into metal and slag. For steel
production the metal bath is operated 50°C to 100°C above the liquidus temperature of the steel.
It is important to quantify and understand ore reduction extent, coal devolatlisation and carbon
consumption occurring simultaneously at the heap surface. The carbon content of metallised product
formed at the heap surface is also important in development of process understanding because the aim
is to make crude steel, not hot metal.
1.2. Iron Ore Reduction with Coal/Carbon The reduction of iron oxide with carbon is endothermic. For this reason, heat transfer to a mixture of
iron oxide and carbon is essential, and in many cases temperature differences can arise within the
mixture of solids. In some studies the intention was for a non-isothermal experiment in order to
simulate reaction conditions specific to a process e.g. Dutta and Gosh (1994), Wang et al. (1997,
1998) and Fortini and Fruehan (2005) reacted composite pellets to simulate conditions in industrial
rotary hearth furnace reactors such as Inmetco (Gou and Lu, 1998) and Fastmet (Hoffman and Harada,
1997). Mookherjee et al. (1985b) reacted a core of iron ore, surrounded by a cylinder of coal char,
non-isothermally to simulate reaction conditions in the Hoganas process in which the oxide and coal
are not mixed. Abraham and Gosh (1979) used an experimental set-up in which the electrode graphite
powder and the hematite pellet were contained in the same crucible, but physically separated at
various distances. The aim was to simulate reaction conditions in the rotary kiln process. Prakash
(1994), Prakash and Ray (1990, 1991) and Prakash et al. (1986) reacted a mixed bed of coal and ore in
the MBR (Moving Bed Reactor) to simulate a vertical retort process for DRI (Directly Reduced Iron)
production. Shivaramakrishna et al. (1996) reacted coal-ore composite pellets with external coal in an
electrically heated rotary tube furnace to simulate DRI production in a rotary kiln furnace. Roman-
Moguel and Brimacombe (1988) used a bench scale batch rotary kiln to study the use of
unagglomerated iron ore as feed material.
In many cases, it appear that experiments performed on mixtures of carbon/coal and iron ore were
intended to yield isothermal reactions, but in most instances the experiment turned out to be non-
isothermal because of relatively large sample sizes and/or sample containment arrangements which
hampered heat transfer. This unintended outcome is usually ignored and the experimental results are
reported as isothermal, and usually the furnace temperature is taken as the experimental temperature.
Isothermal reaction is only obtained when small masses of material, of the order of one gram, is used-
as in the work of Otsuka and Kunii (1969), Rao (1971), Fruehan (1977) and Mookherjee et al.

5
(1985a). Even in a relatively small mixed bed sample the difference between the furnace temperature
and the material mixture can be significant as shown by Haque et al. (1993) for reaction of –2 +1 mm
iron ore – coal mixture at furnace temperatures of 900-1050°C in a mild steel crucible of 30 mm
diameter and 50 mm height for 100-200 minutes total reaction time. The sample temperature reached
the furnace temperature after 19-22 minutes of heating time. Mookherjee et al. (1986) reacted 45 g
samples of coal and ore arranged as separate cylindrical shapes in mild steel crucibles, of 33 mm i.d.
and 50 mm height, at furnace temperatures of 850 to 1050°C. The sample temperature was measured,
starting when the sample was introduced into the furnace. The sample temperature reached the furnace
temperature after 20-30 minutes reaction time. The total reaction time was 150-180 minutes.
Seaton et al. (1983) showed that the heating conditions were non-isothermal in 14 mm diameter
magnetite and hematite containing composite pellets. In magnetite composite pellets the measured
temperature profiles at the pellet centre and pellet surface showed that these two temperatures
equalised after 10, 15, and 27 minutes at furnace temperatures of 1200°C, 1000°C and 1100°C, when
reduction was complete or ceased. According to Seaton et al. (1983) the maximum temperature
differential between the pellet centre and pellet surface occurs when the gasification (Boudouard)
reaction is predominant. The surface temperatures reached values close to the furnace temperature
after 7.5, 16 and 4 minutes for furnace temperatures of 1200°C, 1000°C and 1100°C, respectively.
Seaton et al. (1983) calculated apparent activation energies, but also did heat transfer calculations for
one experiment to show the importance of heat transfer. The heat transfer calculations showed that
heat flux to the sample surface becomes insufficient to drive the gasification reaction in the latter part
of the reaction period, as the pellet core and surface temperatures reach the furnace temperature.
Seaton et al. (1983) were the first to highlight the problem of using chemical kinetics, and not taking
heat transfer limitations into account. They showed that although chemical kinetic analysis of the
results indicated the gasification reaction to be rate limiting, heat transfer calculations indicated heat
transfer to the sample to be rate limiting, after the initial period of reaction. Recent work by Fortini
and Fruehan (2005) confirms the importance of heat transfer in reaction of composite pellets reacted at
900-1280°C furnace temperatures. Fortini and Fruehan (2005) show that heat transfer control alone
prevailed in composite pellets that contained highly reactive carbon in the form of wood charcoal,
whilst chemical rate control prevailed in coal char containing pellets.
The only other laboratory scale study to consider heat transfer in reaction of iron ore and coal/carbon
material mixtures is that of Huang and Lu (1993), and Sun and Lu (1996) who improved on the
experimental set-up used by Huang and Lu (1993). A mixed bed of iron ore and coal, of 81% -75 µm
and 88% -149 µm respectively, was reacted in a hollow cylindrical stainless steel crucible of 118 mm
diameter and 150 mm height. The crucible was placed in a muffle furnace at 1200°C. Huang and Lu
(1993) concluded from their results that heat transfer in the mixture was rate limiting. The
6
experimental set-up used by Huang and Lu (1993) was three-dimensional, or by approximation two-
dimensional, although the intention was for it to give one-dimensional heating in the radial direction.
The mathematical model, for this experimental set-up, was developed for a one-dimensional
configuration. From the model predictions it was concluded that heat transfer within the material
mixture is the rate-limiting step due to the endothermic reactions taking place, and the low thermal
conductivity of the material mixture (Sun and Lu, 1992, 1993). Sun and Lu (1996) improved on the
experimental set-up used by Huang and Lu (1993) by insulating the crucible sidewalls, and heating
only the crucible bottom. This approach ensured that heat transfer was one-dimensional, or as close to
it as experimentally possible. A mathematical model was developed to simulate the experiment (Sun
and Lu, 1996, 1999a, 1999b). It was found that convection and radiation heat transfer within the mixed
bed was negligible in comparison to conduction heat transfer, for furnace temperatures smaller than
1300°C. Heat flux to the sample, and within the sample was calculated in the model. From sensitivity
analyses done on the model, it was concluded that conduction heat transfer within the material is rate-
limiting to the reduction process.
A summary of the different studies in which apparent activation energies were calculated is shown in
Table 1 for coal containing samples and in Table 2 for carbon containing samples. In the tables an
opinion is given on which reaction systems can be considered to be reacted isothermally. In most of
the studies apparent activation energies were calculated from the experimental data assuming
isothermal reaction.
Depending on the amount of information obtained from the experimental measurements, the reaction
extent for the individual reactions of reduction and gasification can be calculated. In absence of
detailed information the reaction extent was expressed in terms of the sample mass loss measured, as a
fraction of the maximum possible mass loss attainable. Kinetic parameters were then calculated in
terms of the overall reaction extent. The resultant magnitude of the activation energy was then used to
make conclusions as to the prevailing rate limiting step in the overall reaction sequence. As indicated
by Seaton et al. (1983) this is questionable if non-isothermal conditions prevail because heat transfer
may be the rate-limiting factor, but cannot be identified through chemical kinetic studies alone.
As seen from Table 1 and 2 few studies were done with coal as reductant. Even when processes with
coal as feed material are simulated, coal char is used rather than coal. This is done to avoid
experimental difficulties in handling and analysing of coal product gases, and to simplify the reaction
system so that conclusions can be made more easily from results. In most studies the contribution of
coal volatiles to reduction has been ignored, and in some studies this contribution was inferred e.g.
Mookherjee et al. (1986) and Haque et al. (1993) concluded reduction by volatiles based on the
absence of an incubation period in the reduction kinetic plot for the initial reaction period when the

7
sample was still heating up to the furnace temperature. Dey et al (1993).viewed reacted composite
pellet microstructures and concluded from these observations that reduction by volatiles took place
along “favourable diffusional paths” and that volatiles release was too fast, at reaction temperatures
above 1000°C, to contribute to reduction. Wang et al.(1997) showed that significant reduction by
volatiles took place at temperatures above 700°C. The contribution of volatiles to reduction was
calculated from mass loss information from isothermal reaction of a coal sample, an ore/alumina/coal
layered sample and an ore/coal mixture, respectively. Sohn and Fruehan (2006a) followed a similar
procedure to show that up to 56% reduction by volatiles occurred in a layered Fe2O3/coal sample
heated from the top surface 1000°C. Sohn and Fruehan (2006b) showed that reduction by volatiles in a
single layer of composite pellets was negligible, but in a three layer bed of pellets volatiles from the
bottom pellet layer reduced the top pellet layer. The work by Wang et al. (1997) and Sohn and
Fruehan (2006a, 2006b) were concentrated on composite pellets and not on the uni-directional heating
of a packed bed of coal and ore. Therefore, the contribution of volatiles to reduction in a packed bed
heated uni-directionally must be simulated in an experimental set-up that is representative of the
material and heat transfer arrangement of the process under study to obtain quantified experimental
evidence of volatile contribution to reduction for the particular process.

8
Table 1: Activation Energy calculated in Previous Studies on Ore Reduction with Coal Authors P/MB/FBa * FT2
(°C) Rate Equation1 Activation Energy
(kJ/mol) Particle
Size (µm)
Mookherjee et al. (1986)
Ore column surrounded by
coal
N 850 900 980
1050
kt)()(G / =−−−= 321321 ααα
Reduction: 156.2 Differential method: 130.7 at α=0.2, 152.1 at α=0.3, 144.7 at α=0.6 and 146.3 at α=0.70
-500 +250
Mookherjee et al. (1985a)
Ore column surrounded by
coal
I 850 920
1000 kt)f(f)f(G / =−−−= 321
321
Reaction: 210
-500 +250
Mookherjee et al. (1985b)
Ore column surrounded by
coal
N 1.7-2.4°C/min to 1100°C
kt)()(G / =−−−= 321321 ααα
Reduction from Coats & Redfern equation: 111.7
-500 +250
Haque et al (1993)
MB N 900 950
1000 1050
kt)ln()(G =−−= αα 1
Reduction: Integral method: 159 Reduction: Differential method: 153 at α=0.20 and 160 at α=0.60
-2000 +1000
Haque et al (1993)
FB N 900 950
1000
kt)ln()(G =−−= αα 1
Reduction: Integral method: 155 Reduction: Differential method: 152 at α=0.60 and 159 at α=0.50
Ore: -250 +180
Coal: -500 +353
Haque et al (1992a)
MB N 950 1000 1050
None Reduction: Differential method: 148-151.4 at α=0.6-0.9
-2000 +1000
Prakash and Ray (1990)
MB I 800 900
1000 kt)()(G / =−−−= 321
321 ααα
Reduction: 111.2 Reaction: 90.9
-6000 +3000
Prakash et al. (2000)
P I 800 900
1000 1050
kt)ln()(G =−−= αα 1 Reduction: 49-50 (Pellet basicity=0.82); 47-52 (Pellet basicity=1.33)
-75 (Pellet φ = 10-12.5
mm)
Wang et al. (1998)
P N 1050 1200 1250
kt)ln()(G =−−= αα 1 Reduction: Soft coal pellet: 82.61; Hard coal pellet: 68.95
(Pellet φ = 16-18 mm)
Reddy et al. (1991)
P N 900 950
1000 1050 1100
kt)1.5X-(M
)X-M(1lnM)(1.5C
1
A
A
A0
=−
=M CA0/CB0 CA0=initial concentration Fe2O3 [g./mol] CB0=initial concentration C [g./mol] XA=fraction conversion of Fe2O3 to Fe
Reaction: Initial stage: 108.15; Latter stage: 93.16
-150 (Pellet φ = 14 mm)
Dey et al. (1993)
P N 900 950
1000 1025 1050
None Reaction: At different fraction reaction: 0.1: 35.0, 0.2: 30.3, 0.3: 40.5 and 30.3, 0.4: 44.2 and 30.3, 0.5: 44.2 and 30.3, 0.6: 44.2
-85 +53 (Pellet φ =
10 mm)
Shivarama-krishna et al. (1996)
P N 950 1000 1050
kt)fln()f(G =−−= 1
Reaction: Char: 138; Coal: 92
Ore: fine Coal: -500 +50 or –50 (Pellet φ = 10-12 mm)
*Isothermal = I; Non-isothermal = N 1 α or fr = reduction extent; f = reaction extent; fc= gasification extent a P = pellet; MB = mixed bed; FB = Fluidised bed 2 FT = Furnace temperature

9
Table 2: Activation Energy calculated in Carbon Reduction Studies Authors P/MB
a * Carbon
Type FT2 (°C)
Rate Equation1 Activation Energy (kJ/mol)
# Particle Size (µm)
Otsuka and Kunii (1969)
MB I Graphite 1050 1100 1150
None At 20% R: 230 (C fine), 259 (C coarse), 272 (Both ore & C fine) At 60% R: 63 (both ore & C fine), 98 (fine ore, coarse C)
R Ore mean size: fine = 20; coarse = 124 Graphite mean size: fine = 67; coarse = 190
Rao (1971) MB I Amor-phous carbon
957 987 1007 1037 1087
).ln(kt)f.ln()f(G
74317431
+−=−=
301 O Oxide: -4 Carbon: -49
Gosh and Tiwari (1970)
P N Lignite Coke
900 950 1000 1050 1100
None At %R > 50%: 78 R -250; (Pellet φ = 19 mm)
Srinivasan and Lahiri (1977)
P N Graphite 927 1022 1060 977
None At 20% R: 418; At 60% R: 286; At 80% R: 56
R -53; (Pellet φ = 9.7-12 mm)
Fruehan (1977)
MB, P I Coconut Charcoal,
Coal Char,
Metallurgi-cal Coke
900 950 1000 1050 1100 1200
tk)fln()f(G ccc =−−= 1
Fe2O3 → FeO and FeO → Fe: 293-335
G -75; (Pellet φ = 6-14 mm cylinder)
Abraham and Gosh (1979)
MB, OP-GP4
N Electrode Graphite
880-1042
None
At %R < 20: MB: 305; MB (pressed): 296 At %R > 20: MB: 230; MB (pressed): 140 At 35-60%R: OP-GP: 314
G Oxide: -49; Graphite: -75 +49; (Pellet φ = 15.2-17.2 mm, height = 2.8-6.6 mm)
Wright et al. (1981)
P (Iron Ore) in
char
I Char 900 950 1000 1075 1150 1200
kt)ln()(G =−−= αα 1 290-335 R (Ore Pellet φ
= 12 mm) Char: -8 +1 mm
Seaton et al. (1983)
P N Coal Char 900 1000 1100 1150
kt)f.ln()(G −=−= 9801α
kt)f.ln()(G −=−= 03711α
Heamatite: 126, 239 Magnetite: 159
O Ore: ? Char: -49 (Pellet φ = 14 mm)
Roman-Moguel and Brimacombe (1988)
MB N Coal Char 800 850 900 950
Gasification:
tk)fln()f(G ccc =−−= 1 Reduction:
tk)f()f(G r/
rr =−−= 3111
Gasification: Coal char: 224; Lignite: 264 Reduction: 116.4
R&G
Ore: -420 +300
Coal char: -210 +150
Mookherjee et al. (1985a)
Ore column in char
I Coal Char 850 920 1000
kt)f(f)f(G / =−−−= 321321
195.8; 168.8 (5% Na2CO3 added to char) Differential: 188.1 at f=0.3; 144.2 at f=0.4 Na2CO3 added to char: 179.9 at f=0.3; 152.0 at f=0.4
O -500 +250
Mookherjee et al. (1985b)
MB N Coal Char 10°C/min;
20°C/min to
1100°C
kt)fln()f(G =−−= 1
Last segment of Non-isothermal kinetic plots: Coats-Redfern equation = 99; Dixit-Ray equation = 114
O -90 +63
Mookherjee et al. (1985b)
Ore column in char
N Coal Char 10°C/min to
1100°C
None 119 O -500 +250
Mookherjee et al. (1986)
Ore column in char
I Coal Char 850 900 950 1000
kt)()(G / =−−−= 321321 ααα
ktfffG ccc =−−−= 3/2)1(32
1)(
Reduction: 168.4 Gasification: 176.6
R&G
-500 +250

10
Authors P/MBa
* Carbon Type
FT2 (°C)
Rate Equation1 Activation Energy (kJ/mol)
# Particle Size (µm)
Ajersch (1987)
P N Electrode Graphite
837 1127 1027
None Fe2O3 → FeO: 169 (initial), 182 (steady) FeO → Fe: 647
R Oxide: -57 +44; Graphite: -105 +74; (Pellet φ = 10 mm = height)
Nasr et al. (1994)
P N Coke 950 1000 1050 1100
)Aln(kt)RAln( +−=−
BACR u += R = %Reduction; Cu =
%Carbon utilisation; A, B are constants
5% Coke in mix: 231; 10% Coke in mix : 179; 15% Coke in mix: 159; 20% Coke in mix: 123
R -75 (Pellet φ = 7.5 mm, height = 10 mm)
*Isothermal = I; Non-isothermal = N; a P = pellet; MB = mixed bed; 4 OP-GP = Oxide pellet – graphite powder, 1.6 cm apart 1 α or fr = reduction extent; f = reaction extent; fc= gasification extent. %R=%Reduction; # Reaction measured in study: R = reduction; G = Gasification; O = Overall reaction; N = None
Studies on coal devolatilisation as applicable to ore reduction are limited. Sampaio et al. (1992)
experimentally simulated coal devolatiliation of 3-9 mm particles in slag at 1325, 1435, 1520°C at
heating rates of 5640, 7020, 10140°C/min applicable to bath smelting processes, and Patisson et al.
(2000) simulated devolatilisation of 10 mm coal particles in a rotary kiln at 8, 14, 30 °C/min up to
850°C.
The heating rates used by Patisson et al. (2000) are rather low but this work does give valuable
information on the expected devolatilisation products: C2H4, C2H6, C2H2, CO2, CO, H2, H2O and tar.
Increased heating rates resulted in more light gases and less tar being formed. The studies on the
mechanism and reaction sequences in coal pyrolysis indicate the rate and extent of coal
devolatilisation to be dependent on the heating rate of the coal (Tomeczek and Kowol, 1991; Goyal
and Rehmat, 1993; Devanathan and Sexena, 1987; Jones and Schmid, 1964; Arendt and van Heek,
1981; Peters and Bertling, 1965; Jüntgen and van Heek, 1979). At high heating rates secondary
reactions occur, in which coal tar (forming in the devolatilisation process) is further cracked to simple
components such as H2, char and gas (Devanathan and Sexena, 1987). Generally, for a coal, an
increased heating rate results in a higher devolatilisation temperature, and an extended temperature
range of devolatilisation (Pattison et al., 2000). Coal heated to high temperatures at high heating rates
can evolve more volatile matter than that found in the proximate analysis (Desypris et al., 1982).
Primary devolatilisation of coal starts at 300-400°C, and continues at higher temperatures up to
1000°C for high heating rates (Stubington and Sumaryonon, 1984; Arendt and van Heek, 1981).
Information on the extent of carburisation of the iron formed in the solid state reduction product at the
heap surface is important because the final product aim is making crude steel. If the product from the
solid state reduction zone is high in carbon, refining must be done in the rest of the process. Few
studies were done to investigate carburisation of iron by coal in mixed ore-coal reaction. Haque et al.
(1992b, 1993) measured carburisation of iron in reaction of coal-ore packed beds and found increased
carbon deposition at lower temperatures. Haque et al. (1992b, 1993) explain this to be the result of

11
slow devolatilisation and slow dissociation of volatiles at low temperatures, enhancing formation of
deposited carbon. Formation of combined carbon is enhanced by increased reaction time and
temperature. In the case of char as reductant only small amounts of free carbon is formed, and
according to Haque et al. (1992b, 1993) this carbon deposition took place on sample cooling. The
combined carbon content of DRI, when char was used as reductant, is similar to that formed when coal
was used as reductant. Additions of Na2CO3 or CaCO3 resulted in increased combined carbon
contents. Haque et al. (1992b, 1993) ascribed this to early formation of iron in the presence of the
carbonates, so increasing the contact time between carbon and iron for diffusion of carbon into iron.
Towhidi and Szekely (1983) performed reduction experiments on Fe2O3 pellets in CO-H2-N2 gas
mixtures at 600-1234°C and found that the maximum rate of carbon deposition occurred at 500-
600°C. Carbon deposition only occurred at temperatures below 900°C and formed a layer of carbon on
the pellet surface that prevented access of reducing gas to the pellet, resulting in decreased reduction
rates. The gas mixtures used in experiments varied from CO and H2, to mixtures of CO and H2 of
25%CO-75%H2, 50%CO-50%H2 and 75%CO-25%H2. The maximum rate of carbon deposition was
observed in a 75%CO-25%H2 gas mixture. At constant partial pressure of CO, carbon deposition was
enhanced by H2 and hindered by N2. Deposited carbon was elemental carbon, not cementite. Carbon
deposition is not only dependent on thermodynamics as it was found that carbon deposition does not
take place to a significant extent in the initial stages of reduction, but once iron had formed from
reduction, the iron served as a catalyst for carbon deposition.
The catalytic effect of iron on CO decomposition means that the pore surface area of the iron formed
in the reduction process directly influenced the carbon deposition rate (Turkdogan and Vinters, 1974).
The product iron surface area formed in reduction of hematite in turn depends on the pore surface area
of the source material as shown by Turkdogan and Vinters (1972); a small iron oxide surface area
(porosity) results in a small iron surface area. Turkdogan and Vinters (1972) also determined that the
coarseness of the iron pore structure formed from hematite reduction increases with increased
reduction temperatures, and the iron pore surface area decreases. Also, a more coarse iron pore
structure is formed from reduction by CO than that formed by H2 reduction.
1.3. Indicators for Heat Transfer Control Pistorius (2005) identified heat transfer control of three different types: (1) thermodynamically
constrained processes such as calcination of limestone which takes place at a specific temperature
where increased heat input results in increased reaction rate at the specific reaction temperature, (2)
processes in which the process temperature is limited by the slag liquidus temperature so that
increased heat input results in increased reaction rate, but process temperatures remain similar to that
at lower heat input as is the case in ferromanganese and ferrochromium production, (3) reaction of

12
ore-carbon/coal systems in which there is a band of reaction temperatures in which the process can
function, given no bulk melting of reactants and products takes place. As shown by Pistorius (2005)
mixed control between heat transfer control and chemical reaction control can prevail in ore-
carbon/coal reaction systems, and heat transfer control can be in the form of radiation heat transfer
control, that is heat transfer from the heat source to the heated surface is controlling, or heat transfer
control can be in the form of conduction heat transfer (where heat transfer from the sample surface to
the sample interior is limiting).
The main indicator for heat transfer control is the presence of a persistent temperature differential
between the heat source and the heated surface. This was shown by Venkateswaran and Brimacombe
(1977) to be the case in the SL/RN direct reduction kiln process. The authors developed a model for
the process and compared the model outputs with solids bed temperature measurements from a pilot
SL/RN kiln of 35 m length and 2.1 m ID. The temperature differential between the solids bed and the
gas varied from a maximum of 597°C closest to the charge end, in the reduction zone of the kiln, to a
minimum of 165°C towards the discharge end of the kiln. At the same physical positions in the kiln,
the temperature differential between the solids bed and the kiln wall varied from 247°C to 41°C.
Venkateswaran and Brimacombe (1977) conclude that heat transfer control prevails in the reduction
zone of the kiln because the air profile in the kiln is an important variable, and that high energy
requirement for the gasification reaction explains heat transfer control in the reduction zone. Heat
transfer control in the SL/RN process is also indicated by the effect of more reactive reductant on the
bed temperature. This is shown in graphical format by Cunningham and Stephenson (1980): for lignite
as reductant the bed temperature is 900°C, increasing to 1000°C for gas-flame coal, and a further
increase to 1140°C for coke breeze as reductant. In the work presented here the sample is heated uni-
directionally from the sample surface to test the effect of heat transfer control within the material bed.
Therefore, in the experimental work presented here a significant temperature differential, at least
100°C, between the sample surface and the heat source is expected.
Besides the observation of a persistent temperature differential between the heat source and the heated
surface, the second indication of heat transfer control in a reaction system is that increased reaction
rates result from increased heat transfer to the reacting material. The latter statement sounds obvious
for an endothermic reaction system but can be better explained from the work of Seaton et al. (1983)
in which the reaction of char-hematite composite pellets almost ceases for reaction at 900°C when the
pellet surface and centre temperatures levelled off with the onset of the gasification reaction. For
reaction of the pellets at 1000°C and 1100°C furnace temperatures, instead, the similar eventual
levelling off of pellet surface and centre temperatures is seen, but the reaction extent was much larger
before reactions ceased. Therefore, as pointed out by Seaton et al. (1983), not enough heat is
transferred to the pellet at 900°C to overcome the heat demand of the gasification reaction at this

13
temperature, whilst heat supply to the pellet at 1000°C and 1100°C furnace temperature was higher to
at least enable significant gasification reaction progress to supply CO for the reduction of FeO. The
latter observation does not mean the absence of heat transfer control at 1000°C and 1100°C furnace
temperatures, only that the effect of heat transfer control was more pronounced at 900°C.
Another indicator of heat transfer control is the observation of apparent activation energy values which
are much lower than that for chemical reaction control. In some studies a possible explanation put
forward for the lower apparent activation energy was catalysis of the gasification reaction, Seaton et
al. (1983), Abraham and Gosh (1979). The other explanation often put forward is mixed control
because the activation energy is close to half that reported by Walker et al. (1959) of 360 kJ/mol for
chemical reaction control.
1.4. Chemical Reaction Rates
1.4.1. Reduction Usually the aim of rate chemical studies of reduction/gasification is to determine the intrinsic reaction
rate for a particular material. To measure the intrinsic reduction/gasification rate the experiment must
be set up in such a way that effects of film mass transfer and diffusion are eliminated. Reacting small
samples at low temperatures and under sufficient gas flow rates ensure that only the chemical reaction
rate is measured. This information provides the absolute maximum rate at which reduction/gasification
can take place. However, rates in industrial processes are usually not under chemical reaction control
only, since high reaction temperatures are employed. Relevant reduction rate studies are summarised
in Table 3. Comparison of the rate data from these studies is shown in graphical format in Coetsee et
al. (2002).

14
Table 3: Studies on Reduction Rates Authors Year Activation
Energy (J/mol) React
ion Step*
Reduction Temperature
(°C)
Gas Start Material
Particle Diameter/ Thickness
(mm)
A/N/D/C/S/PB
McKewan 1960 64 015 W/F 600-1050 H2 Ore fines 5-18; 6-25
(Hard Taconite)
P
McKewan 1960 62 342 M/F 400-550 H2 Ore fines 5-18; 6-25
(Hard Taconite)
P
McKewan 1961 56 902 M/F 400-500 H2-H2O-N2
Reagent Grade Fe2O3
9 P
McKewan 1962a 57 739 H/F 700-1000 H2-H2O-N2
Reagent Grade Fe2O3
9 P
McKewan 1962b 56 484 M/F 350-500 H2 Reagent
Grade Fe2O3 9 P
Trushenski et al. 1974
99 998 64 434
[105 397?]
H/M M/W
750, 775, 800 CO-CO2 Pure Fe2O3
Powder 13.5 P
Trushenski et al. 1974
69 036 78 241 116 131
H/M M/W W/F
750, 775, 800 CO Pure Fe2O3 Powder 13.5 P
Turkdogan & Vinters 1972 191 409 W/F 600-1100 H2
Hematite Ore 0.4-3.6 A
Turkdogan & Vinters 1972 125 614 W/F 700-1200 CO-CO2
Hematite Ore 0.4-3.6 A
Turkdogan & Vinters 1972 137 439 W/F 800, 1050, 1200 CO-CO2
Oxidised Fe Strip
1 x (4-11 cm2) S
Nabi & Lu 1968 92 048 H/M 811-1011 H2-H2O Hematite Ore
9.3 x 27 length C
Quets et al. 1960 61 505 M/F 400-590 H2-N2 Reagent
Grade Fe2O3 & Fe Strip
15.6 (C) 20 x 15 x 0.1
(S) C, S
Quets et al. 1960 13 389 M/W 590-1000 H2-N2 Reagent
Grade Fe2O3 & Fe Strip
15.6 (C) 20 x 15 x 0.1
(S) C, S
El-Geassy et al. 1977
53 555 (Dense) 21 506
(Porous)
H/F 800-1100 H2 Chemically Pure Fe2O3
Dense: 9.8 x 11.1 height
Porous: 10.8 x 12.2 height
C
El-Geassy et al. 1977
31 589 (Dense) 9 540
(Porous)
H/F 800-1100 CO Chemically Pure Fe2O3
Dense: 9.8 x 11.1 height
Porous: 10.8 x 12.2 height
C
Murayama et al. 1978
79 161 120 499 125 143
H/M M/W W/F
800-1050 CO-CO2 Pyrite Cinder 10 P
El-Rahaiby & Rao 1979 71 550 W/F 238-417 H2 Fe Strip
0.0508 x (2.40-5.28
cm2) S
Al-Kahtany & Rao 1980 77 739 M/F 234-620 H2 Fe Strip
0.089 x (1.12-9.88
cm2) S
Sun and Lu 1999b 65 689 69 454 73 638
M/W W/F M/F
1200 CO (Coal) Fe3O4 Fines PB
Sun and Lu 1999b 61 505 63 597 68 618
M/W W/F M/F
1200 H2 (Coal) Fe3O4 Fines PB
Rao & Moinpour 1983 65 325 H/F 245-482 H2 Fe Strip
0.136x (6.40-6.56
cm2) S
Towhidi and Szekely 1981 52 300 H/M 600-1234 CO Fe2O3 4-20 P
Towhidi and Szekely 1981 60 668 H/M 600-1234 H2 Fe2O3 4-20 P

15
Authors Year Activation Energy (J/mol)
Reaction
Step*
Reduction Temperature
(°C)
Gas Start Material
Particle Diameter/ Thickness
(mm)
A/N/D/C/S/PB
Warner 1964 63 597 W/F 650-950 H2 Fe2O3 10 x 10 height C
Meraikib & Friedrichs 1987 63 100 H/F 800-1000 CO Hematite
Ore 13 P
Meraikib & Friedrichs 1987 51 700 H/F 750-1000 H2
Hematite Ore 13 P
Tsay et al. 1976 92 048 [Nabi & Lu]
71 128 63 579 [Warner]
H/M M/W W/F
800, 850, 900 H2 Fe2O3 28.6 x 10
height P
Tsay et al. 1976 113 805 73 638 69 454
H/M M/W W/F
800, 850, 900 CO Fe2O3 28.6 x 10
height P
* Pellet (P) or Particle (A) or Disk (D), or Cylinder (C), Packed Bed of Coal and Oxide (PB), Strip (S) * Fe2O3=H; Fe3O4=M; FeO=W; Fe=F
1.4.2. Gasification
Gasification of carbon occurs via a surface reaction on the carbon pore surface. Therefore, as in the
case of iron oxide reduction with CO, experimental measurement of fundamental kinetics requires
prevention of diffusion control, by using small particles. The pore surface area and pore size
distribution are different for different types of carbon. Also, as the carbon is gasified the pore structure
changes: the pores increase in size when carbon is carried away in the gas phase as CO.
Global kinetic parameters were determined in most of the gasification studies, but some authors
determined the kinetic parameters for the elementary steps in the gasification process, as presented in
the Langmuir-Hinshelwood (LH) expression. The latter approach involves the reaction of carbon
under different CO2-CO gas mixtures, at different temperatures, whilst the former may be calculated
from gasification experiments under CO2 gas only. As it is well known from experimental evidence
that the gasification rate is retarded by CO and H2 in the reactant gas it would seem appropriate to
measure gasification rates in the presence of these retarding gases, since they will be present in
significant quantities in metallurgical processes.
However, there still remains much uncertainty as to the applicability of the LH expression, and the
meaning of the constants in the expression. Wu et al. (1988) questioned the interpretation of the
constants in the LH expression and Bandyopadhyay and Ghosh (1996) questioned the applicability of
the expression for CO-CO2 gases containing large amounts of CO.
The LH equation is:
232
21
1 COCO
CO
PKPKPK
rate++
= (1)
16
The widely accepted mechanism as represented in the LH expression is that proposed by Reif (1952):
CO)O(COk
k+⇔
1
22 (2)
COOCk3
)( →+ (3) 31332211 k/kK;k/kK;kK ===
)(O = carbon-oxygen complex formed by adsorption of oxygen onto the carbon surface
As discussed by Von Fredersdorff and Elliott (1963), the LH expression can be simplified for extreme
reaction conditions of temperature and partial pressures of CO and CO2, for total pressures up to 1
atm. If gasification occurs at low temperature and high 2COP , the COP will be low and the simplified LH
expression will be zero order with respect to 2COP as 12 <<COPK and 1
23 >>COPK . Most of the active
carbon sites are then filled by adsorped oxygen and the gasification rate is that of the gasification step,
reaction (3), and the activation energy,3kE . Dutta et al. (1977) found that the gasification rate is
independent of 2COP at CO2 pressures in excess of 15 atm., and therefore zero order with respect to
2COP .
At low 2COP and low temperatures, when COP is low, the LH expression simplifies to express the rate
of the oxygen adsorption reaction step, reaction (2), as 12 <<COPK and 123 <<COPK . The reaction order
with respect to 2COP is then one. This is also the case when gasification takes place at high temperature
and2COP , because the K2 and K3 become small under these conditions. That is, the gasification reaction
rate constant (k3) is large compared to the oxygen adsorption and desorption reaction rate constants, k1
and k2 so that most of the active carbon sites are free carbon sites. The gasification rate expressed is
that of the oxygen adsorption rate, reaction (2) forward, and the activation energy is1kE .
The extreme reaction conditions that allow simplification of the LH equation are usually absent in ore-
carbon reduction. Then the reaction order with respect to 2COP falls between one and zero. As indicated
by Von Fredersdorff and Elliott (1963), the LH expression does not allow for zero gasification rates at
equilibrium conditions when high COP prevails at ore-carbon reduction temperatures. Rao and Jalan
(1972) show that incorporation of the reverse reaction (3) results in a modified LH expression that
does eliminate the above problem. Reaction (3) (reverse) was not taken into account in the past as the
argument was that carbon transfer from gas to solid carbon would occur if this reaction takes place,
and this was not seen in previous studies, Ergun (1956). The contrary was concluded by Kapteijn et al.
(1994).
The gasification mechanism under water vapour may be considered to be analogous to that of
gasification under CO2:

17
2
1
22 H)O(OH
k
k+⇔ (4)
CO)O(Ck3
→+ (5)
31332211 k/kK;k/kK;kK === )(O = carbon-oxygen complex formed by adsorption of oxygen onto the carbon surface
The LH equation for steam gasification of carbon:
OHH
OH
PKPKPK
rate2322
21
1 ++= (6)
In most instances the gasification rate is determined under CO2 (or H2O) gas only, and the apparent
activation energy is calculated from the first order reaction rate expression. In some instances the
reaction order with respect to 2COP is checked, but in most cases it is assumed. Also, the initial reaction
rates are used so that the carbon pore surface area used in rate calculations can then be assumed to be
the same as that measured in the unreacted carbon. The rates are compared in units of per time here for
easy comparison as the internal pore surface area has not been measured in all the studies. The use of
small particles is very important in gasification rate measurements as the internal surface area is large
so that diffusion control can easily set in when large particles are used. Turkdogan et al. (1968)
determined that the carbon particles should be smaller than 6 mm at 900°C and 2 mm at 1100°C to
ensure reaction control under CO2.
In Fig. 2 the reaction rates from various studies, at 1 atm. total pressure CO2, are shown. Where points
are indicated in the graphs these points were calculated from individual data points in the reported
study, whilst lines without points indicate extrapolation of data measured at low temperatures or a rate
expression determined by the authors and then only converted to the required units for this study.
Where a data series consists of both points and a line, the line represents a linear fit determined in this
study, and the kinetic parameters from this straight line may not be exactly that reported in the
particular study.
It is seen that the reaction rates range from lowest rates for unreactive graphite, to petroleum coke,
coal char and most reactive coconut charcoal. The activation energies range from 164 kJ/mol for Pitch
coke by Kühl et. al.(1992) to 325 kJ/mol for Carbon Black by Rao and Jalan (1972). The reaction rates
measured by Kühl et al. (1992) for different coke samples are higher than the rest. This may be due to
the rates being measured at 40% carbon reaction, when the pore surface area should be close to its
maximum value, Wu et al. (1988).

18
Fig. 2: Initial Gasification Rates under CO2
A limited number of studies have been done on steam gasification of carbon. Fig. 3 shows some of the
initial reaction rates from these studies under 1 atm. H2O. The values reported for Johnstone et al.
(1952) and Blackwood and McGrory (1958) were calculated from the LH-expression parameters
determined in those studies. Kayembe and Pulsifer (1976) calculated an activation energy of 254
kJ/mol for coal char gasification under steam. This value is much higher than that determined in the
other studies done by Pilcher et al. (1955), Johnstone et al. (1952) and Kühl et al. (1992) ranging from
120-177 kJ/mol. The gasification rates measured by Kühl et al. (1992) for different coke types are also
higher than that measured in the other studies, but this may be due to the rates being measured at 40%
reaction, when the carbon surface area is close or at its maximum, Wu et al. (1988).
-7.0
-6.0
-5.0
-4.0
-3.0
-2.0
-1.0
0.0
0.64 0.69 0.74 0.79 0.84 0.89 0.94 0.99
1000/T(K)
log
r (1/
s)
Dutta et al.-Pittsburg Coal & Char (-35 +60 mesh)
Dutta et al.-Illinois Coal & Char (-35+60 mesh)
Turkdogan & Vinters (1969)-CoconutCharcoal (-10 +16 mesh)
Turkdogan & Vinters (1969)-Electrode Graphite (-10+ 16 mesh)
Rao & Jalan-Carbon Black Pellets(20 mm x 3 mm)
Tyler & Smith-0.9 mm PetroluemCoke
Tyler & Smith-2.9 mm PetroluemCoke
Tyler & Smith-0.22 mm PetroluemCoke
Tyler and Smith-0.9 mm Graphite
Kuhl et al. - Westerholt Coke (1-3mm)
Kuhl et al. - Active Coke (1-3 mm)
Kuhl et al. - Pitch Coke (1-3 mm)

19
Fig. 3: Initial Gasification Rates under H2O
1.5. Conclusion
Chemical reaction rates of reduction and gasification indicates the maximum possible process
production rates for mixed bed systems, but do not necessarily provide realistic process production
rate predictions because the real process in usually not under chemical reaction control. Apparent
activation energy values calculated from experiments on composite pellets and mixed bed materials
can not be used alone to make conclusions on heat transfer control, as pointed out by Seaton et al.
(1983). As pointed out by Vankateswaran and Brimacombe (1977) a lot of work is required to obtain
all the necessary detailed fundamental information to describe the process progress in a mixed bed
system so that an empirical approach to reaction rate measurements is more effective. Therefore, the
primary aim of the work presented here is to construct a realistic simulation experiment to quantify
radiation heat transfer from measurement of temperature and reaction extent as functions of reaction
time and position within the sample material. These results will show the importance of heat transfer
in the IFCON® process. Secondary aims of this work are to show the effects of layer thickness, coal
volatiles, phase chemistry and particle size in this reaction system. The information gained from such
an experiment should provide enough information to use in validation of mathematical models that can
then be used for process design and testing process sensitivities.
-7.0
-6.0
-5.0
-4.0
-3.0
-2.0
-1.0
0.0
0.64 0.69 0.74 0.79 0.84 0.89 0.94 0.99
1000/T(K)
log
r (1/
s)
Pilcher et al.
Kayembe & Pulsifer-CoalChar (-177+149 microns)
Kuhl et al. - WesterholtCoke (1-3 mm)
Kuhl et al. - Active Coke (1-3 mm)
Kuhl et al. - Pitch Coke (1-3mm)
Johnstone et al.-Graphite
Blackwood & McGrory-Purified Coconut Charcoal

20
CHAPTER II
EXPERIMENTAL
As discussed in the literature study in Chapter I, one needs an experimental set-up that will simulate
uni-directional heating conditions typical of the industrial process under study. To simulate uni-
directional heating in a tube furnace a unique experimental set-up was developed that allows the
sample to be transported into and out of the experimental tube furnace heating zone, under a protected
atmosphere. This set-up also allows for product gas analyses to be done throughout the experiment.
Furthermore the experimental set-up was used to quantify the heat transferred to the sample over the
experimental time period.
A standard tube furnace was adapted to connect a sample lifting tube to the bottom lid, attached to the
furnace tube. The sample lifting tube contained a pedestal holder that lifted the pedestal into the
furnace through a piston action. Radiation shields were positioned inside the top and bottom end of the
furnace tube to direct radiation heat to the sample surface, and away from the sample sides. The top lid
contained a view port for sample surface temperature measurement. The pedestal contained
thermocouples to measure the sample temperature at different positions within the sample. The
furnace tube surface, used as radiation heat source to heat the sample surface, was conceptually
divided into three heating surfaces. Radiation heat transfer input to the sample surface was increased
by increased heat input to the heating surfaces via the furnace heating elements. The furnace
temperature control thermocouple was positioned outside the furnace tube, close to the middle of the
furnace element heating zone. Increased heat transfer to the sample surface was established by
increased furnace control thermocouple set points of 1300°C, 1400°C and 1500°C, respectively. The
heating surface temperatures were measured throughout each experiment.
2.1. Experimental Set-up
2.1.1. Furnace
The furnace set-up consisted of an alumina furnace tube, 99.8% purity, 88.9 mm O.D. x 79.4 mm I.D.
x 1200 mm, positioned vertically inside a circle of six lanthanum chromite (LaCrO3) heating elements
which were placed on a circle radius of 57.5 mm from the furnace tube centre. The top and bottom
ends of the alumina tube were sealed gas tight via O-rings contained within each brass lid. The furnace
tube was supported via the bottom brass lid, resting on a steel bracket bolted onto the furnace frame.
The top lid on the furnace connected to another lid to serve as a reducer and variable seal. Because of
thermal expansion of the ceramic furnace tube a variable seal was made between the bolt-on top lid
and the rest of the top assembly. The top assembly rested on a bracket bolted onto the tube furnace
21
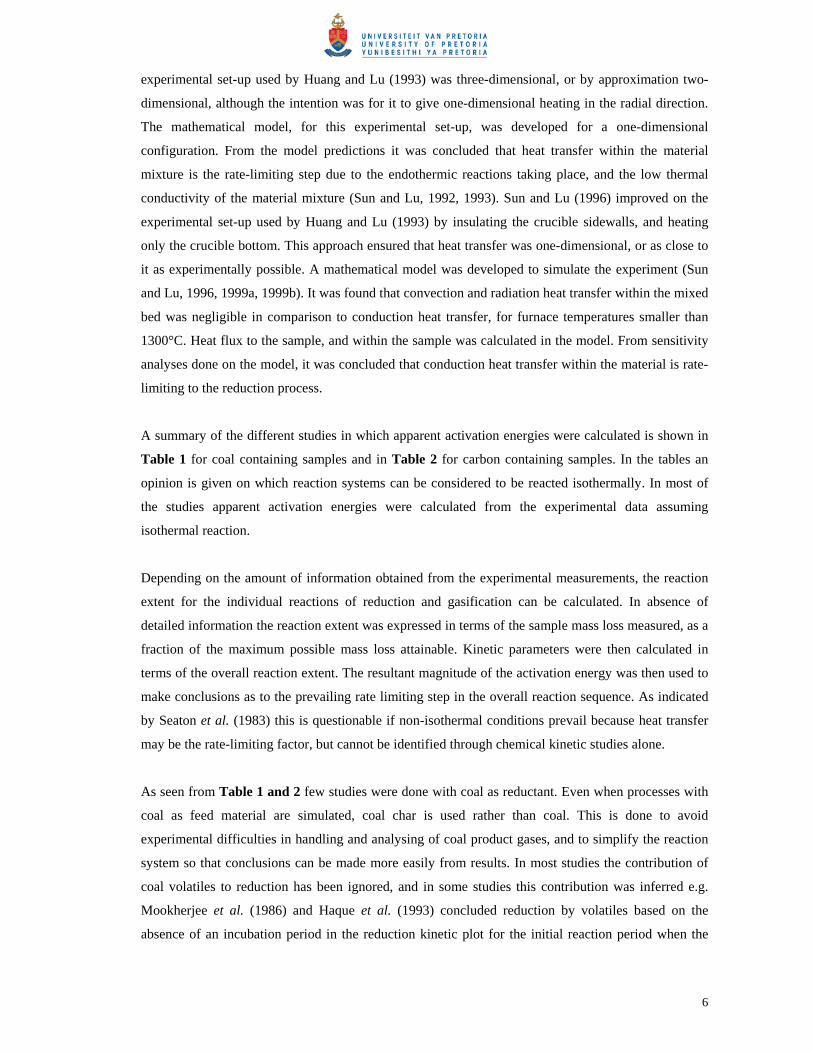
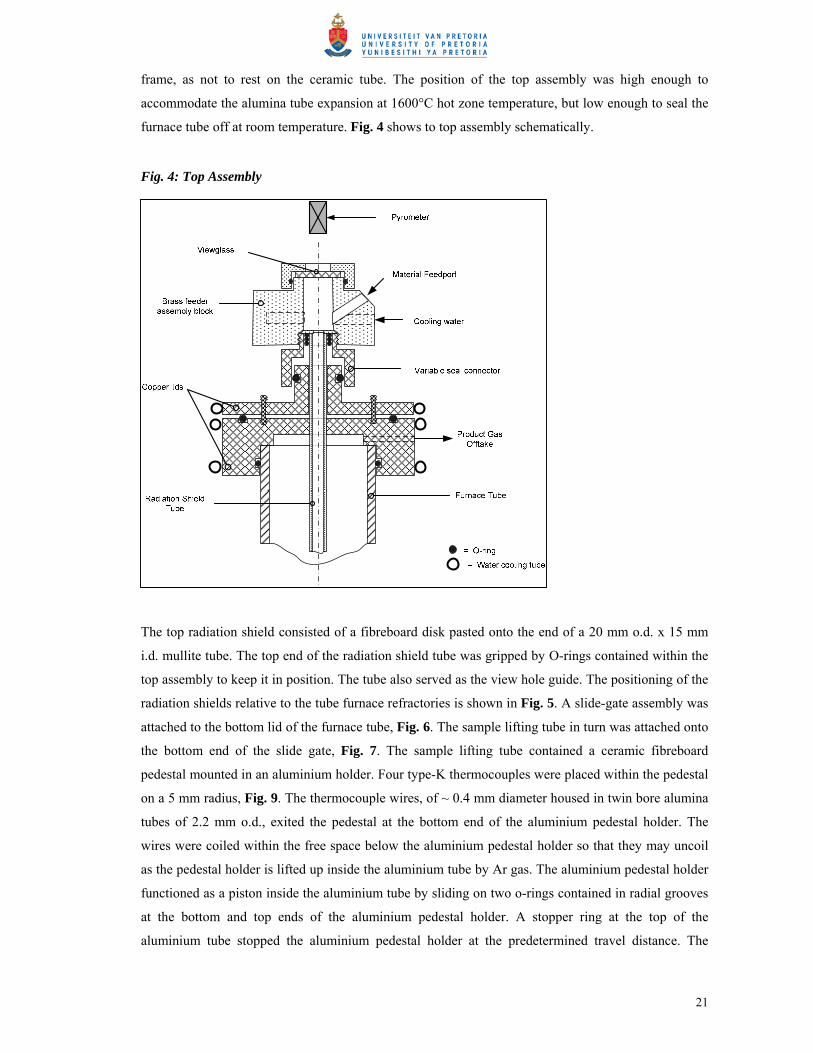
frame, as not to rest on the ceramic tube. The position of the top assembly was high enough to
accommodate the alumina tube expansion at 1600°C hot zone temperature, but low enough to seal the
furnace tube off at room temperature. Fig. 4 shows to top assembly schematically.
Fig. 4: Top Assembly
The top radiation shield consisted of a fibreboard disk pasted onto the end of a 20 mm o.d. x 15 mm
i.d. mullite tube. The top end of the radiation shield tube was gripped by O-rings contained within the
top assembly to keep it in position. The tube also served as the view hole guide. The positioning of the
radiation shields relative to the tube furnace refractories is shown in Fig. 5. A slide-gate assembly was
attached to the bottom lid of the furnace tube, Fig. 6. The sample lifting tube in turn was attached onto
the bottom end of the slide gate, Fig. 7. The sample lifting tube contained a ceramic fibreboard
pedestal mounted in an aluminium holder. Four type-K thermocouples were placed within the pedestal
on a 5 mm radius, Fig. 9. The thermocouple wires, of ~ 0.4 mm diameter housed in twin bore alumina
tubes of 2.2 mm o.d., exited the pedestal at the bottom end of the aluminium pedestal holder. The
wires were coiled within the free space below the aluminium pedestal holder so that they may uncoil
as the pedestal holder is lifted up inside the aluminium tube by Ar gas. The aluminium pedestal holder
functioned as a piston inside the aluminium tube by sliding on two o-rings contained in radial grooves
at the bottom and top ends of the aluminium pedestal holder. A stopper ring at the top of the
aluminium tube stopped the aluminium pedestal holder at the predetermined travel distance. The

22
sample was lifted into the furnace by letting Ar gas flow into the bottom end of the sample tube, via a
control valve set at 50 kPa gauge pressure. When the sample reached the top of the travel position into
the furnace, the sample surface level was flush with the bottom radiation shields’ top surface. To lower
the sample into the sample tube the Ar gas was pumped out of the tube by a vacuum pump.
Fig. 5: Furnace layout
The wires exited the sample tube via a sealed fitting and the thermocouple outputs were logged with a
dataTaker DT500 logger at one-second intervals. The sample crucible, shown in Fig. 8, was made
from ceramic fibreboard and sat on top of the pedestal, with type-K thermocouples entering the sample
= Contact thermocouple junction position
G
Viewhole Level
D
B
C
A
E
F
A = Furnace refractory block
C = Heating elementD = Bottom radiation shield
B = Top radiation shield
E = Furnace tubeF = Bottom brass lidG = Slide-gate assembly
H
H = Furnace control thermocouple
Crucible top surface position throughout reaction period

23
through the crucible bottom. The crucible dimensions were 30 mm i.d., 50 mm o.d. and the crucible
bottom was either 10 or 24 mm thick. The crucible was filled with material mixture so that the sample
surface and the crucible top surface were level. The sample tube contained two fibreboard insulation
rings, within its wider top section, to protect the aluminium when the hot sample was lowered into the
sample tube. The sample tube assembly could be flushed via an Ar gas inlet and outlet on the sample
tube, each line fitted with a ball valve. The furnace was flushed with Ar gas entering through the
bottom brass lid, and exiting through the top brass lid. The furnace tube contained a cylindrical
fibreboard radiation shield made from individual fibreboard rings cemented onto each other. This
radiation shield rested on the bottom brass lid.
Fig. 6: Furnace Tube Bottom Assembly (Bottom lid & slide gate)

24
Fig 7: Sample Tube with Pedestal
Fig. 8: Crucible
710 mm
120 mm

25
Fig. 9: Pedestal and thermocouples
Thermocouples
PedestalHoles forfastening pins
Sample tubeholder
The furnace temperature was controlled by a PID controller/programmer using a type-B thermocouple
positioned next to the furnace tube, radially close to the hot zone, and vertically close to the middle of
the furnace element heating zone. The hot zone position was measured by placing a hand held type-S
thermocouple at various depths into the furnace tube. The thermocouple was kept at one position for
two minutes, and then moved to the next position. The measurements are shown Fig. 10, with the
certified standard deviation range for the thermocouple wire. The 0 cm reference point was the top
surface of the top assembly when the view glass holder was removed.

26
Fig. 10: Hot zone measurements
Initial efforts to use a 87 mm heating zone around the hot zone centre, at 784 mm from 0 reference
level, was not successful as the bottom radiation shield could not shield the sample sides sufficiently
from radiation heat from the furnace tube. This was because the total heating length of the furnace is
350 mm in length, see Fig. 5. Thus, the heating zone was enlarged to include the section of furnace
tube extending from the bottom of the hot zone to the top of the external furnace refractory. This
second heating zone was conceptionally divided into two sections. The heating zone thus consists of
three sections, the furnace tube length of 80 mm around the furnace hot zone, and the second and third
sections of 110 mm and 88 mm length, respectively, extending below the first heating zone. The
heating surface temperatures of each of the three heating sections were measured throughout each
experiment by type-S contact thermocouples placed on the furnace tube exterior surface, as shown in
Fig. 5. Uni-directional heat transfer along the vertical axis of the crucible and contents was confirmed
by viewing polished sections of reacted samples under reflected light, which showed that no reaction
fronts existed across the horisontal axis of the crucible contents.
2.1.2. Gas Lines
The supply lines to the furnace and the gas off-take lines from the furnace to the quadropole mass
spectrometer (Gaslab) are shown diagrammatically in Fig. 11. Argon gas of 99.999% purity was used
as carrier gas. The Ar gas was cleaned by passing through anhydrous CaSO4 to remove water
(“Drierite”), and through an “Oxyzorb” cartridge to remove oxygen. The carrier gas was passed
through the experimental set-up at ~1500 Ncm3/min. The Ar flow rate was measured before each
experiment sequence using a bubble meter, and the flow was controlled by a Rotameter fed from the
Ar bottle via a pressure regulator.
1338133913401341134213431344134513461347134813491350135113521353135413551356135713581359
70 71 72 73 74 75 76 77 78 79 80 81 82 83 84 85 86 87 88 89
Distance from top (cm)
Tem
pera
ture
(°C
)
Measured Temperature (°C) min max

27
The product gas was passed through a Balston filter (050-11 DX) to remove small solid particles from
the gas. The gas flowed past a draw off point for the mass spectrometer (Gaslab), and then through a
bubbler to the vent. The gas system was also used to calibrate the mass spectrometer for Ar, CO2, CO,
CH4 and H2 by connecting the particular calibration gas supply to the one-way inlet valve connection
shown in Fig. 11. The calibration gases used were 100%CO, 5%CH4-Ar, 5%H2-Ar, 100%Ar and
10%CO2-Ar, respectively. Calibration for Ar and CO2 was done by using the furnace gas supply lines
up to the one way inlet valve connection, Fig. 11.
The product gas water content was measured by a Dewmet cooled mirror dewpoint meter. The product
gas off-take lines, 6 mm o.d. copper tubing, were heated by trace heating to prevent condensation of
water from the product gas. A type-K thermocouple was placed in the heated line to monitor the gas
temperature. These temperature values were typically between 120-135°C. This K-type thermocouple
measurement was pre-calibrated to the gas temperature measured with a thermometer at the
dewpointmeter chamber gas inlet. At 1300°C furnace temperature the gas temperature measured at the
dewpoint chamber inlet was 76°C for type-K thermocouple measurement of 133°C. The type-K
thermocouple was used as an indicator temperature to prevent overheating the Dewmet sensor.
The Ar gas used for initial flushing of the sample holder, to displace the bulk of air in the sample
holder and furnace tube, was also 99.999% pure Ar taken from a separate cylinder, and passed through
“Drierite”. The gas sampling response time could best be determined from devolatilisation
experiments. This is because devolatilisation starts at a few hundred degrees so that sample gas
evolution is immediate when the sample is lifted into the furnace tube, and so provided a definitive
start time for gas evolution against which the response time to the first analyses of the devolatilisation
product gas could be measured. The sampling delay time at ~1500 Ncm3/min was found to be 11-12
seconds from zero time. Zero time is the time at which the sample has reached the top of the travel
position into the furnace tube. The 11-12 seconds is the fastest analysis interval time achieved by the
mass spectrometer for the analyses set-up selected on the mass spectrometer. For the Dewmet the
sampling response time was 22-24 seconds. The time to lift the sample up into the furnace, or lower
the sample into the sample holder, was approximately 5 seconds. The flow rate of product gas
components was calculated by scaling relative to the input Ar flow rate, as shown in Appendix I.
The maximum gas retention time in the furnace tube open volume was calculated to be 159 seconds
for a volume of 3892 cm3 and Ar gas flow rate of 1500 Ncm3/min. The minimum gas retention time in
the furnace tube was calculated as ~ 30 seconds, assuming the gas was heated to the sample surface
temperature. The time period required for the product gas analysis to return to that before the sample
was lifted into the furnace tube, was noted from the product gas analyses. This data is expressed, for
each product gas component, as a multiple of the gas retention time in the furnace tube open volume.

28
r
lsm t
ttt
)( −= (7)
=mt Time multiple for product gas to return to product gas composition at start of experiment [seconds]
=st Time when product gas analysis return to product gas composition at start of experiment [seconds] =lt Time when sample was lowered from furnace tube [seconds] =rt Maximum gas retention time in the furnace tube open volume [seconds]
For the samples of graphite and pre-reduced Sishen iron ore the time multiples varied from -8 to +5.
The negative values are possible when the component in the product gas return to the initial levels
before the sample is lowered from the furnace tube. For the ore-coal samples the time multiples varied
from -1 to 8, and in two experiments the CO analyses did not return to the initial level. The data for
calculation of the time multiple is summarized in Appendix I.
The furnace assembly was checked for gas leaks by drawing vacuum of 80 kPa on the assembly, if this
vacuum was maintained, the assembly was considered gas tight. The sample holder was checked for
gas leaks by passing gas through the assembly, and using soap water to identify leaks.

29
Fig. 11: Gas supply and off-take lines to/from furnace

30
2.2. Calibration
2.2.1. Radiation Network
The radiation heat transfer set-up in the tube furnace is shown in Fig. 12. The heat transferred to the
sample surface can be calculated from a radiation network representing the heat flows in the
experimental set-up. The network is shown in Fig. 13 and was developed according to the formalism
set out in Holman (1992), p. 410-413. Calculation of the view factors is summarised in Appendix II.
The calculations are outlined below. In Fig. 12 two imaginary surfaces 8 and 7 are used to calculate
the shape factors for use in the radiation network calculations. The symbols shown in Fig. 13 are
defined as follows: Ji = radiosity of surface i = total radiation that leaves surface i per unit time per
unit area [kW/m2]; =iR Resistance i in radiation network [m-2]; biE = σT4 = blackbody emissive power
of surface i [kW/m2]; σ = Stefan-Boltzmann constant = 5.669 x 10⁻⁸ W/m2K4.
Fig. 12: Radiation Configuration
Fig. 13: Radiation Network
R6
R17
R12
R1 R4
R18
R14
R16 R7R8
R3
R2
R13
R10 R11
R5
R9
R15J1Eb1
J5
J4
J6
J3
J2
Eb5
Eb6
Eb4

31
2.2.1.1. Resistances
The radiation network resistances in Fig. 13 were calculated as follows:
For the surface resistances of surfaces 1, 4, 5 and 6:
R1, R4, R12, R18: jj
ji A
Rε
ε−=
1 (8)
=iR Resistance i in radiation network =jε Emissivity of surface j in radiation network =jA Area of surface j
For the space resistances:
R2, R3, R5, R6, R7, R8, R9, R10, R11, R13, R14, R15, R16, R17: iji
n FAR 1
= (9)
=ijF View factor for radiation from surface i to surface j
=iA Area of surface i
2.2.1.2. Node Equations
The temperatures for surfaces 1, 4, 5 and 6 are known and the radiosity of the six nodes must be
calculated from the node equations. The following node equations were generated according
Kirchhoff’s rule. The equations are solved numerically for the radiosities (Ji).
Node 1:
013
16
8
15
6
14
3
13
2
12
1
11 =−
+−
+−
+−
+−
+−
RJJ
RJJ
RJJ
RJJ
RJJ
RJEb (10)
Node 2:
014
26
10
25
5
24
7
23
2
21 =−
+−
+−
+−
+−
RJJ
RJJ
RJJ
RJJ
RJJ
(11)
Node 3:
015
36
9
35
7
32
3
31 =−
+−
+−
+−
RJJ
RJJ
RJJ
RJJ
(12)
Node 4:
017
46
11
45
5
42
6
41
4
44 =−
+−
+−
+−
+−
RJJ
RJJ
RJJ
RJJ
RJEb (13)

32
Node 5:
016
56
11
54
9
53
10
52
8
51
12
55 =−
+−
+−
+−
+−
+−
RJJ
RJJ
RJJ
RJJ
RJJ
RJEb (14)
Node 6:
016
65
17
64
15
63
14
62
13
61
18
66 =−
+−
+−
+−
+−
+−
RJJ
RJJ
RJJ
RJJ
RJJ
RJEb (15)
The heat transferred to the sample surface is then calculated:
44
444 AR
JEq b −
= [kW/m2] (16)
2.2.2. Emissivity Measurements
The emissivities of alumina powder, alumina furnace tube material, fibre board and fibre board coated
with alumina paste were measured by placing the materials in a muffle furnace to heat up with the
furnace to 999, 1104, 1208 and 1306°C, respectively. A hand held type-S thermocouple was used to
check that the furnace temperature is at the furnace temperature set on the furnace PID controller. The
different material temperatures were measured by opening up the muffle furnace door and measuring
the sample temperature with an optical pyrometer, Minolta/Land Cyclops 152A infrared thermometer,
with the emissivity on the pyrometer set at 1.00. The measurements were logged with a dataTaker
DT500 logger at one-second intervals. After a measurement was made on one of the four materials,
the muffle furnace was closed to allow it to attain the set temperature again, before the next material
sample temperature was measured. The main assumption is that the material samples in the muffle
furnace are at the furnace temperature when the pyrometer temperature measurement is made.
Equation 17, the Planck blackbody radiation law, was used to back calculate the sample material
emissivity required to set the material sample surface temperature equal to the furnace temperature
(Tr). The other variable in the calculation is the spectral response of the Minolta/Land Cyclops 152A
infrared thermometer at 0.8-1.1µm. Calculations were done for both the upper and lower limit
wavelength of the pyrometer spectral response, but the emissivity values calculated for 0.95µm at
1306°C furnace temperature were used in further calculations. The temperature measurements are
summarised in Table 4. The emissivities calculated at different wave lengths are summarised in Table
5.

33
Table 4: Temperature measurements with pyrometer emissivity set to 1.00
Furnace Temperature
(°C)
Alumina powder
Alumina furnace tube
Fibre board
Fibre board coated with
alumina paste 999 946.3 946.0 960.3 942.1
1104 1032.1 1047.0 1036.6 1032.1 1208 1126.8 1146.0 1131.3 1121.1 1306 1204.8 1244.8 1208.2 1210.8
Table 5: Emissivities calculated at different wavelengths Furnace
Temperature (°C)
Alumina powder
Alumina furnace tube
Fibre board Fibre board coated with
alumina paste Wavelength
(µm) → 0.80 0.95 1.10 0.80 0.95 1.10 0.80 0.95 1.10 0.80 0.95 1.10
999°C 0.54 0.60 0.64 0.54 0.59 0.64 0.64 0.69 0.72 0.51 0.57 0.61 1104°C 0.49 0.55 0.59 0.57 0.62 0.66 0.51 0.57 0.61 0.51 0.55 0.59
1208°C 0.49 0.55 0.60 0.59 0.64 0.68 0.52 0.57 0.62 0.47 0.53 0.58 1306°C 0.46 0.52 0.57 0.63 0.68 0.72 0.48 0.53 0.59 0.48 0.54 0.59
2.2.3. Sample Surface Temperature Measurement
One of the main input parameters into the radiation network calculation is the sample surface
temperature. In the experiments the sample surface temperature was measured with a Minolta/Land
Cyclops 152A infrared thermometer with spectral response of 0.8-1.1µm. The measurement was made
through a view glass, along a 15 mm i.d. tube, 738 mm in length. The view glass consisted of 4mm
thick Robax® glass with transmissivity of 0.88 at 1.1µm and 0.91 at 0.8µm. To check the accuracy of
the sample surface temperature measurement made with the pyrometer, the actual surface temperature
of an inert alumina powder sample was measured with a type-S thermocouple positioned 5 mm from
the sample surface. The sample was introduced into the furnace, and once the sample temperature
stabilised, sample surface temperature measurements were made simultaneously using the type-S
thermocouple and the pyrometer.
The pyrometer emissivity was set at 1.00 for the pyrometer sample surface temperature measurement.
This measured temperature value (Tm) was then corrected for the actual alumina powder emissivity of
0.52 reported in Table 5, and glass transmissivity if applicable, using equation 17. Initial
measurements were made with and without the view glass, and with and without Ar purging gas, at
1300, 1400 and 1500°C furnace hot zone temperatures, respectively. Measurement with Ar purging
gas flow through the furnace tube resulted in a maximum decrease of 5°C in sample surface
temperature, at 1500°C furnace hot zone temperature. Comparisons were made for measurements
through the view glass with Ar gas flow through the furnace. The same alumina sample mass was used
in each experiment. The measurement for 1300°C furnace temperature was repeated. The change in

34
sample and surface temperatures for the two tests at 1300°C furnace temperature, as well as for
1400°C and 1500°C furnace temperatures are shown in the graphs in Appendix III. It is seen that the
sample was positioned in the furnace for 50 minutes, or more, to stabilise the sample temperatures. For
measurements made at 1500°C furnace temperatures some interference with the thermocouple
measurements was experienced. The filtered values are shown in the first graph, for measurements at
1500°C, in Appendix III and both the filtered and original data are shown in the following graph. It
was determined that the interference occurred with the heating cycles of the furnace elements,
therefore only the values at the end-point were checked by switching the furnace off. The end-point
temperatures measured by the type-S thermocouple and the pyrometer, respectively, are shown in
Table 6. The sample surface temperatures as adjusted for the emissivity setting on the pyrometer and
the view glass transmissivity are also shown in Table 6. The pyrometer sample surface temperature
measurement over reads the sample surface temperature by 6°C at 1300°C furnace temperature, and
under reads 14°C at 1500°C furnace temperature. The effect of the pyrometer over and under reading
of the alumina sample surface temperature on heat transferred to the sample surface is shown by
comparison of the kW/m2 transferred to the alumina sample surface, calculated using the radiation
network set out in 2.2.1., using as input the sample surface temperature measured with the type-S
thermocouple vs. the sample surface temperature measured with the pyrometer. In the radiation
network calculation the sample surface temperatures shown in Table 6 were used with the associated
heating zone temperature values at the end of the heating period. The resultant differences in radiation
heat transfer calculation values are summarised in Table 6. Heat transfer calculation values vary from
under calculation of 4kW/m2 at 1300°C furnace temperature to over calculation of 13kW/m2 at 1500°C
furnace temperature.
Table 6: Sample surface measurements
Furnace Hot Zone
Temperature (°C)
Pyrometer measurement (°C); ε = 1.00
S-type thermocouple measurement
(°C)
Adjusted Pyrometer
measurement (°C) @ 0.95
µm
∆Ta
*kW/m2 into
alumina sample
∆kW/m2 for
alumina sampleb
1300a 1076 1172 1177 -6 -61 -3 1300b 1082 1178 1184 -6 -59 -4 1400 1172 1290 1288 2 -73 2 1500 1250 1394 1380 14 -93 13
a (S-type thermocouple measurement) – (Adjusted Pyrometer measurement) * kW/m2 calculated from S-type thermocouple surface temperature measurement b (kW/m2 calculated using the S-type thermocouple measurement as sample surface temperature) – (kW/m2 calculated using the adjusted Pyrometer measurement used as sample surface temperature).
2731
1
51
2 −+
⋅=)
EC
ln(
CT
b
r
λλ
(°C) (17)
ετapp
b
EE = (18)

35
1
125
1
−⋅=
mTCapp
e
CE
λλ (19)
=1C 3.743 x 10⁵ kW µm4/m2 =2C 1.4387 x 104 µm K =λ wavelength (µm) =ε emissivity =τ transmissivity =mT Temperature measured by pyrometer (K) =rT Real Temperature (°C) =bE Black body emissive power per unit wavelength [kW/µm m2] =appE Apparent body emissive power per unit wavelength [kW/µm m2]
2.2.4. Calibration of Radiation Network Calculation
To calculate the heat transferred to the sample one must know the relevant surface temperatures, that
is the average furnace tube temperature for each heating zone and the sample surface temperature. As
shown in the furnace layout diagram in Fig. 5, the section of the furnace tube used as heating surface
is 278 mm in length, compared with the typical tube furnace hot zone length of ~ 80 mm. Therefore,
the heating surface is not at one temperature and the variation in temperature over the total 278 mm
length of heating surface is required as input to the radiation calculation. Consequently the heating
surface was divided conceptionally into three heating zone sections to add resolution to the radiation
network calculation. The temperature at the vertical centre of each heating zone was measured by
placing a contact thermocouple at the outside surface of the furnace tube at a position 5 mm below the
heating zone centre. The 5 mm allowance was made to account for the furnace tube expansion.
In addition to the three heating zone surface temperatures, the sample surface temperature was
measured by pyrometer, through the view glass at the top of the experimental assembly. These
temperatures were used as inputs to the radiation network calculation. The sample surface temperature
was measured with the pyrometer emissivity setting at 1.00, and the measurements were then
corrected for view glass transmissivity of 0.88 and sample material emissivity of 0.90 at 0.95µm
wavelength, using equation 17.
To calibrate the radiation network samples of pre-reduced Sishen ore and graphite were reacted at
1300, 1400 and 1500°C, respectively. This selection of materials was made to simplify the possible
reactions, as compared to coal and unreduced Sishen fines. The graphite and pre-reduced Sishen ore
were of -850 +425µm size fraction. Chemical analyses for these materials and XRD (X-ray
diffraction) analysis for the pre-reduced ore are shown in Appendix IV. After the runs the reacted
samples were sectioned horizontally into three portions, and analysed for forms of Fe, %C by Leco

36
method, and main components by ICP (Inductively coupled plasma) method. As a check on the
chemical analyses control samples were prepared from pre-reduced ore and graphite at different
carbon contents. Theses samples were submitted for analyses, and the resultant analyses compared
with the calculated %C and forms of Fe from the input material analyses. Control samples were also
prepared from coal and pre-reduced ore. The comparison for %C in the sample mixtures is shown in
Fig. 14 (a) for graphite and Fig. 14 (b) for coal. It is seen that the %C analysed for the mixtures
containing graphite corresponds well. For the coal containing samples it is seen that the total carbon
content is analysed, that is fixed carbon and carbon in the volatiles. The analyses and calculated total
carbon values differ by a maximum of 1.5%. The forms of Fe analyses are summarised in Table 7.
Fig. 14: Comparison of %C in control sample and %C analyses
(a) Graphite
0
1
2
3
4
5
6
7
8
9
10
11
12
13
14
15
16
17
0 2 4 6 8 10 12 14 16
%C in sample, calculated
%C
Graphite %Total C %C in Graphite Mix Analyses by UIS

37
(b) Coal
0
1
2
3
4
5
6
7
8
9
10
11
12
13
14
15
16
17
18
19
20
21
22
23
24
25
0 2 4 6 8 10 12 14 16 18 20 22
%FC in sample, calculated
%C
%C in Coal Mix Analyses by UIS Coal %FC Calculated Coal %Total C Calculated
Table 7: Comparison of Forms of Fe from analyses of control samples and input materials.
%C in Graphite-Pre-reduced ore mixture
Fe(total) Fe0 FeO Fe2O3
2.5 70.3 / 70.4* 0.24 / 0.18 73.6 / 74.0 19.0 / 18.0 5.0 68.5 / 68.7 0.24 / 0.23 71.7 / 71.9 18.5 / 18.0 10.0 64.8 / 64.9 0.23 / 0.24 67.8 / 68.0 17.5 / 16.8 15.0 61.2 / 60.9 0.21 / 0.28 64.0 / 63.6 16.5 / 15.9 %Fixed Carbon in Coal-Pre-reduced ore mixture
Fe(total) Fe0 FeO Fe2O3
5.0 66.5 / 67.7 0.23 / 0.25 69.6 / 71.6 18.0 / 16.8 10.0 60.9 / 62.4 0.21 / 0.29 63.6 / 62.4 16.5 / 19.4 15.0 55.2 / 55.3 0.19 / 0.42 57.6 / 57.8 15.1 / 14.2 20.0 49.6 / 49.6 0.17 / 0.45 51.7 / 52.9 13.6 / 11.4
* Input value/Analysed value
In the reacted sample each of the three horizontal portions can be associated with temperature data
measured throughout the experiment by the type-K thermocouples embedded within the sample, at
different heights. From the end-point analyses and temperatures a mass balance calculation is made for
each horizontal section of the sample (node). Summation of the heat transferred into the sample, as
calculated from the heat-mass balance, must correspond to the radiation network calculation that uses
only the sample surface temperature, and furnace tube heating zone temperatures as inputs. A
schematic representation of the sample nodes and thermocouple positions is shown in Fig. 15.

38
Fig. 15: Crucible, thermocouple positions and node divisions
To ensure that all the samples were consistently separated into the three horizontal portions, a sample
cutter-splitter was developed as shown in Fig. 16. This equipment enables the sample to be separated
into the required three portions even if the thermocouples are sintered into the sample, thus cutting
through the thermocouple sheath. To test repeatability of the sample cutting method, ten samples of
sand were divided into three nodes each and the resultant portions of silica sand nodes and fibre board
crucible were then weighed. The detailed mass measurements are summarised in Appendix V. The
crucible was vertically positioned in the sample cutter to attain the sample divisions so that the top two
nodes would respectively take up more of the total sample mass than the bottom node, as the bottom
node will be least reacted, and thus of less importance in chemical analyses. Also, the sample material
contracts as the sample reacts so that the sample division results in the top node material mass being
proportionately less of the total sample mass with increased sample reaction extent. The maximum
sample bed height contraction observed visually was 2 mm for coal-ore, coal-char and graphite-ore
samples, and maximum 5 mm contraction for coal-alumina samples. The average mass% distribution
for the top, middle and bottom nodes is 46, 33 and 21% with 95% confidence limits of 1.0, 0.3 and
0.9%.
30 m
m40
mm
46 m
m
25 mm
40 mm
10 mm
10 m
m15
mm
15 m
m
15 mm

39
Fig. 16: Sample Cutter-Splitter
Fig. 17, 18 and 19 a-c shows the heating zone temperatures, sample surface temperatures and internal
sample temperatures, as well as the product gas analyses for calibration experiments at furnace hot
zone setpoint temperatures of 1300°C, 1400°C and 1500°C. It is seen that the temperatures of the hot
zone, heating zone 1, and the heating zone 2 temperatures are within 20°C of each other. The hot zone
temperatures and heating zone 3 temperatures differ by as much as 82°C for 1305°C hot zone
temperatures, and the biggest difference is at the beginning of the experiment when heating zone 3
temperatures are lower. For each of the 1 second intervals at which temperatures were logged, the
radiation heat transferred to the sample was calculated with the hot zone (heating zone 1), second and
third heating zone temperatures, and the sample surface temperature measured by infrared pyrometer

40
as inputs to the radiation network. The weighted average radiation heat transfer value over the
experimental period was then used for comparison with the weighted average energy input to the
sample as calculated from the incremental heat-mass balance. Because of the one second interval
logging of temperature values, the weighted average radiation heat transfer value and the average
radiation heat transfer value is the same.
For samples 1300A and 1300B the heating zone 1 temperature values were scattered due to a loose
connection to the logger. This temperature corresponds to the hot zone temperature of the furnace, and
is therefore close to the controller set point, as is seen for the 1400C, 1400D, 1500E and 1500F
samples in Fig. 18 (a) and 19 (a). The scatter values below 1300°C were filtered out, and the removed
scatter values were then replaced with the average of the values that remained after the filtering step.
These values are shown in Fig. 17 (a).

41
Fig. 17: Calibration Measurements at 1300°C Hot Zone Temperature
(a) Heating Zone Temperatures (1300A)
(a) Heating Zone Temperatures (1300B)
1200
1205
1210
1215
1220
1225
1230
1235
1240
1245
1250
1255
1260
1265
1270
1275
1280
1285
1290
1295
1300
1305
1310
1315
0 60 120 180 240 300 360 420 480 540 600 660 720 780 840 900 960 1020 1080 1140 1200 1260 1320 1380 1440 1500 1560
Time (s)
Tem
pera
ture
(°C
)
Heating Zone 2 Heating Zone 3 Heating Zone 1 Sample lowered
1200
1205
1210
1215
1220
1225
1230
1235
1240
1245
1250
1255
1260
1265
1270
1275
1280
1285
1290
1295
1300
1305
1310
1315
0 60 120 180 240 300 360 420 480 540 600 660 720 780 840 900 960 1020 1080 1140 1200 1260 1320 1380 1440 1500 1560
Time (s)
Tem
pera
ture
(°C
)
Heating Zone 1 Heating Zone 2 Heating Zone 3 Sample lowered

42
(b) Sample Temperatures (1300A)
(b) Sample Temperatures (1300B)
0
50
100
150
200
250
300
350
400
450
500
550
600
650
700
750
800
850
900
950
1000
1050
1100
1150
1200
0 60 120 180 240 300 360 420 480 540 600 660 720 780 840 900 960 1020 1080 1140 1200 1260 1320 1380 1440 1500 1560
Time (s)
Tem
pera
ture
(°C
)
-400
-380
-360
-340
-320
-300
-280
-260
-240
-220
-200
-180
-160
-140
-120
-100
-80
-60
-40
-20
0
kW/m
^2 in
to s
ampl
e
4 mm 10 mm 20 mm 30 mm Pyrometer Real T_Surface (°C) kW/m^2 Sample lowered
0
50
100
150
200
250
300
350
400
450
500
550
600
650
700
750
800
850
900
950
1000
1050
1100
1150
1200
0 60 120 180 240 300 360 420 480 540 600 660 720 780 840 900 960 1020 1080 1140 1200 1260 1320 1380 1440 1500 1560
Time (s)
Tem
pera
ture
(°C
)
-400
-380
-360
-340
-320
-300
-280
-260
-240
-220
-200
-180
-160
-140
-120
-100
-80
-60
-40
-20
0
kW/m
^2 in
to s
ampl
e su
rfac
e
4 mm 10 mm 20 mm 30 mm Pyrometer Real T_Surface (°C) kW/m^2 Sample lowered

43
(c) Product Gas Analyses (1300A)
(c) Product Gas Analyses (1300B)
0
1
2
3
4
5
6
7
8
9
10
11
12
13
14
15
16
17
18
19
20
0 300 600 900 1200 1500 1800 2100 2400 2700 3000 3300Time (s)
Vol%
0
10
20
30
40
50
60
70
80
90
100
Vol%
Ar
Carbon Dioxide Methane Hydrogen Water-DM Carbon Monoxide Argon
0
1
2
3
4
5
6
7
8
9
10
11
12
13
14
15
16
17
18
19
20
0 300 600 900 1200 1500 1800 2100 2400 2700 3000 3300
Time (s)
Vol%
0
10
20
30
40
50
60
70
80
90
100
Vol%
Ar
Carbon Dioxide Methane Hydrogen Water-DM Carbon Monoxide Sample lowered Argon

44
Fig. 18: Calibration Measurements at 1400°C Hot Zone Temperature
(a) Heating Zone Temperatures (1400C)
(a) Heating Zone Temperatures (1400D)
1300
1305
1310
1315
1320
1325
1330
1335
1340
1345
1350
1355
1360
1365
1370
1375
1380
1385
1390
1395
1400
1405
1410
1415
0 60 120 180 240 300 360 420 480 540 600 660 720 780 840 900 960
Time (s)
Tem
pera
ture
(°C
)Heating Zone 1 Heating Zone 2 Heating Zone 3 Sample lowered
1300
1305
1310
1315
1320
1325
1330
1335
1340
1345
1350
1355
1360
1365
1370
1375
1380
1385
1390
1395
1400
1405
1410
1415
0 60 120 180 240 300 360 420 480 540 600 660 720 780 840 900 960
Time (s)
Tem
pera
ture
(°C
)
Heating Zone 1 Heating Zone 2 Heating Zone 3 Sample lowered

45
(b) Sample Temperatures (1400C)
(b) Sample Temperatures (1400D)
0
50
100
150
200
250
300
350
400
450
500
550
600
650
700
750
800
850
900
950
1000
1050
1100
1150
1200
0 60 120 180 240 300 360 420 480 540 600 660 720 780 840 900 960
Time (s)
Tem
pera
ture
(°C
)
-400
-380
-360
-340
-320
-300
-280
-260
-240
-220
-200
-180
-160
-140
-120
-100
-80
-60
-40
-20
0
kW/m
^2 in
to s
ampl
e
4 mm 10 mm 20 mm 30 mm Pyrometer Real T_Surface (°C) kW/m^2 Sample lowered
0
50
100
150
200
250
300
350
400
450
500
550
600
650
700
750
800
850
900
950
1000
1050
1100
1150
1200
0 60 120 180 240 300 360 420 480 540 600 660 720 780 840 900 960
Time (s)
Tem
pera
ture
(°C
)
-400
-380
-360
-340
-320
-300
-280
-260
-240
-220
-200
-180
-160
-140
-120
-100
-80
-60
-40
-20
0
kW/m
^2 in
to s
ampl
e
4 mm 10 mm 20 mm 30 mm Pyrometer Real T_Surface (°C) Sample lowered
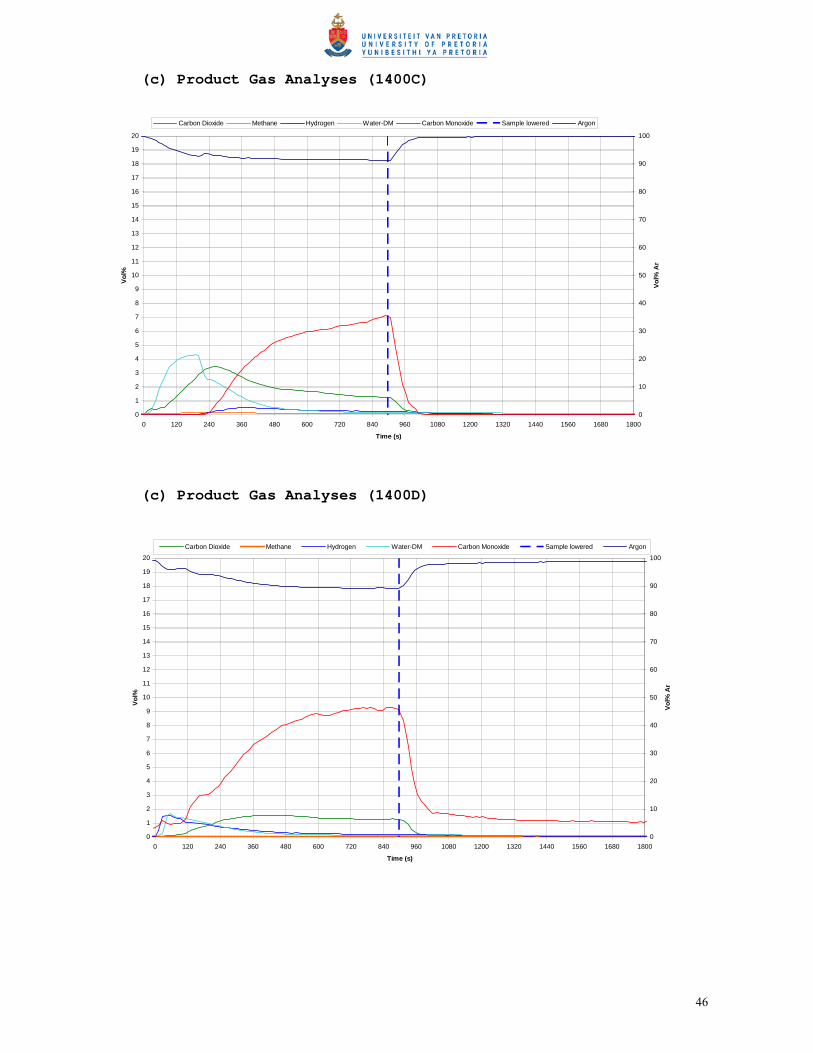
46
(c) Product Gas Analyses (1400C)
(c) Product Gas Analyses (1400D)
0
1
2
3
4
5
6
7
8
9
10
11
12
13
14
15
16
17
18
19
20
0 120 240 360 480 600 720 840 960 1080 1200 1320 1440 1560 1680 1800
Time (s)
Vol%
0
10
20
30
40
50
60
70
80
90
100
Vol%
Ar
Carbon Dioxide Methane Hydrogen Water-DM Carbon Monoxide Sample lowered Argon
0
1
2
3
4
5
6
7
8
9
10
11
12
13
14
15
16
17
18
19
20
0 120 240 360 480 600 720 840 960 1080 1200 1320 1440 1560 1680 1800
Time (s)
Vol%
0
10
20
30
40
50
60
70
80
90
100
Vol%
Ar
Carbon Dioxide Methane Hydrogen Water-DM Carbon Monoxide Sample lowered Argon

47
Fig. 19: Calibration Measurements at 1500°C Hot Zone Temperature
(a) Heating Zone Temperatures (1500E)
(a) Heating Zone Temperatures (1500F)
1400
1405
1410
1415
1420
1425
1430
1435
1440
1445
1450
1455
1460
1465
1470
1475
1480
1485
1490
1495
1500
1505
1510
1515
0 30 60 90 120 150 180 210 240 270
Time (s)
Tem
pera
ture
(°C
)Heating Zone 1 Heating Zone 2 Heating Zone 3 Sample lowered
1400
1405
1410
1415
1420
1425
1430
1435
1440
1445
1450
1455
1460
1465
1470
1475
1480
1485
1490
1495
1500
1505
1510
1515
0 30 60 90 120 150 180 210 240 270
Time (s)
Tem
pera
ture
(°C
)
Heating Zone 1 Heating Zone 2 Heating Zone 3 Sample lowered

48
(b) Sample Temperatures (1500E)
(b) Sample Temperatures (1500F)
0
50
100
150
200
250
300
350
400
450
500
550
600
650
700
750
800
850
900
950
1000
1050
1100
1150
1200
0 30 60 90 120 150 180 210 240 270
Time (s)
Tem
pera
ture
(°C
)
-400
-380
-360
-340
-320
-300
-280
-260
-240
-220
-200
-180
-160
-140
-120
-100
-80
-60
-40
-20
0
kW/m
^2 in
to s
ampl
e
4 mm 10 mm 20 mm 30 mm Pyrometer Real T_Surface (°C) kW/m^2 Sample lowered
0
50
100
150
200
250
300
350
400
450
500
550
600
650
700
750
800
850
900
950
1000
1050
1100
1150
1200
0 30 60 90 120 150 180 210 240 270
Time (s)
Tem
pera
ture
(°C
)
-400
-380
-360
-340
-320
-300
-280
-260
-240
-220
-200
-180
-160
-140
-120
-100
-80
-60
-40
-20
0
kW/m
^2 in
to s
ampl
e
4 mm 10 mm 20 mm 30 mm Pyrometer Real T_Surface (°C) kW/m^2 Sample lowered

49
(c) Product Gas Analyses (1500E)
(c) Product Gas Analyses (1500F)
0
1
2
3
4
5
6
7
8
9
10
11
12
13
14
15
16
17
18
19
20
0 30 60 90 120 150 180 210 240 270 300 330 360 390 420 450 480 510 540
Time (s)
Vol%
0
10
20
30
40
50
60
70
80
90
100
Vol%
Ar
Carbon Dioxide Methane Hydrogen Water-DM Carbon Monoxide Sample lowered Argon
0
1
2
3
4
5
6
7
8
9
10
11
12
13
14
15
16
17
18
19
20
0 30 60 90 120 150 180 210 240 270 300 330 360 390 420 450 480 510 540
Time (s)
Vol%
0
10
20
30
40
50
60
70
80
90
100
Vol%
Ar
Carbon Dioxide Methane Hydrogen Water-DM Carbon Monoxide Sample lowered Argon

50
To indicate the sensitivity of the radiation network calculation (of heat transfer to the sample surface),
to changes in conditions, the individual measurement parameters were changed and the effect noted.
This is shown in Table 8. The measurements for the calibration sample 1400C, reacted at 1400°C
furnace temperature, were used as basis for the sensitivity calculations. It is seem from Table 8 that
the sample surface emissivity used in the calculation has the biggest influence on the radiation
network calculation. For the measured parameters the sample surface temperature and the heating zone
3 temperatures have the biggest effect on the calculated heat transferred to the sample surface. If the
correct emissivity value of 0.90 is used for the sample surface, the remaining effect of possible errors
in the temperature measurements provides an estimated maximum error of ±19 kW/m2 for the heat
transfer calculation.
Table 8: Radiation network calculation sensitivities
Parameter Parameter Value Change
Parameter Basis Value kW/m2 *∆kW/m2
Basis ---- ---- -167 0
Measured sample surface temperature (surface 4) +15°C 1093°C -159 -8
Measured sample surface temperature (surface 4) -15°C 1093°C -176 9
Heating zone No. 1 temperature (surface 1) +15°C 1409°C -168 +1
Heating zone No. 1 temperature (surface 1) -15°C 1409°C -167 0
Heating zone No. 2 temperature (surface 5) +15°C 1405°C -170 +3
Heating zone No. 2 temperature (surface 5) -15°C 1405°C -165 -2
Heating zone No. 3 temperature (surface 6) +15°C 1346°C -177 +10
Heating zone No. 3 temperature (surface 6) -15°C 1346°C -158 -9
Furnace tube emissivity: 1ε , 5ε , 6ε +0.10 0.68 -167 0
Furnace tube emissivity: 1ε , 5ε , 6ε -0.10 0.68 -168 +1
Sample surface emissivity 4ε +0.09 0.90 -191 +24
Sample surface emissivity 4ε -0.10 0.90 -141 -26
Bottom radiation shield emissivity 3ε +0.10 0.53 -167 0
Bottom radiation shield emissivity 3ε -0.10 0.53 -167 0
Top radiation shield emissivity 2ε +0.10 0.54 -167 0
Top radiation shield emissivity 2ε -0.10 0.54 -167 0
*∆kW/m2 = (Basis kW/m2) - (New kW/m2)
When the sample was cut into the three node sections some fibre board material carry over occurred.
The sample masses were corrected for this fibre board carry over by mass balance of the SiO2 and
Al2O3 in the sample, using the analyses of %SiO2 and %Al2O3 in the reacted samples, and
consequently the sample analyses were corrected for the fibreboard carry over as well. The details of

51
this calculation are shown in Appendix VII. The masses and analyses before and after the correction
are shown in Appendix VI. The end-point chemical analyses for the calibration samples, the corrected
sample node masses out and the end-point temperatures are summarised in Table 9.
Table 9: End-point data for calibration samples Furnace
Temperature (°C)
Sample Number
Sample Position
Node End Temperature
(°C)
*Node mass
out (g.)
*Fibre board mass
out (g.) *%C %Reduction
Top 1071 15.4 14.5 12.9 45.4
Middle 1030 15.4 4.2 13.2 25.5
1300
1300A
Bottom 974 10.7 12.9 15.1 23.9
Top 1051 18.2 11.2 12.4 38.8 Middle 1027 14.6 6.9 12.7 25.2
1300
1300B
Bottom 954 8.6 12.9 18.7 24.5
Top 1054 16.0 11.7 10.5 46.6
Middle 1071 15.1 7.3 13.5 25.6
1400
1400C
Bottom 874 9.5 13.4 18.0 24.7
Top 1077 15.1 12.1 12.2 54.8 Middle 1014 14.8 7.0 11.1 26.1
1400
1400D
Bottom 922 9.7 13.2 16.2 25.2
Top 909 18.7 11.8 16.8 31.4
Middle 268 15.4 6.9 12.2 21.2
1500
1500E
Bottom 206 9.1 13.6 13.9 23.3
Top 981 11.5 5.8 14.6 36.5 Middle 316 14.5 7.7 14.3 23.0
1500
1500F
Bottom 234 16.9 17.3 13.6 22.9 *Corrected for fibreboard carry-over
The assumptions made in the incremental mass-energy balance calculations are discussed below with
reference to Fig. 20 in which the reaction products are shown. For each time interval the reaction
extent and temperature of the solid material and gas products in each node are required.
Fig. 20: Crucible and sample material

52
• The sample mass out (on completion of reaction) and the mass Fe out were used in the mass
balance calculations. This is acceptable because the mass Fe in to mass Fe out ratio is close to
one, as expected and is shown in Appendix VI.
• The reduction extent over reaction time is stepwise linear. This linear trend is used to interpolate
the reduction extent between the initial input material reduction extent and the reduction extent
as analysed in the sample material after total reaction. The reduction extent at the end of each
time interval was calculated by re-proportioning of the forms of iron analysis of the input pre-
reduced ore material.
• The oxygen removed from the sample must be present in the product gas as CO or CO2. This
assumption is made based on no volatile content in the graphite used as reductant, and little H2
and H2O present in the product gas. The carbon balance must be closed by using a CO-CO2 gas
composition from each node to attain the %C calculated equal to that analysed in the reacted
node sample. Forms of Fe analyses of the reacted samples show the reduction extent in each
node, and from this information it is seen that the middle and bottom nodes do not show further
reduction progress from the initial reduction extent. Therefore, the CO and CO2 in the product
gas are generated from the top node only, and are taken to exit the sample at the top node
temperature. The mass of oxygen released to the product gas is calculated from the reduction
extent in the top node. The product gas %CO/(%CO+%CO2) ratio is then specified in the heat-
mass balance as equal to that at the end of each time interval in the total product gas analysis.
The %C remaining in the sample is then a result of the heat-mass balance calculation, and can be
compared with that analysed in the reacted sample.
• The total water measured in the product gas analysis is taken as part of the sample and released
with the rest of the product gas from the sample at the top node temperature. This assumption is
based on the chemical analyses done on the reacted material, which shows that most of the
reduction takes place in the top node. Water release from the sample over time was proportioned
according to the water content analysed in the product gas.
• The temperatures measured by the four thermocouples positioned in the material layer are
assigned to the three node segments as follows: the top node is at the end-point temperature
measured by the thermocouple positioned 10 mm from the sample surface; the middle node is at
the end-point temperature of the thermocouple which is 20 mm from the sample surface; and the
bottom node is at the end-point temperature of the thermocouple which is 30 mm from the
sample surface. It is seen from the sample temperature graphs in Fig. 17-19 (b) that the
thermocouple positioned 4 mm from the sample surface, for longer experiment times at 1300°C

53
and 1400°C, levels off and the thermocouple values are lower than that for the thermocouple at
10 mm and/or 20 mm from the sample surface. The material bed level lowers throughout the
experiment, so that the top thermocouple may not be covered by material at the end of the
experiment, and thus temperature values from the top thermocouple are not reliable towards the
end of the experiment. For the tests done at 1500°C a short reaction time was used because of
slag formation. For these two tests, the thermocouple positioned 10 mm from the sample surface
is much lower than the thermocouple positioned 4 mm from the sample surface. Therefore, the
latter temperature is used for the top node for these two samples reacted at 1500°C furnace
temperature.
• In the mass and energy balance several factors must be taken into account, besides the end-point
material temperatures discussed above. The heat transferred to the sample also heats up the
thermocouples embedded in the sample, as well as the crucible material. The masses for the
crucible material can be proportioned between the three nodes, using the mass measurements
made when the sample was cut into the three node portions. The thermocouple material must be
roughly estimated from mass measurements of alumina sheaths cut to the length of the
thermocouples embedded into the sample. The latter masses are small compared to that of the
crucible material, and were therefore not considered in the heat-mass balance. The crucible
material consists of 65% Al2O3 and 35% SiO2, and was considered to be mullite in the heat-mass
balance calculations.
• The other factor to take into account for the heat mass balance is the heat transferred to the Ar
carrier gas used. This is factored into the heat-mass balance by assuming that the Ar is heated to
the top node temperature. The Ar gas flow rate for each time increment was calculated by
proportioning the total Ar flow rate for each time increment.
The incremental heat-mass balance calculation sheets for sample 1400C are shown in Appendix VI.
The sensitivities of the above assumptions for sample 1400C are summarised in Table 10.
Comparison of the heat transfer values calculated from the heat-mass balance to that calculated in the
radiation network is shown in Table 11 and Fig. 21. Reduction extent for the top segment is shown in
Fig. 22. Comparison of the %C in the reacted sample with that analysed is shown in Fig. 23 a-c. The
data values in the figures are shown at the furnace temperatures offset by 5°C to facilitate clarity of the
graphs. It is seen that for the experiments at 1300°C and 1400°C furnace temperature the calculated
mass-heat balance kW/m2 values and those calculated from the radiation network correspond well.
However, for the experiment 1500F reacted at 1500°C there is a difference of 22% of the value
calculated from the incremental heat-mass balance. From Fig. 23 a-c it is seen that the calculated and

54
analysed %C remaining in the sample differ by a maximum of 7% for the top node of sample 1500F.
In terms of the total initial mass carbon input of 3.0 g into the sample top node, 7% is 0.2 g.
Table 10: Heat-mass balance sensitivities for sample 1400C
Condition kW/m2 calculated from heat-mass
balance
kW/m2 calculated from
radiation network
+Ar; +FB, +H2O -163 -167
+Ar; +FB, -H2O -158 ---
+Ar; -FB, +H2O -109 ---
-Ar; +FB, +H2O -131 ---
+Ar at 500°C; +FB, +H2O -146 ---
+Ar; +FB, +H2O, 100%CO in CO-CO2 product gas -167 ---
+Ar; +FB, +H2O, 100%CO2 in CO-CO2 product gas -159 ---
+Ar; +FB, +H2O, sample solids temperatures +50°C -171 ---
+Ar; +FB, +H2O, sample solids temperatures -50°C -155 --- +Ar = Argon carrier gas included in heat-mass balance +FB = Fibreboard crucible material included in heat-mass balance +H2O = Water in product gas analysis included in heat-mass balance
Table 11: Heat transfer values comparison
Sample No. kW/m2 calculated from incremental heat-mass balance
kW/m2 calculated from radiation
network
*Difference in kW/m2
Difference as % of kW/m2 calculated from
incremental heat-mass balance
1300A -110 -118 8 7
1300B -107 -118 11 10
1400C -163 -167 4 2
1400D -166 -166 0 0
1500E -245 -245 0 0
1500F -200 -243 43 22 *Difference in kW/m2 = (kW/m2 calculated from incremental heat-mass balance) - (kW/m2 calculated from radiation network)

55
Fig. 21: Heat transferred to sample
(Experimental period at 1500°C furnace temperature is 4.5 minutes only)
Radiation Network = weighted average kW/m2 heat transferred to sample as calculated from radiation network
M & H Balance = weighted average kW/m2 heat transferred to sample as calculated from incremental heat – mass balance
Fig. 22: %Reduction in top segment
(Experimental period at 1500°C furnace temperature is 4.5 minutes only)
252729313335373941434547495153555759616365
1275
1300
1325
1350
1375
1400
1425
1450
1475
1500
1525
Furnace Temperature (°C)
%R
educ
tion
1300A - top 1300B - top 1400C - top 1400D - top 1500E - top 1500F - top
-300-290-280-270-260-250-240-230-220-210-200-190-180-170-160-150-140-130-120-110-100-90-80-70
1275
1300
1325
1350
1375
1400
1425
1450
1475
1500
1525
Furnace Temperature (°C)
kW/m
2 into
sam
ple
Radiation Network - 1300A
Radiation Network - 1300B
Radiation Network - 1400C
Radiation Network - 1400D
Radiation Network - 1500E
Radiation Network - 1500F
M & H Balance [Incl. FB, Ar, H2O] - 1300B
M & H Balance [Incl. FB, Ar, H2O] - 1400C
M & H Balance [Incl. FB, Ar, H2O] - 1400D
M & H Balance [Incl. FB, Ar, H2O] - 1400E
M & H Balance [Incl. FB, Ar, H2O] - 1400F
M & H Balance [Incl. FB, Ar, H2O] - 1300A

56
Fig. 23: %C analysed vs. calculated from heat-mass balance
(a) Top node
(b) Middle node
0123456789
10111213141516171819202122
1250 1300 1350 1400 1450 1500 1550
Furnace Temperature (°C)
%C
arbo
n1300A M&H 1300B M&H 1400C M&H 1400D M&H1500E M&H 1500F M&H 1300A %C Analysed 1300B %C Analysed1400C %C Analysed 1400D %C Analysed 1500E %C Analysed 1500F %C Analysed
0123456789
10111213141516171819202122
1250 1300 1350 1400 1450 1500 1550
Furnace Temperature (°C)
%C
arbo
n
1300A M&H 1300B M&H 1400C M&H 1400D M&H1500E M&H 1500F M&H 1300A %C Analysed 1300B %C Analysed1400C %C Analysed 1400D %C Analysed 1500E %C Analysed 1500F %C Analysed

57
(c) Bottom node
2.3. Conclusion The experimental set-up is appropriate for quantifying radiation heat transfer to samples reacted non-
isothermally in this set-up. The heat-mass balance calculations and the radiation heat transfer to the
sample, as calculated from the radiation network, correspond within the radiation network calculation
uncertainty for samples reacted at 1300°C and 1400°C furnace temperatures. For samples reacted at
1500°C furnace temperature, the difference is larger due to the short reaction time and resultant small
reaction extent achieved in these samples. The sample cutter-splitter allows for the repeatable division
of the reacted sample into three node portions for further chemical analysis.
0123456789
10111213141516171819202122
1250 1300 1350 1400 1450 1500 1550
Furnace Temperature (°C)
%C
arbo
n
1300A M&H 1300B M&H 1400C M&H 1400D M&H1500E M&H 1500F M&H 1300A %C Analysed 1300B %C Analysed1400C %C Analysed 1400D %C Analysed 1500E %C Analysed 1500F %C Analysed

58
CHAPTER III
RESULTS AND DISCUSSION
3.1. Introduction An experimental set-up was constructed to heat a material layer sample uni-directionally from the
sample surface, to study heat transfer to and within the layer. Large differentials between the sample
surface temperature and bed temperatures, at increasing depth from the sample surface, show
conduction heat transfer control within the layer of material. Increased reduction extent for decreased
material layer thickness would also confirm conduction heat transfer control within the material layer.
Large temperature differentials between the sample surface and the furnace heating surfaces would
indicate radiation heat transfer control. Also, increased reduction extent achieved for increased heat
transfer rate would confirm radiation heat transfer control. These ideas were tested experimentally,
and the results are reported below.
Mixtures of coal and ore were reacted at heating zone 1 temperatures of 1300°C, 1400°C and 1500°C
to measure the extent of reaction at increased heat input into the sample. Sishen fines and Eikeboom
coal of -850 +425 µm were used as input materials for the bulk of the experiments. A molar ratio of
fixed carbon to reducible oxygen in ore of 0.97 was used. The input material chemical compositions
are shown in Appendix IV. To test the effect of different particle sizes, ore and coal fractions of -425
+300 µm and -2000 +1400 µm were also used. The material layer thickness of 40 mm was used as
basis, and a series of 16 mm material layer thickness was tested for comparison. To determine the
devolatilisation components of the coal, the ore portion in the sample mixture was replaced by
alumina particles of the same particle size as the ore. The coal-alumina samples were then reacted to
complete devolatilisation. The radiation network calculation from Chapter II was used to calculate
radiation heat transfer to the sample surface at one second intervals. The reacted samples were
sectioned into three parts, as shown in Chapter II, and analysed for reduction extent and carbon
content.
The product gas was analysed by mass spectrometer. As an example the data set of sample
temperatures, furnace heating zone temperatures and product gas analyses measured in each
experiment is shown in Fig. 24 for the 40 mm layer thickness sample, of coal-ore mixture, reacted for
15 minutes at 1400°C heating zone 1 temperature. Similar sets of data for all the samples reacted are
shown in Appendix VIII in graphical form. The iron balance for the samples was calculated and the
*Reducible oxygen is the oxygen bound to the total Fe analysed in the iron ore, expressed as Fe2O3

59
ratio of iron into the sample to iron out of the reacted sample varied from 0.99 to 1.08. These values
are summarised in Appendix XI, as are sample analyses and total product gas analyses.
The total mass loss according to the product gas analyses was compared to the sample mass weighed
after the sample was split into three sections, and these measurements corrected for fiberboard crucible
material carry over. The values are summarised in Appendix XI, and graphs are shown in Appendix
X. In most instances the difference in mass loss as percentage of the mass loss calculated from the
weighed sample mass of the reacted sample is within 30% of the sample mass loss calculated from the
product gas analysis. The biggest difference of 100% was for the 40 mm sample layer with fine ore
fraction reacted for 9 minutes at 3.13 g mass loss.
The mass of carbon reacted, as calculated from %C analyses of the reacted material, was similarly
compared to that calculated from the product gas analyses. Graphs of mass carbon remaining as
calculated from these two information sources are shown in graphs in Appendix X. The analysis
uncertainty for total carbon analysis in the reacted ore-coal mixture, ±1.5%C as shown in Fig. 14 (b),
is indicated by error bars in the graphs. With the exception of the 16 mm sample layer reacted for 15
minutes the difference in mass carbon remaining in the reacted sample, expressed as percentage of the
mass of carbon remaining as calculated from the reacted sample carbon analysis, is within 20% of the
mass carbon remaining calculated from the product gas analysis. The 57% percentage difference for
the 16 mm sample layer reacted for 15 minutes was 0.70 g carbon of 1.20 g carbon calculated from the
carbon analysis on the reacted sample.
Similarly the mass oxygen released in the product gas analyses was compared to the mass oxygen
reduced from the ore as calculated from the forms of Fe analyses. The uncertainty in the mass oxygen
release calculation from the forms of Fe analyses is that the oxygen released from coal is not included
in the calculation. This uncertainty is shown as error bars in the graphs in Appendix X. Without
taking the error estimation into account the maximum difference in mass oxygen released form the
sample, as percentage of the mass oxygen released as calculated from the forms of Fe analyses, is
78%. This percentage difference is 0.55 g oxygen of 0.70 g oxygen released into the product gas for a
16 mm sample layer reacted for 3 minutes, and 1.64 g oxygen of 2.09 g oxygen released into the
product gas for a 40 mm sample layer with fine ore fraction reacted for 9 minutes.
The product gas analyses were used to calculate the CO/CO2 ratios in the product gas. These values
were compared to the equilibrium gas ratios for the FeO/Fe and the C/CO2 equilibrium to indicate
which reaction was more important in the reaction system. The %C and forms of Fe analyses in the
reacted samples were used in reaction extent calculations.

60
Fig. 24: Temperatures and product gas analyses for 40 mm layer thickness of coal-ore mixture
reacted at 1400°C for 15 minutes.
(a) Sample Temperatures
(b) Product gas analyses
050
100150200250300350400450500550600650700750800850900950
1000105011001150120012501300
0 60 120 180 240 300 360 420 480 540 600 660 720 780 840 900 960
Time (s)
Tem
pera
ture
(°C
)
-300
-280
-260
-240
-220
-200
-180
-160
-140
-120
-100
-80
-60
-40
-20
0
kW/m
^2 in
to s
ampl
e
4 mm 10 mm 20 mm 30 mm Pyrometer Real T_Surface (°C) kW/m^2 Sample lowered
0
1
2
3
4
5
6
7
8
9
10
11
12
13
14
15
16
17
18
19
20
0 60 120 180 240 300 360 420 480 540 600 660 720 780 840 900 960 1020 1080 1140 1200 1260 1320 1380 1440 1500
Time (s)
Vol%
0
10
20
30
40
50
60
70
80
90
100
Vol%
Ar
Carbon Dioxide Methane Hydrogen Water-DM Carbon Monoxide Argon

61
(c) Furnace heating zone temperatures
3.2. Effect of Increased Heat Transfer Radiation heat transfer to the sample surface was calculated from the radiation network using the
sample surface temperature and the furnace heating zone temperatures as inputs, at one second
intervals. As a comparative example of increased heat transfer achieved with increased furnace
temperature, the data for 40 mm sample layers reacted for 15 minutes at furnace heating zone 1
temperatures of 1300, 1400 and 1500°C is shown here. The sample surface temperatures, corrected for
pyrometer emissivity setting and view glass transmissivity, are shown in Fig. 25. The incremental
radiation heat transfer values calculated for each second of temperature data logged are shown in Fig.
26. The heating zone temperatures for these three experiments are shown in Fig. 27 (a)-(c). Increased
furnace temperatures result in increased radiation heat transfer to the sample surface and the heat
transfer rate plot follows the sample surface temperature plot closely, indicating the strong
interrelation between sample surface temperature and heat transferred. The average radiation heat
transfer values over the reaction period for each sample are shown in Table 12. These values are
equivalent to weighted average heat transfer values because the incremental radiation heat transfer
values were calculated at one second intervals.
Comparison of the heap surface temperatures shown in Fig. 25 with the heating zone temperatures
shown in Fig. 27 shows that a large temperature differential persists between the sample surface
temperature and each of the heating zone temperatures.
1320
1325
1330
1335
1340
1345
1350
1355
1360
1365
1370
1375
1380
1385
1390
1395
1400
1405
1410
1415
0 60 120 180 240 300 360 420 480 540 600 660 720 780 840 900 960 1020 1080 1140 1200 1260 1320 1380 1440 1500
Time (s)
Tem
pera
ture
(°C
)
Heating Zone 1 Heating Zone 2 Heating Zone 3 Sample lowered
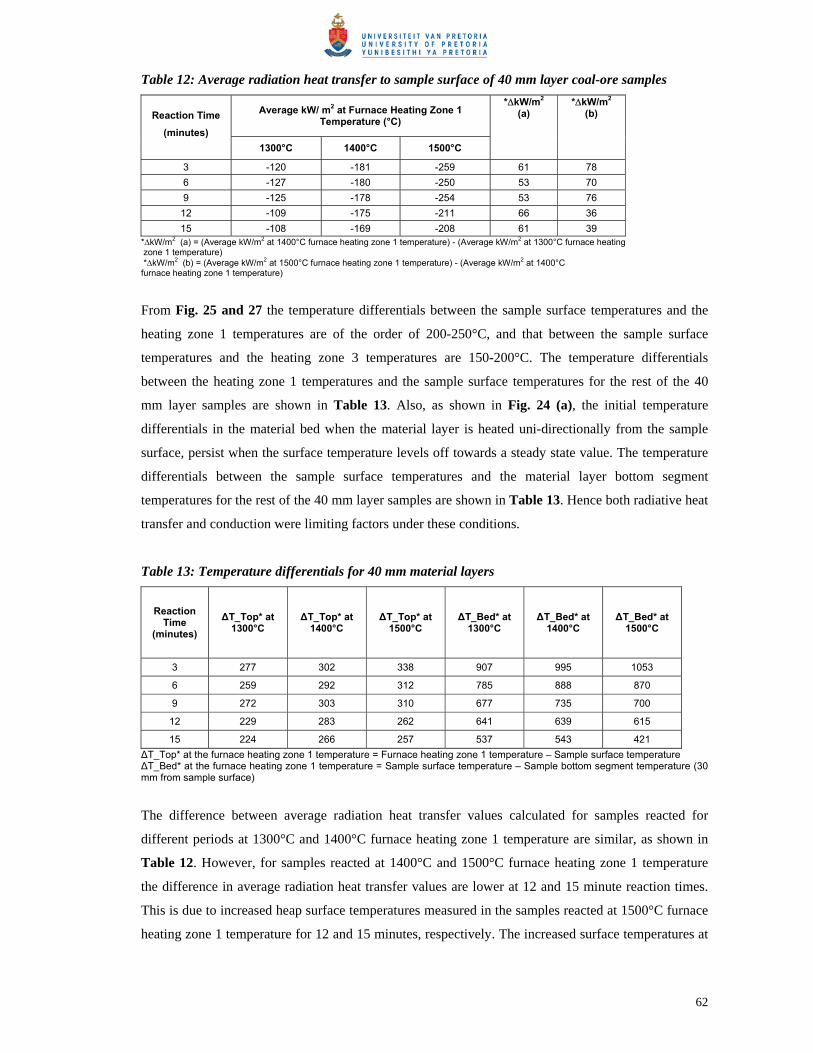
62
Table 12: Average radiation heat transfer to sample surface of 40 mm layer coal-ore samples
Average kW/ m2 at Furnace Heating Zone 1 Temperature (°C) Reaction Time
(minutes) 1300°C 1400°C 1500°C
*∆kW/m2 (a)
*∆kW/m2 (b)
3 -120 -181 -259 61 78 6 -127 -180 -250 53 70 9 -125 -178 -254 53 76
12 -109 -175 -211 66 36 15 -108 -169 -208 61 39
*∆kW/m2 (a) = (Average kW/m2 at 1400°C furnace heating zone 1 temperature) - (Average kW/m2 at 1300°C furnace heating zone 1 temperature) *∆kW/m2 (b) = (Average kW/m2 at 1500°C furnace heating zone 1 temperature) - (Average kW/m2 at 1400°C furnace heating zone 1 temperature)
From Fig. 25 and 27 the temperature differentials between the sample surface temperatures and the
heating zone 1 temperatures are of the order of 200-250°C, and that between the sample surface
temperatures and the heating zone 3 temperatures are 150-200°C. The temperature differentials
between the heating zone 1 temperatures and the sample surface temperatures for the rest of the 40
mm layer samples are shown in Table 13. Also, as shown in Fig. 24 (a), the initial temperature
differentials in the material bed when the material layer is heated uni-directionally from the sample
surface, persist when the surface temperature levels off towards a steady state value. The temperature
differentials between the sample surface temperatures and the material layer bottom segment
temperatures for the rest of the 40 mm layer samples are shown in Table 13. Hence both radiative heat
transfer and conduction were limiting factors under these conditions.
Table 13: Temperature differentials for 40 mm material layers
Reaction Time
(minutes) ∆T_Top* at
1300°C ∆T_Top* at
1400°C ∆T_Top* at
1500°C ∆T_Bed* at
1300°C ∆T_Bed* at
1400°C ∆T_Bed* at
1500°C
3 277 302 338 907 995 1053
6 259 292 312 785 888 870
9 272 303 310 677 735 700
12 229 283 262 641 639 615
15 224 266 257 537 543 421 ∆T_Top* at the furnace heating zone 1 temperature = Furnace heating zone 1 temperature – Sample surface temperature ∆T_Bed* at the furnace heating zone 1 temperature = Sample surface temperature – Sample bottom segment temperature (30 mm from sample surface)
The difference between average radiation heat transfer values calculated for samples reacted for
different periods at 1300°C and 1400°C furnace heating zone 1 temperature are similar, as shown in
Table 12. However, for samples reacted at 1400°C and 1500°C furnace heating zone 1 temperature
the difference in average radiation heat transfer values are lower at 12 and 15 minute reaction times.
This is due to increased heap surface temperatures measured in the samples reacted at 1500°C furnace
heating zone 1 temperature for 12 and 15 minutes, respectively. The increased surface temperatures at

63
12 and 15 minutes reaction time can be explained by decreased reduction rate at increased reduction
extent in the top node, 70% reduction at 12 minutes reaction time and 76% reduction at 15 minutes
reaction time, resulting in decreased energy utilisation for reduction and consequently increased
energy utilisation for heating the material bed.
Fig. 25: Sample Surface Temperatures at different furnace heating zone temperatures for 40 mm
coal-ore samples reacted for 15 minutes
(Corrected for pyrometer emissivity setting and view glass transmissivity)
700
750
800
850
900
950
1000
1050
1100
1150
1200
1250
1300
1350
0 60 120 180 240 300 360 420 480 540 600 660 720 780 840 900
Time (seconds)
Sam
ple
Surf
ace
Tem
pera
ture
(°C
)
Heating zone 1 temperature = 1400°C Heating zone 1 temperature = 1300°C
Heating zone 1 temperature = 1500°C Sample lowered

64
Fig. 26: Radiation heat transfer to sample surface at different furnace heating zone 1 temperatures
for 40 mm coal-ore samples reacted for 15 minutes
Fig. 27: Heating zone temperatures at different furnace heating zone 1 temperatures for 40 mm
coal-ore samples reacted for 15 minutes
(a) Heating zone 1 temperatures
-400
-380
-360
-340
-320
-300
-280
-260
-240
-220
-200
-180
-160
-140
-120
-100
-80
-60
-40
-20
0
0 60 120 180 240 300 360 420 480 540 600 660 720 780 840 900
Time (seconds)
Incr
emen
tal r
adia
tion
heat
tran
sfer
to s
ampl
e su
rfac
e (k
W/m
2 )Heating zone 1 temperature = 1400°C Heating zone 1 temperature = 1300°CHeating zone 1 temperature = 1500°C Sample lowered
1270
1290
1310
1330
1350
1370
1390
1410
1430
1450
1470
1490
1510
1530
1550
0 60 120 180 240 300 360 420 480 540 600 660 720 780 840 900 960 1020 1080 1140 1200
Time (seconds)
Hea
ting
zone
1 T
empe
ratu
re (°
C)
Heating zone 1 temperature = 1400°C Heating zone 1 temperature = 1300°C
Heating zone 1 temperature = 1500°C Sample lowered

65
(b) Heating zone 2 temperatures
(c) Heating zone 3 temperatures
1270
1290
1310
1330
1350
1370
1390
1410
1430
1450
1470
1490
1510
1530
1550
0 60 120 180 240 300 360 420 480 540 600 660 720 780 840 900 960 1020 1080 1140 1200
Time (seconds)
Hea
ting
zone
2 T
empe
ratu
re (°
C)
Heating zone 1 temperature = 1400°C Heating zone 1 temperature = 1300°C
Heating zone 1 temperature = 1500°C Sample lowered
1190
1210
1230
1250
1270
1290
1310
1330
1350
1370
1390
1410
1430
1450
1470
1490
0 60 120 180 240 300 360 420 480 540 600 660 720 780 840 900 960 1020 1080 1140 1200
Time (seconds)
Hea
ting
zone
3 T
empe
ratu
re (°
C)
Heating zone 1 temperature = 1400°C Heating zone 1 temperature = 1300°C
Heating zone 1 temperature = 1500°C Sample lowered

66
Fig. 28 (a) and (b) show the reduction extent and carbon consumption for the whole sample. Carbon
consumption and reduction extent per sample segment, in Fig. 29 and Fig. 30, indicate that very little
reduction takes place in the middle and bottom segments of the sample. The reduction extent for each
sample segment was calculated from the forms of iron analyses of the reacted material of the particular
segment. Because little reduction took place in the middle and bottom segments the carbon
consumption values in these segments are erratic, compared to that in the top segment. For ten of the
segment analyses the carbon consumption values for the middle and bottom segments are negative by
0.03 to 0.27 g carbon, compared with 1.6 and 1.8 g C input to the middle and bottom segments.
Fig. 28 (a): Composite reduction extent
Fig. 28 (b): Composite carbon consumption
0
5
10
15
20
25
30
35
40
45
50
55
60
0 2 4 6 8 10 12 14 16
Time (minutes)
Com
posi
te %
Car
bon
reac
ted
in s
ampl
e
1400°C; 40 mm layer thickness
1300°C; 40 mm layer thickness
1500°C; 40 mm layer thickness
0
5
10
15
20
25
30
35
40
45
50
55
60
0 2 4 6 8 10 12 14 16
Time (minutes)
Com
posi
te %
Red
uctio
n
1400°C; 40 mm layerthickness
1500°C; 40 mm layerthickness
1300°C; 40 mm layerthickness
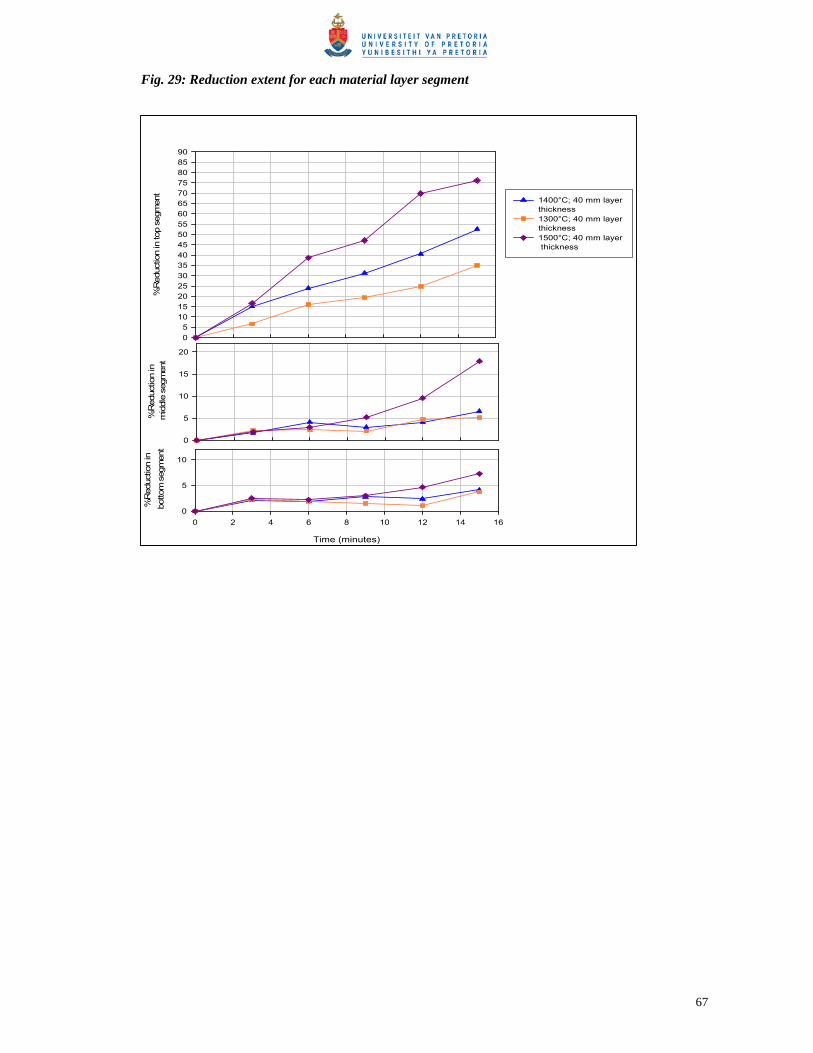
67
Fig. 29: Reduction extent for each material layer segment
%R
educ
tion
in to
p se
gmen
t
05
1015202530354045505560657075808590
1400°C; 40 mm layer thickness1300°C; 40 mm layer thickness1500°C; 40 mm layer thickness
%R
educ
tion
in m
iddl
e se
gmen
t
0
5
10
15
20
Time (minutes)
0 2 4 6 8 10 12 14 16
%R
educ
tion
in b
otto
m s
egm
ent
0
5
10

68
Fig. 30: Carbon consumption for each material layer segment
The temperature in each material layer segment at the end of the reaction period is shown in Fig. 31.
At three minutes reaction time the material segment temperatures are similar, and up to nine minutes
reaction time the material segment temperatures at 1300°C and 1400°C heating zone one temperatures
are similar. Beyond three minutes reaction time material segment temperatures at 1500°C heating zone
one temperature are distinctly higher compared to the rest of the segment temperatures, for the same
reaction time.
%C
arbo
n re
acte
d in
top
segm
ent
05
1015202530354045505560657075808590
1400°C; 40 mm layer thickness1300°C; 40 mm layer thickness1500°C; 40 mm layer thickness
%C
arbo
n re
acte
d in
mid
dle
segm
ent
0
5
10
15
20
25
30
Time (minutes)
0 2 4 6 8 10 12 14 16
%C
arbo
n re
acte
d in
bot
tom
seg
men
t
0
5
10
15
20
25
30

69
Fig. 31: Temperature for each material layer segment at the end of the reaction time
In addition to the presence of large persistent temperature differentials between the sample surface and
the heating zones, as well as temperature differentials within the material layer, another indicator of
heat transfer control is increased reaction rate attained at increased heat transfer rate. This is shown in
Fig. 32 below.
Tem
pera
ture
(°C
) in
top
segm
ent
0
100
200
300
400
500
600
700
800
900
1000
1100
1200
1400°C; 40 mm layer thickness1300°C; 40 mm layer thickness1500°C; 40 mm layer thickness
Tem
pera
ture
(°C
) in
mid
dle
segm
ent
0
100
200
300
400
500
600
700
800
900
1000
1100
Time (minutes)
0 2 4 6 8 10 12 14 16
Tem
pera
ture
(°C
) in
botto
m s
egm
ent
0
100
200
300
400
500
600
700
800
900

70
Fig. 32: Total radiation heat transferred vs. Composite %Reduction
(Number inside square frame shows reaction time in minutes)
3.3. Effect of Layer Thickness At 1400°C heating zone 1 temperature material layer thickness samples of both 40 mm and 16 mm
were reacted. Increased reaction extent in 16 mm material layers, as compared to that in 40 mm
material layers, for the same heat input conditions shows conduction heat transfer control. The sample
temperature profiles for 15 minutes reaction time of a 40 mm and 16 mm material layer, respectively,
are shown in Fig. 33 (a) and (b). The associated heating zone temperatures are compared in Fig. 34
(a) and (b). The steady state surface temperature for the 16 mm layer material is 26°C higher than that
of the 40 mm layer material. The bed temperatures in the 16 mm layer at 4 mm and 10 mm from the
sample surface are higher than those in the 40 mm layer.
The product gas profiles for 40 mm material layers and 16 mm material layers were similar. The
difference is that product gas of higher reducing potential was produced in the 16 mm layers, as
compared to that from the 40 mm layers. This is shown in Fig. 35 (a) and (b) where the
%CO/(%CO+%CO2) ratio in the product gas, for each experiment, is compared to the equilibrium
ratio for reduction of FeO by CO, reaction (20), and the equilibrium ratio for gasification, reaction
(21). The equilibrium %CO/(%CO+%CO2) values were calculated at the material bed temperatures
measured over the 15 minute reaction time. The calculations were done for the longest reaction time of
15 minutes only because the temperature profiles for reaction times smaller than 15 minutes are
represented by the 15 minute reaction time temperature profiles as well. The heat capacity values,
0
20
40
60
80
100
120
140
160
180
200
0 5 10 15 20 25 30 35 40 45
Composite %Reduction
Tota
l rad
iatio
n he
at tr
ansf
er to
sam
ple
surf
ace
(MJ/
m^2
)
1400°C; 40 mm layerthickness
1500°C; 40 mm layerthickness
1300°C; 40 mm layerthickness
15
3
6
9
12
3
6
9
12
15
15
12
9
6
3

71
standard enthalpy and entropy values used to calculate the enthalpy and entropy of reactions (20) and
(21) are shown in Appendix XII. A linear fit of the free energy values was made for each reaction as
shown in Appendix XII.
)(2)()()( gsgs COFeCOFeO +=+ (20)
)()()(2 2 gsg COCCO =+ (21)
At the sample surface temperature the product gas %CO/(%CO+%CO2) ratio for the 16 mm and 40
mm layers experiments plot in-between the equilibrium ratios of reactions (20) and (21). If the
reduction reaction, reaction (20), was slowest the product gas CO content would be at the gasification
reaction equilibrium which is 100%CO at the sample surface temperatures. If the gasification reaction
was slowest the product gas CO content would be at the equilibrium %CO/(%CO+%CO2) ratio of the
reduction reaction, reaction (20). The product gas composition does not follow either equilibrium
%CO/(%CO+%CO2) ratio exclusively, indicating the interdependence of reactions (20) and (21) at the
sample surface.
Fig. 36 shows the comparative reduction extent. The reduction extent for the 16 mm layer is 8%
higher than that of the top layer for the 40 mm layer material sample for reaction times 9, 12 and 15
minutes. At reaction times below 6 minutes the reduction extent is similar. Fig. 37 (a) and (b) shows
the %Carbon and mass carbon reacted in the top node in the 40 mm material layer, compared to that in
the 16 mm layer. The top node comprises 46% of the 40 mm sample height, that is 18 mm. It is seen
that the rate of carbon consumption is similar, but the carbon consumption is higher in the 16 mm
material layer in accordance with the increased reduction extent achieved in the 16 mm layer. Heat
transfer rates to the 16 mm material layer were lower compared to the 40 mm layer material, due to the
slightly higher sample surface temperature and 10°C lower heating zone 3 temperatures. Fig. 38
shows the average heat transferred to the sample for a 40 mm layer as compared to that for a 16 mm
layer.

72
Fig. 33 (a): Temperatures of 40 mm layer thickness of coal-ore mixture reacted at 1400°C for 15
minutes.
Fig. 33 (b): Temperatures of 16 mm layer thickness of coal-ore mixture reacted at 1400°C for 15
minutes.
050
100150200250300350400450500550600650700750800850900950
1000105011001150120012501300
0 60 120 180 240 300 360 420 480 540 600 660 720 780 840 900 960
Time (s)
Tem
pera
ture
(°C
)
-300
-280
-260
-240
-220
-200
-180
-160
-140
-120
-100
-80
-60
-40
-20
0
kW/m
^2 in
to s
ampl
e
4 mm 10 mm Pyrometer Real T_Surface (°C) kW/m^2 Sample lowered
050
100150200250300350400450500550600650700750800850900950
1000105011001150120012501300
0 60 120 180 240 300 360 420 480 540 600 660 720 780 840 900 960
Time (s)
Tem
pera
ture
(°C
)
-300
-280
-260
-240
-220
-200
-180
-160
-140
-120
-100
-80
-60
-40
-20
0
kW/m
^2 in
to s
ampl
e
4 mm 10 mm 20 mm 30 mm Pyrometer Real T_Surface (°C) kW/m^2 Sample lowered

73
Fig. 34 (a): Comparison of furnace tube temperatures for 40 mm vs. 16 mm
Fig. 34 (b): Comparison of furnace tube temperatures for 40 mm vs. 16 mm (Heating zone 3)
1390
1391
13921393
1394
1395
1396
13971398
1399
1400
14011402
1403
1404
14051406
1407
1408
1409
1410
1411
1412
1413
14141415
0 60 120 180 240 300 360 420 480 540 600 660 720 780 840 900 960 1020 1080 1140 1200 1260 1320 1380 1440 1500
Time (s)
Tem
pera
ture
(°C
)
Heating Zone 1; 16 mm Heating Zone 2; 16 mm Sample lowered Heating Zone 1; 40 mm Heating Zone 2; 40 mm
1320
1325
1330
1335
1340
1345
1350
1355
1360
1365
1370
1375
1380
0 60 120 180 240 300 360 420 480 540 600 660 720 780 840 900 960 1020 1080 1140 1200 1260 1320 1380 1440 1500
Time (s)
Tem
pera
ture
(°C
)
Heating Zone 3; 16 mm Sample lowered Heating Zone 3; 40 mm

74
Fig. 35 (a): %CO/(%CO+CO2) in product gas: 15 minute reaction time at 1400°C furnace temperature for 40 mm material layer
Fig. 35 (b): %CO/(%CO+CO2) in product gas: 15 minute reaction time at 1400°C furnace
temperature for 16 mm material layer
0
10
20
30
40
50
60
70
80
90
100
0 60 120 180 240 300 360 420 480 540 600 660 720 780 840 900
Time (s)
%C
O/(%
CO
+%C
O2)
*100
%CO/(%CO+%CO2)*100 for 15 minutetotal reaction time
FeO/Fe equilibrium at 4 mm
C+CO2=2CO equilibrium at 4 mm
FeO/Fe equilibrium at 10 mm
C+CO2=2CO equilibrium at 10 mm
FeO/Fe equilibrium at 20 mm
C+CO2=2CO equilibrium at 20 mm
FeO/Fe equilibrium at 30 mm
C+CO2=2CO equilibrium at 30 mm
FeO/Fe equilibrium at surface
C+CO2=2CO equilibrium at surface
Sample lowered
0
10
20
30
40
50
60
70
80
90
100
0 60 120 180 240 300 360 420 480 540 600 660 720 780 840 900
Time (s)
%C
O/(%
CO
+%C
O2)
*100
%CO/(%CO+%CO2)*100 for 15 minutetotal reaction time
FeO/Fe equilibrium at 4 mm
C+CO2=2CO equilibrium at 4 mm
FeO/Fe equilibrium at 10 mm
C+CO2=2CO equilibrium at 10 mm
FeO/Fe equilibrium at surface
C+CO2=2CO equilibrium at surface

75
Fig. 36: Comparison %Reduction in top segment of 40 mm material layer vs. 16 mm material layer (Top segment of 40 mm material layer is 18 mm)
Fig. 37 (a): Comparison %Carbon for top segment of 40 mm to 16 mm material layer thickness
0
5
10
15
20
25
30
35
40
45
50
55
60
65
70
75
80
85
90
0 2 4 6 8 10 12 14 16
Time (minutes)
%R
educ
tion
1400°C; Top segment of 40mm layer thickness = 18 mm
1400°C; 16 mm layerthickness
0
10
20
30
40
50
60
70
80
90
100
0 2 4 6 8 10 12 14 16
Time (minutes)
%C
arbo
n re
acte
d
1400°C; Top segment of 40mm layer thickness = 18 mm
1400°C; 16 mm layerthickness

76
Fig. 37 (b): Comparison mass carbon for top segment of 40 mm to 16 mm material layer thickness
Fig. 38: Average radiation heat transfer to sample surface: Top segment of 40 mm material layer
vs. 16 mm material layer
-300
-280
-260
-240
-220
-200
-180
-160
-140
-120
-100
-80
-60
-40
-20
0
0 2 4 6 8 10 12 14 16
Time (minutes)
Ave
rage
kW
/m^2
radi
atio
n he
at tr
ansf
erre
d to
sam
ple
surf
ace
1400°C; Top segment of 40mm layer thickness = 18 mm
1400°C; 16 mm layerthickness
0.0
0.5
1.0
1.5
2.0
2.5
3.0
3.5
4.0
4.5
5.0
0 2 4 6 8 10 12 14 16
Time (minutes)
g. C
arbo
n
g. C out: 1400°C; Top segmentof 40 mm layer thickness = 18mmg. C in: 1400°C; Top segment of40 mm layer thickness = 18 mm
g. C out: 1400°C; 16 mm layerthickness
g. C in: 1400°C; 16 mm layerthickness

77
3.4. Effect of Volatiles in Coal The composition and flow rate of the gas product released from the heap surface are important input
information for the process energy balance. The contribution of coal devolatilisation to the product gas
was isolated by heating coal-alumina samples instead of coal-ore samples. This approach has been
used by Dey et al. (1993), Wang et al. (1997, 1998), Dutta and Gosh (1994), Sohn and Fruehan
(2006a). The coal-alumina samples were heated until negligible volatile content was observed in the
product gas analyses. The volatile components in the product gas for coal reacted at different furnace
temperatures are shown in Fig. 44-46, with the associated material bed temperatures. Although the
product gas analyses show that the coal volatiles consisted largely of hydrogen on volume basis, the
hydrogen portion decreases from 26 mass% at 1300°C furnace temperature to 12 mass% and 13
mass% at 1400°C and 1500°C furnace temperature as the mass of CO and CO2 increased with
increasing furnace temperature. Negligible methane was measured in the product gas. This does not
mean that methane is not one of the devolatilisation products as carbon deposition onto the crucible
walls was observed whenever coal was reacted. An example of carbon deposition is shown in Fig. 39,
compared to samples of char-ore mixtures reacted under the same conditions, shown in Fig. 40.
The molar quantities of product gas for the total reaction time, at each heating zone temperature, are
shown in Fig. 41, indicating increased H2, H2O and CO release with increased reaction temperature.
The endpoint reaction temperatures in the coal-alumina material layer, shown in Fig. 44-46, is in
excess of 900°C, indicating that devolatilisation should be complete in the samples. The total mass of
carbon reporting to the product gas is shown in Fig. 42, as calculated from the product gas analyses
and the carbon analyses of the devolatilised sample. The mass carbon to gas for devolatilisation,
shown in Fig. 42, corresponds well for 1500°C, and not well for 1300°C and 1400°C. The calculations
of mass loss to the gas, as shown in Fig. 43, correspond better for reaction at 1300°C and 1400°C, but
not for 1500°C. Coal volatile content values calculated from the mass loss measured are 24%, 31%
and 28% at 1300°C, 1400°C and 1500°C vs. 14%, 32% and 64% calculated from the product gas
analyses. The increased volatile gas release with increased reaction temperature and increased heating
rates has been reported in literature (Desypris et al., 1982).

78
Fig. 39: Carbon deposition on crucible walls for coal-ore samples
Fig. 40: No carbon deposition on crucible walls for char-ore samples
Fig. 41: mol to gas in coal devolatilisation
0.0E+00
2.0E-02
4.0E-02
6.0E-02
8.0E-02
1.0E-01
1.2E-01
1.4E-01
1.6E-01
1.8E-01
2.0E-01
2.2E-01
2.4E-01
2.6E-01
2.8E-01
3.0E-01
3.2E-01
3.4E-01
3.6E-01
3.8E-01
4.0E-01
1250 1300 1350 1400 1450 1500 1550
Heating zone 1 Temperature (°C)
mol
in p
rodu
ct g
as
mol CO2
mol CO
mol H2
mol CH4
mol H2O
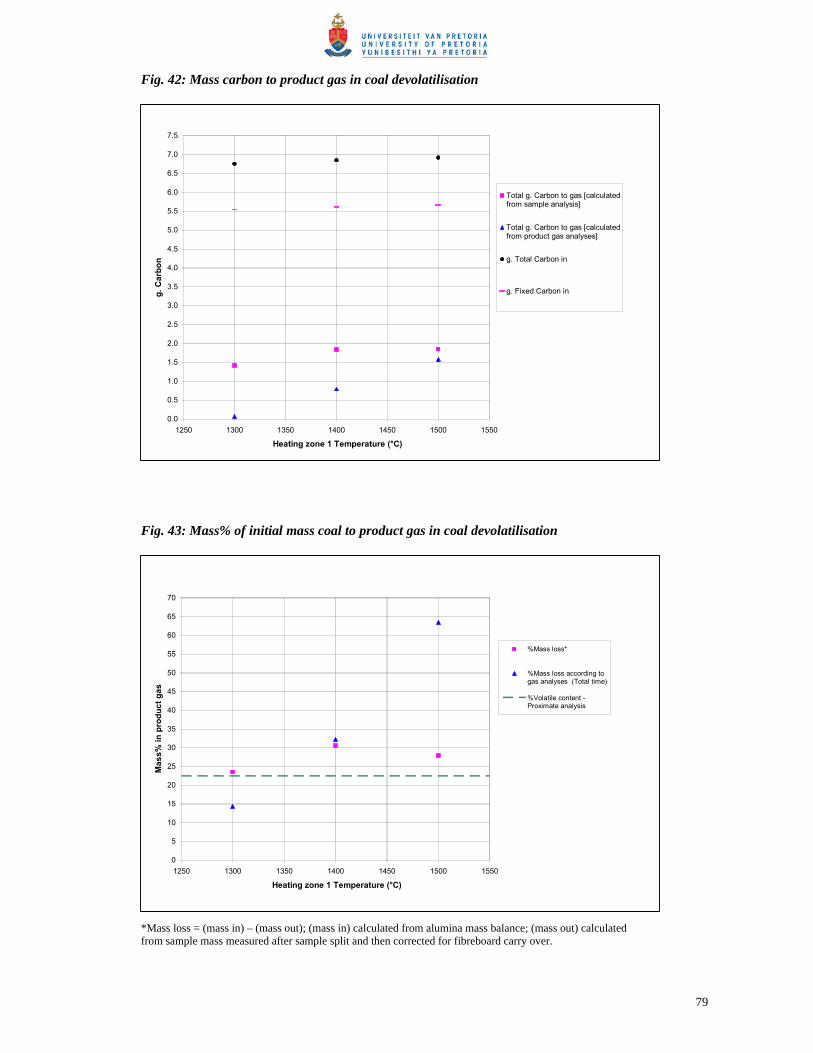
79
Fig. 42: Mass carbon to product gas in coal devolatilisation
Fig. 43: Mass% of initial mass coal to product gas in coal devolatilisation
*Mass loss = (mass in) – (mass out); (mass in) calculated from alumina mass balance; (mass out) calculated from sample mass measured after sample split and then corrected for fibreboard carry over.
0
5
10
15
20
25
30
35
40
45
50
55
60
65
70
1250 1300 1350 1400 1450 1500 1550
Heating zone 1 Temperature (°C)
Mas
s% in
pro
duct
gas
%Mass loss*
%Mass loss according togas analyses (Total time)
%Volatile content -Proximate analysis
0.0
0.5
1.0
1.5
2.0
2.5
3.0
3.5
4.0
4.5
5.0
5.5
6.0
6.5
7.0
7.5
1250 1300 1350 1400 1450 1500 1550
Heating zone 1 Temperature (°C)
g. C
arbo
n
Total g. Carbon to gas [calculatedfrom sample analysis]
Total g. Carbon to gas [calculatedfrom product gas analyses]
g. Total Carbon in
g. Fixed Carbon in

80
The following reactions are possible reactions of devolatilisation in the absence of oxygen. The
temperatures at which the forward reaction can take place according to thermodynamics are indicated
below; the thermodynamic calculation data is shown in Appendix XII.
)(3)()()( 224 gHgCOgOHgCH +=+ ; T > 617°C (22)
)(2)()( 24 gHsCgCH += ; T > 542°C (23)
)(2)(2)()( 224 gHgCOgCOgCH +=+ ; T > 643°C (24)
)()()()( 222 gHgCOgCOgOH +=+ ; T < 848°C (25)
)()()()( 22 gHgCOsCgOH +=+ ; T > 674°C (26)
)(2)()(2 gCOsCgCO =+ ; T > 706°C (27)
(s) = solid material
(g) = gas phase material
The picture in Fig. 39 shows that the carbon deposition profile along the height of the crucible
extended further down the crucible with increased reaction time. This indicates that carbon deposition
is associated with increased temperature via reaction (23) and (26) not via reaction (27). Further
indication that carbon deposition is not due to reaction (27), as the sample was cooled, is that the
picture in Fig. 40 for ore-char samples shows no deposited carbon.
For devolatilisation at 1300°C heating zone 1 temperature, as shown in Fig. 44, the absence of CO
and/or CH4 in the product gas indicates that the only reactions that proceeded significantly are H2
formation from reaction (23) forward and/or direct H2 release from coal. The small quantities of CO2
formed indicate that reaction (25) did not proceed to a significant extent. Devolatilisation at 1400°C
and 1500°C is more complex because CO is present in the product gas. As is the case for
devolatilisation at 1300°C, no significant quantity of CH4 is present in the product gas.
The CO can be the product of reactions (22), (24), (26) and (27) at temperatures below 848°C. Fig. 45
and Fig. 46 show the H2/CO ratio in the product gas, and the time at which changes in the H2/CO ratio
took place are indicated by vertical broken lines. The corresponding time markings are indicated on
the material temperature graphs, adjusted for the residence time of gas in the furnace set-up. For
reaction at 1400°C this ratio is initially higher than four, and then levels off to a value of three until a
dip in the ratio at 799 seconds, indicated by the vertical broken green line in the product gas
composition graph. The ratio of three indicates that reaction (22) is the dominant reaction. At 927
seconds, indicated by the vertical broken pink line, the H2/CO ratio recovers to 3 and continues to
increase beyond this value to the end of the devolatilisation.

81
For devolatilisation at 1500°C furnace temperature the H2/CO ratio is close to three from the
beginning of reaction. Three changes in the H2/CO ratio are indicted by the time markings on the gas
composition and bed temperature graphs. The first change is a slight increase in the H2/CO ratio at 720
seconds on the product gas composition graph, indicated by the vertical broken red line, and can be
explained by the bottom segment temperature reaching 551°C to release H2 from the decomposition of
CH4, reaction (23). Then the H2/CO ratio increases to four, and suddenly drops back to three at 912
seconds, indicated by the vertical broken green line. At 1011 seconds the H2/CO ratio increases as the
product gas CO content decrease more quickly than the H2 product gas content. The latter effect can
only be explained from reaction (23) because this is the only reaction to form H2 alone.
From the above the conclusion is that significant H2 is released in coal devolatilisation over 3-15
minute reaction periods of coal containing material layers of 40 mm reacted at 1300, 1400 and 1500°C
furnace temperatures. The release of H2 is due to decomposition of CH4 and/or direct release of H2
from the coal.

82
Fig. 44 (a): Coal devolatilisation in coal-alumina sample reacted at 1300°C: Temperatures
(Horisontal temperature lines for reactions (22) to (27) indicates the equilibrium temperatures)
Fig. 44 (b): Coal devolatilisation in coal-alumina sample reacted at 1300°C: Product gas
0
1
2
3
4
5
6
7
8
9
10
11
12
13
14
15
16
17
18
19
20
0 120 240 360 480 600 720 840 960 1080 1200 1320 1440 1560 1680 1800 1920 2040 2160 2280 2400
Time (s)
Vol%
0
10
20
30
40
50
60
70
80
90
100
Vol%
Ar
Carbon Dioxide Methane Hydrogen Water-DM Carbon Monoxide Sample lowered Argon
0
100
200
300
400
500
600
700
800
900
1000
1100
1200
1300
0 120 240 360 480 600 720 840 960 1080 1200 1320 1440 1560 1680 1800 1920 2040 2160 2280 2400
Time (s)
Tem
pera
ture
(°C
)4 mm 10 mm 20 mm 30 mmPyrometer Real T_Surface (°C) Sample lowered (22) CH4+H2O=CO+3H2(23) CH4=C+2H2 (24) CH4+CO2=2CO+2H2 (25) H2O+CO=CO2+H2 (27) CO2+C=2CO(26) H2O+C=CO+H2

83
Fig. 45 (a): Coal devolatilisation in coal-alumina sample reacted at 1400°C: Temperatures
(Horisontal temperature lines for reactions (22) to (27) indicates the equilibrium temperatures)
Fig. 45 (b): Coal devolatilisation in coal-alumina sample reacted at 1400°C: Product gas
0
1
2
3
4
5
6
7
8
9
10
11
12
13
14
15
16
17
18
19
20
0 120 240 360 480 600 720 840 960 1080 1200 1320 1440 1560 1680 1800 1920 2040 2160 2280 2400
Time (s)
Vol%
& %
H2/
%C
O
0
10
20
30
40
50
60
70
80
90
100
Vol%
Ar
Carbon Dioxide Methane Hydrogen Water-DM Carbon MonoxideSample lowered %H2/%CO Argon
0
100
200
300
400
500
600
700
800
900
1000
1100
1200
1300
0 120 240 360 480 600 720 840 960 1080 1200 1320 1440 1560 1680 1800 1920 2040 2160 2280 2400
Time (s)
Tem
pera
ture
(°C
)4 mm 10 mm 20 mm 30 mmPyrometer Real T_Surface (°C) Sample lowered (22) CH4+H2O=CO+3H2(23) CH4=C+2H2 (24) CH4+CO2=2CO+2H2 (25) H2O+CO=CO2+H2 (26) H2O+C=CO+H2(27) CO2+C=2CO
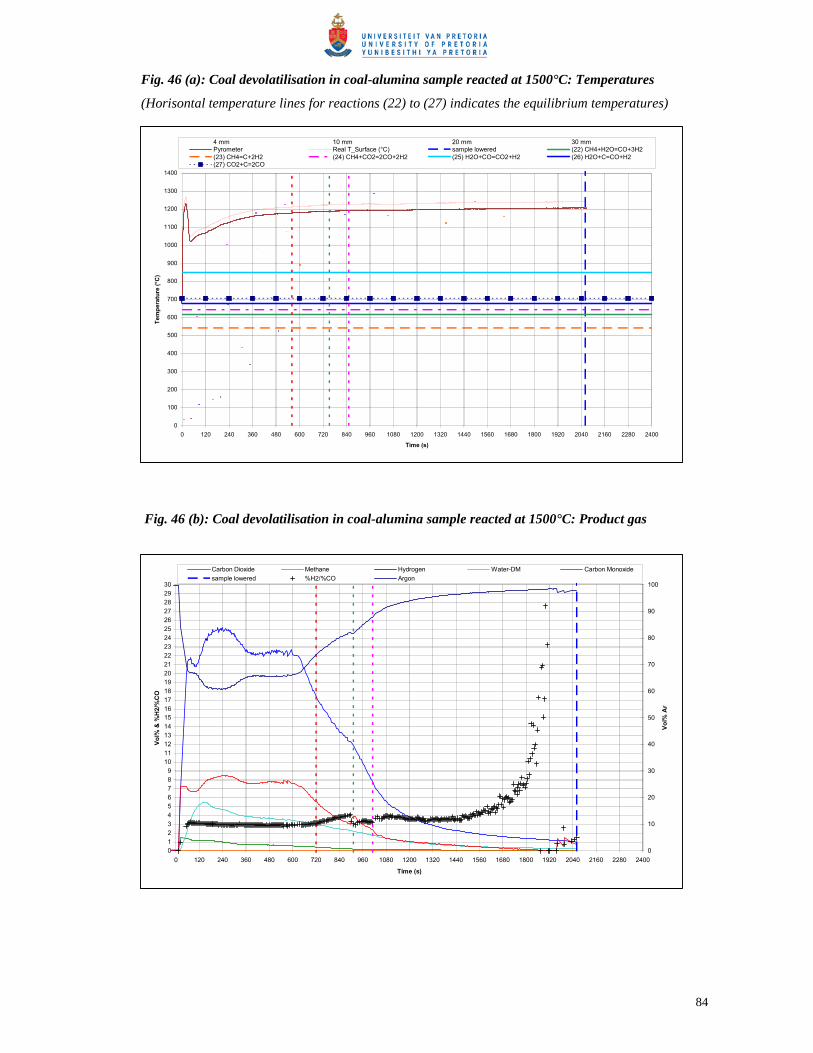
84
Fig. 46 (a): Coal devolatilisation in coal-alumina sample reacted at 1500°C: Temperatures
(Horisontal temperature lines for reactions (22) to (27) indicates the equilibrium temperatures)
Fig. 46 (b): Coal devolatilisation in coal-alumina sample reacted at 1500°C: Product gas
0123456789
101112131415161718192021222324252627282930
0 120 240 360 480 600 720 840 960 1080 1200 1320 1440 1560 1680 1800 1920 2040 2160 2280 2400
Time (s)
Vol%
& %
H2/
%C
O
0
10
20
30
40
50
60
70
80
90
100
Vol%
Ar
Carbon Dioxide Methane Hydrogen Water-DM Carbon Monoxidesample lowered %H2/%CO Argon
0
100
200
300
400
500
600
700
800
900
1000
1100
1200
1300
1400
0 120 240 360 480 600 720 840 960 1080 1200 1320 1440 1560 1680 1800 1920 2040 2160 2280 2400
Time (s)
Tem
pera
ture
(°C
)
4 mm 10 mm 20 mm 30 mmPyrometer Real T_Surface (°C) sample lowered (22) CH4+H2O=CO+3H2(23) CH4=C+2H2 (24) CH4+CO2=2CO+2H2 (25) H2O+CO=CO2+H2 (26) H2O+C=CO+H2(27) CO2+C=2CO

85
The effect of volatiles on reduction extent has been tested by reaction of char instead of coal as
reductant. Comparative sample bed temperatures and product gas analyses are shown for 15 minutes
reaction time in Fig. 47 and 48. Material bed temperatures in the char containing sample are higher
than that for the coal containing sample. The temperature difference can not be uniquely ascribed to
the effect of the heat of devolatilisation because the heat of devolatilisation has been found to vary
from endothermic to exothermic by 200 kJ/kg parent coal, even for coal of similar composition
(Tomeczek and Palugniok, 1996). The difference in material bed temperatures is because of more heat
used in reduction work and less heat used to heat up the material layer in the coal containing sample,
as compared to a reversal of this heat proportioning in the char containing sample.
The sample surface temperatures for coal containing samples show an apparent increase within the
first minute of reaction. This effect is absent when char is used instead of coal. The increased
measured temperature is a result of the initial release of volatiles, forming a gas cloud which shielded
the radiation seen by the pyrometer, from the sample surface. This was confirmed by video material
recorded through an enlarged view hole when a sample of -2000 +1400 µm ore and coal was reacted
at 1400°C heating zone one temperature. Snapshots taken from the video material are shown in Fig.
49.
Reduction extent for each sample segment is shown in Fig. 50, showing that reduction by volatiles
does take place for a stagnant bed of material mixture. The composite carbon consumption and
reduction levels are shown in Fig. 51 (a) and (b).
Fig. 47: Sample temperatures of Coal vs. Char as reductant
(a) Coal-Ore reacted at 1400°C furnace temperature
0
50100150200250300350400450500550600650700750800850900950
1000105011001150120012501300
0 60 120 180 240 300 360 420 480 540 600 660 720 780 840 900 960
Time (s)
Tem
pera
ture
(°C
)
-300
-280
-260
-240
-220
-200
-180
-160
-140
-120
-100
-80
-60
-40
-20
0
kW/m
^2 in
to s
ampl
e4 mm 10 mm 20 mm 30 mm Pyrometer Real T_Surface (°C) kW/m^2 Sample lowered

86
(b) Char-Ore reacted at 1400°C furnace temperature
Fig. 48: Product gas for Coal vs. Char as reductant
(a) Coal-Ore reacted at 1400°C furnace temperature
0
1
2
3
4
5
6
7
8
9
10
11
12
13
14
15
16
17
18
19
20
0 60 120 180 240 300 360 420 480 540 600 660 720 780 840 900 960 1020 1080 1140 1200 1260 1320 1380 1440 1500
Time (s)
Vol%
0
10
20
30
40
50
60
70
80
90
100
Vol%
Ar
Carbon Dioxide Methane Hydrogen Water-DM Carbon Monoxide Argon
0
50
100
150
200
250
300
350
400
450
500
550
600
650
700
750
800
850
900
950
1000
1050
1100
1150
1200
0 60 120 180 240 300 360 420 480 540 600 660 720 780 840 900 960
Time (s)
Tem
pera
ture
(°C
)
-300
-280
-260
-240
-220
-200
-180
-160
-140
-120
-100
-80
-60
-40
-20
0
kW/m
^2 in
to s
ampl
e
4 mm 10 mm 20 mm 30 mm Pyrometer Real T_Surface (°C) kW/m^2 Sample lowered

87
(b) Char-Ore reacted at 1400°C furnace temperature
Fig. 49: Snapshots from video material for -2000 +1400 µm ore and coal reacted at 1400°C heating
zone1 temperature
0
1
2
3
4
5
6
7
8
9
10
11
12
13
14
15
16
17
18
19
20
0 60 120 180 240 300 360 420 480 540 600 660 720 780 840 900 960 1020 1080 1140 1200 1260 1320 1380 1440 1500
Time (s)
Vol%
0
10
20
30
40
50
60
70
80
90
100
Vol%
Ar
Carbon Dioxide Methane Hydrogen Water-DM Carbon Monoxide Sample lowered Argon
0 seconds Within first 1.5 minutes

88
Fig. 50: %Reduction for Coal vs. Char as reductant
%R
educ
tion
in to
p se
gmen
t
0
5
10
15
20
25
30
35
40
45
50
55
60
65
70
Coal; 1400°C; 40 mm layer thicknessChar; 1400°C; 40 mm layer thickness
%R
educ
tion
in m
iddl
e se
gmen
t
0
2
4
6
8
Time (minutes)
0 2 4 6 8 10 12 14 16
%R
educ
tion
in b
otto
m s
egm
ent
0
1
2
3
4
5

89
Fig. 51 (a): Composite %Carbon consumption for Coal vs. Char as reductant
Fig. 51 (b): Composite %Reduction for Coal vs. Char as reductant
0
5
10
15
20
25
30
35
40
45
50
0 2 4 6 8 10 12 14 16
Time (minutes)
Com
posi
te %
Red
uctio
n
Coal; 1400°C; 40 mmlayer thickness
Char; 1400°C; 40 mmlayer thickness
0
5
10
15
20
25
30
35
40
45
50
0 2 4 6 8 10 12 14 16
Time (minutes)
Com
posi
te %
Car
bon
reac
ted
1400°C; 40 mm layer thickness
Char; 1400°C; 40 mm layerthickness

90
In Fig. 52 data of the total heat transferred to the sample vs. composite reduction extent is shown.
Heat transferred to the coal-ore sample is higher than heat transferred to the char-ore sample, for the
same reaction time because the coal-ore sample surface temperatures were lower than that of the char-
ore sample surface. The total heat demand in reaction of a coal-ore sample did not exceed the total
heat demand for reaction of a char-ore sample to attain the same level of composite reduction. The
possible effect of exothermic or endothermic heat of coal devolatilisation on heat transferred to the
sample surface is shown as error bars in Fig. 52, 200 kJ/kg parent coal (Tomeczek and Palugniok,
1996). The higher reduction extent achieved in the coal-ore samples at equivalent energy input to the
sample is most probably because the release of coal volatiles results in more reducing conditions
beyond reduction to magnetite in the material layer at lower temperatures, as compared to ~700°C
required in the char-ore samples to generate reducing conditions with CO from the gasification
reaction. This is in agreement with the work of Sohn and Fruehan (2006b), for a bed of three layers of
composite pellets reacted at 1000°C bed surface temperature, which showed significant reduction of
the top pellet layer from coal volatiles released from the bottom layer of pellets.
In this study the reduction work done by coal volatiles, primarily hydrogen, released at low material
layer temperatures resulted in higher reduction rates in coal-ore samples as compared to char-ore
samples. The percentage reduction gain of 4% to 8% for 3 to 15 minutes reaction time was achieved in
a stagnant material layer. However, the extent to which this advantage is realised in practice would
depend on the process details. For example, if the material is fed through the hot furnace freeboard the
coal will devolatilise at least in part and the percentage reduction gain from coal volatiles will be
partially reduced, or eliminated. Alternatively the material mixture can be fed to through the furnace
sidewalls to gain maximum contribution of coal volatiles in reduction. From the results it is clear that
significant reduction by coal volatiles takes place in a mixed coal-ore bed heated uni-directionally
from the sample surface. As discussed previously with reference the SL/RN process, in Chapter I, the
effect of lowered bed temperature with more reactive reductant used is also observed here for coal vs.
char as reductant.

91
Fig. 52: Total radiation heat transferred vs. Composite %Reduction
(Number inside square frame shows reaction time in minutes)
3.5. Phase chemistry of Metal and Oxide Phases Duplicate samples were reacted for 15 minutes reaction time at 1300°C, 1400°C and 1500°C furnace
temperatures and set in epoxy, polished and viewed under reflected light. The photomicrographs taken
under reflected light are shown in Fig. 53 to 55, and clearly show the variability of reaction of the ore
in the top and middle segments. Because the ore contained variable amounts of gangue, and was of
variable porosity, ore particles exposed to the same conditions of temperature and reducing
atmosphere, showed different degrees of reduction and metallisation. These observations show that
this ore does not reduce according to a single rate mechanism. In Fig. 54 (a) and Fig. 55 (a) extensive
metal rim formation is seen around the edge of the reduced ore particle, and the interior is filled with
slag and rounded wustite grains. Therefore, the top segment material of the samples reacted for 15
minutes at 1400°C and 1500°C no longer follow exclusively solid state reduction, but are in a semi-
molten state. The coal particles also show variable extent of devolatilisation. In Fig. 55 (b) some of
the coal still has an even texture, whilst the largest coal particle has already reacted somewhat. In the
top segment of a sample that has significant metallisation, Fig. 55 (a), the coal has been totally
devolatilised, and the carbon skeleton consumed extensively in reduction reactions. The reacted ore
and coal features in these photomicrographs clearly show the variability in reaction mechanism for
both ore and coal.
0
20
40
60
80
100
120
140
160
180
200
0 5 10 15 20 25 30 35 40 45
Composite %Reduction
Tota
l rad
iatio
n he
at tr
ansf
er to
sam
ple
surf
ace
(MJ/
m^2
)
Coal; 1400°C; 40 mmlayer thickness
Char; 1400°C; 40 mmlayer thickness
3
6
9
12
15
15
12
9
6
3

92
The metal product carbon content is important where the aim is to make steel, not hot metal. If the
carbon content in the metal product at the heap surface is high, metal refinement is required in the rest
of the process zones. The polished sections shown in Fig. 53-54 were etched with 2% Nital solution to
show up the presence of pearlite, indicating carbon content in excess of 0.025%C solubility limit in
ferrite. The polished sections were viewed and analysed using a JSM-6300 SEM (Scanning Electron
Microscope) at 15 kV and 200 second counting interval. The analysed areas are shown in Fig. 56-58.
It is seen from the images that no second phase is present in the metal product, indicating that the
metal product is ferrite. This is possible because the proximity of carbon to the metal product is not
close in the packed bed as seen in Fig. 53-55, and there is no carbon deposition onto the metal
product. The other interesting observation from the metal analyses is the absence of sulphur,
indicating that sulphur pick-up must take place elsewhere in the process.
As is seen from Fig. 53 (a) and (b) much variability in reduction is seen for the sample reacted at
1300°C furnace temperature and only a few ore particles were reduced to metal. The metallised ore
particles were not restricted to the top segment in the sample. Here two areas with metallised ore
particles, in the sample reacted at 1300°C, were analysed for comparison with the analyses of the
samples reacted at 1400°C and 1500°C. The ore particle in Fig. 56 (a) contained little gangue material
and the ore particle is of high porosity so that metallisation occurs throughout the particle and little or
no glass phase is formed. In contrast Fig. 56 (b) shows metallisation at the ore particle edge and glass
phase at the ore particle interior due to high gangue content in the ore particle initially and associated
low initial ore particle porosity. Wüstite grains (light grey rounded grains) are embedded in the glass
phase. The phase morphology seen in Fig. 56 (b) is also seen extensively in the top segments of the
samples reacted at 1400°C and 1500°C heating zone 1 temperatures as shown in Fig. 57 and Fig. 58.

93
Fig. 53 (a): 1300°C furnace temperature; 15 minutes; 40 mm layer, top segment (C=Coal; O=Ore)
Fig. 53 (b): 1300°C furnace temperature; 15 minutes; 40 mm layer, middle segment (C=Coal; O=Ore)
200µm
O
O
O
O
O
C
O
200µm
O
O
O
O O
O
O
O
C
C
C
C
C
C
C
C
C
C
C

94
Fig. 54 (a): 1400°C furnace temperature; 15 minutes; 40 mm layer, top segment (C=Coal; O=Ore)
Fig. 54 (b): 1400°C furnace temperature; 15 minutes; 40 mm layer, middle segment (C=Coal; O=Ore)
200µm
C
C
C
C
O
O
O
O
O
O
O
O
200µm
O
O
O
O
O
Metal rim

95
Fig. 55 (a): 1500°C furnace temperature; 15 minutes; 40 mm layer, top segment (C=Coal; O=Ore)
Fig. 55 (b): 1500°C furnace temperature; 15 minutes; 40 mm layer, middle segment (C=Coal; O=Ore)
200µm
CO
C
O
O
O
200µm
O
O
O
O
O
C C
C
C
C
O

96
The analyses from Fig. 58 (a) show that the oxide phases consist of FeO (light grey rounded grains)
and silicate needles initially. The composition of the needles corresponds to the stoichiometry for
Fayalite, 2FeO.SiO2, with a liquidus temperature of 1208°C and solidus temperatures of 1175°C
associated with FeO, and 1180°C associated with silica. The sample surface temperature is ~ 1250°C
whilst the sample bed temperature 10 mm from the sample surface is ~ 1160°C. Therefore, the silicate
phase could have been liquid at the sample temperatures, but not the FeO areas because the lowest
solidus temperature for FeO is 1371°C. This is important because the lowered oxide liquidus
temperature limits the maximum temperature to which the heap surface can be heated without bulk
melting. This is a function of the gangue component in the ore so that use of a higher quality ore will
allow for higher heap surface temperatures. The silicate glass composition changes from higher FeO
content initially to lower FeO content as the FeO grains are reduced. The lower FeO content in the
silicate glass is seen from Fig. 58 (b). As shown in Fig. 57 (a) and (b), similar phase morphology is
seen in the top segment of the sample reacted for 15 minutes at 1400°C. The glass phase analyses
shown in Fig. 56 (b), Fig. 57 (a) and (b) and Fig. 58 (b) are all similar in composition to the silicate
needles’ composition in Fig. 58 (a) with the stoichiometry of Fayalite, 2FeO.SiO2. However, the
material layer surface temperatures were 1084°C, 1145°C and 1256°C for the samples reacted at
heating zone 1 temperatures of 1300°C, 1400°C and 1500°C. The liquidus temperature of Fayalite is
1208°C and the solidus 1175°C. Melting of Fayalite could only take place at 1084°C and 1145°C
because of the presence of Fe3+ in the Fayalite and/or substitution of minor elements such as K, Na, P
into the glass phase to reduce the liquidus and solidus temperature. The partial oxygen pressures for
the CO/CO2 values were calculated at the sample surface temperatures of 1084°C, 1145°C and 1256°C
to be 4 x 10-12, 3 x 10-11 and 2 x 10⁻⁹ atm. At these partial oxygen pressures Fe3+ should be present in
the glass phase. Glass phase formation within ore particles should be avoided as it results in decreased
porosity resulting in metallisation restricted to the glass phase boundary, as seen above. Furthermore,
bulk melting of ore should be avoided because energy utilisation is shifted toward melting rather than
reduction and metallisation at the heap surface.

97
Fig. 56 (a): Phases in Top segment of coal-ore sample reacted at 1300°C for 15 minutes
(Right hand image is area in blue block enlarged)
A
B
Element Fe Si Al Ca K Ba Ti Mg Mn S P Na Total
A: Metal (mass%) 99.6 0.0 0.0 0.1 0.1 0.1 0.0 0.1 0.0 0.0 0.0 0.0 100
B: FeO grains (mass%) 95.6 0.7 3.2 0.0 0.0 0.0 0.0 0.0 0.0 0.2 0.0 0.1 100
Fig. 56 (b): Phases in Top segment of coal-ore sample reacted at 1300°C for 15 minutes (Right hand image is area in blue block enlarged)
AB
C
Element Fe Si Al Ca K Ba Ti Mg Mn S P Na Total A: FeO grains (mass%) 98.6 0.3 0.7 0.0 0.0 0.0 0.0 0.2 0.0 0.1 0.0 0.0 100
B: Glass (mass%) 75.5 16.9 3.3 1.6 0.2 0.6 0.0 0.1 0.3 0.7 0.8 0.0 100
B: Glass (mol fraction) 0.62 0.28 0.06 0.02 0.00 0.00 0.00 0.00 0.00 0.01 0.01 0.00 1.00
C: Dark phase (mass%) 70.4 10.9 17.0 0.4 0.1 0.0 0.2 0.0 0.3 0.1 0.5 0.2 100

98
Fig. 57 (a): Phases in Top segment of coal-ore sample reacted at 1400°C for 15 minutes (Right hand image is area in blue block enlarged)
ABC
Element Fe Si Al Ca K Ba Ti Mg Mn S P Na Total A: Metal (mass%) 99.4 0.2 0.2 0.1 0.1 0.0 0.0 0.0 0.0 0.1 0.0 0.0 100
B: FeO grains (mass%) 98.0 0.3 1.0 0.1 0.0 0.0 0.2 0.1 0.2 0.0 0.0 0.1 100
C: Glass (mass%) 77.9 13.4 6.0 0.4 0.2 0.3 0 0.2 0.1 0.7 0.6 0.1 100
C: Glass (mol fraction) 0.64 0.22 0.10 0.00 0.00 0.00 0.00 0.00 0.00 0.01 0.01 0.00 1.00
Fig. 57 (b): Phases in Top segment of coal-ore sample reacted at 1400°C for 15 minutes (Right hand image is area in blue block enlarged; black blocks = analysed area)
A
B
C
DE
Element Fe Si Al Ca K Ba Ti Mg Mn S P Na Total
A: Metal (mass%) 99.6 0.1 0.1 0.0 0.0 0.1 0.0 0.0 0.0 0.1 0.0 0.0 100
B: FeO dendrites (mass%) 94.1 2.4 2.4 0.1 0.0 0.2 0.2 0.0 0.0 0.5 0.0 0.2 100
C: Glass (mass%) 77.0 17.2 3.3 0.5 0.1 0.2 0.2 0.1 0.0 0.8 0.5 0.0 100
C: Glass (mol fraction) 0.63 0.28 0.06 0.01 0.00 0.00 0.00 0.00 0.00 0.01 0.01 0.00 1.00
D: Dark phase (mass%) 64.9 4.7 28.5 0.1 0.1 0.4 1.1 0.0 0.0 0.2 0.0 0.0 100
E: Oxide area analysis (mass%) 79.1 12.8 4.9 0.4 0.2 0.0 0.3 0.0 0.0 1.6 0.3 0.2 100

99
Fig. 58 (a): Phases in Top segment of coal-ore sample reacted at 1500°C for 15 minutes (Right hand image is area in blue block enlarged)
CB
A
Element Fe Si Al Ca K Ba Ti Mg Mn S P Na Total A: Metal (mass%) 99.8 0.1 0.1 0 0 0 0 0 0 0 0 0 100
B: Needles (mass%) 79.0 18.9 0.5 0.8 0.1 0 0 0 0.1 0 0.4 0.1 100
C: FeO grains (mass%) 98.2 0.3 0.9 0 0 0 0.1 0 0.2 0 0 0.2 100
B: Needles (mol fraction) 0.66 031 0.01 0.01 0.00 0.00 0.00 0.00 0.00 0.00 0.01 0.00 1.00
Fig. 58 (b): Phases in Top segment of coal-ore sample reacted at 1500°C for 15 minutes (Right hand image is area in blue block enlarged; black blocks = analysed area)
A
B
Element Fe Si Al Ca K Ba Ti Mg Mn S P Na Total
A: Glass (mass%) 61.8 19.9 5.8 0.8 0.3 0.0 8.8 0.7 0.5 1.1 0.2 0.2 100
A: Glass (mol fraction) 0.48 0.30 0.09 0.01 0.00 0.00 0.08 0.01 0.00 0.01 0.00 0.00 1.00
B: Metal (mass%) 99.2 0.3 0.2 0.0 0.0 0.0 0.0 0.1 0.1 0.0 0.1 0.0 100

100
3.6. Effect of particle size The effect of particle size fraction was tested to gauge the relative importance of the reduction reaction
and the gasification reaction, respectively. The basis size fraction of -850 +425 µm was used for ore
and coal particles. For particle size fraction testing the coal in the mixture was changed to a smaller
size fraction of -425 +300 µm and a larger size fraction of -2000 +1400 µm, respectively whilst using
the ore of the basis size. The same variation in ore particle size was used in combination with the basis
size fraction coal. The samples were reacted at 1400°C furnace temperature for 9 minutes reaction
time. The variation in reduction extent and carbon consumption are summarised in Table 14.
Table 14: Effect of particle size variation at 1400°C and 9 minutes for 40 mm layer material
Sample Change
Ore size fraction (µm)
Coal size fraction (µm)
Composite %R*
Top Segment
%R* %C
consumption
Top Segment %C
consumption Average kW/ m2
Coarse Ore -2000 +1400 -850 +425 17 33 27 36 -152
Coarse Coal -850 +425 -2000 +1400 15 25 22 41 -146
Fine Coal -850 +425 -425 +300 21 40 28 53 -153
Fine Ore -425 +300 -850 +425 23 44 23 39 -153
Basis -850 +425 -850 +425 16 31 22 30 -178 %R = %Reduction
The product gas reducing potential is shown in Fig. 59. Heat transferred to the sample as a function of
composite reduction extent is shown in Fig. 60. The energy input into the samples with larger and
smaller particles are similar in magnitude, and the energy input values of this group is lower than that
of the basis case. Although the energy input among the particle size variation samples is similar the
reduction extent in the top node of these samples differs significantly. Different product gas
temperature may result from different particle size material reacted (for example, if the mixture is
more reactive, reaction can occur at a lower temperature, leading to a lower bed temperature and hence
a lower off-gas temperature). To quantify the possible effect of different product gas temperature on
the total heat transfer to the sample (as required for reduction), a simple heat-mass balance was used to
calculate the heat input to the sample with product gas temperature variation of ±100°C. The resultant
variation in total heat transfer was ±3 MJ/m2. This is small compared with the differences in heat
transferred (for similar degrees of reduction) for the beds of different particle sizes (see Fig. 60).
A clear increase in reduction extent is seen when smaller ore or coal particles are reacted, as compared
to reaction of larger ore and coal particles. Increased reduction extent achieved for decreased particle
size is most likely due to decreased diffusion barriers to reacting gases in the case of reduction and
gasification. Alternatively, reduced particle sizes may reduce the effect of diffusion barriers as a result
of increased surface area of reacting particles. The presence of diffusional barriers to reduction gasses
as a result of glass phase formation was shown in Fig. 54 and Fig. 57. Variable gasification extent of

101
char particles in close proximity is also seen in Fig. 54 (b); compare the char particle in top left hand
corner with the char particle in bottom left hand corner. Increased reduction rates for smaller coal and
ore particles indicate that the reduction reaction and the gasification reaction in combination are
important. The increased reduction extent for fine coal and fine ore is confirmed from the higher
reducing potential in the product gas as shown in Fig. 59. Carbon consumption differences are
significant in the top node, but explanation of the relative differences is complicated by the effect of
devolatilisation gases in reduction on the overall carbon consumption. Increased ore particle size does
not result in significant change in reduction extent, whilst increased coal particle size results in
decreased reduction extent, confirming the importance of diffusion effects on the reduction reaction.
Fig. 59: %CO/(%CO+CO2) in product gas: 9 minute reaction time at 1400°C furnace temperature for 40 mm material layer and different particle sizes
0
10
20
30
40
50
60
70
80
90
100
0 60 120 180 240 300 360 420 480 540
Time (s)
%C
O/(%
CO
+%C
O2)
*100
FeO/Fe equilibrium at 4 mm
C+CO2=2CO equilibrium at 4 mm
FeO/Fe equilibrium at 10 mm
C+CO2=2CO equilibrium at 10 mm
FeO/Fe equilibrium at surface
C+CO2=2CO equilibruim at surface
Basis
Coarse Ore
Coarse Coal
Fine Coal
Fine Ore
Sample lowered

102
Fig. 60: Total radiation heat transferred vs. Composite %Reduction
(Number inside square frame shows reaction time in minutes)
Comparison for material layer temperatures for fine and coarse ore and coal particle sizes is shown in
Fig. 61 (a) and (b). Except for the material layer temperatures at 10 mm from the sample surface, the
temperatures for fine and coarse ore particle sizes in the samples are similar. For variation in coal
particle size it is clear from Fig. 61 (b) that material layer temperatures are lower in the case of fine
coal as compared to coarse coal. This temperature difference indicates increased energy use for
reaction of the sample rather than heating the sample, in agreement with higher reaction extents for
smaller sized particles as shown in Table 14.
0
20
40
60
80
100
120
140
160
180
200
0 5 10 15 20 25 30 35 40 45
Composite %Reduction
Tota
l rad
iatio
n he
at tr
ansf
er to
sam
ple
surf
ace
(MJ/
m^2
)
1400°C; 40 mm layerthickness
1500°C; 40 mm layerthickness
1300°C; 40 mm layerthickness
Char; 1400°C; 40 mm layerthickness
Coarse Ore; 1400°C; 40 mmlayer thickness
Coarse Coal; 1400°C; 40 mmlayer thickness
Fine Coal; 1400°C; 40 mmlayer thickness
Fine Ore; 1400°C; 40 mmlayer thickness
15
3
6
9
12
3
6
9
12
15
15
12
9
6
3
3
9
6
15
12
9 9 9 9

103
Fig. 61 (a): Material layer temperatures for fine and coarse ore particles
Fig. 61 (b): Material layer temperatures for fine and coarse coal particles
050
100150200250300350400450500550600650700750800850900950
100010501100115012001250
0 60 120 180 240 300 360 420 480 540
Time (s)
Tem
pera
ture
(°C
)
Coarse Ore - Real T_Surface (°C) Fine Ore - Real T_Surface (°C) Sample lowered4 mm - Fine Ore 10 mm - Fine Ore 20 mm - Fine Ore30 mm - Fine Ore 4 mm - Coarse Ore 10 mm - Coarse Ore20 mm - Coarse Ore 30 mm - Coarse Ore
050
100150200250300350400450500550600650700750800850900950
100010501100115012001250
0 60 120 180 240 300 360 420 480 540
Time (s)
Tem
pera
ture
(°C
)
Coarse Coal - Real T_Surface (°C) Fine Coal - Real T_Surface (°C) Sample lowered4 mm - Fine Coal 10 mm - Fine Coal 20 mm - Fine Coal30 mm - Fine Coal 4 mm - Coarse Coal 10 mm - Coarse Coal20 mm - Coarse Coal 30 mm - Coarse Coal
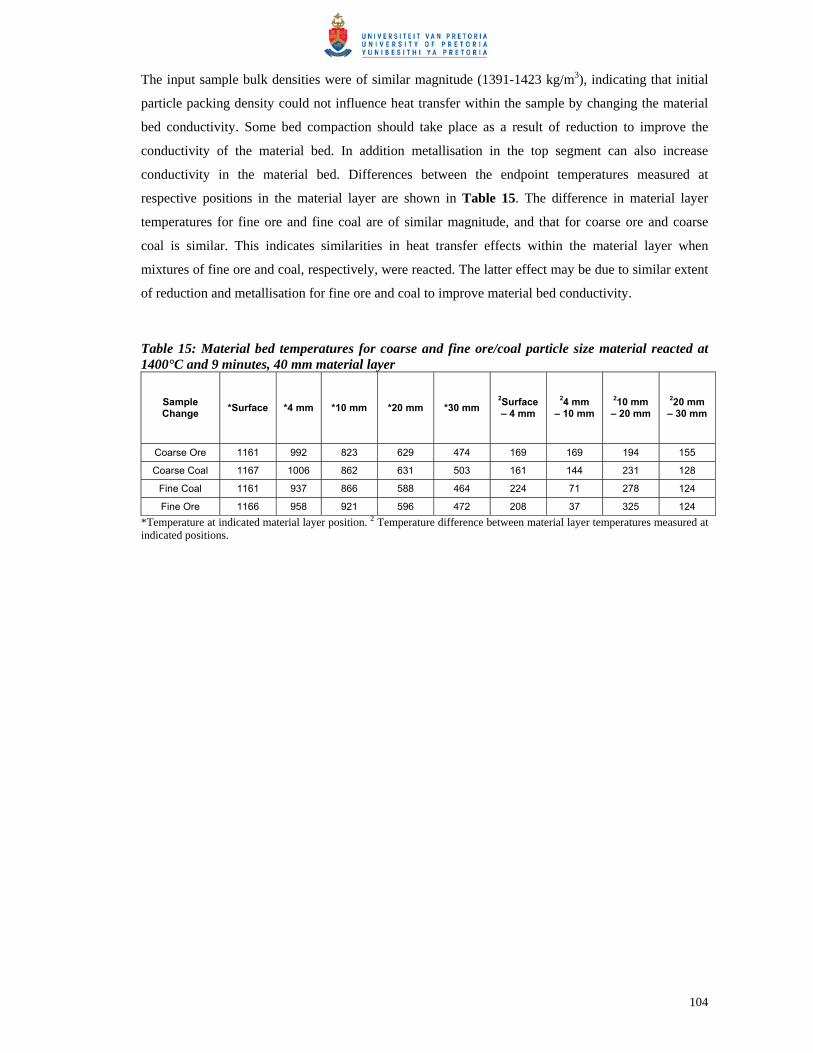
104
The input sample bulk densities were of similar magnitude (1391-1423 kg/m3), indicating that initial
particle packing density could not influence heat transfer within the sample by changing the material
bed conductivity. Some bed compaction should take place as a result of reduction to improve the
conductivity of the material bed. In addition metallisation in the top segment can also increase
conductivity in the material bed. Differences between the endpoint temperatures measured at
respective positions in the material layer are shown in Table 15. The difference in material layer
temperatures for fine ore and fine coal are of similar magnitude, and that for coarse ore and coarse
coal is similar. This indicates similarities in heat transfer effects within the material layer when
mixtures of fine ore and coal, respectively, were reacted. The latter effect may be due to similar extent
of reduction and metallisation for fine ore and coal to improve material bed conductivity.
Table 15: Material bed temperatures for coarse and fine ore/coal particle size material reacted at 1400°C and 9 minutes, 40 mm material layer
Sample Change *Surface *4 mm *10 mm *20 mm *30 mm
2Surface – 4 mm
24 mm – 10 mm
210 mm – 20 mm
220 mm – 30 mm
Coarse Ore 1161 992 823 629 474 169 169 194 155
Coarse Coal 1167 1006 862 631 503 161 144 231 128
Fine Coal 1161 937 866 588 464 224 71 278 124
Fine Ore 1166 958 921 596 472 208 37 325 124 *Temperature at indicated material layer position. 2 Temperature difference between material layer temperatures measured at indicated positions.

105
3.7. Conclusions and Future Work
• The simulation experiment developed in this work adequately quantifies radiation heat transfer
to a material layer heated uni-directionally from the sample surface. These results show the
importance of heat transfer in the IFCON® process.
• Radiative and conduction heat transfer control prevails for 16 mm to 40 mm material layers
heated uni-directionally from the material layer surface. Radiative heat transfer control is
indicated by the persistent temperature differential measured between the sample surface and the
furnace heating zone temperatures and increased reaction extent achieved with increased
radiation heat transfer to the sample surface. At 1400°C furnace temperature the temperature
differentials between the main radiation heat source, heating zone at 1410°C, and the sample
surface temperatures were 266-303°C for 40 mm material layers, and 240-287°C for 16 mm
material layers. Conduction heat transfer control is indicated by the persistent temperature
differentials within the material layer measured after initial heating of the material layer.
Increased reaction extent for decreased material layer thickness confirms conduction heat
transfer control in the material layer. At 1400°C furnace temperature the temperature
differentials between the material layer surface temperature and the material layer bottom
temperatures were 543-995°C for 40 mm material layers, and 914-105°C for 16 mm material
layers. At 15 minutes reaction time of a 16 mm layer the temperature differentials within the
material layer were eliminated.
• Coal volatiles contribute to reduction in a 40 mm layer material bed, mainly in the form of
hydrogen. Some CO and CO2 are also released as volatile material at higher material bed
temperatures.
• The product gas for the coal-ore material layers reacted non-isothermally in this work is of
sufficiently high reducing potential to reduce FeO to Fe, even from the start of reaction when
only the sample surface is at high temperature. The product gas analyses follow a reducing
potential between that of the FeO/Fe and the C/CO2 equilibrium values.
• Reduction of Sishen fine ore does not follow a single reaction mechanism because of variability
of gangue content and porosity in the ore grains. The metal product formed is ferrite. Glass
phase of Fayalite (2FeO.SiO2) stoichiometry was formed. Therefore reduction did not follow
exclusively solid state reduction, but reduction occurred in a semi-molten state. The lowered
oxide liquidus temperature, compared to that of FeO, limits the maximum temperature to which
the heap surface can be heated without bulk melting, and so sets a limit to radiation heat transfer
rates which are practically attainable.

106
• Increased ore size fraction from -850 +425 µm to -2000 +1400 µm, did not result in significant
change in reduction extent and carbon consumption. However a clear increase in reduction
extent and carbon consumption was seen when a reduced ore size fraction of -425 +300 µm was
reacted. Increased reduction extent and increased carbon consumption were observed when a
reduced coal size fraction of -425 +300 µm (from -850 +425 µm) was reacted. For increased
coal size fraction to -2000 +1400 µm reduction extent decreased and carbon consumption
increased. Increased reaction rates for smaller coal and ore particles are most likely due to
decreased diffusion barriers in smaller particles.
• Increased reduction extent is achieved with increased radiation heat transfer to the sample
surface, irrespective of factors such as reductant reactivity and material layer thickness.
• Future work should include a mathematical model of the reaction system presented in this work.
Such a model will provide a method to test the effect of individual possible rate controlling
parameters independently from each other: radiation heat transfer, conduction heat transfer
within the material layer, gasification rate, reduction rate and devolatilisation rate. The effect of
each of these parameters on the overall reaction system productivity can be tested individually in
the model by adjusting the model parameters that determine each of these parameters: furnace
heating surface temperatures to simulate radiation heat transfer effects, material bed thermal
conductivity to simulate conduction heat transfer effects within the material layer, reaction rate
constants to simulate the effects of reaction rates for reduction, gasification and devolatilisation.

107
CHAPTER IV: REFERENCES
Abraham, M.C., Gosh, A., 1979. Kinetics of reduction of iron by carbon. Ironmaking and
Steelmaking, No. 1, pp 14-23.
Ajersch, F., 1987. Chemical and physical characteristics affecting the reduction kinetics of iron oxide
pellets with solid carbon. Canadian Metallurgical Quarterly, Vol. 26, No. 2, pp 137-144.
Al-Kahtany, M.M., Rao, Y.K., 1980. Reduction of magnetite with hydrogen: Part 1 intrinsic kinetics.
Ironmaking and Steelmaking, No. 2, pp 49-58.
Arendt, P., van Heek, K.-H., 1981. Comparative investigations of coal pyrolysis under inert gas and
H2 at low and high heating rates and pressures up to 10 MPa. Fuel, Vol. 60, September, pp 779-787.
Aukrust, A., 1992. Results of the AISI/DOE direct steelmaking program. Proceedings of the
Savard/Lee International Symposium on Bath Smelting, The Mineral, Metal & Materials Society, pp
591-610.
Bandyopadhyay, D., Gosh, A., 1996. Validity of rate equation on Langmuir-Hinshelwood mechanism
for gasification of carbon – a reappraisal. Steel Research, Vol. 67, No. 3, pp 79-86.
Blackwood, J.D., McGrory, F., 1958. The carbon-steam reaction at high pressure. Australian Journal
of Chemistry, Vol. 11, pp 16-33.
Borlée, J., Steyls, D., Colin, R., Munnix, R., Economopoulos, M., 1999. COMET: a coal-based
process for the production of high quality DRI from iron ore fines. La Revue de Métallurgie-CIT,
March, pp 331-339.
Bornman, C.J., Ackerman, J.P., 1993. World’s largest coal-based direct reduction plant-nine years
later. Steel Times International, March, pp 18-22.
Chase, M.W., Jr., NIST-JANAF Thermochemical Tables, Fourth Edition, 1998. American Institute of
Physics, Woodbury, New York.
Coats, A.W., Redfern, J.P., 1964. Kinetic Parameters from Thermogravimetric Data. Nature (London),
Vol. 201, pp. 68-69.
108
Coetsee, T., Pistorius, P.C., de Villiers, E.E., 2002. Rate-determining steps for reduction in magnetite-
coal pellets. Minerals Engineering, Vol. 15, pp. 919-929.
Contrucci, M. de A., 2000. Tecnored process industrial plant construction. Conference:
Commercializing New Hot Metal Processes Beyond the Blast Furnace. Atlanta, Georgia, USA, June
5-7, 2000.
Cunningham, B.C., Stephenson, J.G., Direct Reduced Iron – technology and economics of production
and use, Chapter 6, Direct Reduction Processes. 1980. The Iron & Steel Society of AIME,
Warrendale, U.S.A., p. 67.
Cusack, B.L., Wingrove, G.S., Hardie, G.J., 1995. Initial operation of the Hismelt® research and
development facility. Iron and Steelmaker, February, pp 13-20.
Desypris, J., Murdoch, P., Williams, A., 1982. Investigation of the flash pyrolysis of some coals. Fuel,
Vol. 61, September, pp 807-816.
Devanathan, N., Saxena, S.C., 1987. Transport model for devolatilization of large nonplastic coal
particles: The effect of secondary reactions. Ind. Eng. Chem. Res., Vol. 26, pp 539-548.
Dey, S.K., Jana, B., Basumallick, A., 1993. Kinetics and reduction characteristics of hematite-
noncoking coal mixed pellets under nitrogen gas atmosphere. ISIJ International, Vol. 33, No. 7, pp
735-739.
Dixit, S. K., Ray, H.S., 1982. Use of reciprocal temperature rise equation in analysis of non-isothermal
kinetic data in general. Thermochimica Acta, Vol. 54, pp 245-250.
Dutta, S.K., Gosh, A., 1994. Study of nonisothermal reduction of iron ore-coal/char composite pellet.
Metallurgical Transactions B, Vol. 25B, February, pp 15-26.
Dutta, S., Wen, C.Y., Belt, R.J., 1977. Reactivity of coal and char. 1.In carbon dioxide atmosphere.
Ind. Eng. Chem., Process Des. Dev., Vol. 16, No. 1, pp 20-30.
El-Geassy, A.A., Shehata, K.A., Ezz, S.Y., 1977. Mechanism of iron oxide reduction with
hydrogen/carbon monoxide mixtures. Transactions ISIJ, Vol. 17, pp 629-635.

109
El-Rahaiby, S.K., Rao, Y.K., 1979. The kinetics of reduction of iron oxides at moderate temperatures.
Metallurgical Transactions B, Vol. 10B, June, pp 257-269.
Ergun, S., 1956. Kinetics of the reaction of carbon dioxide with carbon. Journal of Physical
Chemistry, Vol. 60, pp 480-485.
Flickenschild, A. J., Reufer, F., Eberle, A., Siuka, D., 1996. Combined Cores/DRI technology. Iron
and Steel Engineer, August, pp 25-29.
Floyd, J.M., 2000. Research and development of Ausmelt technology. The Brimacombe Memorial
Symposium, TMS, ISS, CIM, 1-4 October, pp 173-191.
Fortini, O.M., Fruehan, R.J., 2005. Rate of Reduction of Ore-Carbon Composites: Part II. Modeling of
Reduction in Extended Composites. Metallurgical Transactions B, Vol. 36B, December, pp 709-717.
Fourie, L.J., 1995. U.S. Patent No. 5411570. Steelmaking Process. 2 May 1995.
Fourie, L.J., 2000. U.S. Patent No. 6146437. Metal containing compound reduction and melting
process. 14 November 2000.
Fourie, L.J., DeVilliers, J.P., 2003. U.S. Patent No. 6537342. Induction furnace for a metal reduction
and melting process. 25 March 2003.
Fruehan, R.J., 1977. The rate of reduction of iron oxides by carbon. Metallurgical Transactions B,
Vol. 8B, June, pp 279-286.
Ghosh, P.C., Tiwari, S.N., 1970. Reduction of pellets of iron ore plus lignite coke. Journal of The Iron
and Steel Institute, March, pp 255-257.
Gou, H., Lu, W.-K., 1998. Using the RHF/SRV or RHF/EAF to produce liquid iron at low coal rate.
Iron and Steelmaker, March, pp. 81-86.
Goyal, A., Rehmat, A., 1993. Modeling of a fluidised-bed coal carbonizer. Ind. Eng. Chem. Res., Vol.
32, pp 1396-1410.
Haque, R., Ray, H.S., Mukherjee, A., 1992a. Packed bed reduction of iron ore fines by coal fines:
effect of operating variables. Ironmaking and Steelmaking, Vol. 19, No. 1, pp 31-35.

110
Haque, R., Ray, H.S., Mukherjee, A., 1992b. Carburisation of directly reduced iron during reduction
of iron ore fines by coal fines. Ironmaking and Steelmaking, Vol. 19, No. 2, pp 127-130.
Haque, R., Ray, H.S., Mukherjee, A., 1993. Reduction of iron ore fines by coal fines in a packed bed
and fluidized bed apparatus-a comparative study. Metallurgical Transactions B, Vol. 24B, June, pp
511-520.
Haworth, D.J., Doel, P.J., Hinrichsen, J.D., 1995. Davy DRC: Coal-based direct reduction in China.
Iron and Steel Engineer, April, pp 76-80.
Hoffman, G.E., Harada, T., 1997. A status report on the FASTMET® process from the Kakogawa
demonstration plant. Iron and Steelmaker, May, pp 51-53.
Holman, J.P., Heat Transfer Seventh Edition in SI Units, McGraw-Hill International (UK) Limited,
Singapore, 1992.
Huang, N-H., Lu, W.-K., 1993. Kinetics and mechanisms of reactions in iron ore/coal composites. ISIJ
International, Vol. 33, No. 10, pp 1055-1061.
Jones, J.F., Schmid, M.R., 1964. Fluidized bed pyrolysis of coal. Chemical Engineering Progress,
Vol. 60, No. 6, 1964, pp 69-73.
Johnstone, H.F., Chen, C.Y., Scott, D.S., 1952. Kinetics of the steam-carbon reaction in porous
graphite tubes. Industrial and Engineering Chemistry, Vol. 44, No. 7, pp 1564-1569.
Jüntgen, H., Van Heek, K.H., 1979. An update of German non-isothermal coal pyrolysis work. Fuel
Processing Technology, Vol. 2, pp 261-293.
Kapteijn, F., Meijer, R., Moulijn, J.A., 1994. On why do different carbons show different gasification
rates: A transient isotopic CO2 gasification study. Carbon, Vol. 32, No. 7, pp 1223-1231.
Kayembe, N., Pulsifer, A.H., 1976. Kinetics and catalysis of the reaction of coal char and steam. Fuel,
Vol. 55, pp 211-216.
Kubaschewski, O., Alcock, C.B., Spencer, P.J., Materials Thermochemistry, Sixth Edition, Pergamon
Press Ltd., 1993.

111
Kühl, H., Kashani-Motlagh, M.M., Mühlen, H.-J., Van Heek, K.H., 1992. Controlled gasification of
different carbon materials and development of pore structure. Fuel, Vol. 71, pp 879-882.
Lide, D.R. (Ed.), CRC Handbook of Chemistry and Physics, 86th Edition, 2005-2006. CRC Press.,
Boca Raton, Florida.
McKewan, W.M., 1960. Kinetics of Iron Oxide Reduction. Trans. Met. Soc. AIME, Vol. 218, pp 2-6.
McKewan, W.M., 1961. Reduction Kinetics of Magnetite in H2-H2O-N2 Mixtures. Trans. Met. Soc.
AIME, Vol. 221, pp 140-145.
McKewan, W.M., 1962a. Reduction Kinetics of Magnetite in Hydrogen at High Pressures. Trans. Met.
Soc. AIME, Vol. 224, pp 2-5.
McKewan, W.M., 1962b. Reduction Kinetics of Magnetite in Hydrogen at High Pressures. Trans.
Met. Soc. AIME, Vol. 224, pp 387-393.
Meraikib, M., Friedrichs, H.A., 1987. On the isothermal reduction of iron ore pellets with carbon
monoxide, hydrogen, and their mixtures. Steel Research, Vol. 58, No. 10, pp.439-445.
Mookherjee, S., Ray, H.S., Mukherjee, A., 1985a. Thermogravimetric studies on the reduction of
hematite ore fines by a surrounding layer of coal or char fines. Part 1. Isothermal kinetic studies.
Thermochimica Acta, Vol. 95, pp 235-246.
Mookherjee, S., Ray, H.S., Mukherjee, A., 1985b. Thermogravimetric studies on the reduction of
hematite ore fines by a surrounding layer of coal or char fines. Part 2. Non-isothermal kinetic studies.
Thermochimica Acta, Vol. 95, pp 247-256.
Mookherjee, S., Ray, H.S., Mukherjee, A., 1986. Isothermal reduction of iron ore fines surrounded by
coal or char fines. Ironmaking and Steelmaking, Vol.13, No. 5, pp 229-235.
Nabi, G., Lu, W-K., 1968. Reduction Kinetics of Hematite to Magnetite in Hydrogen-Water Vapor
Mixtures. Trans. Met. Soc. AIME, Vol. 242, pp 2471-2477.
Nashan, G., Rohde, W., Wessiepe, K., 2000. Long term perspectives for the cokemaking technology
from an individual country’s view. Cokemaking International, No. 1, pp 44-47.

112
Nasr, M.I., Omar, A.A., Khadr, M.H., El-Geassy, A.A., 1994. Analysis of solid-state reduction of iron
ore from a couple of experimental measurements. Scandinavian Journal of Metallurgy, Vol. 23, pp
119-125.
Otsuka, K-I., Kunii, D., 1969. Reduction of powdery ferric oxide mixed with graphite particles.
Journal of Chemical Engineering of Japan, Vol. 2, No. 1, pp 46-50.
Patisson, F., Lebas, E, Hanrot, F., Ablitzer, D., Houzelot, J., 2000. Coal pyrolysis in a Rotary Kiln:
Part I. Model of the pyrolysis of a single grain. Metallurgical and Materials Transactions B, Vol. 31B,
April, pp 381-390.
Peters, W., Bertling, H., 1965. Kinetics of the rapid degasification of coals. Fuel, Vol. 44, 1965, pp
317-331.
Pilcher, J.M., Walker, P.L., Wright, C.C., 1955. Kinetic study of the steam-carbon reaction. Industrial
and Engineering Chemistry. Vol. 47, No. 9, pp 1742-1749.
Pistorius, P.C., 2005. Kinetics of carbothermic reduction reactions under heat transfer control:
modelling results. Scandinavian Journal of Metallurgy, Vol. 34, pp. 122-130.
Prakash, S., 1994. Non-isothermal kinetics of iron ore reduction. Ironmaking and Steelmaking, Vol.
21, No. 3, pp. 237-243.
Prakash, S., Goswami, M.C., Mahapatra, A.K.S., Ghosh, K.C., Das, S.K., Sinha, A.N., Mishra, K.K.,
2000. Morphology and reduction kinetics of fluxed iron ore pellets. Ironmaking and Steelmaking, Vol.
27, No. 3, pp. 194-201.
Prakash, S., Ray, H. S., 1990. Prediction of reduction kinetics of iron ore under fluctuating
temperature conditions. ISIJ International, Vol. 30, No. 3, pp 183-191.
Prakash, S., Ray, H. S., 1991. Moving-bed studies on reaction behaviour of ion ore and coal/char
mixtures in gasifying agents. Fuel, Vol. 70, January, pp. 17-23.
Prakash, S., Ray, H.S., Gupta, K.N., 1986. Bench-scale experiment to simulate vertical retort process
for production of direct reduced iron. Ironmaking and Steelmaking, vol. 13, No. 2, pp. 76-79.

113
Quets, J.M., Wadsworth, M.E., Lewis, J.R., 1960. Kinetics of Hydrogen Reduction of Magnetite.
Trans. Met. Soc. AIME, Vol. 218, pp 545-550.
Rao, Y.K., 1971. The kinetics of reduction of hematite by carbon. Metallurgical Transactions, Vol. 2,
May, pp 1439-1447.
Rao, Y.K., 1979. Mechanism and the intrinsic rates of reduction of metallic oxides. Metallurgical
Transactions B, Vol. 10B, June, pp 243-255.
Rao, Y.K., Jalan, B.P., 1972. A study of the rates of carbon-carbon dioxide reaction in the temperature
range 839° to 1050°C. Metallurgical Transactions, Vol. 3, September, pp 2465-2477.
Rao, Y.K., Moinpour, M., 1983. Kinetics of reduction of hematite with hydrogen gas at modest
temperatures. Metallurgical Transactions B, Vol. 14B, December, pp 711-723.
Reddy, G.V., Sharma, T., Chakravorty, S., 1991. Kinetic rate equation for direct reduction of iron ore
by non-coking coal. Ironmaking and Steelmaking, Vol. 18, No. 3, pp 211-213.
Reif, A.E., 1952. The mechanism of the Carbon Dioxide-Carbon reaction. Journal of Physical
Chemistry, Vol. 56, pp 785-788.
Rierson, D.W., 1993. The ported kiln concept as applied to the grate-kiln system. Skillings’ Mining
Review, April 3, pp 4-10.
Rio Tinto News Realease, 9 November 2006, Hismelt® Homepage: http://www.hismelt.com.au
Roman-Moguel, G.J., Brimacombe, J.K., 1988. Kinetics of direct reduction of unagglomerated iron
ore with coal char. W.O. Philbrook Symposium Conference Proceedings, pp 39-59.
Romenets, V., Valavin, V., Pokvisnev, Yu., Vandariev, S., 1999. Processing industrial wastes with the
liquid-phase reduction Romelt process. Journal of Metals, August, pp 33-37.
Saito, K., 1992. Study on direct iron ore smelting reduction process (DIOS) and future program.
Proceedings of the Savard/Lee International Symposium on Bath Smelting, The Mineral, Metal &
Materials Society, pp 589-590.

114
Sampaio, R.S., Fruehan, R.J., Ozturk, B., 1992. Rate of coal devolatilization in iron and steelmaking
processes. Part I – Experimental results. Iron and Steelmaker, August, pp 49-57.
Sarma, B, Fruehan, R.J., 1998. A review of coal-based direct ironmaking processes. 1998
ICSTI/Ironmaking Conference Proceedings, pp 1537-1548.
Seaton, C.E., Foster, J.S., Velasco, J., 1983. Reduction kinetics of hematite and magnetite pellets
containing coal char. Transactions ISIJ, Vol. 23, pp 490-496.
Shivaramakrishna, N., Sakar, S.B., Prasad, K.K., 1996. The role of internal coal in the reduction of
composite pellets. SEAISI Quarterly, April, pp 82-95.
Sohn, I., Fruehan, R.J., 2006a. Reduction of Iron Oxides by Volatiles in a Rotary Hearth Furnace
Process: Part II. The Reduction of Iron Oxide/Carbon Composites. Metallurgical Transactions B, Vol.
37B, April, pp 223-229.
Sohn, I., Fruehan, R.J., 2006b. Reduction of Iron Oxides by Volatiles in a Rotary Hearth Furnace
Process: Part III. The Simulation of Volatile Reduction in a Multi-Layer Rotary Hearth Furnace
Process. Metallurgical Transactions B, Vol. 37B, April, pp 231-238.
Srinivasan, N.S., Lahiri, A.K., 1977. Studies on the reduction pf hematite by carbon. Metallurgical
Transactions B, Vol. 8B, March, pp 175-178.
Stubington, J.F., Sumaryono, 1984. Release of volatiles from large coal particles in a hot fluidised
bed. Fuel, Vol. 63, July, pp 1013-1019.
Sun, S., Lu, W.-K., 1992. A Non-Isothermal Mathematical Model for Reduction of Iron Ore in
Ore/Coal Composites. 10th PTD Conference Proceedings, pp. 403-408.
Sun, S., Lu, W.-K., 1993. Mathematical Modelling of Reactions in Iron Ore/Coal Composites. ISIJ
International, Vol 33, No 10, pp. 1062-1069.
Sun, S., Lu, W.-K., 1996. A study of kinetics and mechanisms of iron ore reduction in ore/coal
composites. 1996 Steelmaking Conference Proceedings, pp 641-647.
Sun, S., Lu, W.K., 1999a. Building of a mathematical model for the reduction of iron ore in ore/coal
composites. ISIJ International, Vol. 39, No. 2, pp 130-138.

115
Sun, S., Lu, W.K., 1999b. A theoretical investigation of kinetics and mechanisms of iron ore reduction
in an ore/coal composite. ISIJ International, Vol. 39, No. 2, pp 123-129.
Tomeczek, J., Kowol, J., 1991. Temperature field within a devolatilizing coal particle. The Canadian
Journal of Chemical Engineering, Vol. 69, February, pp 286-293.
Tomeczek, J., Palugniok, H., 1996. Specific heat capacity and enthalpy of coal pyrolysis at elevated
temperatures. Fuel, Vol. 75, No. 9, pp 1089-1093.
Towhidi, N., Szekely, J., 1981. Reduction kinetics of commercial low-silica hematite pellets with CO-
H2 mixtures over temperature range 600°-1234°C. Ironmaking and Steelmaking, No. 6, pp 237-249.
Towhidi, N., Szekely, J., 1983. The influence of carbon deposition on the reduction kinetics of
commercial grade hematitie pellets with CO, H2, and N2. Metallurgical Transactions B, Vol. 14B,
September, pp 359-367.
Trushenski, S.P., Li, K., Philbrook, W.O., 1974. Non-Topochemical Reduction of Iron Oxides.
Metallurgical Transactions, Vol. 5, pp 1149-1158.
Tsay, Q.T., Ray, W.H., Szekely, J., 1976. The Modeling of Hematite Reduction with Hydrogen Plus
Carbon Monoxide Mixtures: Part I The Bahvior of Single Pellets. AIChe Journal, Vol. 22, No. 6, pp
1064-1072.
Turkdogan, E.T., Koump, V., Vinters, J.V., Perzak, T.F., 1968. Rate of oxidation of graphite in carbon
dioxide. Carbon, Vol. 6, pp 467-484.
Turkdogan, E.T., Vinters, J.V., 1969. Kinetics of oxidation of graphite and charcoal in carbon dioxide.
Carbon, Vol. 7, pp 101-117.
Turkdogan, E.T., Vinters, J.V., 1972. Gaseous reduction of iron oxides: Part III. Reduction-oxidation
of porous and dense iron oxides and iron. Metallurgical Transactions, Vol. 3, June, pp 1561-1574.
Turkdogan, E.T., Vinters, J.V., 1974. Catalytic effect of iron on decomposition of carbon monoxide: I.
Carbon deposition in H2-CO mixtures. Metallurgical Transactions, Vol. 5, January, pp 11-19.
Tyler, R.J., Smith, I.W., 1975. Reactivity of petroleum coke to carbon dioxide between 1030 and
1180K. Fuel, Vol. 54, pp 99-104.

116
Venkateswaran, V., Brimacombe, J.K., 1977. Mathermatical model of the SL/RN direct reduction
process. Metallurgical Transactions B, Vol. 8B, September, pp 387-398.
Von Fredersdorff, C.G., Elliott, M.A., Chemistry of Coal Utilization, Chapter 20, Coal Gasification.
1963. John Wiley & Sons, Inc., U.S.A., p. 925-931.
Walker, P.L., Jr., Rusinko, F, Jr., Austin, L.G., Advances in catalysis, Vol. 11, pp 134-221, Academic
Press, Inc., New York, 1959.
Wang, Q., Yang, Z., Tian, J., Li, W., Sun, J., 1997. Mechanisms of reduction in iron ore-coal
composite pellet. Ironmaking and Steelmaking, Vol. 24, No. 6, pp 457-460.
Wang, Q., Yang, Z., Tian, J., Li, W., Sun, J., 1998. Reduction kinetics of iron ore-coal pellet during
fast heating. Ironmaking and Steelmaking, Vol. 25, No. 6, pp 443-447.
Warner, N.A., 1964. Reduction kinetics of hematite and the influence of gaseous diffusion.
Transactions of the Metallurgical Society of AIME, Vol. 230, February, pp 163-176.
Wiesinger, H., 2000. At the frontiers of technology. Iron and Steelmaker, January, pp 47-48.
Wong, H.Y., Handbook of Essential Formulae and Data on Heat Transfer for Engineers, Longman
Group Limited, London, 1977.
Wright, J.K., Bowling, K., McG., Morrison, A.L., 1981. Reduction of hematite pellets with carbonised
coal in a static bed. Transactions ISIJ, Vol. 2, pp 149-155.
Wu, P.C., Lower, W.E., Hottel, H.C., 1988. Reaction kinetics of carbon dioxide with electrode carbon
particles. Fuel, Vol. 67, February, pp 205-214.

117
CHAPTER V: APPENDICES

118
Appendix I Gas retention times for samples & Product gas calculations
Time multiple data for graphite and pre-reduced Sishen ore sample mixtures
n.p. = component not present in product gas
Sam
ple
Ref
eren
ce N
o.
Sam
ple
low
ered
tim
e [s
econ
ds]
Re-
zero
tim
e - %
H2
[sec
onds
]
Re-
zero
tim
e - %
CO
2 [s
econ
ds]
Re-
zero
tim
e - %
CO
[sec
onds
]
Re-
zero
tim
e - %
H2O
[sec
onds
]
Re-
zero
tim
e - %
CH
4 [s
econ
ds]
Sam
ple
rem
oval
tim
e [s
econ
ds]
Gas
rete
ntio
n tim
e in
furn
ace
tube
vol
ume
[sec
onds
]
Re-
zero
tim
e/ga
s re
tent
ion
time
- %H
2 [s
econ
ds]
Re-
zero
tim
e/ga
s re
tent
ion
time
- %C
O2
[sec
onds
]
Re-
zero
tim
e/ga
s re
tent
ion
time
- %C
O [s
econ
ds]
Re-
zero
tim
e/ga
s re
tent
ion
time
- %H
2O [s
econ
ds]
1300A 1503 1359 1558 1682 1161 n.p. 3347 159 -1 0 1 -21300B 1498 154 1559 2271 499 n.p. 3417 159 -8 0 5 -61400C 897 n.p. 952 999 508 n.p. 2701 159 n.p. 0 1 -21400D 897 350 954 1145 315 n.p. 2821 159 -3 0 2 -41500E 260 355 344 332 482 n.p. 1388 159 1 1 0 11500F 268 337 337 360 325 n.p. 1503 159 0 0 1 0
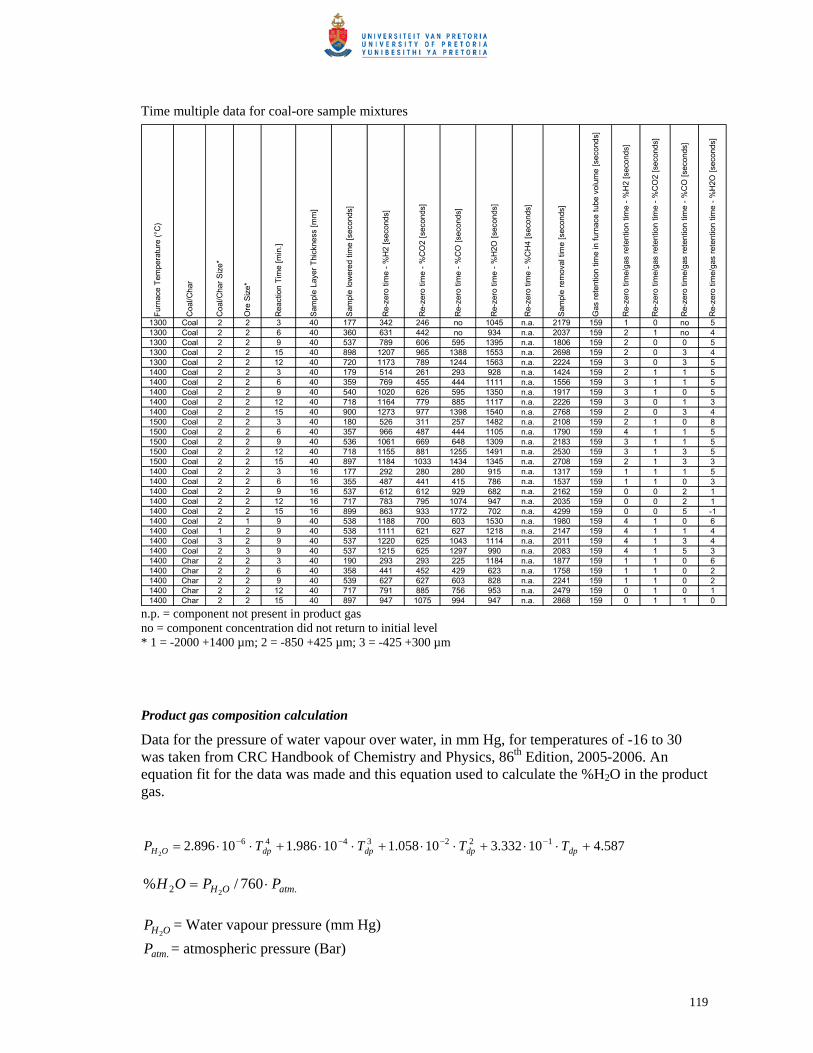
119
Time multiple data for coal-ore sample mixtures
n.p. = component not present in product gas no = component concentration did not return to initial level * 1 = -2000 +1400 µm; 2 = -850 +425 µm; 3 = -425 +300 µm Product gas composition calculation
Data for the pressure of water vapour over water, in mm Hg, for temperatures of -16 to 30 was taken from CRC Handbook of Chemistry and Physics, 86th Edition, 2005-2006. An equation fit for the data was made and this equation used to calculate the %H2O in the product gas.
587.410332.310058.110986.110896.2 12234462
+⋅⋅+⋅⋅+⋅⋅+⋅⋅= −−−−dpdpdpdpOH TTTTP
.2 760/%2 atmOH PPOH ⋅=
OHP
2= Water vapour pressure (mm Hg)
.atmP = atmospheric pressure (Bar)
Furn
ace
Tem
pera
ture
(°C
)
Coa
l/Cha
r
Coa
l/Cha
r Siz
e*
Ore
Siz
e*
Rea
ctio
n Ti
me
[min
.]
Sam
ple
Laye
r Thi
ckne
ss [m
m]
Sam
ple
low
ered
tim
e [s
econ
ds]
Re-
zero
tim
e - %
H2
[sec
onds
]
Re-
zero
tim
e - %
CO
2 [s
econ
ds]
Re-
zero
tim
e - %
CO
[sec
onds
]
Re-
zero
tim
e - %
H2O
[sec
onds
]
Re-
zero
tim
e - %
CH
4 [s
econ
ds]
Sam
ple
rem
oval
tim
e [s
econ
ds]
Gas
rete
ntio
n tim
e in
furn
ace
tube
vol
ume
[sec
onds
]
Re-
zero
tim
e/ga
s re
tent
ion
time
- %H
2 [s
econ
ds]
Re-
zero
tim
e/ga
s re
tent
ion
time
- %C
O2
[sec
onds
]
Re-
zero
tim
e/ga
s re
tent
ion
time
- %C
O [s
econ
ds]
Re-
zero
tim
e/ga
s re
tent
ion
time
- %H
2O [s
econ
ds]
1300 Coal 2 2 3 40 177 342 246 no 1045 n.a. 2179 159 1 0 no 51300 Coal 2 2 6 40 360 631 442 no 934 n.a. 2037 159 2 1 no 41300 Coal 2 2 9 40 537 789 606 595 1395 n.a. 1806 159 2 0 0 51300 Coal 2 2 15 40 898 1207 965 1388 1553 n.a. 2698 159 2 0 3 41300 Coal 2 2 12 40 720 1173 789 1244 1563 n.a. 2224 159 3 0 3 51400 Coal 2 2 3 40 179 514 261 293 928 n.a. 1424 159 2 1 1 51400 Coal 2 2 6 40 359 769 455 444 1111 n.a. 1556 159 3 1 1 51400 Coal 2 2 9 40 540 1020 626 595 1350 n.a. 1917 159 3 1 0 51400 Coal 2 2 12 40 718 1164 779 885 1117 n.a. 2226 159 3 0 1 31400 Coal 2 2 15 40 900 1273 977 1398 1540 n.a. 2768 159 2 0 3 41500 Coal 2 2 3 40 180 526 311 257 1482 n.a. 2108 159 2 1 0 81500 Coal 2 2 6 40 357 966 487 444 1105 n.a. 1790 159 4 1 1 51500 Coal 2 2 9 40 536 1061 669 648 1309 n.a. 2183 159 3 1 1 51500 Coal 2 2 12 40 718 1155 881 1255 1491 n.a. 2530 159 3 1 3 51500 Coal 2 2 15 40 897 1184 1033 1434 1345 n.a. 2708 159 2 1 3 31400 Coal 2 2 3 16 177 292 280 280 915 n.a. 1317 159 1 1 1 51400 Coal 2 2 6 16 355 487 441 415 786 n.a. 1537 159 1 1 0 31400 Coal 2 2 9 16 537 612 612 929 682 n.a. 2162 159 0 0 2 11400 Coal 2 2 12 16 717 783 795 1074 947 n.a. 2035 159 0 0 2 11400 Coal 2 2 15 16 899 863 933 1772 702 n.a. 4299 159 0 0 5 -11400 Coal 2 1 9 40 538 1188 700 603 1530 n.a. 1980 159 4 1 0 61400 Coal 1 2 9 40 538 1111 621 627 1218 n.a. 2147 159 4 1 1 41400 Coal 3 2 9 40 537 1220 625 1043 1114 n.a. 2011 159 4 1 3 41400 Coal 2 3 9 40 537 1215 625 1297 990 n.a. 2083 159 4 1 5 31400 Char 2 2 3 40 190 293 293 225 1184 n.a. 1877 159 1 1 0 61400 Char 2 2 6 40 358 441 452 429 623 n.a. 1758 159 1 1 0 21400 Char 2 2 9 40 539 627 627 603 828 n.a. 2241 159 1 1 0 21400 Char 2 2 12 40 717 791 885 756 953 n.a. 2479 159 0 1 0 11400 Char 2 2 15 40 897 947 1075 994 947 n.a. 2868 159 0 1 1 0

120
dpT = water dewpoint (°C)
100%%
%%
20
⋅+∑
=OHg
gg i
a
an
60%% p
n
nArg
tArg
QQ ⋅=
22400/gg Qn = =ng% % of component g in gas =ag% % of component analysed by mass spectrometer
∑i
ag0
% = sum of % of components 0 to i analysed by mass spectrometer
=ArQ Ar flow rate into experiment [Ncm3/min.] =gQ flow rate of gas g in product gas [Ncm3/min.] =pt time interval [seconds] =gn mol gas g in product gas for time interval pt

121
Appendix II View factor calculations for radiation network
The view factors were calculated as follows.
From parallel disk geometry (Wong, 1977):
)4(2
1 222224 CBXX
BF −−=
hr
B 2=
hr
C 4=
)1( 22 CBX ++=
=ijF view factor from area i to j
=ir radius of disk [m]
=h separation distance between disks [m]
Ai = area of surface i [m2]
Similarly the following view factors were calculated: F27, F2(3+4), F28, F(3+4)7, F47, F48, F(3+4)8, F87.
2721 1 FF −=
022 =F
24)43(223 FFF −= +
282725 FFF −=
)43(22826 +−= FFF
1211 21 FF −= ; 1712 FF =
1
22112 A
AFF =
2)43(7)43(1)43( +++ −= FFF
)43(
2)43(22)43(
+++ =
AA
FF
1
)43(1)43()43(1 A
AFF +
++ =

122
14)43(113 FFF −= +
1
44114 A
AFF =
424741 FFF −=
1
55115 A
AFF =
)FFFFF(F 151413121116 1 ++++−=
424741 FFF −=
043 =F ; 044 =F
474845 FFF −=
)(1 45424146 FFFF ++−=
525751 FFF −=
5857 FF =
8785 1 FF −=
5
88558 A
AFF =
5
22552 A
AFF =
54)43(553 FFF −= +
5
435)43()43(5 A
AAFF
+= ++
7)43(8)43(5)43( +++ −= FFF
5
44554 A
AFF =
5855 21 FF −=
)(1 555453525156 FFFFFF ++++−=
3
11331 A
AFF =

123
3
22332 A
AFF =
034 =F ; 033 =F
3
55335 A
AFF =
3
66336 A
AFF =
6
11661 A
AFF =
6
22662 A
AFF =
64)43(663 FFF −= +
68)43(6 FF =+ ; 8)43(6)43( 1 ++ −= FF
6
44664 A
AFF =
6866 21 FF −= ; )43(668 += FF
)(1 666463626165 FFFFFF ++++−=

124
Appendix III
Surface temperature measurement for alumina sample (1300°C a)
Surface temperature measurement for alumina sample (1300°C b)
050
100150200250300350400450500550600650700750800850900950
10001050110011501200
0 240 480 720 960 1200 1440 1680 1920 2160 2400 2640 2880 3120
Time (s)
Tem
pera
ture
(°C
)
5 mm 10 mm 20 mm 30 mm T_surface_real (°C)
050
100150200250300350400450500550600650700750800850900950
10001050110011501200
0 240 480 720 960 1200 1440 1680 1920 2160 2400 2640 2880 3120 3360 3600
Time (s)
Tem
pera
ture
(°C
)
5 mm 10 mm 20 mm 30 mm T_surface_real (°C)

125
Surface temperature measurement for alumina sample (1400°C)
Surface temperature measurement for alumina sample (1500°C) (Filtered data for thermocouple placed 5 mm from sample surface shown)
050
100150
200250300350400450500
550600650700750800850
900950
10001050110011501200
1250130013501400
0 240 480 720 960 1200 1440 1680 1920 2160 2400 2640 2880
Time (s)
Tem
pera
ture
(°C
)
5 mm 10 mm 20 mm 30 mm T_surface_real (°C)
050
100150200250300350400450500550600650700750800850900950
1000105011001150120012501300135014001450
0 240 480 720 960 1200 1440 1680 1920 2160 2400 2640 2880 3120 3360 3600
Time (s)
Tem
pera
ture
(°C
)
5 mm f iltered 10 mm 20 mm 30 mm T_surface_real (°C)

126
Surface temperature measurement for alumina sample (1500°C) (Both filtered and original data for thermocouple placed 5 mm from sample surface shown)
1000
1050
1100
1150
1200
1250
1300
1350
1400
1450
0 240 480 720 960 1200 1440 1680 1920 2160 2400 2640 2880 3120 3360 3600
Time (s)
Tem
pera
ture
(°C
)5 mm filtered 10 mm 20 mm 30 mm T_surface_real (°C) 5 mm

127
Appendix IV
Chemical Analyses of Input Materials Ore Analyses
Sishen Fines:
-425 +300 µm
Sishen Fines: -850 +425
µm
Sishen Fines: -2000 +1400
µm
Pre-Reduced Sishen Fines
Al2O3 1.35 1.64 1.35 1.81 CaO 0.25 0.19 0.25 0.10 Cr <0.05 <0.05 <0.05 n.d. Fe(total) 63.5 63.0 63.5 71.1 Fe0 n.d. n.d. n.d. 0.64 FeO n.d. n.d. n.d. 68.1 Fe2O3 n.d. n.d. n.d. 25.0 K2O 0.20 0.23 0.20 0.23 MgO 0.08 0.05 0.08 0.04 MnO 0.03 0.04 0.03 0.04 Ni <0.05 <0.05 <0.05 n.d. P 0.05 0.05 0.05 0.05 SiO2 3.43 3.95 3.43 3.84 C 0.03 0.01 0.03 n.d. S 0.01 0.02 0.01 n.d. Ba <0.05 0.49 <0.05 n.d. TiO2 0.06 0.10 0.06 0.08 Moisture 0.02 0.01 0.02 n.d. XRD analysis of pre-reduced Sishen fines
Hand milled, top loading onto zero-background holder due to small sample size Analysed using a PANalytical X’Pert Pro powder diffractometer with X’Celerator detector and variable divergence- and roeceiving slits with Fe filtered Co-Kα radiation Phases identified using X’Pert Highscore plus software
Position [°2Theta]10 20 30 40 50 60 70 80
Counts
0
2000
4000
6000
8000
Coetzee_TCFeO
Peak List 01-076-1849; Fe3 O4; Magnetite 01-089-0686; Fe0.925 O; Wuestite, syn 01-087-1165; Fe2 O3; Hematite 01-071-1399; Fe2 Si O4; Fayalite, syn 03-065-0466; Si O2; Quartz low, syn 03-065-4899; Fe
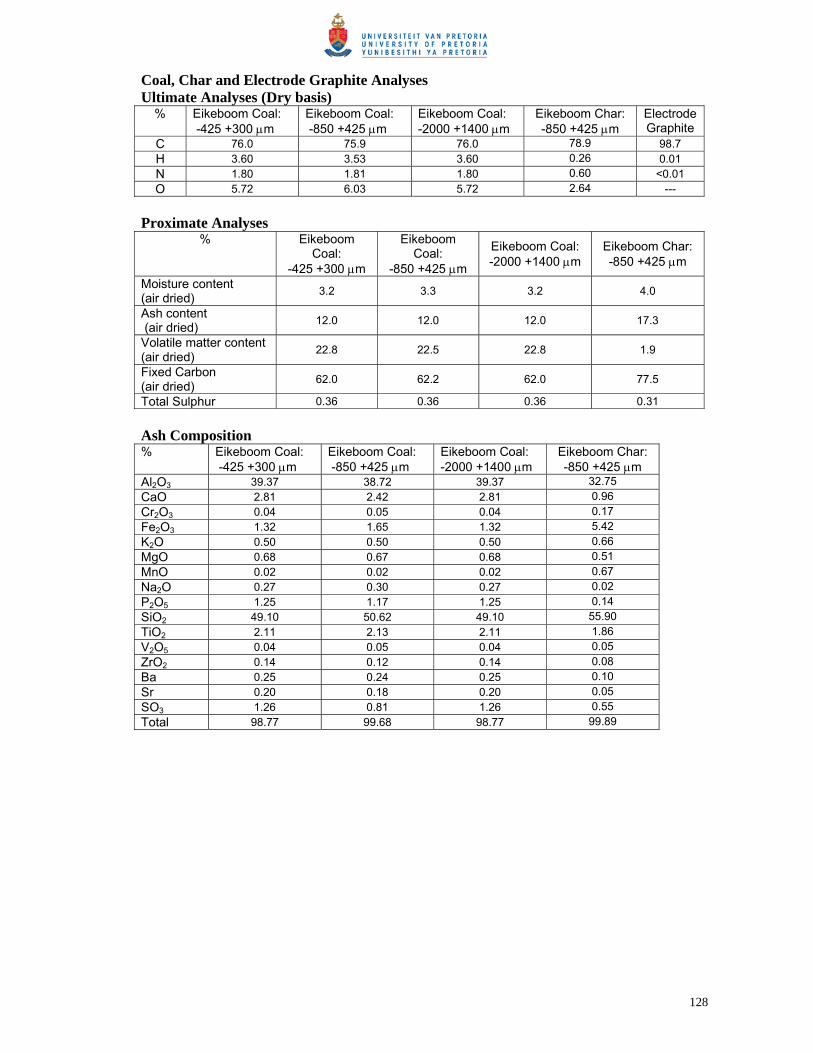
128
Coal, Char and Electrode Graphite Analyses Ultimate Analyses (Dry basis)
% Eikeboom Coal: -425 +300 µm
Eikeboom Coal: -850 +425 µm
Eikeboom Coal: -2000 +1400 µm
Eikeboom Char: -850 +425 µm
Electrode Graphite
C 76.0 75.9 76.0 78.9 98.7 H 3.60 3.53 3.60 0.26 0.01 N 1.80 1.81 1.80 0.60 <0.01 O 5.72 6.03 5.72 2.64 ---
Proximate Analyses
% Eikeboom Coal:
-425 +300 µm
Eikeboom Coal:
-850 +425 µm
Eikeboom Coal: -2000 +1400 µm
Eikeboom Char: -850 +425 µm
Moisture content (air dried) 3.2 3.3 3.2 4.0
Ash content (air dried) 12.0 12.0 12.0 17.3
Volatile matter content (air dried) 22.8 22.5 22.8 1.9
Fixed Carbon (air dried) 62.0 62.2 62.0 77.5
Total Sulphur 0.36 0.36 0.36 0.31 Ash Composition % Eikeboom Coal:
-425 +300 µm Eikeboom Coal: -850 +425 µm
Eikeboom Coal: -2000 +1400 µm
Eikeboom Char: -850 +425 µm
Al2O3 39.37 38.72 39.37 32.75 CaO 2.81 2.42 2.81 0.96 Cr2O3 0.04 0.05 0.04 0.17 Fe2O3 1.32 1.65 1.32 5.42 K2O 0.50 0.50 0.50 0.66 MgO 0.68 0.67 0.68 0.51 MnO 0.02 0.02 0.02 0.67 Na2O 0.27 0.30 0.27 0.02 P2O5 1.25 1.17 1.25 0.14 SiO2 49.10 50.62 49.10 55.90 TiO2 2.11 2.13 2.11 1.86 V2O5 0.04 0.05 0.04 0.05 ZrO2 0.14 0.12 0.14 0.08 Ba 0.25 0.24 0.25 0.10 Sr 0.20 0.18 0.20 0.05 SO3 1.26 0.81 1.26 0.55 Total 98.77 99.68 98.77 99.89

129
Appendix V Mass measurements of sand samples divided in Sample Cutter-Splitter
Cru
cibl
e N
umbe
r
Fibr
e Bo
ard
Cru
cibl
e M
ass
In
(g.)
Sand
Mas
s In
(g.)
g. S
and
- Top
Nod
e
g. S
and
- Mid
dle
Nod
e
g. S
and
- Bot
tom
Nod
e
g. F
ibre
Boa
rd -
Top
Nod
e
g. F
ibre
Boa
rd -
Mid
dle
Nod
e
g. F
ibre
Boa
rd -
Botto
m N
ode
Mas
s Sa
nd o
ut (g
.)
Mas
s Fi
bre
boar
d ou
t (g.
)
Mas
s%To
p N
ode
Mas
s% M
iddl
e N
ode
Mas
s% B
otto
m N
ode
Mas
s%To
p N
ode
Mas
s% M
iddl
e N
ode
Mas
s% B
otto
m N
ode
Mas
s Sa
nd In
- M
ass
Sand
Out
(g.)
Mas
s Fi
bre
Boar
d In
- M
ass
Fibr
e Bo
ard
Out
(g.)
Sum
of S
and
and
FB M
ass
Diff
eren
ces
(g)
1 21.05 36.52 17.3 12.4 7.9 6.6 4.3 8.6 37.65 19.48 46 33 21 34 22 44 1.13 -1.57 -0.442 20.93 36.52 18.3 12.4 7.0 6.7 4.2 8.4 37.70 19.39 48 33 19 35 22 44 1.18 -1.55 -0.373 21.56 36.53 18.1 12.3 7.4 6.7 4.4 8.9 37.83 19.98 48 33 20 34 22 45 1.30 -1.58 -0.284 20.45 36.52 18.2 12.7 6.8 6.6 4.2 8.3 37.63 19.10 48 34 18 35 22 43 1.11 -1.34 -0.235 20.23 36.52 16.9 12.8 8.1 5.9 4.3 8.3 37.84 18.58 45 34 21 32 23 45 1.31 -1.66 -0.346 20.24 36.52 16.4 12.9 8.1 5.5 4.1 8.4 37.41 17.96 44 34 22 31 23 47 0.88 -2.28 -1.407 21.02 36.52 17.8 12.7 7.4 6.5 4.3 8.5 37.94 19.34 47 33 20 34 22 44 1.42 -1.68 -0.268 19.90 36.52 17.2 12.7 8.0 6.0 4.2 8.2 37.86 18.34 45 34 21 33 23 45 1.34 -1.57 -0.229 21.10 36.52 16.9 12.8 8.4 5.4 4.4 9.5 38.03 19.34 44 34 22 28 23 49 1.51 -1.76 -0.2510 21.16 36.53 16.8 12.6 8.5 6.6 4.5 8.4 37.93 19.47 44 33 22 34 23 43 1.41 -1.69 -0.28
Average 20.76 36.52 17.4 12.6 7.8 6.3 4.3 8.6 37.8 19.1 46 33 21 33 22 45Population Standard Deviation
0.6 0.2 0.5 0.5 0.1 0.4 1.7 0.5 1.4 2.0 0.5 1.7
95% Confidence Limit
0.4 0.1 0.3 0.3 0.1 0.2 1.0 0.3 0.9 1.2 0.3 1.0

130
Appendix VI Calibration sample masses and analyses
Sample Mix Out Fibreboard Thermocouples Totals Out In
Sam
ple
Nam
e
Sam
ple
Ref
eren
ce N
o.
Rea
ctio
n Ti
me
(min
utes
)
g. s
ampl
e m
ix -
top
g. s
ampl
e m
ix -
mid
dle
g. s
ampl
e m
ix -
botto
m
g. F
ibre
boar
d - t
op
g. F
ibre
boar
d -m
iddl
e
g. F
ibre
boar
d -b
otto
m
g. th
erm
ocou
ple
- top
g. th
erm
ocou
ple
- mid
dle
g. th
erm
ocou
ple
-bot
tom
Tota
l g. s
ampl
e m
ix o
ut
Tota
l g. F
ibre
boea
rd o
ut
Tota
l g. T
herm
ocou
ples
out
g. F
ibre
boar
d in
g. M
ix in
mas
s% "F
eO" i
n
mas
s% G
raph
ite in
19_09_2006_1300_A_25 1300A 25 15.981 16.182 11.261 13.906 3.371 12.299 0.16 0.098 0.328 43.424 29.576 0.586 31.854 43.787 85.4 14.619_09_2006_1300_B_25 1300B 25 18.615 15.453 8.847 10.798 6.092 12.643 0 0 0 42.915 29.533 0 31.264 43.218 85.4 14.620_09_2006_1400_C_15 1400C 15 16.283 16.030 9.815 11.435 6.303 13.048 0.234 0.217 0.193 42.128 30.786 0.644 32.365 44.023 85.4 14.620_09_2006_1400_D_15 1400D 15 15.534 15.739 10.043 11.572 5.972 12.867 0.346 0.337 0.534 41.316 30.411 1.217 32.096 43.017 85.4 14.621_09_2006_1500_E_4.5 1500E 4.3 18.954 16.168 9.610 11.560 6.162 13.160 0 0 0 44.732 30.882 0 32.395 44.519 85.4 14.621_09_2006_1500_F_4.5 1500F 4.5 11.482 15.372 18.011 5.814 6.784 16.174 0 0 0 44.865 28.772 0 30.868 43.968 85.4 14.6

131
Sample out Fe analyses Sample out Fe analyses - Corrected*
Sam
ple
Ref
eren
ce N
o.
%Fe
(met
) - T
op
%Fe
(met
) - M
iddl
e
%Fe
(met
) - B
otto
m
%Fe
O -
Top
%Fe
O -
Mid
dle
%Fe
O -
Bot
tom
%Fe
2O3
-Top
%Fe
2O3
- Mid
dle
%Fe
2O3
- Bot
tom
%Fe
(tota
l) - T
op
%Fe
(tota
l) - M
iddl
e
%Fe
(tota
l) - B
otto
m
%Fe
(met
) - T
op (C
orre
cted
)*
%Fe
(met
) - M
iddl
e (C
orre
cted
)*
%Fe
(met
) - B
otto
m (C
orre
cted
)*
%Fe
O -
Top
(Cor
rect
ed)*
%Fe
O -
Mid
dle
(Cor
rect
ed)*
%Fe
O -
Botto
m (C
orre
cted
)*
%Fe
2O3
- Top
(Cor
rect
ed)*
%Fe
2O3
- Mid
dle
(Cor
rect
ed)*
%Fe
2O3
- Bot
tom
(Cor
rect
ed)*
%Fe
(+2)
- To
p (C
orre
cted
)*
%Fe
(+2)
- M
iddl
e (C
orre
cted
*)
%Fe
(+2)
- Bo
ttom
(Cor
rect
ed)*
%Fe
(+3)
- To
p (C
orre
cted
*)
%Fe
(+3)
- M
iddl
e (C
orre
cted
*)
%Fe
(+3)
- Bo
ttom
(Cor
rect
ed*)
%Fe
(tota
l) - T
op (C
orre
cted
)*
%Fe
(tota
l) - M
iddl
e (C
orre
cted
)*
%Fe
(tota
l) - B
otto
m (C
orre
cted
)*
g. F
e in
/ g. F
e ou
t
1300A 15.6 0.2 0.2 51.5 57.2 52.6 11.6 20.5 24.0 63.8 59.1 57.9 16.2 0.3 0.2 53.6 60.3 55.5 12.06 21.61 25.34 41.6 46.8 43.1 8.4 15.1 17.7 66.3 62.2 61.1 1.011300B 11.4 0.1 0.1 52.5 57.7 52.7 17.6 20.9 21.6 64.5 59.5 56.2 11.6 0.1 0.1 53.6 61.0 54.1 17.98 22.08 22.19 41.6 47.3 42.1 12.6 15.4 15.5 65.9 62.9 57.7 1.001400C 17.3 0.1 0.2 53.4 57.5 53.1 11.5 19.7 21.3 66.9 58.6 56.4 17.6 0.1 0.2 54.4 61.2 55.1 11.72 20.96 22.12 42.3 47.5 42.8 8.2 14.7 15.5 68.1 62.3 58.5 1.041400D 23.0 0.1 0.1 47.5 59.8 55.8 6.5 18.8 20.7 64.5 59.8 58.0 23.7 0.1 0.1 49.0 63.8 57.8 6.71 20.05 21.45 38.1 49.5 44.9 4.7 14.0 15.0 66.5 63.7 60.1 1.041500E 4.3 0.4 0.4 56.4 46.9 51.2 17.2 31.9 26.2 60.2 59.2 58.5 4.4 0.4 0.4 57.1 49.3 53.9 17.41 33.53 27.57 44.3 38.3 41.8 12.2 23.5 19.3 60.9 62.1 61.5 1.021500F 7.1 0.2 0.4 58.0 50.2 50.8 12.1 26.2 27.3 60.7 57.6 58.9 7.1 0.2 0.4 58.1 53.2 54.0 12.13 27.77 29.04 45.2 41.3 42.0 8.5 19.4 20.3 60.7 61.0 62.7 1.01

132
*Corrected for Fibreboard carry over
Product gas analysed %C calculated vs. Analysed Mass C in and out g. Mass loss g. O to gas
Sam
ple
Ref
eren
ce N
o.
Tota
l g. C
O2
in P
rodu
ct G
as
Tota
l g. C
H4
in P
rodu
ct G
as
Tota
l g. C
O in
Pro
duct
Gas
Tota
l g. H
2 in
Pro
duct
Gas
Tota
l g. H
2O in
Pro
duct
Gas
%C
out
ana
lyse
d - t
op (C
orre
cted
)*
%C
out
calc
ulat
edfro
min
crem
enta
lM
ass
&E
nerg
y
Bal
ance
- To
p
%C
out
ana
lyse
d - m
iddl
e (C
orre
cted
)*
%C
out
calc
ulat
edfro
min
crem
enta
lM
ass
&E
nerg
yB
alan
ce -
Mid
dle
%C
out
ana
lyse
d - b
otto
m (C
orre
cted
)*
%C
out
calc
ulat
edfro
min
crem
enta
lM
ass
&E
nerg
yB
alan
ce -
Bot
tom
%Fi
xed
Car
bon
in s
tart
mix
ture
Tota
l g. C
in
g. C
in -
top
g. C
in -
mid
dle
g. C
in -
botto
m
Tota
l g. C
rem
aini
ng in
sam
ple
Tota
l g. C
con
sum
ptio
n ac
cord
ing
to %
C c
hem
ical
ana
g. C
to g
as -
Prod
uct g
as a
naly
sis
g. C
to g
as a
ccor
ding
to in
crem
enta
l Mas
s &
Ene
rgy
Bal
ance
g. C
to g
as a
ccor
ding
to c
hem
ical
AN
ALY
SIS
- to
p
g. C
to g
as a
ccor
ding
to c
hem
ical
AN
ALY
SIS
- m
iddl
e
g. C
to g
as a
ccor
ding
to c
hem
ical
AN
ALY
SIS
- bo
ttom
Mas
sa L
oss
acco
rdin
g to
Pro
duct
gas
[Tot
al T
ime]
Mas
slo
ssca
lcul
ated
inin
crem
enta
lm
ass
&en
ergy
bala
nce
g. O
in C
O &
CO
2 Pr
oduc
t gas
[Tot
al T
ime]
g.O
From
Red
uctio
nto
gas
acco
rdin
gto
incr
emen
tal
Mas
s &
Ener
gy B
alan
ceg.
OFr
omR
educ
tion
toga
sac
cord
ing
toin
crem
enta
l
Mas
s &
Ener
gy B
alan
ce
1300A 0.92 0.00 2.34 0.03 0.75 12.9 14.5 13.2 13.5 15.1 12.7 14.4 6.4 2.9 2.1 1.3 5.6 0.77 1.25 0.58 0.96 0.09 -0.27 4.0 2.2 2.0 0.9 0.91300B 0.56 0.00 1.71 0.01 0.21 12.4 12.9 12.7 13.7 18.7 15.6 14.4 6.3 2.9 2.1 1.3 5.7 0.59 0.89 0.45 0.65 0.23 -0.29 2.5 1.3 1.4 0.7 0.71400C 0.99 0.03 1.30 0.01 0.30 10.5 14.1 13.5 13.7 18.0 14.5 14.4 6.4 3.0 2.1 1.3 5.4 1.01 0.83 0.54 1.28 0.08 -0.35 2.6 1.8 1.5 1.0 1.01400D 0.63 0.00 2.96 0.01 0.14 12.2 13.4 11.1 13.5 16.2 13.7 14.4 6.3 2.9 2.1 1.3 5.0 1.24 1.44 0.83 1.05 0.43 -0.25 3.7 2.2 2.2 1.3 1.31500E 0.72 0.02 0.41 0.01 0.29 16.8 15.1 12.2 12.2 13.9 14.4 14.4 6.5 3.0 2.1 1.4 6.3 0.21 0.37 0.13 -0.16 0.27 0.10 1.5 0.7 0.8 0.3 0.31500F 0.33 0.01 0.47 0.01 0.12 14.6 21.6 14.3 12.7 13.6 7.5 14.4 6.4 3.0 2.1 1.3 6.1 0.36 0.29 0.17 1.28 0.04 -0.96 0.9 0.6 0.5 0.3 0.3

133
*Corrected for Fibreboard carry over
g. Al2O3 pick-up g. SiO2 pick-up %Al2O3 - Out %SiO2 - Out Corrected masses out Correced Fibreboard masses
Sam
ple
Ref
eren
ce N
o.
g. A
l2O
3 In
g. A
l2O
3 ou
t
g. S
iO2
In
g. S
iO2
out
Tota
l g. A
l2O
3 pi
ck-u
p
Tota
l g. S
iO2
pick
-up
g. A
l2O
3 pi
ck-u
p - t
op
g. A
l2O
3 pi
ck-u
p - m
iddl
e
g. A
l2O
3 pi
ck-u
p - b
otto
m
g. S
iO2
pick
-up
- top
g. S
iO2
pick
-up
- mid
dle
g. S
iO2
pick
-up
- bot
tom
%Al
2O3
Anal
ysed
-Top
%A
l2O
3 A
naly
sed
-Mid
dle
%Al
2O3
Anal
ysed
-Bot
tom
%S
iO2
Ana
lyse
d -T
op
%S
iO2
Ana
lyse
d -M
iddl
e
%Si
O2
Ana
lyse
d -B
otto
m
g. s
ampl
e m
ix o
ut -
Top
( Cor
rect
ed)*
g. s
ampl
e m
ix o
ut -
Mid
dle
( Cor
rect
ed)*
g. s
ampl
e m
ix o
ut -
Botto
m (
Cor
rect
ed)*
g. F
ibre
boar
d ou
t - T
op (
Cor
rect
ed)*
g. F
ibre
boar
d ou
t - M
iddl
e ( C
orre
cted
)*
g. F
ibre
boar
d ou
t - B
otto
m (
Cor
rect
ed)*
1300A 0.68 1.91 1.44 2.24 1.24 0.81 0.42 0.51 0.31 0.19 0.32 0.29 4.59 4.52 3.99 5.35 4.92 5.26 15.4 15.4 10.7 14.5 4.2 12.91300B 0.67 1.54 1.42 2.00 0.87 0.58 0.23 0.50 0.14 0.16 0.32 0.10 2.88 4.68 3.15 4.37 5.12 4.47 18.2 14.6 8.6 11.2 6.9 12.91400C 0.68 1.71 1.45 2.05 1.03 0.61 0.20 0.61 0.21 0.11 0.35 0.15 3.17 5.22 3.64 4.74 5.18 4.61 16.0 15.1 9.5 11.7 7.3 13.41400D 0.67 1.74 1.41 2.15 1.08 0.74 0.31 0.59 0.18 0.18 0.39 0.17 3.95 5.15 3.17 5.31 5.43 4.69 15.1 14.8 9.7 12.1 7.0 13.21500E 0.69 1.65 1.46 1.99 0.96 0.53 0.17 0.50 0.29 0.05 0.29 0.19 2.58 4.48 4.52 3.82 4.77 5.15 18.7 15.4 9.1 11.8 6.9 13.61500F 0.68 1.89 1.44 2.21 1.21 0.77 0.15 0.54 0.52 -0.12 0.33 0.56 3.99 4.97 3.69 4.77 5.24 4.78 11.5 14.5 16.9 5.8 7.7 17.3

134
Incremental Heat-mass balance calculation sheets for sample 1400C Top Node mass balance
Top Node Mass IN Mass in (g.)
Time (s) Top Node % T (°C) %Reduction %Fe(total) %Fe(met) %Fe(+2) %Fe(+3) g. Fe (total) g. Fe (met) g. FeO g. Fe2O3 g. Al2O3 g. CaO g. K2O g. MgO g. MnO g. P2O5 g. SiO2 g. TiO2 g. C g. Mullite g. H2O g. Ar Total g. in
0 46 25 25.7 71.1 0.6 52.9 17.5 10.9 0.1 10.4 3.8 0.3 0.0 0.0 0.0 0.0 0.0 0.7 0.0 2.91 12.1 0.300 0.0 30.7120 25 25.7 71.1 0.6 52.9 17.5 10.9 0.1 10.4 3.8 0.3 0.0 0.0 0.0 0.0 0.0 0.7 0.0 2.91 12.1 0.300 5.1 35.8240 175 28.5 68.1 0.0 58.2 9.9 10.9 0.0 12.0 2.3 0.3 0.0 0.0 0.0 0.0 0.0 0.7 0.0 2.87 12.1 0.150 5.1 35.5360 497 31.3 68.1 2.0 57.9 8.2 10.9 0.3 11.9 1.9 0.3 0.0 0.0 0.0 0.0 0.0 0.7 0.0 2.81 12.1 0.011 5.1 35.2480 755 34.1 68.1 4.9 55.0 8.2 10.9 0.8 11.3 1.9 0.3 0.0 0.0 0.0 0.0 0.0 0.7 0.0 2.74 12.1 0.000 5.1 34.9600 920 36.9 68.1 7.7 52.2 8.2 10.9 1.2 10.7 1.9 0.3 0.0 0.0 0.0 0.0 0.0 0.7 0.0 2.67 12.1 0.000 5.1 34.7720 1021 39.7 68.1 10.6 49.3 8.2 10.9 1.7 10.1 1.9 0.3 0.0 0.0 0.0 0.0 0.0 0.7 0.0 2.59 12.1 0.000 5.1 34.5840 1059 42.5 68.1 13.5 46.4 8.2 10.9 2.2 9.5 1.9 0.3 0.0 0.0 0.0 0.0 0.0 0.7 0.0 2.50 12.1 0.000 5.1 34.3897 1055 45.3 68.1 16.3 43.6 8.2 10.9 2.6 9.0 1.9 0.3 0.0 0.0 0.0 0.0 0.0 0.7 0.0 2.42 12.1 0.000 2.4 31.4
Top Node Mass OUT Mass Out: 16.0 g. Fe out: 10.9 Mass out (g.)
Time (s) T (°C) %Reduction Aim %Reduction %Fe(total) %Fe(met) %Fe(+2) %Fe(+3) g. Fe (total) g. Fe (met) g. FeO g. Fe2O3 g. Al2O3 g. CaO g. K2O g. MgO g. MnO g. P2O5 g. SiO2 g. TiO2 g. C g. Mullite g. H2O (g) g. Ar g. CO g. CO2 Total g. Out %CO/(%CO+%CO2)
Aim
%CO/(%CO+%CO2)0 25.0 25.7 25.7 68.1 0.00 52.5 15.59 10.9 0.0 10.8 3.6 0.3 0.0 0.0 0.0 0.0 0.0 0.7 0.0 2.92 12.1 0.000 0.0 0.00 0.00 30.7 100 #DIV/0!
120 175 28.5 28.5 68.1 0.00 58.2 9.87 10.9 0.0 12.0 2.3 0.3 0.0 0.0 0.0 0.0 0.0 0.7 0.0 2.87 12.1 0.150 5.1 0.00 0.18 35.8 0 0240 497 31.3 31.3 68.1 2.02 57.9 8.20 10.9 0.3 11.9 1.9 0.3 0.0 0.0 0.0 0.0 0.0 0.7 0.0 2.81 12.1 0.075 5.1 0.03 0.15 35.5 25 25360 755 34.1 34.1 68.1 4.88 55.0 8.20 10.9 0.8 11.3 1.9 0.3 0.0 0.0 0.0 0.0 0.0 0.7 0.0 2.74 12.1 0.038 5.1 0.08 0.12 35.2 50 50480 920 36.9 36.9 68.1 7.74 52.2 8.20 10.9 1.2 10.7 1.9 0.3 0.0 0.0 0.0 0.0 0.0 0.7 0.0 2.67 12.1 0.038 5.1 0.13 0.08 34.9 71 71600 1021 39.7 39.7 68.1 10.60 49.3 8.20 10.9 1.7 10.1 1.9 0.3 0.0 0.0 0.0 0.0 0.0 0.7 0.0 2.59 12.1 0.000 5.1 0.14 0.07 34.7 75 75720 1059 42.5 42.5 68.1 13.46 46.4 8.20 10.9 2.2 9.5 1.9 0.3 0.0 0.0 0.0 0.0 0.0 0.7 0.0 2.50 12.1 0.000 5.1 0.17 0.04 34.5 86 86840 1055 45.3 45.3 68.1 16.32 43.6 8.20 10.9 2.6 9.0 1.9 0.3 0.0 0.0 0.0 0.0 0.0 0.7 0.0 2.42 12.1 0.000 5.1 0.18 0.04 34.3 88 88897 1054 46.6 46.5 68.1 17.60 42.3 8.20 10.9 2.8 8.7 1.9 0.3 0.0 0.0 0.0 0.0 0.0 0.7 0.0 2.38 12.1 0.000 2.4 0.08 0.02 31.4 88 88

135
Top Node heat balance
Top Node kJ INTime (s) Fe (met) FeO Fe2O3 Al2O3 CaO K2O MgO MnO P2O5 SiO2 TiO2 C Mullite H2O Ar kJ IN
0 0.0 -38.2 -19.7 -5.1 -0.2 -0.2 -0.1 0.0 -0.2 -10.0 -0.2 0.0 -192.9 -4.8 0.0 -271.6120 0.0 -38.2 -19.7 -5.1 -0.2 -0.2 -0.1 0.0 -0.2 -10.0 -0.2 0.0 -192.9 -4.8 0.8 -270.8240 0.0 -42.6 -11.4 -5.1 -0.2 -0.1 -0.1 0.0 -0.2 -10.0 -0.2 0.4 -191.3 -2.0 0.8 -261.9360 0.1 -39.5 -8.9 -5.0 -0.2 -0.1 -0.1 0.0 -0.2 -9.7 -0.2 1.7 -187.1 -0.1 0.8 -248.7480 0.4 -35.2 -8.4 -4.9 -0.2 -0.1 -0.1 0.0 -0.2 -9.5 -0.2 2.8 -183.5 0.0 0.8 -238.3600 0.8 -32.0 -8.2 -4.8 -0.2 -0.1 -0.1 0.0 -0.2 -9.4 -0.2 3.6 -181.0 0.0 0.8 -231.0720 1.2 -29.4 -8.0 -4.8 -0.2 -0.1 -0.1 0.0 -0.2 -9.3 -0.2 4.0 -179.5 0.0 0.8 -225.8840 1.5 -27.4 -7.9 -4.8 -0.2 -0.1 -0.1 0.0 -0.2 -9.3 -0.2 4.0 -178.9 0.0 0.8 -222.7897 1.9 -25.7 -7.9 -4.8 -0.2 -0.1 -0.1 0.0 -0.2 -9.3 -0.2 3.9 -179.0 0.0 0.4 -221.4
Top Node kJ OUT
Time (s) Fe (met) FeO Fe2O3 Al2O3 CaO K2O MgO MnO P2O5 SiO2 TiO2 C Mullite H2O Ar CO CO2 kJ OUT (kJ OUT) - (kJ IN)0 0.0 -39.5 -18.4 -5.1 -0.2 -0.2 -0.1 0.0 -0.2 -10.0 -0.2 0.0 -192.9 0.0 0.0 0.0 0.0 -266.8 5
120 0.0 -42.6 -11.4 -5.1 -0.2 -0.1 -0.1 0.0 -0.2 -10.0 -0.2 0.4 -191.3 -2.0 3.5 0.0 -1.6 -260.8 10240 0.1 -39.5 -8.9 -5.0 -0.2 -0.1 -0.1 0.0 -0.2 -9.7 -0.2 1.7 -187.1 -0.9 3.5 -0.1 -1.3 -248.1 14360 0.4 -35.2 -8.4 -4.9 -0.2 -0.1 -0.1 0.0 -0.2 -9.5 -0.2 2.8 -183.5 -0.4 3.5 -0.2 -1.0 -237.3 11480 0.8 -32.0 -8.2 -4.8 -0.2 -0.1 -0.1 0.0 -0.2 -9.4 -0.2 3.6 -181.0 -0.4 3.5 -0.4 -0.6 -229.7 9600 1.2 -29.4 -8.0 -4.8 -0.2 -0.1 -0.1 0.0 -0.2 -9.3 -0.2 4.0 -179.5 0.0 3.5 -0.4 -0.6 -224.0 7720 1.5 -27.4 -7.9 -4.8 -0.2 -0.1 -0.1 0.0 -0.2 -9.3 -0.2 4.0 -178.9 0.0 3.5 -0.5 -0.3 -220.8 5840 1.9 -25.7 -7.9 -4.8 -0.2 -0.1 -0.1 0.0 -0.2 -9.3 -0.2 3.9 -179.0 0.0 3.5 -0.5 -0.3 -219.0 4897 2.0 -25.0 -7.9 -4.8 -0.2 -0.1 -0.1 0.0 -0.2 -9.3 -0.2 3.8 -179.0 0.0 1.7 -0.2 -0.1 -219.6 2
Middle Node mass balance

136
Middle Node Mass IN Mass in (g.)
Time (s) Middle Node % T (°C) %Reduction %Fe(total) %Fe(met) %Fe(+2) %Fe(+3) g. Fe (total) g. Fe (met) g. FeO g. Fe2O3 g. Al2O3 g. CaO g. K2O g. MgO g. MnO g. P2O5 g. SiO2 g. TiO2 g. C g. Mullite g. H2O g. Ar Total g. in
0 33 25 25.6 62.3 0.10 47.5 14.70 9.4 0.0 9.2 3.2 0.2 0.0 0.0 0.0 0.0 0.0 0.5 0.0 2.1 7.0 0.0 0.0 22.2120 25 25.6 62.3 0.1 47.5 14.7 9.4 0.0 9.2 3.2 0.2 0.0 0.0 0.0 0.0 0.0 0.5 0.0 2.1 7.0 0.0 0.0 22.2240 50 25.6 62.3 0.1 47.5 14.7 9.4 0.0 9.2 3.2 0.2 0.0 0.0 0.0 0.0 0.0 0.5 0.0 2.1 7.0 0.0 0.0 22.2360 182 25.6 62.3 0.1 47.5 14.7 9.4 0.0 9.2 3.2 0.2 0.0 0.0 0.0 0.0 0.0 0.5 0.0 2.1 7.0 0.0 0.0 22.2480 404 25.6 62.3 0.1 47.5 14.7 9.4 0.0 9.2 3.2 0.2 0.0 0.0 0.0 0.0 0.0 0.5 0.0 2.1 7.0 0.0 0.0 22.2600 652 25.6 62.3 0.1 47.5 14.7 9.4 0.0 9.2 3.2 0.2 0.0 0.0 0.0 0.0 0.0 0.5 0.0 2.1 7.0 0.0 0.0 22.2720 826 25.6 62.3 0.1 47.5 14.7 9.4 0.0 9.2 3.2 0.2 0.0 0.0 0.0 0.0 0.0 0.5 0.0 2.1 7.0 0.0 0.0 22.2840 958 25.6 62.3 0.1 47.5 14.7 9.4 0.0 9.2 3.2 0.2 0.0 0.0 0.0 0.0 0.0 0.5 0.0 2.1 7.0 0.0 0.0 22.2960 1038 25.6 62.3 0.1 47.5 14.7 9.4 0.0 9.2 3.2 0.2 0.0 0.0 0.0 0.0 0.0 0.5 0.0 2.1 7.0 0.0 0.0 22.2
Middle Node Mass OUT Mass Out: 15.1 g. Fe out: 9.4 Mass out (g.)
Time (s) T (°C) %Reduction %Fe(total) %Fe(met) %Fe(+2) %Fe(+3) g. Fe (total) g. Fe (met) g. FeO g. Fe2O3 g. Al2O3 g. CaO g. K2O g. MgO g. MnO g. P2O5 g. SiO2 g. TiO2 g. C g. Mullite g. H2O g. Ar g. CO g. CO2 Total g. Out
0 25.0 25.6 62.3 0.10 47.5 14.70 9.4 0.0 9.2 3.2 0.2 0.0 0.0 0.0 0.0 0.0 0.5 0.0 2.1 7.0 0.0 0.0 0 0 22.2120 50 25.6 62.3 0.1 47.5 14.7 9.4 0.0 9.2 3.2 0.2 0.0 0.0 0.0 0.0 0.0 0.5 0.0 2.1 7.0 0.0 0.0 0 0 22.2240 182 25.6 62.3 0.1 47.5 14.7 9.4 0.0 9.2 3.2 0.2 0.0 0.0 0.0 0.0 0.0 0.5 0.0 2.1 7.0 0.0 0.0 0 0 22.2360 404 25.6 62.3 0.1 47.5 14.7 9.4 0.0 9.2 3.2 0.2 0.0 0.0 0.0 0.0 0.0 0.5 0.0 2.1 7.0 0.0 0.0 0 0 22.2480 652 25.6 62.3 0.1 47.5 14.7 9.4 0.0 9.2 3.2 0.2 0.0 0.0 0.0 0.0 0.0 0.5 0.0 2.1 7.0 0.0 0.0 0 0 22.2600 826 25.6 62.3 0.1 47.5 14.7 9.4 0.0 9.2 3.2 0.2 0.0 0.0 0.0 0.0 0.0 0.5 0.0 2.1 7.0 0.0 0.0 0 0 22.2720 958 25.6 62.3 0.1 47.5 14.7 9.4 0.0 9.2 3.2 0.2 0.0 0.0 0.0 0.0 0.0 0.5 0.0 2.1 7.0 0.0 0.0 0 0 22.2840 1038 25.6 62.3 0.1 47.5 14.7 9.4 0.0 9.2 3.2 0.2 0.0 0.0 0.0 0.0 0.0 0.5 0.0 2.1 7.0 0.0 0.0 0 0 22.2960 1071 25.6 62.3 0.1 47.5 14.7 9.4 0.0 9.2 3.2 0.2 0.0 0.0 0.0 0.0 0.0 0.5 0.0 2.1 7.0 0.0 0.0 0 0 22.2
Middle Node heat balance

137
Middle Node kJ IN
Time (s) Fe (met) FeO Fe2O3 Al2O3 CaO K2O MgO MnO P2O5 SiO2 TiO2 C Mullite H2O Ar Total kJ IN0 0.0 -33.7 -16.3 -3.7 -0.1 -0.1 -0.1 0.0 -0.2 -7.2 -0.1 0.0 -111.3 0.0 0.0 -172.8
120 0.0 -33.7 -16.3 -3.7 -0.1 -0.1 -0.1 0.0 -0.2 -7.2 -0.1 0.0 -111.3 0.0 0.0 -172.8240 0.0 -33.5 -16.3 -3.7 -0.1 -0.1 -0.1 0.0 -0.1 -7.2 -0.1 0.0 -111.1 0.0 0.0 -172.4360 0.0 -32.7 -16.0 -3.7 -0.1 -0.1 -0.1 0.0 -0.1 -7.1 -0.1 0.3 -110.3 0.0 0.0 -170.1480 0.0 -31.2 -15.4 -3.6 -0.1 -0.1 -0.1 0.0 -0.1 -7.0 -0.1 0.9 -108.7 0.0 0.0 -165.5600 0.0 -29.4 -14.6 -3.5 -0.1 -0.1 -0.1 0.0 -0.1 -6.9 -0.1 1.8 -106.7 0.0 0.0 -159.9720 0.0 -28.2 -14.1 -3.5 -0.1 -0.1 -0.1 0.0 -0.1 -6.8 -0.1 2.4 -105.2 0.0 0.0 -155.9840 0.0 -27.2 -13.7 -3.5 -0.1 -0.1 -0.1 0.0 -0.1 -6.7 -0.1 3.0 -104.1 0.0 0.0 -152.7960 0.0 -26.6 -13.5 -3.4 -0.1 -0.1 -0.1 0.0 -0.1 -6.7 -0.1 3.3 -103.4 0.0 0.0 -150.8
Middle Node kJ OUTTime (s) Fe (met) FeO Fe2O3 Al2O3 CaO K2O MgO MnO P2O5 SiO2 TiO2 C Mullite H2O Ar CO CO2 Total kJ OUT (kJ OUT) - (kJ IN)
0 0.0 -33.7 -16.3 -3.7 -0.1 -0.1 -0.1 0.0 -0.2 -7.2 -0.1 0.0 -111.3 0.0 0.0 0.0 0.0 -172.8 0.0120 0.0 -33.5 -16.3 -3.7 -0.1 -0.1 -0.1 0.0 -0.1 -7.2 -0.1 0.0 -111.1 0.0 0.0 0.0 0.0 -172.4 0.4240 0.0 -32.7 -16.0 -3.7 -0.1 -0.1 -0.1 0.0 -0.1 -7.1 -0.1 0.3 -110.3 0.0 0.0 0.0 0.0 -170.1 2.3360 0.0 -31.2 -15.4 -3.6 -0.1 -0.1 -0.1 0.0 -0.1 -7.0 -0.1 0.9 -108.7 0.0 0.0 0.0 0.0 -165.5 4.5480 0.0 -29.4 -14.6 -3.5 -0.1 -0.1 -0.1 0.0 -0.1 -6.9 -0.1 1.8 -106.7 0.0 0.0 0.0 0.0 -159.9 5.6600 0.0 -28.2 -14.1 -3.5 -0.1 -0.1 -0.1 0.0 -0.1 -6.8 -0.1 2.4 -105.2 0.0 0.0 0.0 0.0 -155.9 4.1720 0.0 -27.2 -13.7 -3.5 -0.1 -0.1 -0.1 0.0 -0.1 -6.7 -0.1 3.0 -104.1 0.0 0.0 0.0 0.0 -152.7 3.1840 0.0 -26.6 -13.5 -3.4 -0.1 -0.1 -0.1 0.0 -0.1 -6.7 -0.1 3.3 -103.4 0.0 0.0 0.0 0.0 -150.8 1.9960 0.0 -26.3 -13.4 -3.4 -0.1 -0.1 -0.1 0.0 -0.1 -6.7 -0.1 3.4 -103.1 0.0 0.0 0.0 0.0 -150.0 0.8
Bottom Node mass balance

138
Bottom Node Mass IN Mass in (g.)
Time (s) Bottom Node % T (°C) %Reduction %Fe(total) %Fe(met) %Fe(+2) %Fe(+3) g. Fe (total) g. Fe (met) g. FeO g. Fe2O3 g. Al2O3 g. CaO g. K2O g. MgO g. MnO g. P2O5 g. SiO2 g. TiO2 g. C g. Mullite g. H2O g. Ar Total g. in
0 21 25 24.7 58.5 0.20 42.8 15.50 5.5 0.0 5.2 2.1 0.1 0.01 0.0 0.0 0.0 0.0 0.3 0.0 1.3 13.2 0.0 0.0 22.457 25 24.7 58.5 0.2 42.8 15.5 5.5 0.0 5.2 2.1 0.1 0.0 0.0 0.0 0.0 0.0 0.3 0.0 1.3 13.2 0.0 0.0 22.4
146 56 24.7 58.5 0.2 42.8 15.5 5.5 0.0 5.2 2.1 0.1 0.0 0.0 0.0 0.0 0.0 0.3 0.0 1.3 13.2 0.0 0.0 22.4241 150 24.7 58.5 0.2 42.8 15.5 5.5 0.0 5.2 2.1 0.1 0.0 0.0 0.0 0.0 0.0 0.3 0.0 1.3 13.2 0.0 0.0 22.4340 265 24.7 58.5 0.2 42.8 15.5 5.5 0.0 5.2 2.1 0.1 0.0 0.0 0.0 0.0 0.0 0.3 0.0 1.3 13.2 0.0 0.0 22.4448 386 24.7 58.5 0.2 42.8 15.5 5.5 0.0 5.2 2.1 0.1 0.0 0.0 0.0 0.0 0.0 0.3 0.0 1.3 13.2 0.0 0.0 22.4522 546 24.7 58.5 0.2 42.8 15.5 5.5 0.0 5.2 2.1 0.1 0.0 0.0 0.0 0.0 0.0 0.3 0.0 1.3 13.2 0.0 0.0 22.4616 711 24.7 58.5 0.2 42.8 15.5 5.5 0.0 5.2 2.1 0.1 0.0 0.0 0.0 0.0 0.0 0.3 0.0 1.3 13.2 0.0 0.0 22.4713 822 24.7 58.5 0.2 42.8 15.5 5.5 0.0 5.2 2.1 0.1 0.0 0.0 0.0 0.0 0.0 0.3 0.0 1.3 13.2 0.0 0.0 22.4
Bottom Node Mass OUT Mass Out: 9.5 g. Fe out: 5.5 Mass out (g.)
Time (s) T (°C) %Reduction %Fe(total) %Fe(met) %Fe(+2) %Fe(+3) g. Fe (total) g. Fe (met) g. FeO g. Fe2O3 g. Al2O3 g. CaO g. K2O g. MgO g. MnO g. P2O5 g. SiO2 g. TiO2 g. C g. Mullite g. H2O g. Ar g. CO g. CO2 Total g. Out
0 25.0 24.7 58.5 0.20 42.8 15.50 5.5 0.0 5.2 2.1 0.1 0.0 0.0 0.0 0.0 0.0 0.3 0.0 1.3 13.2 0.0 0.0 0 0 22.457 56 24.7 58.5 0.2 42.8 15.5 5.5 0.0 5.2 2.1 0.1 0.0 0.0 0.0 0.0 0.0 0.3 0.0 1.3 13.2 0.0 0.0 0 0 22.4146 150 24.7 58.5 0.2 42.8 15.5 5.5 0.0 5.2 2.1 0.1 0.0 0.0 0.0 0.0 0.0 0.3 0.0 1.3 13.2 0.0 0.0 0 0 22.4241 265 24.7 58.5 0.2 42.8 15.5 5.5 0.0 5.2 2.1 0.1 0.0 0.0 0.0 0.0 0.0 0.3 0.0 1.3 13.2 0.0 0.0 0 0 22.4340 386 24.7 58.5 0.2 42.8 15.5 5.5 0.0 5.2 2.1 0.1 0.0 0.0 0.0 0.0 0.0 0.3 0.0 1.3 13.2 0.0 0.0 0 0 22.4448 546 24.7 58.5 0.2 42.8 15.5 5.5 0.0 5.2 2.1 0.1 0.0 0.0 0.0 0.0 0.0 0.3 0.0 1.3 13.2 0.0 0.0 0 0 22.4522 711 24.7 58.5 0.2 42.8 15.5 5.5 0.0 5.2 2.1 0.1 0.0 0.0 0.0 0.0 0.0 0.3 0.0 1.3 13.2 0.0 0.0 0 0 22.4616 822 24.7 58.5 0.2 42.8 15.5 5.5 0.0 5.2 2.1 0.1 0.0 0.0 0.0 0.0 0.0 0.3 0.0 1.3 13.2 0.0 0.0 0 0 22.4713 874 24.7 58.5 0.2 42.8 15.5 5.5 0.0 5.2 2.1 0.1 0.0 0.0 0.0 0.0 0.0 0.3 0.0 1.3 13.2 0.0 0.0 0 0 22.4
Bottom Node heat balance

139
Bottom Node kJ IN
Time (s) Fe (met) FeO Fe2O3 Al2O3 CaO K2O MgO MnO P2O5 SiO2 TiO2 C Mullite H2O Ar kJ IN0 0.0 -19.1 -10.8 -2.4 -0.1 -0.1 0.0 0.0 -0.1 -4.6 -0.1 0.0 -211.6 0.0 0.0 -248.857 0.0 -19.1 -10.8 -2.4 -0.1 -0.1 0.0 0.0 -0.1 -4.6 -0.1 0.0 -211.6 0.0 0.0 -248.8
146 0.0 -18.9 -10.8 -2.3 -0.1 -0.1 0.0 0.0 -0.1 -4.6 -0.1 0.0 -211.3 0.0 0.0 -248.3241 0.0 -18.6 -10.6 -2.3 -0.1 -0.1 0.0 0.0 -0.1 -4.6 -0.1 0.1 -210.2 0.0 0.0 -246.5340 0.0 -18.2 -10.4 -2.3 -0.1 -0.1 0.0 0.0 -0.1 -4.5 -0.1 0.3 -208.7 0.0 0.0 -244.2448 0.0 -17.7 -10.2 -2.3 -0.1 -0.1 0.0 0.0 -0.1 -4.5 -0.1 0.6 -207.0 0.0 0.0 -241.5522 0.0 -17.1 -9.9 -2.3 -0.1 -0.1 0.0 0.0 -0.1 -4.4 -0.1 0.9 -204.5 0.0 0.0 -237.7616 0.0 -16.4 -9.5 -2.2 -0.1 -0.1 0.0 0.0 -0.1 -4.4 -0.1 1.3 -202.0 0.0 0.0 -233.6713 0.0 -15.9 -9.3 -2.2 -0.1 -0.1 0.0 0.0 -0.1 -4.3 -0.1 1.5 -200.2 0.0 0.0 -230.8
Bottom Node kJ OUT
Time (s) Fe (met) FeO Fe2O3 Al2O3 CaO K2O MgO MnO P2O5 SiO2 TiO2 C Mullite H2O Ar CO CO2 kJ OUT (kJ OUT) - (kJ IN)0 0.0 -19.1 -10.8 -2.4 -0.1 -0.1 0.0 0.0 -0.1 -4.6 -0.1 0.0 -211.6 0.0 0.0 0.0 0.0 -248.8 0.0
57 0.0 -18.9 -10.8 -2.3 -0.1 -0.1 0.0 0.0 -0.1 -4.6 -0.1 0.0 -211.3 0.0 0.0 0.0 0.0 -248.3 0.5146 0.0 -18.6 -10.6 -2.3 -0.1 -0.1 0.0 0.0 -0.1 -4.6 -0.1 0.1 -210.2 0.0 0.0 0.0 0.0 -246.5 1.7241 0.0 -18.2 -10.4 -2.3 -0.1 -0.1 0.0 0.0 -0.1 -4.5 -0.1 0.3 -208.7 0.0 0.0 0.0 0.0 -244.2 2.4340 0.0 -17.7 -10.2 -2.3 -0.1 -0.1 0.0 0.0 -0.1 -4.5 -0.1 0.6 -207.0 0.0 0.0 0.0 0.0 -241.5 2.7448 0.0 -17.1 -9.9 -2.3 -0.1 -0.1 0.0 0.0 -0.1 -4.4 -0.1 0.9 -204.5 0.0 0.0 0.0 0.0 -237.7 3.8522 0.0 -16.4 -9.5 -2.2 -0.1 -0.1 0.0 0.0 -0.1 -4.4 -0.1 1.3 -202.0 0.0 0.0 0.0 0.0 -233.6 4.1616 0.0 -15.9 -9.3 -2.2 -0.1 -0.1 0.0 0.0 -0.1 -4.3 -0.1 1.5 -200.2 0.0 0.0 0.0 0.0 -230.8 2.8713 0.0 -15.7 -9.2 -2.2 -0.1 -0.1 0.0 0.0 -0.1 -4.3 -0.1 1.7 -199.3 0.0 0.0 0.0 0.0 -229.5 1.3
Time (s) kJ Out - kJ In Top
kJ Out - kJ In Middle
kJ Out - kJ In Bottom
Incremental kJ
120 10 0 1 11240 14 2 2 18360 11 5 2 18480 9 6 3 17600 7 4 4 15720 5 3 4 12840 4 2 3 8897 2 1 1 4
Total Incremental kJ: 103Weighted Average kW/m^2: 163

140
Appendix VII Mass and Heat Balance equations
(a) Mass balance equations
inijm _ = mass of component j in node i of unreacted sample
outijm _ = mass of component j in node i of reacted sample
outicorrjm _
_ = corrected mass of component j in node i of reacted sample
intotalm = total g. unreacted sample mix in crucible
iniY _% = mass% of component Y in node i of unreacted sample
outiY _% = mass% of component Y in node i of reacted sample
outicorrY _% = corrected mass% of component Y in node i of reacted sample
kmm = molar mass of component k
iX = mass fraction of sample material mix in node i, i = top, mid, bot for top, middle or bottom node
i = top, mid, bot for top, middle or bottom node
outiphasejn _
_ = mol of component j in node i of reacted sample in a phase
Correction of reacted mass out for fibreboard carry over to top node reacted sample
mix:
topintotal
intoptotal Xmm ⋅=_
100%
100% _
32__
32_32
intopintop
total
outtopouttop
totalovercarry
OAlOAl
mOAl
mm ⋅−⋅=−
100%
100% _
2__
2_2
intopintop
total
outtopouttop
totalovercarry
SiOSiOmSiOmm ⋅−⋅=−
overcarry
OAlm −32
= g. Al2O3 carry-over from fibreboard to reacted sample mix in top node
overcarrySiOm −
2= g. SiO2 carry-over from fibreboard to reacted sample mix in top node
intotalm = total g. unreacted sample mix in crucible
overcarrySiO
overcarryOAl
intoptotal
outtopcorrOAl mmmm −− −−=
23232
___

141
The fibreboard carry-over calculations for the middle and bottom node are done in the
same manner.
Correction of fibreboard crucible mass, in top node section, for fibreboard carry-
over to top node reacted sample mix:
overcarry
SiOovercarry
OAlouttop
FBouttopcorrFB mmmm −− ++=
232
___
overcarryOAlm −
32 = g. Al2O3 carry-over from fibreboard to reacted sample mix in top node
overcarrySiOm −
2= g. SiO2 carry-over from fibreboard to reacted sample mix in top node
The fibreboard mass correction calculations for the middle and bottom node are done in
the same manner.
Correction of FeO analyses for top node for fibreboard carry-over to top node
reacted sample mix:
100% _
__outtop
outtoptotal
outtopFeO
FeOmm ⋅=
100% __
__ ⋅= outtop
corrtotal
outtopFeOouttop
corr mm
FeO
FeFeOouttopcorrtotal
outtopFeOouttop
corr mmmmmm
Fe ⋅⋅=+ /100)2(% __
__
Similarly the corrected mass% of C, Fe2O3, Fe metal, Fe(total) can be calculated. The
calculations are done for the top, middle and bottom nodes.
Calculation of mass FeO into top node material mix
FeOFe
outtopcorr
intop
intopouttop
corrtotalintop
FeO mmmmtotalFe
totalFeFemm ⋅⋅
+⋅= /
100)(%
)()2(% _
_
__
__
FeOFe
outtopcorrouttop
corrtotalouttop
FeO mmmmFe
mm ⋅+
⋅= /100
)2(% __
__

142
Calculation of CaO into top node material mix
100% _
___intop
intoptotal
intopCaO
outtopCaO
CaOmmm ⋅==
topintotal
intoptotal Xmm ⋅=_
Fe balance calculation to check Fe mass accounting
100)(%
100"%" __
_intotalintotal
intotal
intotalFe
totalFeFeOmm ⋅⋅=
"%"FeO = mass% pre-reduced ore in sample mix
100)(%
100)(%
100)(% _
__
__
__outbot
corroutbotcorr
outmidcorroutmid
corr
outtopcorrouttop
corrouttotal
FetotalFe
mtotalFe
mtotalFe
mm ⋅+⋅+⋅=
1_
_
≈outtotalFe
intotalFe
mm
C balance
100%
100% __
__intotalintotal
intoptotal
intopC
CGraphitemm ⋅⋅=
topintotal
intoptotal Xmm ⋅=_
Couttop
gasCOouttopgasCO
intopC
outtopC mmnnmm ⋅+−= )( _
___
__2
intotalGraphite _% = mass% graphite in sample mix
intotalC _% = %C in graphite

143
O balance
3//3//32323232
______ ⋅−−⋅+= OFe
outtopOFeFeO
outtopFeOOFe
intopOFeFeO
intopFeO
outtopgasO mmmmmmmmmmmmn
100/__
__
__
2
rnn
nouttop
gasCOouttopgasCO
outtopgasCO =
+
outtopgasO
outtopgasCO
outtopgasCO nnn _
___
__ 2
2 =⋅+
)2/()1(__
__2
rrnn outtopgasO
outtopgasCO −−⋅=
2%%%
COCOCOr+
= in product gas analysis
(b) Heat balance equations 22/)( DTTCBTATC p +++= [J/mol K]
)(3/)/()(2/)( 31
3212
21
22121
2
1
TTDTTCTTBTTAHdTCH T
T
Tp −⋅+−−−⋅+−⋅=∆+=∆ ∫
The )(TC p equations were obtained from Kubashewski et al. (1993).
intopj
topj
outtopj
topj
toptotal nHnHJ __ ⋅∆∑−⋅∆∑=∆ [J]
bottotal
midtotal
toptotaltotal JJJJ ∆+∆+∆=∆ [J]
tJW totaltotal ⋅∆=∆ 6000/ [kW]
4AW
q totalHM
∆= [kW/m2]
)(TC p = heat capacity of component at constant pressure
H∆ = change in enthalpy of component material when heated from T1 to T2
t = total reaction time in minutes
HMq = heat transfer to sample as calculated in heat-mass balance
The enthalpy equation parameters used are shown below:

144
[J/deg mol] Component ]/[
1molJHT∆ ][1 KT ][2 KT A 310⋅B 510−⋅C 610⋅D
Fe2O3 -823400 298 950 98.28 77.82 -14.85 --- -731081 950 1050 150.62 --- --- --- -716019 >=1050 132.67 7.36 --- --- Fe3O4 -1108800 298 900 91.55 202 --- --- -980846 >=900 213.4 --- --- --- FeO -263000 >=298 48.79 8.37 -2.8 --- Fe 0 298 800 28.18 -7.32 -2.9 --- 15571 800 1000 -263.45 255.81 619.23 --- 24408 1000 1042 -641.91 696.34 --- --- 27308 1042 1060 1946.25 -1787.5 --- --- 28525 1060 1184 -561.95 334.13 2912.11 --- 35002 1184 1665 23.99 8.36 --- --- 53069 1665 1809 24.64 9.9 --- --- 72893 1809 2000 46.02 --- --- --- SiO2 -908300 298 540 46.9 31.51 -10.08 --- -893971 540 2000 71.63 1.88 -39.06 --- -781586 >=2000 86.19 --- --- --- Al2O3 -1675700 298 2325 117.49 10.38 -37.11 --- CaO -634900 298 2900 50.42 4.18 -8.49 --- MgO -601600 298 3105 48.99 3.43 11.34 --- CO -110500 >=298 28.41 4.1 -0.46 --- CO2 -393500 >=298 44.14 9.04 -8.54 --- C(graphite) 0 298 1100 0.11 38.94 -1.48 --- 13998 >=1100 24.43 0.44 -31.63 --- MnO -384900 298 2058 46.48 8.12 -3.68 --- H2 0 298 27.37 3.33 --- --- H2O (liquid) -285800 >=298 75.44 --- --- --- H2O (gas) -241800 >=298 30 10.71 0.33 --- TiO2 -944000 >=298 73.35 3.05 -17.03 --- Na2O -415100 298 1023 55.48 70.21 -4.14 -30.54 -351070 1023 1243 82.3 12.76 --- --- -317883 1243 1405 84.85 10.71 --- --- -254140 >=1405 104.6 --- --- --- K2O -363200 >=298 95.65 -4.94 -11.05 23.68 P2O5 -1505000 >=298 74.89 162.34 -15.61 --- Mullite (3Al2O3.2SiO2)
-6820800 298 600 233.59 633.88 -55.86 385.77
-6698110 600 503.46 35.1 -230.12 -2.51
)(TC p of Argon taken as 20.786 J/mol K from Chase, M.W., Jr., NIST-JANAF
Thermochemical Tables, Fourth Edition, 1998. American Institute of Physics, Woodbury, New
York.

145
Appendix VIII: Experimental data graphs Coal-Ore; 40mm layer, 1300°C, 3minutes
050
100150200250300350400450500550600650700750800850900950
1000105011001150120012501300
0 60 120 180 240
Time (s)
Tem
pera
ture
(°C
)
-300
-280
-260
-240
-220
-200
-180
-160
-140
-120
-100
-80
-60
-40
-20
0
kW/m
^2 in
to s
ampl
e
4 mm 10 mm 20 mm 30 mm Pyrometer Real T_Surface (°C) kW/m^2 Sample lowered
0
1
2
3
4
5
6
7
8
9
10
11
12
13
14
15
16
17
18
19
20
0 60 120 180 240 300 360 420 480 540 600 660 720 780
Time (s)
Vol%
0
10
20
30
40
50
60
70
80
90
100
Vol%
Ar
Carbon Dioxide Methane Hydrogen Water-DM Carbon Monoxide Argon

146
1220
1225
1230
1235
1240
1245
1250
1255
1260
1265
1270
1275
1280
1285
1290
1295
1300
1305
1310
1315
0 60 120 180 240 300 360 420 480 540 600 660 720 780
Time (s)
Tem
pera
ture
(°C
)
Heating Zone 1 Heating Zone 2 Heating Zone 3 Sample lowered
Coal-Ore; 40mm layer, 1300°C, 6minutes
050
100150200250300350400450500550600650700750800850900950
1000105011001150120012501300
0 60 120 180 240 300 360 420
Time (s)
Tem
pera
ture
(°C
)
-300
-280
-260
-240
-220
-200
-180
-160
-140
-120
-100
-80
-60
-40
-20
0
kW/m
^2 in
to s
ampl
e
4 mm 10 mm 20 mm 30 mm Pyrometer Real T_Surface (°C) kW/m^2 Sample lowered

147
0
1
2
3
4
5
6
7
8
9
10
11
12
13
14
15
16
17
18
19
20
0 60 120 180 240 300 360 420 480 540 600 660 720 780 840 900 960
Time (s)
Vol%
0
10
20
30
40
50
60
70
80
90
100
Vol%
Ar
Carbon Dioxide Methane Hydrogen Water-DM Carbon Monoxide Argon
1220
1225
1230
1235
1240
1245
1250
1255
1260
1265
1270
1275
1280
1285
1290
1295
1300
1305
1310
1315
0 60 120 180 240 300 360 420 480 540 600 660 720 780 840 900 960
Time (s)
Tem
pera
ture
(°C
)
Heating Zone 1 Heating Zone 2 Heating Zone 3 Sample lowered

148
Coal-Ore; 40mm layer, 1300°C, 9minutes
050
100150200250300350400450500550600650700750800850900950
1000105011001150120012501300
0 60 120 180 240 300 360 420 480 540 600
Time (s)
Tem
pera
ture
(°C
)
-300
-280
-260
-240
-220
-200
-180
-160
-140
-120
-100
-80
-60
-40
-20
0
kW/m
^2 in
to s
ampl
e
4 mm 10 mm 20 mm 30 mm Pyrometer Real T_Surface (°C) kW/m^2 Sample lowered
0
1
2
3
4
5
6
7
8
9
10
11
12
13
14
15
16
17
18
19
20
0 60 120 180 240 300 360 420 480 540 600 660 720 780 840 900 960 1020 1080 1140
Time (s)
Vol%
0
10
20
30
40
50
60
70
80
90
100
Vol%
Ar
Carbon Dioxide Methane Hydrogen Water-DM Carbon Monoxide Argon

149
1220
1225
1230
1235
1240
1245
1250
1255
1260
1265
1270
1275
1280
1285
1290
1295
1300
1305
1310
1315
0 60 120 180 240 300 360 420 480 540 600 660 720 780 840 900 960 1020 1080 1140
Time (s)
Tem
pera
ture
(°C
)
Heating Zone 1 Heating Zone 2 Heating Zone 3 Sample lowered
Coal-Ore; 40mm layer, 1300°C, 12minutes
050
100150200250300350400450500550600650700750800850900950
1000105011001150120012501300
0 60 120 180 240 300 360 420 480 540 600 660 720 780
Time (s)
Tem
pera
ture
(°C
)
-300
-280
-260
-240
-220
-200
-180
-160
-140
-120
-100
-80
-60
-40
-20
0
kW/m
^2 in
to s
ampl
e
4 mm 10 mm 20 mm 30 mm Pyrometer Real T_Surface (°C) kW/m^2 Sample lowered

150
0
1
2
3
4
5
6
7
8
9
10
11
12
13
14
15
16
17
18
19
20
0 120 240 360 480 600 720 840 960 1080 1200 1320
Time (s)
Vol%
0
10
20
30
40
50
60
70
80
90
100
Vol%
Ar
Carbon Dioxide Methane Hydrogen Water-DM Carbon Monoxide Sample lowered Argon
1210
1215
1220
1225
1230
1235
1240
1245
1250
1255
1260
1265
1270
1275
1280
1285
1290
1295
1300
1305
1310
1315
0 60 120 180 240 300 360 420 480 540 600 660 720 780 840 900 960 1020 1080 1140 1200 1260 1320
Time (s)
Tem
pera
ture
(°C
)
Heating Zone 1 Heating Zone 2 Heating Zone 3 Sample lowered

151
Coal-Ore; 40mm layer, 1300°C, 15minutes
050
100150200250300350400450500550600650700750800850900950
1000105011001150120012501300
0 60 120 180 240 300 360 420 480 540 600 660 720 780 840 900 960
Time (s)
Tem
pera
ture
(°C
)
-300
-280
-260
-240
-220
-200
-180
-160
-140
-120
-100
-80
-60
-40
-20
0
kW/m
^2 in
to s
ampl
e
4 mm 10 mm 20 mm 30 mm Pyrometer Real T_Surface (°C) kW/m^2 Sample lowered
0
1
2
3
4
5
6
7
8
9
10
11
12
13
14
15
16
17
18
19
20
0 60 120 180 240 300 360 420 480 540 600 660 720 780 840 900 960 1020 1080 1140 1200 1260 1320 1380 1440 1500
Time (s)
Vol%
0
10
20
30
40
50
60
70
80
90
100
Vol%
Ar
Carbon Dioxide Methane Hydrogen Water-DM Carbon Monoxide Sample lowered Argon

152
1200
1205
1210
1215
1220
1225
1230
1235
1240
1245
1250
1255
1260
1265
1270
1275
1280
1285
1290
1295
1300
1305
1310
1315
0 60 120 180 240 300 360 420 480 540 600 660 720 780 840 900 960 1020 1080 1140 1200 1260 1320 1380 1440 1500
Time (s)
Tem
pera
ture
(°C
)
Heating Zone 1 Heating Zone 2 Heating Zone 3 Sample lowered
Coal-Ore; 40mm layer, 1400°C, 3minutes
050
100150200250300350400450500550600650700750800850900950
1000105011001150120012501300
0 60 120 180 240
Time (s)
Tem
pera
ture
(°C
)
-300
-280
-260
-240
-220
-200
-180
-160
-140
-120
-100
-80
-60
-40
-20
0
kW/m
^2 in
to s
ampl
e
4 mm 10 mm 20 mm 30 mm Pyrometer Real T_Surface (°C) kW/m^2 Sample lowered

153
0
1
2
3
4
5
6
7
8
9
10
11
12
13
14
15
16
17
18
19
20
0 60 120 180 240 300 360 420 480 540 600 660 720 780
Time (s)
Vol%
0
10
20
30
40
50
60
70
80
90
100
Vol%
Ar
Carbon Dioxide Methane Hydrogen Water-DM Carbon Monoxide Argon
1320
1325
1330
1335
1340
1345
1350
1355
1360
1365
1370
1375
1380
1385
1390
1395
1400
1405
1410
1415
0 60 120 180 240 300 360 420 480 540 600 660 720 780
Time (s)
Tem
pera
ture
(°C
)
Heating Zone 1 Heating Zone 2 Heating Zone 3 Sample lowered

154
Coal-Ore; 40mm layer, 1400°C, 6minutes
050
100150200250300350400450500550600650700750800850900950
1000105011001150120012501300
0 60 120 180 240 300 360 420
Time (s)
Tem
pera
ture
(°C
)
-300
-280
-260
-240
-220
-200
-180
-160
-140
-120
-100
-80
-60
-40
-20
0
kW/m
^2 in
to s
ampl
e
4 mm 10 mm 20 mm 30 mm Pyrometer Real T_Surface (°C) kW/m^2 Sample lowered
0
1
2
3
4
5
6
7
8
9
10
11
12
13
14
15
16
17
18
19
20
0 60 120 180 240 300 360 420 480 540 600 660 720 780 840 900 960
Time (s)
Vol%
0
10
20
30
40
50
60
70
80
90
100
Vol%
Ar
Carbon Dioxide Methane Hydrogen Water-DM Carbon Monoxide Argon

155
1320
1325
1330
1335
1340
1345
1350
1355
1360
1365
1370
1375
1380
1385
1390
1395
1400
1405
1410
1415
0 60 120 180 240 300 360 420 480 540 600 660 720 780 840 900 960
Time (s)
Tem
pera
ture
(°C
)
Heating Zone 1 Heating Zone 2 Heating Zone 3 Sample lowered
Coal-Ore; 40mm layer, 1400°C, 9minutes
050
100150200250300350400450500550600650700750800850900950
1000105011001150120012501300
0 60 120 180 240 300 360 420 480 540 600
Time (s)
Tem
pera
ture
(°C
)
-300
-280
-260
-240
-220
-200
-180
-160
-140
-120
-100
-80
-60
-40
-20
0
kW/m
^2 in
to s
ampl
e
4 mm 10 mm 20 mm 30 mm Pyrometer Real T_Surface (°C) kW/m^2 Sample lowered

156
0
1
2
3
4
5
6
7
8
9
10
11
12
13
14
15
16
17
18
19
20
0 60 120 180 240 300 360 420 480 540 600 660 720 780 840 900 960 1020 1080 1140
Time (s)
Vol%
0
10
20
30
40
50
60
70
80
90
100
Vol%
Ar
Carbon Dioxide Methane Hydrogen Water-DM Carbon Monoxide Argon
1320
1325
1330
1335
1340
1345
1350
1355
1360
1365
1370
1375
1380
1385
1390
1395
1400
1405
1410
1415
0 60 120 180 240 300 360 420 480 540 600 660 720 780 840 900 960 1020 1080 1140
Time (s)
Tem
pera
ture
(°C
)
Heating Zone 1 Heating Zone 2 Heating Zone 3 Sample lowered

157
Coal-Ore; 40mm layer, 1400°C, 12minutes
050
100150200250300350400450500550600650700750800850900950
1000105011001150120012501300
0 60 120 180 240 300 360 420 480 540 600 660 720 780
Time (s)
Tem
pera
ture
(°C
)
-300
-280
-260
-240
-220
-200
-180
-160
-140
-120
-100
-80
-60
-40
-20
0
kW/m
^2 in
to s
ampl
e
4 mm 10 mm 20 mm 30 mm Pyrometer Real T_Surface (°C) kW/m^2 Sample lowered
0
1
2
3
4
5
6
7
8
9
10
11
12
13
14
15
16
17
18
19
20
0 60 120 180 240 300 360 420 480 540 600 660 720 780 840 900 960 1020 1080 1140 1200 1260 1320
Time (s)
Vol%
0
10
20
30
40
50
60
70
80
90
100
Vol%
Ar
Carbon Dioxide Methane Hydrogen Water-DM Carbon Monoxide Argon

158
1320
1325
1330
1335
1340
1345
1350
1355
1360
1365
1370
1375
1380
1385
1390
1395
1400
1405
1410
1415
0 60 120 180 240 300 360 420 480 540 600 660 720 780 840 900 960 1020 1080 1140 1200 1260 1320
Time (s)
Tem
pera
ture
(°C
)
Heating Zone 1 Heating Zone 2 Heating Zone 3 Sample lowered
Coal-Ore; 40mm layer, 1400°C, 15minutes
050
100150200250300350400450500550600650700750800850900950
1000105011001150120012501300
0 60 120 180 240 300 360 420 480 540 600 660 720 780 840 900 960
Time (s)
Tem
pera
ture
(°C
)
-300
-280
-260
-240
-220
-200
-180
-160
-140
-120
-100
-80
-60
-40
-20
0
kW/m
^2 in
to s
ampl
e
4 mm 10 mm 20 mm 30 mm Pyrometer Real T_Surface (°C) kW/m^2 Sample lowered

159
0
1
2
3
4
5
6
7
8
9
10
11
12
13
14
15
16
17
18
19
20
0 60 120 180 240 300 360 420 480 540 600 660 720 780 840 900 960 1020 1080 1140 1200 1260 1320 1380 1440 1500
Time (s)
Vol%
0
10
20
30
40
50
60
70
80
90
100
Vol%
Ar
Carbon Dioxide Methane Hydrogen Water-DM Carbon Monoxide Argon
1320
1325
1330
1335
1340
1345
1350
1355
1360
1365
1370
1375
1380
1385
1390
1395
1400
1405
1410
1415
0 60 120 180 240 300 360 420 480 540 600 660 720 780 840 900 960 1020 1080 1140 1200 1260 1320 1380 1440 1500
Time (s)
Tem
pera
ture
(°C
)
Heating Zone 1 Heating Zone 2 Heating Zone 3 Sample lowered
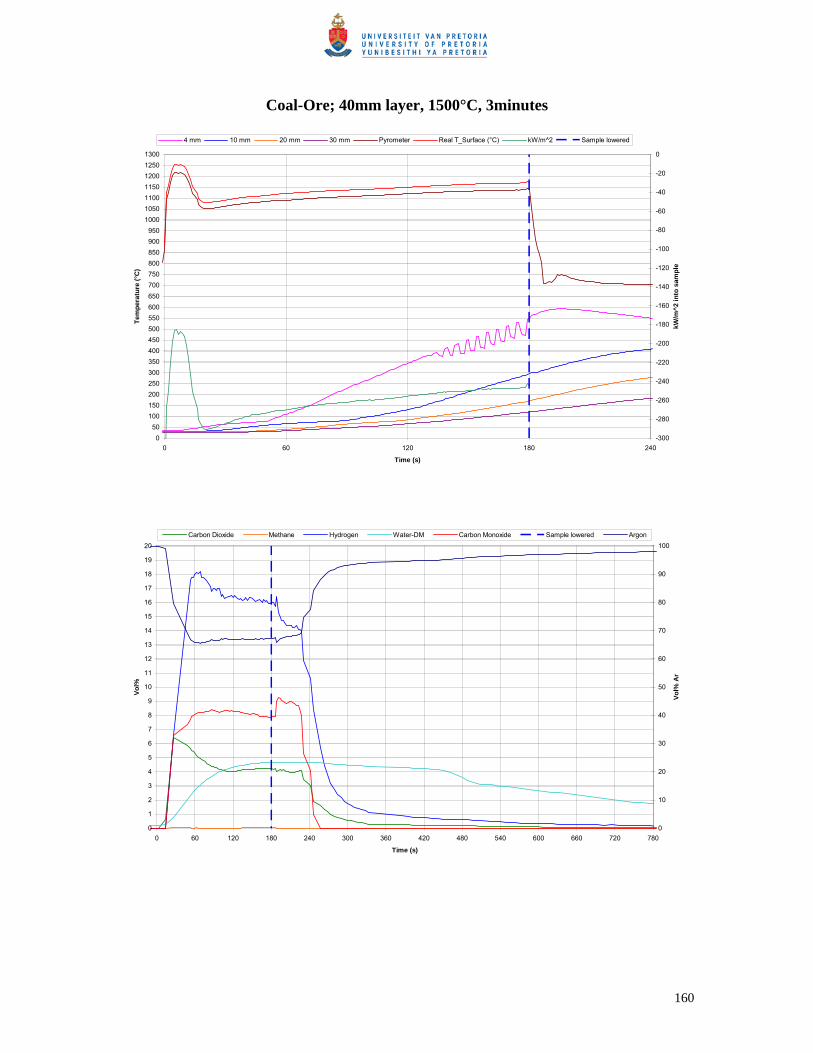
160
Coal-Ore; 40mm layer, 1500°C, 3minutes
050
100150200250300350400450500550600650700750800850900950
1000105011001150120012501300
0 60 120 180 240
Time (s)
Tem
pera
ture
(°C
)
-300
-280
-260
-240
-220
-200
-180
-160
-140
-120
-100
-80
-60
-40
-20
0
kW/m
^2 in
to s
ampl
e
4 mm 10 mm 20 mm 30 mm Pyrometer Real T_Surface (°C) kW/m^2 Sample lowered
0
1
2
3
4
5
6
7
8
9
10
11
12
13
14
15
16
17
18
19
20
0 60 120 180 240 300 360 420 480 540 600 660 720 780
Time (s)
Vol%
0
10
20
30
40
50
60
70
80
90
100
Vol%
Ar
Carbon Dioxide Methane Hydrogen Water-DM Carbon Monoxide Sample lowered Argon

161
1420
1425
1430
1435
1440
1445
1450
1455
1460
1465
1470
1475
1480
1485
1490
1495
1500
1505
1510
1515
0 60 120 180 240 300 360 420 480 540 600 660 720 780
Time (s)
Tem
pera
ture
(°C
)
Heating Zone 1 Heating Zone 2 Heating Zone 3 Sample lowered
Coal-Ore; 40mm layer, 1500°C, 6minutes
050
100150200250300350400450500550600650700750800850900950
1000105011001150120012501300
0 60 120 180 240 300 360 420
Time (s)
Tem
pera
ture
(°C
)
-300
-280
-260
-240
-220
-200
-180
-160
-140
-120
-100
-80
-60
-40
-20
0
kW/m
^2 in
to s
ampl
e
4 mm 10 mm 20 mm 30 mm Pyrometer Real T_Surface (°C) kW/m^2 Sample lowered
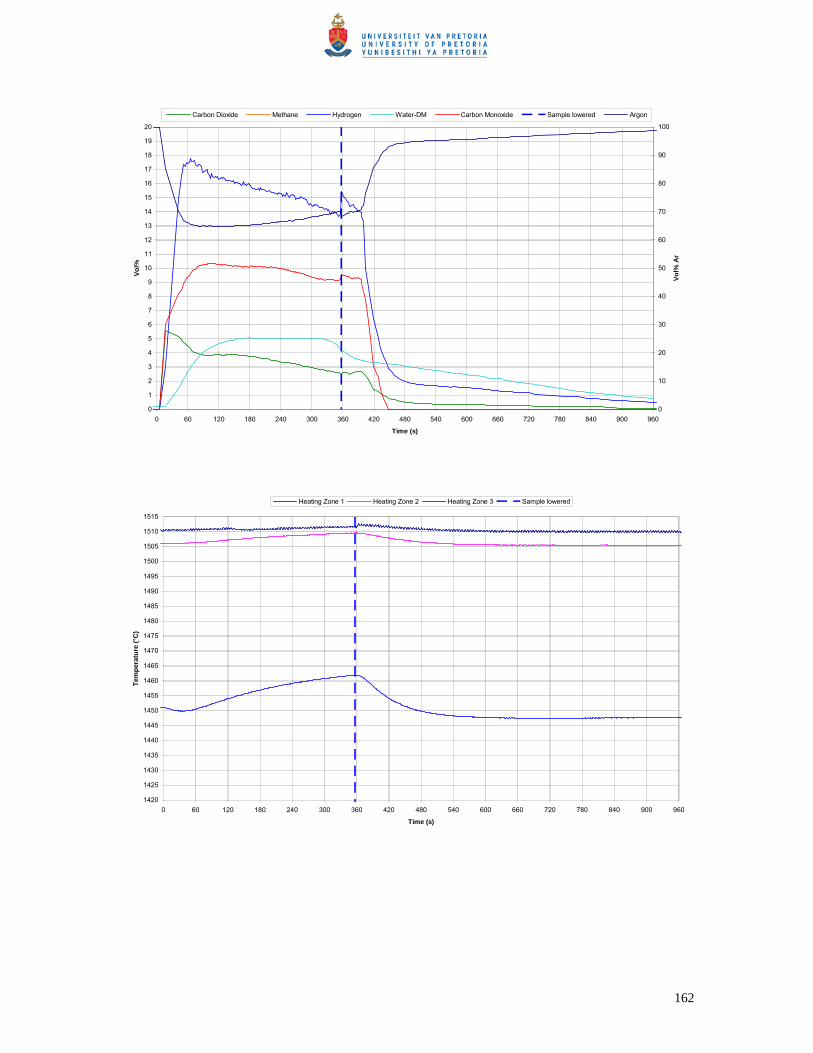
162
0
1
2
3
4
5
6
7
8
9
10
11
12
13
14
15
16
17
18
19
20
0 60 120 180 240 300 360 420 480 540 600 660 720 780 840 900 960
Time (s)
Vol%
0
10
20
30
40
50
60
70
80
90
100
Vol%
Ar
Carbon Dioxide Methane Hydrogen Water-DM Carbon Monoxide Sample lowered Argon
1420
1425
1430
1435
1440
1445
1450
1455
1460
1465
1470
1475
1480
1485
1490
1495
1500
1505
1510
1515
0 60 120 180 240 300 360 420 480 540 600 660 720 780 840 900 960
Time (s)
Tem
pera
ture
(°C
)
Heating Zone 1 Heating Zone 2 Heating Zone 3 Sample lowered
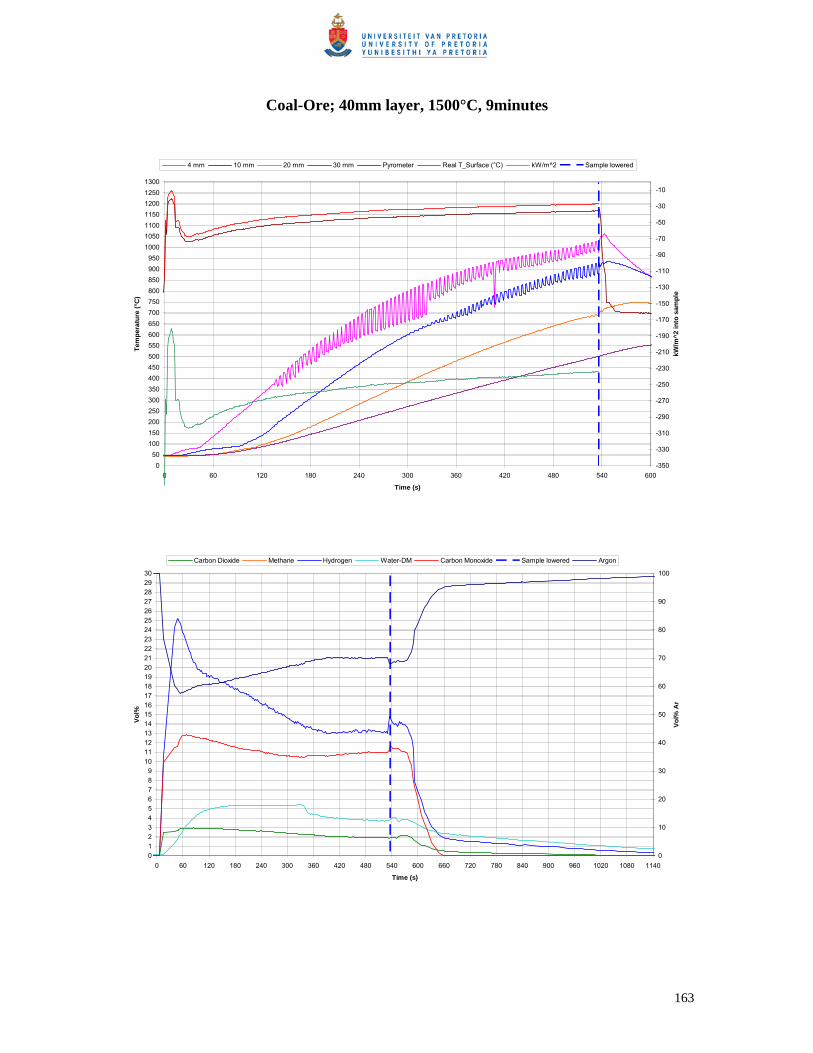
163
Coal-Ore; 40mm layer, 1500°C, 9minutes
050
100150200250300350400450500550600650700750800850900950
1000105011001150120012501300
0 60 120 180 240 300 360 420 480 540 600
Time (s)
Tem
pera
ture
(°C
)
-350
-330
-310
-290
-270
-250
-230
-210
-190
-170
-150
-130
-110
-90
-70
-50
-30
-10
kW/m
^2 in
to s
ampl
e
4 mm 10 mm 20 mm 30 mm Pyrometer Real T_Surface (°C) kW/m^2 Sample lowered
0123456789
101112131415161718192021222324252627282930
0 60 120 180 240 300 360 420 480 540 600 660 720 780 840 900 960 1020 1080 1140
Time (s)
Vol%
0
10
20
30
40
50
60
70
80
90
100
Vol%
Ar
Carbon Dioxide Methane Hydrogen Water-DM Carbon Monoxide Sample lowered Argon

164
1420
1425
1430
1435
1440
1445
1450
1455
1460
1465
1470
1475
1480
1485
1490
1495
1500
1505
1510
1515
0 60 120 180 240 300 360 420 480 540 600 660 720 780 840 900 960 1020 1080 1140
Time (s)
Tem
pera
ture
(°C
)
Heating Zone 1 Heating Zone 2 Heating Zone 3 Sample lowered
Coal-Ore; 40mm layer, 1500°C, 12minutes
050
100150200250300350400450500550600650700750800850900950
1000105011001150120012501300
0 60 120 180 240 300 360 420 480 540 600 660 720 780
Time (s)
Tem
pera
ture
(°C
)
-300
-280
-260
-240
-220
-200
-180
-160
-140
-120
-100
-80
-60
-40
-20
0
kW/m
^2 in
to s
ampl
e
4 mm 10 mm 20 mm 30 mm Pyrometer Real T_Surface (°C) kW/m^2 Sample lowered

165
0
1
2
3
4
5
6
7
8
9
10
11
12
13
14
15
16
17
18
19
20
0 60 120 180 240 300 360 420 480 540 600 660 720 780 840 900 960 1020 1080 1140 1200 1260 1320
Time (s)
Vol%
0
10
20
30
40
50
60
70
80
90
100
Vol%
Ar
Carbon Dioxide Methane Hydrogen Water-DM Carbon Monoxide Sample lowered Argon
1420
1425
1430
1435
1440
1445
1450
1455
1460
1465
1470
1475
1480
1485
1490
1495
1500
1505
1510
1515
0 60 120 180 240 300 360 420 480 540 600 660 720 780 840 900 960 1020 1080 1140 1200 1260 1320
Time (s)
Tem
pera
ture
(°C
)
Heating Zone 1 Heating Zone 2 Heating Zone 3 Sample lowered

166
Coal-Ore; 40mm layer, 1500°C, 15minutes
050
100150200250300350400450500550600650700750800850900950
10001050110011501200125013001350
0 60 120 180 240 300 360 420 480 540 600 660 720 780 840 900 960
Time (s)
Tem
pera
ture
(°C
)
-300
-280
-260
-240
-220
-200
-180
-160
-140
-120
-100
-80
-60
-40
-20
0
kW/m
^2 in
to s
ampl
e
4 mm 10 mm 20 mm 30 mm Pyrometer Real T_Surface (°C) kW/m^2 Sample lowered
0
1
2
3
4
5
6
7
8
9
10
11
12
13
14
15
16
17
18
19
20
0 60 120 180 240 300 360 420 480 540 600 660 720 780 840 900 960 1020 1080 1140 1200 1260 1320 1380 1440 1500
Time (s)
Vol%
0
10
20
30
40
50
60
70
80
90
100
Vol%
Ar
Carbon Dioxide Methane Hydrogen Water-DM Carbon Monoxide Sample lowered Argon

167
1420
1425
1430
1435
1440
1445
1450
1455
1460
1465
1470
1475
1480
1485
1490
1495
1500
1505
1510
1515
0 60 120 180 240 300 360 420 480 540 600 660 720 780 840 900 960 1020 1080 1140 1200 1260 1320 1380 1440 1500
Time (s)
Tem
pera
ture
(°C
)
Heating Zone 1 Heating Zone 2 Heating Zone 3 Sample lowered
Coal-Ore; 16 mm layer, 1400°C, 3minutes
050
100150200250300350400450500550600650700750800850900950
1000105011001150120012501300
0 60 120 180 240
Time (s)
Tem
pera
ture
(°C
)
-300
-280
-260
-240
-220
-200
-180
-160
-140
-120
-100
-80
-60
-40
-20
0
kW/m
^2 in
to s
ampl
e
4 mm 10 mm Pyrometer Real T_Surface (°C) kW/m^2 Sample lowered

168
0
1
2
3
4
5
6
7
8
9
10
11
12
13
14
15
16
17
18
19
20
0 60 120 180 240 300 360 420 480 540 600 660 720 780
Time (s)
Vol%
0
10
20
30
40
50
60
70
80
90
100
Vol%
Ar
Carbon Dioxide Methane Hydrogen Water-DM Carbon Monoxide Argon
1320
1325
1330
1335
1340
1345
1350
1355
1360
1365
1370
1375
1380
1385
1390
1395
1400
1405
1410
1415
0 60 120 180 240 300 360 420 480 540 600 660 720 780
Time (s)
Tem
pera
ture
(°C
)
Heating Zone 1 Heating Zone 2 Heating Zone 3 Sample lowered

169
Coal-Ore; 16 mm layer, 1400°C, 6minutes
050
100150200250300350400450500550600650700750800850900950
1000105011001150120012501300
0 60 120 180 240 300 360 420
Time (s)
Tem
pera
ture
(°C
)
-300
-280
-260
-240
-220
-200
-180
-160
-140
-120
-100
-80
-60
-40
-20
0
kW/m
^2 in
to s
ampl
e
4 mm 10 mm Pyrometer Real T_Surface (°C) kW/m^2 Sample lowered
0
1
2
3
4
5
6
7
8
9
10
11
12
13
14
15
16
17
18
19
20
0 60 120 180 240 300 360 420 480 540 600 660 720 780 840 900 960
Time (s)
Vol%
0.0
10.0
20.0
30.0
40.0
50.0
60.0
70.0
80.0
90.0
100.0
Vol%
Ar
Carbon Dioxide Methane Hydrogen Water-DM Carbon Monoxide Argon

170
1320
1325
1330
1335
1340
1345
1350
1355
1360
1365
1370
1375
1380
1385
1390
1395
1400
1405
1410
1415
0 60 120 180 240 300 360 420 480 540 600 660 720 780 840 900 960
Time (s)
Tem
pera
ture
(°C
)
Heating Zone 1 Heating Zone 2 Heating Zone 3 Sample lowered
Coal-Ore; 16 mm layer, 1400°C, 9minutes
050
100150200250300350400450500550600650700750800850900950
1000105011001150120012501300
0 60 120 180 240 300 360 420 480 540 600
Time (s)
Tem
pera
ture
(°C
)
-300
-280
-260
-240
-220
-200
-180
-160
-140
-120
-100
-80
-60
-40
-20
0
kW/m
^2 in
to s
ampl
e
4 mm 10 mm Pyrometer Real T_Surface (°C) kW/m^2 Sample lowered
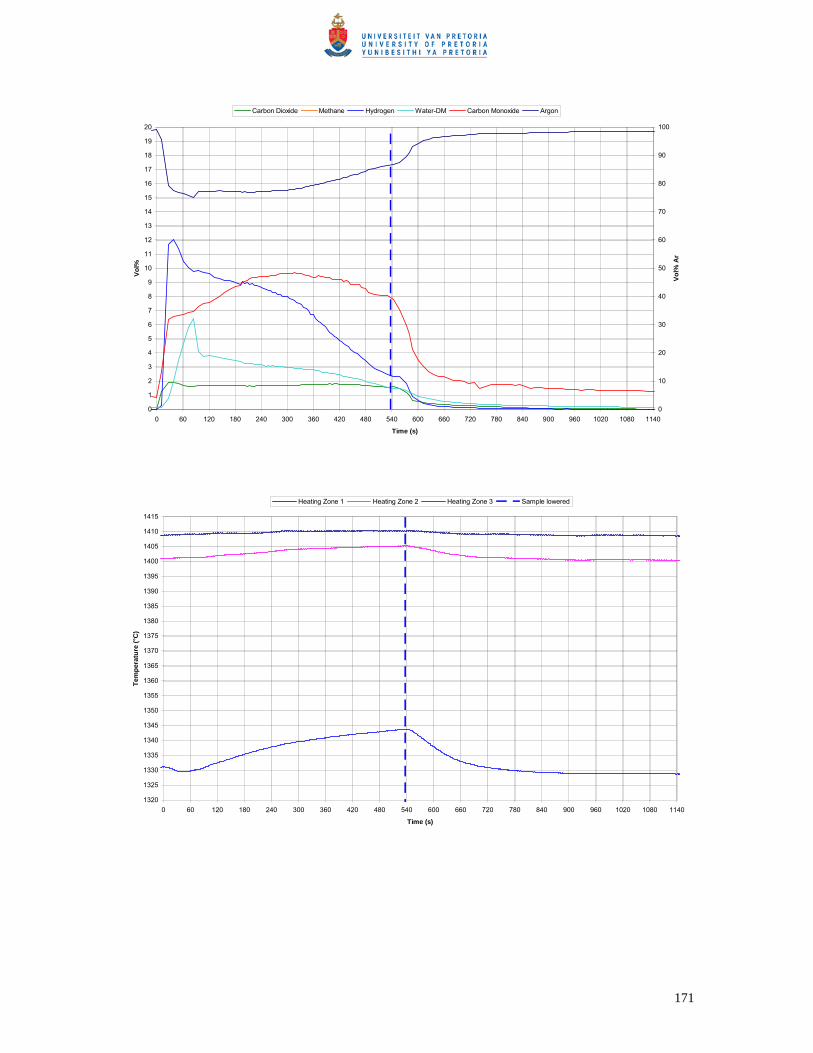
171
0
1
2
3
4
5
6
7
8
9
10
11
12
13
14
15
16
17
18
19
20
0 60 120 180 240 300 360 420 480 540 600 660 720 780 840 900 960 1020 1080 1140
Time (s)
Vol%
0
10
20
30
40
50
60
70
80
90
100
Vol%
Ar
Carbon Dioxide Methane Hydrogen Water-DM Carbon Monoxide Argon
1320
1325
1330
1335
1340
1345
1350
1355
1360
1365
1370
1375
1380
1385
1390
1395
1400
1405
1410
1415
0 60 120 180 240 300 360 420 480 540 600 660 720 780 840 900 960 1020 1080 1140
Time (s)
Tem
pera
ture
(°C
)
Heating Zone 1 Heating Zone 2 Heating Zone 3 Sample lowered

172
Coal-Ore; 16 mm layer, 1400°C, 12minutes
050
100150200250300350400450500550600650700750800850900950
1000105011001150120012501300
0 60 120 180 240 300 360 420 480 540 600 660 720 780
Time (s)
Tem
pera
ture
(°C
)
-300
-280
-260
-240
-220
-200
-180
-160
-140
-120
-100
-80
-60
-40
-20
0
kW/m
^2 in
to s
ampl
e
4 mm 10 mm Pyrometer Real T_Surface (°C) kW/m^2 Sample lowered
0
1
2
3
4
5
6
7
8
9
10
11
12
13
14
15
16
17
18
19
20
0 60 120 180 240 300 360 420 480 540 600 660 720 780 840 900 960 1020 1080 1140 1200 1260 1320
Time (s)
Vol%
0
10
20
30
40
50
60
70
80
90
100
Vol%
Ar
Carbon Dioxide Methane Hydrogen Water-DM Carbon Monoxide Argon

173
1320
1325
1330
1335
1340
1345
1350
1355
1360
1365
1370
1375
1380
1385
1390
1395
1400
1405
1410
1415
0 60 120 180 240 300 360 420 480 540 600 660 720 780 840 900 960 1020 1080 1140 1200 1260 1320
Time (s)
Tem
pera
ture
(°C
)
Heating Zone 1 Heating Zone 2 Heating Zone 3 Sample lowered
Coal-Ore; 16 mm layer, 1400°C, 15minutes
050
100150200250300350400450500550600650700750800850900950
1000105011001150120012501300
0 60 120 180 240 300 360 420 480 540 600 660 720 780 840 900 960
Time (s)
Tem
pera
ture
(°C
)
-300
-280
-260
-240
-220
-200
-180
-160
-140
-120
-100
-80
-60
-40
-20
0
kW/m
^2 in
to s
ampl
e
4 mm 10 mm Pyrometer Real T_Surface (°C) kW/m^2 Sample lowered
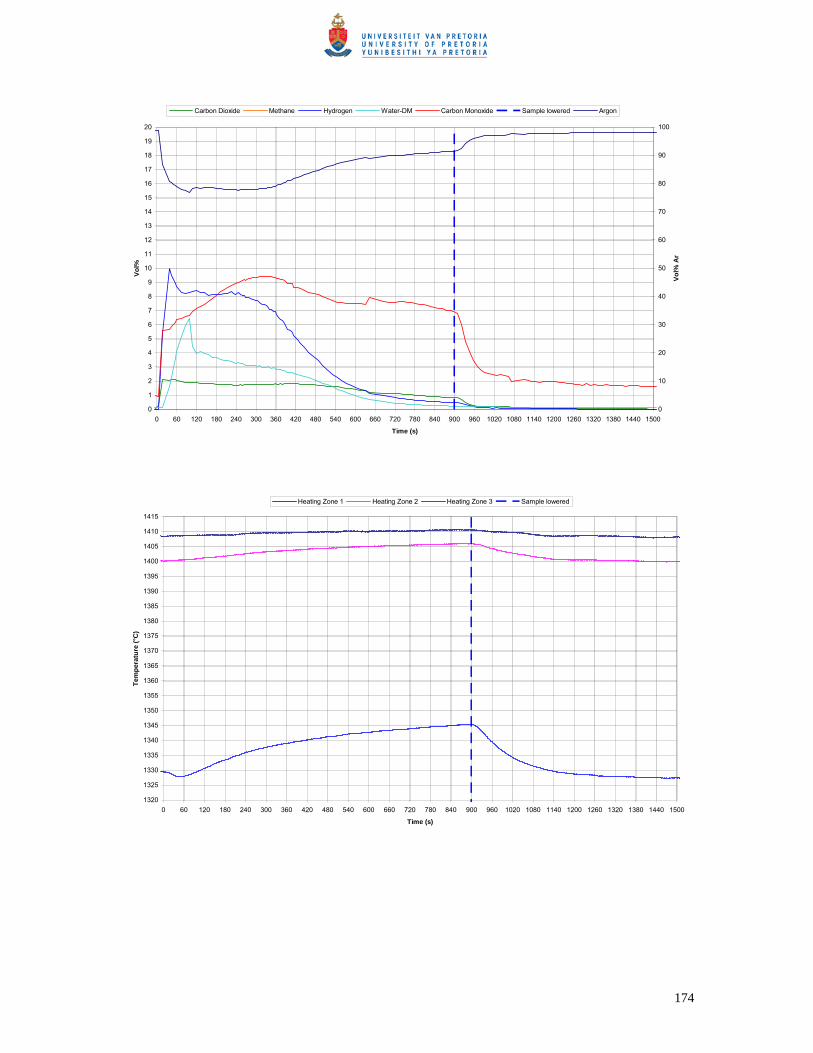
174
0
1
2
3
4
5
6
7
8
9
10
11
12
13
14
15
16
17
18
19
20
0 60 120 180 240 300 360 420 480 540 600 660 720 780 840 900 960 1020 1080 1140 1200 1260 1320 1380 1440 1500
Time (s)
Vol%
0
10
20
30
40
50
60
70
80
90
100
Vol%
Ar
Carbon Dioxide Methane Hydrogen Water-DM Carbon Monoxide Sample lowered Argon
1320
1325
1330
1335
1340
1345
1350
1355
1360
1365
1370
1375
1380
1385
1390
1395
1400
1405
1410
1415
0 60 120 180 240 300 360 420 480 540 600 660 720 780 840 900 960 1020 1080 1140 1200 1260 1320 1380 1440 1500
Time (s)
Tem
pera
ture
(°C
)
Heating Zone 1 Heating Zone 2 Heating Zone 3 Sample lowered

175
Char-Ore; 40 mm layer, 1400°C, 3minutes
0
50
100
150
200
250
300
350
400
450
500
550
600
650
700
750
800
850
900
950
1000
1050
1100
1150
1200
0 60 120 180 240
Time (s)
Tem
pera
ture
(°C
)
-300
-280
-260
-240
-220
-200
-180
-160
-140
-120
-100
-80
-60
-40
-20
0
kW/m
^2 in
to s
ampl
e
4 mm 10 mm 20 mm 30 mm Pyrometer Real T_Surface (°C) kW/m^2 Sample lowered
0
1
2
3
4
5
6
7
8
9
10
11
12
13
14
15
16
17
18
19
20
0 60 120 180 240 300 360 420 480 540 600 660 720 780
Time (s)
Vol%
0
10
20
30
40
50
60
70
80
90
100
Vol%
Ar
Carbon Dioxide Methane Hydrogen Water-DM Carbon Monoxide Sample lowered Argon

176
1320
1325
1330
1335
1340
1345
1350
1355
1360
1365
1370
1375
1380
1385
1390
1395
1400
1405
1410
1415
0 60 120 180 240 300 360 420 480 540 600 660 720 780
Time (s)
Tem
pera
ture
(°C
)
Heating Zone 1 Heating Zone 2 Heating Zone 3 Sample lowered
Char-Ore; 40 mm layer, 1400°C, 6minutes
0
50
100
150
200
250
300
350
400
450
500
550
600
650
700
750
800
850
900
950
1000
1050
1100
1150
1200
0 60 120 180 240 300 360 420
Time (s)
Tem
pera
ture
(°C
)
-300
-280
-260
-240
-220
-200
-180
-160
-140
-120
-100
-80
-60
-40
-20
0
kW/m
^2 in
to s
ampl
e
4 mm 10 mm 20 mm 30 mm Pyrometer Real T_Surface (°C) kW/m^2 Sample lowered

177
0
1
2
3
4
5
6
7
8
9
10
11
12
13
14
15
16
17
18
19
20
0 60 120 180 240 300 360 420 480 540 600 660 720 780 840 900 960
Time (s)
Vol%
0
10
20
30
40
50
60
70
80
90
100
Vol%
Ar
Carbon Dioxide Methane Hydrogen Water-DM Carbon Monoxide Sample lowered Argon
1320
1325
1330
1335
1340
1345
1350
1355
1360
1365
1370
1375
1380
1385
1390
1395
1400
1405
1410
1415
0 60 120 180 240 300 360 420 480 540 600 660 720 780 840 900 960
Time (s)
Tem
pera
ture
(°C
)
Heating Zone 1 Heating Zone 2 Heating Zone 3 Sample lowered

178
Char-Ore; 40 mm layer, 1400°C, 9minutes
0
50
100
150
200
250
300
350
400
450
500
550
600
650
700
750
800
850
900
950
1000
1050
1100
1150
1200
0 60 120 180 240 300 360 420 480 540 600
Time (s)
Tem
pera
ture
(°C
)
-300
-280
-260
-240
-220
-200
-180
-160
-140
-120
-100
-80
-60
-40
-20
0
kW/m
^2 in
to s
ampl
e
4 mm 10 mm 20 mm 30 mm Pyrometer Real T_Surface (°C) Sample lowered
0
1
2
3
4
5
6
7
8
9
10
11
12
13
14
15
16
17
18
19
20
0 60 120 180 240 300 360 420 480 540 600 660 720 780 840 900 960 1020 1080 1140
Time (s)
Vol%
0
10
20
30
40
50
60
70
80
90
100
Vol%
Ar
Carbon Dioxide Methane Hydrogen Water-DM Carbon Monoxide Sample lowered Argon

179
1320
1325
1330
1335
1340
1345
1350
1355
1360
1365
1370
1375
1380
1385
1390
1395
1400
1405
1410
1415
0 60 120 180 240 300 360 420 480 540 600 660 720 780 840 900 960 1020 1080 1140
Time (s)
Tem
pera
ture
(°C
)
Heating Zone 1 Heating Zone 2 Heating Zone 3 Sample lowered
Char-Ore; 40 mm layer, 1400°C, 12minutes
0
50
100
150
200
250
300
350
400
450
500
550
600
650
700
750
800
850
900
950
1000
1050
1100
1150
1200
0 60 120 180 240 300 360 420 480 540 600 660 720 780
Time (s)
Tem
pera
ture
(°C
)
-300
-280
-260
-240
-220
-200
-180
-160
-140
-120
-100
-80
-60
-40
-20
0
kW/m
^2 in
to s
ampl
e
4 mm 10 mm 20 mm 30 mm Pyrometer Real T_Surface (°C) Gas T Sample lowered

180
0
1
2
3
4
5
6
7
8
9
10
11
12
13
14
15
16
17
18
19
20
0 60 120 180 240 300 360 420 480 540 600 660 720 780 840 900 960 1020 1080 1140 1200 1260 1320
Time (s)
Vol%
0
10
20
30
40
50
60
70
80
90
100
Vol%
Ar
Carbon Dioxide Methane Hydrogen Water-DM Carbon Monoxide Sample lowered Argon
1320
1325
1330
1335
1340
1345
1350
1355
1360
1365
1370
1375
1380
1385
1390
1395
1400
1405
1410
1415
0 60 120 180 240 300 360 420 480 540 600 660 720 780 840 900 960 1020 1080 1140 1200 1260 1320
Time (s)
Tem
pera
ture
(°C
)
Heating Zone 1 Heating Zone 2 Heating Zone 3 Sample lowered

181
Char-Ore; 40 mm layer, 1400°C, 15minutes
0
50
100
150
200
250
300
350
400
450
500
550
600
650
700
750
800
850
900
950
1000
1050
1100
1150
1200
0 60 120 180 240 300 360 420 480 540 600 660 720 780 840 900 960
Time (s)
Tem
pera
ture
(°C
)
-300
-280
-260
-240
-220
-200
-180
-160
-140
-120
-100
-80
-60
-40
-20
0
kW/m
^2 in
to s
ampl
e
4 mm 10 mm 20 mm 30 mm Pyrometer Real T_Surface (°C) kW/m^2 Sample lowered
0
1
2
3
4
5
6
7
8
9
10
11
12
13
14
15
16
17
18
19
20
0 60 120 180 240 300 360 420 480 540 600 660 720 780 840 900 960 1020 1080 1140 1200 1260 1320 1380 1440 1500
Time (s)
Vol%
0
10
20
30
40
50
60
70
80
90
100
Vol%
Ar
Carbon Dioxide Methane Hydrogen Water-DM Carbon Monoxide Sample lowered Argon

182
1320
1325
1330
1335
1340
1345
1350
1355
1360
1365
1370
1375
1380
1385
1390
1395
1400
1405
1410
1415
0 60 120 180 240 300 360 420 480 540 600 660 720 780 840 900 960 1020 1080 1140 1200 1260 1320 1380 1440 1500
Time (s)
Tem
pera
ture
(°C
)
Heating Zone 1 Heating Zone 2 Heating Zone 3 Sample lowered
-850 +425 µm Coal & -2000 +1400 µm Ore; 40 mm layer, 1400°C, 9minutes
050
100150200250300350400450500550600650700750800850900950
1000105011001150120012501300
0 30 60 90 120 150 180 210 240 270 300 330 360 390 420 450 480 510 540 570
Time (s)
Tem
pera
ture
(°C
)
-300
-280
-260
-240
-220
-200
-180
-160
-140
-120
-100
-80
-60
-40
-20
0
kW/m
^2 in
to s
ampl
e
4 mm 10 mm 20 mm 30 mm Pyrometer Real T_Surface (°C) kW/m^2 sample lowered

183
0
1
2
3
4
5
6
7
8
9
10
11
12
13
14
15
16
17
18
19
20
0 60 120 180 240 300 360 420 480 540 600 660 720 780 840 900 960 1020 1080 1140
Time (s)
Vol%
0
10
20
30
40
50
60
70
80
90
100
Vol%
Ar
Carbon Dioxide Methane Hydrogen Water-DM Carbon Monoxide Argon
1320
1325
1330
1335
1340
1345
1350
1355
1360
1365
1370
1375
1380
1385
1390
1395
1400
1405
1410
1415
0 60 120 180 240 300 360 420 480 540 600 660 720 780 840 900 960 1020 1080 1140 1200
Time (s)
Tem
pera
ture
(°C
)
Heating Zone 1 Heating Zone 2 Heating Zone 3 sample lowered

184
-2000 +1400 µm Coal & -850 +425 µm Ore; 40 mm layer, 1400°C, 9minutes
050
100150200250300350400450500550600650700750800850900950
1000105011001150120012501300
0 30 60 90 120 150 180 210 240 270 300 330 360 390 420 450 480 510 540 570
Time (s)
Tem
pera
ture
(°C
)
-300
-280
-260
-240
-220
-200
-180
-160
-140
-120
-100
-80
-60
-40
-20
0
kW/m
^2 in
to s
ampl
e
4 mm 10 mm 20 mm 30 mm Pyrometer Real T_Surface (°C) kW/m^2 sample lowered
0
12
3
45
67
89
10
1112
13
1415
1617
1819
20
2122
2324
25
0 60 120 180 240 300 360 420 480 540 600 660 720 780 840 900 960 1020 1080 1140
Time (s)
Vol%
0
10
20
30
40
50
60
70
80
90
100
Vol%
Ar
Carbon Dioxide Methane Hydrogen Water-DM Carbon Monoxide Argon

185
1320
1325
1330
1335
1340
1345
1350
1355
1360
1365
1370
1375
1380
1385
1390
1395
1400
1405
1410
1415
0 60 120 180 240 300 360 420 480 540 600 660 720 780 840 900 960 1020 1080 1140 1200
Time (s)
Tem
pera
ture
(°C
)
Heating Zone 1 Heating Zone 2 Heating Zone 3 sample lowered
-425 +300 µm Coal & -850 +425 µm Ore; 40 mm layer, 1400°C, 9minutes
050
100150200250300350400450500550600650700750800850900950
1000105011001150120012501300
0 30 60 90 120 150 180 210 240 270 300 330 360 390 420 450 480 510 540 570
Time (s)
Tem
pera
ture
(°C
)
-300
-280
-260
-240
-220
-200
-180
-160
-140
-120
-100
-80
-60
-40
-20
0
kW/m
^2 in
to s
ampl
e
4 mm 10 mm 20 mm 30 mm Pyrometer Real T_Surface (°C) -631 sample lowered

186
0
12
3
45
67
89
10
1112
13
1415
1617
1819
20
2122
2324
25
0 60 120 180 240 300 360 420 480 540 600 660 720 780 840 900 960 1020 1080 1140
Time (s)
Vol%
0
10
20
30
40
50
60
70
80
90
100
Vol%
Ar
Carbon Dioxide Methane Hydrogen Water-DM Carbon Monoxide Argon
1320
1325
1330
1335
1340
1345
1350
1355
1360
1365
1370
1375
1380
1385
1390
1395
1400
1405
1410
1415
0 60 120 180 240 300 360 420 480 540 600 660 720 780 840 900 960 1020 1080 1140 1200
Time (s)
Tem
pera
ture
(°C
)
Heating Zone 1 Heating Zone 2 Heating Zone 3 sample lowered

187
-850 +425 µm Coal & -425 +300 µm Ore; 40 mm layer, 1400°C, 9minutes
050
100150200250300350400450500550600650700750800850900950
1000105011001150120012501300
0 30 60 90 120 150 180 210 240 270 300 330 360 390 420 450 480 510 540 570
Time (s)
Tem
pera
ture
(°C
)
-300
-280
-260
-240
-220
-200
-180
-160
-140
-120
-100
-80
-60
-40
-20
0
kW/m
^2 in
to s
ampl
e
4 mm 10 mm 20 mm 30 mm Pyrometer Real T_Surface (°C) kW/m^2 sample lowered
0123456789
101112131415161718192021222324252627282930
0 60 120 180 240 300 360 420 480 540 600 660 720 780 840 900 960 1020 1080 1140
Time (s)
Vol%
0
10
20
30
40
50
60
70
80
90
100
Vol%
Ar
Carbon Dioxide Methane Hydrogen Water-DM Carbon Monoxide Argon

188
1320
1325
1330
1335
1340
1345
1350
1355
1360
1365
1370
1375
1380
1385
1390
1395
1400
1405
1410
1415
0 60 120 180 240 300 360 420 480 540 600 660 720 780 840 900 960 1020 1080 1140 1200
Time (s)
Tem
pera
ture
(°C
)
Heating Zone 1 Heating Zone 2 Heating Zone 3 sample lowered
Alumina-Coal; 40 mm layer, 1300°C
050
100150200250300350400450500550600650700750800850900950
1000105011001150120012501300
0 120 240 360 480 600 720 840 960 1080 1200 1320 1440 1560 1680 1800 1920 2040 2160 2280 2400
Time (s)
Tem
pera
ture
(°C
)
-300
-280
-260
-240
-220
-200
-180
-160
-140
-120
-100
-80
-60
-40
-20
0
Gas
Tem
pera
ture
at G
as T
rap
4 mm 10 mm 20 mm 30 mm Pyrometer Real T_Surface (°C) kW/m^2 Sample lowered

189
0
1
2
3
4
5
6
7
8
9
10
11
12
13
14
15
16
17
18
19
20
0 120 240 360 480 600 720 840 960 1080 1200 1320 1440 1560 1680 1800 1920 2040 2160 2280 2400
Time (s)
Vol%
0
10
20
30
40
50
60
70
80
90
100
Vol%
Ar
Carbon Dioxide Methane Hydrogen Water-DM Carbon Monoxide Sample lowered Argon
1220
1225
1230
1235
1240
1245
1250
1255
1260
1265
1270
1275
1280
1285
1290
1295
1300
1305
1310
1315
0 300 600 900 1200 1500 1800 2100 2400
Time (s)
Tem
pera
ture
(°C
)
Heating Zone 1 Heating Zone 2 Heating Zone 3 Sample lowered

190
Alumina-Coal; 40 mm layer, 1400°C
050
100150200250300350400450500550600650700750800850900950
1000105011001150120012501300
0 300 600 900 1200 1500 1800
Time (s)
Tem
pera
ture
(°C
)
-300
-280
-260
-240
-220
-200
-180
-160
-140
-120
-100
-80
-60
-40
-20
0
kW/m
^2 in
to s
ampl
e
4 mm 10 mm 20 mm 30 mm Pyrometer Real T_Surface (°C) kW/m^2 Sample lowered
0
1
2
3
4
5
6
7
8
9
10
11
12
13
14
15
16
17
18
19
20
0 120 240 360 480 600 720 840 960 1080 1200 1320 1440 1560 1680 1800 1920 2040 2160 2280 2400
Time (s)
Vol%
& %
H2/
%C
O
0
10
20
30
40
50
60
70
80
90
100
Vol%
Ar
Carbon Dioxide Methane Hydrogen Water-DM Carbon Monoxide Sample lowered Argon

191
1320
1325
1330
1335
1340
1345
1350
1355
1360
1365
1370
1375
1380
1385
1390
1395
1400
1405
1410
1415
0 300 600 900 1200 1500 1800 2100 2400
Time (s)
Tem
pera
ture
(°C
)
Heating Zone 1 Heating Zone 2 Heating Zone 3 Sample lowered
Alumina-Coal; 40 mm layer, 1500°C
050
100150200250300350400450500550600650700750800850900950
100010501100115012001250130013501400
0 120 240 360 480 600 720 840 960 1080 1200 1320 1440 1560 1680 1800 1920 2040 2160 2280 2400
Time (s)
Tem
pera
ture
(°C
)
4 mm 10 mm 20 mm 30 mm Pyrometer Real T_Surface (°C) sample lowered

192
0123456789
101112131415161718192021222324252627282930
0 120 240 360 480 600 720 840 960 1080 1200 1320 1440 1560 1680 1800 1920 2040 2160 2280 2400
Time (s)
Vol%
0
10
20
30
40
50
60
70
80
90
100
Vol%
Ar
Carbon Dioxide Methane Hydrogen Water-DM Carbon Monoxide sample lowered Argon
1420
1425
1430
1435
1440
1445
1450
1455
1460
1465
1470
1475
1480
1485
1490
1495
1500
1505
1510
1515
0 120 240 360 480 600 720 840 960 1080 1200 1320 1440 1560 1680 1800 1920 2040
Time (s)
Tem
pera
ture
(°C
)
Heating Zone 1 Heating Zone 2 Heating Zone 3 sample lowered

193
Appendix IX Calculation of %Carbon consumption, %Reduction and Total mass loss
%Carbon consumption
OreFemm in
ore
outFe
intotal %
100
%
100⋅⋅=
100%
100%
_TotalCCoalmm in
totalin
totalC ⋅⋅=
intotalCtop
intopC mXm _
_ ⋅=
100% _
__
_outtop
corrouttopcorrtotal
outtopC
Cmm ⋅=
100)(
% _
__⋅
−= intop
C
outtopC
intopCtop
nconsumptiom
mmC
The %Carbon consumption is calculated similarly for the middle and bottom nodes
%Reduction
OFe
outtopcorrouttop
corrtotalintop
O mmmm
totalFemm ⋅⋅
⋅⋅⋅= 3
2100)(% _
__
_
⎟⎟⎠
⎞⎜⎜⎝
⎛⋅⋅
⋅⋅+
+⋅⋅+
⋅= OFe
outtopcorr
OFe
outtopcorrouttop
corrtotalouttop
O mmmm
Femm
mmFe
mm 32100
)3(%100
)2(% ___
__
100)(
% _
__⋅
−= intop
O
outtopO
intopOtop
m
mmR
The %Reduction is calculated similarly for the middle and bottom nodes
Mass loss calculated from weighed masses and firbre board carry over correction overcarry
OAlovercarry
SiOouttop
corrtotalintotal
weighedtotal mmmmm −− −−−=∆
322
__
Total mass oxygen in unreacted sample
⎟⎟⎠
⎞⎜⎜⎝
⎛+⋅
⋅⋅+++=
100_%
100_%
2
2_
____
CoalOmmmm
CoalOHmmmmm O
OH
intotalC
inbotO
inmidO
intopO
intotalO
CoalOH _% 2 = %Moisture in Proximate analysis of coal

194
CoalO _% = %O in Ultimate analysis of coal
overcarryOAlm −
32 = g. Al2O3 carry-over from fibreboard to reacted sample mix in top node
overcarrySiOm −
2= g. SiO2 carry-over from fibreboard to reacted sample mix in top node
intotalm = total g. unreacted sample mix in crucible
weighedtotalm∆ = sample mass loss calculated from weighed masses and fibre board carry over correction
inijm _ = mass of component j in node i of unreacted sample
outijm _ = mass of component j in node i of reacted sample
outicorrjm _
_ = corrected mass of component j in node i of reacted sample
intotalm = total g. unreacted sample mix in crucible
iniY _% = mass% of component Y in node i of unreacted sample
outiY _% = mass% of component Y in node i of reacted sample
outicorrY _% = corrected mass% of component Y in node i of reacted sample
kmm = molar mass of component k
iX = mass fraction of sample material mix in node i, i = top, mid, bot for top, middle or bottom node
i = top, mid, bot for top, middle or bottom node

195
Appendix X Appendix X (a): Graphs of total sample mass loss calculated from weighed masses and fibreboard (FB) carry over ( weighed
totalm∆ ) vs. mass loss according to product gas analyses
1300°C, 40 mm, Coal-Ore
0.0
0.5
1.0
1.5
2.0
2.5
3.0
3.5
4.0
4.5
5.0
5.5
6.0
6.5
7.0
0.0 0.5 1.0 1.5 2.0 2.5 3.0 3.5 4.0 4.5 5.0 5.5 6.0 6.5 7.0
g. mass loss - weighed
g. m
ass
loss
- ga
s an
alys
is
Mass Loss according tomixture in sample split & FBcarry over; [Mixture mass isbackcalulated from Fe massbalance]
Mass loss according to gasanalyses (Total time)
1400°C, 40mm, Coal-Ore
0.0
0.5
1.0
1.5
2.0
2.5
3.0
3.5
4.0
4.5
5.0
5.5
6.0
6.5
7.0
0.0 0.5 1.0 1.5 2.0 2.5 3.0 3.5 4.0 4.5 5.0 5.5 6.0 6.5 7.0
g. mass loss - weighed
g. m
ass
loss
- ga
s an
alys
is
Mass Loss according to mixture insample split & FB carry over; [Mixturemass is backcalulated from Fe massbalance]
Mass loss according to gas analyses (Total time)

196
1500°C, 40 mm, Coal-Ore
0.0
0.5
1.0
1.5
2.0
2.5
3.0
3.5
4.0
4.5
5.0
5.5
6.0
6.5
7.0
7.5
8.0
8.5
9.0
9.5
10.0
0.0 0.5 1.0 1.5 2.0 2.5 3.0 3.5 4.0 4.5 5.0 5.5 6.0 6.5 7.0 7.5 8.0 8.5 9.0 9.5 10.0
g. mass loss - weighed
g. m
ass
loss
- ga
s an
alys
is
Mass Loss according tomixture in sample split & FBcarry over; [Mixture mass isbackcalulated from Fe massbalance]
Mass loss according to gasanalyses (Total time)
1400°C, 16 mm, Coal-Ore
0.0
0.5
1.0
1.5
2.0
2.5
3.0
3.5
4.0
4.5
5.0
5.5
6.0
6.5
7.0
0.0 0.5 1.0 1.5 2.0 2.5 3.0 3.5 4.0 4.5 5.0 5.5 6.0 6.5 7.0
g. mass loss - weighed
g. m
ass
loss
- ga
s an
alys
is
Mass Loss according to mixture insample split & FB carry over;[Mixture mass is backcalulatedfrom Fe mass balance]
Mass loss according to gasanalyses (Total time)

197
1400°C, 40mm, Size Fraction Change
0.0
0.5
1.0
1.5
2.0
2.5
3.0
3.5
4.0
4.5
5.0
5.5
6.0
6.5
7.0
0.0 0.5 1.0 1.5 2.0 2.5 3.0 3.5 4.0 4.5 5.0 5.5 6.0 6.5 7.0
g. mass loss - weighed
g. m
ass
loss
- ga
s an
alys
is
Mass Loss according to mixture insample split & FB carry over; [Mixturemass is backcalulated from Fe massbalance]
Mass loss according to gas analyses (Total time)
Fine Ore
Fine Coal
Coarse Ore
Coarse Coal
1400°C, 40mm, Char-Ore
0.0
0.5
1.0
1.5
2.0
2.5
3.0
3.5
4.0
4.5
5.0
5.5
6.0
6.5
7.0
0.0 0.5 1.0 1.5 2.0 2.5 3.0 3.5 4.0 4.5 5.0 5.5 6.0 6.5 7.0
g. mass loss - weighed
g. m
ass
loss
- ga
s an
alys
is
Mass Loss according to mixture insample split & FB carry over; [Mixturemass is backcalulated from Fe massbalance]
Mass loss according to gas analyses (Total time)

198
Appendix X (b): Graphs of total oxygen removed from sample as calculated from forms of Fe analyses for reacted sample vs. total oxygen in product gas analyses
1300°C, 40 mm, Coal-Ore
0.0
0.5
1.0
1.5
2.0
2.5
3.0
3.5
4.0
4.5
5.0
0.0 0.5 1.0 1.5 2.0 2.5 3.0 3.5 4.0 4.5 5.0
g. O in product gas
g. O
in p
rodu
ct g
as
g. O to gas from Forms of Feanalyses of reacted samplematerial
g. O in CO & CO2 & H2O inProduct gas [Total Time]
1400°C, 40 mm, Coal-Ore
0.0
0.5
1.0
1.5
2.0
2.5
3.0
3.5
4.0
4.5
5.0
0.0 0.5 1.0 1.5 2.0 2.5 3.0 3.5 4.0 4.5 5.0
g. O in product gas
g. O
in p
rodu
ct g
as
g. O to gas from Forms of Feanalyses of reacted sample material
g. O in CO & CO2 & H2O inProduct gas [Total Time]

199
1500°C, 40 mm, Coal-Ore
0.0
0.5
1.0
1.5
2.0
2.5
3.0
3.5
4.0
4.5
5.0
5.5
6.0
0.0 0.5 1.0 1.5 2.0 2.5 3.0 3.5 4.0 4.5 5.0 5.5 6.0
g. O in product gas
g. O
in p
rodu
ct g
as
g. O to gas from Forms of Feanalyses of reacted sample material
g. O in CO & CO2 & H2O in Productgas [Total Time]
1400°C, 16 mm, Coal-Ore
0.0
0.5
1.0
1.5
2.0
2.5
3.0
3.5
4.0
4.5
5.0
0.0 0.5 1.0 1.5 2.0 2.5 3.0 3.5 4.0 4.5 5.0
g. O in product gas
g. O
in p
rodu
ct g
as
g. O to gas from Forms of Feanalyses of reacted sample material
g. O in CO & CO2 & H2O in Productgas [Total Time]

200
1400°C, 40 mm, Size Fraction Change
0.0
0.5
1.0
1.5
2.0
2.5
3.0
3.5
4.0
4.5
5.0
0.0 0.5 1.0 1.5 2.0 2.5 3.0 3.5 4.0 4.5 5.0
g. O in product gas
g. O
in p
rodu
ct g
as
g. O to gas from Forms of Feanalyses of reacted sample material
g. O in CO & CO2 & H2O in Productgas [Total Time]
Fine Coal
Coarse Ore
Fine Ore
Coarse Coal
1400°C, 40 mm, Char-Ore
0.0
0.5
1.0
1.5
2.0
2.5
3.0
3.5
4.0
4.5
5.0
0.0 0.5 1.0 1.5 2.0 2.5 3.0 3.5 4.0 4.5 5.0
g. O in product gas
g. O
in p
rodu
ct g
as
g. O to gas from Forms of Feanalyses of reacted sample material
g. O in CO & CO2 & H2O in Productgas [Total Time]

201
Appendix X (c): Graphs of total carbon remaining in reacted sample as calculated from carbon analyses for reacted sample vs. total carbon in product gas analyses
1300°C; 40 mm, Coal-Ore
0.0
0.5
1.0
1.5
2.0
2.5
3.0
3.5
4.0
4.5
5.0
5.5
6.0
6.5
7.0
7.5
8.0
0.0 0.5 1.0 1.5 2.0 2.5 3.0 3.5 4.0 4.5 5.0 5.5 6.0 6.5 7.0 7.5 8.0
Total g. Carbon in sample according to sample analyses
Tota
l g. C
arbo
n in
sam
ple Total g. Carbon remaining in
sample [calculated from sampleanalysis]
Total g. Carbon remaining insample [calculated from productgas analyses]
g. Total Carbon in
1400°C, 40 mm, Coal-Ore
0.0
0.5
1.0
1.5
2.0
2.5
3.0
3.5
4.0
4.5
5.0
5.5
6.0
6.5
7.0
7.5
0.0 0.5 1.0 1.5 2.0 2.5 3.0 3.5 4.0 4.5 5.0 5.5 6.0 6.5 7.0 7.5
Total g. Carbon in sample according to sample analyses
Tota
l g. C
arbo
n in
sam
ple
Total g. Carbon remaining in sample[calculated from sample analysis]
Total g. Carbon remaining in sample[calculated from product gasanalyses]g. Total Carbon in

202
1500°C, 40 mm, Coal-Ore
0.0
0.5
1.0
1.5
2.0
2.5
3.0
3.5
4.0
4.5
5.0
5.5
6.0
6.5
7.0
7.5
8.0
0.0 0.5 1.0 1.5 2.0 2.5 3.0 3.5 4.0 4.5 5.0 5.5 6.0 6.5 7.0 7.5 8.0
Total g. Carbon in sample according to sample analyses
Tota
l g. C
arbo
n in
sam
ple Total g. Carbon remaining in
sample [calculated from sampleanalysis]
Total g. Carbon remaining insample [calculated from productgas analyses]
g. Total Carbon in
1400°C, 16 mm, Coal-Ore
0.0
0.5
1.0
1.5
2.0
2.5
3.0
3.5
4.0
4.5
5.0
0.0 0.5 1.0 1.5 2.0 2.5 3.0 3.5 4.0 4.5 5.0
Total g. Carbon in sample according to sample analyses
Tota
l g. C
arbo
n in
sam
ple
Total g. Carbon remaining insample [calculated from sampleanalysis]
Total g. Carbon remaining insample [calculated from productgas analyses]
g. Total Carbon in

203
1400°C, 40 mm, Size Fraction Change
0.0
0.5
1.0
1.5
2.0
2.5
3.0
3.5
4.0
4.5
5.0
5.5
6.0
6.5
7.0
7.5
8.0
0.0 0.5 1.0 1.5 2.0 2.5 3.0 3.5 4.0 4.5 5.0 5.5 6.0 6.5 7.0 7.5 8.0
Total g. Carbon in sample according to sample analyses
Tota
l g. C
arbo
n in
sam
ple Total g. Carbon remaining in
sample [calculated from sampleanalysis]
Total g. Carbon remaining insample [calculated from productgas analyses]
g. Total Carbon in
Coarse Ore
Fine Coal
Fine Ore
Coarse Coal
1400°C, 40 mm, Char-Ore
0.0
0.5
1.0
1.5
2.0
2.5
3.0
3.5
4.0
4.5
5.0
5.5
6.0
6.5
7.0
7.5
0.0 0.5 1.0 1.5 2.0 2.5 3.0 3.5 4.0 4.5 5.0 5.5 6.0 6.5 7.0 7.5
Total g. Carbon in sample according to sample analyses
Tota
l g. C
arbo
n in
sam
ple Total g. Carbon remaining in
sample [calculated from sampleanalysis]
Total g. Carbon remaining insample [calculated from productgas analyses]
g. Total Carbon in

204
Appendix XI: Sample masses and analyses for coal-ore; coal-char and coal-alumina experiments (*For Coal/Char Size and Ore Size: 1=-2000 +1400 µm; 2 = -850 +425 µm; 3 = -425 +300 µm; * Corrected for Fibreboard carry over)
Mass% In Sample Mix Out Fibreboard Thermocouples Totals Out Mass In
Sam
ple
Num
ber
Furn
ace
Tem
pera
ture
(°C
)
Coa
l/Cha
r
Coa
l/Cha
r Siz
e*
Ore
Siz
e*
Rea
ctio
n Ti
me
[min
.]
Sam
ple
Laye
r Thi
ckne
ss [m
m]
mas
s% O
re in
mas
s% C
oal i
n
g. s
ampl
e m
ix -
top
g. s
ampl
e m
ix -
mid
dle
g. s
ampl
e m
ix -
botto
m
g. F
ibre
boar
d - t
op
g. F
ibre
boar
d -m
iddl
e
g. F
ibre
boar
d -b
otto
m
g. th
erm
ocou
ple
- top
g. th
erm
ocou
ple
- mid
dle
g. th
erm
ocou
ple
-bot
tom
Tota
l g. s
ampl
e m
ix o
ut
Tota
l g. F
ibre
boea
rd o
ut
Tota
l g. T
herm
ocou
ples
out
g. F
ibre
boar
d in
g. M
ix in
g.M
ixin
cruc
ible
befo
reex
perim
ent,
acco
rdin
g to
ana
lyse
s on
reac
ted
sam
ple
1300_3_40 1300 Coal 2 2 3 40 75.3 24.7 13.490 16.210 10.918 5.302 3.888 8.348 0 0 0 40.618 17.538 0 19.591 40.209 40.5551300_6_40 1300 Coal 2 2 6 40 75.3 24.7 12.843 15.862 10.792 5.480 3.880 8.668 0 0 0 39.497 18.028 0 19.849 40.167 40.1971300_9_40 1300 Coal 2 2 9 40 75.3 24.7 12.679 16.414 10.049 5.119 3.931 8.719 0 0 0 39.142 17.769 0 19.793 40.236 40.0261300_12_40 1300 Coal 2 2 12 40 75.3 24.7 15.389 13.901 8.118 10.975 6.266 13.045 0 0 0 37.408 30.286 0 32.529 38.875 38.7211300_15_40 1300 Coal 2 2 15 40 75.3 24.7 14.145 14.595 7.600 9.733 6.335 12.962 0 0 0 36.340 29.030 0 31.103 38.842 38.825
1400_3_40 1400 Coal 2 2 3 40 75.3 24.7 15.831 15.024 7.378 11.234 6.314 13.137 0 0 0 38.233 30.685 0 31.865 39.092 39.1991400_6_40 1400 Coal 2 2 6 40 75.3 24.7 14.425 14.775 8.347 10.076 6.491 14.509 0 0 0 37.547 31.076 0 32.460 39.164 39.2491400_9_40 1400 Coal 2 2 9 40 75.3 24.7 13.755 15.042 5.246 10.804 6.814 12.634 0 0 0 34.043 30.252 0 31.637 39.383 36.3821400_12_40 1400 Coal 2 2 12 40 75.3 24.7 12.849 14.429 7.717 11.660 6.550 13.540 0 0 0 34.995 31.750 0 32.889 38.473 38.8201400_15_40 1400 Coal 2 2 15 40 75.3 24.7 11.930 14.693 7.968 9.972 6.138 13.187 0 0 0 34.591 29.297 0 30.991 38.503 38.267
1500_3_40 1500 Coal 2 2 3 40 75.3 24.7 15.622 14.472 8.416 10.112 6.540 13.396 0 0 0 38.510 30.048 0 31.756 39.638 39.9091500_6_40 1500 Coal 2 2 6 40 75.3 24.7 12.993 14.785 9.013 10.692 6.396 12.863 0 0 0 36.791 29.951 0 31.451 39.523 39.8521500_9_40 1500 Coal 2 2 9 40 75.3 24.7 13.138 14.922 8.281 10.778 6.751 13.189 0 0 0 36.341 30.718 0 32.562 39.700 40.2431500_12_40 1500 Coal 2 2 12 40 75.3 24.7 11.468 14.448 7.901 9.697 5.810 12.630 0 0 0 33.817 28.137 0 30.528 38.342 38.7341500_15_40 1500 Coal 2 2 15 40 75.3 24.7 10.868 13.241 8.373 10.395 5.924 12.276 0 0 0 32.482 28.595 0 31.001 38.432 38.125
1400_3_16 1400 Coal 2 2 3 16 75.3 24.7 13.723 0 0 36.794 0 0 0 0 0 13.723 36.794 0 37.172 14.999 14.9461400_6_16 1400 Coal 2 2 6 16 75.3 24.7 12.821 0 0 40.621 0 0 0 0 0 12.821 40.621 0 40.887 15.007 14.9531400_9_16 1400 Coal 2 2 9 16 75.3 24.7 12.159 0 0 37.403 0 0 0 0 0 12.159 37.403 0 37.730 14.997 15.0631400_12_16 1400 Coal 2 2 12 16 75.3 24.7 11.668 0 0 39.304 0 0 0 0 0 11.668 39.304 0 39.668 14.976 14.7991400_15_16 1400 Coal 2 2 15 16 75.3 24.7 11.188 0 0 39.941 0 0 0 0 0 11.188 39.941 0 40.357 14.980 14.855
Coarse ore_I 1400 Coal 2 1 9 40 75.3 24.7 14.777 16.677 6.439 5.333 3.941 9.672 0 0 0 37.893 18.946 0 21.139 40.222 40.646Coarse coal_II 1400 Coal 1 2 9 40 75.3 24.7 16.635 14.001 5.650 6.559 3.798 8.538 0 0 0 36.286 18.895 0 20.495 39.340 38.605Fine coal_A 1400 Coal 3 2 9 40 75.3 24.7 11.779 15.669 9.383 5.652 3.875 9.075 0 0 0 36.831 18.602 0 20.440 40.241 39.901Fine ore_B 1400 Coal 2 3 9 40 75.3 24.7 9.598 16.092 10.185 5.231 3.917 9.316 0 0 0 35.875 18.464 0 20.514 39.089 37.698
1400_3_40_char 1400 Char 2 2 3 40 79.7 20.3 14.929 17.208 10.078 5.445 4.132 9.093 0 0 0 42.215 18.67 0 20.606 42.074 42.5221400_6_40_char 1400 Char 2 2 6 40 79.8 20.2 15.509 16.130 9.916 5.408 3.908 9.115 0 0 0 41.555 18.431 0 20.082 42.003 42.0411400_9_40_char 1400 Char 2 2 9 40 79.8 20.2 15.333 16.019 9.813 10.124 5.815 14.334 0 0 0 41.165 30.273 0 32.236 41.992 42.2881400_12_40_char 1400 Char 2 2 12 40 79.8 20.2 15.974 15.371 8.380 6.053 3.896 9.277 0 0 0 39.725 19.226 0 21.024 41.427 41.3681400_15_40_char 1400 Char 2 2 15 40.0 79.7 20.3 15.118 14.743 9.377 5.751 3.881 8.984 0 0 0 39.238 18.616 0 21.278 41.792 42.038

205
*Corrected for Fibreboard carry over
Product Gas Product gas analysed Sample out Fe analyses Sample out Fe analyses - Corrected*
Sam
ple
Num
ber
Mas
slo
ssac
cord
ing
toP
rodu
ctga
san
alys
is[T
otal
Tim
e]
Mas
slo
ssac
cord
ing
toP
rodu
ctga
san
alys
is[E
xper
imen
tal T
ime
only
]
g.O
inC
O&
CO
2in
Pro
duct
gas
[Tot
alTi
me]
g.O
inC
O&
CO
2in
Prod
uct
gas
[Exp
erim
enta
l tim
e on
ly]
g.O
inC
O&
CO
2&
H2O
inP
rodu
ctga
s[T
otal
Tim
e]
Tota
l g. C
O2
in P
rodu
ct G
as
Tota
l g. C
H4
in P
rodu
ct G
as
Tota
l g. C
O in
Pro
duct
Gas
Tota
l g. H
2 in
Pro
duct
Gas
Tota
l g. H
2O in
Pro
duct
Gas
%Fe
(met
) - T
op
%Fe
(met
) - M
iddl
e
%Fe
(met
) - B
otto
m
%Fe
O -
Top
%Fe
O -
Mid
dle
%Fe
O -
Bot
tom
%Fe
2O3
-Top
%Fe
2O3
- Mid
dle
%Fe
2O3
- Bot
tom
%Fe
(met
) - T
op (C
orre
cted
)*
%Fe
(met
) - M
iddl
e (C
orre
cted
)*
%Fe
(met
) - B
otto
m (C
orre
cted
)*
%Fe
O -
Top
(Cor
rect
ed)*
%Fe
O -
Mid
dle
(Cor
rect
ed)*
%Fe
O -
Bot
tom
(Cor
rect
ed)*
%Fe
2O3
- Top
(Cor
rect
ed)*
%Fe
2O3
- Mid
dle
(Cor
rect
ed)*
%Fe
2O3
- Bot
tom
(Cor
rect
ed)*
%Fe
(+2)
- To
p (C
orre
cted
)*
%Fe
(+2)
- M
iddl
e (C
orre
cted
*)
%Fe
(+2)
- B
otto
m (C
orre
cted
)*
%Fe
(+3)
- To
p (C
orre
cted
*)
%Fe
(+3)
- M
iddl
e (C
orre
cted
*)
%Fe
(+3)
- B
otto
m (C
orre
cted
*)
%Fe
(tota
l) - T
op (C
orre
cted
)*
%Fe
(tota
l) - M
iddl
e (C
orre
cted
)*
%Fe
(tota
l) - B
otto
m (C
orre
cted
)*
g. F
e in
/ g. F
e ou
t
1300_3_40 1.98 0.76 0.82 0.33 1.30 0.30 0.01 1.05 0.09 0.54 0.3 0.4 0.2 11.3 2.8 3.3 56.8 67.8 63.4 0.3 0.4 0.2 11.4 2.9 3.4 57.3 71.9 65.7 8.9 2.3 2.6 40.1 50.3 45.9 49.3 52.9 48.8 0.991300_6_40 2.43 1.52 1.02 0.66 1.62 0.55 0.01 1.09 0.11 0.67 1.4 0.2 0.2 26.9 3.6 3.0 41.7 65.0 67.5 1.4 0.2 0.2 26.9 3.9 3.1 41.7 69.6 69.1 20.9 3.0 2.4 29.2 48.7 48.3 51.4 51.9 50.9 1.001300_9_40 2.68 2.10 1.04 0.93 1.88 0.83 0.01 0.76 0.13 0.94 3.0 0.2 0.2 26.4 3.4 2.1 38.9 67.5 67.6 3.0 0.2 0.2 26.6 3.7 2.1 39.2 72.4 69.0 20.7 2.9 1.6 27.4 50.7 48.3 51.1 53.7 50.1 1.011300_12_40 3.73 2.98 1.58 1.35 2.55 1.02 0.01 1.47 0.13 1.10 4.9 0.4 0.4 33.9 7.4 0.4 34.5 59.8 65.0 5.1 0.4 0.4 34.9 7.9 0.4 35.5 63.9 66.1 27.1 6.1 0.3 24.8 44.7 46.2 57.0 51.2 46.9 1.001300_15_40 5.21 3.97 2.43 1.83 3.34 0.92 0.00 3.08 0.18 1.02 10.6 0.3 0.5 35.0 8.9 4.9 26.1 62.3 62.4 10.9 0.3 0.5 35.8 9.5 4.9 26.7 66.5 62.8 27.8 7.4 3.8 18.7 46.5 44.0 57.4 54.2 48.3 1.00
1400_3_40 1.58 0.93 0.62 0.44 1.02 0.39 0.05 0.60 0.10 0.45 3.6 0.2 0.3 14.4 2.7 2.8 48.6 72.0 65.1 3.6 0.2 0.3 14.6 2.8 2.8 49.3 74.0 64.1 11.4 2.2 2.2 34.5 51.8 44.8 49.5 54.2 47.2 1.001400_6_40 2.61 1.82 1.06 0.86 1.71 0.75 0.10 0.90 0.12 0.74 5.7 1.3 0.3 26.1 3.2 2.6 37.3 67.8 67.5 5.7 1.3 0.3 26.4 3.3 2.5 37.8 70.3 67.1 20.5 2.5 2.0 26.4 49.2 46.9 52.7 53.0 49.2 1.001400_9_40 3.25 2.53 1.35 1.20 2.17 1.04 0.13 1.03 0.13 0.92 9.9 0.3 0.4 29.5 4.7 3.7 33.3 66.7 62.8 10.0 0.3 0.3 29.9 4.9 3.5 33.7 70.1 59.5 23.2 3.8 2.7 23.6 49.1 41.6 56.8 53.2 44.6 1.081400_12_40 4.05 3.61 1.87 1.71 2.57 0.96 0.08 2.04 0.17 0.79 15.2 0.2 0.2 32.4 7.4 3.8 25.4 67.0 67.5 15.3 0.2 0.2 32.5 7.7 3.7 25.5 69.4 66.9 25.3 6.0 2.9 17.8 48.6 46.8 58.4 54.8 49.9 0.991400_15_40 5.46 4.74 2.62 2.31 3.46 1.16 0.04 3.12 0.20 0.94 21.9 0.3 0.3 35.2 11.8 7.0 13.9 60.5 64.8 22.3 0.3 0.3 35.9 12.5 7.0 14.2 64.2 64.8 27.9 9.7 5.5 9.9 44.9 45.3 60.1 55.0 51.1 1.01
1500_3_40 2.71 1.51 1.12 0.80 1.88 0.86 0.00 0.87 0.13 0.85 4.5 0.4 0.4 16.7 2.2 3.3 51.3 67.5 64.6 4.6 0.4 0.4 16.8 2.3 3.3 51.6 70.0 64.8 13.1 1.8 2.5 36.1 48.9 45.3 53.7 51.1 48.2 0.991500_6_40 4.15 3.30 1.95 1.67 2.69 1.20 0.00 1.89 0.24 0.83 14.0 0.4 0.4 32.0 4.3 2.7 26.9 66.7 68.6 13.9 0.4 0.4 31.9 4.5 2.7 26.8 69.7 68.2 24.7 3.5 2.1 18.7 48.7 47.7 57.4 52.6 50.2 0.991500_9_40 5.94 5.07 2.77 2.46 3.71 1.20 0.00 3.32 0.36 1.06 20.0 0.3 0.4 28.8 9.5 4.4 22.8 63.8 67.4 20.2 0.3 0.4 29.1 10.0 4.3 23.0 67.2 66.9 22.6 7.8 3.4 16.1 47.0 46.8 58.9 55.1 50.6 0.991500_12_40 7.39 6.30 3.55 3.11 4.77 1.72 0.00 4.01 0.27 1.38 37.8 0.4 0.3 28.4 17.4 8.0 6.8 53.8 64.4 39.3 0.5 0.3 29.5 18.8 8.2 7.1 58.1 65.4 22.9 14.6 6.3 5.0 40.6 45.7 67.2 55.7 52.4 0.991500_15_40 9.39 7.93 4.81 4.04 5.75 1.58 0.00 6.40 0.35 1.07 47.8 1.1 0.4 17.7 31.5 13.2 10.4 37.3 58.7 49.7 1.2 0.4 18.4 34.1 13.5 10.8 40.4 60.2 14.3 26.5 10.5 7.6 28.3 42.1 71.5 55.9 53.0 1.01
1400_3_16 1.73 0.94 0.68 0.48 1.25 0.58 0.00 0.45 0.05 0.65 0.9 0.0 0.0 20.7 0.0 0.0 51.8 0.0 0.0 1.0 0.0 0.0 21.7 0.0 0.0 54.3 0.0 0.0 16.8 0.0 0.0 38.0 0.0 0.0 55.8 0.0 0.0 1.001400_6_16 2.95 2.14 1.42 1.05 1.89 0.60 0.00 1.71 0.10 0.53 5.6 0.0 0.0 37.0 0.0 0.0 32.5 0.0 0.0 5.9 0.0 0.0 39.0 0.0 0.0 34.3 0.0 0.0 30.3 0.0 0.0 24.0 0.0 0.0 60.1 0.0 0.0 1.001400_9_16 3.93 2.93 2.00 1.46 2.44 0.66 0.00 2.66 0.12 0.49 11.7 0.0 0.0 47.1 0.0 0.0 17.6 0.0 0.0 12.3 0.0 0.0 49.7 0.0 0.0 18.6 0.0 0.0 38.6 0.0 0.0 13.0 0.0 0.0 64.0 0.0 0.0 1.001400_12_16 3.82 3.27 1.89 1.61 2.52 1.13 0.02 1.85 0.10 0.71 18.9 0.0 0.0 45.8 0.0 0.0 10.8 0.0 0.0 20.2 0.0 0.0 48.9 0.0 0.0 11.5 0.0 0.0 38.0 0.0 0.0 8.1 0.0 0.0 66.2 0.0 0.0 1.011400_15_16 6.22 4.13 3.31 2.16 3.80 0.88 0.00 4.68 0.12 0.55 29.5 0.0 0.0 38.3 0.0 0.0 8.1 0.0 0.0 31.9 0.0 0.0 41.4 0.0 0.0 8.8 0.0 0.0 32.1 0.0 0.0 6.1 0.0 0.0 70.1 0.0 0.0 1.01
Coarse ore_I 4.81 3.98 2.06 1.85 3.22 1.38 0.00 1.84 0.28 1.31 10.5 0.5 0.4 32.9 6.1 3.2 31.0 65.5 65.8 10.6 0.5 0.4 33.1 6.4 3.2 31.2 69.3 66.4 25.7 5.0 2.5 21.8 48.5 46.5 58.1 54.0 49.3 0.99Coarse coal_II 3.98 3.41 1.7 1.53 2.54 0.95 0.00 1.77 0.31 0.95 3.2 0.5 0.8 44.9 10.2 4.9 30.0 54.3 58.2 3.2 0.5 0.8 45.3 10.8 4.8 30.3 57.5 57.9 35.2 8.4 3.7 21.2 40.2 40.5 59.6 49.1 45.0 1.02Fine coal_A 5.98 4.99 2.93 2.49 3.70 1.19 0.00 3.62 0.31 0.86 14.8 0.3 0.4 33.0 8.6 3.8 26.0 62.3 66.8 14.8 0.3 0.4 33.0 9.1 3.9 26.0 66.1 68.0 25.6 7.0 3.0 18.2 46.2 47.5 58.6 53.6 50.9 1.01Fine ore_B 6.26 5.18 3.03 2.53 3.73 0.87 0.00 4.21 0.40 0.78 14.7 0.6 0.4 34.2 9.8 4.4 17.5 61.6 69.2 14.4 0.7 0.4 33.5 10.6 4.5 17.2 66.1 70.5 26.1 8.2 3.5 12.0 46.2 49.3 52.5 55.1 53.2 1.04
1400_3_40_char 2.01 1.19 0.85 0.69 1.54 1.06 0.00 0.13 0.04 0.78 0.5 0.1 0.0 15.3 1.6 0.9 57.9 71.4 74.1 0.5 0.1 0.0 15.1 1.6 0.9 57.3 75.0 74.0 11.8 1.3 0.7 40.1 52.5 51.8 52.4 53.8 52.5 0.991400_6_40_char 1.97 1.63 1.02 0.87 1.4 1.03 0.00 0.47 0.04 0.43 2.1 0.2 0.3 19.9 0.9 0.7 52.8 70.6 74.1 2.1 0.2 0.3 19.8 1.0 0.7 52.6 73.9 74.6 15.4 0.8 0.5 36.8 51.7 52.2 54.3 52.6 53.0 1.001400_9_40_char 2.56 2.28 1.3 1.2 1.79 1.21 0.00 0.73 0.07 0.55 5.3 0.1 0.1 25.6 1.5 0.8 41.6 73.5 73.9 5.2 0.1 0.1 25.6 1.5 0.8 41.6 76.5 74.0 19.9 1.2 0.7 29.1 53.5 51.8 54.2 54.8 52.5 1.001400_12_40_char 3.19 2.88 1.74 1.6 2.35 2.20 0.02 0.24 0.04 0.69 8.4 0.2 0.2 43.8 4.7 1.4 24.0 66.5 70.3 8.4 0.2 0.2 44.2 5.0 1.4 24.2 70.0 70.6 34.3 3.9 1.1 16.9 49.0 49.4 59.7 53.1 50.7 1.001400_15_40_char 4.32 3.98 2.5 2.31 2.9 2.03 0.00 1.79 0.05 0.46 10.8 0.2 0.0 48.8 9.4 3.0 18.6 62.3 71.2 10.9 0.2 0.0 49.1 9.8 3.0 18.7 65.0 71.5 38.1 7.6 2.3 13.1 45.5 50.0 62.0 53.3 52.3 1.00

206
*Corrected for Fibreboard carry over
g. Al2O3 pick-up g. SiO2 pick-up %Al2O3 - Out %SiO2 - Out Corrected masses out Correced Fibreboard masses
Sam
ple
Num
ber
g. A
l2O
3 In
g. A
l2O
3 ou
t
g. S
iO2
In
g. S
iO2
out
Tota
l g. A
l2O
3 pi
ck-u
p
Tota
l g. S
iO2
pick
-up
g. A
l2O
3 pi
ck-u
p - t
op
g. A
l2O
3 pi
ck-u
p - m
iddl
e
g. A
l2O
3 pi
ck-u
p - b
otto
m
g. S
iO2
pick
-up
- top
g. S
iO2
pick
-up
- mid
dle
g. S
iO2
pick
-up
- bot
tom
%A
l2O
3 A
naly
sed
-Top
%A
l2O
3 A
naly
sed
-Mid
dle
%A
l2O
3 A
naly
sed
-Bot
tom
%S
iO2
Ana
lyse
d -T
op
%S
iO2
Ana
lyse
d -M
iddl
e
%S
iO2
Ana
lyse
d -B
otto
m
g. s
ampl
e m
ix o
ut -
Top
( Cor
rect
ed)*
g. s
ampl
e m
ix o
ut -
Mid
dle
( Cor
rect
ed)*
g. s
ampl
e m
ix o
ut -
Botto
m (
Cor
rect
ed)*
g. F
ibre
boar
d ou
t - T
op (
Cor
rect
ed)*
g. F
ibre
boar
d ou
t - M
iddl
e ( C
orre
cted
)*
g. F
ibre
boar
d ou
t - B
otto
m (
Cor
rect
ed)*
1300_3_40 0.97 2.05 1.84 2.40 1.07 0.57 0.17 0.56 0.35 -0.04 0.36 0.03 4.56 5.42 5.07 5.94 5.94 5.85 13.37 15.30 10.54 5.43 4.80 8.731300_6_40 0.97 1.98 1.83 2.35 1.01 0.51 0.08 0.65 0.27 -0.08 0.40 -0.02 4.12 6.12 4.44 5.95 6.31 5.39 12.84 14.82 10.54 5.48 4.93 8.921300_9_40 0.97 2.08 1.84 2.38 1.10 0.55 0.15 0.69 0.26 -0.05 0.43 -0.05 4.72 6.16 4.65 6.29 6.30 5.50 12.58 15.30 9.84 5.22 5.05 8.931300_12_40 0.94 1.97 1.78 2.42 1.03 0.64 0.27 0.54 0.21 0.17 0.34 -0.08 4.59 6.14 5.04 6.42 6.67 6.22 14.94 13.02 7.99 11.42 7.15 13.181300_15_40 0.94 1.87 1.77 2.36 0.93 0.59 0.22 0.55 0.16 0.11 0.37 -0.11 4.63 5.87 4.70 6.56 6.55 6.31 13.81 13.68 7.55 10.07 7.25 13.02
1400_3_40 0.95 1.41 1.79 2.06 0.47 0.28 0.16 0.23 0.07 0.07 0.18 -0.19 3.78 3.64 3.62 5.65 5.12 5.42 15.59 14.61 7.50 11.47 6.73 13.021400_6_40 0.95 1.52 1.79 2.09 0.57 0.30 0.15 0.32 0.10 0.03 0.20 -0.15 4.06 4.29 3.58 5.91 5.36 5.31 14.25 14.25 8.39 10.26 7.01 14.461400_9_40 0.95 1.52 1.80 2.06 0.57 0.26 0.12 0.44 0.01 0.04 0.30 -0.30 4.08 5.00 3.95 6.30 5.94 5.63 13.59 14.30 5.54 10.97 7.55 12.341400_12_40 0.93 1.41 1.76 1.98 0.48 0.22 0.08 0.31 0.09 -0.03 0.20 -0.16 3.94 4.25 3.74 6.09 5.40 5.44 12.80 13.92 7.78 11.71 7.06 13.471400_15_40 0.93 1.77 1.76 2.23 0.83 0.47 0.19 0.51 0.13 0.04 0.35 -0.13 5.19 5.57 4.12 7.14 6.30 5.67 11.70 13.84 7.96 10.21 6.99 13.19
1500_3_40 0.96 1.53 1.81 2.09 0.57 0.28 0.10 0.32 0.14 0.00 0.19 -0.12 3.49 4.39 4.11 5.30 5.43 5.70 15.52 13.96 8.39 10.21 7.05 13.421500_6_40 0.96 1.45 1.80 2.05 0.49 0.24 0.02 0.38 0.09 -0.08 0.25 -0.15 3.53 4.73 3.22 5.81 5.70 4.97 13.05 14.15 9.07 10.64 7.03 12.801500_9_40 0.96 1.62 1.81 2.19 0.65 0.38 0.10 0.46 0.09 0.03 0.29 -0.15 4.12 5.23 3.55 6.54 5.97 5.36 13.01 14.17 8.34 10.90 7.51 13.131500_12_40 0.93 2.04 1.75 2.47 1.11 0.71 0.30 0.63 0.19 0.13 0.44 -0.07 6.32 6.46 4.86 8.20 7.05 6.41 11.04 13.38 7.78 10.13 6.88 12.751500_15_40 0.93 2.07 1.75 2.45 1.14 0.70 0.30 0.61 0.23 0.11 0.40 -0.03 6.67 6.93 5.11 8.45 7.42 6.60 10.46 12.23 8.17 10.80 6.94 12.48
1400_3_16 0.36 0.39 0.68 0.72 0.03 0.03 0.23 0.00 0.00 0.40 0.00 0.00 2.87 0.00 0.00 5.22 0.00 0.00 13.09 0.00 0.00 37.42 0.00 0.001400_6_16 0.36 0.42 0.69 0.72 0.06 0.03 0.26 0.00 0.00 0.40 0.00 0.00 3.30 0.00 0.00 5.58 0.00 0.00 12.16 0.00 0.00 41.28 0.00 0.001400_9_16 0.36 0.41 0.68 0.71 0.05 0.02 0.25 0.00 0.00 0.39 0.00 0.00 3.41 0.00 0.00 5.81 0.00 0.00 11.52 0.00 0.00 38.04 0.00 0.001400_12_16 0.36 0.49 0.68 0.73 0.13 0.05 0.32 0.00 0.00 0.42 0.00 0.00 4.21 0.00 0.00 6.26 0.00 0.00 10.93 0.00 0.00 40.04 0.00 0.001400_15_16 0.36 0.52 0.68 0.79 0.16 0.10 0.36 0.00 0.00 0.47 0.00 0.00 4.68 0.00 0.00 7.04 0.00 0.00 10.36 0.00 0.00 40.77 0.00 0.00
Coarse ore_I 0.97 2.05 1.84 2.06 1.07 0.22 0.17 0.64 0.27 -0.07 0.28 -0.21 4.15 5.76 7.33 5.25 5.30 6.22 14.68 15.76 6.38 5.43 4.86 9.73Coarse coal_II 0.96 1.80 1.78 2.06 0.84 0.28 0.13 0.51 0.19 0.02 0.26 -0.22 3.46 5.93 6.95 5.04 6.07 6.50 16.48 13.22 5.68 6.71 4.57 8.51Fine coal_A 0.98 1.92 1.82 2.15 0.94 0.33 0.11 0.58 0.26 -0.11 0.32 -0.09 4.73 5.77 4.93 6.15 5.89 5.40 11.79 14.77 9.22 5.65 4.78 9.24Fine ore_B 0.95 2.00 1.78 2.04 1.06 0.25 0.06 0.73 0.27 -0.24 0.37 -0.09 5.12 6.45 4.64 6.03 5.97 4.87 9.78 14.99 10.00 5.04 5.01 9.50
1400_3_40_char 1.03 1.92 2.16 2.18 0.89 0.02 0.09 0.59 0.21 -0.25 0.24 -0.22 3.77 5.39 4.25 4.98 5.52 4.84 15.09 16.38 10.09 5.28 4.96 9.081400_6_40_char 1.03 1.84 2.15 2.35 0.81 0.19 0.09 0.48 0.24 -0.14 0.24 -0.17 3.61 5.08 4.60 5.49 5.91 5.47 15.56 15.41 9.84 5.36 4.63 9.191400_9_40_char 1.03 1.87 2.15 2.20 0.84 0.05 0.14 0.49 0.22 -0.14 0.14 -0.20 3.99 5.16 4.43 5.52 5.28 5.15 15.34 15.40 9.80 10.12 6.44 14.351400_12_40_char 1.01 1.93 2.12 2.40 0.92 0.28 0.17 0.52 0.23 -0.04 0.25 -0.19 3.97 5.57 5.28 5.89 6.20 6.09 15.84 14.60 8.34 6.18 4.67 9.321400_15_40_char 1.02 1.83 2.14 2.33 0.81 0.19 0.15 0.44 0.21 -0.07 0.18 -0.18 4.14 5.27 4.58 6.04 6.02 5.64 15.04 14.12 9.34 5.83 4.50 9.02

207
*Corrected for Fibreboard carry over
%Reduction %Carbon out Mass Carbon In %Carbon consumption
Sam
ple
Num
ber
%R
educ
tion
- Top
%R
educ
tion
- Mid
dle
%R
educ
tion
- Bot
tom
%C
ana
lyse
d - T
op
%C
ana
lyse
d - M
iddl
e
%C
ana
lyse
d - B
otto
m
%C
out
ana
lyse
d - t
op (C
orre
cted
)*
%C
out
ana
lyse
d - m
iddl
e (C
orre
cted
)*
%C
out
ana
lyse
d - b
otto
m (C
orre
cted
)*
Com
posi
te %
Car
bon
%Fi
xed
Car
bon
in s
tart
mix
ture
%To
tal C
arbo
n in
sta
rt m
ixtu
re
g. T
otal
Car
bon
in
g. T
otal
C in
- to
p
g. T
otal
C in
- m
iddl
e
g. T
otal
C in
- bo
ttom
g. T
otal
FC
in -
top
g. T
otal
FC
in -
mid
dle
g. T
otal
FC
in -
botto
m
%C
con
sum
ptio
n - t
op
%C
con
sum
ptio
n - m
iddl
e
%C
con
sum
ptio
n - b
otto
m
Com
posi
te %
C c
onsu
mpt
ion
1300_3_40 6.7 2.2 2.3 18.7 15.3 16.6 18.9 16.2 17.2 17.6 15.4 18.7 7.60 3.50 2.51 1.60 2.87 2.06 1.31 27.8 1.1 -13.5 10.31300_6_40 16.2 2.4 1.9 17.7 15.1 15.1 17.7 16.2 15.5 16.7 15.4 18.7 7.53 3.47 2.49 1.58 2.84 2.04 1.30 34.4 3.7 -3.0 16.41300_9_40 19.4 2.1 1.5 19.2 12.6 16.0 19.4 13.5 16.3 16.8 15.4 18.7 7.50 3.45 2.48 1.58 2.83 2.03 1.29 29.5 16.5 -2.1 18.61300_12_40 24.8 4.8 1.1 14.1 15.8 15.3 14.5 16.9 15.6 15.5 15.4 18.7 7.26 3.34 2.39 1.52 2.74 1.96 1.25 35.0 8.3 18.5 22.71300_15_40 35.1 5.1 3.7 13.3 17.4 15.3 13.6 18.6 15.4 15.6 15.4 18.7 7.28 3.35 2.40 1.53 2.74 1.97 1.25 43.8 -5.7 23.9 23.3
1400_3_40 15.0 1.7 2.1 18.7 12.3 16.8 19.0 12.6 16.5 16.4 15.4 18.7 7.35 3.38 2.42 1.54 2.77 1.99 1.26 12.4 23.8 19.7 17.71400_6_40 23.9 4.1 1.9 18.2 13.3 17.1 18.4 13.8 17.0 16.6 15.4 18.7 7.36 3.38 2.43 1.54 2.77 1.99 1.27 22.4 19.0 7.6 18.21400_9_40 31.2 3.0 2.8 15.9 14.4 18.9 16.1 15.1 17.9 16.2 15.4 18.7 6.82 3.14 2.25 1.43 2.57 1.84 1.17 30.3 3.7 30.8 21.61400_12_40 40.6 4.1 2.4 16.7 14.1 15.0 16.8 14.6 14.9 15.7 15.4 18.7 7.28 3.35 2.40 1.53 2.74 1.97 1.25 35.9 15.3 24.2 26.61400_15_40 52.6 6.5 4.1 15.5 13.1 15.3 15.8 13.9 15.3 15.1 15.4 18.7 7.17 3.30 2.37 1.51 2.70 1.94 1.23 44.0 18.7 19.1 30.4
1500_3_40 16.6 1.9 2.5 16.0 14.0 17.5 16.1 14.5 17.6 15.9 15.4 18.7 7.48 3.44 2.47 1.57 2.82 2.02 1.29 27.4 17.9 6.2 19.81500_6_40 38.6 3.0 2.2 16.0 13.9 15.1 15.9 14.5 15.0 15.3 15.4 18.7 7.47 3.44 2.47 1.57 2.82 2.02 1.29 39.5 16.6 13.2 26.41500_9_40 47.1 5.2 3.0 16.3 12.3 14.9 16.5 13.0 14.8 15.0 15.4 18.7 7.54 3.47 2.49 1.58 2.84 2.04 1.30 38.3 26.2 22.1 30.91500_12_40 69.9 9.6 4.6 10.4 13.7 14.1 10.8 14.8 14.3 12.9 15.4 18.7 7.26 3.34 2.40 1.52 2.74 1.96 1.25 64.3 17.4 26.9 41.01500_15_40 76.1 17.9 7.3 6.1 14.7 14.6 6.3 15.9 15.0 11.3 15.4 18.7 7.15 3.29 2.36 1.50 2.69 1.93 1.23 80.0 17.5 18.5 46.4
1400_3_16 11.8 0.0 0.0 15.5 0.0 0.0 16.2 0.0 0.0 7.5 15.4 18.8 2.80 2.80 0.00 0.00 1.06 0.76 0.48 24.1 0.0 0.0 24.11400_6_16 26.5 0.0 0.0 14.6 0.0 0.0 15.4 0.0 0.0 7.1 15.4 18.7 2.80 2.80 0.00 0.00 1.06 0.76 0.48 33.2 0.0 0.0 33.21400_9_16 39.4 0.0 0.0 13.4 0.0 0.0 14.1 0.0 0.0 6.5 15.4 18.7 2.82 2.82 0.00 0.00 1.06 0.76 0.49 42.3 0.0 0.0 42.31400_12_16 49.6 0.0 0.0 11.9 0.0 0.0 12.7 0.0 0.0 5.8 15.4 18.7 2.77 2.77 0.00 0.00 1.05 0.75 0.48 49.9 0.0 0.0 49.91400_15_16 60.7 0.0 0.0 11.1 0.0 0.0 12.0 0.0 0.0 5.5 15.4 18.8 2.79 2.79 0.00 0.00 1.05 0.75 0.48 55.4 0.0 0.0 55.4
Coarse ore_I 32.9 4.0 2.4 15.1 14.9 13.2 15.2 15.8 13.3 15.0 15.4 18.7 7.62 3.50 2.51 1.60 2.87 2.06 1.31 36.3 1.1 46.9 26.9Coarse coal_II 25.1 6.8 4.5 11.8 18.7 18.2 11.9 19.8 18.1 15.8 15.3 18.8 7.25 3.33 2.39 1.52 2.72 1.95 1.24 41.1 -9.5 32.4 22.6Fine coal_A 39.8 5.0 2.7 13.8 14.8 15.3 13.8 15.7 15.6 14.8 15.3 18.8 7.49 3.44 2.47 1.57 2.81 2.02 1.28 52.8 6.1 8.7 28.1Fine ore_B 44.0 6.2 3.0 20.6 13.0 13.4 20.2 14.0 13.6 16.8 15.4 18.7 7.06 3.25 2.33 1.48 2.66 1.91 1.22 39.2 10.3 8.0 23.1
1400_3_40_char 8.5 1.0 0.5 15.8 14.2 14.1 15.6 14.9 14.1 15.1 15.7 16.0 6.80 3.13 2.24 1.43 3.07 2.20 1.40 24.6 -8.9 0.5 8.41400_6_40_char 13.2 0.8 0.9 13.2 15.4 15.6 13.2 16.1 15.7 14.7 15.7 16.0 6.72 3.09 2.22 1.41 3.03 2.18 1.39 33.7 -12.1 -9.7 9.51400_9_40_char 21.9 1.0 0.6 16.6 12.8 13.5 16.6 13.3 13.5 14.9 15.7 16.0 6.75 3.11 2.23 1.42 3.05 2.19 1.39 18.1 8.0 6.6 12.31400_12_40_char 33.3 2.9 1.1 12.5 15.7 15.1 12.6 16.5 15.2 14.4 15.7 16.0 6.60 3.04 2.18 1.39 2.98 2.14 1.36 34.3 -10.7 8.8 14.11400_15_40_char 38.0 5.1 1.5 11.1 15.9 14.8 11.2 16.6 14.9 13.7 15.8 16.0 6.74 3.10 2.23 1.42 3.05 2.19 1.39 45.9 -5.3 2.0 19.8

208
Mass Carbon remaining Mass loss Mass oxygen Energy Input
Sam
ple
Num
ber
Tota
lg.
Car
bon
rem
aini
ngin
sam
ple
[cal
cula
ted
from
pro
duct
gas
ana
lyse
s]
Tota
lg.
Car
bon
rem
aini
ngin
sam
ple
[cal
cula
ted
from
sam
ple
anal
ysis
]
g.C
Diff
eren
ce:
(Tot
alg.
Car
bon
rem
aini
ngin
sam
ple
[cal
cula
ted
from
prod
uct
gas
anal
yses
])-
(Tot
alg.
Car
bon
rem
aini
ngin
sam
ple
[cal
cula
ted
from
sam
ple
anal
ysis
])
g.D
iffer
ence
as%
ofan
alys
edC
rem
aini
ngin
reac
ted
sam
ple
Mas
slo
ssac
cord
ing
toga
san
alys
es(T
otal
time)
Mas
sLo
ssac
cord
ing
tom
ixtu
rein
sam
ple
split
&FB
carr
yov
er;
[M
ixtu
rem
ass
isba
ckca
lula
ted
from
Fe
mas
s ba
lanc
e]
g.M
ass
loss
diffe
renc
e:(M
ass
loss
acco
rdin
gto
gas
anal
yses
(Tot
altim
e))
-(M
ass
Loss
acco
rdin
gto
mix
ture
insa
mpl
esp
lit&
FBca
rry
over
;[M
ixtu
rem
ass
isba
ckca
lula
ted
from
Fe
mas
s ba
lanc
e])
g. D
iffer
ence
as
% o
f wei
ghed
mas
s lo
ss
g. O
in
g. O
rem
aini
ng in
sam
ple
g. O
to g
as fr
om F
orm
s of
Fe
anal
yses
g.O
Diff
eren
ce:(
g.O
inC
O&
CO
2&
H2O
inPr
oduc
tga
s[T
otal
Tim
e])
-(g
.O
toga
sfro
mFo
rms
ofFe
anal
yses
ofre
acte
dsa
mpl
em
ater
ial)
g.D
iffer
ence
as%
ofg.
Oto
gas
from
form
sof
Fe
anal
ysis
Ave
rage
kW/m
^2in
tosa
mpl
e-
Rad
iatio
nN
etw
ork
Tota
l rad
iatio
n he
at in
put t
o sa
mpl
e (M
J/m
^2)
1300_3_40 7.07 6.82 0.25 4 1.98 1.6 0.4 26 9.42 8.21 1.21 0.09 7 -120 211300_6_40 6.92 6.30 0.62 10 2.43 2.2 0.2 10 9.34 7.87 1.47 0.15 10 -127 461300_9_40 6.95 6.11 0.84 14 2.68 2.5 0.1 6 9.30 7.77 1.53 0.35 23 -125 671300_12_40 6.35 5.61 0.74 13 3.73 3.0 0.7 25 8.99 7.08 1.92 0.63 33 -109 791300_15_40 5.71 5.58 0.12 2 5.21 4.0 1.2 30 9.02 6.74 2.28 1.06 47 -108 97
1400_3_40 6.98 6.05 0.93 15 1.58 1.7 -0.1 -8 9.11 7.65 1.45 -0.43 -30 -181 331400_6_40 6.77 6.02 0.75 12 2.61 2.6 0.0 1 9.12 7.31 1.81 -0.10 -5 -180 651400_9_40 6.09 5.34 0.75 14 3.25 3.2 0.1 3 8.45 6.48 1.97 0.20 10 -178 961400_12_40 6.14 5.34 0.80 15 4.05 4.5 -0.5 -11 9.02 6.68 2.34 0.23 10 -175 1261400_15_40 5.52 4.99 0.52 10 5.46 5.0 0.5 10 8.89 6.17 2.72 0.74 27 -169 152
1500_3_40 6.87 6.00 0.87 15 2.71 2.2 0.5 20 9.27 7.69 1.58 0.30 19 -259 471500_6_40 6.33 5.49 0.84 15 4.15 3.8 0.4 9 9.26 6.99 2.26 0.43 19 -250 891500_9_40 5.79 5.21 0.58 11 5.94 4.9 1.0 20 9.35 6.68 2.67 1.04 39 -254 1371500_12_40 5.07 4.29 0.78 18 7.39 6.7 0.6 10 9.00 5.53 3.47 1.30 37 -211 1511500_15_40 3.97 3.83 0.14 4 9.39 7.5 1.9 26 8.86 4.90 3.95 1.80 45 -208 186
1400_3_16 2.45 2.13 0.33 15 1.73 1.3 0.4 35 3.47 2.77 0.70 0.55 78 -165 291400_6_16 1.91 1.87 0.03 2 2.95 2.2 0.7 33 3.47 2.31 1.17 0.72 62 -158 561400_9_16 1.50 1.63 -0.13 -8 3.93 3.0 1.0 32 3.50 1.92 1.58 0.86 54 -157 851400_12_16 1.67 1.39 0.28 20 3.82 3.3 0.5 16 3.44 1.57 1.87 0.65 35 -157 1131400_15_16 0.54 1.24 -0.70 -57 6.22 3.9 2.3 58 3.45 1.23 2.22 1.58 71 -153 138
Coarse ore_I 6.45 5.57 0.88 16 4.81 4.0 0.8 19 9.57 7.29 2.29 0.93 41 -152 82Coarse coal_II 6.23 5.61 0.62 11 3.98 3.4 0.5 16 8.93 6.81 2.11 0.43 20 -146 79Fine coal_A 5.61 5.38 0.23 4 5.98 4.3 1.6 38 9.23 6.98 2.25 1.45 65 -153 82Fine ore_B 5.02 5.43 -0.41 -8 6.26 3.1 3.1 100 8.88 6.79 2.09 1.64 78 -153 82
1400_3_40_char 6.45 6.22 0.23 4 2.01 1.2 0.8 65 10.00 9.12 0.87 0.67 77 -175 331400_6_40_char 6.23 6.08 0.16 3 1.97 1.5 0.5 33 9.88 8.83 1.06 0.34 33 -168 601400_9_40_char 6.11 5.92 0.19 3 2.56 2.0 0.5 27 9.94 8.58 1.36 0.43 31 -163 881400_12_40_char 5.90 5.68 0.23 4 3.19 2.8 0.3 12 9.73 7.74 1.99 0.36 18 -155 1121400_15_40_char 5.42 5.41 0.01 0 4.32 3.8 0.5 14 9.88 7.63 2.25 0.65 29 -151 136

209
Sample masses and analyses for coal-alumina experiments
Mass% In Sample Mix Out Fibreboard Thermocouples Totals Out Mass In
Sam
ple
Num
ber
Furn
ace
Tem
pera
ture
(°C
)
Coa
l/Cha
r
Coa
l/Cha
r Siz
e*
Ore
Siz
e*
Rea
ctio
n Ti
me
[min
.]
Sam
ple
Laye
r Thi
ckne
ss [m
m]
mas
s% A
lum
ina
in
mas
s% C
oal i
n
g. s
ampl
e m
ix -
top
g. s
ampl
e m
ix -
mid
dle
g. s
ampl
e m
ix -
botto
m
g. F
ibre
boar
d - t
op
g. F
ibre
boar
d -m
iddl
e
g. F
ibre
boar
d -b
otto
m
g. th
erm
ocou
ple
- top
g. th
erm
ocou
ple
- mid
dle
g. th
erm
ocou
ple
-bot
tom
Tota
l g. s
ampl
e m
ix o
ut
Tota
l g. F
ibre
boea
rd o
ut
Tota
l g. T
herm
ocou
ples
out
g. F
ibre
boar
d in
g. M
ix in
1300_Devol 1300 Coal 2 2 2337 40.0 75.3 24.7 9.716 15.024 9.417 5.102 3.954 8.716 0 0 0 34.157 17.772 0 19.738 35.1721400_Devol 1400 Coal 2 2 1800 40.0 75.3 24.7 10.528 14.895 8.511 10.559 6.083 12.530 0 0 0 33.934 29.172 0 31.127 34.8591500_Devol 1500 Coal 2 2 2060 40.0 75.3 24.7 11.509 14.390 8.666 11.215 6.172 12.742 0 0 0 34.565 30.129 0 32.707 35.166
Product Gas Product gas analysed H2O - out H In vs. H in Product Gas O In vs. O in Product Gas
Sam
ple
Num
ber
Mas
slo
ssac
cord
ing
toP
rodu
ctga
san
alys
is[T
otal
Tim
e]
Mas
slo
ssac
cord
ing
toP
rodu
ctga
san
alys
is[E
xper
imen
tal T
ime
only
]
g.O
inC
O&
CO
2in
Pro
duct
gas
[Tot
alTi
me]
g.O
inC
O&
CO
2in
Pro
duct
gas
[Exp
erim
enta
l tim
e on
ly]
g.O
inC
O&
CO
2&
H2O
inP
rodu
ctga
s[T
otal
Tim
e]
Tota
l g. C
O2
in P
rodu
ct G
as
Tota
l g. C
H4
in P
rodu
ct G
as
Tota
l g. C
O in
Pro
duct
Gas
Tota
l g. H
2 in
Pro
duct
Gas
Tota
l g. H
2O in
Pro
duct
Gas
g. H
2O in
- P
roxi
mat
e an
alys
is
g.H
2Oin
-(P
roxi
mat
ean
alys
is)+
(All
%O
from
Ulti
mat
e A
naly
sis
as H
2O)
%H
2O -
Pro
xim
ate
Ana
lysi
s
%H
2Oin
-(P
roxi
mat
ean
alys
is)
+(A
ll%
Ofro
m U
ltim
ate
Ana
lysi
s as
H2O
)
%H
2O i
n - P
rodu
ct G
as A
naly
sis
Tota
l g. H
in
Tota
l g. H
out
- (F
rom
Pro
duct
Gas
Ana
lysi
s)
g. H
in/g
. H o
ut
g. O
in
Tota
l g. O
out
- (F
rom
Pro
duct
Gas
Ana
lysi
s)
g. O
in/g
. O o
ut
1300_Devol 1.28 1.28 0.14 0.14 0.79 0.19 0.02 0.00 0.33 0.73 0.29 0.90 3.3 10.1 8.2 0.35 0.8 0.5 0.8 0.79 1.01400_Devol 2.91 2.6 1.08 0.95 1.68 0.29 0.08 1.52 0.34 0.68 0.30 0.91 3.3 10.1 7.5 0.35 0.8 0.5 0.8 1.68 0.51500_Devol 5.79 5.79 2.29 2.29 3.35 0.55 0.00 3.32 0.73 1.19 0.30 0.92 3.3 10.1 13.1 0.36 1.6 0.2 0.8 3.35 0.2

210
Total C Balance %Fixed carbon back-calculated %Volatile Matter Content - back-calculated Mass loss S
ampl
e N
umbe
r
g. T
otal
Car
bon
in
Tota
lg.
Car
bon
toga
s[c
alcu
late
dfro
mpr
oduc
t gas
ana
lyse
s]
Tota
lg.
Car
bon
rem
aini
ngin
sam
ple
[cal
cula
ted
from
pro
duct
gas
ana
lyse
s]
Tota
lg.
Car
bon
rem
aini
ngin
sam
ple
[cal
cula
ted
from
sam
ple
anal
ysis
]
g. C
dep
osite
d if
all H
2 of
f as
CH
4
g.C
Diff
eren
ce:
(Tot
alg.
Car
bon
rem
aini
ngin
sam
ple
[cal
cula
ted
from
prod
uct
gas
anal
yses
])-
(Tot
alg.
Car
bon
rem
aini
ngin
sam
ple
[cal
cula
ted
from
sam
ple
anal
ysis
])
g.D
iffer
ence
as%
ofan
alys
edC
rem
aini
ngin
reac
ted
sam
ple
g.To
tal
Cou
tac
cord
ing
toP
rodu
ctG
asan
alys
is &
%C
ana
lyse
d in
reac
ted
sam
ple
g. C
in/g
. C o
ut
%To
tal C
arbo
n in
Coa
l
%To
talC
inC
oalc
alcu
late
dfro
mP
rodu
ctG
asAn
alys
is&
%C
anal
ysed
inre
acte
dsa
mpl
e
%Fi
xed
Car
bon
in c
oal -
Pro
xim
ate
anal
ysis
%Fi
xed
Car
bon
inco
alfro
mC
arbo
nre
mai
ning
inre
acte
dsa
mpl
e[c
alcu
late
dfro
mpr
oduc
t gas
ana
lyse
s]
%Fi
xed
Car
bon
inco
alfro
mC
arbo
nre
mai
ning
inre
acte
dsa
mpl
e[c
alcu
late
dfro
msa
mpl
e an
alys
is]
%V
olat
ileM
atte
rC
onte
nt-
Prox
imat
eA
naly
sis
g.V
olat
ileM
atte
rC
onte
nt-
Prox
imat
eA
naly
sis
%V
olat
ileM
atte
rC
onte
nt-
Cal
cula
ted
from
Pro
duct
Gas
Ana
lysi
s
g.Vo
latil
eM
atte
rC
onte
nt-
Cal
cula
ted
from
Pro
duct
Gas
Ana
lysi
s
%V
olat
ileM
atte
rC
onte
nt-
Cal
cula
ted
from
Sam
ple
mas
s lo
ss w
iegh
ed
g.Vo
latil
eM
atte
rC
onte
nt-
Cal
cula
ted
from
Sam
ple
mas
s lo
ss w
iegh
ed
Mas
slo
ssac
cord
ing
toga
san
alys
es(T
otal
time)
Mas
sLo
ssac
cord
ing
tom
ixtu
rein
sam
ple
split
&FB
carry
over
;[
Mix
ture
mas
sis
back
calu
late
d fro
m F
e m
ass
bala
nce]
g.M
ass
loss
diffe
renc
e:(M
ass
loss
acco
rdin
gto
gas
anal
yses
(Tot
altim
e))
-(M
ass
Loss
acco
rdin
gto
mix
ture
insa
mpl
esp
lit&
FBca
rryov
er;
[Mix
ture
mas
sis
back
calu
late
d fro
m F
e m
ass
bala
nce]
)
g. D
iffer
ence
as
% o
f wei
ghed
mas
s lo
ss
1300_Devol 6.75 0.07 6.69 5.34 0.98 1.4 25 5.40 1.2 75.9 61 62.2 75 60 22.5 2.00 14 1.28 24 2.10 1.28 2.10 -0.8 -391400_Devol 6.85 0.79 6.06 5.01 1.01 1.0 21 5.80 1.2 75.9 64 62.2 67 56 22.5 2.03 32 2.91 31 2.75 2.91 2.75 0.2 61500_Devol 6.92 1.57 5.34 5.07 2.17 0.3 5 6.64 1.0 75.9 73 62.2 59 56 22.5 2.05 64 5.79 28 2.54 5.79 2.54 3.3 128
*Corrected for Fibreboard carry over
g. Al2O3 pick-up g. SiO2 pick-up %Al2O3 - Out %SiO2 - Out Corrected masses out Correced Fibreboard masses
Sam
ple
Num
ber
g. A
l2O
3 In
g. A
l2O
3 ou
t
g. S
iO2
In
g. S
iO2
out
Tota
l g. A
l2O
3 pi
ck-u
p
Tota
l g. S
iO2
pick
-up
g. A
l2O
3 pi
ck-u
p - t
op
g. A
l2O
3 pi
ck-u
p - m
iddl
e
g. A
l2O
3 pi
ck-u
p - b
otto
m
g. S
iO2
pick
-up
- top
g. S
iO2
pick
-up
- mid
dle
g. S
iO2
pick
-up
- bot
tom
%A
l2O
3 An
alys
ed -T
op
%A
l2O
3 An
alys
ed -M
iddl
e
%A
l2O
3 An
alys
ed -B
otto
m
%S
iO2
Ana
lyse
d -T
op
%S
iO2
Ana
lyse
d -M
iddl
e
%S
iO2
Ana
lyse
d -B
otto
m
g. s
ampl
e m
ix o
ut -
Top
( Cor
rect
ed)*
g. s
ampl
e m
ix o
ut -
Mid
dle
( Cor
rect
ed)*
g. s
ampl
e m
ix o
ut -
Botto
m (
Cor
rect
ed)*
g. F
ibre
boar
d ou
t - T
op (
Cor
rect
ed)*
g. F
ibre
boar
d ou
t - M
iddl
e ( C
orre
cted
)*
g. F
ibre
boar
d ou
t - B
otto
m (
Cor
rect
ed)*
g. A
l2O
3 in
/ g.A
l2O
3e o
ut
1300_Devol 26.53 27.29 0.62 1.09 0.13 0.07 0.00 0.13 0.00 0.00 0.07 0.00 76.70 80.00 83.00 2.78 3.78 2.63 9.72 14.83 9.42 5.10 4.15 8.72 0.981400_Devol 26.30 27.53 0.62 1.00 0.09 0.05 0.00 0.09 0.00 0.00 0.05 0.00 79.00 82.60 81.20 2.57 3.42 2.63 10.53 14.76 8.51 10.56 6.22 12.53 0.961500_Devol 26.53 27.81 0.62 1.22 0.12 0.06 0.09 0.02 0.00 0.05 0.01 0.00 79.30 82.10 79.30 2.93 3.98 3.58 11.36 14.36 8.67 11.36 6.20 12.74 0.96

211
*Corrected for Fibreboard carry over
%Carbon out Mass Carbon In %Carbon consumptionS
ampl
e N
umbe
r
g. C
oal i
n
g.C
oal
Inba
ck-c
alcu
late
dfro
mA
lum
ina
mas
s ba
lanc
e
%C
ana
lyse
d - T
op
%C
ana
lyse
d - M
iddl
e
%C
ana
lyse
d - B
otto
m
%C
out
ana
lyse
d - t
op (C
orre
cted
)*
%C
out
ana
lyse
d - m
iddl
e (C
orre
cted
)*
%C
out
ana
lyse
d - b
otto
m (C
orre
cted
)*
Com
posi
te %
Car
bon
g. T
otal
C in
- to
p
g. T
otal
C in
- m
iddl
e
g. T
otal
C in
- bo
ttom
g. T
otal
FC
in -
top
g. T
otal
FC
in -
mid
dle
g. T
otal
FC
in -
botto
m
%C
con
sum
ptio
n - t
op
%C
con
sum
ptio
n - m
iddl
e
%C
con
sum
ptio
n - b
otto
m
Com
posi
te %
C c
onsu
mpt
ion
1300_Devol 8.7 8.9 18.9 14.9 13.4 18.9 15.1 13.4 16.5 3.11 2.23 1.42 2.55 1.83 1.16 40.9 -0.4 11.0 21.01400_Devol 8.6 9.0 17.0 13.0 15.1 17.0 13.1 15.1 15.3 3.15 2.26 1.44 2.58 1.85 1.18 43.2 14.3 10.6 26.81500_Devol 8.7 9.1 16.2 12.7 15.9 16.41 12.7 15.9 15.1 3.18 2.28 1.45 2.61 1.87 1.19 41.4 19.9 5.1 26.7
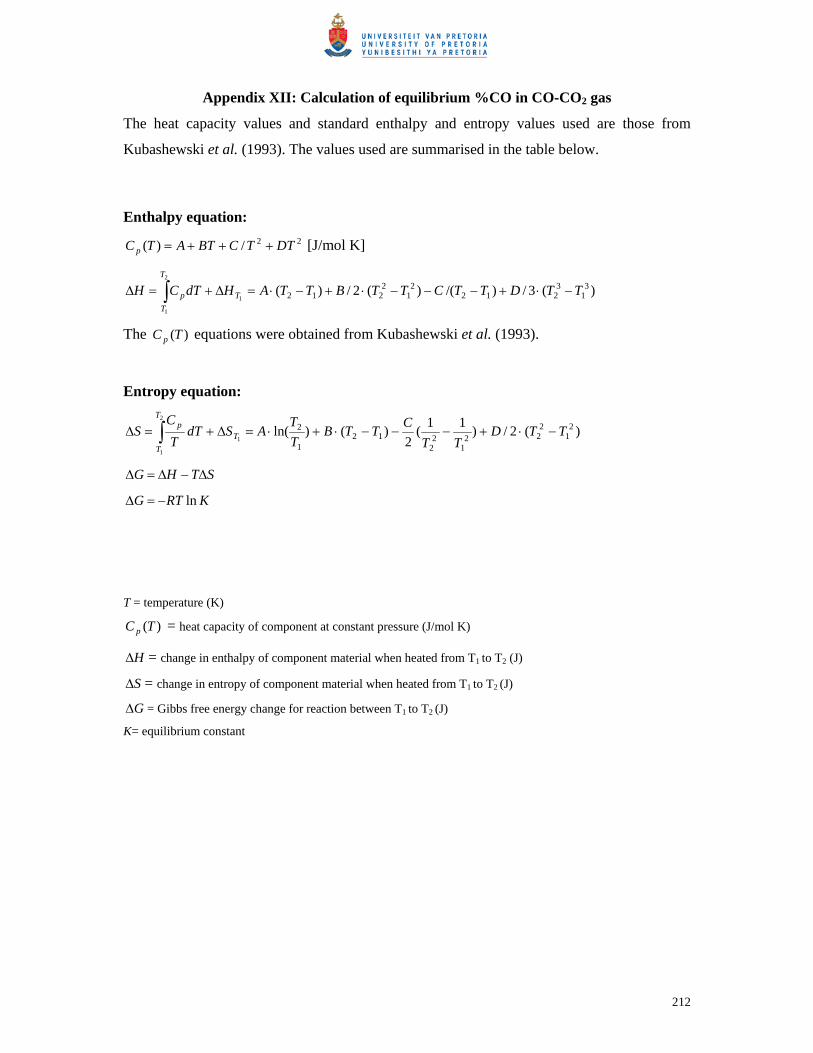
212
Appendix XII: Calculation of equilibrium %CO in CO-CO2 gas
The heat capacity values and standard enthalpy and entropy values used are those from
Kubashewski et al. (1993). The values used are summarised in the table below.
Enthalpy equation:
22/)( DTTCBTATC p +++= [J/mol K]
)(3/)/()(2/)( 31
3212
21
22121
2
1
TTDTTCTTBTTAHdTCH T
T
Tp −⋅+−−−⋅+−⋅=∆+=∆ ∫
The )(TC p equations were obtained from Kubashewski et al. (1993).
Entropy equation:
)(2/)11(2
)()ln( 21
222
12
212
1
21
2
1
TTDTT
CTTBTT
ASdTT
CS T
T
T
p −⋅+−−−⋅+⋅=∆+=∆ ∫
STHG ∆−∆=∆
KRTG ln−=∆
T = temperature (K)
)(TC p = heat capacity of component at constant pressure (J/mol K)
H∆ = change in enthalpy of component material when heated from T1 to T2 (J)
S∆ = change in entropy of component material when heated from T1 to T2 (J)
G∆ = Gibbs free energy change for reaction between T1 to T2 (J)
K= equilibrium constant

213
The enthalpy and entropy equation parameters used are shown below:
[J/deg mol]
Component ]/[
1molJHT∆
1TS∆
]deg/[ molJ
Ht [kJ/mol] ][1 KT ][2 KT A 310⋅B
510−⋅C
610⋅D
Fe0.945O -263000 60.10 --- >=298 48.79 8.37 -2.8 --- Fe 0 27.3 --- 298 800 28.18 -7.32 -2.9 --- 15571 56.95 --- 800 1000 -263.45 255.81 619.23 --- 24408 66.74 --- 1000 1042 -641.91 696.34 --- --- 27308 69.58 --- 1042 1060 1946.25 -1787.5 --- --- 28525 70.73 --- 1060 1184 -561.95 334.13 2912.11 --- 35002 76.54 0.9 1184 1665 23.99 8.36 --- --- 53069 89.22 0.8 1665 1809 24.64 9.9 --- --- 72893 100.32 13.8 1809 2000 46.02 --- --- --- CO -110500 197.50 --- >=298 28.41 4.1 -0.46 --- CO2 -393500 213.7 --- >=298 44.14 9.04 -8.54 --- C(graphite) 0 5.7 --- 298 1100 0.11 38.94 -1.48 --- 13998 26.56 --- >=1100 24.43 0.44 -31.63 --- H2 0 130.6 --- 298 27.37 3.33 --- --- H2O (liquid) -285800 69.9 --- >=298 75.44 --- --- --- H2O (gas) -241800 188.7 --- >=298 30 10.71 0.33 --- CH4 -74800 186.3 --- >=298 12.45 76.69 1.45 -17.99 O2 0 205.1 --- >=298 29.96 4.18 -1.67 --- The linear plots for οG∆ :
y = -175.003x + 171340.954R2 = 1.000
y = 19.815x - 19226.081R2 = 0.999
y = -10.277x + 13906.787R2 = 0.998
y = -142.926x + 135283.859R2 = 1.000
-200000
-150000
-100000
-50000
0
50000
100000
150000
0 500 1000 1500 2000
Temperature (K)
dG° (
J)
C+CO2=2CO
FeO+CO=CO2+Fe
FeO+H2=H2O+Fe
H2O+C=CO+H2
Linear (C+CO2=2CO)
Linear (FeO+CO=CO2+Fe)
Linear (FeO+H2=H2O+Fe)
Linear (H2O+C=CO+H2)

214
y = -108.094x + 88074.887R2 = 1.000
y = -251.020x + 223358.746R2 = 1.000
y = -282.654x + 258829.895R2 = 1.000
y = 31.634x - 35471.149R2 = 0.997
y = -142.926x + 135283.859R2 = 1.000
y = -175.003x + 171340.954R2 = 1.000
-60000
-50000
-40000
-30000
-20000
-10000
0
10000
20000
30000
40000
50000
800
820
840
860
880
900
920
940
960
980
1000
1020
1040
1060
1080
1100
1120
1140
1160
1180
1200
1220
Temperature (K)
dG° (
J)
(21) CH4=C+2H2
(20) CH4+H2O=CO+3H2
(22) CH4+CO2=2CO+2H2
(23) H2O+CO=CO2+H2
(24) H2O+C=CO+H2
(25) C+CO2=2CO