Embed Size (px)
Citation preview

CDFA by the NUMBERSData that drives California’s agricultural oversight
2016

CDFA Headquarters
1220 N Street, Sacramento 95814 www.cdfa.ca.gov
EXECUTIVE OFFICE
Karen Ross, Secretary
Jim Houston, Undersecretary
Jenny Lester Moffitt, Deputy Secretary
Kevin Masuhara, Deputy Secretary for Administration and Finance
Bob Wynn, Senior Advisor to the Secretary
Amrith Gunasekara, Ph.D., Science Advisor to the Secretary
Michele Dias, General Counsel
Steve Lyle, Director of Public Affairs
DIVISION DIRECTORS
Dr. Annette Jones, State Veterinarian, Animal Health and Food Safety Services
Nick Condos, Plant Health and Pest Prevention Services
Kristin Macey, Measurement Standards
Natalie Krout-Greenberg, Inspection Services
Jeff Cesca, Marketing Services
Mary Winkley, Agency Information Officer
Gary Leslie, County–State Liaison
Kari Morrow, Administrative Services
Forewordby CDFA Secretary Karen Ross
By the numbers, for the farmers.A lot of the work we do at CDFA happens behind the scenes: tasks like food safety inspections, setting traps to catch pests, and granting licenses and registrations to farmers and their colleagues in the industry. We collect data at many steps along these processes, which is what brought about the idea for this report. Rather than trying to exhaustively explain all that we do, this document provides snapshots and examples of the data that drives what we do. I hope you will find that it also illustrates why our department, our people and their daily efforts are valuable to farmers and consumers alike.
1 By the Numbers: The California Department of Food & Agriculture

Foreword by CDFA Secretary Karen Ross ............................................................. 1Who is CDFA?
CDFA's Workforce: Science, seasonal flexibility and lean leadership ......................................................3Emergency Response: 2015 Valley Fire .................................................................................................4
The Evolving MarketplaceState Organic Program.........................................................................................................................5Certified Farmers' Market Program ......................................................................................................5Senior Farmers' Market Nutrition Program ...........................................................................................6CalAgPlate ...........................................................................................................................................6Office of Farm to Fork .......................................................................................................................... 7
Climate. Soils. Air. Water. Innovation.Dairy Digester Research and Development Program ............................................................................8State Water Efficiency and Enhancement Program ..............................................................................8Specialty Crop Block Grant Program.....................................................................................................9Fertilizer Research and Education Program ................................................................................... 10-11
Fertilizing Materials Inspection Program ....................................................................................... 12-13
Quantity. Quality. Safety. Setting the Standard.California Dairy ............................................................................................................................. 14-16Pesticide Residue Testing ................................................................................................................... 17Environmental Safety Lab .................................................................................................................. 18Standardization Program ................................................................................................................... 19California Citrus Program ...................................................................................................................20Shipping Point Inspection Program ....................................................................................................20
CDFA does that?Measurement Standards .................................................................................................................... 21
Detect. Identify. Respond. Repeat."The Lab." ..................................................................................................................................... 23-24Huanglongbing/Asian citrus psyllid ....................................................................................................24Border Protection Stations ................................................................................................................. 25Detector Dogs! ...................................................................................................................................26Hydrilla .............................................................................................................................................. 27Pink Bollworm ....................................................................................................................................28
Staying Ahead of the Herd"When I grow up, I want to be a veterinarian." ....................................................................................29Foreign Animal Disease surveillance, detection, monitoring Animal Health Branch .............................................................................................................. 30 Animal ID ................................................................................................................................. 30 CAHFS labs .............................................................................................................................. 31 Monitoring Livestock ............................................................................................................... 32 Data Development for CDFA's Animal Health programs ........................................................... 33Meat Poultry and Egg Safety Branch .................................................................................................. 34Egg Safety and Quality Management Program................................................................................... 35"Yep. It's 2016, and cattle rustling is still a thing." ............................................................................... 36Brand Inspection? There's an app for that. .......................................................................................... 37Feed and Livestock Drugs Inspection Program ................................................................................... 38
Parting Shot: California Fairs .............................................................................................................. 39
Cont
ents

3 By the Numbers: The California Department of Food & Agriculture
CDFA’s workforce: Science, seasonal flexibility and lean leadership
1,180 employees work for CDFA as permanent staff. Five years ago (2010-11), that number was 1,352. Most of CDFA’s work happens where agriculture happens – in the field.
The scale of our administrative (352) and managerial/supervisorial (289) staff is dwarfed by the hundreds of temporary and seasonal field staff who swell our ranks mainly in the summer months as we fan out across the state to set traps, catch pests and perform other duties including surveys, treatments, inspections and investigations.
CDFA employs 239 scientists (veterinarians, entomologists, biologists, etc.) and other highly trained and educated staff such as inspectors (248) and investigators (44) who spend the bulk of their time either in the field or working in our laboratories, research facilities and other technical settings. These specialists are the key to our ability to respond quickly when emergencies arise, such as animal and plant disease outbreaks and pest infestations. In government circles, CDFA is renowned for being lean, nimble and responsive.
239 CDFA veterinarians, entomologists, biologists and other scientists provide the diagnostic expertise, research capability and responsiveness that California’s farms and farmers require.
248
In government
circles, CDFA is
renowned for being
lean, nimble and
responsive.
CDFA inspectors spend the bulk of their working hours out of the office, making sure agricultural commodities like meat, produce, nuts and seeds meet exacting standards for safety, quality and marketability.
Most of CDFA's work happens where
agriculture happens – in the field.

The California Department of Food & Agriculture: By the Numbers 4
CDFA Emergency Response2015 Valley Fire a snapshot of CDFA’s role in rescuing, protecting animals
800+livestock, pets and wild animals received care as victims of the Valley Fire in 2015.
This Silkie chicken was reunited with its owner
after being lost for several days.
This kitten had badly burned paws and was taken to UC Davis for
treatment.
Four civilians lost, four firefighters injured, more than 76,000 acres burned, 1,955 structures lost. Those are the numbers that garner our attention during a blaze like the 2015 Valley Fire in California — and understandably so.
Largely lost in the sheer magnitude of that fire, though, was another statistic: more than 800 animals were also victims of that event, either injured or separated from their owners, or worse. Some were livestock, some pets, some wild. All needed care, and that’s what they got.
The California Veterinary Medical Reserve Corps (CVMRC) works with CDFA to coordinate and deploy trained teams of volunteers during such emergencies. CDFA provided funds for supplies to support teams of vets and vet techs helping burned, injured, lost, and evacuated animals during the Valley Fire. The CVMRC is the largest of its kind in the country with more than 750 members. Teams were deployed to the animal hospital in Middletown.
CDFA also provided funding for a generator to power the facility, which provided care to over 500 animals during the first two weeks of response and another 300 over the following weeks. Cats, dogs, horses, sheep, goats, chickens, cows, pigs, and even some rescued koi (fish) were treated and cared for.
The 76,000-acre footprint of the 2015 Valley Fire in Northern California.

5 By the Numbers: The California Department of Food & Agriculture
Certified Farmers’ Market ProgramCDFA's Certified Farmers’ Market Program gives California farmers an opportunity to offer what they grow directly to the public, with exemptions for minimum size, labeling, standard pack, and container requirements. These exemptions allow sales directly to the public without the added expense of commercial preparation.
California has 726 Certified Farmers’ Markets.
On any given day, from 1 to 135 Certified Farmers’ Markets are happening in more than 50 California counties.
On average, between 6 and 20 booths are selling agricultural products at a Certified Farmers’ Market in California.
In addition to the Certified Farmers’ Markets, California has more than 60 registered Community Supported Agricultural Producers.
California has the most robust Certified Farmers’ Market enforcement program in the nation.
Since July 2015, California’s Certified Farmers’ Market enforcement program has issued more than 100 non-compliance notices, resulting in over 50 civil penalties levied and 10 suspensions; ranging from 1 to 18 months.
State Organic ProgramCalifornia is the primary driver of growth in U.S. Organic Farming. California is the only state with its own organic program. Organic
$2.2 billion in California organic
production in 2015
40% of US organic
agriculture is grown in California
agriculture in California topped $2.2 billion in value, which is approximately 40% of the nation's organic production. California organic acreage has grown to 687,000 acres.
• The State Organic Program (SOP) is expanding its enforcement activities to include GMO testing, beginning with a first-of-its-kind pilot program.
• The SOP had 478 new registrants in 2015, bringing the total to 4,043.
• The SOP registers four types of organic operations:
◊ Producers
◊ Handlers
Certified organic artichokes growing in Monterey County
◊ Processors
◊ Retailers
• The SOP conducted 1,247 inspections in FY 2015/16, including Certified Farmers Markets.
• The SOP submitted 251 samples for pesticide residue testing in FY 2015/16

The California Department of Food & Agriculture: By the Numbers 6
Better Nutrition, Health for our SeniorsSenior Farmers' Market Nutrition Program: www.cdfa.ca.gov/go/sfmnp
California’s certified farmers’ markets are great places to give your diet a nutrition boost. CDFA’s Senior Farmers’ Market Nutrition Program helps low-income seniors accomplish just that. It’s a 100 percent federally funded program that provides check booklets that these seniors may use to purchase fresh fruits and vegetables along with specialty items such as fresh-cut herbs and honey.
The program is a continuing partnership with 32 Area Agencies on Aging, and together we will distribute approximately 43,000 check booklets this year. Each booklet is valued at $20. On average, the statewide redemption rate for the SFMNP has been 94%. That’s good news for vendors at the markets, but the real payoff is improved nutrition and health for our low-income seniors.
Agricultural Education Programs Drive California's Farming Future CalAgPlate: www.cdfa.ca.gov/calagplate
The agriculture-themed CalAgPlate special interest license plates are officially a hit with the farm set. With significant support from the Future Farmers of America (FFA), more than 25,000 of the plates have been sold, renewed or transferred since 2012. This program is funded with proceeds generated through the sale of these specialized license plates through the California Department of Motor Vehicles.
94%That's California's statewide redemption
rate for the coupon booklets provided by the Senior Farmers Market Nutrition Program. Seniors like it. Farmers like it.
We all benefit when our seniors improve their nutrition and health.
43,000booklets will be distributed
to seniors this year.
Each booklet is valued at
$20
Proceeds from the plates fund grant projects that provide agricultural education and leadership opportunities for students at the K-12, post-secondary, and adult education levels.
52 grant proposals received
8 projects funded
Total funds awarded :$477,629
AG
PLA
TE B
Y T
HE
NU
MB
ERS
7 By the Numbers: The California Department of Food & Agriculture
Office of
Farm to
Fork
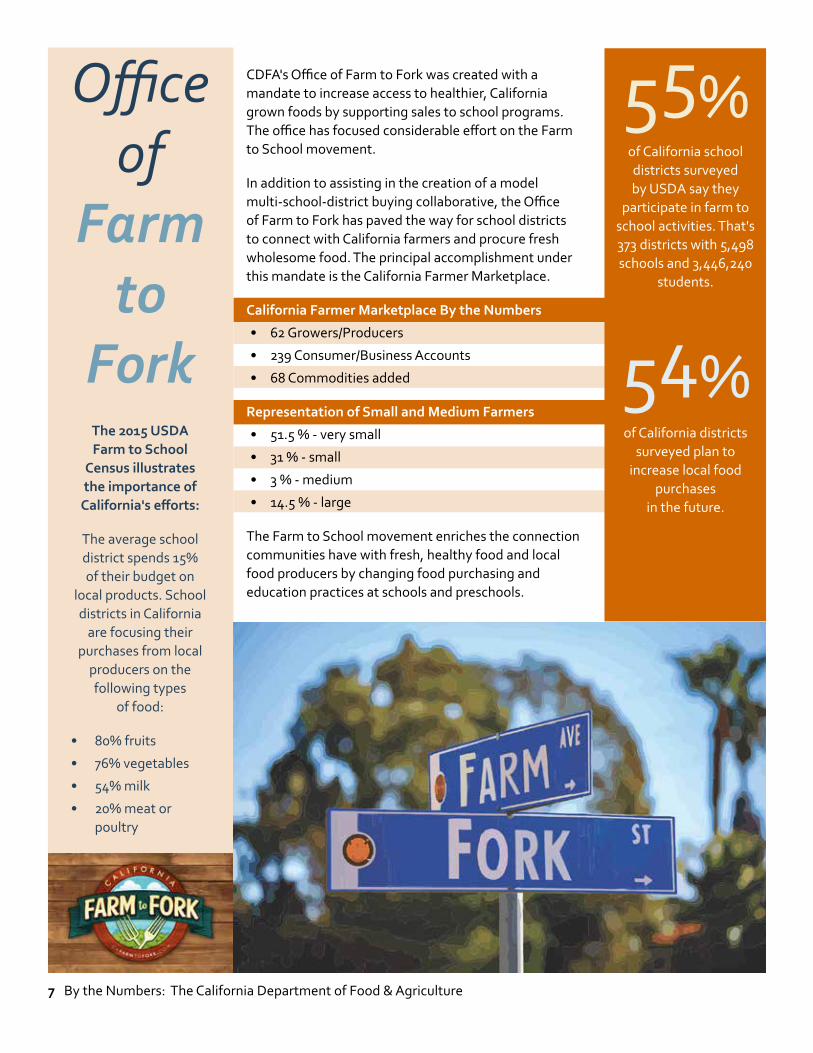
CDFA's Office of Farm to Fork was created with a mandate to increase access to healthier, California grown foods by supporting sales to school programs. The office has focused considerable effort on the Farm to School movement.
In addition to assisting in the creation of a model multi-school-district buying collaborative, the Office of Farm to Fork has paved the way for school districts to connect with California farmers and procure fresh wholesome food. The principal accomplishment under this mandate is the California Farmer Marketplace.
California Farmer Marketplace By the Numbers
• 62 Growers/Producers
• 239 Consumer/Business Accounts
• 68 Commodities added
Representation of Small and Medium Farmers
• 51.5 % - very small
• 31 % - small
• 3 % - medium
• 14.5 % - large
The Farm to School movement enriches the connection communities have with fresh, healthy food and local food producers by changing food purchasing and education practices at schools and preschools.
55% of California school districts surveyed by USDA say they
participate in farm to school activities. That's 373 districts with 5,498 schools and 3,446,240
students.
54% of California districts
surveyed plan to increase local food
purchases in the future.
The 2015 USDA Farm to School
Census illustrates the importance of
California's efforts:
The average school district spends 15% of their budget on
local products. School districts in California
are focusing their purchases from local
producers on the following types
of food:
• 80% fruits
• 76% vegetables
• 54% milk
• 20% meat or poultry

The California Department of Food & Agriculture: By the Numbers 8
Climate Smart AgricultureState Water Efficiency and Enhancement Program
Known as SWEEP, this program provides financial incentives for agricultural operations to invest in irrigation and/or distribution systems that save water and reduce greenhouse gas (GHG) emissions. This program is investing $17.8 million to save water, reduce climate change impacts and reduce greenhouse gas emissions.
The initial investment for this work came from California’s Greenhouse Gas Reduction Fund. The program uses on-farm water and energy use data to calculate GHG reductions and water savings. From 2014 to 2016, SWEEP has funded $17.8 million for 233 projects, with the grants generating an additional $10.5 million in matching funds.
• 67% of projects installed soil moisture monitoring systems linked to irrigation controllers to save water and GHG emissions from pumping
• 28% used evapotranspiration-based irrigation scheduling
• 26% reduced GHG emissions from water pumping, including conversion from fossil fuels to renewable energy such as solar
• 37% installed micro-irrigation or drip systems to save water and reduce GHG emissions
• 5% installed low-pressure irrigation systems to reduce pumping and energy use
• 15% installed variable frequency drives to reduce energy use by matching pump flow with load requirements
• 43,123 acres under irrigation systems in the 233 SWEEP projects funded to-date
• Water savings: 37,488 acre feet per year (1 acre foot = 325,850 gallons)
• Water savings projected over 10 years: 374,880 acre feet (enough to fill 814,364 pools per year)
• Approximately 12.2 billion gallons saved per year
• GHG savings projected over 10 years: 546,950 tons CO2e (GHG reduction is roughly equivalent to removing 11,630 passenger vehicles from the road each year)
Dairy Digester Research and Development Program
Methane is approximately 21 times more potent than carbon dioxide as a greenhouse gas. Dairy digesters capture methane gas at dairy farms and convert it into useful energy. Harnessing this potent gas prevents it from contributing to climate change. Converting it to a low-carbon energy source provides additional greenhouse gas reduction benefits. This program helps California dairies:
• Reduce greenhouse gas (GHG) emissions
• Lessen energy demand by producing electricity or fuel on-site
• Reduce odors and pathogens• Potential to provide additional revenue
stream through production of by-products
How Does This Program Help?
In 2014, CDFA was appropriated $12 million from the Greenhouse Gas Reduction Fund (GGRF) to support dairy digesters. In 2015, CDFA
awarded six projects for approximately $11.1 million in grants to implement digester technology on California dairy operations. These six projects will result in 1,558 million metric tons of CO2 equivalent over 10 years and will generate an estimated 40,000 MW-h of renewable electricity. Four of the projects are located in disadvantaged communities.
233projects have been funded thus far through SWEEP grants.
21�Methane is approximately 21 times more potent than carbon dioxide as a greenhouse gas.
43,123 acres are now under the efficient irrigation systems funded by the SWEEP program.

9 By the Numbers: The California Department of Food & Agriculture
Advancing agricultureone grant at a time
Grant Spotlight:
Characterizing and Breeding Drought Tolerance in Lettuce $353,151 - USDA Agricultural Research Service (ARS)
Supplies of irrigation water for leafy vegetable farming in California are increasingly constrained by both climate change and regulatory restrictions. It's a statewide problem affecting all major lettuce producing regions. A predicted rise in temperatures will lead to increased evapotranspiration that will increase the water requirement of lettuce. Thus, there is a pressing need to adapt lettuce production to the changing environment. This grant is designed to identify traits underlying drought tolerance in lettuce at both the physiological and molecular levels, and incorporate these traits into new cultivars to protect yields. This project aims to conserve water, reducing production costs and increasing the profitability of the lettuce industry while simultaneously increasing the sustainability and protecting the future of lettuce production in California.
1Specialty Crop Block Grant Program: www.cdfa.ca.gov/grants
CDFA’s Specialty Crop Block Grant Program (SCBGP) funds projects that enhance the competitiveness of our farmers’ fruits, vegetables, tree nuts, dried fruits, and horticulture and nursery crops (including floriculture). Over the years, it has added up to 535 projects (and counting).
CDFA announced its 2017 SCBGP Request for Concept Proposals on October 5, 2016 and expects to award up to $22 million to projects that enhance the competitiveness of California Specialty Crops
Specialty Crop Block Grants by the Numbers, 2008-2016:
• 2,311 concept proposals submitted
• 1,130 advanced to full grant proposal phase
• 535 grants awarded
• 145 million in grants awarded
• 290 research projects awarded
• 39 pilot projects
To achieve the goals of this program, CDFA continues to partner with the Center for Produce Safety (now an independent non-profit) to solicit grant proposals in the area of food safety and has developed an ongoing partnership with the Buy California Marketing Agreement to promote the California Grown identity and multi-commodity marketing. In 2015 and 2016 SCBGP program priorities were revised to emphasize adaptation to drought, training for beginning and socially disadvantaged farmers and Food Safety Modernization Act compliance. The SCBGP has also funded multiple projects that support the Farm to School/Farm to Fork movement.
462These are just two of the
grants awarded by this program since 2008.
Grant Spotlight:
Linking Farms to Schools for Nutrition-Based Learning $211,902 - School Garden Network of Sonoma County
Farm-to-school programs are a gateway to introducing young children to healthy habits, tasting fresh produce, and connecting to California's agricultural heritage. This project addresses gaps in nutrition and specialty crop consumption in Sonoma County with a robust, countywide farm-to-school program including: 1) Harvest of the Month fruit and vegetable tastings; 2) Farm field trips; 3) School garden technical and financial assistance; 4) Garden nutrition classes; and 5) Specialty crop cooking and nutrition education workshops. The project is designed to increase specialty crop consumption in adults and children as well as generate revenue sources for California farmers. The education model of this project will increase awareness of how to purchase and prepare specialty crops for adult consumers and encourage youth to become informed eaters through exposure to both new and familiar specialty crops.

The California Department of Food & Agriculture: By the Numbers 10
Online Crop Fertilization Guidelines for Major CropsFertilization guidelines for twenty of California's major crops are currently available on FREP’s website. These crops represent approximately two-thirds (68 percent) of the irrigated acreage in California. An additional eight crop guidelines will be added by mid-2017, bringing the total up to approximately three-quarters of the irrigated agriculture in the state (73 percent).
Successful Projects Making a Difference A great example of FREP funding making a difference for growers is the CropManage decision-making tool, which has been developed by UC Cooperative Extension. Growers can integrate publicly available soil and climate data with in-field measurements to create irrigation and fertilization recommendations that maximize efficiencies. This online application continues to build a user base as it is refined and improved. Originally developed for high value vegetable crops on the Central Coast, CropManage is being adapted to other commodities, such as almonds and processing tomatoes.
CropManage integrates information from multiple sources to make fertilizer and irrigation recommendations.
CropManage: data informs fertilization, irrigation decisions
FREP Guidelines Cover Majority of California Crop Acreage

11 By the Numbers: The California Department of Food & Agriculture
Fertilizer Research and Education Program (FREP)
Supporting Growers’ Nitrogen Management Planning Through Technical Education, Outreach
FREP, in collaboration with the University of California, Division of Agriculture and Natural Resources (UC ANR) and the California Certified Crop Advisor (CCA) organization has developed and extended a one and one-half day nitrogen management certification training program. To date, 890 of California’s 1,200 CCAs have attended one of the training sessions. FREP and UC ANR plan to hold one additional certification training in 2017 and one in 2018.
Year Training Sessions CCAs Trained
2014 5 530
2015 3 260
2016 1 100
Total 9 890
Nitrogen Management Training for CCAs
In 2015, FREP and Central Valley grower coalitions developed a grower training program for nitrogen management. Under Central Valley water quality regulations, growers are required to complete nitrogen management plans. For some growers, these plans must be certified by a qualified professional. The regulations allow growers to self-certify their nitrogen management plans if they participate in a CDFA training program; therefore, the CCA training curriculum was adapted for this purpose by UC Davis. A group of certified CCAs was selected to be trainers, and the Coalition for Urban/Rural Environmental Stewardship has administered the trainings. Growers must pass an examination to qualify for self-certification. FREP funded this effort through grants totaling $139,568.
Grower Nitrogen Training Summary Statistics
Certification Exams graded 1,881
Grower training sessions held to date 31
Total CCAs trained to lead sessions 28
Overall Pass Rate 82%

The California Department of Food & Agriculture: By the Numbers 12
Fertilizer Manufacturer Inspections CDFA's Fertilizing Materials Inspection Program (FMIP) monitors fertilizing materials distributed in California and inspects manufacturing facilities to ensure compliance with State laws and regulations. CDFA inspectors are stationed throughout the state to cover the extent of fertilizer distribution. Inspectors monitor both conventional and organic fertilizer manufacturing and
distribution within their districts and in neighboring states (for organic production shipping into California). In 2015, a total of 242 organic fertilizer manufacturers were inspected and audited throughout California and neighboring states. Additionally, there are over 1,400 conventional fertilizer manufacturers and distributors that are monitored throughout the state.
242organic fertilizer
manufacturers were inspected and audited
throughout California and neighboring states in 2015

13 By the Numbers: The California Department of Food & Agriculture
Organically grown foods continue their rise as a highly desired commodity in California and worldwide. As the world’s number-one producers of organic crops, California growers need quality fertilizing materials that are acceptable and useful for growing organic. Fertilizing materials used in organic growing are known as organic input materials (OIM) and must be evaluated and reviewed by FMIP scientists prior to distribution in California. The number of OIM products reviewed and registered by program staff has grown dramatically since the inception of the program.
Conventional fertilizing products are used in settings ranging from large-scale agriculture to backyard gardening. Over the last several years, the number of products evaluated by the program has increased approximately 30%, giving growers a broader selection and a slate of more modern options for specific soil types and other growing conditions.
Fertilizing Materials Inspection Program (FMIP)
Fertilizers: Expanding options for organic, conventional, backyard growers
The OIM Program registers fertilizing materials to be used in organic crop and food production The program is mandated by the Legislature and supported by the industry. Products claiming to be appropriate for use in organic production are verified to comply with the California Fertilizing Materials Law and Regulations and USDA National Organic Program Standards.

The California Department of Food & Agriculture: By the Numbers 14
Who Leads the Nation? California Dairy Does.With 40.9 billion pounds of milk in 2015, California's dairy farms account for 19.6 percent of the nation's supply.
CDFA regulates the state’s dairy industry across the entire supply chain, from its 1,438 dairy farms to the diverse mix of finished dairy products made with California milk, which are consumed locally and across the world. Over the past 20 years, the industry has experienced significant growth. During this time period, the number of dairy cows in the state has increased by 36.5 percent, and the amount of milk produced by the state’s dairy herd has increased by 61.7 percent.
Butter and cheese are two important dairy products manufactured in California. In fact, more than three-quarters of the state’s total milk supply is used to make these products. Over the past 20 years, total cheese production has increased by 150.7 percent (to approximately 2.44 billion pounds in 2015) and butter production has increased by 67.5 percent (to approximately 581 million pounds in 2015).
Milk production per cow in 2015 was estimated at 23,382 pounds and the number of cows was estimated to be 1.75 million head.
California's Top Three Cheeses (2015)
1. Mozzarella 1.4 billion lbs.
2. Cheddar 359 million lbs.
3. Monterey Jack 293 million lbs.
California Milk Production
California Butter Production
California Cheese Production

15 By the Numbers: The California Department of Food & Agriculture
California is home to:
cow dairies 1,438goat dairies 61
sheep dairies 15water buffalo dairies 2
72.7%of California's milk in 2015 was
produced in our five leading dairy counties: Tulare, Merced, Kings,
Stanislaus, and Kern.
Safe. Wholesome. Reliable. California Dairy.CDFA’s Milk and Dairy Food Safety Branch (MDFS) protects California’s consumers by ensuring that milk and milk products are safe, wholesome, meet all state and federal bacterial and compositional standards, and are properly labeled. That means inspections of dairy farms, bulk milk tanker trucks, milk processing plants, industry milk testing laboratories and manufacturers of single-use dairy containers. MDFS also collects regulatory samples of milk, milk products and water supplies for laboratory testing, responds to consumer complaints and food safety incidents, and initiates impounds and product recalls to protect public health as warranted. In addition, sanitation ratings by MDFS personnel certify milk supplies and milk plants for federal approval to ship Grade-A dairy products in interstate commerce.
Facilities that receive, process or package milk and dairy products must also be licensed and inspected. MDFS licensed and regularly inspected 561 milk products plants in 2015. The plants are inspected and officially scored for compliance with food safety standards four times per year, with the inspections covering many facets of the modern dairy industry, from analyzing raw ingredients and water supplies to pasteurization equipment, container manufacturing, and even the design of new plants and the remodeling of existing ones.
MILK PRODUCT PLANT INSPECTIONS 2015
Number Activity Completed
Sanitation Inspections 4,304
Pasteurization Equipment Inspections 2,015
Raw Ingredient Samples Collected 1,190
Finished Product Samples Collected 11,342
Water Samples Collected 697
Sanitation Ratings for FDA compliance 116
Evaluations of Industry Milk Testing Labs 63
Dairy Container Manufacturer Inspections 25

The California Department of Food & Agriculture: By the Numbers 16
Bulk Milk Tanker InspectionsApproximately 13 million gallons (about 2000 tanker truckloads) of milk are transported from dairy farms in California every day. Each milk tanker truck transporting milk from dairy farms to milk processing plants is inspected for proper maintenance, cleanliness, and sanitary design. Drivers are tested and licensed as well: in 2015, MDFS administered 472 new driver exams, 645 field proficiency evaluations, and hosted online refresher courses for 547 renewing drivers. These activities help to ensure that milk is handled in a sanitary manner when transported from the farm and that milk measurements taken by the driver for purposes of payment to the producer are accurate. MDFS is also responsible for issuing permits and conducting annual inspections of commercial facilities that wash and sanitize bulk milk tanker trucks.
Dairy Farm Inspections Of the state’s 1,516 total dairy farms, 607 are inspected directly by MDFS. The balance is inspected by county operated Approved Milk Inspection Services under MDFS supervision. Inspections involve on-site assessments of dairy farm surroundings, milking barns, and milking equipment for proper maintenance and cleanliness and for compliance with all state and federal sanitation standards. Recording thermometers on farm milk tanks are checked for accuracy and maintained under regulatory seal to ensure proper milk cooling and storage. MDFS also reviews and approves construction plans for new dairy farms or new equipment installations. Samples of bulk milk are collected and analyzed from each farm for compliance with regulatory limits on bacterial and somatic cell counts and to ensure the absence of any detectable antibiotic residues. Milk is restricted in use or excluded from the market as necessary. Samples of well water are collected annually and re-circulating chiller water is collected every six-months for bacterial testing.
MDFS DAIRY FARM INSPECTIONS 2015
The MDFS Branch performed the following inspections and sampling at 607 dairy farms in 2015:
Number Activity Completed
Sanitation Inspections 1,553
Bulk Farm Milk Samples Collected 4,644
Water Samples Collected 1,336
BULK MILK TANKER INSPECTIONS 2015
Number Activity Completed
Tanker Truck Sanitation Inspections 1,261
Tanker Wash Station Inspections 9
Driver Field Proficiency Evaluations 645
On-line Driver Refresher Course 547
New Driver Exams Administered 472
17 By the Numbers: The California Department of Food & Agriculture
Pesticide residue testing
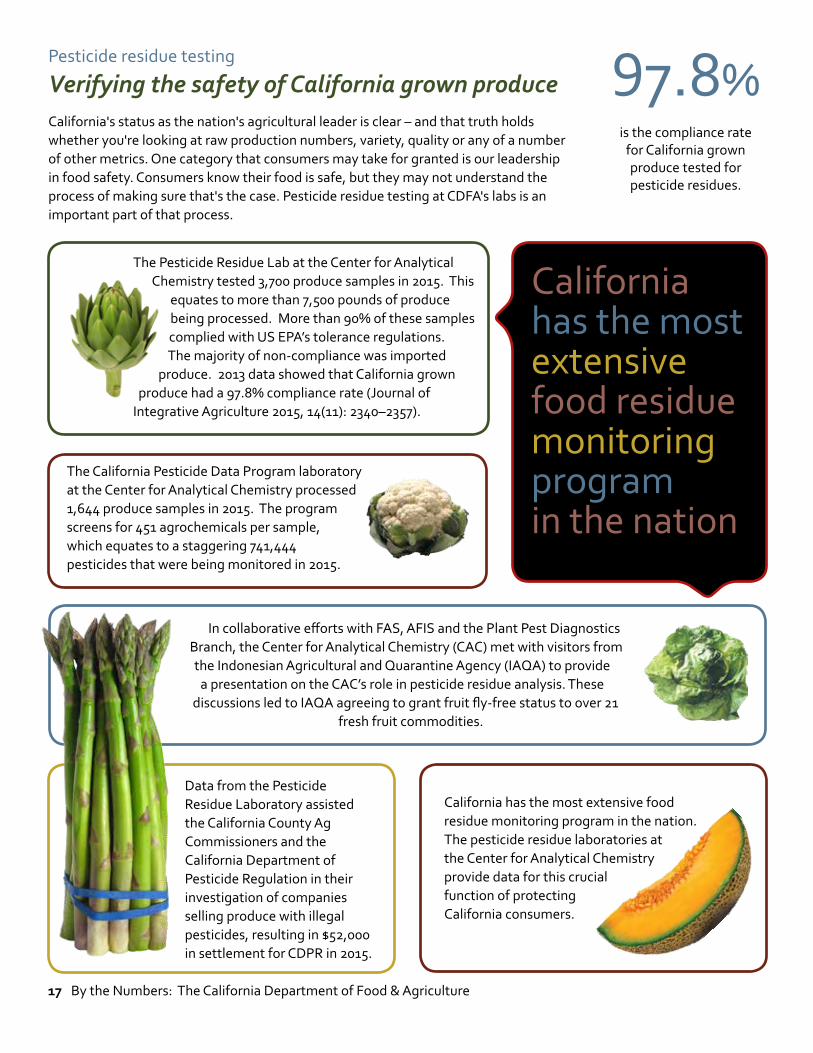
Verifying the safety of California grown produceCalifornia's status as the nation's agricultural leader is clear – and that truth holds whether you're looking at raw production numbers, variety, quality or any of a number of other metrics. One category that consumers may take for granted is our leadership in food safety. Consumers know their food is safe, but they may not understand the process of making sure that's the case. Pesticide residue testing at CDFA's labs is an important part of that process.
97.8%is the compliance rate
for California grown produce tested for pesticide residues.
California has the most extensive food residue monitoring program in the nation
The Pesticide Residue Lab at the Center for Analytical Chemistry tested 3,700 produce samples in 2015. This
equates to more than 7,500 pounds of produce being processed. More than 90% of these samples complied with US EPA’s tolerance regulations. The majority of non-compliance was imported
produce. 2013 data showed that California grown produce had a 97.8% compliance rate (Journal of
Integrative Agriculture 2015, 14(11): 2340–2357).
California has the most extensive food residue monitoring program in the nation. The pesticide residue laboratories at the Center for Analytical Chemistry provide data for this crucial function of protecting California consumers.
The California Pesticide Data Program laboratory at the Center for Analytical Chemistry processed 1,644 produce samples in 2015. The program screens for 451 agrochemicals per sample, which equates to a staggering 741,444 pesticides that were being monitored in 2015.
In collaborative efforts with FAS, AFIS and the Plant Pest Diagnostics Branch, the Center for Analytical Chemistry (CAC) met with visitors from the Indonesian Agricultural and Quarantine Agency (IAQA) to provide
a presentation on the CAC’s role in pesticide residue analysis. These discussions led to IAQA agreeing to grant fruit fly-free status to over 21
fresh fruit commodities.
Data from the Pesticide Residue Laboratory assisted the California County Ag Commissioners and the California Department of Pesticide Regulation in their investigation of companies selling produce with illegal pesticides, resulting in $52,000 in settlement for CDPR in 2015.

The California Department of Food & Agriculture: By the Numbers 18
Environmental Safety Lab provides testing for local, state and federal agenciesProtecting farm workers, the environment and California’s citizens from exposure to agrochemicals
Within the Environmental Safety Laboratory at CDFA, the Feed and Fertilizer Laboratory provides testing of fertilizers, livestock feed and drugs to help prevent adulterated or contaminated products from being applied to fields or consumed by livestock and poultry.
Test assays include aflatoxins, antibiotics and microscopic analysis of prohibited materials. Fertilizer testing is designed to ensure that fertilizer is safe, effective, and meets the licensee’s claims and guarantees. Testing also verifies that what is printed on the label matches what’s in the package.
Environmental Analysis LabLaboratory testing of environmental monitoring samples (water, soil, air & foliage) from emergency eradication projects of unwanted pests that are detrimental to California's agricultural crops is an important component of the eradication process. These tests help to ensure spray tanks are cleaned properly, the appropriate level of pesticide is used and monitor the actual levels of pesticide that are found in and around the treatment areas.
Feed Lab
• 1000 samples received
• 4471 analyses performed
• 211 Monensin analyses performed in response to horse illness and deaths, also provided analytical support for a Monensin mixer study
Peak season for our environmental safety testing is between April and November, when pests are most likely
to be active and eradication efforts are most likely to be underway.
Fertilizer Lab
• 1246 samples received
• 6046 analyses performed
Program/Source Samples Tested in 2015
Asian Citrus Psyllid Eradication program 237
Japanese Beetle Eradication program 103
Oriental Fruit Fly Eradication program 15
Soil samples (tested for various pesticides) 49
Air samples for volatile pesticide levels and 838 pesticide air monitoring
Water samples (mostly surface water) 3151

19 By the Numbers: The California Department of Food & Agriculture
Standardization ProgramCDFA sets the standards for consumer confidence in California quality
Standardization, or setting minimum standards for fresh fruits, nuts and vegetables, came about a century ago at the behest of California fresh fruit and vegetable industry who sought to protect their reputations and their consumers from substandard products. California's standardization laws establish minimum standards for maturity, quality, size, standard container and pack, and container markings.
Under the Standardization program today, over 30 major commodities must meet specific standards, while all other commodities must meet at least minimum standards established by the Food and Agriculture Code.
The CDFA Standardization Program is a big but behind-the-scenes reason why consumers in California and elsewhere have confidence that they are purchasing commodities at an acceptable level of quality. That reliability helps our growers protect and promote their fruit, nut and vegetable industries in California.
In 1992, our program added an Advisory Committee comprised of 13 voting members from the industry. Prior to 1992, the Standardization program was entirely funded by the State General Fund. Today, the program is funded entirely by industry. Funding is derived from a set container fee assessment.
County agricultural commissioners and their staff enforce standards at the local level. Inspections take place in fields and packinghouses, at wholesale markets and retail distribution centers, retail outlets, and highway inspection stations.
California produce found in violation can be reconditioned and re-inspected, sent for
processing or donated to a food bank or local charitable organization. Imported produce has an additional option to be shipped out of the state.
27 narrated commodity training presentations are available on the program's web page, providing easy public access to the laws and regulations that govern California fresh fruit and vegetable commodities.
Violations in FY 2014/15
• 1,004 notices of noncompliance were issued for labeling, quality and proof of ownership.
• 144 notices of proposed actions were issued, which resulted in $56,037 in civil penalties.

The California Department of Food & Agriculture: By the Numbers 20
Not just citrus. California citrus.CDFA's Citrus Program is responsible for protecting the industry and general public from substandard products and ensuring that the established minimum maturity and quality standards are met. In addition, the Citrus Program is responsible for providing industry members with current and accurate data regarding the state’s citrus acreage and citrus crop.
• 2,058 maturity inspections performed by county personnel
• 3,572 maturity inspection hours performed by county personnel (this includes frost monitoring hours)
• This citrus season experienced below-freezing temperatures that required monitoring and assessing by county personnel but did not warrant a statewide freeze inspection program.
Shipping Point Inspection Program
Inspections confirm size, weight, quality, food safety standards & moreThe Shipping Point Inspection (SPI) Program provides elective third-party audits for grading, certification service, and food safety verification to the fruit, nut and vegetable industries throughout California. A Federal-State Cooperative Agreement with the United States Department of Agriculture (USDA) authorizes CDFA inspectors to use federal grade standards for fresh produce inspection and to issue federal-state inspection certificates that are nationally and internationally recognized.
Inspectors can certify California produced commodities as to quality (grade), condition, size, net weight, temperature, and other factors required by users.
• SPI conducted a total of 77,086 fresh fruit, vegetable and nut inspections in 2015.
• SPI inspected a total of 4,455,260,163 pounds of fresh fruits, vegetables and nuts in 2015.
• SPI conducted a total of 755 Food Safety Audits in 2015.
77,086inspections of fruits, vegetables
and nuts were performed by SPI Program staff in 2015

21 By the Numbers: The California Department of Food & Agriculture
Measurement Standards
Let's Play "I'll Bet You Didn't Know..."Farms. Crops. Cows, eggs, alfalfa, breakfast, dinner... that's agriculture - that's what CDFA does. Right? Well, yes, but... I'll tell you what - let's play a little game called "I'll Bet You Didn't Know what else CDFA does." Check each box that applies:
� Supermarket scales � Truck stop scales � Recycling center scales � Gold scales � Airport luggage scales � Butcher's shop scales
� Cashiers' price scanners � Gasoline pumps � Propane meters � Electric vehicle charging stations � Taxi meters � Ride-sharing apps
Of course, the correct answer is "all of the above." CDFA's Division of Measurement Standards regulates all of these important forms of measurement and many more used in the millions of commercial transactions that take place every day in California. Our expertise in this arena dates all the way back to the days when the local farmer was the person you went to see when you needed to weigh or measure anything from a gallon of milk to a pound of butter to a length of fencing. Farmers have always been the ones with the tools and the know-how, and CDFA's oversight of those devices, methods, standards and procedures carries over into the modern marketplace.
Commerce Requires Confidence: Weighing and Measuring Devices
• 1,530,000 commercial weighing and measuring devices are registered in California. Commercial weighing devices include scales at grocery stores, truck stops, recycling centers, jewelry stores and airports, just to name a few. Commercial measuring devices include gasoline dispensers, propane meters, and utility sub-meters for electricity, gas, and water.
Electric Vehicles and Charging Stations
• To date, 189,000 electric vehicles (EV) have been sold in California, 45% of the total U.S. sales (http://www.pevcollaborative.org/ Homepage, Dashboard information)
• In 2012, Governor Brown issued Executive Order B-16-12, which set a target of 1.5 million zero-emission vehicles on the road by 2025.
• While most charging takes place at home, there are over 3,000 public access charging stations today throughout California (http://www.afdc.energy.gov/locator/stations/ select "Electric" and "CA")
• By 2018, it is estimated that as many as 40,000 Level 2 (AC, 220 V) and 350 fast charge (DC, 480 V) high public access stations will be needed http://www.energy.ca.gov/2015publications/CEC-600-2015-014/CEC-600-2015-014-LCF.pdf (Page 42, Table 14)
$1.29That's the annual cost per capita for weights and measures oversight in California. That’s less than four-tenths of a cent per person, per day, for all the consumer and business protection that ensures customers get what they pay for, and businesses have a level playing field to produce, compete, market and innovate.
1,530,000 commercial weighing and measuring devices are registered in California.
189,000 electric vehicles (EV) have been sold in California, 45% of the total U.S. sales.
1,500,000 zero-emission vehicles on the road by 2025 – that's the target set by an Executive Order signed by Governor Brown in 2012.

The California Department of Food & Agriculture: By the Numbers 22
38public hydrogen fueling stations are projected to be online by the end of 2016, up from 25 in 2015.
12,200,000,000gallons of gas are purchased by California motorists every year.
3,300,000,000gallons of diesel are purchased in California every year.
10,000 gasoline service stations are scattered throughout California.
94 percent that's the compliance rate of motor fuel dispensers checked by CDFA and county inspectors. The official seal on gas pumps means the dispenser has passed all legal requirements.
Measurement Standards, continued
• In 2016, the Division of Measurement Standards began new research under a $1.3 million interagency agreement with the California Energy Commission to develop field standards for State and county inspectors to use when testing electric vehicle supply equipment (aka EVSE, electric charging stations) for accuracy.
The Hydrogen Highway
• As auto manufacturers like Hyundai, Toyota, and Honda introduce fuel cell electric vehicles (FCEVs), the network of public hydrogen stations continues to expand. In one short year, the number of stations has grown from 11 to 25, with projections of 38 stations by the end of 2016.
A Foundation of Fairness in the "Sharing" Economy
• Uber and Lyft are examples of the new “sharing” economy, where everyday people are linking goods and services through new technology. Uber, the largest Transportation Network Company, facilitates about 5 million trips per day in countries all across the world, and completed its billionth ride in December 2015. DMS is leading the nation in developing standards and specifications for digital network transportation systems which use GPS to measure time and distance for fare calculations, and the only weights and measures jurisdiction in the U.S. testing these systems.
10,000 Gas Stations, 15 Billion Gallons of Fuel
• California motorists buy 12.2 billion gallons of gasoline and 3.3 billion gallons of diesel every year (42 million gallons of fuel every day), according to statistics compiled by the California Energy Commission (latest figures are for 2012). The economic impact of small measurement errors to the fuel industry can be enormous. If the average price of fuel is $2.50/gallon, and the dispensers are off either way by just half a percent (0.5%, which is the legal limit for meter error), this seemingly small inaccuracy would cost $1.9 billion annually.
• 10,000 gasoline service stations are scattered throughout California. Through vigilant testing and inspecting of the 270,000 fuel dispensers by county inspectors at these locations, the compliance rate of motor fuel dispensers in CA is 94%. If a dispenser fails, it is tagged for repair or taken out of service. When repaired and recalibrated, it can be put back into service. Consumers should look for official seal (sticker), indicating that the dispenser passes and meets all legal requirements.
Quality, Safety of Petroleum Products
• 10 - 15 cents/gallon extra is what consumers pay at the pump for premium gasoline. They can take comfort knowing that DMS is behind the scenes testing the quality of gasoline and other fuels. In 2015, the DMS Sacramento and Anaheim laboratories tested a total of 1,500 gasoline and diesel samples, and the results indicated a 96 % compliance rate. DMS also samples and tests packaged and bulk motor oil, brake fluid, transmission fluid and antifreeze, for quality and correct labeling.
23 By the Numbers: The California Department of Food & Agriculture
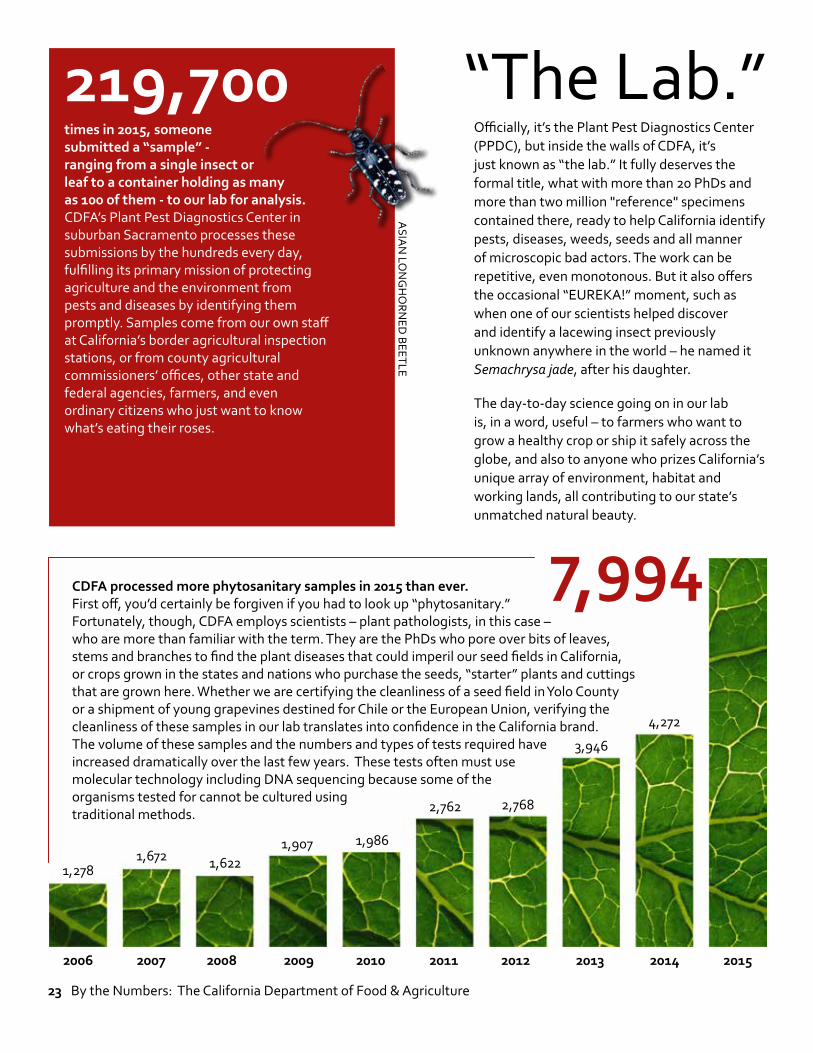
“The Lab.”219,700times in 2015, someone submitted a “sample” - ranging from a single insect or leaf to a container holding as many as 100 of them - to our lab for analysis. CDFA’s Plant Pest Diagnostics Center in suburban Sacramento processes these submissions by the hundreds every day, fulfilling its primary mission of protecting agriculture and the environment from pests and diseases by identifying them promptly. Samples come from our own staff at California’s border agricultural inspection stations, or from county agricultural commissioners’ offices, other state and federal agencies, farmers, and even ordinary citizens who just want to know what’s eating their roses.
ASIA
N LO
NG
HO
RNED
BEETLE
7,994CDFA processed more phytosanitary samples in 2015 than ever. First off, you’d certainly be forgiven if you had to look up “phytosanitary.” Fortunately, though, CDFA employs scientists – plant pathologists, in this case – who are more than familiar with the term. They are the PhDs who pore over bits of leaves, stems and branches to find the plant diseases that could imperil our seed fields in California, or crops grown in the states and nations who purchase the seeds, “starter” plants and cuttings that are grown here. Whether we are certifying the cleanliness of a seed field in Yolo County or a shipment of young grapevines destined for Chile or the European Union, verifying the cleanliness of these samples in our lab translates into confidence in the California brand. The volume of these samples and the numbers and types of tests required have increased dramatically over the last few years. These tests often must use molecular technology including DNA sequencing because some of the organisms tested for cannot be cultured using traditional methods.
2006 2007 2008 2009 2010 2011 2012 2013 2014 2015
1,2781,672 1,622
1,907 1,986
2,762 2,768
3,946
4,272
Officially, it’s the Plant Pest Diagnostics Center (PPDC), but inside the walls of CDFA, it’s just known as “the lab.” It fully deserves the formal title, what with more than 20 PhDs and more than two million "reference" specimens contained there, ready to help California identify pests, diseases, weeds, seeds and all manner of microscopic bad actors. The work can be repetitive, even monotonous. But it also offers the occasional “EUREKA!” moment, such as when one of our scientists helped discover and identify a lacewing insect previously unknown anywhere in the world – he named it Semachrysa jade, after his daughter.
The day-to-day science going on in our lab is, in a word, useful – to farmers who want to grow a healthy crop or ship it safely across the globe, and also to anyone who prizes California’s unique array of environment, habitat and working lands, all contributing to our state’s unmatched natural beauty.

The California Department of Food & Agriculture: By the Numbers 24
“The Lab” continued
2009 2010 2011 2012 2013 2014 2015
The Human TouchThe most labor-intensive part of the laboratory test to detect HLB is preparation of the plant tissue for each sample. While other phases of the qPCR test procedure have been mechanized, the initial tissue preparation still requires the human touch.
120,000+The Entomology LabWe’re on track to surpass 120,000 samples submitted to the Entomology Laboratory for identification this year, and that total has steadily increased over the years. The graph indicates the number of Pest and Damage Records, or PDRs, submitted to Entomology since 2006-07. Each PDR can represent from 1 to numerous specimens (sometimes up to 100), and sometimes different pests are submitted on the same PDR, so each specimen needs to be identified. So the number of actual specimens that come through the Entomology lab far exceeds the number of PDRs in a given year. After a dip in 2010-2011, the trend has been going up steadily, and in the current year, that increase has been considerably more than in previous years.
Some entomologists don’t particularly like the word “bug.” It’s not wrong, it’s just not specific enough for their brand of science. They prefer “insects” or “pests” or something ending in “-optera.” But “bugs” is what they are to most of us, and some are better for crops and gardens than others. CDFA’s Entomology Lab is where that all gets figured out.
05-06 06-07 07-08 08-09 09-10 10-11 11-12 12-13 13-14 14-15 15-16
120,000
100,000
80,000
60,000
40,000
20,000
2209
9,111
14,233 14,644 14,40213,640
Samples Submitted to Entomology Lab
26,897plant tissue samples were tested in CDFA’s Plant Pest Diagnostics Center in 2015 for huanglongbing (HLB), a fatal disease of citrus that has caused severe losses to the citrus industry in Florida and was detected in Southern California in 2012. It is spread from infected trees to healthy trees by a small insect called the Asian citrus psyllid (ACP). The disease-causing bacterium can be detected from both plant tissue of an infected tree and in ACP by a laboratory test called real time polymerase chain reaction (qPCR).
HUANGLONGBING (HLB)

25 By the Numbers: The California Department of Food & Agriculture
First Line of Defense: CDFA’s Border Protection Stations
7,000,000That’s how many vehicles pass through CDFA’s Yermo Agricultural Inspection Station on their way into California each year.
That’s an average of
45 vehiclesa minute
Inspectors at CDFA’s Border Protections Stations (BPS) are our first line of defense in the department’s mission to prevent the introduction of invasive species. Also known as the Pest Exclusion – Exterior Program, the BPS Program consists of 16 stations located on major roadways entering the state through its eastern and northern boundaries.
The mountains and deserts surrounding California provide protection from the natural movement of invasive species from other parts of North America. However, since an average of 35 million vehicles travel into California each year, invasive species can and do hitch a ride here. That’s why the BPS Program exists – to protect California from the artificial movement of invasive species via commercial and private vehicles entering the state.
In order to detect and exclude invasive species, millions of incoming vehicles must be monitored annually.
Private Vehicles
Vehicles monitored entering California via BPS 25,101,059
Detected shipments of prohibited plant material 19,637
Total number of pests found 3,120
Total number of harmful invasive pests 625
Commercial Vehicles
Vehicles monitored entering California via BPS 6,470,425
Shipments inspected 430,977
Detected shipments of prohibited plant material 2,957
Total number of pests found 2,673
Total number of harmful invasive pests 454
Diligence = DetectionCalifornia’s Border Protection Stations (BPS) prevented more than 1,000 introductions of harmful, invasive pests in 2015.
Location, Location, Location Strategic sites also benefit partner agencies
The stations along California's borders also provide services to other state agencies. In 2015, the BPS surpassed one million watercraft inspections in support of the Department of Fish and Wildlife’s effort to exclude exotic invasive mussels. These watercraft inspections have resulted in more than 1,500 interceptions of quagga and zebra mussels on personal watercraft. The BPS provides services to Board of Equalization to identify property entering the state without having paid sales and use taxes, generating more than $130,000 a day in recovered tax revenue. The network of stations also assists CalRecycle with their efforts to prevent fraud in the beverage container recycling program.
Truckee Border Protection Station

The California Department of Food & Agriculture: By the Numbers 26
490significant pests were intercepted in fiscal 2014-15 by “detector dogs” and their handlers, working as teams to prevent the introduction of harmful plant pests into California via privately-shipped parcels (FedEx, US Postal Service, UPS, etc.). That’s a 70 percent increase from the previous year.
The California Dog Teams “alerted” on 22,583 parcels containing agricultural products last year. Of those, 4,948 were unmarked or mislabeled. The dogs alerted on 4,548 parcels at USPS facilities. Of these packages nearly 80 percent (3,578) were unmarked. Additionally, thanks to the dog teams, 2,273 rejections were issued in 2014-15 for violations of state and federal plant quarantine rules, a 65% increase from FY 2013-14.
97 percentThat’s how accurate our trained detector dogs are at finding parcels that contain agricultural commodities. Once they find the package, their handlers can perform an inspection to determine whether it’s legally marked, whether the contents are allowed to be shipped that way, and whether the parcel contains any pests or other material that could cause problems for California crops or the environment.
09-10 10-11 11-12 12-13 13-14 14-15
500
400
300
200
100
Significant Pests Intercepted by California’s Dog Teams
490
319
53 57
124 132
Detector Dogs!
09-10 10-11 11-12 12-13 13-14 14-15
5,000
4,000
3,000
2,000
1,000
4,948
2,107
3,481
2,925
1,9812,270
Unmarked Parcels Containing Ag ProductsIntercepted by California Dog Teams

27 By the Numbers: The California Department of Food & Agriculture
HydrillaIntegrated Pest Control Branch’s Efforts to Eradicate an Invasive Aquatic Weed
Hydrilla and the Healing Power of “Alphabet Soup” Multiple agencies, complementary rolesWhen it comes to aquatic weeds, “alphabet soup” is just what the doctor ordered. CDFA, DWR, DBW, DFW... it takes several cooperating agencies to protect our waterways.
and Waterways in its fight against invasive aquatic species in the Delta. We are also frequently consulted by outside agencies when they encounter hydrilla for the first time. In 2015, CDFA was approached for advice by representatives from the states of Michigan and New York, and we were also called to testify at a Senate hearing about aquatic weeds in the Delta.
CDFA has also provided equipment and personnel to support the California Department of Fish and Wildlife with their submersed aquatic vegetation mapping efforts in the Delta. The United States Bureau of Reclamation has joined with CDFA as a funding partner and CDFA assists their efforts by maintaining hydrilla-free clearings around boat docks. In addition, CDFA has assisted USGS with their national aquatic weeds database.
43,000acres of surface area makes Clear Lake California’s largest freshwater lake. Hydrilla was first found there in 1994 and the initial response was successful, but the weed rebounded in 2007. Its rapid regrowth led CDFA’s Hydrilla Eradication Program to pursue a cooperative effort with several sister agencies including the Department of Water Resources and the Department of Parks and Recreation’s Division of Boating and Waterways. The number of hydrilla plants has come down from a high of 196 in 2008 to just 4 plants in 2015. Isolated infestations in Shasta and Nevada counties are near eradication, with no plants for up to nine years, leaving Lake and Yuba Counties with the only active hydrilla infestations in the state. 2007 2008 2009 2010 2011 2012 2013 2014 2015
200
180
160
140
120
100
80
60
40
20
Toward Eradication:Declining Numbers of Hydrilla Plants in Clear Lake
Hydrilla plants found
Survey grids with hydrilla
Here’s a short list of the folks CDFA works with on a regular basis to keep these aquatic weeds at bay:
• Dept. of Water Resources• Dept. of Parks and Recreation• Division of Boating and Waterways• Dept. of Fish and Wildlife• Delta Conservancy• County Agricultural Commissioners
While CDFA is the lead for rapid response to hydrilla, we also provide mapping resources to the DWR for the control of other damaging weeds within the State Water Project. Working together with the Delta Conservancy and Delta Area-wide Aquatic Weed Management effort, CDFA provides an added level of detection and knowledge to the Division of Boating
The California Department of Food & Agriculture: By the Numbers 28
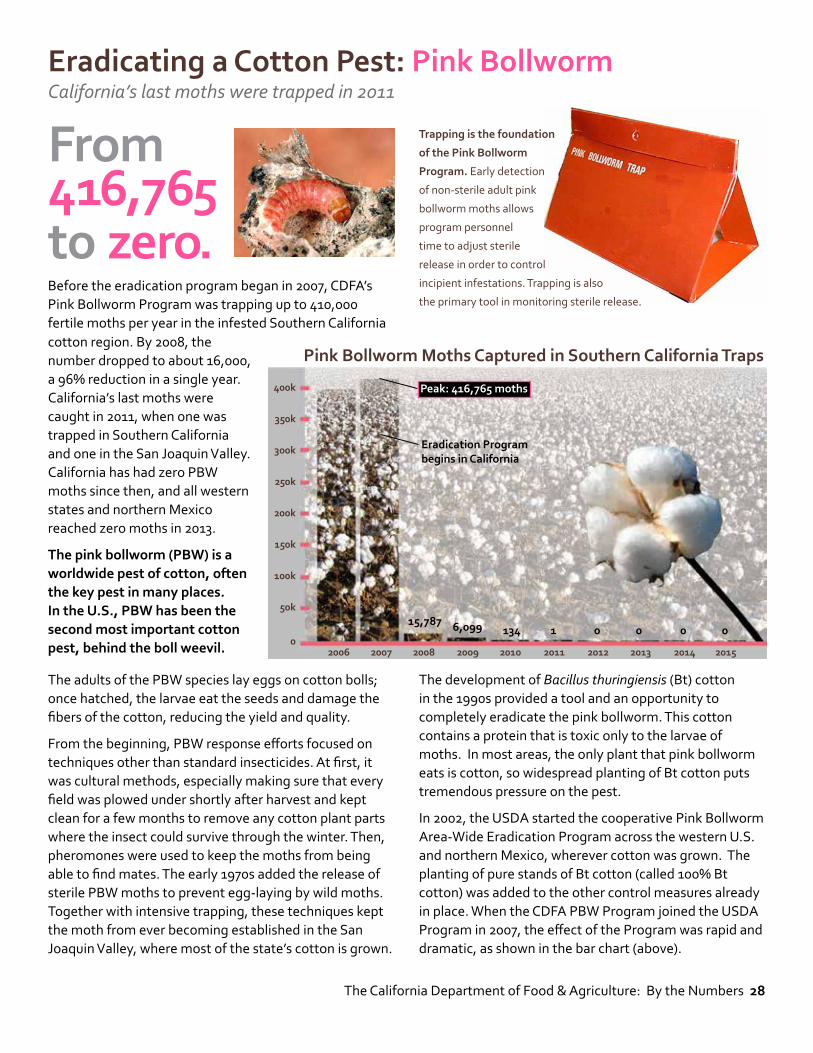
Eradicating a Cotton Pest: Pink BollwormCalifornia’s last moths were trapped in 2011
From 416,765 to zero.Before the eradication program began in 2007, CDFA’s Pink Bollworm Program was trapping up to 410,000 fertile moths per year in the infested Southern California
Trapping is the foundation
of the Pink Bollworm
Program. Early detection
of non-sterile adult pink
bollworm moths allows
program personnel
time to adjust sterile
release in order to control
incipient infestations. Trapping is also
the primary tool in monitoring sterile release.
The development of Bacillus thuringiensis (Bt) cotton in the 1990s provided a tool and an opportunity to completely eradicate the pink bollworm. This cotton contains a protein that is toxic only to the larvae of moths. In most areas, the only plant that pink bollworm eats is cotton, so widespread planting of Bt cotton puts tremendous pressure on the pest.
In 2002, the USDA started the cooperative Pink Bollworm Area-Wide Eradication Program across the western U.S. and northern Mexico, wherever cotton was grown. The planting of pure stands of Bt cotton (called 100% Bt cotton) was added to the other control measures already in place. When the CDFA PBW Program joined the USDA Program in 2007, the effect of the Program was rapid and dramatic, as shown in the bar chart (above).
cotton region. By 2008, the number dropped to about 16,000, a 96% reduction in a single year. California’s last moths were caught in 2011, when one was trapped in Southern California and one in the San Joaquin Valley. California has had zero PBW moths since then, and all western states and northern Mexico reached zero moths in 2013.
The pink bollworm (PBW) is a worldwide pest of cotton, often the key pest in many places. In the U.S., PBW has been the second most important cotton pest, behind the boll weevil.
The adults of the PBW species lay eggs on cotton bolls; once hatched, the larvae eat the seeds and damage the fibers of the cotton, reducing the yield and quality.
From the beginning, PBW response efforts focused on techniques other than standard insecticides. At first, it was cultural methods, especially making sure that every field was plowed under shortly after harvest and kept clean for a few months to remove any cotton plant parts where the insect could survive through the winter. Then, pheromones were used to keep the moths from being able to find mates. The early 1970s added the release of sterile PBW moths to prevent egg-laying by wild moths. Together with intensive trapping, these techniques kept the moth from ever becoming established in the San Joaquin Valley, where most of the state’s cotton is grown.
2006 2007 2008 2009 2010 2011 2012 2013 2014 2015
400k
350k
300k
250k
200k
150k
100k
50k
0
Eradication Program begins in California
Pink Bollworm Moths Captured in Southern California Traps
15,787 6,099 134 1 0 0 0 0
Peak: 416,765 moths
29 By the Numbers: The California Department of Food & Agriculture
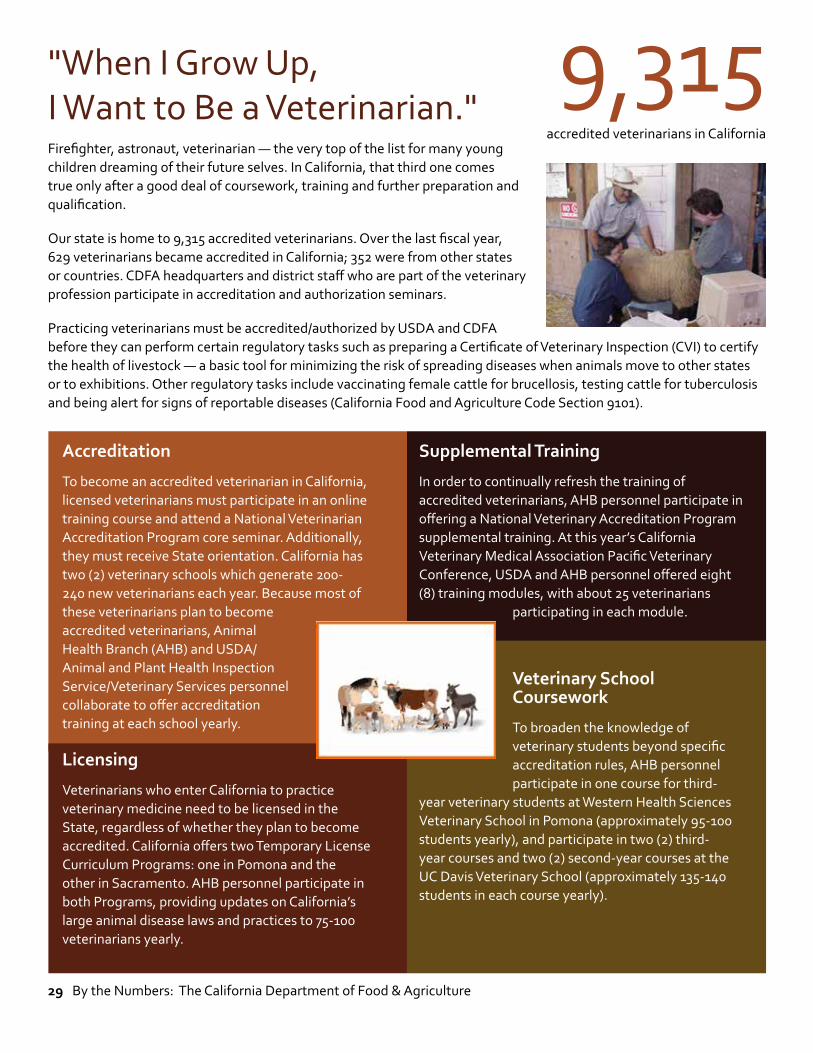
"When I Grow Up, I Want to Be a Veterinarian."Firefighter, astronaut, veterinarian — the very top of the list for many young children dreaming of their future selves. In California, that third one comes true only after a good deal of coursework, training and further preparation and qualification.
Our state is home to 9,315 accredited veterinarians. Over the last fiscal year, 629 veterinarians became accredited in California; 352 were from other states or countries. CDFA headquarters and district staff who are part of the veterinary profession participate in accreditation and authorization seminars.
Practicing veterinarians must be accredited/authorized by USDA and CDFA before they can perform certain regulatory tasks such as preparing a Certificate of Veterinary Inspection (CVI) to certify the health of livestock — a basic tool for minimizing the risk of spreading diseases when animals move to other states or to exhibitions. Other regulatory tasks include vaccinating female cattle for brucellosis, testing cattle for tuberculosis and being alert for signs of reportable diseases (California Food and Agriculture Code Section 9101).
9,315 accredited veterinarians in California
Accreditation
To become an accredited veterinarian in California, licensed veterinarians must participate in an online training course and attend a National Veterinarian Accreditation Program core seminar. Additionally, they must receive State orientation. California has two (2) veterinary schools which generate 200-240 new veterinarians each year. Because most of these veterinarians plan to become accredited veterinarians, Animal Health Branch (AHB) and USDA/Animal and Plant Health Inspection Service/Veterinary Services personnel collaborate to offer accreditation training at each school yearly.
Licensing
Veterinarians who enter California to practice veterinary medicine need to be licensed in the State, regardless of whether they plan to become accredited. California offers two Temporary License Curriculum Programs: one in Pomona and the other in Sacramento. AHB personnel participate in both Programs, providing updates on California’s large animal disease laws and practices to 75-100 veterinarians yearly.
Supplemental Training
In order to continually refresh the training of accredited veterinarians, AHB personnel participate in offering a National Veterinary Accreditation Program supplemental training. At this year’s California Veterinary Medical Association Pacific Veterinary Conference, USDA and AHB personnel offered eight (8) training modules, with about 25 veterinarians
participating in each module.
Veterinary School Coursework
To broaden the knowledge of veterinary students beyond specific accreditation rules, AHB personnel participate in one course for third-
year veterinary students at Western Health Sciences Veterinary School in Pomona (approximately 95-100 students yearly), and participate in two (2) third-year courses and two (2) second-year courses at the UC Davis Veterinary School (approximately 135-140 students in each course yearly).

The California Department of Food & Agriculture: By the Numbers 30
CDFA’s Animal Health BranchKeeping Foreign Animal Diseases Off our Farms, Out of our Food ChainCalifornians are accustomed to a safe, reliable food supply. That’s no accident; it’s a comfort level that is based on decades of dependability. CDFA’s Animal Health Branch has helped accomplish and preserve this stability by focusing on its number-one priority: excluding foreign animal diseases from California’s food chain.
39 investigations into possible introductions of foreign animal diseases in 2015
Animal Identification: “Tag, Track, Trace” for disease response readinessOfficial identification is required for most livestock moving between states or nations. CDFA’s Animal Health Branch (AHB) is responsible for the distribution of certain official identification tags including National Uniform Eartagging System (NUES) silver “brite” tags, NUES orange brucellosis tags, USDA backtags and swine plastic NUES tags. The AHB tracks these as well as official tags distributed by USDA, including scrapie tags, and tags distributed directly from private companies to producers, including Animal Identification Numbering (AIN) System “840” tags. These “840” tags can be either a radio frequency tag or a visual ID tag.
2015 Official Animal ID Tag Distribution
AIN AIN Brucellosis NUES Scrapie Swine USDA 840 tags Brucellosis NUES orange tags Silver "brite” tags Plastic NUES Tags Backtags
1,362,979 5,300 866,377 150,841 133,856 237 595,000
EARLY DETECTION Case-In-Point: Avian InfluenzaIn January 2015, a positive case of highly pathogenic avian influenza (HPAI) (H5N8) was detected in a Stanislaus County commercial poultry flock. Another positive HPAI (H5N8) commercial flock in Kings County was found in February, and in March a Merced County farm tested positive for low pathogenic avian influenza (LPAI) (H7N3) resulting in California’s third incident response for the year. In each case, the disease introduction most likely resulted from migrating wild birds along the Pacific Flyway; no lateral disease spread was detected from those sites. California officials credit early disease detection through proactive surveillance by farmers, veterinarians and agricultural officials, as well as good on-farm biosecurity practices, as key factors that prevented a much larger outbreak.
In 2015, CDFA staff conducted 39 investigations into possible introductions of foreign animal diseases such as foot-and-mouth disease (FMD), vesicular stomatitis, avian influenza and Schmallenberg virus. We work daily with our federal and foreign counterparts to keep diseases out when food, feed and livestock come in – but diseases can also be introduced by wild and migrating birds and animals, for example. That’s why we also must be vigilant inside our state to detect outbreaks early and respond swiftly. Most of this work happens in relative silence, but it is important work nonetheless, protecting not only our food
supply but also animal health and, in some cases, even public health.

31 By the Numbers: The California Department of Food & Agriculture
Backyard Birds: Sentinels for Disease
7,777wild waterfowl were tested for avian influenza in 2015 by the California Animal Health and Food Safety Laboratory System (CAHFS). Farmers and veterinarians keep a close eye on their poultry flocks, maintaining strict biosecurity systems and measures to prevent the introduction and transmission of disease. California’s migratory waterfowl, backyard birds and other bird populations serve as sentinels when they are tested for diseases that could impact California’s food supply.
33,559samples were tested by CAHFS labs in 2015 that were submitted by 2,336 veterinarians and 9,645 animal owners. The system works best when farmers, ranchers, veterinarians and backyard bird owners all participate.
CAHFS Labs: The Key to California's Animal Disease Surveillance, DetectionThe California Animal Health and Food Safety Laboratory System (CAHFS) is often the first line of defense protecting the health of our state’s livestock and poultry, and safeguards our public health and food supply. With four locations strategically located throughout California, CAHFS provides rapid and reliable diagnoses for animal diseases and dairy food safety. The labs operate in partnership with the CDFA, veterinarians, and livestock and poultry owners.
CAHFS plays a critical role in early surveillance to detect foreign and emerging diseases such as avian influenza (AI) and foot-and-mouth (FMD) disease. CAHFS – a public service unit of the UC Davis School of Veterinary Medicine – has an outstanding record of discovering emerging diseases and developing new and improved diagnostic methods. Most recently, in 2015 CAHFS helped detect the worst outbreak of AI in US history. Due in part to early detection of AI from routine submissions to CAHFS, CDFA was quickly notified of all three 2015 domestic poultry AI detections and was able to achieve rapid containment.
In 2015, CAHFS labs:
• Tested 37,934 samples for avian influenza, including 2,887 samples for avian influenza outbreak response; 7,777 samples for wild waterfowl surveillance, and 25,929 samples from domestic birds.
• Provided diagnostic support for 39 official foreign animal disease investigations, testing samples from animals with suspicious symptoms.
• Tested 1,274 retail dairy products for food pathogens, and detected Campylobacter, Listeria, or Staphylococcus in a small number of them.
• Accepted 33,559 submissions from 2,336 veterinarians and 9,645 animal owners throughout California.
• Did secondary testing for bovine tuberculosis on 1,021 cows.
• Provided 110 presentations at 48 meetings and conferences, sharing new information with animal health officials, veterinarians and animal owners.
• Tested 34,838 samples for pathogens classified as potential bioterrorism agents or toxins that have the potential to endanger public health.
• Performed 508,886 tests on 496 animal species.
• Tested 902 animal feed samples for the presence of toxic agents including poisonous plants such as oleander and common groundsel, and chemical contaminants such as monensin in horse feed.

The California Department of Food & Agriculture: By the Numbers 32
Monitoring Livestock HealthProtecting California herds by permitting, testing and vaccinationIn 2015, CDFA issued permits for animals entering California from 43 states and Canada for a total of 7,262 permits representing 666,065 head of livestock. Most cattle, sheep, goats and swine require an Interstate Livestock Entry Permit. The graph below shows the number of animals entering under permit by month.
These numbers do not include the number of beef cattle that move on the special entry permits to pasture temporarily out-of-state and return to California. In 2015, we issued 195 of these “Pasture to Pasture Permits” (136 with Oregon, 51 with Nevada, and eight with Idaho) for 98,244 head of breeding beef cattle.
Permits are issued and reviewed by AHB staff. They are valid for 15 days. The permits for the highest risk shipments, such as animals from a state with a known disease outbreak, are followed up once the animals arrive in the destination AHB district.
666,065head of livestock entered California in 2015 under
7,262 permits issued to ranchers and veterinarians

33 By the Numbers: The California Department of Food & Agriculture
Good Data is Accessible DataAnimal Health office’s ambitious data development project is paying dividends
What once were separate, “siloed” collections of data relevant to each of CDFA’s Animal Health programs, are now a comprehensive integrated data library shared via a massive, relational web-accessible database – the Emerging Threats (ET) Data System. It began as an ambitious project several years ago to herd a combination of heavily overlapping data, separately maintained by Animal Health and Milk and Dairy Food Safety Branches, into a single system serving both Branches simultaneously. The system has since added large sets of data from our Livestock Identification and Meat, Poultry and Egg Safety Branches. This consolidation provides crucial access to data relevant to AHB’s surveillance and disease prevention efforts against foreign animal diseases such as foot and mouth disease (FMD) and highly pathogenic avian influenza (HPAI).
The database consists of core demographic premises and business operation records used by all programs, coupled with specific, task-oriented data used by individual AHFSS branches, including AHB programs for their day-to-day activities and responsibilities. The first round of AHB-specific modules developed for the ET data system included bovine TB and brucellosis herd testing and follow-up case management modules, along with an Animal Disease Investigation Module that documented and reported on individual suspect cases coordinated by AHB district offices.
More recently, modules have been developed and added to the system supporting brucellosis vaccine distribution, food waste management, bovine trichomonosis testing and case management, animal movement permitting and identification compliance, and AHB outreach. Additionally, a legacy data system for the Equine Medication Monitoring Program (EMMP) has been rebuilt and incorporated into the SQL-Server environment with a tablet-based component for field testing due to come online in the near future.
Animal Health Branch
Data
Milk and Dairy Food
Safety Branch Data
Livestock Identification
Branch Data
Meat, Poultry and Egg Safety
Branch Data
Shared, accessible disease-surveillance data strengthens disease prevention capabilities
We recently completed an Avian Influenza Surveillance Module. It has facilities to collect and report bird sampling submissions and results from the laboratory, as well as regular inspections of Live Bird Markets and suppliers. Longer-range plans for 2016 include a module to generate and electronically enter data, where possible, from Certificates of Veterinary Inspection (CVI). This is crucial for analyzing the interstate movement of livestock and a necessary component of our ability to trace animals’ movements for disease investigation purposes.
Besides the ET database, the AHB was the first branch in the division to create a web-accessible database to track daily activities of AHB staff statewide (AHB Time Tracker) to provide oversight and documentation of staff work efforts and funds expended in accordance with our cooperative funding agreements with USDA and other funding sources. Other branches and programs have adopted similar systems after the success of the AHB system was demonstrated.
Efforts are on-going to improve the accuracy and ease of analyzing the Time Tracker data.

The California Department of Food & Agriculture: By the Numbers 34
Focus on Food Safety at California's Meat, Poultry and Egg FacilitiesMost meat processing facilities are inspected by federal agencies. The Meat, Poultry and Egg Safety Branch (MPES) provides oversight in plants that are exempt from federal inspection to ensure that meat and poultry products are wholesome, unadulterated and properly labeled. The branch also ensures that meat and poultry products not intended for human or pet consumption do not enter the food supply. In addition, MPES inspects and regulates egg quality and production at wholesale and retail levels.
• MPES licenses and inspects 362 meat, poultry, rendering and pet food-related operations. MPES registers 334 Transporters of Inedible Kitchen Grease (IKG). In 2015, IKG transporters were issued 1,366 decals for their vehicles. MPES conducts periodic reviews of 209 establishments exempt from mandatory USDA inspection under a cooperative agreement with USDA. MPES trains and licenses 466 industry-employed inspectors who enforce state laws in meat and poultry slaughter and processing plants.
• MPES conducted 3,296 routine inspections of licensed operations in 2015. MPES conducted 55 annual humane slaughter reviews in livestock and poultry slaughter plants in 2015. MPES conducted 676 reviews of USDA-exempt plants in 2015.
• Investigators issued 25 Notices of Violation (NOV) in the Rendering Enforcement Program (REP) in 2015. As a result of these NOVs, civil penalties were levied that totaled $96,070. There were four licenses/registrations revoked or denied in 2015. Several NOVs were issued in 2015 for illegal livestock and poultry slaughter and processing.
• MPES conducted 30 mandatory annual maintenance training sessions for industry inspectors in 2015. Numerous training sessions were provided to
county environmental health agencies and investigators in the REP provided outreach training to local law enforcement and
other agencies on 29 occasions in 2015.
• Annual license fees charged to meat and poultry plants and
industry inspectors totaled $166,650 in 2015. Annual
license, registration and enforcement fees charged to renderers, collection centers and IKG transporters totaled $497,740 in 2015.
The MPES Branch licenses
362 meat, poultry, rendering
and pet food-related operations.
MPES conducted
3,296 routine inspections of licensed operations in 2015.

35 By the Numbers: The California Department of Food & Agriculture
Egg Safety & Quality Management Program Quality, origin, grade and size are just the beginningThe Egg Safety and Quality Management (ESQM) Program within MPES regulates shell eggs and egg products produced, shipped, or sold in California. We check the eggs and products for quality, origin, grade, and size. ESQM also ensures eggs have been properly handled, labeled, transported, refrigerated; and are wholesome and safe to eat.
ESQM registers anyone engaged in the production, sale, or handling of shell eggs or egg products in California. Our personnel inspect shell eggs and egg products at production, packing, distribution, and retail facilities. ESQM also oversees the inspection activities of contracted county personnel, conducts shell egg surveillance under contract with the United States Department of Agriculture (USDA), conducts Egg Safety Rule inspections under contract with the Food and Drug Administration, performs California Egg Quality Assurance Program inspections at productions facilities, and conducts outreach activities aimed at educating small-flock egg producers and others about egg quality and food safety.
• California has 14,577,590 layers in its registration records, including large producers with 3,000 or more birds as well as many smaller producers. California ranks 7th in the nation for shell egg production.
• ESQM and county personnel inspected 214,887 dozen eggs at retail stores throughout California last year and rejected 25,259 (12%) dozens for various Food and Agricultural Code violations primarily due to date code violations (past 30 days), followed by labeling violations, and to a lesser degree, quality defects.
300 Shell Egg Food Safety (SEFS) inspections were completed last year. Of those, 205 were out-of-state and 95 were in-state.
• ESQM and county personnel inspected 2,624,970 dozen eggs at production and 4,142,550 dozen eggs at wholesale/distribution facilities. Currently, 40% of the shell eggs consumed in California are produced in California. The other 60% are imported from other states including Iowa, Ohio, Indiana, Pennsylvania, Texas, and Michigan.
14,577,590That's how many "layers" (egg-laying hens) are registered in California.
68.51 gramsis the
minimum weight for a "jumbo"
size egg. A small egg must weigh 40.16 grams. The grade
of a shell egg is determined by the size of its internal air-cell. As an egg
ages, the liquid contents evaporate through its pores. The larger the air-cell, the lower the egg will be graded. The outer appearance also factors into the
grade. Eggs with moderate staining (but not adhering dirt) may be sold as
grade "B." All other grades require a clean, unblemished shell.
Dirty eggs cannot be sold to consumers.
2,286 egg handlers are registered with CDFA/ESQM. Of those, 875 are
out-of-state and 1,411 are in-state.

The California Department of Food & Agriculture: By the Numbers 36
The Bureau of Livestock Identification (BLI) protects cattle owners in California against loss of animals by theft, straying or misappropriation. We have four offices, but that’s not where we spend the bulk of our time. At the Bureau of Livestock Identification (BLI), our employees include the Branch Chief, four Agriculture Program Supervisors, one Brand Registrar, three Senior Brand Inspectors, 45 Brand Inspectors, three regional Agriculture Aides, and eight support staff. The fields, pastures, feedlots and auction yards are where we do most of the work.
We register brands for cattle, horse, burro, and sheep; we inspect cattle for lawful possession prior to movement, sale or slaughter; and we assist local law enforcement with investigations and prosecutions involving theft. The state’s brand registration and inspection program is entirely financed through brand registration and inspection fees paid by the livestock owners.
In 2015, those tasks included reuniting 449 stray animals with their owners. Frequently, the Bureau also holds animals that are offered for sale because the seller does not present proper proof of ownership. Last year, for example, the Bureau returned 172 of these cattle to their proper owners — those livestock had a market value of $214,690.
Brands: We conducted inspections and investigations in approximately 3,500 locations in 2015. With a total of 871,771 miles traveled – approximately 72,648 miles per month, over some very rough terrain – this is clearly not your average daily grind.
The State of California has been recording brands since 1917. Since that time, 175,014 brands have come on the books. Currently, there are 22,145 active brands. The oldest brand still active is brand number A000002, the “Circle C” design originally registered to R E Jacks Company on September 26, 1917. It was transferred to Hearst Corp on November 14, 1966. The number of active brands has remained relatively stable over the last several years. Approximately 1,000 brands cancel and 1,000 new brands are recorded each year.
Yep. It's 2016, and cattle rustling is still a thing...Just one of several reasons ranchers - and consumers - need our Bureau of Livestock ID
24/724 hours a day, 7 days a week, rain or shine, our Brand Inspectors are available to the public. You might say that’s as much a matter of pride as it is a standard of service.
Branding Diagram

37 By the Numbers: The California Department of Food & Agriculture
Data Simplifies Enforcement: The Bureau’s mobile app has an enforcement component that records stolen cattle. Once the brand of the stolen cattle has been recorded on the mobile app and the brand inspector has synced his device, whenever another brand inspector throughout the state inspects cattle that have the stolen brand, a popup will appear on-screen to alert them. The mobile app also records payments for inspection and will also allow any inspector to collect an outstanding balance.
In the short time that the Mobile Inspection App has been active, Inspectors have issued 49 Notices of Violation for canceled brands for a total of $11,540 in penalties.
Investigations: In 2015 the BLI was involved with the Sheriff’s Departments of Kern, San Joaquin and Tulare counties in the arrest of 14 people for the theft of cattle, medicine and powdered milk. The Bureau also recovered 32 head of cattle in these cases. The Bureau used DNA testing to confirm parentage in one of these cases. The Bureau takes all of its DNA samples to the forensic lab at the University of California, Davis. The Bureau was also involved with Tehama County on an animal cruelty case where 48 cattle were confiscated. All of these cases continue in various stages of the criminal court system.
In 2015 the Bureau issued 144 Notices of Violation for such offences as buying and selling cattle without brand inspection, shipping cattle across state lines without inspection, using an unrecorded or cancelled brand, and shipping undeclared strays to a destination inspection point. Violation fees paid to the Bureau totaled $25,241.
Brand Inspection? There's an app for that.Picture a cowboy on horseback, checking an iPad to see if the brand matches. That's us.
...and cattle drives, too.
A modern-day cattle drive in Modoc County, California.
We may work in the Wild West, but that doesn't mean we don't know our way around an iPad. In February 2015, the Bureau released a brand new Mobile Inspection Application to run on iPads. The new App has greatly increased BLI’s accuracy, efficiency and speed. Data is transmitted between headquarters and the field staff on a daily basis. Recently, BLI also released a Brand Book Lookup app that allows inspectors to get data on brands in real-time. The original Brand Book Lookup app for Apple mobile devices will soon also be available for all mobile platforms, as well as a web version. The Advisory Board for the Bureau has authorized the release of this free Brand Book Lookup app for use by law enforcement, financial agencies and the public as well. Finally, BLI has introduced an interactive Inspector Map to replace the old Inspector Directory. The map allows a user to click on any county and receive a list of Brand Inspectors that cover that area, including the city the inspector lives in as well as their contact information.
Inspection fees paid by livestock owners in 2015 totaled $3,975,387. That represents approximately 3,442,251 head of cattle inspected.
about $1 a cow.
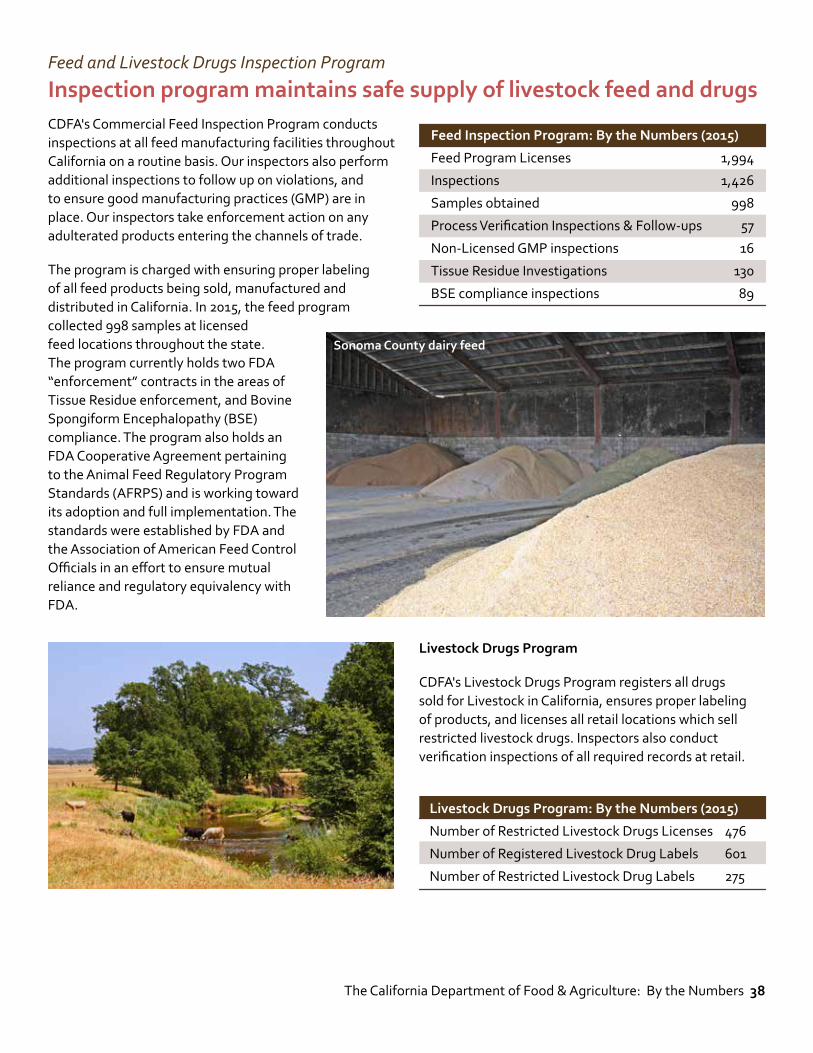
The California Department of Food & Agriculture: By the Numbers 38
Feed and Livestock Drugs Inspection Program
Inspection program maintains safe supply of livestock feed and drugs
Livestock Drugs Program
CDFA's Livestock Drugs Program registers all drugs sold for Livestock in California, ensures proper labeling of products, and licenses all retail locations which sell restricted livestock drugs. Inspectors also conduct verification inspections of all required records at retail.
Livestock Drugs Program: By the Numbers (2015)
Number of Restricted Livestock Drugs Licenses 476
Number of Registered Livestock Drug Labels 601
Number of Restricted Livestock Drug Labels 275
CDFA's Commercial Feed Inspection Program conducts inspections at all feed manufacturing facilities throughout California on a routine basis. Our inspectors also perform additional inspections to follow up on violations, and to ensure good manufacturing practices (GMP) are in place. Our inspectors take enforcement action on any adulterated products entering the channels of trade.
The program is charged with ensuring proper labeling of all feed products being sold, manufactured and distributed in California. In 2015, the feed program collected 998 samples at licensed feed locations throughout the state. The program currently holds two FDA “enforcement” contracts in the areas of Tissue Residue enforcement, and Bovine Spongiform Encephalopathy (BSE) compliance. The program also holds an FDA Cooperative Agreement pertaining to the Animal Feed Regulatory Program Standards (AFRPS) and is working toward its adoption and full implementation. The standards were established by FDA and the Association of American Feed Control Officials in an effort to ensure mutual reliance and regulatory equivalency with FDA.
Feed Inspection Program: By the Numbers (2015)
Feed Program Licenses 1,994
Inspections 1,426
Samples obtained 998
Process Verification Inspections & Follow-ups 57
Non-Licensed GMP inspections 16
Tissue Residue Investigations 130
BSE compliance inspections 89
Sonoma County dairy feed

39 By the Numbers: The California Department of Food & Agriculture
Parting Shot: California's FairsThe first fair sanctioned by the State of California began more than a century and a half ago. A shift in recent years away from a governance model drawing from the state's General Fund has sparked a transformation in our local fairs, with the goal of achieving a greater focus on the invididuality of local agriculture and the character of each local community. CDFA has presided over the transition and has guided and advised fair boards as they consider their options.
It is a time of discovery and reinvention for many fairs, but throughout this period our network of California fairs has maintained its role as a cornerstone of California's diverse communities. Californians continue to embrace their fairs, and our fairgrounds have evolved to become sites for many other important local events and occasions - including staging crews and equipment for wildfire response and other emergencies and natural disasters. California's fairs are evolving with their communities, so their future remains bright.
17fires in 2015 required
the use of fairgrounds to stage emergency
crews and equipment or to evacuate
residents, pets and livestock.
6,705acres make up the permanent
fairgrounds of the California Network
of Fairs.8,805,014 people went
to their local fair in 2014.
787,833 people attended
the 2015 State Fair, up 5 percent - the
third straight year of growth.
97 percent of those folks said they are likely to
attend the fair in the future.
State Fair standbys like livestock judging and horse racing now share the stage with
drone racing, celebrity chef tie-ins and a
wave of social media activity.