Embed Size (px)
Citation preview

1
By The Way: who was right?
Short-term effects of VAT-raise on
commercial theater in The Netherlands
Student
Yfke Koolhaas
#336213
Erasmus University Rotterdam
Erasmus School of History, Culture and Communication (ESHCC)
Date
June 5th
2013
Supervisor
Dr. B.J. Langenberg
2nd
reader
Dr. F.R.R. Vermeylen

2
SUMMARY
The subject of this master thesis refers to the discussion in The Netherlands on the strong
negative effects of increasing value added tax (VAT) in the performing arts sector. This thesis
takes part in this discussion by answering the main research question:
What were the short-term effects of VAT-raise on commercial theater producers in The
Netherlands?
Also the title contains a question: who was right? This question refers to the difference in
point of view by the government and a research company Ape. The government intended to
increase income from VAT on the performing arts sector by raising it from 6% to 19%,
whereas Ape stated increasing income from VAT to the government would be impossible
because demand for performing arts would decrease too much due to this VAT-raise.
This thesis is set up in three parts. First a theoretical framework is set forth containing theory
on VAT on the market of commercial theater, consumer theory and the recent study by Ape
on the effects.
Then the hypothetical outcomes are given, based upon the theoretical framework, and
the methods and data that are used to test these hypotheses are described.
Finally, the results of this research are set forth per hypothesis, which then provide an
answer to the main research question and a winner of ‘the battle’.
Theory
In chapter two the market of commercial theater in The Netherlands is described: it’s share on
the whole market for performing arts as well as particular market characteristics, the forming
of contracts, prices, price setting and the role VAT has played over the last decades. VAT is
tax that is included in prices paid by buyers of a product. In the performing arts sector there
are two kinds of buyers: theaters who buy performances at producers and consumers who buy
tickets at the theaters. Changes in VAT resonate through both these submarkets and influence
prices, demand and income. The ways in which VAT influences commercial theater

3
producers depends on the form of contract and the reaction of consumers to possible price
changes.
Therefore in chapter three theory of demand is set forth. This contains theory of
consumer behavior and is used to predict or explain reactions of consumers to price changes.
For every product a demand schedule can be drawn. However, for cultural products the
consumption depends on more than taste, income or prices of related goods. To explain which
other factors influence consumer decisions regarding consuming theater a model for cultural
participation is given. This chapter also explains the development of figures for price, income
and cross-price elasticities of demand. Demand for commercial theater depends on more than
just box-office prices. To investigate in which way and to what extend increased box-office
prices influence demand, a couple of factors need to be analyzed: box-office prices, changes
in demand, consumer income, prices of substitutes and the different demand elasticities.
In chapter four the effects that were forecasted by Ape (Goudriaan, 2010) are set forth.
To so the method and data of this research are first outlined. The results of this research show
that it was expected that box-office prices for commercial theater would increase with 12,3%.
Given the relatively strong price elastic character of commercial theater, demand would then
decrease with 13,5%. Income of producers would decrease equally, which would force a loss
in employment and a decrease in spending in other sectors. These effects together would
result in a disappointment for the government: the increase in income from VAT on
performing arts would fall 20% short of the 45 million Euros that were hoped for.
Hypotheses
Based on this theoretical framework five hypotheses are given:
1. Box-office prices for commercial theater productions have increased after the VAT-raise.
2. Demand for commercial theater decreased due to the VAT-raise.
3. Commercial theater producers experienced negative effects on income of the VAT-raise.
4. Employment at commercial producers has decreased due to the VAT-raise
5. The intended raise in income to the Dutch government from VAT was not met during the
first year.
Method and data
While this master thesis was developed, new secondary data was presented in November
2012. That rapport (Blankers et al., 2012) on the effects of the economic crisis on cultural
sectors, forms a rich source for quantitative data which can be used to analyze the effects of

4
the VAT-raise. Then three commercial producers are confronted with these effects and asked
for their experiences and opinion. These case-studies form the qualitative base for explaining
the ways through which the quantitative data should be analyzed and for explaining the found
effects.
Results
What is found is that box-office prices have not increased with the full percentage that was
needed to capture the VAT-raise. The decrease in demand cannot be contributed to the VAT-
raise, because demand for commercial theater had already been decreasing and the found
figures for price elasticity of demand are not use1ful since they are not calculated using box-
office prices but average income per visit to the producer. Income of producers has
experienced negative effects of the VAT-raise, because box-office prices were not raised
enough, so theater and producers had to partially capture the VAT-raise in their own income
from box-office sales. Although employment depends on income at companies, a change in
employment in the first season after the VAT-raise cannot be contributed to this raise, because
developments in employment follow developments in income and a change in employment
would therefore be revealed during the following season, for which no data is available yet
and VAT has been decreased to 6% again. Last but not least, this thesis shows that the
government did not overestimate the increase income from VAT on the performing arts sector
by the raise from 6% to 19%.
Conclusions
Two short-term effects of the VAT-raise on commercial theater producers were determined:
an increase in box-office prices and a decrease in income to the producer.
Box-office prices did increase with 7,32% after the VAT-raise. This was not enough to
keep the VAT-raise from affecting income to the producer. Demand for commercial theater
decreased, but this decline had already been set in years before and was not enlarged after
VAT increased. Therefore this decrease in demand cannot be contributed to the VAT-raise.
Due to the combination of decreasing demand, an increase in box-office prices that
was not enough to cover the VAT-raise and to the fact that per visit more VAT had to be paid
during season 2011/12 than before, income to producers has been affected negatively by the
VAT-raise.
A decrease in employment has not been noticed yet. Employment follows trends in a
company’s or sector’s income, therefore the effects on employment could be revealed in
5
season 2012/13. However, VAT has been lowered to 6% again and the effects on employment
will have been diminished.
Demand for commercial theater has not decreased as much as was expected and
although it is unknown by how much income from VAT on performing arts to the government
has increased exactly due to the VAT-raise, the calculations in this master thesis lead to the
conclusion that the 45 million ‘goal’ was met and the government has won the battle.
6
PREFACE
Writing this master thesis taught me more than ‘just’ the effects of increasing VAT on
commercial theater producers. At work at a commercial theater producing company, I have
followed and experienced the effects of the VAT-raise up closely. The emotional effects are
sometimes even stronger than financial effects, therefore it was very interesting to analyze the
data that show changes and trends in the theater sector. I also got confronted many times with
the ‘political game’ that increasing VAT was apparently a part of, which explains the
emotional reactions. I would like to thank the three producers that made time to explain their
experiences.
On an academic level this ‘last assignment’ finally taught me to really dig deep, stick
to a subject and get to know all about it. Obviously I would never have gotten to this master
thesis if I had not invested in all the essays and exams before, but never before have I invested
so much, waited this long, until I got the result I wanted. Many people around me have had to
be very patient. I thank my colleagues, my boss, my friends, my father and my two ‘little’
brothers for that. Most of all I want to thank my mother for her never ending faith in me and
support since the first day I went to school and she realized (quote) ‘we were at the beginning
of a very long road’.
While writing this thesis, I realized how much fun combining academic research and
practical experience can be. I am sure I had never realized this, had my supervisor not been
Berend Jan Langenberg. I am very grateful for his time, knowledge (both practical and
academic), enthusiasm, coffee, support, jokes and interest.
Yfke Koolhaas
Amsterdam, June 2013

7
TABLE OF CONTENTS
Figures and tables 9
Concepts 10
1. Introduction 12
2. VAT and Theater
2.1. Introduction 14
2.2. The market 15
2.2.1. Market characteristics 15
2.2.2. Estimated market size of the VVTP 16
2.2.3. Contracts 18
2.2.4. Prices and price setting 19
2.3. Value added tax and theater in The Netherlands 22
2.4. Conclusion 26
3. Theory of demand
3.1. Introduction 27
3.2. Demand schedule 28
3.3. A model for cultural participation 29
3.4. Consumer tastes 30
3.5. Consumer income 32
3.6. Prices of related goods 34
3.7. Elasticities of demand 36
3.7.1. Price elasticity of demand 36
3.7.2. Income elasticity of demand 37
3.7.3. Cross-price elasticity of demand 37
3.6. Conclusion 38
8
4. Forecasted effects of VAT-raise
4.1. Introduction 39
4.2. Method and data 39
4.2.1. Remark 40
4.2.2. Model 40
4.3. Results 41
4.4. Conclusion 43
5. Hypotheses 44
6. Method
6.1. Introduction 49
6.2. Case-study design 49
6.3. New information 50
6.4. Data 51
6.5. Data collection per hypothesis 51
7. Results 54
8. Conclusions 67
Further research 70
Bibliography 71
APPENDICES
Appendix A: demand elasticities
Appendix B: interview schedule
Appendix C: interview producer A
Appendix D: interview producer B
Appendix E: interview producer C
Appendix F: summary in Dutch

9
FIGURES AND TABLES
Number Title Chapter Page
Figure 1 The Dutch cultural sector 2.1. 14
Figure 2 Production chain of theater 2.2.1 15
Figure 3 Income from box-office sales 2.2.4. 20
Figure 4 From box-office price to average income per visit 2.2.4 21
Figure 5 Changes in VAT on performing arts (timeline) 2.3. 24
Figure 6 Demand for theater tickets 3.2 28
Table 1 Model for cultural participation 3.3 29
Figure 7 Indifference Curves 3.4. 31
Figure 8 Indifference Curves with budget lines 3.5 33
Figure 9 Changing budget 3.6 35

10
CONCEPTS
An alphabetical list of most used concepts and the way they are defined in this research.
Groups of organizations
VVTP
Short for ‘Vereniging Vrije Theaterproducenten’: the association for commercial theater
producers in The Netherlands
VSCD
Short for ‘Vereniging van Schouwburg- en Concertgebouwdirecties’: the association for
managers of theaters and concert buildings in The Netherlands.
VVEM
Short for ‘Vereniging van Evenementenmakers’: the association for organizations of events,
mainly music events and festivals.
Commercial producers
Non-subsidized theater producers. Not all commercial producers are VVTP-members, but all
VVTP-members are commercial theater producers.
Theaters
All theaters in The Netherlands. Not all theaters are connected to the VSCD, but in the theater
sector VSCD-theaters make up for the main part of the market by far.
Market terms
Purchase market
The market where producers are suppliers, theaters are buyers and theater productions are the
products.

11
Consumption market
The market where theaters are suppliers, visitors are consumers and theater performances are
the products. In this thesis, visitors are referred to as consumers.
Box-office prices
The prices consumers pay at theaters’ box-offices.
Average income per visit
The average income producers or theaters receive per visit after VAT over box-office income
has been paid and the negotiated division has been done.
Suppliers
Can be both theaters and producers. Theaters supply to the consumers on the consumption
market, producers to the theaters on the purchase market
Fte’s
Fulltime-equivalent: a unit that indicates the workload.
VAT
Value added tax.

12
1. INTRODUCTION
It is spring 2013 at this date of writing. Two years ago the Dutch government decided to
increase value added tax (VAT) on the performing arts. The reason to do so was to increase
income to the government from tax. This measurement caused a lot of commotion, not only
within the performing arts sector itself, also on a national level. From national media the main
question read out is: why should the performing arts sector receive the benefit of a lower
VAT-rate, especially at times of economic crisis?
The question that afflicted the performing arts sector was: is it conscientious to
increase VAT on performing arts, while keeping it at a lower level for products of other arts
sectors, for example movies? This question sent a group of performing arts organizations to
court, where they asked that the VAT-raise in their sector should be forbidden. Their request
was denied and at the 1st of July 2011 VAT on performing arts was increased from 6% to
19%.
As soon as the intention to increase VAT was declared, the Dutch Association of
Commercial Theater Producers (in Dutch: Vereniging Vrije Theaterproducenten; in short:
VVTP) had asked research company Ape to investigate the effects this measurement would
have on commercial theater producers. In November 2010, more than half a year before the
VAT-raise was and at a moment where it was still not sure whether it really would be
implemented, Ape’s researcher René Goudriaan published a rapport which forecasted four
effects. The VAT-raise would cause a raise in average income per visit to the producer, a
decrease in demand for commercial theater, a decrease in income of commercial theater
producers and therefore a decrease in spending in other sectors by the producers themselves.
Besides, Goudriaan concluded, the intended increase in income to the government from VAT
on performing arts, would not be met.
A couple of months later it was clear that VAT on performing arts would be increased
and by July 2012 it was. Surprisingly, one year later the measurement was reversed. By July
1st 2012 VAT on performing arts was lowered from 19% to 6%. The VAT-raise had therefore
only been applied for theater season 2011/2012.
Within this research it will be set forth which of the forecasted effects were experienced by
commercial theater producers and an answer to the main research question will be given:

13
What were the short-term effects of VAT-raise on commercial theater producers in The
Netherlands?
As seen in the title of this thesis, there is one other question: Who was right?. This question is
based on the statement, apart from the four effects on commercial producers, that the intended
financial goal of increased income from VAT on the performing arts sector, would not be met.
So, who was right? The government, that thought income from VAT from the performing arts
sector could be augmented by raising the VAT-rate? Or was Ape right, stating that demand
for commercial theater would keep decreasing and so would income from VAT to the
government?
Before answers to these questions can be given, more information on (1) the role of VAT in
the Dutch performing arts sector, (2) the ways in which consumers make their decisions and
(3) the effects that were forecasted by Ape is needed.
The following section (chapter 2) will outline the Dutch performing arts sector and the
role of VAT in this. Then consumer behavior will be set forth in chapter 3 using the theory of
demand, including the effect of (box-office) prices, income and prices of other goods on
demand for theater: demand elasticities. Once this broader view is provided, the research of
Goudriaan and its outcomes can be described (chapter 4) and put into context. Then, from this
theoretical framework, a couple of hypothetical outcomes to the main research question, can
be formulated (chapter 5). Chapter 6 will show how these hypotheses were tested, using
which method and data, and chapter 7 will show the results of this research. Finally, in the
concluding chapter, both the answer to which effects commercial theater producers have
experienced from the VAT-raise and to who was right, will be given.

14
2. VAT AND THEATER
2.1. Introduction
This research concentrates on the effects on commercial producers of a VAT-raise on
performing arts in The Netherlands. As figure 1 illustrates, commercial theater producers are
on the non-subsidized part of the Dutch theater market.
In this chapter the economic circumstances of commercial theater producers in The
Netherlands will be outlined: the market, the different contract forms, the way box-office
prices are determined and the role of VAT for performing arts. This broader view provides a
framework for the possible influence of changes in VAT for theater on commercial producers.
Figure 1: The Dutch cultural sector

15
2.2. The market
2.2.1. Market characteristics
The performing arts form one of many cultural sectors in The Netherlands (see figure 1). Not
only theater, also for example music performances and events are performing arts. Genres
classified as ‘theater’ are for example: dance, theater plays, stand-up comedy, musical, opera
and mime. The most explicit characteristic of the market for performing arts is differentiation.
Products, theaters, producers and consumer profiles are varied. Everything varies in size and
in costs and/or income (Goudriaan et al., 2008: 71). A classical music concert in a large
concert building with 100 musicians as well as a solo performance of a 20 year old actor in a
tent, are products of this market.
The overall theater market consists of two submarkets: the purchase market (in Dutch:
inkoopmarkt) and the consumption market (in Dutch: afzetmarkt) (Goudriaan et al., 2008: 70).
On the purchase market the suppliers are theater producers and buyers are the theater halls, on
the consumption market the theater halls are suppliers and the visitors are consumers. In The
Netherlands almost all theater productions tour: they move mostly daily from theater to
theater all across the country. Therefore all theaters are buyers of all producers and every
production will be staged more or less nearby the homes of consumers.
The production chain on the theater market is built up as follows (in the most simplistic
description):
Figure 2: Production chain of theater
Producers can be roughly divided into two categories: subsidized and non-subsidized
(see figure 1). However, subsidized is never completely (100%) subsidized and non-
subsidized, also referred to as commercial, theater is almost always partly and/or indirectly
subsidized. One example of indirect subsidies to commercial producers are subsidized

16
theaters purchasing commercial theater. Most theater halls in The Netherlands receive
financial support from a local government and through that are able to pay higher prices in the
form of guarantee sums (see 2.2.3.: contracts) to the producers than they would be without
subsidy. Other examples are: a drama writer receiving a grant to write a play which is then
produced by a commercial producer or a group of artists that receives financial support in the
form of subsidy, which then produces a show at a commercial producer. These methods of
financial support keep production costs to the producers at a lower level.
On both the purchase and the consumption market for theater the strength of suppliers
positions when it comes to price setting, vary according to the popularity of specific
productions. On the consumption market, the supplier (theater) will have to carefully set box-
office prices (see further: paragraph on prices and price setting).
On the purchase market, for every specific production there is only one producer.
Theater halls can influence the price setting by producers, although their influence is limited.
When a supplier raises the price of a production, a theater can decide not to purchase and
choose a substitute that approaches the first choice as much as possible (Langeveld, 2009:
106). When too many theaters decide not to purchase production A, but turn to other suppliers
for substitutes, the producer of A will be forced to lower its price (the requested guarantee
sum). The position of producers is strongest when selling a unique and very popular
production or solo artist. In that case, visitors will not be satisfied with a substitute and so will
theaters not be, since they are the suppliers on the consumption market.
2.2.2. Estimated market size of the VVTP
Nineteen1 commercial producers have subscribed to the Association for Commercial
Producers, the VVTP, in Dutch: Vereniging Vrije Theaterproducenten. According to their
mission statement, the VVTP is an interest group and concentrates on cooperation amongst its
members in order to stimulate efficiency and the creation of remarkable productions (VVTP,
2013). Not all commercial theater producers are a member of the VVTP, but all VVTP-
members are commercial theater producers (see figure 1).
1 The website www.vvtp.com opens with stating that there are fourteen members. However, the list of members,
on the same website, counts twenty one members. On the ‘VVTP-fair’, a day where all members come together
and present their plans for the next theater season (this year: February 28th
2013), nineteen members were
presented. Therefore it can be assumed that the front page, but also the list are outdated and that the VVTP
currently represents nineteen members.

17
Determining the exact share of the VVTP on the Dutch performing arts market market
is almost impossible since by far not all members provide data on for example number of
performances and attendance figures. In 2012 data was gathered at VVTP-members (Blankers
et al., 2012: 82). Eight2 VVTP-members provided data on attendance, which shows they
produced 6.025 performances during season 10/11 (Blankers et al., 2012: 82, 181). To
illustrate the share of VVTP-members on the theater market, these figures can be compared to
the figures for the same characteristics of the Association of Managers of Theater and Concert
Buildings (in Dutch: Vereniging Schouwburg- en Concertgebouw Directeuren; in short:
VSCD), the largest organization of theaters in The Netherlands (see figure 1). In 2010 the
VSCD housed 54.800 performances (Kleingeld, 2011: 6), in 2011 35.173 (Kleingeld, 2012:
7). Not all performing arts performances take place in VSCD-theaters. The VSCD estimates
its own market size at 55% out of total performing arts productions in The Netherlands
(Kleingeld, 2011: 5).
Since a theater season in The Netherlands runs from September the one year until June
the next, it can be expected that 1/4 of the number of performances in 2010 and 1/6 of this
number in 2011 took place in season 10/11. Therefore it can be expected that approximately
(0,4*54.800+0,6*35.173=) 43.024 performances took place at VSCD-theaters during season
10/11.
Not all, but nearly all3 VVTP-performances take place in VSCD-buildings. The 6.025
performances of the eight VVTP-members make up for 14,0 % of the performances at the
VSCD-theaters during season 10/11.
VVTP-members differ a lot in company size and therefore also in the number of
performances produced per season. Which members have supplied data is only known to the
research company and the average number of performances of these eight members is 7534.
Based on this figure it can be expected that all 19 members together produced approximately
14.307 performances during season 10/11. This makes up for 33,3 % of the total offer at
VSCD-theaters for season 10/11.
When the VSCD makes up for 55% out of total supply performing arts productions,
the total supply is approximately 78.225 performances during season 10/11 (including all
2 Nine VVTP-members provided data. However, data on attendance were useful from only eight members, on
attendance from only seven. 3 There are no data that explain this statement, it is based on my own work experience at a commercial producer
4 The commercial producer I work at produces almost 700 performances per year. The average number of
performances per producer calculated in this research therefore seems reasonable to take as an average number
for all VVTP-members.

18
performing arts genres; see figure 1). Then the market size of the VVTP on the Dutch
performing arts market can be estimated at 18,3%.
2.2.3. Contracts
Five general forms of contracts on the purchase market, between theaters and producers, are
distinguished:
1. Buy-out (in Dutch: uitkoop):
The theater pays the producer a negotiated fixed price and all box-office income goes
to the theater. In this way the financial risk lies with the theater: when box-office income
remains under the amount paid to the producer, the theater will experience a financial loss.
When box-office income exceeds the same amount, this profit goes to the theater (Langeveld,
2009: 112).
2. Split (in Dutch: partage):
At this form of contract, both income and risk are shared between theater and producer
by negotiated percentages. In some cases the sharing of box-office income starts at zero, but
in other cases a negotiated sum is paid by the theater to the producer. Other than buy-out
contracts the box-office income that exceeds this amount is shared between the theater and the
producer (Langeveld, 2009: 112). For example for one production the theater pays 3000 Euros
to the producer and they agree to a split of 80/20. Then the producer receives 80% of box-
office income with a minimum of 3000 Euros. If not enough tickets are sold to let the 80%
income to the producer be 3000 Euros, the theater will pay the difference, so experience a
financial loss for this production.
Therefore this form of contract knows two sub forms: ‘split’ (in Dutch ‘partage’) and
‘split with guarantee sum’ (in Dutch ‘partage plus garantie’).
3. Completion (in Dutch: suppletie)
With this relatively new found but increasingly used5 form of contract, the theater and
the producer agree to a maximum sum until which the division of box-office income runs. For
example when the theater and the producer agree to a completion with guarantee sum of 3000
Euros, split of 80/20 and a maximum of 6000 Euros, the producer will receive at least 3000
Euros but at most 6000 Euros. After enough tickets have been sold to let the 80% to the
producer be 3000 Euros, the meter starts running and it stops when 80% is 7000 Euros. After
this all box-office income goes to the theater.
5 Based on own work experience at a commercial producer

19
4. Rental (in Dutch: huur):
The producer rents out the accommodation and therefore the financial risk lies
completely with him. This contract form is the opposite of the buy-out form (Langeveld,
2009: 112).
5. Costing (in Dutch: costing):
This contract form usually only appears in the music industry. The first layer of box-
office income is to cover the costs of for example a band, the second to cover the costs of the
accommodation and the rest is shared via a split (Langeveld, 2009: 112).
The market power on the purchasing market hovers between the producer and the theater. The
form of contract that will be chosen depends on and differs per genre, spirit of the age,
willingness to purchase by the theater (Langeveld, 2009: 112), overall popularity of a specific
production on both purchase and consumption market, financial mix of producer and theater,
history of contracts between them and so on.
2.2.4. Prices and price setting
When describing contracts above, box-office income was simply referred to as total income
from box-office sales. However, this is not entirely true since VAT is deducted before income
from ticket sales ‘reaches’ the theater and the producer. To illustrate and define the different
incomes from ticket sales to the theater and the producer, the ways in which the box-office
prices are constructed need to be clearly set forth.
The end product of the production chain of theater (see figure 2) is the theater ticket. This
ticket has its price, in this research referred to as box-office price, paid for by the consumer on
the consumption market (see figure 4). This box-office price is inclusive VAT, since it is the
price at the very end of the chain. This price times the number of attendances results in the
total box-office income. The financial sum that remains after VAT is deducted from total box-
office income, is in this research referred to as box-office income at the theater. Dividing this
amount by the number of attendances yields the average income per visit at the theater.
However, this is not the same as the revenue to the theater. This depends on the negotiated
share in income from ticket sales, the possible supplement6 and/or administration costs.
6 Theaters often add a couple of Euros to the negotiated box-office price to cover costs as a ‘free’ drink during
the break and the cloakroom.

20
After deducting this revenue to the theater, what remains is the revenue to the
producer. Dividing this by the number of attendances is one way to approach the average
income per visit to the producer. The other way to approach the average income per visit to
the producer is by dividing the guarantee sum by the number of attendances, when revenue to
the producer has not exceeded the negotiated guarantee sum.
On both the purchase and consumption market VAT is paid over revenue from box-
office income or over the guarantee sum. However, a producer and theater buy or hire
equipment, room, scene decoration and so on for producing or housing a production and also
pay VAT over those amounts. A company, in this case a producer, can balance out (in Dutch:
salderen) what is paid over purchased or hired products with VAT that is paid over income
(from box-office sales).
All this is summarized in figure 3, based on the model situation where theater and
commercial (!) producer have agreed to a split contract with guarantee sum.
Figure 3: Income from box-office sales
The price the theater (the buyer) on the purchase market needs to pay is 80% out of the box-
office income that is left to divide after supplements etc. have been deducted or the guarantee
sum. When 80% out of box-office income to divide is less than the negotiated guarantee sum,
the theater pays the guarantee sum and revenue to the theater might be negative. At the

21
transaction on the purchase market, VAT is also added to the paid price (e.g. the 80% revenue
or the guarantee sum). Therefore in figure 4 the amount divided by the number of visitors is
regarded as 80% of revenue to divide.
The price that is paid on the consumption market is the box-office price. As will be
seen in chapter 4, these definitions of income and prices on the theater market need to be
regarded closely since analyzing their trends might provide a distorted view. For example, the
average income per visit to the producer differs from box-office price (see figure 4). If in this
example the guarantee sum would have been € 1500 (because a lot more than 100 visitors
were expected), the theater has to pay € 1500 to the producer and experiences a loss in
income. In that case the average income per visit to the producer is € 15, which is even more
than the average box-office price.
Figure 4: from box-office price to average income per visit to the producer
The price setting of box-office prices, is based on experience and depending on the chosen
contract form during the negotiations between theaters and producers (Goudriaan et al., 2008:
70). Those prices are usually set six to eighteen months before a production is staged. In a
system where prices are set that long in advance, well-considered decisions need to be made
since anticipating to circumstances shortly before or at the time when the ‘product is sold’ is
not possible. Price and income elasticity of demand need to be kept in mind, as well as the
presence and prices of substitutes, the popularity of the theater, the producer and the
production, the developments on the market, the day of the week the performance will be
staged and so on (Langeveld, 2009: 155,156). Theaters and producers negotiate on this and

22
agree to a certain box-office price and possible price differentiation and price discrimination.
The strength of each of their positions is revealed in the form of the contract.
2.3. Value added tax and theater in The Netherlands
The Dutch Ministry of Finance implemented a lower VAT-rate of 6% for cultural products
and necessities of life around 1998 (the commencing date differs per product or service). This
also applied to the theater sector (see figure 5). Before that year the normal/higher rate of 19%
was applied to these products. The overall objective behind this measurement of lowering
VAT on these products, was to create (financial) space to attain secondary effects: stimulating
demand and supply, stimulate culture, expansion of knowledge and support of the concerning
sectors. The specific objectives per sector or cultural product had been formulated in different
policies over the years (Plasterk & De Jager, 2009: 2).
Although VAT is tax added at the end of the production chain of theater, the lower
VAT-rate did not have to be included into the box-office prices, meaning box-office prices
did not decrease due to the new VAT-rate. For the theater sector and some other sectors
stimulating demand was not the primary objective for decreasing VAT (Plasterk & De Jager,
2009: 2). The reason for applying the lower VAT-rate to products and services of the
performing arts sector was to reduce production costs and to stimulate producers. As can be
seen in figure 3, a decreasing VAT when keeping box-office prices at the same level results
in higher box-office income at the theater and therefore in more income to both theaters and
the producers. On the other hand, this measurement did prevent increases in box-office prices
(Goudriaan, 2008: 69), which at least prevented a decrease in demand as a result of that.
The intention for lowering VAT in the performing arts sector was to compensate for
the regulation of working hours7 (Goudriaan et al., 2008: 69). Another objected effect of the
lower VAT-rate in the performing arts sector was to compensate for the costs due to graying
of personnel, a trend that had been signaled (Plasterk & De Jager, 2009: 2).
At first the lower VAT-rate was only applicable to theater tickets. This caused so
much administrational hassle and discussion to make the government decided in 2002 that the
lowered VAT-rate should not only be applicable to theater tickets, but also to theater services,
performances (TK, 2001-2002: 28015, C.6), which are the products on the purchase market.
7 implemented in 1996 and increased labor costs for performing arts producers. This law on working hours
regulated the overall norms for minimum duration of rest period and maximum of working hours (De Vries et
al., 1996). According to this regulation the working days of especially theater technicians contained too many
hours in a row, also due to the travel distances between home and theater. This forced producers to plan double
shifts, which increased their labor and therefore production costs.

23
To evaluate the effects of this measurement, in 2008 both the total loss as well as the
loss per sector of income from tax that the Dutch government missed out on due to the lower
VAT-rate (6%) regulation was calculated. Apart from that a simulative outcome was given for
the situation where the VAT-rate would have been held constant at 19% and caused a
decrease in demand. This decrease in demand would also have caused a loss in income from
tax to the government (Goudriaan et al., 2008).
Total loss in tax income from culture in the 6% situation was 490 million Euros, in the
19% situation it was 415 million Euros per year (Plasterk & De Jager, 2009: 2).
Total loss in tax income from theater (halls) was 23,1 million Euros in the 6%
situation and 21,7 million Euros in the simulated 19% situation (Goudriaan et al., 2008: 73).
The VAT-decrease was not calculated into the box-office prices (prices were not
lowered due to the lower rate, on the contrary: they had been increased) and this gave
financial room to the performing arts sector to attract new employees, after having to cut back
on these due to the regulation on working hours (Goudriaan et al., 2008: 79).
A remark in this evaluation was that the profit of the lower VAT-rate did not always
end up at the producers of performing arts since exploiters of halls had not always shared this
benefit with them (Goudriaan et al., 2008: 79). The rapport states that touring companies
mostly agree to buy-out contracts. Due to the fact that these buy out sums did not increase as
well, the situation of producers remained unchanged after the VAT-decrease. This is mostly
true for orchestras and choirs8 (Goudriaan et al., 2008: 77).
Also a couple of local governments shrunk subsidies after the VAT-rate was lowered.
These remarks, together with a positive evaluation of economic effects, resulted in concluding
that the intended effect was partially successfully achieved: the measurement improved the
relationship between labor costs and income at the performing arts producers (Goudriaan et
al., 2008: 80).
The Minister of Finance and the Minister of Education, Culture & Science (OCW) in
2009, concluded that both the evaluation in 2008 of the efficiency of the lower rate and a
study of Copenhagen Economics on a uniform VAT-rate internationally, did not provoke
changing the regulation of the lower VAT-rate in 2009 (Plasterk & De Jager, 2009: 5). The
VAT-rate on theater tickets remained 6%, because it compensated in one way or another the
(increased) costs of production.
8 Note that this remark refers to the total performing arts sector. In the theater sub sector the split contract form
was used most. With this contract changes in VAT are shared between theater and producer.

24
However, one year later the Dutch government decided in the taxation plan for 2011 that the
lower VAT-rate should no longer be applied to performing arts and visual arts. These sectors
were put ‘back’ into the rate of 19% VAT by July 1st 2011 (TK, 2010-2011: Belastingplan
2011). This measure caused a lot of debates within the government. Some parties asked what
the reasons behind this decisions were, especially at a time when large subsidy cuts were on
hand as well. They asked whether the motive for applying the lower rate in 1998, to
compensate the regulation of working hours and the graying of personnel, is no longer
applicable. The answer of the State Secretary of Finance to these questions was that the
measurement was meant to ‘cure the governmental financing’. Due to the national graying,
the national and European economic crisis, the reorganization of the Dutch governmental
financing system was needed. He stated the intention of the government was to stay away
from intervening too much into the performing arts sector, which also implied restraint
regarding the lowered VAT-rate, and referred to the evaluation of Ape (Goudriaan et al.,
2008) which had concluded that the benefits of a lower VAT-rate did not always end up with
the producers, which had been the target group for this measurement in the first place. He
stated that fiscal measurements should always be reconsidered when they did not lead to
intended effects (TK, 2010-2011: 32 504, nr. D).
Figure 5: Changes in VAT on performing arts
The Ministry of Finance hoped to increase income from tax by € 90 million Euros, of which €
48 million Euros should come from the performing arts sector. This figure is based on the
yearly box-office sales of the years before 2011 and on the assumption that the same number
of tickets will be sold in 2011 and the years after that. Effects as decrease in demand,
substitution away from the performing arts sector and producing in other countries but

25
performing in The Netherlands, were not taken into account. The effect of decreasing demand
was taken into account when describing the development of governmental income from tax,
but the decrease in demand for performing arts with an inherent decrease in income from tax
of this sector, was supposed to be compensated by spending of consumers in other sectors. It
was assumed that when consumers would decide not to consuming in the performing arts
sector, they would substitute away to other sectors, where then the tax would be paid. The
Ministry of Finance assumed that decrease in demand for theater (on at least the short-term)
would be limited based on the results in the evaluation of Ape in 2008 where a figure of price
elasticity of demand (see chapter 4) was found of -0.32 and referred to similar figures found
internationally for the performing arts sector (TK, 2010-2011: 32 504, nr. D).
The VVTP-members went to court, together with a few other groups of performing
arts organizations. One important player in this was the Association for Event Organizing
Organizations (in Dutch: Vereniging van Evenementenmakers; in short: VVEM). This
organization realizes a lot of events as concerts and festivals, also of foreign artists, more in
the music than in the theater sector. Like the VVTP, they also expected great negative effects
of the VAT-raise. Together these organizations went to court to accuse the Ministry of
Finance based on the principle of fiscal neutrality (competitive goods should be treated the
same by the tax authorities) that the measurement of increased VAT would harm. They asked
that the VAT-raise on performing arts should be forbidden. This possible incompatibility with
the principle of fiscal neutrality had also been one of the questions of some parties of the
Dutch parliament (see previous paragraph). Entrance to the Zoo, circus, movies and sports
events remained 6% . The interest groups (VVTP, VVEM and so on) argued that these goods
and services, especially movies, are competitive with performing arts. The court denied this
request, because entrance to the performing arts could be distinguished from entrance to the
other listed forms of recreation. Therefore the principle of fiscal neutrality remained intact
(Rechtbank ‘s-Gravenhage, 2011).
The VVTP-members also turned to the market research company Ape in 2010 (the
same company that evaluated the lowered VAT-rate in 2008), in order to evaluate the possible
effects of the VAT-raise. The outline and results of this will be set forth in chapter four and
forms the basis of this master thesis since it forecasted the effects the VAT-raise would have
on commercial theater producers (Goudriaan, 2010).

26
2.4. Conclusion
The way of functioning of the theater market, the contract forms and the price setting
behavior all more or less influence the effects of changes in VAT. A main characteristic of the
performing arts sector is ‘differentiation’. This affects the decisions made by suppliers and
buyers on the two sub markets: the purchase and the consumption market. The chosen form of
contract and the negotiated box-office prices differ per supplier, product(ion) and consumer
(or group of consumers). Therefore also the effects of changes in VAT depend on the
decisions and agreements made by suppliers and buyers.
The role of VAT in price setting negotiations and the forms of contract between
VVTP-members and theaters will be included in the interviews for the case studies, which are
described in chapter six (Method) and be used to test the hypotheses formulated in chapter
five. The results of this will be shown in chapter seven.
First the factors influencing consumer choices will be outlined. Changes in consumer
behavior are expected according to changes in box-office prices after the VAT-raise. To
calculate or simulate changes in demand for theater tickets, the figure for price elasticity of
demand for theater is calculated (see chapter 3.7.). However, as will be shown in the next
chapter: more than just prices alone influence consumer decisions.

27
3. THEORY OF DEMAND
3.1. Introduction
In this chapter the ways in which consumer reactions to price changes, in this case changes in
box-office prices, are analyzed is set forth. Effects of (box-office) prices on demand for
cultural activities is analyzed best by the micro economic theory of consumer behavior.
This model considers consumers to be well informed when choosing a goods and act
rationally and consistent. Consumers choose a good or combination of goods that provides
most utility to them given their income, prices of goods and their preferences. This process of
optimalization leads to a couple of relations, expressed in demand curves, in which demand
for goods and services depend on available income and prices of the goods (Blankers et al.,
2012: 130).
The model of consumer behavior is helpful when trying to predict the reaction of
consumers to changes in market conditions and explains price and income elasticities (Begg et
al., 2008:75). Also for suppliers it is useful to analyze the consumption pattern of consumers
through theory of demand, as due to the ‘nobody knows’ effect, producers cannot know in
advance if and how much their good will be consumed and enjoyed (Towse, 2010:154). As
seen in the previous chapter, estimating demand for a production is part of the contract
negotiations between theaters and producers. Consumers cannot influence setting of box-
office prices directly, but they can decide to buy a cheaper ticket or go to a similar but less
expensive performance (Goudriaan et al., 2008: 70,71).
Demand for a good depends on its own price, prices of related goods, consumer incomes
and consumer tastes (Begg et al., 2008: 42). The influence of a goods own price on demand is
set forth in a demand schedule. The first part of this chapter (3.2.) will be analyzing this
construction. The other three factors are analyzed through theory of consumer behavior,
which can be explained by a model for cultural participation as set forth in 3.3. The parts
following the description of this model, will analyze the three factors that are included in
models of consumer behavior. First consumer tastes (3.4.) and how they can be modeled by
indifference curves, then consumer income (3.5.) and how it can be modeled by a budget line
in a figure with indifference curves and finally the prices of related goods (3.6.) and their
influence on a consumer’s budget line.

28
3.2. Demand schedule
The behavior of consumers is described by demand: the quantity demanded of a good at each
set price. To model the demand for a good, a demand curve is set up, which shows the relation
between price and quantity demanded (Begg et al., 2008: 38, 39).
For example the demand curve in figure 3 of demand for theater tickets, shows that an
increase in box-office price will cause a decrease in quantity of tickets demanded, keeping all
other factors constant. At € 30 the number of tickets demanded is 300. An increase in price
with € 5, from € 30 to € 35, leads to a decrease in tickets demanded by 50, so from 300 to 250
tickets. Because every increase of the price that is equal to the previous, leads to a ditto
increase in quantity demanded, this
demand schedule is a straight line.
The slope of the demand curve
differs per good or service and
depends on or expresses its figure
for price elasticity of demand (see
chapter 3.7.).
As stated above, in this model
other factors apart from price are
supposed to have stayed constant.
The theory of consumer behavior
describes the three of these other factors, that also influence consumer behavior, apart from a
goods own price. These factors are categorized under three headings: (1) the price of related
goods, (2) the income of consumers and (3) consumer tastes or preferences. Changes in any of
these three groups will change the demand for a good (Begg et al., 2008: 40) and will cause
shifts of its demand curve.
A demand curve is used to analyze the market for a certain good and therefore the goods
own price is set along the vertical axe. The other three factors are determined elsewhere in the
economy: the prices of other goods depend on their own markets, incomes depend on national
economic circumstances of consumers and tastes depend on the development of people at a
certain time. They are therefore not on the axes, but do have their influence on demand.
Changes in price cause movements along the demand curve, changes in other factors cause
shifts in the position of the demand curve (Begg et al., 2008: 42,43).
0 5
10 15 20 25 30 35 40 45 50 55 60 65
0 100 200 300 400 500 600
Pri
ce (
€ /
tic
ket
)
Quantity (number of tickets)
Figure 6: Demand for theater tickets

29
3.3. A model for cultural participation
When questions are posed about the relationship between theater and its audience, statements
on the selection process of consumers, on why and with which frequency they select certain
goods or services, are needed. In doing so it is assumed that from visiting theater people gain
benefits. It provides utility, because it satisfies two needs: the urge for esthetical pleasure and
the need for social regard (Ganzeboom, 1990: 29).
But selecting theater also brings about costs. Two restraints are posed, their
availability differ per individual: the spare time and the money that need to be spend
(Ganzeboom, 1990: 29).
From this four determinants in participation for theater can be distinguished:
information process, social regard, time allocation and expense (Ganzeboom, 1990: 29).
For each of these four factors the determining constraint of potential visitors can be
put against the characteristics of theater, which leads to a model for cultural participation
(Ganzeboom, 1990: 49).
Table 1: Model for cultural participation
Consumer constraint Theater characteristic
I Cultural capacity Complexity
II Social network Conventionality
III Monetary budget Financial cost
IV Time budget Time cost
The relation of this constraints to the characteristics of theater leads to an analysis of
consumers selection process under four headings. (1) The ability of an individual to process
and enjoy information offered by theater performances in relation to the complexity of
information offered, (2) the social regard an individual will gain from visiting theater, in
relation to the social thresholds theater holds for him, (3) the costs of visiting theater in
relation to a consumers budget and (4) the time it takes to visit a performance in relation to
consumer’s available time (Ganzeboom, 1990: 49).
The capacity for processing cultural information, differs per individual and depends on
his background, social network and individual characteristics. When this individual capacity
is compared to the complexity of a certain performance, the individual’s ability to enjoy the
performance is analyzed. His capacity holds two features: his expectations and skills. An
individual’s expectations depend on his personal learning process (Ganzeboom, 1990: 31). A

30
complete description of the analysis of peoples personal learning processes requires other
scientific fields as for example psychology and sociology. However, a consumer’s personal
tastes or preferences are revealed in his individual demand schedule.
3.4. Consumer tastes
Consumer’s taste or preferences depend on convenience, custom and social attitudes (Begg et
al., 2008: 42) and are revealed in a demand curve. A growing taste in favor of a good will
shift the demand curve to the right, because people will be willing to pay more, e.g. the
quantity demanded will be higher at each price.
The price that consumers are willing to pay for a product depends on its value. For
cultural products it is more difficult to determine the value and therefore the price, because it
not only depends on the utility provided by the product or its material worth, but also on the
cultural, personal and/or intrinsic value that consumers attribute to it. The theory of consumer
behavior contributes preference orderings to consumers, which means they are supposed to
prefer one good over another or to be indifferent between the two (Throsby, 2001:19,22).
Consumers’ tastes and preferences are based on what they ‘naturally’ like and on their
background of experiences. The appreciation of a good grows with the time that is devoted to
that kind of good. The reasons for consumers to consume cultural goods lie with both present
satisfaction and the accumulation of knowledge and experience. A person’s taste is build up
over time and is therefore cumulative (Throsby, 2001:24).
For studies that have investigated on an aggregate level as well as for studies that have
investigated demand for individual organizations, the three socioeconomic factors age,
education and occupation play a central role (Seaman, 2005: 8-9) and therefore are the
building bricks for taste formation.
Indifference curves
Although an individual prefers one good over another or one bundle of goods over another
bundle, there are bundles that provide the same utility. An individual’s taste can be expressed
in a model with indifference curves and a consumer is indifferent between bundles that lie on
the same indifference curve. The model of indifference curves is based on three assumptions.
First of all taste is expressed through ranking bundles of goods: one bundle of goods
provides more utility to a consumer than another bundle. Quantifying this utility is
unnecessary since it depends on consumers personal tastes and preferences (Begg et al.,
2008:77). For example a consumer prefers bundle A with seven theater tickets and three

31
movie tickets over bundle B with three theater tickets and seven movie tickets, because he
prefers theater over movie. Then bundle A provides more utility to the consumer than bundle
B.
The second assumption is that consumers prefer more to less (Begg et al., 2008:77).
Consumers prefer the bundle that provides them most goods fitting their budget. In our
example the consumer will prefer a bundle with ten tickets in total over a bundle with six
tickets in total.
And the third assumption is that of a diminishing marginal rate of substitution,
meaning that the more of good A the consumer is able to purchase, the more he would be
willing to give up of A to purchase some of good B in order to keep utility constant (Begg et
al., 2008:78). For example a consumer goes to a theater festival where shows last 30 minutes
and he has a budget to spend on tickets to shows and glasses of wine. Suppose he spends his
whole budget on wine, he will buy 30 glasses. Suppose he spends everything on the
performances, he will buy 9 tickets. The utility of the bundles where everything is spend on
either wine or shows, is both very low: drinking 30 glasses of wine, he will probably not
survive the night, and he cannot see 9 performances on one evening. Therefore within for
example a bundle where he has 25 glasses of wine, he will be willing to give up more wine to
gain a ticket to a show than within a bundle where he has 15 glasses of wine (although he
would still be very drunk) and he will be reluctant to give up a ticket in order to gain more
wine.
Figure 7: Indifference curves
These three assumptions can be combined
and expressed in consumers indifference
curves (see figure 7). Each indifference
curve ‘connects’ the bundles of goods with
the same level of utility (Begg et al., 2008:
79).
The curves slope downwards and do
not intersect because consumers prefer
more to less (Begg et al., 2008: 79,80).
More wine would increase utility, so a
ticket has to be taken away in order to keep
utility constant and the bundles on the same indifference curve.

32
The curves flatten because of the diminishing marginal rate of substitution (Begg et
al., 2008: 79): the consumer will be equally happy with bundle X as with bundle Y and with
bundle Z, but moving from X to Y he is willing to sacrifice 5 glasses to gain one ticket and
moving from Y to Z he only willing to sacrifice 3 glasses to gain one ticket. So the nearer the
bundle is at the extreme points on the curve, the more the consumer will be willing to give up
of the good of which he has the most and the nearer it is to the middle, the fewer.
Due to the assumption that consumers can rank bundles of goods, every point on
U3U3’ will be preferred to every point on U2U2’. D will be preferred to B, B to E and so on
(Begg at al., 2008:79). An endless number of indifference curves can be drawn, where each
one that lies higher is preferred over all the lower ones. But a consumer’s budget puts a limit
to what is affordable. Which bundle of goods is the best and still affordable to a consumer
depends on his budget line, as shown in the following paragraph.
3.5. Consumer income
The third relationship described in the model for cultural participation is the one between
monetary budget and the costs of consuming theater. This relationship depends on a
consumers available budget, which depends on his savings, social class and most or all of his
income (Ganzeboom, 1990: 49).
For most goods demand increases when consumer incomes rise (Begg et al., 2008:
41). Therefore increases in consumer incomes will cause a shift to the right of the demand
curve, because people will be able to spend more and the quantity demanded at each price will
increase.
The combinations of goods that are affordable to the consumer, are called the budget
constraint and can be expressed by the budget line. To the figure with indifference curves
(figure 6) budget lines can be added to model the budgets of consumers (figure 7). The budget
depends on consumer’s income and the prices of related goods. At each point on the budget
line we can read out the maximum quantity of a good that can be purchased, given the
quantity of the other good that is purchased. No bundle of goods at a point above this budget
line is affordable and bundles of goods that lie at points inside the budget line, leave income
unspent (Begg et al, 2010:76,77).
To determine where the budget line lies in the model, the two most extreme points
have to be calculated, where it the maximum of one good is bought given no quantity of the
other good is bought at all. In the example: at which point is the whole budget spent on wine
and at which point on theater tickets. The budget line is a straight line that connects these two
33
points and its slope can be determined by calculating the ratio of the prices of the two
investigated goods: -Ph/Pv, the change in vertical distance, divided by the change in
horizontal distance (Begg et al., 2008: 77, 81-82). In the example the slope of the budget line
can be determined by calculating how many glasses of wine the consumer will have to give
up to get one theater ticket.
When looking at the influence of consumers income on the quantity demanded of
goods in economics, the possibility of saving is left out. In that way a rise in income will
result in an increase in total consumer spending. By how much spending on a certain good
will increase, depends on it’s budget share of total consumer spending. Budget shares of
goods might change over time too. For example the budget share of food will decrease and the
budget share of cultural goods will increase when incomes rise (Begg et al., 2008:65).
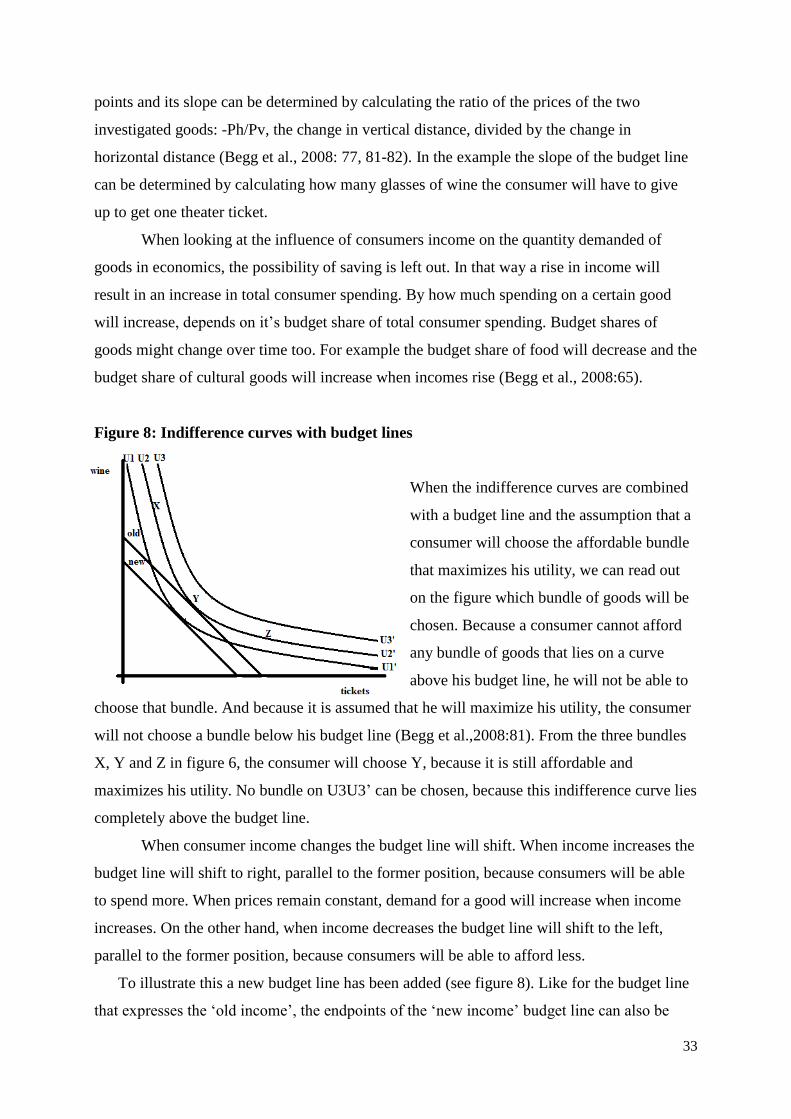
Figure 8: Indifference curves with budget lines
When the indifference curves are combined
with a budget line and the assumption that a
consumer will choose the affordable bundle
that maximizes his utility, we can read out
on the figure which bundle of goods will be
chosen. Because a consumer cannot afford
any bundle of goods that lies on a curve
above his budget line, he will not be able to
choose that bundle. And because it is assumed that he will maximize his utility, the consumer
will not choose a bundle below his budget line (Begg et al.,2008:81). From the three bundles
X, Y and Z in figure 6, the consumer will choose Y, because it is still affordable and
maximizes his utility. No bundle on U3U3’ can be chosen, because this indifference curve lies
completely above the budget line.
When consumer income changes the budget line will shift. When income increases the
budget line will shift to right, parallel to the former position, because consumers will be able
to spend more. When prices remain constant, demand for a good will increase when income
increases. On the other hand, when income decreases the budget line will shift to the left,
parallel to the former position, because consumers will be able to afford less.
To illustrate this a new budget line has been added (see figure 8). Like for the budget line
that expresses the ‘old income’, the endpoints of the ‘new income’ budget line can also be

34
determined by calculating the both most extreme points. The new budget line is parallel to the
old line, because the prices of the two goods have stayed the same, only consumer income has
decreased (Begg et al., 2008:83). Since theater tickets (and glasses of wine) are luxury goods,
not necessities, demand is particularly sensitive to changes in consumer income.
More income means more to spend (in Dutch: bestedingsruimte), which means more
money to spend on cultural activities. If box-office prices increase, but less than available
income, the effects of these price increases will be limited. Econometric analyses that estimate
price elasticity always keep in mind these relationships between different variables of demand
for cultural activities (Blankers et al., 2012: 131).
3.6. Prices of related goods
Other goods can be complements or substitutes (Begg et al., 2008: 41). In the first case they
are consumed together with the good in question, in the second case they are consumed
instead off the good in question (Towse, 2010:142).
When good A is a complement for good B, consumers consume good A together with
good B. For example: a glass of wine is a complementary good of a theater ticket. When the
prices of theater tickets rise, the quantity demanded for theater tickets will fall and so will the
quantity demanded for glasses of wine since fewer people will go to the theater. However, the
decrease in demand for wine will only be noticeable at the theaters, probably not nationally,
when prices for tickets are raised. Complementary goods are usually described when it
concerns more specific features: a CD is a complement for a CD player, car tires for cars, and
so on (Begg et al., 2008: 41).
When good A is a substitute for good B, consumers choose between good A and B. An
increase in the price of good A will cause an increase in demand for good B, because demand
for good A will decrease and consumers will choose B instead of A (Begg et al., 2008:84).
Movie tickets are substitutes for theater tickets. When the prices of theater tickets rise, but the
prices of movie tickets stay the same, the quantity of theater tickets demanded will decrease
and the quantity of movie tickets demanded will increase. People will substitute away from
theater to movie tickets.
A rise in the price of good A, a substitute for good B, will shift the demand curve of
good A to the right, as people will substitute away from good B to good A and will be willing
to pay more for it (Begg et al., 2008: 42).
As we saw before in figure 5, a budget line models the income constraint for
consumers when choosing bundles of good A and B. The slope of a budget line depends on

35
how much of one good must be sacrificed to get the other good, so on the ratio of the prices of
the two goods (Begg et al., 2008:77).
When the price of a good increases, the budget line will rotate inwards around the
most extreme point in favor of the other good, see figure 9. The affordable bundle of goods
that maximizes utility will then contain less of the first good at the same amount of the other
good (Begg et al.,2008:85). In our example: when the prices of theater tickets increase, the
budget line will rotate around point A, where all money is spent on movie tickets, and less
theater tickets will be affordable at the same amount of movie tickets.
Figure 9: Changing budget according to price changes
The new budget line has two consequences: first, the
budget line has become steeper, which means that
more movie tickets must be sacrificed in order to
gain a theater ticket and second, the line has shifted
to the left, lies inside the ‘old’ budget, and therefore
the purchasing power of the consumer has
diminished although his income has stayed the same
(Begg et al.,2008:85).
As will be explained in the next section (3.7) of this theoretical framework, the influence
of a price change of one good on the demand for another good, is expressed by calculating the
cross-price elasticity of demand. When goods are substitutes the figure for cross-price
elasticity of demand is positive: a higher price of good A increases demand for good B. The
better a substitute, the higher the (positive) cross-price elasticity number. But even when the
other good is not a perfect substitute, an increase in relative price of a good will always create
an effect away from it, whether or not it will be (completely) captured by a substitute (Begg et
al., 2008:89-90).
The influence of prices of related goods depend on the characteristics of a product. For
example, the more competitive characteristics a performance has, the higher cross-price
elasticity of demand. The more ‘highbrow’ and unique or ‘blockbuster’, the less sensitive a
production is to box-office prices of other productions. These characteristics depend on
consumer preferences (Blankers et al., 2012: 130,131).
A

36
3.7. Elasticities of demand
The price of a good, consumer income and prices of other goods influence demand for a good
(Begg et al., 2008: 56). To describe to which degree these factors influence demand for a
good, their elasticity figures are calculated. These figures describe the percentage change of
demand due to one percent change of the other three factors.
To explain price and income elasticity of demand for cultural activities, the
determinants that are used to purely calculate them are not enough, since changes in demand
are not just caused by changes in prices of goods or consumer income. That is the function of
consumer theory: to explain the underlying relationships(Blankers et al., 2012: 129).
3.7.1. Price elasticity of demand
As stated above, the slope of the demand curve, figure 6 (and whether it is a straight
line or curved), depends on the characteristics of a good, its price elasticity included (Begg et
al., 2008: 55). PED is an abbreviation for price elasticity of demand, also referred to as
demand elasticity (Begg et al., 2008: 56).
PED = (% change in quantity) / (% change in price).
Using this model it is possible to calculate the figure for PED for every price change on the
demand curve (figure 6), by dividing the percentage change in quantity that appears for any
percentage change in price.
In this case demand falls when prices rise, so the figure for PED is preceded by a
minus sign. For most goods demand curves slope down, therefore their changes in price and
changes in quantity have opposite signs and demand elasticity is a negative number. But the
minus sign is often left out, because nearly all goods have a negative PED number (Begg et
al., 2008: 56).
The figure for PED expresses whether demand for the investigated good or service is
elastic, inelastic or unit-elastic. If the figure exceeds -1 demand is elastic (Begg et al., 2008:
58), an increase in price within this range will lead to a decrease in demand. The more elastic
demand for a good is to price changes, the decrease in quantity demanded. The figure for PED
differs per point on the demand curve. The higher the starting price, the more demand will be
elastic to price changes.
Demand is inelastic when PED lies between 0 and -1 (Begg et al., 2008: 58). At these
points on the demand curve an increase in price will lead to a negligible change in demand.

37
At PED = -1 demand is unit-elastic (Begg et al., 2008: 58). At this point total spending
of consumers is unchanged when prices rise or fall. It is the turning-point for price elasticity
of demand on the demand curve. Total spending is the price times the demanded quantity, e.g.
how much is spend by consumers at a certain price. Beginning at high prices and moving
down along a demand curve, total spending will first increase and then decrease. At the
turning point, demand is unit-elastic. (Begg et al., 2008: 61). In the example (see 3.2. and
appendix B): when box-office price to the performance rises from € 20 to € 21, PED remains -
1 and income from box-office sales remains unchanged.
Knowledge of PED for commercial theater in particular is limited, since former
research had analyzed this for either just subsidized theater or for commercial and subsidized
theater together (Goudriaan, 2010: 6). To be able to forecast, estimate or simulate changes in
demand for commercial theater after increased box-office prices due to increased VAT, the
figure for PED for commercial theater is needed (see further in chapter 4 and 6).
3.7.2. Income elasticity of demand
Income is one of the variables influencing consumer behavior and its relationship to the
quantity demanded is positive: when consumer income increases, demand for (cultural) goods
increases as well. The figure of income elasticity of demand expresses the change in quantity
demanded due to the change in consumer income (Towse, 2010, p.148). To calculate the
figure for income elasticity of demand, the percentage change in quantity needs to be divided
by the percentage change in income (Begg et al., 2008: 65).
3.7.3. Cross-price elasticity of demand
When calculating the own price elasticity of a good, all other factors are remained constant,
only the changes in price of the examined good is changed. When calculating the cross-price
elasticity of demand, the own price of the examined good and consumer income remain
constant and elasticity is calculated for price changes in other goods. When a rise in price of
good A increases the quantity of good B demanded, cross-price elasticity is positive. In
general this is the case when good A is a substitute for good B (see figure 9). When goods A
and B are complements, their cross-price elasticity figure will be negative (Begg et al., 2008:
64).
Although in this research neither the effects of price changes for substitutes of theater
on the demand for theater tickets, nor the effects of increased box-office prices on the demand
for substitutes of theater are discussed, it is useful to address this cross-price elasticity of

38
demand. This model explains that when for example movie tickets are supposed to be a
substitute for theater tickets, it is likely that part of the audience will substitute away from
theater when prices of theater tickets have increased.
3.8. Conclusion
Demand for theater depends on the selection process of consumers which can be analyzed
through theory of consumer behavior and expressed in a demand schedule.
A figure for price elasticity of demand for theater tickets is needed to calculate the
possible change in demand when prices increase.
From this chapter can be concluded that, in order to investigate whether an increase in
VAT on theater tickets in The Netherlands leads to an increase in box-office prices and/or a
fall in demand, two variables need to be analyzed: prices of and demand for theater tickets.
However, a change in consumer income and/or the prices of substitutes might also have
caused a shift in demand for theater tickets.

39
4. FORECASTED EFFECTS OF VAT INCREASE
4.1. Introduction
The starting point for this master thesis is formed by the rapport the research company Ape
presented in November 2010 (Goudriaan, 2010), the same company that evaluated the effects
of the lower VAT-rate in 2008 (Goudriaan et al., 2008) (see 2.3.). The VVTP instructed Ape
in 2010 to investigate the possible effects the VAT-raise (by July 2011, see figure 5) would
have on them (Goudriaan, 2010: 3).
Another question that was raised in this study is whether the calculators of income to
the government from the VAT-raise on theater tickets, also took into account the possible
decrease in demand (Goudriaan, 2010:7,8). If a fall in demand after increased box-office
prices was not taken into account, then income to the government from the VAT-raise would
probably be disappointing.
This chapter will outline this research done in 2010. The outcomes will be summarized
in the conclusion. The hypotheses formulated in the next chapter are based on these outcomes
(Chapter 5).
4.2. Method and data
The 2010-rapport starts off by calculating a ‘new’ figure for PED for commercial theater.
Data on attendance and income during the years before (from 06/07 on), have been gathered
at the individual VVTP-members and at the Central Bureau for Statistics in The Netherlands
(in short: CBS) (Goudriaan, 2010: 9). The figure for PED is then isolated from a model that
estimates the effects of ‘ticket prices’ on demand.
Then the new found figure for PED is implemented into a model that was developed in
the rapport in 2008 on the evaluation of the lowered VAT-rate for performing arts (see
chapter 2.3.) (Goudriaan, 2008), which is based on the theory of consumer behavior in micro
economics and contains the variables of demand theory (see chapter 3): ‘ticket prices’ for
commercial productions, the consumer price index of substitutes and consumer income
(Goudriaan, 2010: 10).
The effects of including the VAT-raise into the box-office prices are addressed using
this model. The outcomes are used to describe the possible effects on income of and
employment at the producers, income of subcontractors and the income to the government
from the VAT-raise.

40
4.2.1. Remark
In this research ‘ticket prices’ are approached as revenue to the producer divided by the
number of attendances. However, as explained in chapter 2.2.4. and showed in figure 3, this
reveals the average income per visit to the producer, which is not the same as box-office
prices. Ideally box-office prices change by the same percentage as revenue to the theater and
the producer, but this is not realistic. When revenue to the producer falls, this can be caused
by other factors besides decreased box-office prices, for example: a fall in guarantee sums, a
raise in supplements, an increase in VAT, a decrease in percentage share to the producer out
of box-office income to divide and so on. However, in the 2010-rapport the average income
per visit to the producer is regarded as ‘ticket price’ and used as a variable to explain the
hypothetical outcomes. This makes describing the method and interpreting the results of this
rapport somewhat complicating. The figure for PED is calculated using this average income
per visit to the producer, whereas statements about consumer reaction to price changes can
only be made using prices consumers actually see and base their choices on: box-office prices.
However, the effects that were forecasted in 2010 are reliable since they describe
overall possible effects of the VAT-raise on commercial producers. These results are set forth
in the next paragraph, which shows that they are realistic expectations.
4.2.2. The model
The model used to describe the development of attendance to productions of
commercial producers, is based on the micro economic theory of consumer behavior, e.g.
theory of demand (chapter 3). It was impossible to include taste formation into the model in
2010, due to the relatively short period of time for which data on attendance and average
income per visit could be gathered.
The model contains three variables:
1. Income per visit to commercial producers
2. Consumer price index of substitutes
3. Available consumer income
Given the data structure (a cross-sectional time period) the model is based on panel data
estimations with fixed effects. This means that for every VVTP-member an individual fixed
effect is calculated, to take specific circumstances and the difference in genres out of total
offer of different VVTP-members into account. Because for the price index of substitutes only

41
data on a national level is available, the figure for price elasticity of demand for substitutes is
a priori supposed to be the same as the PED-figure for theater productions, only with an
opposite sign (Goudriaan, 2010: 17-18).
4.3 Results
Price elasticity of demand
The price elasticity of demand for VVTP-members is calculated. Prior to these calculations,
two statements were set forth to formulate an hypothesis. First of all box-office prices for
commercial productions are generally higher than box-office prices for subsidized
productions and second, the audiences to commercial theater are less well-off than those to
subsidized theater (Van den Broek et al., 2009). Apart from that, box-office prices have
increased strongly over the previous years (Goudriaan, 2010:6). Based on these three factors,
Goudriaan expects demand for commercial theater productions to be relatively strong elastic
to price changes and the figure for PED nowadays to be on the more elastic part of the
demand curve than it was found at in 2008 (Goudriaan, 2010: 6).
The figure for PED that is found for commercial theater productions is -1,09. As stated
above, this figure is found using average income to the producer for the variable ‘ticket
prices’. Therefore it does not express the real reactions of consumers to changes in box-office
prices for commercial theater, but it is used in this 2010-rapport to describe the effects of the
VAT-raise. Whether or not this figure for PED is reliable, for now it is enough to conclude
that demand for commercial theater is price elastic. Previous performed studies (both in The
Netherlands as well as in other countries) have found figures for PED for theater also showing
a price elastic character of theater in general (Seaman,2005: 52-57).
Furthermore demand for theater tickets appeared to be very sensitive to consumer
income. With a moderate fall in income, demand for theater decreases strongly (Goudriaan,
2010: 10).
Box-office prices
If the VAT-raise of 13 percentage points (from 6 to 19%) would be completely included in
the box-office prices, then this would lead to an increase in box-office prices of 12,3%
(Goudriaan, 2010: 10) . If before the VAT-raise a ticket costs € 10 at the box-office, then it
will cost € 11,23 after the VAT-raise (10 x 119 / 106 = 11,23). This increase of € 1,23 means
an increase in VAT of 13% will lead to an increase in box-office price of 12,3%.

42
Attendance
Given the PED estimation in this research, the increase in price of 12,3% will then cause a
decrease in demand of 13,5% (1 million) for the VVTP-members. This fall in attendance is
added to the drop that had already occurred in 09/10 (Goudriaan, 2010: 11).
Performances of commercial producers compete with other entertainment. Therefore
the attendance to these productions is sensitive to the number of PED for substitutes (movies,
theater, and so on). The fall in demand might turn out to be even bigger if the lower VAT-rate
of 6% remains maintained for substitutes as movies, circus and other entertainment . The
price difference that already existed between theater and movie will be enlarged.
Income of producers and employment
After the VAT-raise, revenue to the producer will decrease by the same percentage as demand
(13,5%) which is more than 18 million Euros. This decrease is added to the previous decrease
in income of 45 million Euros, caused by the attendance drop in 09/10. Producers will be
unable to compensate for the income loss by increasing box-office prices, because demand
would fall even more (Goudriaan, 2010: 11).
A decrease in income will possibly force a loss in employment. If this corresponds to
the income loss of 18 million Euros, then 250 fulltime jobs will be lost at the VVTP-members
(Goudriaan, 2010: 11).
Other sectors
CBS-figures show that the box-office prices only form a part (ca 60%) of the costs of a visit
to the theater. This means that the decrease in demand, will lead to a supplementary turnover
loss of approximately 15 million Euros in other economic sectors (Goudriaan, 2010: 11).
Apart from consumers, theater producers themselves spend in other sectors of the
economy. It is assumed that spending will decrease as much as demand (13,5%). This results
in a turnover decrease of 12 million Euros in other sectors. In total the spending in other
sectors of the economy will decrease by 27 million Euros (Goudriaan, 2010: 11,12).
Governmental gain
In the governmental ordinance that announced the VAT-raise, the income to the government
of the VAT-raise is estimated at 90 million Euros, half of which should come from
performing arts. When this was calculated, the Dutch ministry of Finance did not take into
account the drop in demand due to raised box-office prices (Goudriaan, 2010: 12).

43
The income to the government from VAT on commercial theater producers will be 3
million Euros less than what was hoped for after the VAT-raise. For the other performing arts,
the figures will be similar. Apart from that the spending in other sectors of the economy will
be less. Due to this, the VAT-output to the government from these sectors will also be 4
million Euros less than usual (Goudriaan, 2010: 12).
Based on the theory of consumer behavior and the figures for price elasticity of
demand for theater, Goudriaan concluded that income to the government from VAT on arts
sectors will be 10 million Euros less than before the VAT-raise. This means that 20% of the
planned VAT-outcome will not be met (Goudriaan, 2010: 12).
4.4. Conclusion
The expectations regarding the effects of VAT-raise for VVTP-members were based on the
theory of consumer behavior and a calculated figure for price elasticity of demand. This
formed a solid background to conclude that (1) demand for VVTP-productions will drop,
therefore (2) income and (3) employment will decline, (4) spending of VVTP-producers in
other sectors will decrease and (5) the governmental gain will fall 20% short of the 45 million
Euros that were hoped for.
These predicted effects form the basis for the hypotheses of this research, which will
be set forth in the next chapter.

44
5. HYPOTHESES
Which short-term effects of the VAT-raise can be found for commercial theater producers?
To investigate this a theoretical framework has been set up of elements on the market for
theater including VAT (chapter 2), theory of consumer behavior and elasticities of demand
(chapter 3).
The model of consumer behavior is used to predict the reaction of consumers to
changes in market conditions and explains how and why they react to price changes. Demand
for a product, in this case a commercial theater ticket, depends on its own price, prices of
substitutes and consumer income.
In the previous chapter the forecasted effects of the VAT-raise on demand for, income
of and employment at commercial theater producers were set forth. An hypothetical effect on
other sectors was also given: it was expected that due to decreasing income of producers, they
would spend less themselves in other economic sectors. In this thesis the effects of the VAT-
raise to commercial theater producers is the focus point, so the effects on other sectors
(subcontractors) will be left out.
To answer the main research question, the effects on box- office prices, demand for
commercial theater productions, income of producers and employment at producing
companies will be analyzed for the period before and the one after the VAT-raise. Also a final
effect will be examined, namely the income to the Dutch government of the VAT-raise, to
answer the question posed in the title: ‘who was right?’.
In this chapter five hypotheses are given and their theoretical base set forth. Then, in
the next chapter ,the methods used and data needed to test these hypotheses are described
further.
1. Box-office prices for commercial theater productions have increased after the VAT-
raise.
If the complete raise in VAT of 13 percentage points, would be calculated into the box-office
prices, then the prices of theater tickets would have to be raised with 12,3%.
Box-office prices ‘normally’ increase every season compared to the previous one. This
leads to the expectation that when negotiating on contracts, theaters and producers might not

45
decide to also include the VAT-raise in the box-office prices, apart from this ‘normal’ raise.
Completely capturing the VAT-raise themselves would mean a loss in box-office income of
13,5 % to the theater sector, given the figure for PED of -1,01.
All factors that influence demand for the productions and changes in income, will be
taken into account when box-office prices are negotiated. Theaters and producers will agree to
a box-office price that more or less captures the increased VAT and the according expected
drop in demand for commercial theater.
The popularity of comparable productions will have stayed constant over the years,
consumer tastes are supposed to remain constant and in favor of the same productions they
were before the VAT-raise. However, when prices increase and income decreases, the
consumers will choose a good or bundle of goods that provides the same utility but costs less,
one that lies lower on the indifference curve.
It is expected that box-office prices have increased slightly more in season 11/12 than
in previous ‘normal’ theater seasons. In order to both prevent a fall in demand and diminish a
fall in income, theaters and producers will have decided not to include all but a percentage of
the VAT-raise into the box-office prices. Therefore it can be concluded that the VAT-raise
has led to an increase in box-office prices for commercial theater.
2. Demand for commercial theater decreased due to the VAT-raise.
In the model for cultural participation an increase in VAT will not influence the ability to
enjoy information and gain social regard, since tastes and preferences are assumed to have
stayed constant. An increase in VAT that leads to an increase in box-office prices, will
influence the monetary and with that the time budget. Even if monetary budgets stay the
same, the financial cost of theater and with that also the time cost of theater increases.
Supposed box-office prices have increased for commercial productions, combined
with what is taught by consumer theory and the price elastic character of demand for theater,
it is expected that demand for commercial theater has decreased after the VAT-raise.
Changes in price cause movements along the demand curve, changes in other factors
(tastes, income, prices of substitutes) cause shifts in the position of the demand curve. If not
only box-office prices have increased, but consumer income has decreased, demand for
commercial theater will have fallen even more, due to the strong income elastic character of
commercial theater. The purchasing power of consumers diminishes when prices of goods
increase and/or when monetary budgets decrease.

46
Also prices of substitutes as movies, sports events and circus have stayed under the 6
% regulation. Based on the figure for cross-price elasticity it is expected that this will cause an
additional decrease in demand. Although in court it was decided that movies, sport events and
circus are no true substitutes when it comes to the principle of fiscal neutrality, they are
regarded as substitutes for theater in cultural economics.
The VAT-raise will cause a decrease in demand for commercial theater due to (1) the
price elastic character of theater, (2) a fall in consumer income for the same period, (3) the
cross-price elastic character of theater and the fact that prices of substitutes only had to
increase ‘normally’ since VAT on movies, sports events and circus have stayed the same.
3. Commercial theater producers experienced negative effects on income of the VAT-
raise.
A drop in demand which is too much to be covered by an increase in box-office price, is
experienced as a loss in revenue to the theater and the producer (see figure 3). The ‘normal’
box-office price increase, which corresponds to the consumer price index, does not lead to a
drop in demand and a loss in income. The new VAT-regulation however, will lead to a ‘more
than normal’ price increase and will therefore cause a drop in demand and a loss in income.
The difference between the ‘normal’ percentage of price increase and the one that was
performed from 10/11 to 11/12 is the increase that can be attributed to the VAT-raise. This
percentage should ideally meet the 12,3%, which was the percentage increase in box-office
prices the VAT-raise of 13 percentage points would cause. If the ‘extra’ percentage increase
that was performed is less than 12,3%, it means the producers have partially captured the
VAT-raise in their revenue from box-office income. As seen at the first hypothesis,
commercial producers will probably have decided to do so when negotiating on contracts with
theaters, to prevent box-office prices from increasing too much at once. This means their
average income per visit decreases compared to the previous season, which causes a loss in
income, apart from the decrease in income caused by a fall in demand.
Where the disadvantage of increased VAT on theater tickets is experienced the most,
depends on the form of contract. With a buy-out contract, the disadvantage will end up at the
theater, with a rental contract it will be at the producer and with a split it will be shared
between the theater and the producer. However, due to an expected decrease in demand after
an increase in box-office prices, theaters might lower guarantee sums on the purchase market,
which would then be the third negative effect on income to the producer.

47
Summarizing, the commercial producer will experience three kinds of negative effects
on income after VAT has been increased in the theater sector: (1) a drop in demand for
commercial productions, (2) a decrease in income per visit due to capturing a part of the
VAT-raise himself and (3) a decrease in guarantee sums.
4. Employment at commercial producers has decreased due to the VAT-raise
Commercial theater producers will have cut back the number of working hours and jobs due
to decreased income. When companies experience a drop in income, then their ability to keep
their employment on the same level is set back. The decrease in employment is expected to be
similar to the drop in demand and income.
Also the compensation of increased labor costs due to the regulation of working hours,
which was the intention of lowering VAT in 1998 (see chapter 2.3.) will diminish and with
that employment in a labor intensive sector as the performing arts stimulated less than before
the VAT-raise.
5. The intended raise in income to the Dutch government from VAT was not met during
the first year.
Goudriaan expected the real increase in income to the government from the VAT-measure for
performing arts to fall 20% short of the aim that was set (Goudriaan, 2010: 12). This
statement was made based on data from VVTP-members, but is expected to hold for other
theater producing companies as well since their economic circumstances are the same.
In 2008 Ape (Goudriaan et al., 2008) not only calculated the loss of income to the
government from tax on culture and media after the 6% regulation was implemented, but also
the loss that would have still be experienced had the VAT-rate stayed 19% (see chapter 2.3.).
The Ministers Plasterk and De Jager based their positive reaction on the results of this
evaluation and concluded that at that time (2009) there was no reason to reverse the measure
and set the VAT-rate back at 19%. However, despite this knowledge and these conclusions,
one year later it was decided that the higher rate should be reinforced. Therefore it can be
assumed that the calculated increase in income to the government of 45 million Euros that
was calculated by the Ministry of Finance in 2010, does not include a possible drop in
demand and will therefore not be met.
Although the calculated figure for PED and the according drops in demand for and
income of the commercial producers were based on the average income per visit to the
producer, not real box-office prices, and the found 20% shortfall of the intended increase in

48
income to the government from VAT is therefore also based on ‘wrong’ conclusions, it can
be expected that the VAT-raise caused an increase in box-office prices, which caused a drop
in demand. Since this drop in demand was not taken into account when the increase in income
to the government from VAT of 45 million Euros from the performing arts sector was
calculated, this financial goal was not met and therefore Ape (Goudriaan, 2010) was right: the
measure did not have the desirable effect.
These hypotheses are tested through analyzing data. In the next chapter the methods for
testing are set forth and the results of this will provide an answer to the central question and to
the question on ‘who was right’ (chapter 7).

49
6. METHOD
6.1. Introduction
This chapter will outline the method that was used to conduct this research and retrieve the
results to test the hypotheses. The method that was most suitable was performing case studies.
Selecting a research method depends on the main research question, the availability of data
(Gilbert, 2008: 35) and the kind of research. Since the VAT-raise was only applied during one
theater season and this particular season has ended not so long ago, the effects needed to be
analyzed on a relatively short-term and analyzing trends was impossible. Questioning all
nineteen VVTP-members in detail would be too extensive for this master thesis. Therefore
three commercial producers have been selected, differing in size and producing genres.
First the case-study method in general, with its benefits and limitations, will be
outlined, followed by an explanation of applying this method to this particular research. Then
an extra subchapter will set forth which new information was found while writing this thesis,
followed by an explanation of collecting data to test each individual hypothesis. The
concluding paragraph will outline the next step from this chapter on method to analyzing the
results.
6.2. Case-study design
The most suitable research method to conduct this research on the effects of the VAT-raise
were experienced by commercial theater producers is performing case studies. This deductive
process makes it possible to test the theory (Gilbert, 2008: 27) upon which the five hypotheses
described in the previous chapter are based.
Case-studies are selected carefully and then studied intensively. The cases that are
studied are not selected randomly, but are considered representative. The number of selected
cases differs per study, but the sample that is chosen should be as large as is representative of
the whole population. In that way the average opinion of the selected cases can be used as an
indicator of the population’s average opinion (Gilbert, 2008: 36).
The limitations of case-studies lie with the problems or even impossibility to
generalize findings. Research has to be specific for one field and not needed to be
extrapolated into another area. However, conducting so called ‘critical case-studies’ is useful

50
when testing a theory via a deductive strategy. In this way research is more detailed than it
would be when studying a larger sample (Gilbert, 2008: 36-37).
Although when conducting the case-studies for this research also figures were used,
the research design remains qualitative (vs. quantitative): primary data are mostly gathered
through interviews.
Since the theater season during which the VAT-raise was applied has ended only a
couple of months ago, the data are collected at one moment in time and the research design is
therefore cross-sectional (vs. longitudinal) (Gilbert, 2008: 36).
6.3. New information
While this master thesis was developed, Ape presented a new research rapport in November
2012, describing the effects of the economic crisis on cultural sectors in The Netherlands
(Blankers, 2012). The rapport describes the economic situation of cinemas, museums and
performing arts organizations, regarding demand, supply and income (Blankers, 2012: 7). The
development of these factors are both analyzed per discipline (museum, performing arts,
visual arts and movies) as well as per category of income structure: subsidized or non-
subsidized (Blankers, 2012: 22).
The VVTP is one of the investigated groups of organizations. The rapport describes
trends using data on changes in demand for theater and income of and employment at
commercial producers, from 2005/2006 through to 2011/2012. These results have provided
useful secondary data for this master thesis, since it also covers the theater season for which
VAT had been increased, 2011/2012.
Not only is the figure for PED revised and indicated at -0,72 (however, again based
on average income per visit to the producer), the rapport also describes the strong effects of
the economic crisis on commercial producers (Blankers et al., 2012).
The new figure for PED weakened the expected effects of decreases in demand,
income and employment. Calculating a new figure for PED that represented all commercial
producers for this master thesis was impossible, due to the unavailability of data and the case-
study design.

51
6.4. Data
Quantitative data
The 2012-rapport (Blankers et al., 2012) contains data that were provided by five VVTP-
members since 2005/06, including season 2011/129. With this relatively small population size,
one organization can enlarge the sample and influence the outcomes (Blankers, 2012: 81).
Prices of substitutes are extracted from the consumer price index for culture and
recreation at the CBS (Blankers, 2012: 27).
Qualitative data
To explain trends in quantitative data and to complete the view on the results, qualitative
interviews were conducted.
At each interview the same questions were posed to three selected commercial theater
producers in semi-standardized interviews, so that where needed other questions could be
inserted during the interview to probe for more information (Gilbert, 2008: 247, 248). For the
interview schedule see appendix B.
The commercial producers were selected based on their availability and their
difference in company size and produced genres. They are referred to as producer A, B and C
in this thesis instead of their real names, to extract most honest answers.
The questions provoked subjective reactions (Gilbert, 2008: 207) of the commercial
producers and therefore supplied qualitative data, whereas the facts and figures that were
extracted from the 2012-rapport make up for the quantitative data.
6.5. Data collection per hypothesis
Hypothesis 1
To test whether box-office prices have increased after VAT on theater tickets was raised, data
in the 2012-rapport that explain this trend are analyzed. In this rapport the ‘ticket prices’ are
approached by calculating the average income per visit to the producer. In this way the figures
are corrected for discounts, free entrance and shifts in interest between the different museums,
organizations or theaters (Blankers et al., 2012: 26). However, these ‘prices’ can be quite
different from the real price a consumer paid at the box-office and therefore do not reflect the
negotiations between theater and producer and the prices to which consumers will respond.
9 Not all VVTP-members could be included due to gaps in data provision.

52
Consumers pay the box-office prices at the theaters, therefore the trends in changes in
‘ticket price’ of the VSCD-theaters can be used to describe changes in box-office prices,
prices on the consumption market (Blankers et al., 2012: 179).
These figures will be taken into consideration when conducting the interviews. In the
interviews questions were posed on the attitude of the producers, during negotiations on
contracts, towards calculating the VAT-raise into the box-office prices. To find out whether
the VAT-raise has played a part in this and caused an increase in box-office price, the
producers will be confronted with the forecasted effect (box-office prices have increased) and
asked whether they considered this to have come true.
Combining these qualitative and quantitative data, will provide an answer to whether
this first hypothesis can be verified or falsified.
Hypothesis 2
To test whether demand has decreased after VAT has increased, data is extracted from the
2012-rapport that lead to the analyzed trend of decreasing demand for commercial theater.
Which part of this can be contributed to the VAT-raise is very hard to analyze at this time and
probably will also be in a couple of years, since it has only been applied during one theater
season. To analyze what the effect of the VAT-raise is on demand for commercial theater the
trends in demand, the changes in average income per visit to the commercial producer and
box-office prices at the VSCD-theaters will be combined with the figures for PED for the
VVTP and the VSCD.
Besides this the difference in consumer income between the years 2011 and 2012 will
be analyzed to describe it’s influence on demand for theater during season 11/12.
The producers will be asked what their ideas on the effects of the VAT-raise on
demand for their products are.
Hypothesis 3
To analyze changes in income of VVTP-members, the trends in demand for and revenue to
the producer from box-office income described in the 2012-rapport are combined with the
answers of the commercial producers in the interviews. In 2010 it was expected that the VAT-
raise would be completely calculated in the box-office prices and a loss in income to the
producer would therefore ‘only’ be caused by a decrease in demand. However, hypothesis 1
shows that it is expected that producers and theaters will have agreed to partially capture the
VAT-raise at the box-office and take the rest of the loss themselves in their revenue from box-

53
office income. This might also result in theater to take precautions and lower the guarantee
sums . It is impossible to determine the exact part of income loss that can be attributed to the
VAT-raise.
Therefore to verify or falsify this hypothesis this effect will be ‘cut into pieces’. (1)
Changes in income of the producer and average income per visit will be analyzed in the 2012-
rapport, and (2) producers will be asked whether they experienced a decrease in guarantee
sums or other ways in which theaters decisions of theaters have affected their incomes. These
outcomes combined with the findings under hypotheses 1 and 2, provide the basis for
verifying or falsifying this hypothesis.
Hypothesis 4
The 2012-rapport shows the (decreasing) trend in employment at the VVTP-members. To
approach which part of this can be contributed to the VAT-raise, the producers will be asked
in the interview whether the amount of fte’s per production and at their office has decreased
during or after season 11/12 compared to season 10/11. To analyze whether this is (partially)
due to the VAT-raise, the findings on income under hypothesis 3 will be combined, since
effects on income will have effects on employment at companies.
Hypothesis 5
The changes in box-office prices (hypothesis 1), demand (hypothesis 2) average income per
visit and revenue to the producer form box-office income (hypothesis 3) will be used to
estimate whether the financial goal set by the government was met. Based on this the income
to the government from VAT on VVTP-members can be estimated, which can then be
estimated for the whole theater sector. If these trends together show that the intended increase
in income to the government from VAT on the performing arts is most probably less 45
million Euros, this hypothesis is verified and Ape (Goudriaan, 2010) ‘has won the battle’.

54
7. RESULTS
Introduction
In this chapter the results that were found through conducting the three interviews and
analyzing secondary data will be set forth and analyzed. Every hypothesis will be tested and
verified or falsified at the end, so in the next chapter, the conclusions of this research, an
answer to the main research question and to the question ‘who was right’, can be formulated.
Testing the hypotheses
1. Box-office prices to commercial theater productions have increased after the VAT-
raise.
Quantitative data
Since the price changes that are calculated in the 2012-rapport describe changes in income per
visit to the producer (Blankers et al., 2012: 26), these figures cannot provide an answer to the
question whether box-office prices for commercial theater have increased during season
2011/12. As explained in chapter 2.2.3., these figures retrieved from the acquittals at VVTP-
members can be quite different from the prices consumers paid at the box-office.
Box-office prices are determined by the theaters and the producers together when
negotiating on contracts. Therefore the increase in box-office prices should be revealed in
data on prices that were supplied by the theaters (Blankers et al., 2012: 51-66, 179). Since
these prices are exclusive VAT and divided by the number of visitors, they express the
average box-office income per visit at the theater (see figure 3 and 4), which are therefore the
box-office prices exclusive VAT.
These box-office prices exclusive VAT are given per year, not per season, from 2005
until 2011. Unfortunately, more than half of season 2011/12 is not revealed in these data.
However, since contract negotiations take place six to eight months before the theater season
commences, the box-office prices from September to December 2011 are negotiated on in
spring 2011 and set at a certain amount. These months are also calculated into and therefore
revealed by the average box-office prices exclusive VAT. Figures show that these prices have
decreased with 4,4% in 2011 compared to 2010 (Blankers et al., 2012: 179). Although the
average box-office prices exclusive VAT are unknown for the rest (January-June) of season
2011/12, it can be expected that these prices have decreased during season 2011/12.

55
However, to express the real box-office prices, the prices that consumers paid for a
theater ticket, VAT needs to be included. The average box-office price in 2010 is € 14,76
inclusive 6% VAT. From January until June 2011 the lower VAT-rate was still applied, from
July until December 2011 VAT was increased10
. Inclusive 6% VAT the average box-office
price is € 14,11 and inclusive 19% VAT the average box-office price is € 15,84 (Blankers et
al., 2012: 179).
These figures indicate a rise at the box-offices, of 7,32 % for September-December
2011 compared to 2010. The average box-office price seems to have decreased for January-
June 2011, where the VAT-raise was not yet implemented, compared to 2010. And the
increase from September-December 2011 compared to January-June 2011 is 12,26 %, but the
prices for January-June 2011 where set in spring 2010, when the VAT-raise was not yet
announced.
These figures show that the VAT-raise did cause an average increase in box-office
prices for all theater productions at VSCD-theaters, most probably by around 7,32 %. Based
on these secondary (quantitative) data, it can be concluded that box-office prices to
commercial productions did increase after VAT was increased, but not enough to ‘protect’ the
producers from needing to capture a part of the VAT-raise in their own revenue from box-
office income.
Qualitative data
The three producers individually agreed that discussion on calculating VAT into box-office
prices differs per form of contract, and stated that the most used contract form is ‘split with
guarantee sum’. Hardly any production is sold via buyout and when it is, then it is for smaller
productions in smaller halls with lower box-office prices.
All three producers confirmed that while box-office prices for theater season 11/12
were negotiated on, it was clear that VAT would increase per July 1st 2011. All three wanted
to increase box-office prices with the same percentage as VAT increased, because all three of
them state that demand for their productions is not much influenced by the (height of) box-
office prices. What matters is the popularity of a production and the circumstances of
consumers. Theaters did not always agree to increase box-office prices by 12,3 %. Whether
they were able to convince the theaters to increase box-office prices after the VAT-raise
differs per producer.
10
Often the months July and August are not included in theater seasons, but the VAT-raise was implemented at
July 1st 2011

56
Producer A stated that most theaters agreed to raise box-office prices after the VAT-
raise, however not always with the full 12,3% that was needed. Sometimes it was chosen not
to increase box-office prices by the full percentage, when prices that consumers needed to pay
at the box-office would then end up over a certain level, for example over € 30. ‘For
psychological reasons it was then decided to stay under € 30’, producer A states, indicating
the assumption that consumers are more willing to pay € 29,50 than € 30,50. A few theaters
found box-office prices too high already and therefore plead not to increase them by the full
percentage. Producer A stated that when a rise in box-office prices was agreed on for season
2011/12, this was completely due to the VAT-raise.
Producer B stated that no theater was willing to increase box-office prices with the
12,3% that was needed after the VAT-raise, because theaters feared decreases in demand.
This difference in experience is probably due to the different price levels the productions are
in: box-office prices inclusive VAT for productions of Producer A cost are between € 20 and
€ 30, whereas those same prices for productions of Producer B are between € 50 and € 60.
Producer A and B differ in most produced genre. Box-office prices differ per genre: comedy
tickets are cheaper than those for drama, those for drama are cheaper than tickets to musical
and international shows. As producer B says: ‘13% out of € 55 is more than 13% out of € 20’.
Producer C said whether or not the VAT-raise was calculated into the box-office
prices differed per theater and per production. He stated this was caused by the differences in
attitudes of theater managers: some wanted to sign a signal to the audience saying ‘we think
about your money’ (e.g. not include VAT-raise in box-office prices), other theaters wanted to
show they spared the producers (e.g. include VAT-raise in box-office prices).
Stepwise raising box-office prices to be able to reach a raise of 12,3% at the box-
offices compared to the price level before the VAT-raise was implemented, seemed not to
have been a strong point of negotiation. Either theaters agreed to increase box-office prices
after the VAT-raise or they did not.
Verified or falsified?
The difference in experience when negotiating on box-office prices explains the
average rise of 7,32 % at the box-offices that was found: not for every production the box-
office prices were raised with 12,3% and not for every production had prices not been raised
at all.

57
Box-office prices have increased with 7,32% and income per visit to the producer has
decreased with 5,5%. These figures show that box-office prices have increased after the VAT-
raise but not by the full 12,3% that was needed (and was predicted) to cover for the VAT-
raise. Therefore the theaters and commercial producers have captured a part of the VAT-raise
in their own revenue from box-office income. For some commercial productions box-office
prices were raised after the VAT-raise and for some others they were not. Whether or not
theaters agreed to do so, depended on the negotiations with theaters.
Before season 2011/12 box-office prices at VSCD-theaters decreased, in 2011 they
also would have, had the VAT-rate been kept at 6%. Inclusive 19% VAT, box-office prices
increased by 7,32%. In the 2010-rapport it was expected that ‘ticket prices’ would be raised
with 12,3%. By that box-office prices were meant (since these ‘ticket prices’ were also used
to calculate effects on demand), but the average income per visit to the producer was
calculated. However, both average income per visit to the producer as well as box-office
prices did not increase by 12,3%. Assuming Ape meant to forecast an increase in box-office
prices, then this partially came true.
The hypotheses that box-office prices increased after VAT increased is verified.
2. Demand for commercial theater decreased due to the VAT-raise
Quantitative data
The theater sector is amongst the arts sectors that have experienced the biggest fall in demand
during the economic crisis. Theaters have had to cope with demand decreases and the effects
on attendance are most negative for VVTP-members compared to the other investigate groups
of cultural organizations. This trend also shows in season 2011/12 (Blankers et al., 2012: 10).
In 2010 a figure for price elasticity of demand of -1,09 was found for VTTP-
productions. An increase in VAT of 13% would cause an increase in average income per visit
of 12,3%, which would then cause a decrease in demand of 13,5 % (Goudriaan, 2010: 3). In
2012 a new figure for PED for VVTP-productions was found: -0,72 (Blankers et al., 2012:
154). Both these figures were however based on average income per visit, whereas a figure
for PED describes consumer reactions.
When testing the previous hypothesis an increase of 7,32% in box-office prices at the
VSCD-theaters was found for season 2011/12 (Blankers et al., 51-66, 179). Using this
percentage increase and the new found figure for PED to calculate the effect on demand, is
impossible since they are regarding two different audiences and ‘ticket prices’. However,
using this new figure for PED and the income per visit to the VVTP-member would also not
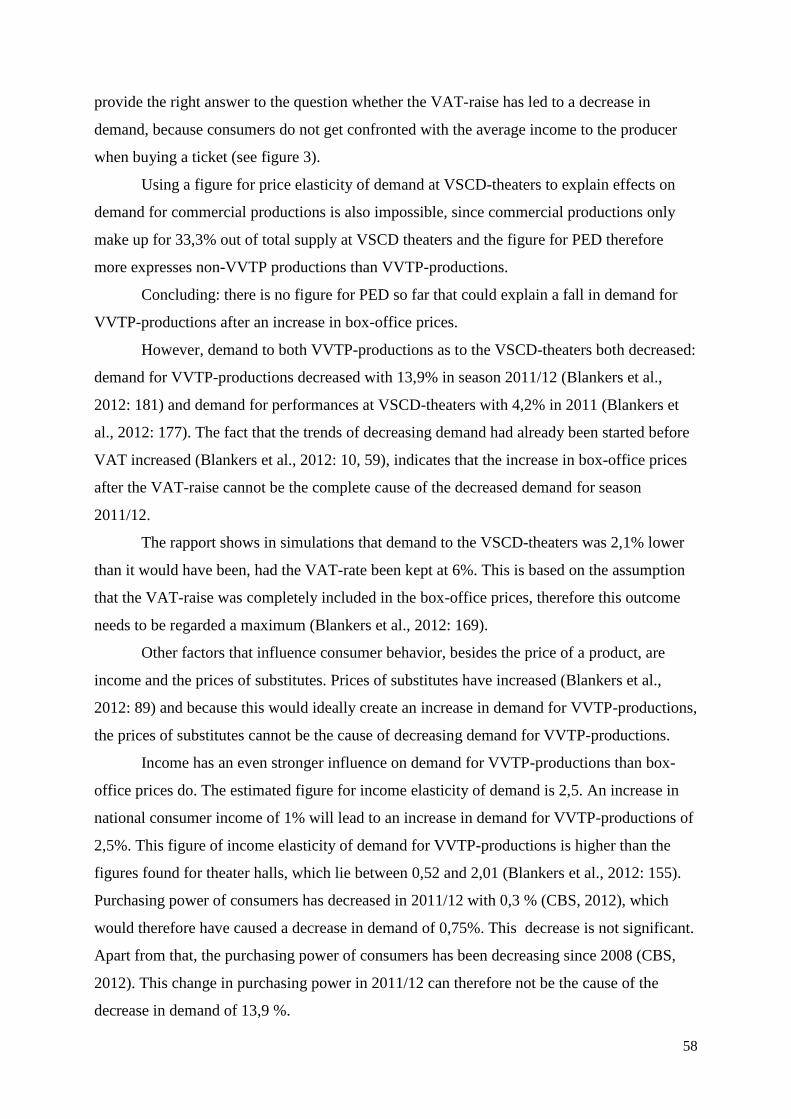
58
provide the right answer to the question whether the VAT-raise has led to a decrease in
demand, because consumers do not get confronted with the average income to the producer
when buying a ticket (see figure 3).
Using a figure for price elasticity of demand at VSCD-theaters to explain effects on
demand for commercial productions is also impossible, since commercial productions only
make up for 33,3% out of total supply at VSCD theaters and the figure for PED therefore
more expresses non-VVTP productions than VVTP-productions.
Concluding: there is no figure for PED so far that could explain a fall in demand for
VVTP-productions after an increase in box-office prices.
However, demand to both VVTP-productions as to the VSCD-theaters both decreased:
demand for VVTP-productions decreased with 13,9% in season 2011/12 (Blankers et al.,
2012: 181) and demand for performances at VSCD-theaters with 4,2% in 2011 (Blankers et
al., 2012: 177). The fact that the trends of decreasing demand had already been started before
VAT increased (Blankers et al., 2012: 10, 59), indicates that the increase in box-office prices
after the VAT-raise cannot be the complete cause of the decreased demand for season
2011/12.
The rapport shows in simulations that demand to the VSCD-theaters was 2,1% lower
than it would have been, had the VAT-rate been kept at 6%. This is based on the assumption
that the VAT-raise was completely included in the box-office prices, therefore this outcome
needs to be regarded a maximum (Blankers et al., 2012: 169).
Other factors that influence consumer behavior, besides the price of a product, are
income and the prices of substitutes. Prices of substitutes have increased (Blankers et al.,
2012: 89) and because this would ideally create an increase in demand for VVTP-productions,
the prices of substitutes cannot be the cause of decreasing demand for VVTP-productions.
Income has an even stronger influence on demand for VVTP-productions than box-
office prices do. The estimated figure for income elasticity of demand is 2,5. An increase in
national consumer income of 1% will lead to an increase in demand for VVTP-productions of
2,5%. This figure of income elasticity of demand for VVTP-productions is higher than the
figures found for theater halls, which lie between 0,52 and 2,01 (Blankers et al., 2012: 155).
Purchasing power of consumers has decreased in 2011/12 with 0,3 % (CBS, 2012), which
would therefore have caused a decrease in demand of 0,75%. This decrease is not significant.
Apart from that, the purchasing power of consumers has been decreasing since 2008 (CBS,
2012). This change in purchasing power in 2011/12 can therefore not be the cause of the
decrease in demand of 13,9 %.

59
Another specific factor for decreasing demand for VVTP-productions seems to be
increasing supply of VVTP-members. Combining increasing supply and decreasing demand,
means average attendance per performance has decreased even stronger (Blankers et al.,
2012: 83,85).
Qualitative data
Although other factors play a role, the three producers stated that increasing VAT has
‘certainly not helped’, in other words: it did not stop or reverse the decreasing trend in
demand.
The three producers find it hard or even impossible to analyze which part of the
decrease can be contributed to the VAT-raise. Producer C said it is impossible to calculate
how many people stayed away due to the VAT-raise. And ‘hits are above laws’, indicating the
strong demand for popular performances regardless changes in box-office prices. The VAT-
raise alone is not the cause of decreasing demand.
According to producer A it differs per genre what the effect of the VAT-raise could
have had on demand. With comedy or entertainment (musical, international shows, etc.) it is
different than with theater plays, because the reactions of consumers differ per genre. He
expects musical and comedy audiences to pay more attention to price changes than audiences
at theater plays.
Producer B does not think the decrease in demand that was noticed, is due to the
increase in VAT. He says he is forced by theater managers to price tickets at € 25 for a very
popular performance, whereas he is sure that if tickets would cost € 50 it would still be sold
out (referring to the same characteristics of hits as producer C).
According to B decreasing demand is due to the economic crisis, and to changes in
agendas of people that used to attend theater around 20 years ago. The theater sector has not
innovated enough to capture the generation following this group of people, according to B.
Verified or falsified?
Although demand to commercial theater has decreased strongly in 2011/12, it is impossible to
contribute this to the increased VAT. However, consumer income and prices of substitutes
cannot be addressed as the cause either. Increased supply of VVTP-productions might have
played a more important role in the decreasing demand for commercial theater. Although the
VAT-raise has probably had a small negative influence on demand for commercial theater due
to the slight increase in box-office prices, the fall in demand of 13,9% needs to be contributed

60
to other circumstances as (people’s perception of) the economic crisis. This hypothesis is
falsified.
3. Commercial theater producers experienced negative effects on income of increased
VAT
Quantitative data
The average income per visit to the producer has decreased by 5,5% in season 2011/12
(Blankers et al., 2012: 179, 182). Also the part of revenue from box-office income in total
income has decreased. In 08/09 income from ticket sales made up 95% of total financing, in
11/12 this part has decreased to 84%. Only a very small part (1%) comes from sponsoring and
subsidy (Blankers et al., 2012: 87). The growing gap is referred to as ‘other’, referring to
other ways of generating income as merchandizing, renting out room or equipment and maybe
even loans.
The effects on income of an increase in box-office prices due to a VAT-raise differ
from the effects of ‘normal’ price increases. With normal price increases a possible decrease
in demand is compensated by an increase in income per visit. Whereas in the first case, box-
office income decreases. If all of the VAT-raise is covered by the box-office prices, a fall in
demand will cause a decrease in revenue to the producer. If only a part of the VAT-raise is
covered by the box-office prices, income per visit to the producer decreases. This means that
an increase in VAT will almost always cause a decrease in box-office income, which has
negative effects on the income capacity of organizations (Blankers et al., 2012: 18).
The box-office income of nine VVTP-members11
in season 10/11 was estimated at
94.338 million Euros, which was 86% of total income. In season 11/12 the share in income of
box-office has decreased to 84% and is estimated at € 77.262 million Euros (Blankers, 2012:
182, 87). Using these figures the VAT that was paid per season by the VVTP-members can be
estimated. In season 10/11 this was 6% out of 94.338 million Euros, which is € 5.660.280. In
11/12 19% had to be paid out of € 77.262 million Euros, which is € 14.679.780. Had the
VAT-rate been kept at the lower level of 6%, the figure in the second case would have been €
4.635.720. The average amount of VAT paid (apart from effects of the VAT-raise that might
have cause this amount of income to be lower than it would have been otherwise) of [ ( €
14.679.780 - € 4.635.720) / 9 =] € 1.116.006 per producer. To use this data to estimate the
loss in income per producer, data on VAT paid over material to produce (see chapter 2.2.4.) is
11
Nine VVTP-members supplied useful data on income, eight members on number of perfomances
61
needed, because the difference between what is paid over hired or purchased material and the
VAT paid by over revenue from box-office income is the result that is paid.
Qualitative data
Producer A agrees that the VAT-raise has affected income to his company negatively,
but does not know by which percentage and he does not think this percentage to be very high.
He contributes decreased income to the overall situation of the theater sector, which ‘runs
badly’, the reduced popularity level of his productions produced in 11/12 and the overall
economic crisis. Producer A: ‘we have definitely experienced a loss in income, but not much
of that is due to the VAT-raise’. The impression of producer A that demand to his productions
is not (very) price elastic and that most of the time theaters did agree with him to increase
box-office prices by the full percentage of the VAT-raise and to remain at that price level
after VAT had decreased again (see timeline chapter 2), makes him expect that income from
ticket sales to his drama productions has increased with about 10%.
Producer B states the VAT-raise did play a role in decreasing income in season 11/12.
He gives an example of a production that was staged before and in 10/11, as well as in 11/12.
In 10/11 this production was still profitable, but in 11/12 it produced a financial loss.
According to him, this is owing to the VAT-raise.
Producer C says it is impossible to calculate which percentage of decreased income is
due to the VAT-raise, because it is impossible to calculate how many people stayed away due
to the VAT-raise. ‘But’, he says, ‘for every person that did attend, more tax had to be paid’.
The producers list other factors to be more important for decreased income. The most
important factor in this is the overall economic crisis, which had started already in 2008, so
three years prior to the VAT-raise. But the effects of the economic crisis on sectors like
culture are only getting clear, and researchable, now (Blankers et al., 2012: 7). The effects of
the recession follow two paths: (1) due to a decline in consumer spending in the cultural
sector, it becomes more difficult to receive and increase own income through (ticket) sales
and (2) also a decrease is found in sponsoring and donations (Blankers et al., 2012: 21).
Parallel to this, different local governments introduce large subsidy cuts due to the economic
situation (Blankers et al., 2012: 7). These subsidy cuts might result in lower guarantee sums
and higher supplement prices (these supplements often cover some costs for the building,
which is mostly also subsidized). Producer A and B experience both these trends.

62
Verified or falsified?
Average income per visit and the percentage part of revenue from box-office income out of
total income both decreased. All three producers agree that the VAT-raise affected their
income negatively. Only when demand stays the same or increases and VAT is completely
calculated into the box-office price, does an increase in VAT not have a negative effect on
income of producers (and theaters). Set forth above: box-office prices have not increased
enough to capture the VAT-raise and demand to commercial productions has decreased,
therefore the VAT-raise does have a negative effect on income of commercial producers. This
hypothesis is verified.
4. Employment at commercial producers has decreased due to the VAT-raise
Quantitative data
For season 2011/12, the number of employers as well as the number of fte’s have decreased at
both the office and the productions. The number of employers has decreased by 1,3% for that
season and the number of fte’s at commercial production companies by 9,1% (Blankers et al.,
2012: 182).
As with the previous hypothesis on income, it is hard to analyze which part of this
decrease in employment can be attributed to the VAT-raise. The factors that play a role in
decreasing income at producers also influence employment, since a company’s income
directly influences it’s financial room for employment.
Qualitative data
Also on this point the producers differ in their impressions. Producer A disagreed with the
statement that the VAT-raise negatively influenced employment at his office. Both fte’s for
productions as well as for the office have not been decreased at his company during season
2011/12.
But producer B agreed that employment at his company decreased during season
2011/12 and that this was partially due to the VAT-raise. The reason he gave for this is that
the VAT-raise has kept commercial producers from producing large productions. He stated
that it is hard to indicate the cause of negative effects, but when VAT increased things as
employment changed for the worse at his company.
‘During that period change appeared’, he explains, ‘especially in the part of the sector
with higher box-office prices. Those larger productions with higher box-office prices, are not
63
produced as much as they were before 2011/12, because fewer theaters wanted to take the
risk. Therefore, less people are working in the sector and fewer ad hoc employees are hired’.
At the office of producer B there had been a cut back of 25% in fte’s. ‘This is not
completely due to the VAT-raise, but the VAT-raise did not help to prevent this’, he stated.
More factors can be indicated, but the VAT-raise played a role in this. ‘The government
thought it would not make a difference at the commercial producers, which are the
entrepreneurs of the sector, but it did make a difference. Not for the very popular productions,
but for the more vulnerable productions and nowadays everything seems to be vulnerable.
Therefore, at the point of employment, I am sure it did have negative effects.’
Verified or falsified?
The secondary (quantitative) data from the rapport show that employment has slightly
decreased at commercial producers during season 2011/12. Although producer B has
experienced a strong negative trend in employment in or around season 2011/12, this cannot
be contributed to the VAT-raise.
Employment is a result of income of companies. Therefore, in the theater sector
developments in employment for one season will probably follow developments of income
from the previous season. The effects on employment of the VAT-raise will then have
appeared during season 2012/13. For this season there is no secondary data available, only the
experiences of the interviewed producers. However, at the moment of interviewing, the
experiences (still) differ.
The goal of this research is to investigate the short-term effects of the VAT-raise. On
this short-term the effects of the VAT-raise on employment at commercial producers cannot
be signaled. Still, regarding the negative effects this VAT-raise has had on income of
commercial producers, it is expected that employment will suffer from this.
At this point in time, this hypothesis is falsified, with the remark that it might be
verified if this trend is looked at in a year or more.
5. The intended raise in income to the Dutch government from VAT was not met during
the first year.
Quantitative data
There is no strong evidence in the form of quantitative data showing the exact financial
income to the government from the VAT-raise on the performing arts. However, although
demand for productions of the VVTP-members has decreased for season 2011/12 and average

64
income per visit also decreased, testing hypothesis 3 showed that the difference between 6%
and 19% for season 2011/12 over revenue from box-office income is € 10.044.060. This is the
amount that these nine VVTP-members have lost in income due to the VAT-raise and that is
‘won by the government’.
These nine members approximately produce half of total VVTP-productions12
, so total
loss in income due to the higher VAT-level for the VVTP will be around 20 million Euros.
In chapter 2 the size of the VVTP was estimated at 18,3% on the total performing arts
market. If 20 million Euros make up for 18,3% of the total raise in income to the government
from the VAT-raise, then this total raise is 103,3 million Euros, ceteris paribus.
For this calculation it is assumed that VAT paid on purchased or hired material has
been the same in season 2010/11 as in 2011/12. What remains after the producer has balanced
out VAT over bought or hired material with VAT over revenue from box-office income is the
true benefit to the government. It can be assumed that VAT paid over hirer or bought material
in 2010/11 is approximately the same as in 2011/12. However, what exactly these amounts
are and which changes in demand for all other forms of performing arts have appeared, is
unknown. Therefore this calculation ‘stops’ at this point, but it is unlikely that this balancing
out would result in reclaiming 58 million Euros or more by suppliers on the purchase and
consumption submarkets of the total performing arts market.
Another way of estimating the income to the government from the VAT increase is analyzing
box-office income at the VSCD-theaters. When looking at figure 3 and 4, the theaters also
balance out VAT that is paid over guarantee sums or revenue from box-office income to the
producer, with VAT that is paid over box-office income at the theater. The income from VAT
to the government is the result after both theater and producer have balanced out the VAT.
However, the VSCD supplies data per year not per season (see also chapter 2.2.2.) and
the last year of the period for which data was gathered was 2011 (Blankers et al., 2012: 179).
Only the months September until December of that year are included in season 2011/12. Box-
office income has been decreasing since 2008. Therefore it would be too speculative to
calculate paid VAT for season 2011/12 at the VSCD-theaters by simply using data from 2011.
Besides the fact that also for the VSCD-theaters the amount of VAT paid over guarantee sums
or revenue from box-office income that is handed over to the producers, is unknown.
12
The number of members differs per theater season. Ape (Blankers et al., 2012) counts at one place seventeen,
at another nineteen. At the VVTP-fair in February 2013 nineteen members were counted (see footnote 1)

65
Qualitative data
All three producers agreed to this hypothesis and stated they knew from the start that this
measure would not reach the intended effects. Producer A states that when everything in the
performing arts sector decreases, the number of productions, the fte’s, income, demand, and
so on, then income to the government will decrease in more sectors than just in the
performing arts. Taxes on loan, other products, cafes and restaurants, everything decreases.
Producer A thinks it possible that the hoped for effect of the VAT-raise to the government
was eliminated by the drop out in all the other taxes.
The VAT-measure was, according to producer A, not a way to economize, but a purely
political game to give Geert Wilders a measure to show his supporters that he ‘had dealt with
those artists’. Therefore this measure had never had the intention to truly yield anything. It
was already a much governmentally discussed measure, so it was more a symbol for ‘look at
us, we are cutting back’.
Producer B is sure that the financial goal set by the government was not met. This
measurement was according to producer B a contra productive one: ‘The emotional effect has
been large. The signal to the public that this measure provided was very negative. First,
together with the subsidy cuts, this measure put culture in a very bad light. Second, at a time
were people do not easily spend their money, this measure made people think that attending
theater had become very expensive. The damage done by increasing VAT and cutting subsidy
is much larger than the 48 million, respectively 200 million Euros, that the government sought
to ‘gain’.’
Producer C also states the measure was contra productive. According to him the
decision to increase VAT on performing arts was purely sentimental. ‘And very stupid,
because it did effect the entrepreneurs the most.’ Pure effects (monetary, measurable effects)
were not the only effects. With that he refers to the emotional effect that was also named by
producer B.
Verified or falsified?
The producers all think this measurement has not provided the financial income the
government hoped for. However, the calculations with quantitative data show that this
intended increase of 45 million Euros in income to the government from VAT might have
been reached after all.
Although the share of the VVTP on the total performing arts market in The
Netherlands is only estimated and paid VAT over products purchased or hired by the

66
producers and theaters is unknown, these calculations here lead to carefully assume that the
goal set by the government is met and to falsifying this hypothesis.

67
8. CONCLUSIONS
The main research question was:
What were the short-term effects of VAT-raise on commercial theater producers in The
Netherlands?
To analyze this a rapport written in 2010 formed the starting point (Goudriaan, 2010) . This
rapport was written before VAT increased from 6% to 19% and forecasted a domino-effect:
box-office prices would increase with 12,3 %, due to the price elastic character of commercial
theater demand would fall with 13,5%, income would decrease accordingly, which would
cause a decrease in employment and this all would have the effect that the government would
not be able to increase income from VAT on the performing arts by the desired 45 million
Euros.
It has been almost three years since this rapport was written and almost one year since
the VAT-measure was reversed: VAT on performing arts has been in the higher rate from July
1st 2011 until July 1
st 2012. Therefore at this date, the short-term effects can be evaluated.
First of all, box-office prices did increase, however not with the full percentage that
was needed to cover the VAT-raise. What exactly consumers pay at the box-office for
commercial theater is unknown since data at VVTP-members was gathered on average
income per visit and the average box-office prices exclusive VAT at VSCD-theaters also
explain the rest of VSCD theater supply. However, this second figure best reflects the changes
in box-office price for the performing arts sector and with that for commercial theater
producers. Including VAT an increase of 7,32% is noticed at the box-offices of VSCD-
theaters. The interviewed commercial producers have experienced the contract negotiations
with theaters on including VAT into box-office prices differently. This difference in
experience leads to the conclusion that box-office prices have increased after the VAT-raise
was implemented, but not with the full percentage that was needed to keep the VAT-raise
from affecting average income per visit to the producer.
Also a decrease in demand for commercial productions has been noticed. It is
impossible to calculate how many people stayed away after VAT was increased, but if the
VAT-raise did affect demand for commercial theater, it must have been negatively. Although
68
both figures for PED that were found were based on average income per visit in relation to
demand and are therefore not reliable to reflect consumer reactions at the box-offices, it can
be expected that demand for theater in general and commercial theater in particular is
sensitive to changes in box-office prices.
An increase in box-office price that is unable to capture the VAT-raise and a fall in
demand inherently leads to a decrease in revenue from box-office income to the producer.
What exactly the effect on producers’ income was is impossible to calculate at this moment,
because (as figure 2 and 3 in chapter 2 show) more factors influence revenue from box-office
income to the commercial producer than consumer demand alone. But per visit more VAT
had to be paid during season 2011/12 than during other seasons and box-office prices were
not raised enough to capture this.
At this date of writing the effect of the VAT-raise on employment at commercial
producers seems negligible. One producer has experienced a loss in employment, but which
part of that can be contributed to the VAT-raise is unclear. At this point the overall economic
crisis seems to play a bigger part. However, employment is sensitive to changes of a
company’s income and income to the commercial producers has decreased due to the VAT-
raise. The effect on employment might therefore show later. But because VAT has been
decreased to 6% again, it is more likely that commercial producers are able to intercept the
effect this has on employment.
Last but not least, the income result to the government from the VAT-raise on
performing arts was estimated. Due to a somewhat complicated tax system and the
unavailability of data, the exact benefit to the government cannot be calculated. However,
although demand for commercial theater decreased even more than was expected, the increase
in VAT over box-office income in the 19%-situation compared to the 6%-situation seems to
be enough to cover the 45 million Euros that were wanted from the performing arts sector.
Although the VAT-raise might have provided financial benefit to the government, the
measure was luckily reversed one year after it was implemented. As seen above, the effects it
has had limit commercial producers to increase revenue from box-office income by raising
box-office prices. The measure has mainly had negative effects on income of commercial
producers and these non-subsidized entrepreneurs need revenue from box-office income to
keep producing theater at the same pace and to be defensible to the economic crisis.
The short-term effects on commercial theater producers of the VAT-raise were: an
increase in box-office prices and a decrease in demand. The VAT-raise influenced contract

69
negotiations, which shows the importance of contracts in the theater sector. In contracts box-
office prices, supplements and the division of box-office income are determined.
Apart from this the VAT-raise caused a lot of hassle and irritation. The commercial
producers did not understand the decisions that were made by the government, experienced
this as an additional way to harm the performing arts sector, consider the media attention that
this measure gathered to be harming the image of and demand for theater and had to discuss
with theaters on including this VAT-raise in box-office prices or not, which caused
unnecessary discussion. However, the VAT-raise probably provided the only positive effect
the government attended: an increase in income from VAT on performing arts of 45 million
Euros.

70
FURTHER RESEARCH
Apart from monitoring the performing arts sector more intensively, calculating a figure for
PED that reflects consumer reactions to changes in box-office prices and gathering more
different data, some more proposals for further research can be done after writing this master
thesis.
First of all, the effects of the VAT-decrease should be analyzed. All three producers
noted the VAT-decrease for season 2011/12 as also having negative effects on them and
maybe even more than the VAT-raise. The discussion on box-office prices continued when
VAT was lowered to 6% again in 2012 (see figure 5). According to producer B, the VAT-
decrease following the VAT-raise resulted in a lower level of box-office prices for season
12/13 than for 10/11. In that way the VAT-raise had an indirect decreasing effect on box-
office prices. When VAT decreased, every theater wanted to decrease box-office prices with
the full 13%, producer B stated. This meant that box-office prices in some cases ended up
lower than they started before the VAT-raise. When the increase had not been completely
calculated into the box-office prices, but the decrease was, this caused a decline in box-office
price. Also some public attention was drawn to which theater lowered its box-office prices
and which did not, which sometimes forced theaters to do so (or at least to pretend).
Another remarkable finding is found when comparing the trend in average income per
visit to the producer and the trend in box-office prices at the theaters. The first one decreased,
whereas the second increased. If all other circumstances stayed the same, then (according to
figure 3 and 4) the trends in these figures should follow the same path. This indicates a
change in contracts between theaters and producers. The share in revenue from box-office
income to the producer has declined. This could be due to a smaller part of the producer in the
division of box-office income and/or an increase in supplements on tickets. Both these trends,
but especially the second one is noticed by the three commercial producers and myself.
On the purchase market the position of theaters appararently have gotten stronger and the
positions of producers have weakened.

71
BIBLIOGRAPHY
Begg, D., Fischer, S. & Dornbusch, R. 2008. Economics 9th edition. London etc: McGraw-
Hill Education (UK) Limited.
Blankers, I., Goudriaan, R., De Groot, N., Everhardt, T., Friperson, R. & Mazzola, G. 2012.
Effecten van de economische crisis in de cultuursector. Den Haag: Aarts De Jong Wilms
Goudriaan Public Economics bv (Ape).
Broek, A. van den, Haan, J. de & Huysmans, F. 2009. Cultuurbewonderaars en
cultuurbeoefenaars: Trends in cultuurparticipatie en mediagebruik. Den Haag: Sociaal en
Cultureel Planbureau (SCP-publicatie 2009/8).
Ganzeboom, H., Maas, I. & Verhoeff, R. 1990. Podiumkunsten & Publiek. Rijswijk:
Ministerie van Welzijn, Volksgezondheid en Cultuur.
Gilbert, N. (ed.) 2008. Researching social life. Los Angeles etc.: Sage.
Goudriaan, R., Groot, N. de, Notenboom, A., Schrijvershof, C. & Hout, C. van, 2008.
Evaluatie van het verlaagde btw-tarief cultuur en media. Den Haag: Aarts De Jong Wilms
Goudriaan Public Economics bv (Ape).
Goudriaan, R. 2010. Effecten van de btw-verhoging bij de vrije theaterproducenten. Den
Haag: Aarts De Jong Wilms Goudriaan Public Economics bv (Ape).
Groot, N. de. 2007. Increasing the price of theater, a modern tragedy?. Amsterdam:
University of Amsterdam.
Kleingeld, E. 2011. Podia 2010. Amsterdam: VSCD.
Kleingeld, E. 2012. Podia 2011. Amsterdam: VSCD.

72
Langeveld, C. 2009. Zaken van Zalen. Amsterdam: Boekmanstudies.
Plasterk, R.H.A. & Jager, J.C. de. Kabinetsreactie evaluatie verlaagd btw-tarief cultuur en
media. Den Haag: Ministerie OCW en Ministerie Financiën.
Rechtbank ’s-Gravenhage, 389722/ HA ZA 11-829 (LJN.BQ8751); d.d.22-06-2011
Seaman, B. 2005. Attendance and Public Participation in the Performing Arts: A Review of
the Empirical Literature. Atlanta: Andrew Young School of Policy Studies, GSU.
Throsby, D. 2001. Economics and Culture. Cambridge: Cambridge University Press.
TK (2001/2002)
Belastingplan 2002. Tweede Kamer, vergaderjaar 2001/2002. 28015, memorie van
toelichting, onderdeel C.6.
TK (2010/2011)
Belastingplan 2011. Tweede Kamer, vergaderjaar 2010/2011. Wet van 23 december 2010,
Stb. 2010, 872, V-N 2011/5.3.2.
TK (2010/2011)
Tweede Kamer, vergaderjaar 2010/2011. Kamerstukken I 2010/11, 32 504, nr. D, 32 505, 32
401, V-N 2010/67.2.
TK (2010/2011)
Belastingplan 2011. Tweede Kamer, vergaderjaar 2010/2011. Meer dan kwaliteit, een nieuwe
visie op cultuurbeleid.
TK (2011/2012)
Begrotingsakkoord 2013. Tweede Kamer, vergaderjaar 2011/2012. Advies Raad van State
Wet uitwerking fiscale maatregelen Begrotingsakkoord 2013
Towse, R. 2010. A Textbook of Cultural Economics. Cambridge: Cambridge University Press.

73
Vries, K.G. de, Niekerk, N.C.M. van. 1997. Heroriëntatie arbobeleid en Arbowet. Den Haag:
Sociaal Economische raad.
Websites
www.cbs.nl
www.ser.nl
www.vvtp.nl

74
APPENDICES
Appendix A: Demand elasticities
Appendix B: Interview schedule
Appendix C: interview A
Appendix D: interview B
Appendix E: interview C
Appendix F: Summary in Dutch (samenvatting)

75
APPENDIX A
DEMAND ELASTICITIES
A.1. Introduction
To be able to describe hypotheses about the influence of changes in price, income and prices
of related goods, different numbers for elasticity of demand can be calculated.
If all other things are kept equal, the demand curve, which shows the relation between
box-office price and quantity demanded, is a straight line (see figure A). Next to the (own)
price elasticity, there are two other forms of demand elasticities: income elasticity and cross-
price elasticity (Begg et al, 2008, p.56).
This appendix chapter will outline, more in detail than in chapter 3, how price
elasticity of demand, income elasticity of demand and cross-price elasticity is calculated and
give an overview on what has been found on these topics for demand for theater.
A.2. Price elasticity of demand
When estimating price elasticity of demand, changes in consumer income and changes in
prices of substitutes are taken into account, since only then the effects of changes in box-
office prices can be isolated. The value of the figure of price elasticity of demand also
depends on the level of analyses: sector (macro level) or organization (micro level) (Blankers
et al., 2012: 132).
Figure A is used to
explain the calculation of price
elasticity of demand. As stated
above, the slope of the demand
curve (and whether it is a
straight line or curved), depends
on the characteristics of a good,
its price elasticity included
(Begg et al., 2008: 55).
PED is an abbreviation
for price elasticity of demand,
also referred to as demand elasticity (Begg et al., 2008: 56).
0 5
10 15 20 25 30 35 40 45 50 55 60 65
0 100 200 300 400 500 600
Pri
ce (
€ /
tic
ket
)
Quantity (number of tickets)
Figure A: Demand for theatre tickets

76
Definition of PED by Begg et al., page 56:
The price elasticity of demand (PED) is the percentage change in the quantity demanded
divided by the corresponding percentage change in its price.
PED = (% change in quantity) / (% change in price).
Using the model above, the demand curve used as an example in chapter A.1. leads to table A,
where for every decrease by 10 euros in box-office price and its corresponding increase in
quantity of tickets demanded, the figure for PED is calculated.
Table A: Calculating price elasticity of demand
In this case demand falls when prices rise, so
the figure for PED is preceded by a minus
sign. For most goods demand curves slope
down, therefore their changes in price and
changes in quantity have opposite signs and
demand elasticity is a negative number. But
the minus sign is often left out, because
nearly all goods have a negative PED
number (Begg et al., 2008: 56).
The first figure for PED in table A is ‘minus infinity’, because the percentage change
in quantity from 0 to 100 would be 100/0 and any positive number divided by zero is infinity
(Begg et al., 2008: 57).
As shown in table A demand elasticity falls when we move down the demand curve.
At higher prices a higher PED is found and at lower prices PED turns to small and even
decreases to zero when the price per ticket is changed from € 10 to zero. This is also true for
(almost all) curved demand schedules. For linear demand schedules, it does not matter
whether PED is calculated using price increases or decreases. For nonlinear demand
schedules, down sloping curves, the change in quantity demanded differs per price change,
which is resolved by calculating PED for very small changes in price as the curvature
negligible (Begg et al., 2008: 58).
Price
( € / ticket)
Tickets
demanded
PED
60 0 - ∞
50 100 -6
40 200 -5
30 300 -2
20 400 -1
10 500 -0,5
0 600 0

77
From the height of the PED grade it can be read out whether demand for an
investigated good or service is elastic, inelastic or unit-elastic. If the figure exceeds -1 demand
is elastic (Begg et al., 2008: 58). In the previous example demand is elastic for prices between
€ 30 and € 60. This means that increases in price within this range will lead to a decrease in
demand (the higher the starting price, the higher the PED so the bigger the decrease in
quantity demanded).
Demand is inelastic when PED lies between 0 and -1 (Begg et al., 2008: 58). In the
previous example demand is inelastic at € 10 or € 0 euros. At these prices a ‘normal’ rise will
lead to a negligible change in demand.
At PED = -1 demand is unit-elastic (Begg et al., 2008: 58). At this point total spending
of consumers is unchanged when prices rise or fall. Total spending is the price times the
demanded quantity, e.g. how much is spend by consumers at a certain price. Beginning at
high prices and moving down along a demand curve, total spending will first increase and
then decrease. At the turning point, demand is unit-elastic. Total spending rises at points
where PED is elastic and prices are cut or at points where PED is inelastic and prices are
raised. And total spending falls when PED is elastic an prices are raised or when PED is
inelastic and prices are cut. But at the point where demand is unit-elastic, it means that the
raise or cut in price leads to an equal rise or fall in the demanded quantity and therefore in
total spending. E.g.: the rise or fall in quantity demanded compensates for the change in price
(Begg et al., 2008: 61). For example: when the price of the tickets for the performance in the
example rises from € 20 to € 21, PED remains -1.
Although PED differs per price on demand schedules for goods, statements can be
made about whether elasticity of demand for a good is high or low, because most goods have
a ‘normal’ price, a price that is usually charged (Begg et al., 2008:58).
PED is of demand elasticities used the most (Begg et al., 2008: 56), but two other
demand elasticities play a role here: income elasticity of demand and cross-price elasticity of
demand. In the following subsections of this chapter, the ways in which to calculate these
other two are set forth.
Knowledge of PED for commercial theater in particular is limited, since former research had
analyzed this for either just subsidized theater or for commercial and subsidized theater
together (Goudriaan, 2010: 6).
Estimation of PED

78
The lower VAT-rate influenced demand for theater, also when the theater halls or producers
did not include this benefit into the box-office prices. In that case box-office prices did not
have to be raised to compensate for increased costs. The expectations were that this measure
prevented a decrease in demand (Goudriaan et al., 2008: 71). To be able to calculate to what
extend the lower VAT-rate prevented an increase in box-office prices and with that a decrease
in demand, the figure for PED was estimated (Goudriaan, 2008: 71).
A.3. Income elasticity of demand
Income is one of the variables influencing consumer behavior and its relationship to the
quantity demanded is positive. The figure of income elasticity of demand expresses the
change in quantity demanded due to the change in consumer income (Towse, 2010, p.148).
To calculate the figure for income elasticity of demand, the percentage change in
quantity needs to be divided by the percentage change in income (Begg et al., 2008: 65)
The income elasticity of demand for theater tickets will be useful when determining other
effects than the increased VAT-rate over this theater season.
A.4. Cross-price elasticity of demand
When calculating the own price elasticity of a good, all other factors are remained constant,
only the changes in price of the examined good is changed. When calculating the cross-price
elasticity of demand, the own price of the examined good remains constant and elasticity is
calculated for price changes in other goods. When a rise in price of good A increases the
quantity of good B demanded, cross-price elasticity is positive. In general this is the case
when good A is a substitute for good B. When goods A and B are complements, then usually
their cross-price elasticity figure will be negative (Begg et al., 2008: 64).
Although in this research neither the effects of price changes for substitutes of theater
on the demand for theater tickets, nor the effects of increased box-office prices on the demand
for substitutes of theater are discussed, it is useful to address this cross-price elasticity of
demand. This model explains that when for example movie tickets are supposed to be a
substitute for theater tickets, it is likely that part of the audience will substitute away from
theater when prices of theater tickets have increased.

79
To estimate and explain price and income elasticity of demand for cultural activities, the
determinants that are used to purely calculate them are not enough, since changes in demand
are not just caused by changes in box-office prices or consumer income. That is the function
of consumer theory: to explain the underlying relationships(Blankers et al., 2012: 129).
A.5. Conclusion
A figure for price elasticity of demand for theater tickets is needed to calculate the possible
change in demand when prices increase. This figure is found through dividing the percentage
change in quantity demanded by the percentage change in price.
To find out whether demand for theater tickets is income elastic during theater season
10/11 and 11/12, the percentage change in quantity demanded had to be divided by the
percentage change in consumer income for these two years.
Prices of substitution goods, like movies, stayed the same after the VAT had been
raised for theater tickets. Consumers might have substituted away from (commercial) theater
to substitutional goods as movies. However, in this research focus laid on the effects on
commercial producers. If VAT had caused a decrease in demand, it was irrelevant whether the
‘dropped consumers’ turned to substitutional entertainment goods.

80
APPENDIX B
Interview schedule
First, I explained the art of research and that the companies as well as the producers
themselves would stay anonymous. Then the three producers were confronted with the
information from the 2012-Ape rapport conclusion on the situation of VVTP-members:
In this chapter we set forth the developments of the supply, number of attendances, attendance
fees, financing mix and the recruitment power of the VVTP-members in seasons 2005/2006
through to 2011/2012. To do so, data of nine VVTP-members that have provided data for that
whole period have been used.
Supply of the VVTP-members has increased between 2005 and 2011, both in number
of performances as well as number of productions. However, the number of attendances has
decreased significantly: with 18% over the whole period, which is an average of 4,4% per
year.
Decreasing number of attendances can be the result of higher entrance fees. However,
this is definitely not the case with the VVTP-members. The ‘ticket price’ has decreased with
18% between 2005 and 2011 (an average of 3,3% per year), while the price of substitutes
(competing leisure time activities) has increased with 23% (an average increase of 3,4% per
year).
This indicates that the VVTP-members have been hit relatively hard by the economic
crisis. Commercial theater producers lower entrance fees, but in the meanwhile experience a
decrease in demand. However, this does not seem to lead to anticipation in supply.
Then I explained that I am looking for the role of VAT in this story. So that I am looking for
(1) the differences on a few factors between season 10/11 and 11/12 and (2) the effects of
season 11/12.
Box-office prices
In 2010 it was forecasted that the box-office prices would increase due to the VAT-raise with
the complete percentage increase (13%).
81
Did you take the VAT-raise into account when setting box-office prices with theater
managers?
Which contract form is used most? Have buy-out contracts been used?
Which construction did you conceptualize?
1. Take the VAT-raise for own account
2. Calculate parts of the VAT-raise into the box-office prices
3. Calculate the complete VAT-raise into the box-office prices
4. Calculate the VAT-raise into the box-office prices via a stepwise construction that
eventually captures the complete percentage? Within which period?
Demand for theater
It was forecasted that demand for commercial theater would decrease.
Which role in this do you consider to be for the VAT-raise?
Is it your impression that theaters became more careful when ‘buying’ productions?
What is the role of the VAT-raise in this?
Do you think that box-office prices for movies and other substitutes influence demand for
theater?
What is the role of the VAT-raise in this?
Income
It was forecasted that the VAT-raise would cause a decrease in demand.
Is the turnover at your company for season 11/12 more, less or the same as turnover in 10/11?
In case of a decreased income, which part is due to the VAT-raise?
Employment
It was predicted that the decrease in income would cause a decrease in employment.
Did you reduce the number of fte’s at your office in 2012 compared to 2011?
Did you reduce the number of fte’s at the productions in 2012 compared to 2011?
Which part in this is contributed to the VAT-raise?
Financial outcome

82
It was predicted that this measure would not produce the hoped for 45 million Euros for the
government.
Do you think this VAT-raise produced the financial outcome that was hoped for?
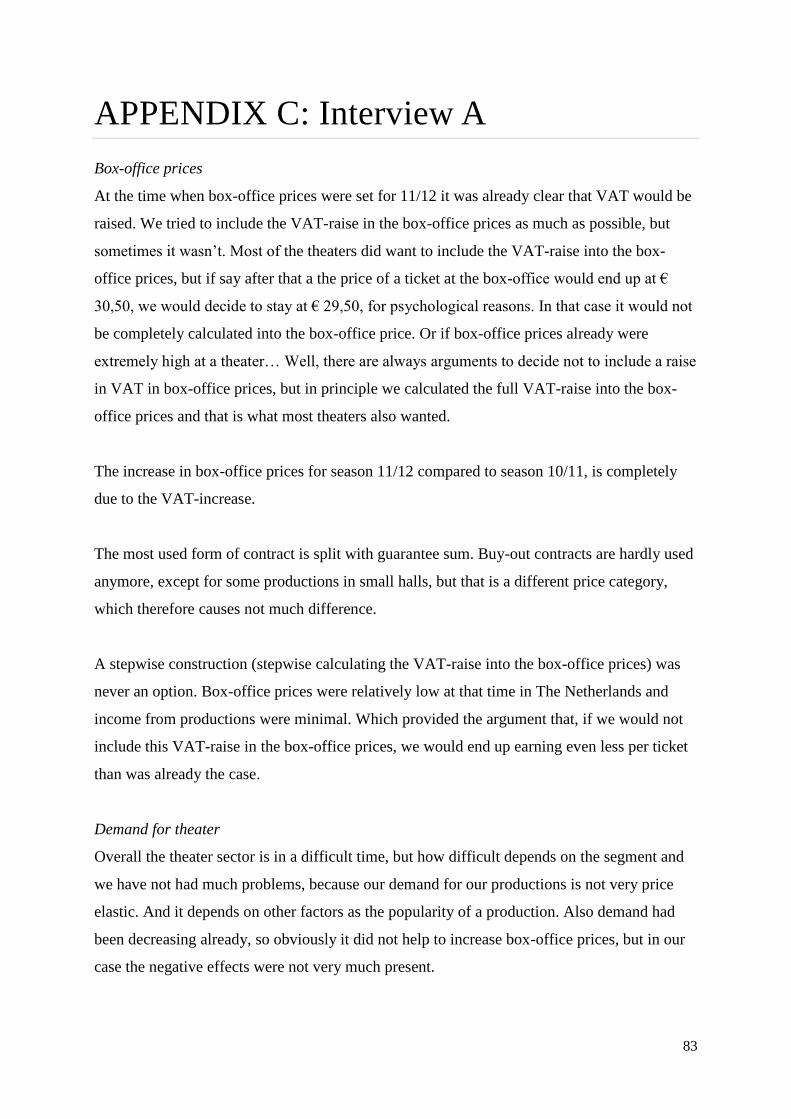
83
APPENDIX C: Interview A
Box-office prices
At the time when box-office prices were set for 11/12 it was already clear that VAT would be
raised. We tried to include the VAT-raise in the box-office prices as much as possible, but
sometimes it wasn’t. Most of the theaters did want to include the VAT-raise into the box-
office prices, but if say after that a the price of a ticket at the box-office would end up at €
30,50, we would decide to stay at € 29,50, for psychological reasons. In that case it would not
be completely calculated into the box-office price. Or if box-office prices already were
extremely high at a theater… Well, there are always arguments to decide not to include a raise
in VAT in box-office prices, but in principle we calculated the full VAT-raise into the box-
office prices and that is what most theaters also wanted.
The increase in box-office prices for season 11/12 compared to season 10/11, is completely
due to the VAT-increase.
The most used form of contract is split with guarantee sum. Buy-out contracts are hardly used
anymore, except for some productions in small halls, but that is a different price category,
which therefore causes not much difference.
A stepwise construction (stepwise calculating the VAT-raise into the box-office prices) was
never an option. Box-office prices were relatively low at that time in The Netherlands and
income from productions were minimal. Which provided the argument that, if we would not
include this VAT-raise in the box-office prices, we would end up earning even less per ticket
than was already the case.
Demand for theater
Overall the theater sector is in a difficult time, but how difficult depends on the segment and
we have not had much problems, because our demand for our productions is not very price
elastic. And it depends on other factors as the popularity of a production. Also demand had
been decreasing already, so obviously it did not help to increase box-office prices, but in our
case the negative effects were not very much present.

84
I think one solution to decreasing demand is price differentiation. In order to be able to
capture all consumers, many different tickets in different price categories need to be offered.
At the box-offices demand is lower, so theaters are more conscious when buying in, they pay
less and buy less, but this is not due to the VAT-increase. This trend is still present, even
though VAT has been lowered again.
Income
The turnover at my company for season 11/12 is less than turnover in 10/11, but I have no
idea what the exact lost amount would be. Overall season 11/12 was more negative than
10/11. Two of our productions in that season were ‘flops’, which had never happened in 30
years before. Demand for them was extremely low. But that is not caused by the VAT-raise,
so that clouds the results of that season. However, my idea is: we did not experience much
trouble of that VAT-increase. Surely income has decreased during that season, but not so
much and it is more due to the economic recession and popularity of our productions than to
the VAT-increase.
In the end, I even think we came out stronger, because when VAT was lowered again
after season 11/12, not all box-office prices were lowered accordingly. So we actually had
been able to increase box-office income.
Employment
Both the number of fte’s at the office as well as at the productions were not lowered in 2012
compared to 2011. Maybe even on the contrary, but the number of fte’s has definitely not
decreased.
Financial outcome to the government
The VAT-increase has not delivered financially what the government hoped for. I think the
VVTP has figures that proves this.
Not only did ticket sales not raise enough income from VAT to the government, also
decreases in fte’s and in number of productions results in less income to the government from
more than box-offices. Wage tax, tax on drinks at the cafés on the corner, everywhere less tax
is paid. Due to this it can be assumed that the possible positive effect of the VAT-increase is
eliminated by the decreases in taxes that used to be paid in times before the VAT-increase.

85
The intended 45 million Euros were calculated before the measurement was implemented and
were not a measure of economy. It was a political game, played by Geert Wilders, so he could
show his supporters that he had dealt with those artists. Even at the government this
measurement was cause of discussion even before it was implemented and questions were
raised whether it would even result in any positive financial effects.

86
APPENDIX D: Interview B
Box-office prices
Box-office prices have not decreased, but the share of the producer in box-office income has
decreased.
There is no theater that was willing to calculate the VAT-increase completely into the
box-office prices. They all feared decrease in demand. In the segment of higher box-office
prices the VAT-raise was not completely calculated into the box-office prices.
Especially in the segment of higher box-office prices, theaters were not willing to
stepwise included the VAT-increase. However, when VAT was decreased, box-office prices
were all lowered by the full percentage, which resulted in a decrease in box-office prices in
the end.
Split with guarantee sum is the most used contract form, we hardly use buy-out anymore.
Demand for theater
I don’t think demand for theater decreased due to the VAT-increase. It is partly due to the
overall economic crisis, but there is another form of crisis going on. Interest in theater
decreased, because the group that always occupied all seats in the theaters has become less
mobile, active and able to purchase, for many reasons. The generation that comes after these
people, has never formed the habit of going to the theater.
The theater sector has not been active enough to renew itself. There is no constant
flood of consumers anymore. The generation that attends theater now, likes to go to Soldaat
van Oranje and Mars&Venus (two theater hits around 2012 in The Netherlands red.). Theaters
force me to price tickets at the box-office at € 25 for a big hit. Why? If box-office prices were
set at € 50, it would still be sold out. To capture most visitors and most box-office income,
price differentiation should be used.
Theaters pay lower guarantee sums due to the decreased demand. They need to focus and
realize they are unable to stage 6 productions a week.
Income

87
Income at this company has decreased due to the VAT-increase. This is due to the fact that
more tax has to be paid. There is one production for which we always made profit and during
11/12 we experienced a loss in come. Purely due to the VAT.
Employment
The number of fte’s as productions has been reduced, because the largest productions were
not produced anymore due to the VAT-increase. It is hard to say what the share of the VAT-
increase is in this trend, but it is definitely not to say that everything staid the same after VAT
was increased. Trends turned for the negative, especially in the higher price categories,
musical and international show.
At the office the amount of fte’s has been cut back by 25%. All I can say is that the
VAT-increase did not prevent this to happen. It was thought that it did not make a difference
if VAT was increased, but it did matter, especially for the more vulnerable part of the market.
Financial outcome to the government
I am sure this measurement did not result in what the government hoped for. I don’t know
what the financial result was, but the measurement has been contra productive. We should not
underestimate the emotional effect of this. The signal to the public was very negative, because
it put culture in a bad light, together with the subsidy cuts. In a time where everybody watches
their expenses, people have also started to think going to the theater is expensive. We cannot
beat that. The national cut backs have also started a trend in cutting back on cultural subsidy
on all kinds of governmental levels.
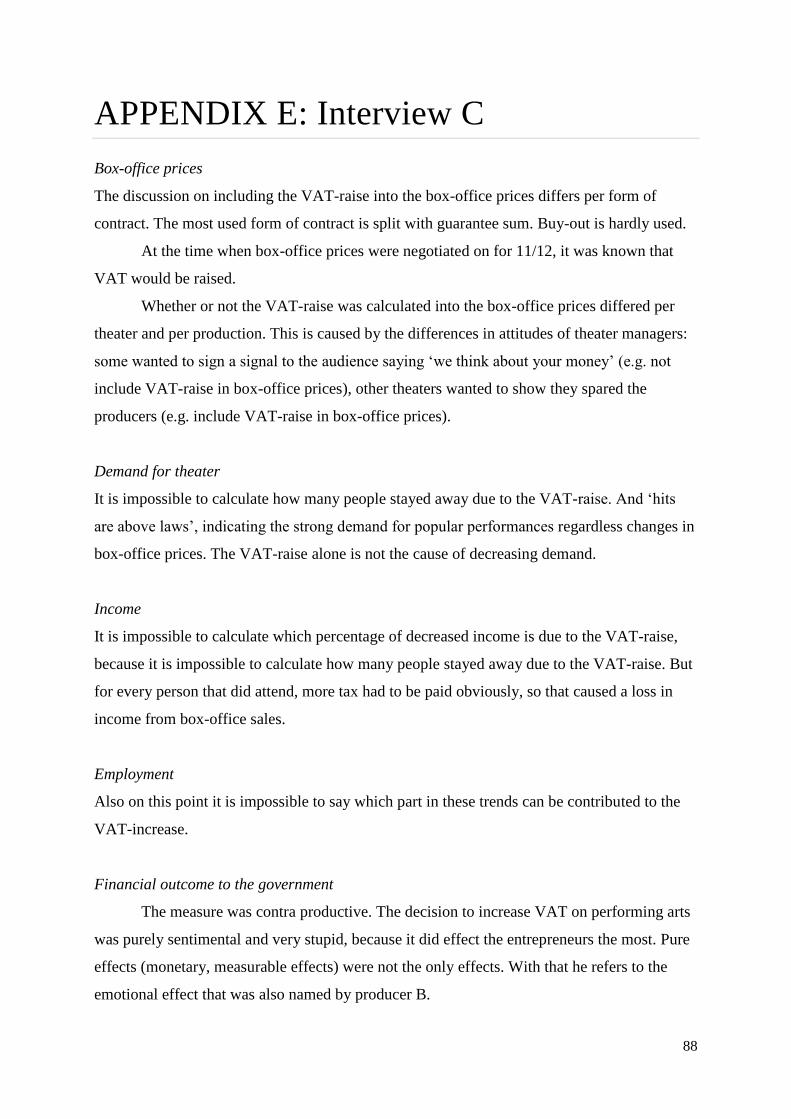
88
APPENDIX E: Interview C
Box-office prices
The discussion on including the VAT-raise into the box-office prices differs per form of
contract. The most used form of contract is split with guarantee sum. Buy-out is hardly used.
At the time when box-office prices were negotiated on for 11/12, it was known that
VAT would be raised.
Whether or not the VAT-raise was calculated into the box-office prices differed per
theater and per production. This is caused by the differences in attitudes of theater managers:
some wanted to sign a signal to the audience saying ‘we think about your money’ (e.g. not
include VAT-raise in box-office prices), other theaters wanted to show they spared the
producers (e.g. include VAT-raise in box-office prices).
Demand for theater
It is impossible to calculate how many people stayed away due to the VAT-raise. And ‘hits
are above laws’, indicating the strong demand for popular performances regardless changes in
box-office prices. The VAT-raise alone is not the cause of decreasing demand.
Income
It is impossible to calculate which percentage of decreased income is due to the VAT-raise,
because it is impossible to calculate how many people stayed away due to the VAT-raise. But
for every person that did attend, more tax had to be paid obviously, so that caused a loss in
income from box-office sales.
Employment
Also on this point it is impossible to say which part in these trends can be contributed to the
VAT-increase.
Financial outcome to the government
The measure was contra productive. The decision to increase VAT on performing arts
was purely sentimental and very stupid, because it did effect the entrepreneurs the most. Pure
effects (monetary, measurable effects) were not the only effects. With that he refers to the
emotional effect that was also named by producer B.

89
APPENDIX F: Summary in Dutch
SAMENVATTING
In 2010 ontstond in de Nederlandse theatersector veel ophef na het aankondigen van het
voornemen om per 1 juli 2011 de btw (belasting over de toegevoegde waarde) op
podiumkunsten van 6% naar 19% te verhogen. Verwacht werd dat deze maatregel meer
kwaad dan goed zou doen. Dit onderzoek is gericht op het beantwoorden van de vraag welke
effecten deze maatregel uiteindelijk heeft gehad voor vrije theaterproducenten.
In de titel wordt daarnaast de vraag gesteld wie er ‘gelijk’ heeft gehad: de Nederlandse
overheid, die bij de berekening van de verhoogde inkomsten uit btw op podiumkunsten
mogelijke vraaguitval achterwege liet, of Ape13
, het onderzoeksbureau dat in 2010 onderzocht
dat deze maatregel teleurstellend uit zou pakken door het sterke prijselastische karakter van
theater.
Deze scriptie bestaat uit drie delen. Het eerste deel bevat het theoretisch kader
betreffende de podiumkunstenmarkt, de btw en consumentengedrag. Allereerst worden
opbouw, specifieke eigenschappen, contracten, prijzen en prijsvorming van de
podiumkunstensector beschreven, gevolgd door een beschrijving van de rol van de btw op
podiumkunsten in Nederland in de laatste decennia. Tot slot legt de meer algemene
economische theorie van consumentengedrag in combinatie met de hiervoor genoemde
onderwerpen, een basis voor onderzoek en uitleg van de mogelijke werking van
veranderingen in de btw. De markt van de podiumkunsten kan worden onderverdeeld in twee
afzonderlijke markten: de inkoop- en de afzetmarkt. Zodoende zijn er ook twee soorten
kopers: (1) de theaters die voorstellingen inkopen bij de producenten en de bezoekers (2), die
kaartjes kopen voor de voorstellingen aan de kassa van het theater. Btw wordt betaald door
beide kopers, zodoende heeft een verandering in btw dan ook effect op beide markten.
Veranderingen in btw hebben invloed op prijs, vraag en het inkomen van de verkoper (in dit
geval: de producent). Op welke manier een btw-verhoging effect heeft op de vrije
theaterproducent, is afhankelijk van de gekozen contractvorm en de reactie van consumenten
op veranderingen in prijs (de mate van prijselasticiteit).
13
Aarts De Jong Wilms Goudriaan Public Economics bv (Ape)

90
Het gedrag van de consument komt tot uitdrukking in de vraagcurve. De vorm van de
curve, en dus het gedrag van de consument, wordt beïnvloed door smaak, inkomen en prijs
van substituten. In het geval van culturele goederen, wordt de vraag daarnaast nog beïnvloed
door factoren als tijd en culturele vorming, wat wordt uitgelegd in het model voor
cultuurparticipatie. Dit hoofdstuk over consumentengedrag laat tevens zien hoe cijfers voor
prijs- en inkomenselasticiteit tot stand komen.
Het theoretisch kader wordt afgesloten met een uiteenzetting van het onderzoek van
Ape (Goudriaan, 2010) naar de effecten van de btw-verhoging op vrije theaterproducenten.
Hieruit blijkt dat aan de theaterkassa een prijsstijging van 12,3% verwacht werd, na een btw-
verhoging van 13%. Gegeven de, in dit onderzoek bepaalde, relatief sterke mate van
prijselasticiteit van theater, zou een dergelijke prijsstijging leiden tot een afname in vraag van
13,5%. Het inkomen van de producenten daalt dan ook met dit percentage, wat een afname in
werkuren en uitgaven in andere economische sectoren tot gevolg zou hebben. Uiteindelijk zou
deze maatregel de overheid 20% minder inkomen uit btw op podiumkunsten opleveren dan de
45 miljoen waar ze op hoopte.
De in dit onderzoek beschreven verwachte effecten, vormen het uitgangspunt voor de
hypotheses in deze scriptie, onderbouwd met de rest van het theoretisch deel.
Zodoende zijn de volgende vijf hypotheses tot stand gekomen:
1. Kaartprijzen van vrije theaterproducties zijn gedaald na de btw-verhoging
2. Vraag voor vrije theaterproducties is gedaald als gevolg van de btw-verhoging
3. De btw-verhoging heeft negatief effect gehad op het inkomen van vrije
theaterproducenten
4. De btw-verhoging heeft negatief effect gehad op de werkgelegenheid bij vrije
theaterproducenten
5. De verwachte verhoging van de opbrengst uit btw op de podiumkunstsector is in het
eerste jaar niet behaald
Methode en data
In november 2012 verscheen een rapport over de effecten van de economische crisis op de
culturele sectoren (Blankers et al., 2012). Dit onderzoek vormt een rijke bron kwantitatieve
data om de hierboven genoemde hypotheses te toetsen. Daarnaast zijn deze hypotheses
voorgelegd aan drie vrije theaterproducenten, die gevraagd zijn hun ervaringen en meningen
hierbij uit te leggen.

91
Resultaten
Bij het toetsen van de hypotheses in dit onderzoek is gebleken dat de kaartprijzen niet met het
volledige percentage zijn gestegen, wat betekent dat de prijsstijging onvoldoende was om de
btw-verhoging op te vangen. De afname in vraag kan niet volledig aan de btw-verhoging
worden toegeschreven, aangezien is gebleken dat deze daling reeds enige tijd ervoor was
ingezet en de gevonden cijfers voor prijselasticiteit van (commercieel) theater onbruikbaar
zijn, aangezien bij de berekening het gemiddelde inkomen per bezoek is meegenomen in
plaats van de daadwerkelijke prijs aan de kassa.
De btw-verhoging heeft negatief effect gehad op het inkomen van de vrije
theaterproducenten, aangezien de kaartprijzen onvoldoende zijn gestegen om de btw-
verhoging op te vangen en de producenten dit dan ook met het eigen inkomen hebben moeten
doen. Hoewel werkgelegenheid het patroon van het inkomen van een organisatie meestal
volgt, is er onvoldoende tijd verstreken sinds de invoering van de btw-verhoging en is deze
maatregel te kort van kracht geweest, om te kunnen aantonen dat er sprake is van een negatief
effect.
Tot slot blijkt uit dit onderzoek dat de overheid de verhoging van het inkomen uit btw
op de podiumkunstsector niet heeft overschat.
Conclusie
Twee effecten van de btw-verhoging kunnen op deze korte termijn worden vastgesteld: een
prijsstijging aan de kassa en een daling in het inkomen van de producent. De daling in vraag
was reeds voor de btw-verhoging ingezet en een daling in werkgelegenheid kan nog niet
worden vastgesteld. De daling in vraag is niet zodanig sterk dat het de verhoging van
inkomsten uit btw op de podiumkunsten voor de overheid, uitvlakt. Berekeningen in dit
onderzoek tonen aan dat de overheid ‘gelijk heeft gehad’.