Embed Size (px)
Citation preview

TOWARDS THE SYSTEMATIC ASSESSMENT AND DESIGN
OF ADAPTIVE USER INTERFACES
by
Theophanis Tsandilas
A thesis submitted in conformity with the requirements for the degree of Doctor of Philosophy
Graduate Department of Computer Science University of Toronto
Copyright by Theophanis Tsandilas, 2007
ii
Towards the Systematic Assessment and Design of Adaptive User Interfaces
Theophanis Tsandilas
Doctor of Philosophy
Graduate Department of Computer Science
University of Toronto
2007
Abstract
Adaptive user interfaces have been suggested as an alternative to help users deal with infor-
mation overload and the complexity of software. However, experimental studies have ques-
tioned their effectiveness, while the introduction of adaptation techniques in commercial ap-
plications has had limited success. The negative past experience has caused skepticism
among researchers in Human-Computer Interaction, as adaptive behaviour has been linked
to poor designs, that have violated well-established usability principles. Several researchers
have suggested that adaptable user interfaces, which are interfaces adapted by the user rather
than the system itself, should be considered as a better alternative.
This dissertation explores the design space of adaptation techniques in a range of user
interfaces, identifies tradeoffs between adaptive and adaptable user interfaces and makes
recommendations about their design and evaluation. In particular, it examines three different
types of interfaces: hypermedia systems, lists, and hierarchical drop-down menus. New ad-
aptation techniques are proposed for each interface. We explore both techniques that assist
navigation and visual search, and techniques that facilitate movement and selection. We ad-
dress limitations of existing techniques by exploring designs that merge automation with
iii
user control. The proposed designs are extensively evaluated. Specifically, the dissertation
documents a total of seven user studies. Through our evaluation work, we explore the role of
adaptation accuracy as a measure of the quality of automatic inference and decision-making,
and evaluate its effect on the success of adaptation techniques. This allows us to investigate
strengths and limitations of the techniques that we propose and come up with recommenda-
tions about the design and evaluation of adaptive user interfaces.
Overall, the dissertation has three major contributions: (1) the introduction of designs
of hypermedia systems that combine automation and direct user manipulation; (2) the sys-
tematic treatment of accuracy as a way to assess the effectiveness of adaptation techniques;
and (3) the systematic design and evaluation of bubbling menus, a new design of adaptive
and adaptable menus.
iv
Acknowledgments
Sometimes, a Ph.D. gives the feeling of a lonely journey, but fortunately, I had the support
of many people to whom I express my gratitude. First, I am grateful to my Ph.D. advisor,
m.c. schraefel, for the opportunity that she gave me to work in a research area that was new
for me, and the confidence that she has shown on my work and ideas. I am grateful to
Graeme Hirst for his continuous help. I would never have completed my Ph.D. without his
advice and support. Next, I would like to thank Mark Chignell and Faith Ellen for their valu-
able feedback on my work and thesis, as well as Joanna McGrenere; first, for her willingness
to be my external examiner, and second, for the exceptionally thorough comments that she
gave me. Craig Boutilier also helped me with his feedback on early stages of my Ph.D. as a
member of my committee.
Next, I am thankful to people in DGP whose work gave me great inspiration. I am
particularly thankful to Ravin Balakrishnan for his immediate help whenever I asked for it. I
also thank Dan Vogel, Joe Lazlo, John Hancock, and several other DGPiers, as well as
Bowen Hui, who helped me proofread my first papers. Anastasia Bezerianos has to be men-
tioned separately. Not only has she always been willing to give feedback on my work, she
has also been a very good friend. During our last year of Ph.D., we spent many hours dis-
cussing our problems and worked with our laptops in several cozy cafés in Toronto, often
together with my roommates Stavros Vassos and Stefanos Karterakis – not to forget that Ste-
fanos also assisted me in submitting my thesis. Sometimes, Tasos Kementsietsidis, whenever
he visited Toronto, and Aktina Stathaki participated in these memorable group-working ses-
sions. Tasos had another very special role in the story of my Ph.D. When we lived together,

v
he enjoyed testing my prototypes and experimental designs and always came up with com-
ments and crazy ideas about future work. Our card-game fights were also unforgettable!
Then, I cannot forget George Chalkiadakis, with whom I have spent very special
moments. In our discussions, we have covered every aspect of human life, either in front of a
pitcher of beer or online, with the participation of Vassiliki Barzoka, Angeliki Maglara,
Themis Palpanas and, of course, Panagiotis Tsaparas, a very keen debater! But there have
been a lot of friends who played an important role during my Ph.D., like Yannis Lazaridis,
George Giakkoupis, and Kevin Sasaki, who have been my roommates for a while, George
Katsirelos, Sotirios Liaskos, Yannis Velegrakis, and many others. I thank them all for the
great moments that I have spent with them!
Finally, I am grateful to my family in Greece for their constant love and support: my
father Panagiotis, my mother Konstantina, my sister Sotiria, and my brothers Christos and
Alexandros.
vi
Table of Contents
1 INTRODUCTION................................................................................................................................... 1
1.1 MOTIVATION ...................................................................................................................................... 1
1.2 SCOPE ................................................................................................................................................. 3
1.3 RESEARCH GOALS.............................................................................................................................. 4
1.4 METHODOLOGY ................................................................................................................................. 4
1.5 OVERVIEW.......................................................................................................................................... 5
2 RELATED WORK ................................................................................................................................. 7
2.1 PERSONALIZATION, CUSTOMIZATION, AND ADAPTATION............................................................... 7
2.2 IS THERE ANY REAL NEED FOR ADAPTING A USER INTERFACE? .................................................... 9
2.2.1 Web Environments ..................................................................................................................10
2.2.2 Email and Office Applications ...............................................................................................11
2.3 ADAPTATION TECHNIQUES..............................................................................................................13
2.3.1 Adapting Hypermedia Environments .....................................................................................13
2.3.2 Adapting User Interface Widgets ...........................................................................................16
2.4 USER MODELING..............................................................................................................................19
2.4.1 Evaluation Measures...............................................................................................................21
2.5 PROBLEMS ASSOCIATED WITH ADAPTIVE BEHAVIOUR .................................................................22
2.5.1 Predictability, User Trust, and Transparency of Adaptive Behaviour ................................23
2.5.2 Controllability .........................................................................................................................25
2.6 EVALUATION OF ADAPTIVE USER INTERFACES..............................................................................29
2.6.1 Evaluation Strategies and Frameworks.................................................................................30
2.6.2 Evaluating the Viability of Adaptive User Interfaces ...........................................................32
2.6.3 Comparing Adaptation Techniques .......................................................................................36
3 COMBINING AUTOMATION WITH USER CONTROL...........................................................37
3.1 MOTIVATION ....................................................................................................................................38
3.2 FIRST PROTOTYPE ............................................................................................................................40
3.2.1 System Architecture.................................................................................................................41
vii
3.2.2 Representing User Interests and Content ..............................................................................43
3.2.3 User Interface..........................................................................................................................45
3.2.4 Visualizations of Browsing Histories .....................................................................................47
3.3 SECOND PROTOTYPE........................................................................................................................51
3.3.1 Focus, Context and Fisheye Views.........................................................................................52
3.3.2 Fisheye-Like Content Adaptation...........................................................................................53
3.3.3 Interactions ..............................................................................................................................56
3.3.4 Making the User Model Transparent.....................................................................................57
3.3.5 User Control ............................................................................................................................59
3.3.6 Evaluation of Fisheye-Like Adaptation .................................................................................61
3.3.7 Evaluation of Control Mechanisms........................................................................................65
3.4 SUMMARY AND DISCUSSION ...........................................................................................................67
4 ASSESSING ADAPTATION TECHNIQUES .................................................................................69
4.1 AN EVALUATION APPROACH FOR ASSESSING ADAPTATION TECHNIQUES...................................70
4.2 EXPERIMENT.....................................................................................................................................73
4.2.1 Evaluated Techniques .............................................................................................................74
4.2.2 Independent Variables ............................................................................................................76
4.2.3 Participants .............................................................................................................................76
4.2.4 Apparatus.................................................................................................................................77
4.2.5 Task ..........................................................................................................................................77
4.2.6 Design ......................................................................................................................................78
4.2.7 Procedure ................................................................................................................................79
4.2.8 Measures..................................................................................................................................80
4.3 HYPOTHESES ....................................................................................................................................81
4.4 RESULTS ...........................................................................................................................................81
4.4.1 Data..........................................................................................................................................81
4.4.2 Time Measures ........................................................................................................................84
4.4.3 Errors .......................................................................................................................................86
4.4.4 Qualitative Results ..................................................................................................................86
4.5 CONCLUSIONS AND DISCUSSION .....................................................................................................88
viii
5 A NEW TECHNIQUE OF PERSONALIZED MENUS.................................................................91
5.1 GOALS ..............................................................................................................................................92
5.2 BACKGROUND ..................................................................................................................................93
5.2.1 Menu Selection ........................................................................................................................93
5.2.2 Improving Pointing Performance...........................................................................................96
5.3 BUBBLING MENUS ...........................................................................................................................98
5.4 TESTING MULTIMODE POINTING...................................................................................................100
5.4.1 Evaluated Techniques ...........................................................................................................101
5.4.2 Apparatus and Participants..................................................................................................102
5.4.3 Task ........................................................................................................................................102
5.4.4 Design and Procedure ..........................................................................................................104
5.4.5 Measures................................................................................................................................104
5.4.6 Hypotheses.............................................................................................................................105
5.4.7 Results ....................................................................................................................................105
5.4.8 Discussion..............................................................................................................................109
5.5 FIRST DESIGN .................................................................................................................................110
5.5.1 Visual and Interaction Design..............................................................................................110
5.5.2 Submenus ...............................................................................................................................112
5.6 EVALUATION OF THE FIRST DESIGN OF BUBBLING MENUS.........................................................114
5.6.1 Experimental Conditions ......................................................................................................115
5.6.2 Apparatus...............................................................................................................................115
5.6.3 Participants ...........................................................................................................................115
5.6.4 Task ........................................................................................................................................116
5.6.5 Design and Procedure ..........................................................................................................117
5.6.6 Measures................................................................................................................................119
5.6.7 Hypotheses.............................................................................................................................119
5.6.8 Results ....................................................................................................................................119
5.6.9 Subjective User Feedback.....................................................................................................121
5.6.10 Conclusions .........................................................................................................................122
5.7 SUPPLEMENTARY EXPERIMENT.....................................................................................................123
5.8 EXTENDED DESIGN ........................................................................................................................124
ix
5.9 EVALUATION OF THE SECOND DESIGN OF BUBBLING MENUS.....................................................128
5.9.1 Techniques .............................................................................................................................128
5.9.2 Apparatus...............................................................................................................................130
5.9.3 Participants ...........................................................................................................................130
5.9.4 Procedure ..............................................................................................................................130
5.9.5 Results ....................................................................................................................................132
5.9.6 Conclusions ...........................................................................................................................135
5.10 SUMMARY AND DISCUSSION .......................................................................................................135
6 CONCLUSIONS AND FUTURE DIRECTIONS..........................................................................138
6.1 CONTRIBUTIONS.............................................................................................................................138
6.1.1 Design of Techniques for Adaptive and Adaptable Hypermedia .......................................138
6.1.2 Systematic Treatment of Accuracy Effects in Experimental Designs ................................139
6.1.3 Design and Evaluation of Bubbling Menus.........................................................................140
6.2 FUTURE DIRECTIONS .....................................................................................................................141
6.2.1 Improving and Extending the Proposed Designs................................................................141
6.2.2 Studying Additional Parameters of Adaptation...................................................................143
6.2.3 Establishing Detailed Design Guidelines for Adaptive and Adaptable User Interfaces..144
APPENDIX A CONSENT FORMS FOR MAIN USER STUDIES ...............................................159
A.1 EXPERIMENT ON ADAPTIVE LISTS................................................................................................159
A.2 EXPERIMENT ON MULTIMODE TARGET ACQUISITION.................................................................160
A.3 FIRST STUDY ON BUBBLING MENUS ............................................................................................161
A.4 SECOND STUDY ON BUBBLING MENUS........................................................................................162
APPENDIX B RESEARCH INSTRUMENTS ..................................................................................163
B.1 STUDY ON CONTROL MECHANISMS APPLIED TO HYPERMEDIA..................................................163
B.2 EXPERIMENT ON ADAPTIVE LISTS................................................................................................165
B.3 FIRST STUDY ON BUBBLING MENUS............................................................................................166
B.4 SECOND STUDY ON BUBBLING MENUS ........................................................................................167
COVER PAGE FOR PARTICIPATION (A).....................................................................................................167
COVER PAGE FOR PARTICIPATION (B) .....................................................................................................169
Chapter 1
x
List of Figures
FIGURE 2.1. ADAPTIVE MENUS IN MICROSOFT OFFICE 2000. SOME OPTIONS IN THE ADAPTED MENU HAVE BEEN
HIDDEN. THE USER CAN EXPAND THE MENU TO ITS REGULAR VIEW BY CLICKING ON A BUTTON WITH AN
ARROW ICON AT THE BOTTOM OF THE MENU. IN THE EXPANDED FORM OF ADAPTIVE MENUS, SHADING IS
USED TO SHOW WHICH ITEMS HAVE BEEN EXPANDED. ....................................................................................17
FIGURE 2.2. AN EXAMPLE OF A COMPLEX, PROBABILISTIC USER MODEL (HUI AND BOUTILIER, 2006). IN THIS
EXAMPLE, A DYNAMIC BAYESIAN NETWORK CAPTURES TEMPORAL PROBABILISTIC DEPENDENCIES AMONG
OBSERVATIONS (DOUBLE-LINE OVALS) AND VARIABLES (SINGLE-LINE OVALS) REPRESENTING USER TYPES,
ABILITIES AND ATTITUDES. ...............................................................................................................................20
FIGURE 2.3. FORMS OF USER CONTROL IN ADAPTIVE/ADAPTABLE USER INTERFACES.............................................26
FIGURE 3.1 USING SLIDERS TO CONTROL THE DISPLAY OF HYPERLINKS ON A WEB PAGE. HERE, THE USER IS
INTERESTED IN INFORMATION ABOUT HOUSING. RELEVANT LINKS ARE SHOWN WITH A RED OR REDDISH
COLOUR..............................................................................................................................................................41
FIGURE 3.2. SYSTEM ARCHITECTURE .........................................................................................................................43
FIGURE 3.3 THE FLASH USER INTERFACE USED TO CONTROL THE PARAMETERS OF PAGE ADAPTATION. (A) MAIN
VIEW OF THE INTERFACE. (B) THE USER INSERTS A NEW TOPIC BY TYPING ITS NAME AND A SET OF
KEYWORDS. .......................................................................................................................................................45
FIGURE 3.4 FILTERING HYPERLINKS BY ADAPTING THE SIZE OF FONTS....................................................................46
FIGURE 3.5. STARFIELD VISUALIZATION OF A BROWSING HISTORY. THE USER HOVERS THE MOUSE OVER A NODE
TO REVEAL INFORMATION ABOUT THE WEB PAGE THAT THE NODE REPRESENTS. .........................................49
FIGURE 3.6. SHOWING LINKS OF PAGES IN THE HISTORY ..........................................................................................50
FIGURE 3.7. ALTERNATIVE VIEW ORGANIZING NODES BY TOPIC AND TIME.............................................................50
FIGURE 3.8. PANEL TO CONTROL THE HISTORY VISUALIZATIONS.............................................................................51
FIGURE 3.9. FISHEYE VIEW OF A WEB PAGE ..............................................................................................................54
FIGURE 3.10. USE OF GLOSSES TO GIVE FEEDBACK ABOUT THE CONTENT OF MINIMIZED FRAGMENTS..................55
FIGURE 3.11 THE SAME PAGE UNDER TWO DIFFERENT INSTANCES OF THE USER MODEL. (A) THE USER
INTERESTED IN MUSIC, FESTIVALS, AND DANCE. (B) THE USER IS INTERESTED IN MUSIC AND FILMS. .........58
FIGURE 3.12 REFINING USER INTERESTS WITH A POPUP SLIDER. (A) WHEN THE USER CLICKS ON A LABEL, A
SLIDER POPS UP. (B) THE USER MOVES THE SLIDER BY DRAGGING THE MOUSE UPWARDS OR DOWNWARDS.
...........................................................................................................................................................................59
xi
FIGURE 3.13. A PAGE ADAPTED BY THE TWO TESTED TECHNIQUES: (A) SCALING PARAGRAPHS, AND (B)
STRETCHTEXT. ...................................................................................................................................................62
FIGURE 4.1. SCHEMATIC DEMONSTRATION OF APPROACHES TOWARDS THE EVALUATION OF ADAPTIVE USER
INTERFACES. (A) COMMON APPROACH: THE SYSTEM IS EVALUATED AS A WHOLE. THERE IS NO
SEPARATION BETWEEN THE USER MODEL (UM) AND THE USER INTERFACE (UI). (B) APPROACH SUGGESTED
BY BRUSILOVSKY ET AL. (2004) AND WEIBELZAHL (2002): USER NEEDS ARE DEFINED AS PART OF SPECIFIC
SCENARIOS OF USE AND ARE CONSIDERED TO BE FULLY KNOWN....................................................................70
FIGURE 4.2. OUR SUGGESTED EVALUATION APPROACH. THE ADAPTATION MECHANISM IS CONSIDERED AS A
BLACK BOX, AND ITS BEHAVIOUR IS FULLY CONTROLLED. PARAMETERS OF THE USER MODEL AND THE
DECISION-MAKING PROCESS THAT DETERMINE THE QUALITY OF AUTOMATION ARE HANDLED AS
INDEPENDENT VARIABLES.................................................................................................................................72
FIGURE 4.3. THE MSPACE BROWSER (SCHRAEFEL ET AL., 2005), USED HERE TO EXPLORE CLASSICAL MUSIC. THE
INTERFACE CONSISTS OF MULTIPLE LISTS, WHICH CAN BE BROWSED FROM LEFT TO RIGHT. ........................73
FIGURE 4.4. EVALUATED TECHNIQUES: (A) HIGHLIGHTING SUGGESTIONS (NORMAL), AND (B) SHRINKING NON-
SUGGESTED ITEMS IN ADDITION TO HIGHLIGHTING (SHRINK) ......................................................................75
FIGURE 4.5. EXPERIMENTAL SOFTWARE....................................................................................................................77
FIGURE 4.6. BOXPLOTS SHOWING THE EFFECT OF ACCURACY. THE NUMBERS ABOVE THE BOXES SHOW MEAN
TIMES. ................................................................................................................................................................83
FIGURE 4.7. GRAPHS SHOWING THE INTERACTIONS (A) ACCURACY × TECHNIQUE ON BLOCKTIME, AND (B)
ACCURACY × SUGGESTIONS ON NONSUGGESTEDTIME. STANDARD DEVIATIONS ARE SHOWN........................84
FIGURE 4.8. BOXPLOT SHOWING THE MEAN NUMBER OF OUTLIERS (SUGGESTEDTIME > 8 SEC) PER EXPERIMENTAL
CONDITION.........................................................................................................................................................85
FIGURE 4.9. DISTRIBUTION OF PARTICIPANTS’ ANSWERS WHEN ASKED TO ESTIMATE THE ADAPTATION
ACCURACY FOR THE CONDITIONS THAT THEY HAD EXPERIENCED..................................................................86
FIGURE 4.10. DISTRIBUTION OF PARTICIPANTS’ ANSWERS ON WHICH TECHNIQUE (NORMAL VS. SHRINK) (1)
HELPED THEM TO LOCATE A. HIGHLIGHTED ITEMS FASTER, AND B. NON-SUGGESTED ITEMS FASTER, AND
(2) WOULD BE PREFERRED WHEN SYSTEM’S PREDICTIONS WERE GENERALLY C. ACCURATE, AND D.
INACCURATE......................................................................................................................................................87
FIGURE 4.11. IMPROVED VERSION OF SHRINKING LISTS THAT SUPPORT A “FOCUS LOCK” MODE. (A) THE BOX,
SHOWN AT THE RIGHT HALF OF THE LIST OUTLINES THE PORTION OF THE LIST THAT GETS FULLY VISIBLE IF
xii
THE LIST IS EXPANDED. (B) THE USER MOVES THE CURSOR TO THE RIGHT PORTION OF THE LIST TO EXPAND
IT. .......................................................................................................................................................................90
FIGURE 5.1. OUR VISION OF MENUS CONTRASTED WITH REGULAR MENUS. ONLY ITEMS THAT THE USER SELECTS
REGULARLY ARE SHOWN. (A) SELECTION IN A REGULAR MENU REQUIRES THE USER TO FOLLOW A HIGHLY
CONSTRAINED TRAJECTORY AND PERFORM SEVERAL MOVEMENTS. (B) OUR VISION WAS TO ALLOW USERS
TO SELECT MENU ITEMS WITH ROUGH, SINGLE-STROKE GESTURES. ...............................................................93
FIGURE 5.2. SELECTION IN NESTED MENUS (MAC OS X). MOTION IS CONSTRAINED WITHIN THE TRIANGULAR
AREA OUTLINED BY THE RED (OUTER) ARROWS. WHEN THE CURSOR EXITS THE BOUNDARIES OF THE
SELECTION (“STYLE”), FOR A BRIEF TIME WINDOW, THE USER CAN MOVE THE CURSOR TOWARDS THE
SUBMENU WITHOUT CAUSING THE SELECTION TO CHANGE.............................................................................95
FIGURE 5.3. OVERVIEW OF THE BUBBLE CURSOR (GROSSMAN AND BALAKRISHNAN, 2005). THE SIZE OF THE
CURSOR DYNAMICALLY CHANGES AS THE CURSOR MOVES. IN THIS EXAMPLE, THE BUBBLE CURSOR
SELECTS TARGET 1, AS ITS DISTANCE D1 FROM THE CENTER OF THE CURSOR IS SHORTER THAN THE
DISTANCE OF THE CENTER OF THE CURSOR FROM ANY OTHER TARGET..........................................................97
FIGURE 5.4. OVERVIEW OF BUBBLING MENUS. BUBBLE CURSORS ARE USED TO SELECT BLUE (HOT) ITEMS IN AN
ALTERNATIVE VIEW, ACTIVATED THROUGH MOUSE-DRAGGING GESTURES. BLUE ITEMS ARE DEFINED BY
EITHER A MANUAL OR AN AUTOMATIC CUSTOMIZATION MECHANISM. ..........................................................98
FIGURE 5.5. THE TWO MODES OF INTERACTION SUPPORTED BY MULTIMODE POINTING. (A) DEFAULT MODE –
EXPANDABLE TARGETS HAVE BEEN HIGHLIGHTED. (B) ALTERNATIVE MODE – HIGHLIGHTED TARGETS
HAVE BEEN EXPANDED....................................................................................................................................101
FIGURE 5.6. EXPERIMENTAL TASK. AFTER THE TASK BEGINS, THE PARTICIPANT HAS TO SELECT THE TARGET
WITHIN THE RED CIRCLE. BLUE TARGETS ARE EXPANDED BY SWITCHING TO THE ALTERNATIVE MODE. ...103
FIGURE 5.7. DISTRIBUTION OF ERRORS ....................................................................................................................105
FIGURE 5.8. RESULTS FOR MOVEMENT TIME (MT) .................................................................................................106
FIGURE 5.9. THE EFFECT OF PREDICTABILITY ON (A) MOVEMENT TIME (MT) AND (B) RESPONSE TIME (RT) ...108
FIGURE 5.10. FIT OF MODEL FOR MT: (A) OVER ORIGINAL IDS FOR NON-SUGGESTED GOAL TARGETS, AND (B)
OVER EXPANDED IDS FOR SUGGESTED GOAL TARGETS. ................................................................................109
FIGURE 5.11. USER INTERACTION WITH BUBBLING MENUS. (A) DEFAULT VIEW - A SMALL NUMBER OF HOT ITEMS
ARE HIGHLIGHTED WITH A LIGHT-BLUE COLOR. (B) ALTERNATIVE VIEW - THE USER DRAGS THE MOUSE
AND A BUBBLE CURSOR SELECTS HIGHLIGHTED ITEMS. (C) WHEN THE CURSOR MOVES TO THE LEFT SUB-
AREA OF THE MENU, THE BUBBLE CURSOR DISAPPEARS................................................................................111
xiii
FIGURE 5.12. INTERACTION WITH SUBMENUS IN BUBBLING MENUS: (A) SELECTION OF PARENT ITEM; (B)
VERTICAL MOVEMENT; (C) DIAGONAL MOVEMENT; AND (D) RELEASE OF MOUSE BUTTON. WHILE THE USER
DRAGS THE MOUSE, THE BUBBLE CURSOR APPEARS. ARROWS SHOW THE DIRECTION OF MOUSE MOVEMENT.
.........................................................................................................................................................................113
FIGURE 5.13. A NESTED ITEM IN BOOKMARKS IS SELECTED WITH A SINGLE-STROKE GESTURE. ..........................114
FIGURE 5.14. DEMONSTRATION OF THE EXPERIMENTAL TASK. ..............................................................................116
FIGURE 5.15. BASE EXPERIMENTAL TASKS. GOAL ITEMS ARE MARKED BY AN ARROW. NUMBERS SPECIFY THE
WIDTH OF MENUS IN PIXELS. THE HEIGHT OF EACH ITEM WAS 30 PIXELS. ...................................................117
FIGURE 5.16. OVERALL RESULTS. ERROR BARS REPRESENT STANDARD DEVIATIONS. .........................................120
FIGURE 5.17. PERFORMANCE OF EACH OF THE SIXTEEN PARTICIPANTS WHEN SUGGESTIONS WERE PERFECT. ....121
FIGURE 5.18. PERFORMANCE FOR PERFECT SUGGESTIONS SHOWN SEPARATELY FOR 2ND AND 3RD LEVEL MENUS.
.........................................................................................................................................................................121
FIGURE 5.19. RESULTS. MEAN SELECTION TIMES (TT) PER PARTICIPANT.............................................................123
FIGURE 5.20. THE EXTENDED DESIGN OF BUBBLING MENUS. (A) WHEN THE USER DRAGS THE RIGHT MOUSE
BUTTON, A BUBBLE APPEARS THAT SELECTS HIGHLIGHTED MENU CATEGORIES. A PREVIEW OF THE
CORRESPONDING MENU FOLLOWS THE CURSOR AS THE CURSOR’S CENTER MOVES TOWARDS THE MENUBAR.
(B) THE USER MOVES THE MOUSE DOWNWARDS WHILE DRAGGING. THE POSITION OF THE MENU FREEZES
AND A SECOND BUBBLE ALLOWS FOR THE SELECTION OF HIGHLIGHTED ITEMS WITHIN THE MENU. (C)
ALTERNATIVELY, THE USER CAN RELEASE THE BUTTON TO ACTIVATE THE DEFAULT VIEW OF A MENU....125
FIGURE 5.21. ACTIVATING A LONG MENU FAR FROM A MENUBAR WHILE PRESSING THE RIGHT MOUSE BUTTON.
(A) THE MENU PREVIEW APPEARS CLOSE TO THE MOUSE CURSOR SO THAT IT IS FULLY VISIBLE. ITS
LOCATION FOLLOWS THE CURSOR BUT WHEN (B) IT MOVES DOWNWARDS AND TOWARDS ITS BOUNDARIES,
THE ALTERNATIVE VIEW OF THE MENU IS ACTIVATED, AND THE USER CAN USE THE INNER BUBBLE CURSOR
TO SELECT HOT ITEMS IN THE MENU. ..............................................................................................................127
FIGURE 5.22. IMPROVED BACKTRACKING. (A) THE USER ENTERS A SUBMENU WHILE DRAGGING. (B) IF MOVING
TO THE BACK LEVEL, THE BUBBLE SELECTS THE ACTIVATED PARENT ITEM (“PICTURE”) RATHER THAN
SELECTING THE NEAREST HIGHLIGHTED ITEM (“TEXT BOX”). (C) THE USER SLIGHTLY MOVES THE MOUSE
VERTICALLY TO UPDATE THE SELECTION.......................................................................................................127
FIGURE 5.23. OUR VERSION OF CASCADING SPLIT MENUS. HOT ITEMS CAN BE COPIED TO THE TOP AREA OF THE
MENU FROM ANY LEVEL OF NESTING. THE ORIGINAL COPY OF THESE ITEMS IS SLIGHTLY GRAYED. ..........129

xiv
FIGURE 5.24. AN INSTANCE OF THE SOFTWARE USED IN THE STUDY. HERE, THE USER IS ASKED TO SELECT THE
“FORMAT STYLE” MENU ITEM. THE NEXT TWO ITEMS TO BE SELECTED ARE ALSO SHOWN. THE USER HAS
TO INSTANTLY HOVER OVER THE RED RECTANGLE IN ORDER TO START THE TASK......................................129
FIGURE 5.25. WHEN THE USER PLACES THE CURSOR OVER THE RED RECTANGLE, THE RECTANGLE’S COLOUR
CHANGES TO GREY AND THE USER CAN MOVE TO SELECT THE TARGET........................................................131
1
Chapter 2
Introduction
The goal of this dissertation is to contribute to the systematic understanding of the design
and evaluation of adaptive user interfaces. It explores new interface designs for hypermedia
systems, menus, and lists and investigates tradeoffs between adaptive and adaptable user in-
terfaces. In this chapter, we motivate our research, present its scope and goals, and give an
overview of the document’s structure.
2.1 Motivation
The complexity of computer applications has been growing rapidly, accommodating con-
tinuously emerging user needs. Users of desktop environments have to assess, manage and
retrieve large amounts of information, switch between numerous tasks and often complete
tedious and repetitive actions. Common tasks that users carry out on an everyday basis in-
clude searching and browsing for information on the Web, exchanging and archiving email
messages, executing commands through menus, and exploring long file hierarchies. Power-
CHAPTER 1. INTRODUCTION 2
ful mechanisms such as history lists and shortcuts can reduce the cognitive and motor de-
mands of such tasks, but their scope has been limited (Lane et al., 2005; Tauscher and
Greenberg, 1997). A main limitation of traditional user interfaces acknowledged by previous
work is their inability to fit first to the specialized needs of different users and second to the
particular demands of different tasks. As McGrenere and Moore (2000) state, “one-size-fits-
all interfaces may not in fact fit all”.
Several interface designs have attempted to relax the “one-size-fits-all” limitation by
supporting manual personalization procedures that allow users to tailor a user interface to
their own needs. For instance, Web browsers support the bookmarks utility that enables us-
ers to create personalized lists of frequently accessed Web pages. Similarly, several office
applications support customizable toolbars and allow users to specify shortcut keys to accel-
erate command execution. However, customization mechanisms require users to consume
additional effort and time to use them effectively; as a result, they have been highly
underused (Abrams et al., 1998; Mackay, 1991; Weld et al., 2003).
In an attempt to relieve users of the burden of manually personalizing a user interface,
automated personalization techniques have been suggested as a potential solution. Such user
interfaces employ automated procedures and often borrow techniques from Artificial Intelli-
gence (AI) to facilitate the tasks of users. The term adaptive user interface is commonly
used to characterize the type of user interface that is automatically personalized/adapted ac-
cording to the ongoing needs of a user. Adaptive user interfaces often perform adaptations
based on predefined knowledge about a user’s goals and preferences. Alternatively, they ex-
ploit information from past usage patterns to infer user needs and adapt the interface. For
instance, based on the content of pages that a user visits during a Web browsing session, an
intelligent mechanism could infer the information needs of the user and suggest other related
pages. Similarly, an adaptive mechanism could personalize a menu so that frequently se-
lected items would be accessed faster.
CHAPTER 1. INTRODUCTION 3
Evidence about the existence of usage patterns which adaptive mechanisms can be
built upon has been revealed by previous research (McGrenere and Moore, 2000; Tauscher
and Greenberg, 1997). Such evidence implies that the design of user interfaces could be pos-
sibly more effective if knowledge about usage patterns was taken into account. However,
whether and how such knowledge could be effectively used is a matter of great debate within
the community of Human-Computer Interaction (HCI). Several experimental studies have
questioned the effectiveness of adaptive user interfaces, while their application in commer-
cial environments has had very limited success. This negative past experience has caused
skepticism among HCI researchers as adaptive behaviour has been linked to poor designs
that have violated well-established principles of interaction design. Work on intelligent user
interfaces has mainly been the product of the AI community. As a result, the value of such
work has not been empirically evaluated through extensive user studies. Besides, the few
usability studies (Findlater and McGrenere, 2004; Greenberg and Witten, 1985; Hook, 1997;
Mitchell and Shneiderman, 1989) coming from the HCI community have focused on testing
the general hypothesis of whether adaptive behaviour can be useful rather than answering the
more valuable questions of when and how adaptive behaviour could help. Answering these
questions requires that tradeoffs between costs and benefits associated with adaptive user
interfaces are systematically investigated and that designs take such tradeoffs into account.
This dissertation attempts to explore these issues and propose novel forms of interaction that
take advantage of automation, respecting, at the same time, well-established usability princi-
ples.
2.2 Scope
The term adaptive has been used to characterize various different types of assistive behav-
iour, such as information filtering, recommendation, task auto-completion, notification, spell
checking, and personalization of user interface widgets. Our work does not touch all these
CHAPTER 1. INTRODUCTION 4
types of adaptation. Its scope is limited to techniques for desktop applications that facilitate
exploration and selection in common information structures. In particular, it explores adapta-
tion techniques for hypermedia documents, longs lists, and cascading menus. All the tech-
niques studied in this dissertation apply various types of filtering to personalize an interface,
promoting a small number of interface elements, such as frequently selected menu items or
paragraphs on a Web page that closely relate to the information needs of the user. We exam-
ine the effect of adaptation on user performance for both tasks where difficulty resides in
visual search and tasks where difficulty resides in movement and selection. For instance, we
explore navigation in hypermedia environments, in which part of users’ task is to locate and
gather information. We also explore selection in menus, where motor performance and vis-
ual search are equally important. Applying filtering to promote specific items in a user inter-
face can enhance both visual search and motor performance. On the other hand, different
types of tasks require different adaptation techniques. This is an issue that this dissertation
tries to clarify.
2.3 Research Goals
Overall, the work presented by this dissertation has been driven by three goals:
1. To design new adaptation techniques for a range of user interfaces.
2. To explore tradeoffs between adaptive user interfaces and adaptable user interfaces.
In particular, a main objective of this dissertation has been to explore designs that ef-
fectively combine automation with user control.
3. To investigate approaches for the systematic evaluation of adaptation techniques.
2.4 Methodology
The research presented by this dissertation can be split into three parts. The first part ex-
plores adaptation techniques for hypermedia systems. It focuses on the notion of controlla-
CHAPTER 1. INTRODUCTION 5
bility and proposes new designs that merge automation with direct user manipulation. Also,
it presents two small user studies that evaluate the proposed designs.
The second part investigates the evaluation of adaptation techniques in a more system-
atic way. It identifies the role of adaptation accuracy in the success of adaptive user inter-
faces. Then it empirically tests its effect on the performance of two adaptation techniques for
long lists. Based on the results, we make recommendations about the design and evaluation
of adaptive user interfaces.
The third part of the research presents the development process for the design of an
adaptation technique for cascading drop-down menus. This process includes two design it-
erations and four user studies. Within the context of menu selection, we identify and explore
cognitive costs associated with uncertainty when adaptation is user-initiated. We evaluate
the effect of such costs on the success of the new technique, taking into consideration the
effect of adaptation accuracy. The results of this process allow us to assess the strengths and
limitations of the proposed technique and make recommendations about its use.
2.5 Overview
The dissertation is organized as follows. Chapter 2 reviews related work. It summarizes pre-
vious approaches on adaptive and adaptable user interfaces and discusses their main
strengths and limitations. It focuses on usability problems associated with automatic adapta-
tion. It reviews the methodology and results of relevant user studies and identifies their
shortcomings. Chapter 3 investigates how the combination of automation and direct user
manipulation can address shortcomings of adaptive behaviour. Adaptation and user control
are studied in the context of adaptive hypermedia systems through two Web-based proto-
types. Chapter 4 concentrates on the evaluation of adaptation techniques. It presents an ex-
perimental study, which evaluates two adaptation techniques applied to long lists. The study
explores the effect of adaptation accuracy on user performance and results in recommenda-

CHAPTER 1. INTRODUCTION 6
tions for the design and evaluation of adaptation techniques. Chapter 5 presents the third part
of our research. It describes a complete user-centered design process, conducted to develop
bubbling menus, a new adaptation technique for hierarchical drop-down menus. Chapter 6
summarizes the findings and contributions of this dissertation. Finally, it suggests directions
for future work.
7
Chapter 3
Related Work
In this chapter, we present related work within the area of adaptive, adaptable and custom-
izable user interfaces. We start by putting this work into context and clarifying relevant ter-
minology. We continue by discussing problems that have motivated research on adaptive
user interfaces and describe adaptation techniques that have been used in the past. Then we
identify problems associated with adaptive behaviour and discuss how previous work has
tried to deal with them. Finally, we discuss previous evaluations and identify their main
problems and limitations.
3.1 Personalization, Customization, and Adaptation
The terms customization, personalization and adaptation are all used to describe alterations
or adjustments made to a software system based on user characteristics, preferences, goals
and ongoing needs. Such alterations and adjustments may concern: (1) the functionality pro-
vided by the software, e.g., different sets of functions for different users; (2) the content that
is communicated through the system, e.g., language and style; and (3) elements of the user
CHAPTER 2. RELATED WORK 8
interface, e.g., the structure and layout of visualized widgets, the presentation of the content,
metaphors used, and interaction styles.
The term personalization better describes variations in software that reflect individual
characteristics, preferences and needs of users. Some aspects of such variations may be de-
termined at design time, while other aspects may be determined at use time (Fischer, 2001).
For instance, after eliciting user needs, the designers of a new system may decide to
accommodate the needs of multiple groups of users by providing multiple views of the same
user interface. In this case, user groups and their associated views are determined at design
time. However, the actual classification of a user to a specific user group is decided at use
time. When applied at use time, personalization can be decided by the system, by the actual
user or often by someone else on behalf of the user, such as the system administrator. As
McGrenere (2002) explains, customization usually refers to changes applied manually by the
user himself/herself or the system administrator rather than changes automatically decided
by the system. Customization usually involves long-term or medium-term changes to a user
interface and is often a time-consuming task; it requires users to interrupt their regular tasks,
make decision about changes in their working space, and sometimes use knowledge about
advanced features. In older Unix user interfaces, for instance, several customizations were
performed by editing files with specialized syntaxes. Mackay (1991) reports that “customi-
zation involves a tradeoff for users, who must choose between activities that accomplish
work directly and activities that may increase future satisfaction or productivity”. According
to her study, participants reported “lack of time” and “lack of knowledge” as the main barri-
ers to customization. Modern applications have tried to reduce the burden of customization
actions by coupling them with more intuitive, direct-manipulation interactions. For instance,
office applications allow users to customize their workspace by simply manipulating tool-
bars. Similarly, Google allows users to customize their search page by selecting and drag-
ging floating boxes that contain RSS feeds or other Web-based tools.
CHAPTER 2. RELATED WORK 9
As opposed to customization, adaptation normally involves personalization that is fully
or partially decided and executed by the system using automated mechanisms. Such mecha-
nisms often employ techniques coming from research in Machine Learning, User Modeling
and Information Retrieval. Changes due to adaptation are less radical and normally short-
term compared to changes due to customization. Ideally, an adaptive mechanism can antici-
pate the evolving needs and goals of a user and reflect them in the user interface. An adap-
tive user interface may allow for limited or extensive user control. When adaptation is pri-
marily determined by the user, the term adaptable is used instead of the term adaptive
(Findlater and McGrenere, 2004; McGrenere, 2002). The distinction between customizable
and adaptable user interfaces is not always clear. Both terms are often used interchangeably
to describe the same interface. Customization usually refers to long-term changes applied to
an interface by a user, whereas the term “adaptability” is more appropriate for more dynamic
forms of personalization.
Another term that is used to characterize user interfaces that provide automated assis-
tance is intelligent. The stress, now, is given to the intelligent component of the mechanism
that adapts a user interface. McGrenere (2002) regards intelligent user interfaces as a broader
set of interfaces that are not necessarily adaptive. Intelligent agents provide an example of
such interfaces. Intelligent agents can carry out tasks on behalf of a user (e.g., automatically
download a software update) without providing any kind of interface personalization.
3.2 Is There any Real Need for Adapting a User Interface?
Before we examine existing approaches on adaptive user interfaces, we attempt to give an
answer to a fundamental question: is there real evidence that automatic personalization can
be useful? A lot of evidence is anecdotal, but there has also been research demonstrating the
need for user interfaces that can adapt to the particular user needs and tasks. For presentation
CHAPTER 2. RELATED WORK 10
reasons, we divide this research into research that has studied navigation in Web environ-
ments and research that has studied user interaction in office applications.
3.2.1 Web Environments
Information overload has been commonly cited as one of the most important problems of
today’s Web. Every day, users have to navigate through numerous Web pages and evaluate
their content. A relatively old study on Web usage by Catledge and Pitkow (1995) showed
that users visited approximately 14 different pages per day. A later study by McKenzie and
Cockburn (2001) found that users working in a Computer Science department visited ap-
proximately 42 different pages per day. The number of Web visits is expected to have grown
considerably within the last six years, following the huge growth of the Web since then, the
improvement of network speed, and the spread of new Web-based services and forms of on-
line communication such as online banking, news feeds, collaborative online encyclopedias,
Weblogging, social networking and online dating. Early work on hypertext systems has
shown that navigation, even in small hypertexts, is subject to cognitive overheads and disori-
entation problems (Conklin, 1987; Nielsen, 1990). The overwhelming amount of information
in the Web and the fact that the Web is used by millions of users with a wide range in infor-
mation needs and expertise make the need for dealing with such problems crucial.
Search engines and navigation tools such as history lists and bookmarks help users ac-
cess information in the Web more effectively. Their scope has been limited though. Accord-
ing to Marchionini (1995), information seeking in electronic environments involves both
analytical and browsing strategies. Analytical strategies depend on careful planning, itera-
tive query formulations and evaluation of searching results. On the other hand, browsing
strategies are heuristic and interactive, depend on recognizing relevant information and de-
mand smaller cognitive load. Search engines, bookmarks and history lists can support ana-
lytical strategies by facilitating searching and re-visitation of Web documents, but they can-
CHAPTER 2. RELATED WORK 11
not assist browsing strategies. In addition, history lists and bookmarks bear several usability
problems, which have been long reported by previous research. History lists have been
shown to be rarely used (Catledge and Pitkow, 1995; Tauscher and Greenberg, 1997), and
despite the fact that various history mechanisms have been proposed (Cockburn and Green-
berg, 1999; Cockburn et al., 1999), the history utility in commercial browsers has little
evolved. Bookmarks have been proved more successful, but they are not free of problems.
According to Abrams et al. (1998), 37% of respondents to their survey never organized
bookmarks, as they considered bookmark maintenance to be a laborious and time-consuming
task. The same study found that bookmark lists can grow too fast and eventually become
unmanageable. Also, McKenzie and Cockburn (2001) report that bookmarks often contain
duplicates and a large number of bookmarked items become invalid after some time. Abrams
et al. (1998) suggest that systems should provide automated mechanisms to help users orga-
nize their bookmarks effectively and access frequently selected items faster.
3.2.2 Email and Office Applications
Information overload is not only a problem of Web environments. Everyday, users have to
scan through a continuously increasing number of email messages, frequently search for
their documents within deep hierarchical file structures and interact with overloaded menus
and toolbars. At the same time, they have to process and classify information, filter out in-
formation that does not satisfy their needs and, finally, organize their working space so that
they can use it effectively in the future. Whittaker and Sidner (1996) report that maintaining
email inboxes requires a lot of effort, and users often experience problems when managing
email folders. Whittaker and Sidner (1996) suggest that information retrieval techniques
should be used to automatically cluster email documents and reduce the clutter of inboxes.
A related problem is coping with the increasing complexity of computer applications.
Modern software includes a large number of features, a phenomenon characterized as soft-
CHAPTER 2. RELATED WORK 12
ware “bloat” (McGrenere and Moore, 2000). In order to understand how users deal with the
complexity of software, McGrenere and Moore (2000) conducted a user study with 53 par-
ticipants selected from the general population. The study examined participants’ experience
with Microsoft Word 97. Each participant answered a questionnaire and was engaged in two
interviews. The goal of the first interview was to collect quantitative data about each partici-
pant’s familiarity with the functionality of Microsoft Word. The goal of the second interview
was to collect qualitative in-depth data about their experiences with word-processing appli-
cations. According to the results of the study, 15.8% of the 265 first-level functions of Mi-
crosoft Word were not used at all, and only 21.5% were used by more than half of the par-
ticipants. Finally, only 3.3% of the functions were used regularly by more than three quarters
of the participants. Answers given by participants to the questionnaire and the second inter-
view showed that there was no general consensus about how unused functionality should be
handled. Only 24% of participants agreed that they would want only the functions that they
used, but 45.3% of participants stated that they would prefer to have unused functions
“tucked away”. These results agree with results reported by other studies. Linton et al.
(1999) recorded data from 16 users of Microsoft Word 6.0 over a period ranging from 3 to
11 months per user. They found that out of a total of 642 commands available, each user
used only 56 commands (8.7%) on average during the study period and only 25 commands
(3.9%) in an average month. Furthermore, the top 10 commands accounted for 80% of use
and the top 20 commands accounted for 90% of use. Real data reported by Findlater and
McGrenere (2004) also show that only a small percentage of menu items are frequently se-
lected. According to Greenberg and Witten (1985) and Cockburn et al. (2007), the frequency
of command use in desktop environments, and similarly the frequency of menu selection,
follows a Zipfian distribution. A Zipfian distribution has the form Pn ~ 1/na, where Pn is the
frequency of the nth ranked command or menu option and a is a constant whose value is
close to 1.
CHAPTER 2. RELATED WORK 13
Hotkeys help users to access frequently selected items faster but require them to re-
member several key sequences. According to Lane et al. (2005), even experienced users may
fail to use hotkeys effectively. Besides, hotkeys cannot be used to access dynamically evolv-
ing components such as mailboxes or bookmark lists.
3.3 Adaptation Techniques
Existing evidence seems to suggest that adaptive user interfaces could possibly improve user
interaction with desktop environments. However, how a user interface needs to be adapted is
an open question. In this section, we review various adaptation techniques, aimed at facilitat-
ing common tasks, such as information exploration and selection in hypertexts, lists, file
managers, menus and toolbars. We split our presentation into two parts. First, we discuss ad-
aptation techniques in the context of hypermedia and Web environments. Second, we review
adaptation techniques for common user interface widgets in desktop environments.
3.3.1 Adapting Hypermedia Environments
Hypermedia systems with adaptive features are known as Adaptive Hypermedia (AH) sys-
tems (Brusilovsky, 1996, 2001). Adaptation in AH systems can serve a variety of different
goals:
1. Facilitate navigation and reduce disorientation problems
2. Reduce cognitive overheads by helping users make decisions about what information
to read or which link to follow
3. Reduce information overload by filtering out noise and content that is not needed by
the user
4. Accelerate access to information that is relevant to the user’s needs
5. Adapt content based on level of user expertise, skills, and preferences
6. Recommend pages
CHAPTER 2. RELATED WORK 14
7. Adapt the layout and presentation style of pages based on the hardware and network
capabilities of the client machine or based on individual user preferences
Adaptation techniques used in AH systems are commonly classified based on a taxon-
omy proposed by Brusilovsky (1996). According to Brusilovsky’s taxonomy, adaptation
techniques are divided into two main categories: (1) adaptive presentation, and (2) adaptive
navigation support.
Adaptive Presentation
The primary goal of adaptive presentation is to reduce information overload within hypertext
pages, eliminate scrolling and subsequently, reduce cognitive overhead. A popular method
of content adaptation is hiding content that is not relevant to the information needs of a user.
The main weakness of this approach is the fact that hiding information can prevent users
from accessing information that is possibly valuable. A technique that relaxes this problem is
stretchtext. Stretchtext is a form of hypertext, in which text can be collapsed or expanded by
clicking on hot words. The role of hot words in stretchtexts is similar to the role of
hyperlinks in common hypertexts, with the difference that clicking on a hot word does not
result in jumping to a new page. MetaDoc (Boyle and Encarnacion, 1994) was the first AH
system to apply stretchtext to adapt the presentation of content. In MetaDoc, experts were
provided with fewer details than novice users. However, experts could still view the hidden
details of content by clicking on hot words in the text. Similarly, novice users could collapse
detailed text and reduce the size of pages. PUSH (Hook, 1997) also employed stretchtext to
adapt the presentation of learning material.
In contrast to the above techniques, sorting or dimming fragments can help users iden-
tify useful information without hiding content. Sorting fragments can minimize the scrolling
effect as the most relevant page fragments are presented at the top of a page. The main
drawback of this approach is that reordering fragments on a page can disturb the natural flow
CHAPTER 2. RELATED WORK 15
of content. Dimming was introduced by Hothi et al. (2000). It is the simplest and least intru-
sive adaptation technique. According to dimming, document fragments that are not relevant
to a user’s goals are shaded. Dimming does not reduce the size of the adapted pages and, as a
result, it does not cope with the scrolling problem. Besides, shaded information can easily
gain the attention of users and distract them from their task.
Adaptive Navigation Support
Brusilovsky's (1996) taxonomy specifies six main types of adaptive navigation support: di-
rect guidance, adaptive link sorting, adaptive link hiding, adaptive link annotation, adaptive
link generation, and map adaptation. Different combinations of these techniques have been
integrated into AH systems to facilitate navigation and help users discover interesting infor-
mation. For instance, WebWatcher (Joachims et al., 1997) and Personal WebWatcher
(Mladenic, 1996) provide direct guidance by highlighting a small number of links. Syskill &
Webert (Pazzani et al., 1996) annotates links with descriptive icons, where each icon repre-
sents a different likelihood of relevance. Finally, HYPADAPTER (Hohl et al., 1996) uses
different font sizes and link sorting to adapt the presentation of links.
Link generation techniques enhance pages with supplementary hyperlinks. There are
two types of link generation: (1) generation of lists of recommended hyperlinks, and (2) link
augmentation. Several systems (Hirashima et al., 1998; Kaplan et al., 1993) combine link
recommendation with link sorting so that the most relevant links appear first. Other ap-
proaches (Budzik et al., 2001) cluster recommendations and present them under different
categories. In addition to recommendation, Letizia (Lieberman, 1995) provides explanations
about why each link is recommended. Link augmentation involves direct insertions of
hyperlinks into the body of a document (Bailey et al., 2001; El-Beltagy et al., 2001; Faaborg
and Lieberman, 2006); words or phrases in the document’s text are selected as link anchors.
CHAPTER 2. RELATED WORK 16
Map adaptation refers to the adaptation of global or local hypermedia maps presented
to the user. Several visualization techniques such as tree-maps (Johnson and Shneiderman,
1991), fisheye views (Furnas, 1986; Noik, 1993), and hyperbolic trees (Lamping et al., 1995)
can be used to provide personalized maps of hypermedia structures.
Some systems such as MONTAGE (Anderson and Horvitz, 2002) use a combination of
different adaptation techniques. MONTAGE automatically generates personalized Web portals
that aggregate hyperlinks and summaries of Web content. In such portals, links and content
are classified into topics that appear in separate panes. Finally, a few approaches have tried
to add adaptive features to navigational tools, for example, bookmark lists. PowerBook-
marks (Li et al., 1999), for instance, supports the automatic collection of bookmarks by ana-
lyzing the frequency of page visits and hyperlink connections between visited pages. It also
provides facilities for sophisticated searching in bookmarks.
3.3.2 Adapting User Interface Widgets
As with adaptive hypermedia, highlighting, hiding, restructuring items and making recom-
mendations have been used to adapt menus, toolbars, lists and file hierarchies. Such adapta-
tion techniques have been aimed at (1) reducing cognitive overhead by decreasing the num-
ber of the available choices in an interface, (2) accelerating the selection of frequently se-
lected items, (3) helping users easily identify relevant information and useful functionality,
and (4) relaxing the physical strain caused by repetitive actions.
A variety of adaptation techniques have been used by the Microsoft Windows operat-
ing system. For instance, in the Start menu of Windows XP, newly installed applications are
highlighted to help users learn where a new application has been placed. A more famous de-
sign is the version of adaptive menus, namely Adaptive Menus, introduced by Microsoft Of-
fice 2000. The goal of Adaptive Menus was to reduce the bloat in menus by hiding infre-
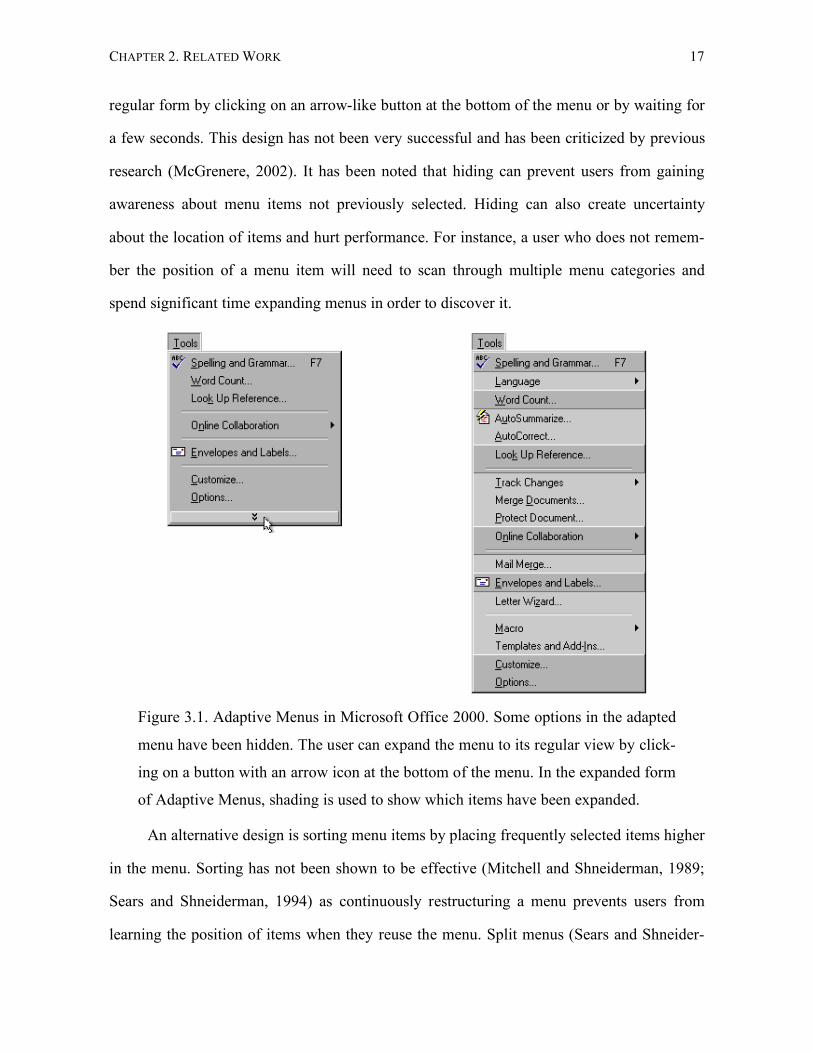
quently used options. As shown in Figure 3.1, users could expand an adapted menu to its
CHAPTER 2. RELATED WORK 17
regular form by clicking on an arrow-like button at the bottom of the menu or by waiting for
a few seconds. This design has not been very successful and has been criticized by previous
research (McGrenere, 2002). It has been noted that hiding can prevent users from gaining
awareness about menu items not previously selected. Hiding can also create uncertainty
about the location of items and hurt performance. For instance, a user who does not remem-
ber the position of a menu item will need to scan through multiple menu categories and
spend significant time expanding menus in order to discover it.
Figure 3.1. Adaptive Menus in Microsoft Office 2000. Some options in the adapted
menu have been hidden. The user can expand the menu to its regular view by click-
ing on a button with an arrow icon at the bottom of the menu. In the expanded form
of Adaptive Menus, shading is used to show which items have been expanded.
An alternative design is sorting menu items by placing frequently selected items higher
in the menu. Sorting has not been shown to be effective (Mitchell and Shneiderman, 1989;
Sears and Shneiderman, 1994) as continuously restructuring a menu prevents users from
learning the position of items when they reuse the menu. Split menus (Sears and Shneider-
CHAPTER 2. RELATED WORK 18
man, 1994) partially solve this problem by splitting menus into two sections: (1) a top per-
sonalized section, and (2) a bottom static section. The top section contains a small number of
the most frequently selected items (e.g., four items). The bottom section contains the rest of
the items in their original order. Note that attempting to locate a frequently selected item at
its original position will fail if using this version of split menus. Gajos et al. (2005) observe
that this issue can be addressed by copying instead of moving items to the split section. This
approach has been adopted by newer versions of Microsoft Word (e.g., Microsoft Word
2004 for Mac) to personalize the list of font styles in the formatting toolbar.
SUPPLE (Gajos et al., 2005), a toolkit that automatically creates personalized user in-
terfaces, generalizes the split design to other user interface components, such as dialog boxes
and configuration windows. Such user interfaces are called split interfaces. Their compo-
nents are split into static sections, which respect the original structure of widgets, and dy-
namic sections, which are dynamically adapted to better accommodate the ongoing user
tasks. An example of a split interface applied to toolbars was tested by Gajos et al. (2006). In
this interface, an additional toolbar was added, containing the most frequently (or more re-
cently) selected tools. Items in the new adaptive toolbar were copied rather than moved from
the original toolbars. Users could still access items from their regular location; on the other
hand, additional screen space was consumed, which might be a problem in small screens.
An approach different than highlighting, sorting or splitting was adopted by Janecek
and Pu (2002). This approach uses scaling in the context of distortion-based fisheye views
(Furnas, 1986) to deemphasize non-relevant information in tabular data. Distortion is applied
by varying the font size of tabular content with respect to a continuous function that evalu-
ates the degree of user interest for each cell in a table. McGuffin et al. (2004), on the other
hand, introduced expand-ahead, an adaptation technique aimed at helping users drill down
paths in tree browsers faster. Expand-ahead automatically expands folders, e.g., frequently
expanded folders, to fill available screen space. Expansion is only performed when there is
CHAPTER 2. RELATED WORK 19
free space for the visualization of an expanded folder, and thus, disturbance due to adapta-
tion is minimal. However, as McGuffin et al. (2004) admit, expand-ahead increases clutter
and can hinder visual search.
Finally, software assistants such as spelling checkers and word predictors (Hui and
Boutilier, 2006), notification systems (Horvitz and Apacible, 2003), and anthropomorphic
agents (Horvitz, 1999; Koda and Maes, 1996) constitute a separate class of adaptation tech-
niques not examined here.
3.4 User Modeling
User models are essential components of adaptive user interfaces. A user model is a repre-
sentation of a user that a system maintains. A user model may capture any information about
a user such as preferences, skills, expertise, disabilities, cognitive styles, goals, interests, us-
age patterns, and information needs. User models are typically application-dependent. Dif-
ferent systems have used a wide range of representation schemes for user models. In their
simplest form, user models are static stereotypes of users, such as novices and experts. There
exist, however, sophisticated modeling techniques that capture rich information about a user,
for example, histories of previous actions, summaries of information that the user has ac-
cessed in the past, and probability distributions over alternative user goals.
A common approach to capturing and modeling information about users is to observe
past usage patterns such as the frequency or recency of certain user actions. For example,
Adaptive Menus in Microsoft Office 2000 were adapted based on an algorithm that com-
bined frequency and recency of menu selections (Findlater and McGrenere, 2004). More ge-
neric approaches (Horvitz et al., 1998; Hui and Boutilier, 2006) have used Bayesian model-
ing to capture uncertainties about user goals and needs. Such models are inferred through
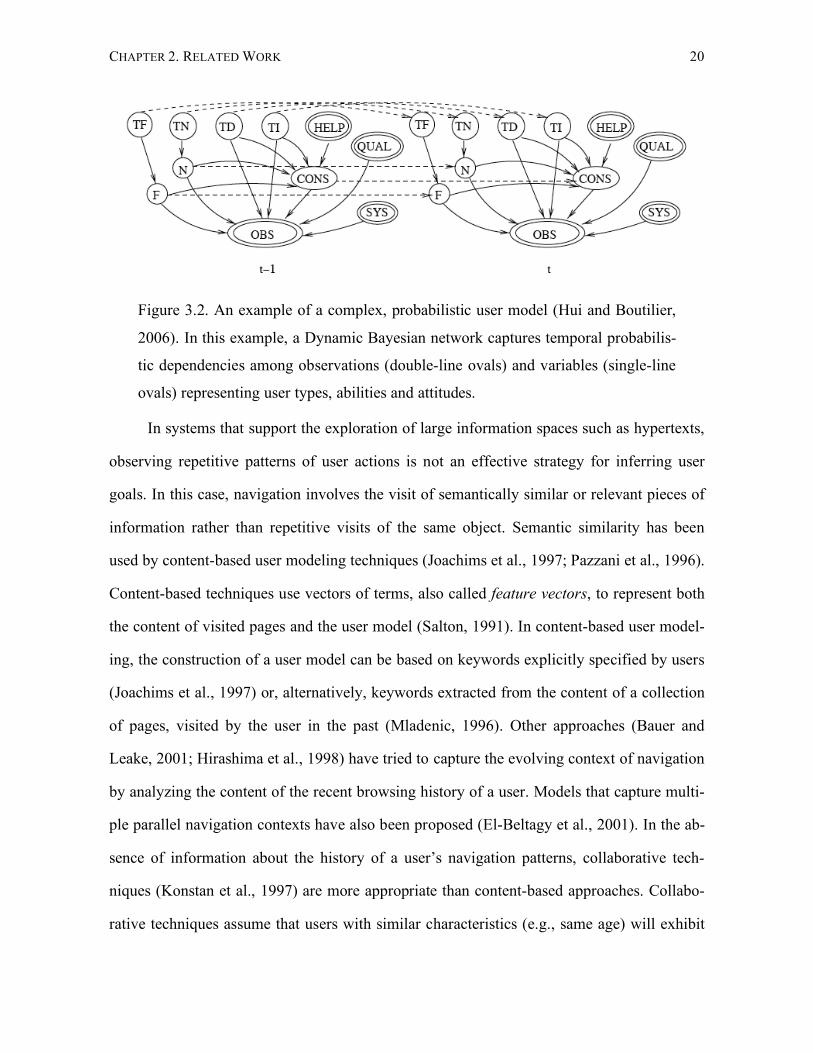
various observations of user actions and can be rather complex as Figure 3.2 illustrates.
CHAPTER 2. RELATED WORK 20
Figure 3.2. An example of a complex, probabilistic user model (Hui and Boutilier,
2006). In this example, a Dynamic Bayesian network captures temporal probabilis-
tic dependencies among observations (double-line ovals) and variables (single-line
ovals) representing user types, abilities and attitudes.
In systems that support the exploration of large information spaces such as hypertexts,
observing repetitive patterns of user actions is not an effective strategy for inferring user
goals. In this case, navigation involves the visit of semantically similar or relevant pieces of
information rather than repetitive visits of the same object. Semantic similarity has been
used by content-based user modeling techniques (Joachims et al., 1997; Pazzani et al., 1996).
Content-based techniques use vectors of terms, also called feature vectors, to represent both
the content of visited pages and the user model (Salton, 1991). In content-based user model-
ing, the construction of a user model can be based on keywords explicitly specified by users
(Joachims et al., 1997) or, alternatively, keywords extracted from the content of a collection
of pages, visited by the user in the past (Mladenic, 1996). Other approaches (Bauer and
Leake, 2001; Hirashima et al., 1998) have tried to capture the evolving context of navigation
by analyzing the content of the recent browsing history of a user. Models that capture multi-
ple parallel navigation contexts have also been proposed (El-Beltagy et al., 2001). In the ab-
sence of information about the history of a user’s navigation patterns, collaborative tech-
niques (Konstan et al., 1997) are more appropriate than content-based approaches. Collabo-
rative techniques assume that users with similar characteristics (e.g., same age) will exhibit
CHAPTER 2. RELATED WORK 21
similar interests. Given this assumption, they assist users based on the interests of other users
with similar characteristics. E-commerce sites such as Amazon.com have extensively
adopted this approach to personalize recommendation.
3.4.1 Evaluation Measures
Presumably, the effectiveness of a user modeling technique could be measured based on how
accurately a user model captures the real goals, preferences or needs of users. However, a
user model is, by definition, an incomplete and simplified representation of a user. As a re-
sult, establishing objective evaluation measures of user models is not always feasible.
Brusilovsky et al. (2004) report that user models can be subjectively tested by having experts
monitor users as they work and evaluate the conclusions of the system stored in the user
model. Alternatively, the actual users themselves can evaluate whether a user model reflects
their needs.
In some cases, objective measures can be established by analyzing data from the inter-
action of users and then matching this data with the system’s assumptions, maintained as
part of the user model. Consider, for instance, the following scenario. An adaptive user in-
terface is aimed at improving visual search in toolbars. As part of its evaluation, a number of
users are observed while they interact with the user interface. Data about the history of tool-
bar selections are collected. This data is then analyzed to test how accurately the observed
user selections reflect the user model under consideration.
When the role of user modeling is to classify documents or elements of a user interface
into a finite set of classes, e.g., tools in a toolbar are classified as either “relevant” of “ ir-
relevant” or a hyperlink is classified as “interesting” or “uninteresting”, then information-
retrieval measures as accuracy, precision and recall (Sebastiani, 2002) can be used. For in-
stance, accuracy could be defined as the mean probability that an element in the user inter-
face is classified into the correct class.
CHAPTER 2. RELATED WORK 22
3.5 Problems Associated with Adaptive Behaviour
We can identify three major problems of adaptive user interfaces:
1. They depend on the construction of user models that are incomplete and often erro-
neous.
2. They result in complex conceptual models that cannot be well understood by users.
3. They often make it difficult for users to control the system’s actions.
Although research in the areas of User Modeling and Machine Learning tries to address the
first problem by applying new user modeling techniques and new learning algorithms, it is
commonly acknowledged that no user model can accurately describe a user. It is also hard to
believe that future intelligent systems will be able to precisely predict what users want as
even human experts may fail to do so. The second problem derives from the fact that the
way that adaptive user interfaces behave is often determined by complex decision-making
that users may not be aware of. User models are usually hidden from the user, and the re-
sponse of an adaptive user interface can seem inconsistent and unpredictable. The third prob-
lem becomes crucial when the system cannot accurately infer user goals and needs. User in-
tentions often change rapidly. Unfortunately, in absence of evidence about changes, auto-
matic learning is not feasible. In such situations, and unless the user can provide direct feed-
back to the system, adaptation will fail to capture the changing user intentions. According to
Shneiderman, who has been a passionate critic of adaptive user interfaces in the past
(Shneiderman and Maes, 1997), adaptive user interfaces violate basic usability principles
that have been established in the context of directly manipulated user interfaces. Direct ma-
nipulation involves continuous representation of objects, rapid, reversible and incremental
actions, and feedback (Shneiderman, 1983). Adaptive behaviour usually lacks such proper-
ties.
CHAPTER 2. RELATED WORK 23
Besides the above problems, adaptation can affect landmarks on which users base their
navigational and reading tasks. In general, landmarks are distinctive environmental features
functioning as reference points (Vinson, 1999). In a user interface, examples of elements that
act as landmarks are images, graphics, fonts, and structural forms of laying out information
or widgets. Users depend on the presence of landmarks when they interact with a desktop
environment, so disturbing these landmarks may disrupt their mental models and result in
disorientation. In the rest of Section 3.5, we survey how existing approaches have tried to
address such problems and identify their main limitations.
3.5.1 Predictability, User Trust, and Transparency of Adaptive Behaviour
Mental models are dynamic representations of the real world, constructed by users to predict
and explain the operation of a target system. D. A. Norman (1986) states that mental models
are incomplete, unstable, unscientific and parsimonious, while humans’ abilities to run them
are limited. He also distinguishes between mental models and conceptual models, which are
models invented by teachers, designers, scientists and engineers. Conceptual models are in-
tended to be accurate, complete and consistent representations of the target system. Making a
system transparent can help users to build adequate mental models that closely match a sys-
tem’s conceptual model.
An adaptive system’s behaviour can vary according to the details of the user model
and its inference mechanism, which are usually not transparent to the user. As a result, there
is a danger that the user will not understand the actions of the adaptive system. Unpredict-
able behaviour, particularly when it fails to satisfy user needs, can lead to user frustration
and poor use of the system. Parasuraman (1997) distinguishes between two deficient uses of
automation, which occur when the operation and capabilities of automation are not correctly
anticipated by users: (1) misuse, which refers to the over-reliance on automation caused
when the user has overestimated the system’s intelligence; and (2) disuse, which refers to the
CHAPTER 2. RELATED WORK 24
underutilization of automation when the user has underestimated the system’s ability to pro-
vide assistance. Misuse and disuse closely relate to user trust, which can be defined as “the
attitude that an agent will help achieve an individual’s goals in a situation characterized by
uncertainty and vulnerability” (Lee and See, 2004). User trust and willingness to use auto-
mation have been shown to decrease as automation becomes incompetent (Muir and Moray,
1996). Eliminating the problems of misuse and disuse is known as trust calibration (Lewis,
1998), which can be achieved by making automation predictable. According to Lewis
(1998), automation can be made predictable by (1) consistently pairing simple observable
actions with inputs, (2) making the causes and rules governing an agent’s behaviour trans-
parent, or (3) making the purpose, capability, and reliability of the agent available to the
user.
As a solution to this problem, researchers (Cook and Kay, 1994; Kuhme, 1993) have
suggested that user models should be inspectable or simply viewable. As user models can be
complex and involve several parameters, the main challenge of this approach is how to rep-
resent the user model in a form that the user can easily understand. In their system, Cook and
Kay (1994) provided visualizations of user models, the components of which were organized
as interactive hierarchical structures. Different shapes were used to indicate the type of each
node in the hierarchy, e.g., crosses represented user characteristics and diamonds represented
user beliefs. The user could click on the nodes to unfold them and uncover their details. Such
views of user models can be rather complex and hard to understand. Furthermore, they are
decoupled from the main user interface and are not directly associated with the interaction
model of the application. Consequently, although the details of such user models are
viewable, the process of their construction is not fully transparent.
Hook (2000) observes that depending on the application domain and the individual
user’s experience, it can be difficult to provide comprehensible views of user models. In this
case, it would be more appropriate to hide complex inference mechanisms from the user and
CHAPTER 2. RELATED WORK 25
show, instead, simplified views of the user model that provide a sense of predictability. Sev-
eral learning systems have used skillometers to give an indication of a student model (Kay,
2001). Skillometers enable learners to see how the system models their progress. Other ap-
proaches (Andre and Rist, 2002; Horvitz, 1999; Koda and Maes, 1996) have suggested the
use of anthropomorphic agents that imitate human-human communication. Such agents are
gifted with facial expressions that provide an indication of transparency of what the agent
believes about a user’s goals. The main argument against anthropomorphic agents is that
they give false expectations about their intelligence and their ability to communicate with the
user (Shneiderman and Maes, 1997).
3.5.2 Controllability
As mentioned earlier, researchers often distinguish between adaptive and adaptable user in-
terfaces (Fischer, 2001). In contrast to adaptive user interfaces, personalization in adaptable
user interfaces is mostly determined by the user and less by the system itself. The main ad-
vantage of adaptable systems over adaptive user interfaces is that they give users control
over adaptive behaviour and minimize the likelihood of incorrect system decisions.
The distinction between adaptability and adaptivity is usually theoretical, as an adap-
tive user interface can incorporate adaptable characteristics and allow for some level of user
control. User control can have different forms and affect different levels of the interface’s
adaptive behaviour. An empirical study conducted by Jameson and Schwarzkopf (2002) in-
dicated that some users may like to have control over the system’s actions, while others may
prefer automatic assistance. On the other hand, some users may be willing to switch between
more or less controllable versions of an interface depending on how their task evolves over
time. Kuhme et al. (1992) identify four stages in an adaptation process: (1) the initiative for
adapting the user interface, (2) a proposal of alternative adaptations, (3) a decision about
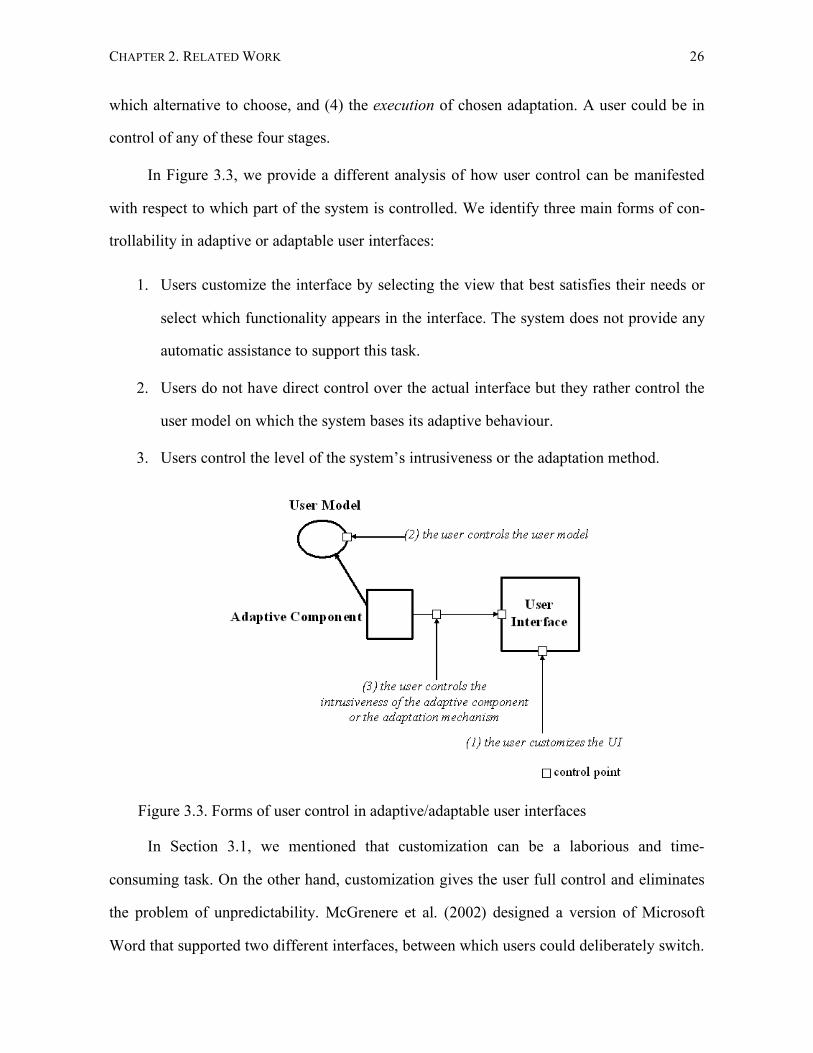
CHAPTER 2. RELATED WORK 26
which alternative to choose, and (4) the execution of chosen adaptation. A user could be in
control of any of these four stages.
In Figure 3.3, we provide a different analysis of how user control can be manifested
with respect to which part of the system is controlled. We identify three main forms of con-
trollability in adaptive or adaptable user interfaces:
1. Users customize the interface by selecting the view that best satisfies their needs or
select which functionality appears in the interface. The system does not provide any
automatic assistance to support this task.
2. Users do not have direct control over the actual interface but they rather control the
user model on which the system bases its adaptive behaviour.
3. Users control the level of the system’s intrusiveness or the adaptation method.
Figure 3.3. Forms of user control in adaptive/adaptable user interfaces
In Section 3.1, we mentioned that customization can be a laborious and time-
consuming task. On the other hand, customization gives the user full control and eliminates
the problem of unpredictability. McGrenere et al. (2002) designed a version of Microsoft
Word that supported two different interfaces, between which users could deliberately switch.
CHAPTER 2. RELATED WORK 27
A full interface contained all the functionality of the software, whereas a personal interface
was customizable, containing only functionality that users explicitly determined. The results
of a field study showed that the majority of participants preferred this customizable multiple
interface over the adaptive interface of menus, as appeared in Microsoft Windows 2000. Be-
sides, participants generally made extensive use of customization.
The fact that several users are willing to customize does not necessarily imply that cus-
tomization is always beneficial. Users employ a variety of different customization strategies,
and some of these strategies could be more effective than others. The effectiveness of differ-
ent customization strategies in the multiple interface, as introduced by McGrenere et al.
(2002), was explored by Bunt et al. (2004). In particular, this work tried to give answers to
two questions:
1. When to customize? Up front or later, when functionality is actually used?
2. What to customize? Everything that is being used or only the most frequent
functions?
Following a model-based evaluation approach, Bunt et al. (2004) found that customizing up
front and only the most frequent functions is the most effective strategy in terms of perform-
ance benefits. Benefits coming from customization were greater for novice users. On the
other hand, the performance of novice users was found to be more sensitive to ineffective
customization strategies than the performance of experts. Unfortunately, novice users are
normally not in the position to predict their future usage patterns. This means that novices
are prone to follow suboptimal customization strategies. Bunt et al. (2004) hypothesized that
enhancing customization with automated assistance would help users customize a user inter-
face more effectively. More recently, Bunt et al. (2007) extended the multiple interface and
modified the customization mechanism to combine automation with customization. Accord-
ing to this approach, the initiative for customizing the user interface is taken by the user, but
CHAPTER 2. RELATED WORK 28
the system assists the customization task by making suggestions about which functionality to
be included in the personal interface. Users can view the rationale that directs the sugges-
tions and either approve the suggestions or apply their own customization. These control
mechanisms make automation transparent, thus dealing with the problem of unpredictability.
On the other hand, they add additional complexity to the user interface. A main drawback of
the multiple interface is the fact that users are required to switch from the personal interface
to the full interface to find functionality not included in the former one. The cognitive over-
head of switching interfaces has not been yet clearly assessed as Bunt et al. (2004) admit.
Such a cost could reinforce the adherence to a minimal set of functions and, in the long run,
discourage novice users from learning how to use new functionality.
The second form of controllability shown in Figure 3.3 does not support direct control
over the elements of the user interface. Customization is performed indirectly as the user
controls the parameters of the user model. Controllability of user models has been mainly
investigated in the context of intelligent tutoring systems. Kay (2001) states that, as opposed
to early tutoring systems that viewed users as students, the term learner has been favoured in
later systems. This implies that the role of the users is not passive; they are responsible for
their own learning, participating in the construction of their model and selection of teaching
strategies. Kay has also introduced the notion of scrutable adaptive systems. Scrutable adap-
tive systems enable the user to investigate and review the way that the system has been
adapted. Tutor (Czarkowski and Kay, 2003) is a scrutable AH system developed within this
framework. At the beginning of each session, Tutor constructs a student model based on the
answers of the student to a small set of profile questions. Based on the constructed model,
pages are adapted by excluding parts of the content. Furthermore, at the bottom of each
adapted page, there is a link to an explanation section. The explanation section explains how
adaptation is performed and what content has been excluded from a page. Users can revise
their answers to profile questions by clicking on an icon on the top of an adapted page. Tutor
CHAPTER 2. RELATED WORK 29
does not distinguish between user feedback, which is received by the system in order to
build the user model, and user control over the system’s adaptive behaviour. Both types of
interaction are performed by the user by answering a small set of predefined questions.
Therefore, this approach cannot be applied to systems in which the construction of user
models depends on extensive and implicit user feedback.
Adaptable systems that belong to the third form of controllability let the user control
the adaptation method or the intrusiveness of adaptation. As an example, research by Micro-
soft has tried to tackle the problem of balancing between automated assistance and intrusive-
ness and investigate how intelligence could be incorporated into directly manipulated inter-
faces. Horvitz (1999) refers to the type of interfaces in which users and intelligent agents
collaborate to achieve the user goals as mixed-initiative user interfaces. Although, in such
systems, beliefs about the goals of a user are based primarily on implicit user input, users are
allowed to explicitly specify utilities and threshold probabilities that affect the system’s in-
trusiveness and adaptation strategy (Horvitz, 1999).
3.6 Evaluation of Adaptive User Interfaces
Because of the problems discussed above, adaptive user interfaces have been criticized for
being more a hindrance rather than help (Shneiderman and Maes, 1997). Part of this criti-
cism can be explained by the lack of clear evaluation results that could show advantages of
adaptive user interfaces over static user interfaces. After reviewing articles on user model-
ing and user-adapted systems prior to 2001, Chin (2001) found that only about one third of
the articles on user models and user-adapted systems included any type of evaluation. As
several evaluations were just pilot or informal studies, only a quarter of the articles reported
statistically significant results. Besides, a large volume of work within the communities of
artificial intelligence and user modeling has assumed that adaptive behaviour is beneficial as
long as effective intelligent algorithms can be developed, disregarding the effect of adaptive
CHAPTER 2. RELATED WORK 30
behaviour on real users. On the other hand, results from evaluations with real users have
been non-conclusive and contradictory or were limited in scope.
3.6.1 Evaluation Strategies and Frameworks
Based on Chin's (2001) analysis, we can distinguish between two different types of evalua-
tions: (1) evaluations that only test the effectiveness of the underlying learning algorithm and
user modeling approach; and (2) evaluations that test the overall success of a particular sys-
tem. Evaluations that belong to the first category make use of evaluation measures like the
ones discussed in Section 3.4.1. For instance, Joachims et al. (1997) measured the perform-
ance of WebWatcher in terms of accuracy. Accuracy was defined as the percentage of cases
in which users followed the advice given by the system. In a different experiment,
WebWatcher’s performance was compared against the performance of eight human experts
as well as the performance of random suggestions. Unfortunately, such approaches cannot
test the overall success of the system and the usability of the techniques used to adapt a user
interface.
Evaluations that belong to the second category evaluate the overall utility and usability
of a particular system through studies with real users. A common approach of such studies is
to compare the adaptive system against its non-adaptive version with respect to measures of
user performance, such as task-completion time, number of errors, quality of user answers to
comprehension questions as well as measures that capture user satisfaction. Hook (1997)
notes that this evaluation approach can often be problematic, if the non-adaptive version of
the user interface has not been optimally designed for a given task. If adaptivity is a natural
part of the system, the evaluation could be biased against its non-adaptive version if the lat-
ter has not been carefully designed. In addition, an evaluation will be biased if the selection
of the tasks that participants complete stresses the strengths of the adaptive system and the
CHAPTER 2. RELATED WORK 31
weaknesses of the non-adaptive one. Selecting a set of representative tasks that capture both
the strengths and weakness of an approach is a tricky procedure.
Brusilovsky et al. (2004) observe that evaluating an adaptive system as a whole is not
always useful, as it cannot lead to safe conclusions about which parts of a system are suc-
cessful. If the system fails to satisfy the user or proves to hinder his/her tasks, such an
evaluation cannot clearly show which aspect of the system did not work well. Should the
failure be attributed to limitations of the user modeling approach or is it the adaptation tech-
nique that is used to personalize the user interface that fails? As a solution to this problem,
Brusilovsky et al. (2004) propose a layered evaluation process. They suggest that the evalua-
tion of adaptive systems should be conducted at two distinct layers: (1) user modeling and
(2) decision-making. We have already discussed how user models can be evaluated, so we
skip the first layer here. The question, according to Brusilovsky et al. (2004), that an evalua-
tion at the second layer should address can be stated as “are the adaptation decisions valid
and meaningful, for the given state of the user model?” For instance, given the scenario that
the user model “thinks” that the user will insert a new table using a menu, is highlighting the
corresponding menu option the correct adaptive decision to be made? Would hiding the
other options in the same menu be a better approach? The layered evaluation process, as
proposed by Brusilovsky et al. (2004), allows for testing and comparing different adaptation
techniques independently of the implementation of the user-modeling and learning compo-
nent. On the other hand, it disregards the fact that the appropriateness of a particular adapta-
tion technique highly depends on the ability of the user model to correctly capture the user
needs. Hiding menu options might be the best decision given a user model that was always
accurate, but highlighting might be more appropriate if the user model contained errors.
Since user models are usually incomplete and erroneous, studying adaptation decision-
making independently can result in misleading conclusions.
CHAPTER 2. RELATED WORK 32
Similar layered evaluation frameworks but with a greater degree of granularity have
been proposed by Paramythis et al. (2001) and Weibelzahl (2002). Weibelzahl (2002) identi-
fies four rather than two evaluation steps: (1) the evaluation of the reliability and validity of
the data collected from a user to built a user model; (2) the evaluation of the inference
mechanism and the accuracy of user properties; (3) the evaluation of adaptation decisions;
and (4) the evaluation of the overall interaction with respect to system behaviour, user be-
haviour and usability. On the other hand, Paramythis et al. (2001) identify seven modules
that together comprise the various stages of adaptation, and for each module, they propose
different evaluation approaches. The seven modules capture all the different aspects of a sys-
tem that performs adaptations including user modeling, learning, decision-making, user in-
teraction, feedback, and transparency of adaptation. The approaches that Paramythis et al.
(2001) and Weibelzahl (2002) suggest for the evaluation of adaptation decisions and adapta-
tion techniques are very similar to the approach suggested by Brusilovsky et al. (2004) and
bear similar limitations. Overall, their scope has been the extensive evaluation of particular
systems rather than the assessment of designs independently of the system in which they are
used.
3.6.2 Evaluating the Viability of Adaptive User Interfaces
Several user studies have tested the effectiveness of particular designs of adaptive user inter-
faces. Some studies have shown that adaptation is beneficial while others have shown the
opposite. In this section, we review the most thorough, according to our opinion, studies. We
also attempt to explain their results and identify their limitations.
Overview of Studies Assessing Adaptive User Interfaces
An early experiment on the viability of adaptive user interfaces was conducted by Greenberg
and Witten (1985). The experiment compared two hierarchical menu interfaces: (1) a regular
menu interface that did not use any information about usage patterns; and (2) an adaptive
CHAPTER 2. RELATED WORK 33
version of the menu interface that organized nodes based on popularity patterns. The results
showed that the adaptive design was significantly more effective in terms of both task-
completion time and error rates. A later experiment conducted by Mitchell and Shneiderman
(1989) on adaptive menus showed that adaptive user interfaces may hurt rather than improve
performance. The experiment compared static versus dynamic menus. Dynamic menus were
continuously reordered so that frequently selected items appeared closer to the top of the
menu. The results showed that dynamic menus did not improve menu selection speed.
Moreover, an 81% of the 73 students that participated in the study favoured the static menus.
More than a decade later, McGrenere et al. (2002) conducted a field study to evaluate
their multiple interface design applied to Microsoft Word 2000 and compare it against the
normal interface of this software, both with and without Adaptive Menus (see Figure 3.1)
enabled. The researchers classified participants into two different user types: feature-shy us-
ers, i.e., users who generally prefer interfaces with few features; and feature-keen users, i.e.,
users who generally prefer up-to-date versions of software with many features. The majority
of participants (13 out of 20) ranked the multiple interface design as the most favoured one.
Preferences over the static and the adaptive version of the user interface were split among
participants. Feature-shy participants seemed to favour the static interface while feature-keen
participants favoured the adaptive one.
More recently, Findlater and McGrenere (2004) compared a design of static menus
against a design of adaptive menus and a design of adaptable menus. All the three designs
were implemented as split menus. Adaptive split menus were automatically organized based
on both selection frequencies and selection recency. Adaptable split menus were manually
customized by users. In their original design (Sears and Shneiderman, 1994), split menus
were assumed to be pre-organized at design time rather than being adapted at use time.
Tested on rather long menus (28- item long), frequency-based split menus were shown to be
faster than alphabetic menus (Sears and Shneiderman, 1994). However, prior to the study of
CHAPTER 2. RELATED WORK 34
Findlater and McGrenere (2004), there was no evidence about whether automatically reor-
ganized split menus could be effective. The latter study showed that static split menus per-
formed better than adaptive split menus.
Benefits of adaptive behaviour have been identified by early experimental work on
adaptive hypermedia systems. Boyle and Encarnacion (1994) compared three different ver-
sions of a hypertext-based documentation system: (1) traditional hypertext; (2) stretchtext-
like hypertext; and (3) adaptive stretchtext-like hypertext. The results showed significant
performance benefits of stretchtext over traditional hypertext. In addition, compared to the
static version of stretchtext, adaptive stretchtext improved some performance measures such
as the time spent by participants to answer comprehension questions. Hook (1997) also
evaluated adaptive stretchtext, but she focused on measures of user satisfaction rather than
measures of user performance. The results showed that participants generally preferred the
adaptive version to the static version of stretchtext.
Discussion
The above results indicate that the success of an adaptive user interface depends on several
parameters. Clearly, we cannot reach general conclusions about the effectiveness of adaptive
user interfaces without having first identified these parameters and understood their impact.
The findings of Greenberg and Witten (1985) are different than the findings of Mitchell and
Shneiderman (1989) and the findings of Findlater and McGrenere (2004) despite the fact that
they all tested adaptation in menus and used similar heuristics to adapt menus, such as fre-
quency and recency of use. Yet, these variations are reasonable if we consider that each
study tested different techniques under very different conditions. For instance, Greenberg
and Witten (1985) tested adaptation on hierarchical rather than flat menus. It is possible that
personalization is more valuable when applied to hierarchical menus, as it reduces the need
for accessing items in high depths, which is a time consuming task. Besides, Greenberg and
Witten (1985) tested their adaptive interface after selection frequencies had been stabilized.
CHAPTER 2. RELATED WORK 35
Without having access to the actual data and the adaptation algorithm used in their experi-
ment, it is not possible to know how frequently the structure of the adaptive menus changed.
We can expect, though, that changes were not as rapid as they would be if learning had not
yet occurred. In addition, both the adaptive and static menus tested by Greenberg and Witten
(1985) were alphabetically sorted. As a result, the danger that a user would search for an
item in the wrong submenu was minimal. It is very likely that that the cost of disturbance
due to automatic restructuring of menus would be greater if menus were not alphabetically
sorted.
In contrast to the above study, the study conducted by Mitchell and Shneiderman
(1989) evaluated an adaptive interface that bore the worst attributes of adaptation. First,
learning was performed while participants interacted with the system. As participants had to
complete only 12 menu selection tasks per user interface, we can expect that any benefits
coming from adaptation would be minor. Besides, Mitchell and Shneiderman (1989) do not
report any information about the tested frequency patterns. Therefore, it is unclear whether
and to what extend frequency-based adaptation, which was tested by their study, was justi-
fied.
Similarly, the outcome of the study conducted by Findlater and McGrenere (2004) can
be better understood if we examine their experimental design in more detail. More specifi-
cally, the static menus tested by the study were optimally organized based on previous
knowledge of selection frequencies. According to the reported data, the items that appeared
in the top partition of the static split menus accounted for 720 out of 788 selections, i.e., ap-
proximately 91% of the time the static split menu provided correct suggestions. As adaptive
menus did not use any prior knowledge about selection frequencies and learning was in-
volved, this accuracy could have been lower than the accuracy of suggestions made by the
static menu. In other words, the static version could have been equally or even more “intelli-
gent” than the adaptive version of menus.
CHAPTER 2. RELATED WORK 36
The benefits of adaptive behaviour shown by Boyle and Encarnacion (1994) and Hook
(1997) are also non-conclusive. Boyle and Encarnacion (1994) do not provide any details
about the tasks given to participants. They also do not report on how accurately adaptation
had supported the given tasks. If tasks were carefully selected to promote the utility of adap-
tation, no safe conclusions can be made about the success of adaptive stretchtext in more
general contexts. Similarly, Hook (1997) explains that her study was designed so that “usu-
ally, the system adapted correctly to what the subjects were up to”. It is not known how the
adaptive system would perform if adaptive actions were less accurate.
3.6.3 Comparing Adaptation Techniques
Gajos et al. (2006) distanced themselves from previous approaches by comparing different
adaptation techniques applied to the same system rather than testing the viability of a par-
ticular adaptive user interface. More specifically, they conducted two experimental studies to
evaluate three adaptive interfaces applied to the toolbars of Microsoft Word: (1) a split inter-
face that added an additional toolbar, in which “hot”, e.g., frequently used, buttons were cop-
ied from other toolbars; (2) a moving interface in which hot buttons within hidden popup
panes were moved up to the main toolbar; and (3) a highlighting interface in which hot but-
tons were coloured in magenta. The above work addressed several methodological problems
found in previous studies discussed earlier. First, it controlled various factors that could im-
pact the effectiveness of an adaptation technique, such as the accuracy of adaptation. Sec-
ond, it attempted to quantify both costs and benefits of the tested adaptation techniques and
examined the impact of these costs and benefits on the overall acceptance of the evaluated
techniques.
The work documented in this dissertation has progressed in a similar direction. Gajos
et al. (2006) cite our published research (Tsandilas and schraefel, 2005) to justify their
evaluation approach.
37
Chapter 4
Combining Automation with User Control
This chapter explores adaptation techniques for adaptive hypermedia (AH) systems. Special
attention is given on the issue of user control. In particular, we introduce two Web-based
prototypes, through which we examine techniques that merge automation with direct ma-
nipulation. The first prototype makes use of information retrieval techniques to filter
hyperlinks on Web documents. Interaction is enhanced with techniques that allow users to
directly control the display of hyperlinks on a page and receive incremental feedback about
the outcome of their actions. The second prototype allows users to adapt the presentation of
Web content rather than the display of links. The prototype incorporates a new adaptation
technique, which has been influenced by fisheye views (Furnas, 1986). The new technique
allows for incremental adjustments in the adapted view of a page and integrates several
powerful control mechanisms. Two evaluation studies demonstrate strengths and limitations
of this approach. They also reveal challenges concerning the evaluation of adaptation tech-
niques, an issue explored in more detail in the next chapter.
CHAPTER 3. COMBINING AUTOMATION WITH USER CONTROL 38
The research presented in this chapter has been published in the 14th ACM Conference
of Hypertext and Hypermedia (Tsandilas and m. c. schraefel, 2003a), the AH2003 Workshop
on Adaptive Hypermedia and Adaptive Web-based Systems (Tsandilas and m.c. schraefel,
2003b), and the New Review of Hypermedia and Multimedia (Tsandilas and schraefel,
2004).
4.1 Motivation
As discussed in Chapter 2, in several AH systems (Cook and Kay, 1994; Czarkowski and
Kay, 2003), adaptation is based on direct user input rather than implicit feedback gathered
through the user’s interaction with the system. The scope of these systems has been limited,
since the parameters of adaptation that form the basis of user control have to be predefined
by the authors of the hypermedia system; not by the actual users with respect to their own
needs. For the same reason, the above approaches cannot easily generalize to regular Web
documents, as Web developers do not design Web sites with adaptation in mind.
To better understand the problem, consider the following three scenarios.
Scenario 1: “Alice, a new graduate student at the University of Toronto, looks for informa-
tion about housing, courses, and teaching assistantships in the university’s Web site. Al-
though the site contains a large number of links with relevant information, these links are
spread in different places and under a variety of different categories. Unfortunately, these
categories do not match closely her navigation goals. Information about housing can be
found under Colleges and Residences, Prospective Students, Student Services, and City In-
formation. Information about courses and teaching assistantships can be found under Pro-
spective Students, Programs, and so forth. Alice wants to be able to easily identify which
links are relevant to the topics of her interests. She also wants to be able to easily switch be-
tween these topics while she explores the Web site.”
CHAPTER 3. COMBINING AUTOMATION WITH USER CONTROL 39
Scenario 2: “Stephan frequently visits a Web site that contains a large list of recipes.
Stephan usually searches the site having in mind specific combinations of ingredients. He
would like to be able to easily recognize which recipes are vegetarian and which recipes
contain nuts, to which he is allergic. Unfortunately, recipes are organized either alphabeti-
cally or by country, and Stephan normally has to visit several links before finding an appro-
priate recipe.”
Scenario 3: “Mary visits several Web sites to find information about cultural events in To-
ronto. Mary is primarily interested in music events that are appropriate for kids. In the ma-
jority of the sites that she visits, events are posted in long pages and are organized by date.
As a result, finding entries that relate to her interests is time-consuming.”
Someone could argue that studying user needs before designing Web sites would
eliminate such problems. Unfortunately, this is a not a common practice; the majority of
Web sites have been designed without a prior careful examination of user needs. Further,
coming up with a design that satisfies all the users of a Web site can be difficult. Search
tools can help users complete tasks as the ones described in the above scenarios, but their
scope has been limited. They require users to solely depend on the success of their query
formulations, and search results are isolated from the global context of information.
WebWatcher (Joachims et al., 1997), on the other hand, allows users to give explicit input to
a hypertext system by entering keywords that represent their information needs. Then the
system automatically adapts pages, based on the occurrence of such keywords in the text of
the pages. Unfortunately, user information needs can change frequently as navigation
evolves over time, and in WebWatcher, switching between different personalization goals is
a cumbersome process. It requires the user to start a new session and reformulate his or her
goals by entering a new set of keywords; no reuse is supported.
Motivated by these problems, our work focused on the design of tools that combine the
strengths of both searching and browsing. Our goal was to allow users to formulate queries,
CHAPTER 3. COMBINING AUTOMATION WITH USER CONTROL 40
as they normally do with search tools, but as in WebWatcher, queries would be used to sup-
port adaptation rather than searching. Furthermore, we considered as a high priority the de-
sign of interaction mechanisms that do not interrupt the browsing task of users and allow
them to quickly refine their interests. We also aimed at adaptation techniques that do not dis-
turb the original structure of information. In order to reach these goals, we developed two
Web prototypes, presented in the following sections.
4.2 First Prototype
The first prototype addressed the problem of representation and reuse of user interests, in a
way that users can directly control adaptation. Our efforts concentrated on the representation
of reusable user interests with easy-to-use interface controllers like sliders. Sliders have been
traditionally used to filter well-structured data such information about movies stored in a da-
tabase (Ahlberg and Shneiderman, 1994). Our challenge was to generalize their use to hy-
permedia environments, where information is generally unstructured. Similarly to previous
work by Joachims et al. (1997), our work focused on adaptive link annotation. Specifically,
we examined how sliders could be used to incrementally control the annotation of links on
hypermedia pages with respect to reusable topics of user interest.
Figure 4.1 illustrates the user interface of the prototype. As shown in the figure, a
separate browser window is used to enhance interaction with a set of sliders. Each slider
represents a weighted topic of user interest. Users can dynamically add sliders by entering
sets of keywords and reuse them in future browsing sessions. As users interact with the
sliders, visual properties of the links on the visited pages are incrementally updated. In other
words, users are given direct feedback about the effect of their manipulations.
In the prototype shown in Figure 4.1, colour annotation is used: links pointing to pages
whose content is relevant to the current user interests become red, while links pointing to
pages whose content is not relevant to the user interests become blue. Hue variations be-
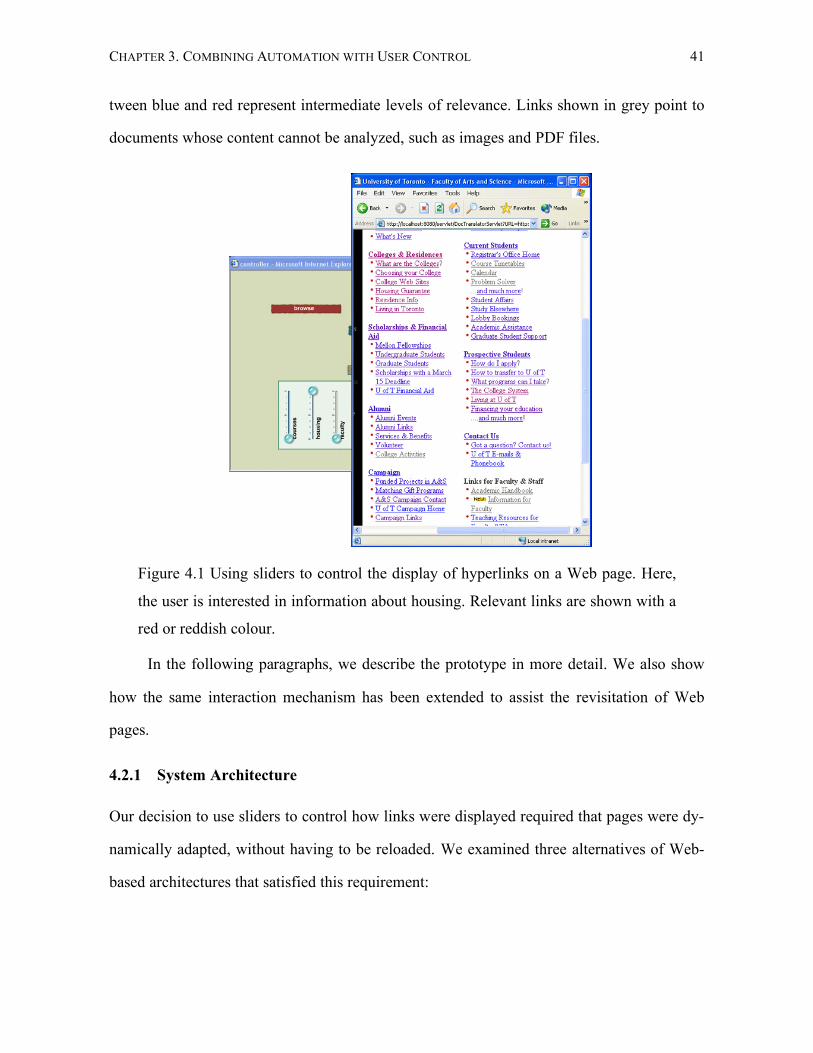
CHAPTER 3. COMBINING AUTOMATION WITH USER CONTROL 41
tween blue and red represent intermediate levels of relevance. Links shown in grey point to
documents whose content cannot be analyzed, such as images and PDF files.
Figure 4.1 Using sliders to control the display of hyperlinks on a Web page. Here,
the user is interested in information about housing. Relevant links are shown with a
red or reddish colour.
In the following paragraphs, we describe the prototype in more detail. We also show
how the same interaction mechanism has been extended to assist the revisitation of Web
pages.
4.2.1 System Architecture
Our decision to use sliders to control how links were displayed required that pages were dy-
namically adapted, without having to be reloaded. We examined three alternatives of Web-
based architectures that satisfied this requirement:
CHAPTER 3. COMBINING AUTOMATION WITH USER CONTROL 42
1. Extending Web browsers with additional functionality, e.g., by developing a new
plug-in that would enable users to directly control the visualization of Web pages.
2. Using a Web server to transform Web pages to adaptable pages that could be directly
controlled by users.
3. Using a proxy server as an intermediate component between clients and Web servers
to transform pages to adaptable pages.
The first approach is possibly the most elegant and most effective in terms of stability
and performance. Yet, it would require us to stick to a particular browser such as Mozilla
Firefox. Moreover, when we started this project in late 2002, there was only limited docu-
mentation and poor development tools for user interface extension languages like the XML
User-Interface Language (XUL) , which is commonly used today to extend the capabilities
of Firefox. The second and third alternatives are similar in concept. We opted for the second
one, because it is simpler in terms of implementation.
According to the selected alternative, the role of the server application is to analyze the
content of requested Web pages and transform them to adaptable pages. Adaptable pages are
pages whose HTML code has been enhanced with JavaScript code. The user interface
through which users control such adaptable pages was implemented in Macromedia Flash
MX and ActionScript. Finally, we decided to use the Java Servlet API (Sun) for server-side
programming, as it allows for platform-independent and easily extensible server applica-
tions.
Figure 4.2 illustrates how the different components of the system communicate. The
servlet resides at the server side and is responsible for handling page requests made by the
client, i.e., the Web browser. The servlet first extracts the URL of all the links in the re-
quested page. Then it retrieves the content of the destination page pointed to by each link.
This content is analyzed and compared with descriptions of user interests. The servlet also
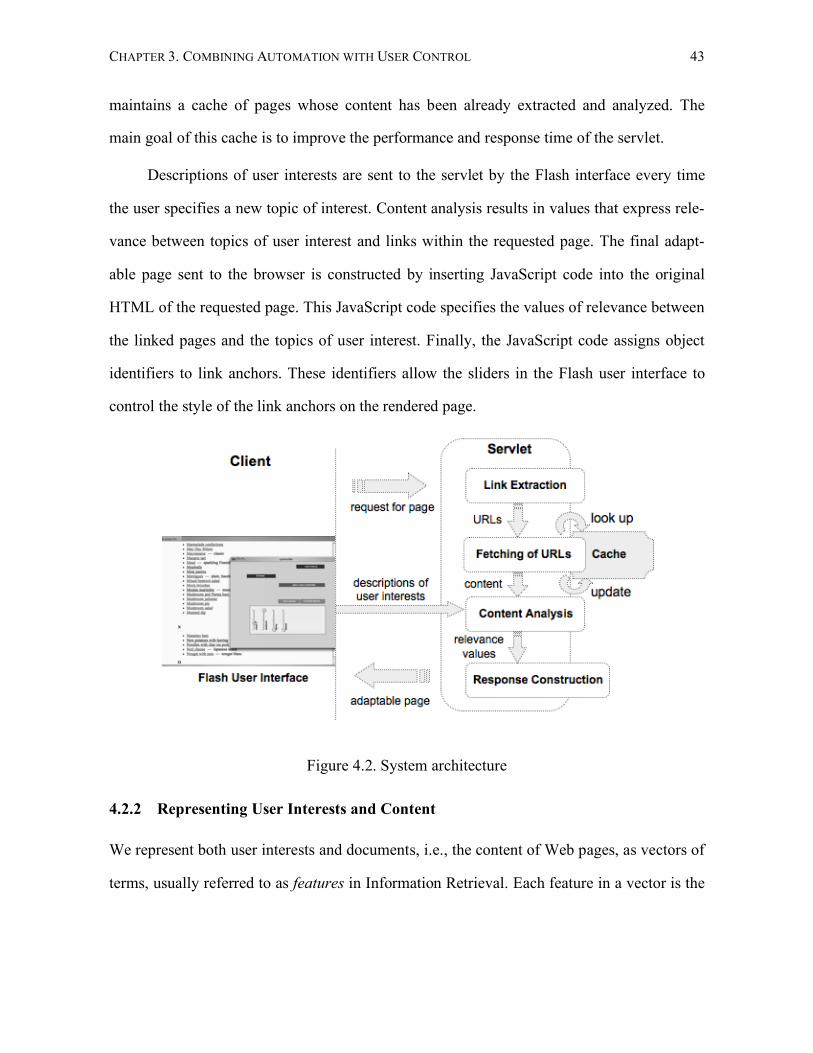
CHAPTER 3. COMBINING AUTOMATION WITH USER CONTROL 43
maintains a cache of pages whose content has been already extracted and analyzed. The
main goal of this cache is to improve the performance and response time of the servlet.
Descriptions of user interests are sent to the servlet by the Flash interface every time
the user specifies a new topic of interest. Content analysis results in values that express rele-
vance between topics of user interest and links within the requested page. The final adapt-
able page sent to the browser is constructed by inserting JavaScript code into the original
HTML of the requested page. This JavaScript code specifies the values of relevance between
the linked pages and the topics of user interest. Finally, the JavaScript code assigns object
identifiers to link anchors. These identifiers allow the sliders in the Flash user interface to
control the style of the link anchors on the rendered page.
Figure 4.2. System architecture
4.2.2 Representing User Interests and Content
We represent both user interests and documents, i.e., the content of Web pages, as vectors of
terms, usually referred to as features in Information Retrieval. Each feature in a vector is the
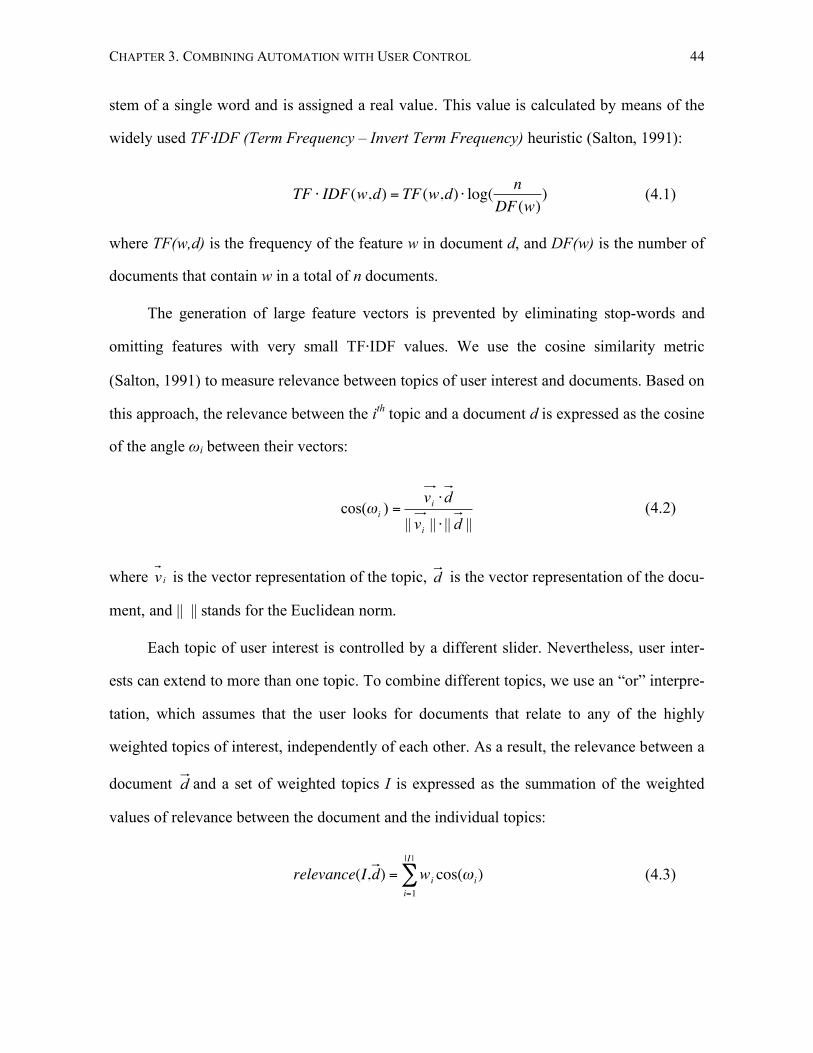
CHAPTER 3. COMBINING AUTOMATION WITH USER CONTROL 44
stem of a single word and is assigned a real value. This value is calculated by means of the
widely used TF⋅IDF (Term Frequency – Invert Term Frequency) heuristic (Salton, 1991):
!
TF " IDF(w,d) = TF(w,d) " log(n
DF(w)) (4.1)
where TF(w,d) is the frequency of the feature w in document d, and DF(w) is the number of
documents that contain w in a total of n documents.
The generation of large feature vectors is prevented by eliminating stop-words and
omitting features with very small TF⋅IDF values. We use the cosine similarity metric
(Salton, 1991) to measure relevance between topics of user interest and documents. Based on
this approach, the relevance between the ith topic and a document d is expressed as the cosine
of the angle ωi between their vectors:
||||||||)cos(
dv
dv
i
i
i
!
!=" (4.2)
where iv is the vector representation of the topic, d is the vector representation of the docu-
ment, and || || stands for the Euclidean norm.
Each topic of user interest is controlled by a different slider. Nevertheless, user inter-
ests can extend to more than one topic. To combine different topics, we use an “or” interpre-
tation, which assumes that the user looks for documents that relate to any of the highly
weighted topics of interest, independently of each other. As a result, the relevance between a
document d and a set of weighted topics I is expressed as the summation of the weighted
values of relevance between the document and the individual topics:
!
relevance(I,d) = wicos("
i)
i=1
|I |
# (4.3)
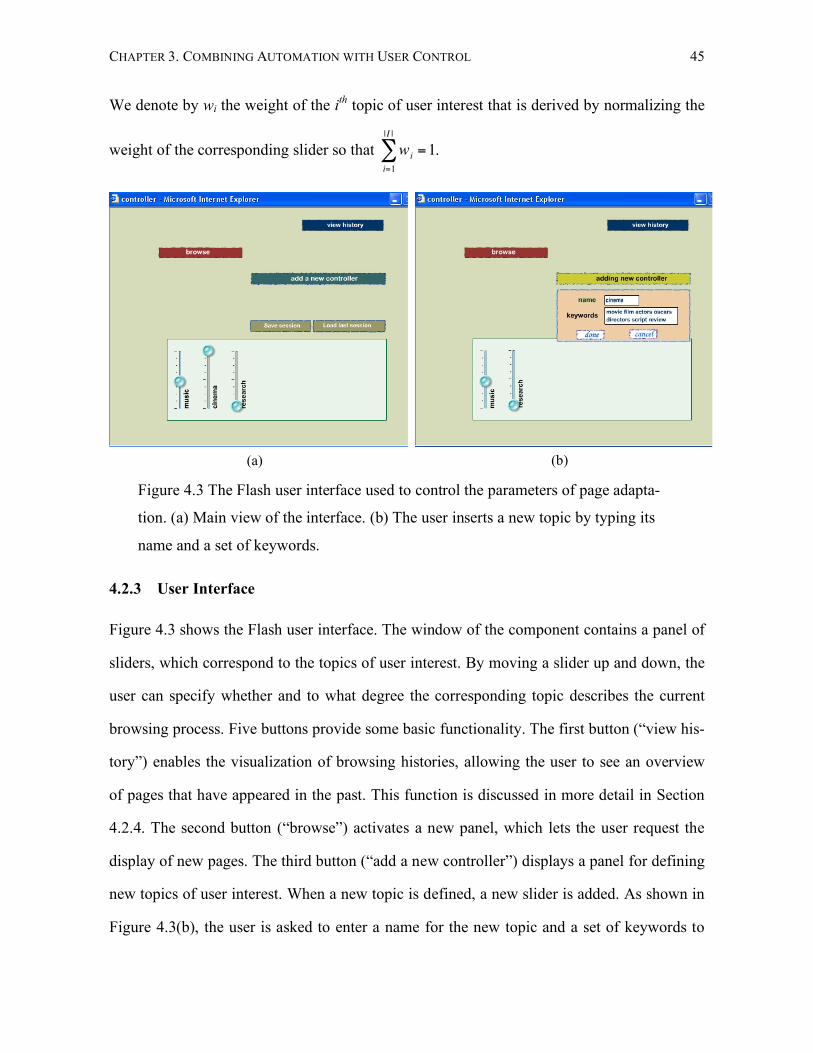
CHAPTER 3. COMBINING AUTOMATION WITH USER CONTROL 45
We denote by wi the weight of the ith topic of user interest that is derived by normalizing the
weight of the corresponding slider so that
!
wi
i=1
|I |
" =1.
(a)
(b)
Figure 4.3 The Flash user interface used to control the parameters of page adapta-
tion. (a) Main view of the interface. (b) The user inserts a new topic by typing its
name and a set of keywords.
4.2.3 User Interface
Figure 4.3 shows the Flash user interface. The window of the component contains a panel of
sliders, which correspond to the topics of user interest. By moving a slider up and down, the
user can specify whether and to what degree the corresponding topic describes the current
browsing process. Five buttons provide some basic functionality. The first button (“view his-
tory”) enables the visualization of browsing histories, allowing the user to see an overview
of pages that have appeared in the past. This function is discussed in more detail in Section
4.2.4. The second button (“browse”) activates a new panel, which lets the user request the
display of new pages. The third button (“add a new controller”) displays a panel for defining
new topics of user interest. When a new topic is defined, a new slider is added. As shown in
Figure 4.3(b), the user is asked to enter a name for the new topic and a set of keywords to
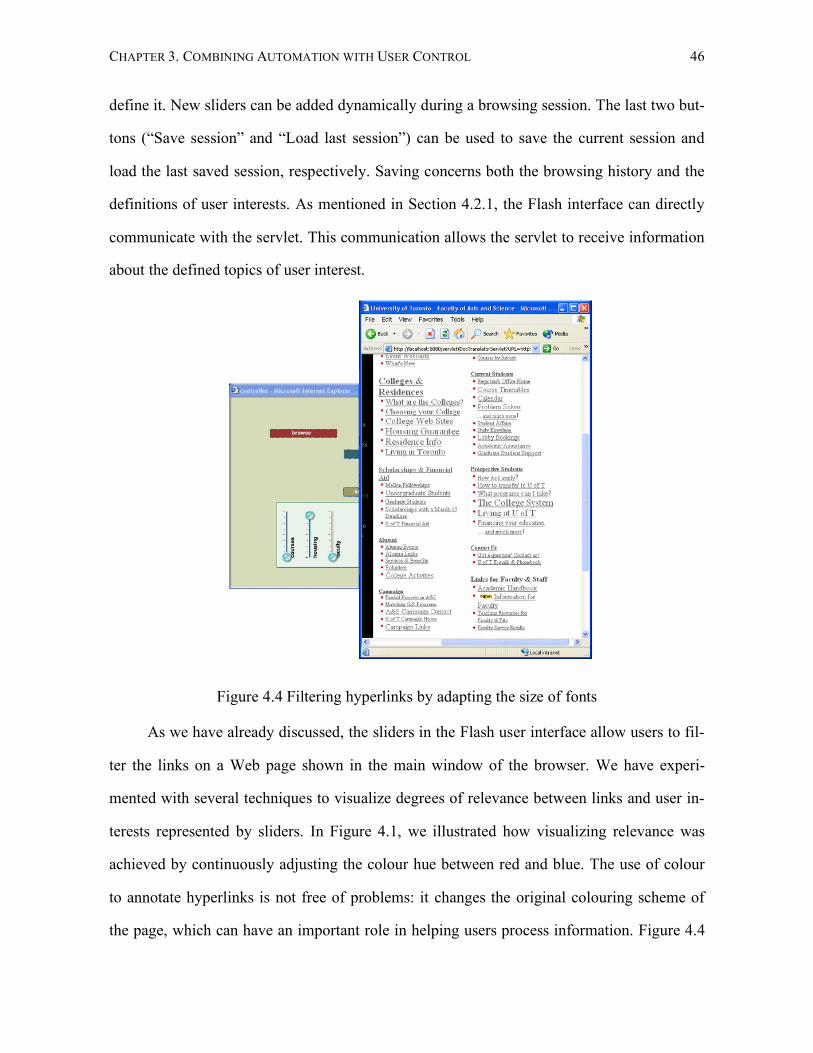
CHAPTER 3. COMBINING AUTOMATION WITH USER CONTROL 46
define it. New sliders can be added dynamically during a browsing session. The last two but-
tons (“Save session” and “Load last session”) can be used to save the current session and
load the last saved session, respectively. Saving concerns both the browsing history and the
definitions of user interests. As mentioned in Section 4.2.1, the Flash interface can directly
communicate with the servlet. This communication allows the servlet to receive information
about the defined topics of user interest.
Figure 4.4 Filtering hyperlinks by adapting the size of fonts
As we have already discussed, the sliders in the Flash user interface allow users to fil-
ter the links on a Web page shown in the main window of the browser. We have experi-
mented with several techniques to visualize degrees of relevance between links and user in-
terests represented by sliders. In Figure 4.1, we illustrated how visualizing relevance was
achieved by continuously adjusting the colour hue between red and blue. The use of colour
to annotate hyperlinks is not free of problems: it changes the original colouring scheme of
the page, which can have an important role in helping users process information. Figure 4.4
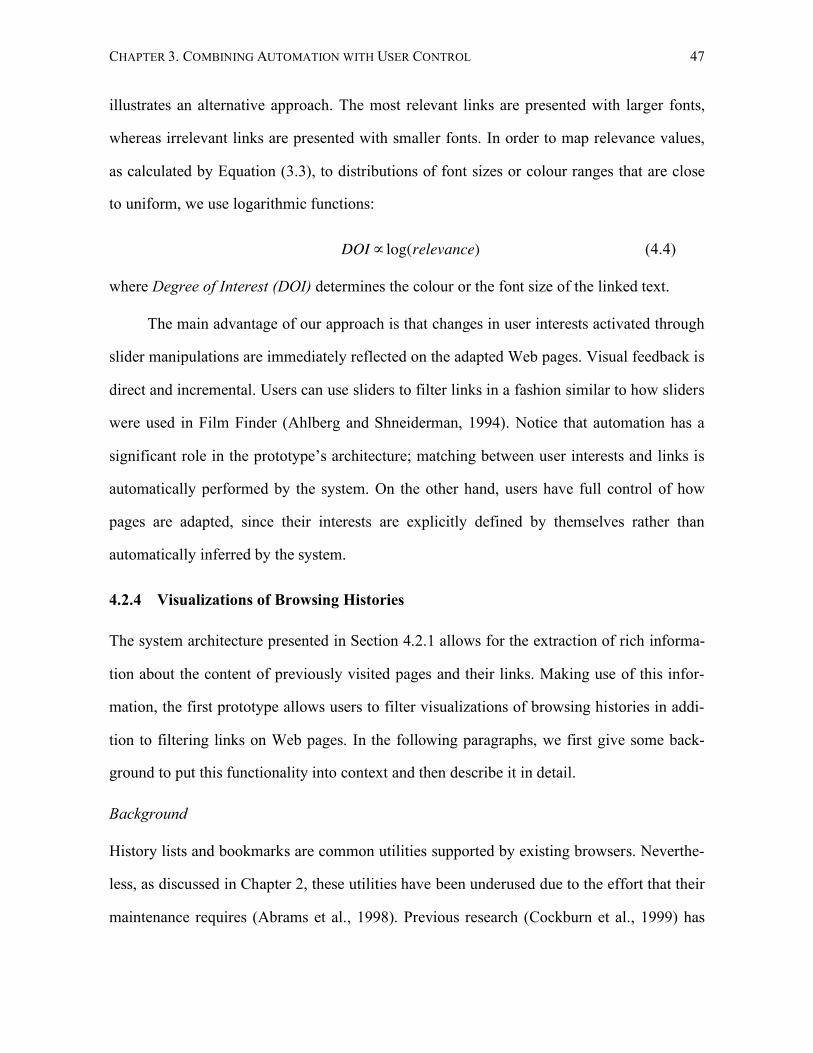
CHAPTER 3. COMBINING AUTOMATION WITH USER CONTROL 47
illustrates an alternative approach. The most relevant links are presented with larger fonts,
whereas irrelevant links are presented with smaller fonts. In order to map relevance values,
as calculated by Equation (3.3), to distributions of font sizes or colour ranges that are close
to uniform, we use logarithmic functions:
!
DOI" log(relevance) (4.4)
where Degree of Interest (DOI) determines the colour or the font size of the linked text.
The main advantage of our approach is that changes in user interests activated through
slider manipulations are immediately reflected on the adapted Web pages. Visual feedback is
direct and incremental. Users can use sliders to filter links in a fashion similar to how sliders
were used in Film Finder (Ahlberg and Shneiderman, 1994). Notice that automation has a
significant role in the prototype’s architecture; matching between user interests and links is
automatically performed by the system. On the other hand, users have full control of how
pages are adapted, since their interests are explicitly defined by themselves rather than
automatically inferred by the system.
4.2.4 Visualizations of Browsing Histories
The system architecture presented in Section 4.2.1 allows for the extraction of rich informa-
tion about the content of previously visited pages and their links. Making use of this infor-
mation, the first prototype allows users to filter visualizations of browsing histories in addi-
tion to filtering links on Web pages. In the following paragraphs, we first give some back-
ground to put this functionality into context and then describe it in detail.
Background
History lists and bookmarks are common utilities supported by existing browsers. Neverthe-
less, as discussed in Chapter 2, these utilities have been underused due to the effort that their
maintenance requires (Abrams et al., 1998). Previous research (Cockburn et al., 1999) has
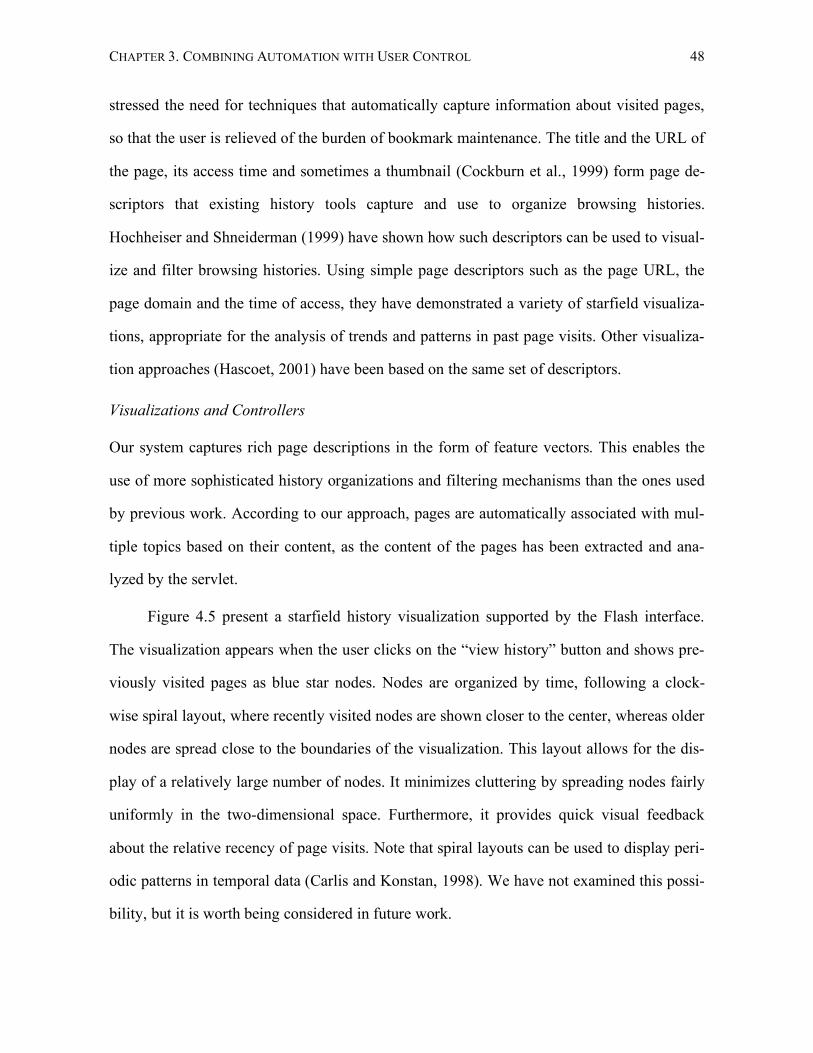
CHAPTER 3. COMBINING AUTOMATION WITH USER CONTROL 48
stressed the need for techniques that automatically capture information about visited pages,
so that the user is relieved of the burden of bookmark maintenance. The title and the URL of
the page, its access time and sometimes a thumbnail (Cockburn et al., 1999) form page de-
scriptors that existing history tools capture and use to organize browsing histories.
Hochheiser and Shneiderman (1999) have shown how such descriptors can be used to visual-
ize and filter browsing histories. Using simple page descriptors such as the page URL, the
page domain and the time of access, they have demonstrated a variety of starfield visualiza-
tions, appropriate for the analysis of trends and patterns in past page visits. Other visualiza-
tion approaches (Hascoet, 2001) have been based on the same set of descriptors.
Visualizations and Controllers
Our system captures rich page descriptions in the form of feature vectors. This enables the
use of more sophisticated history organizations and filtering mechanisms than the ones used
by previous work. According to our approach, pages are automatically associated with mul-
tiple topics based on their content, as the content of the pages has been extracted and ana-
lyzed by the servlet.
Figure 4.5 present a starfield history visualization supported by the Flash interface.
The visualization appears when the user clicks on the “view history” button and shows pre-
viously visited pages as blue star nodes. Nodes are organized by time, following a clock-
wise spiral layout, where recently visited nodes are shown closer to the center, whereas older
nodes are spread close to the boundaries of the visualization. This layout allows for the dis-
play of a relatively large number of nodes. It minimizes cluttering by spreading nodes fairly
uniformly in the two-dimensional space. Furthermore, it provides quick visual feedback
about the relative recency of page visits. Note that spiral layouts can be used to display peri-
odic patterns in temporal data (Carlis and Konstan, 1998). We have not examined this possi-
bility, but it is worth being considered in future work.
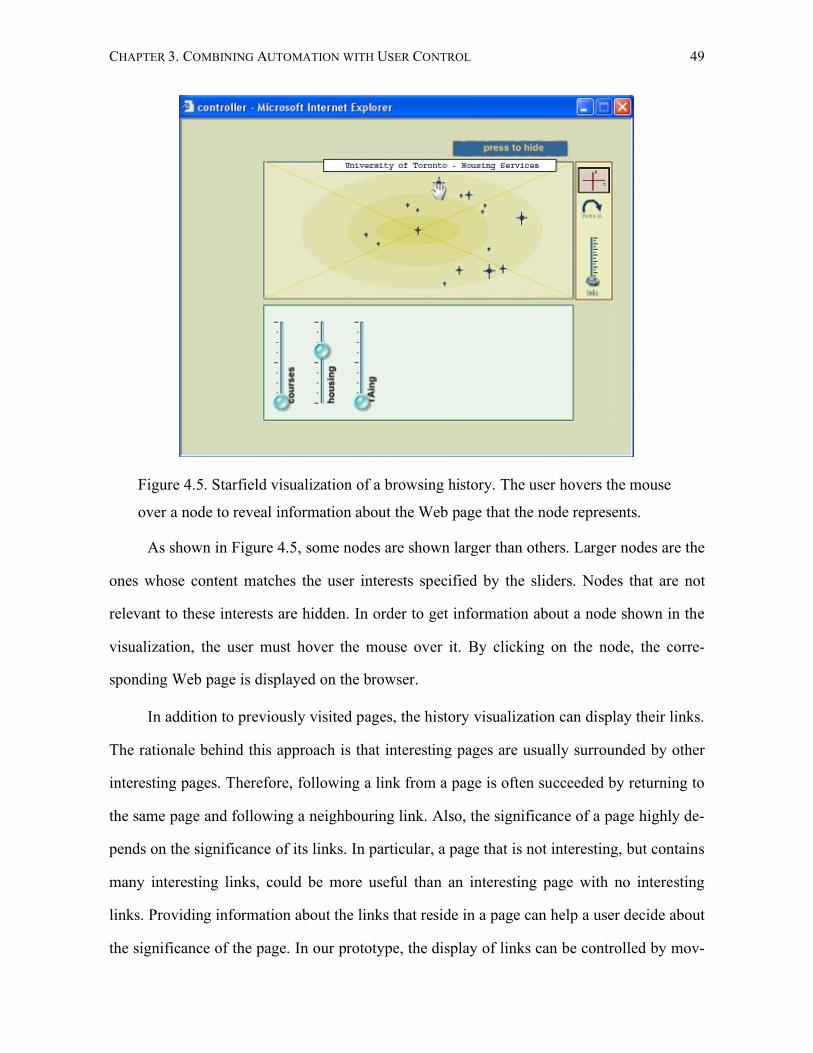
CHAPTER 3. COMBINING AUTOMATION WITH USER CONTROL 49
Figure 4.5. Starfield visualization of a browsing history. The user hovers the mouse
over a node to reveal information about the Web page that the node represents.
As shown in Figure 4.5, some nodes are shown larger than others. Larger nodes are the
ones whose content matches the user interests specified by the sliders. Nodes that are not
relevant to these interests are hidden. In order to get information about a node shown in the
visualization, the user must hover the mouse over it. By clicking on the node, the corre-
sponding Web page is displayed on the browser.
In addition to previously visited pages, the history visualization can display their links.
The rationale behind this approach is that interesting pages are usually surrounded by other
interesting pages. Therefore, following a link from a page is often succeeded by returning to
the same page and following a neighbouring link. Also, the significance of a page highly de-
pends on the significance of its links. In particular, a page that is not interesting, but contains
many interesting links, could be more useful than an interesting page with no interesting
links. Providing information about the links that reside in a page can help a user decide about
the significance of the page. In our prototype, the display of links can be controlled by mov-
CHAPTER 3. COMBINING AUTOMATION WITH USER CONTROL 50
ing the slider included in a control panel at the right of the visualization. Low slider values
allow only the most relevant links to be shown. As Figure 4.6 illustrates, links are repre-
sented by red dots around the star nodes. As with star nodes, their size is analogous to their
relevance to the specified user interests.
Figure 4.6. Showing links of pages in the history
Figure 4.7. Alternative view organizing nodes by topic and time
Figure 4.7 demonstrates an alternative view, which organizes previously visited pages
and their links in two dimensions: (1) the time the page was last visited, and (2) the topic that
is most relevant to the page. Each column in the visualization area corresponds to a single
visit of a page. Columns at the left part of the visualization correspond to the most recent
visits. Each row corresponds to a different topic of user interest. There is an additional row
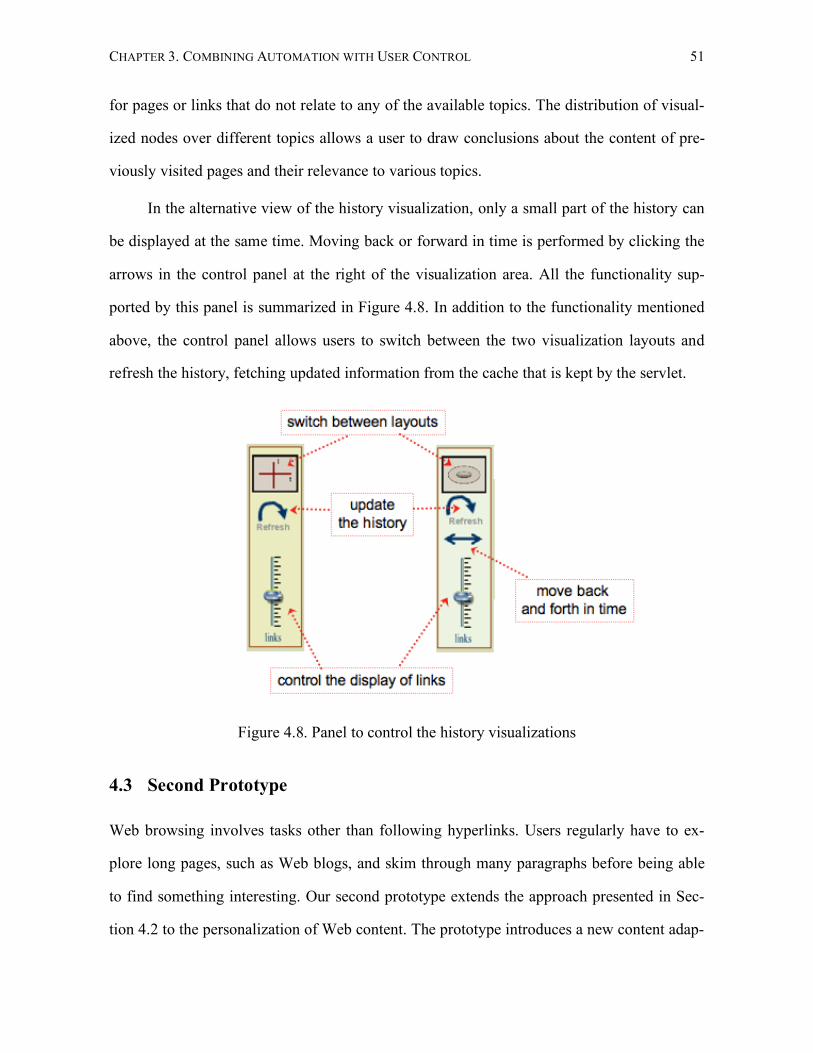
CHAPTER 3. COMBINING AUTOMATION WITH USER CONTROL 51
for pages or links that do not relate to any of the available topics. The distribution of visual-
ized nodes over different topics allows a user to draw conclusions about the content of pre-
viously visited pages and their relevance to various topics.
In the alternative view of the history visualization, only a small part of the history can
be displayed at the same time. Moving back or forward in time is performed by clicking the
arrows in the control panel at the right of the visualization area. All the functionality sup-
ported by this panel is summarized in Figure 4.8. In addition to the functionality mentioned
above, the control panel allows users to switch between the two visualization layouts and
refresh the history, fetching updated information from the cache that is kept by the servlet.
Figure 4.8. Panel to control the history visualizations
4.3 Second Prototype
Web browsing involves tasks other than following hyperlinks. Users regularly have to ex-
plore long pages, such as Web blogs, and skim through many paragraphs before being able
to find something interesting. Our second prototype extends the approach presented in Sec-
tion 4.2 to the personalization of Web content. The prototype introduces a new content adap-
CHAPTER 3. COMBINING AUTOMATION WITH USER CONTROL 52
tation technique. The new technique filters in/out Web information by adjusting the scale of
its visual properties. The technique is aimed at helping users focus on information that sup-
ports their current information needs, while preserving context about surrounding informa-
tion. The prototype integrates mechanisms that allow users to fluidly switch between differ-
ent views of a Web page.
As we wanted to concentrate on interaction issues and avoid dealing with information
retrieval and classification problems, we simplified the system architecture by assuming that
topics of user interest have been predefined. However, the addition of a mechanism through
which user could specify topics of user interest is possible, simply based on the system ar-
chitecture described in Section 4.2. We do further discuss this issue here.
4.3.1 Focus, Context and Fisheye Views
Supporting context and focus has been the goal of several techniques in HCI research. Most
of these techniques are based on fisheye views (Furnas, 1986). Fisheye views provide both
local detail and global context in a single display. They have been applied to visualize in-
formation in several domains.
Furnas (1986) applied fisheye views to program code, tree structures and calendars.
Fisheye techniques were used by Sarkar and Brown (1992) to support viewing and browsing
graphs. Bederson (2000) applied fisheye zooming to pull-down menus with the goal to re-
duce the cognitive load caused by long lists of choices. Greenberg et al. (1996) introduced
fisheye views to support group awareness when multiple people work on the same docu-
ment. Fisheye views were used by Janecek and Pu (2002) to visualize semantic relationships
within tabular data. Fisheye views have also been applied to hypertext applications. For in-
stance, Noik (1993) introduced fisheye-like visualizations of large hypertext networks.
Bederson et al. (1998) introduced the Multi-Scale Markup Language (MSML), a markup
CHAPTER 3. COMBINING AUTOMATION WITH USER CONTROL 53
language implemented using the HTML <Meta> tag, to enable multiple levels of scaling
within Web pages. Finally, Holmquist (1997) developed fisheye views of page collections.
Fisheye-view techniques define a Degree of Interest (DOI) function that specifies how
the elements of the visualized information are presented. The actual definition of the DOI
function is application dependent. Different approaches use different techniques to visualize
information with respect to a DOI function. Noik (1993) classifies fisheye-view approaches
into two main categories: filtering and distorting fisheye views. Approaches that belong to
the first category use thresholds to constrain the display of information to relevant or inter-
esting elements. Approaches that belong to the second category apply geometrical distortion
to the visualization. Distortion is usually performed by altering the position and size of the
visualized elements. Fisheye-view techniques assume that there is a focal point, and the
value of the DOI function decreases with distance to this point. Several fisheye approaches
(Greenberg et al., 1996; Sarkar and Brown, 1992) support multiple focal points at the same
time.
4.3.2 Fisheye-Like Content Adaptation
Here, we explain how fisheye views can be used for content adaptation. Limiting our atten-
tion to information exploration tasks, we assume that a user model captures the current inter-
ests of the user. In this context, the DOI function can be expressed as the relevance between
the user interests and the individual pieces of information on visited hypermedia pages. Each
page is assumed to be segmented into smaller fragments such as sections or paragraphs. Un-
der this assumption, the DOI value for a fragment f, given that I is the set of the current user
interests, is as follows:
!
DOI( f | I) = relevance( f ,I) (4.5)
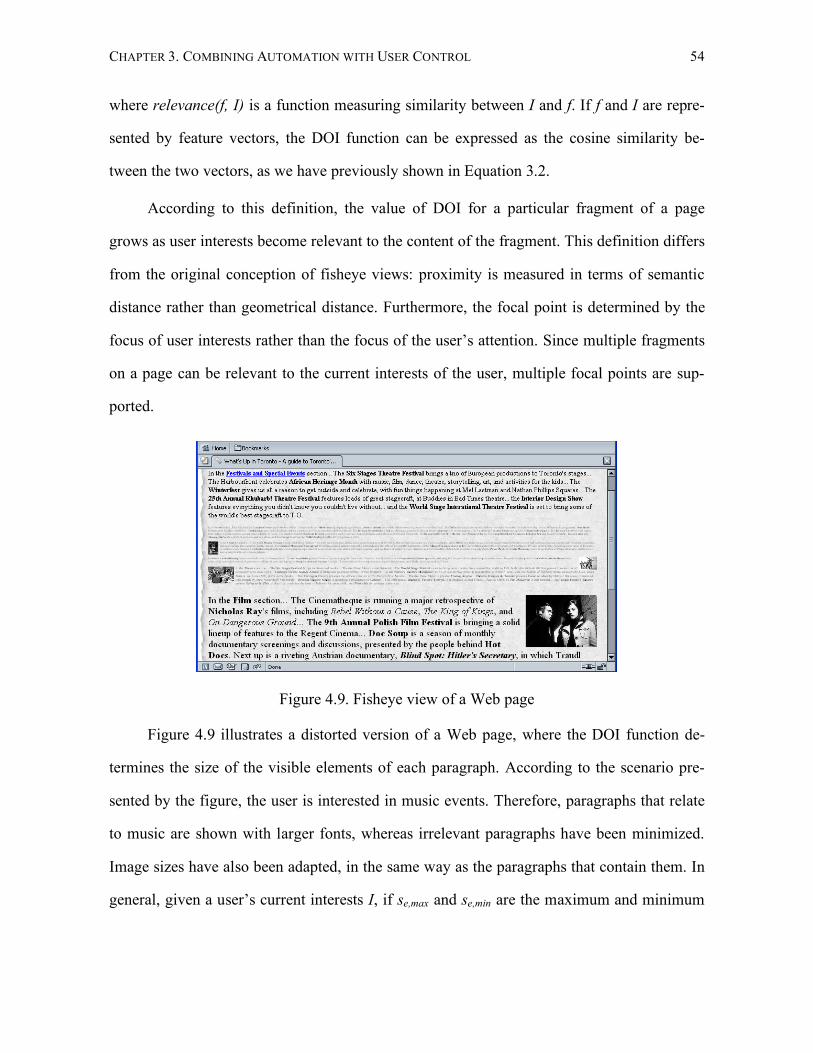
CHAPTER 3. COMBINING AUTOMATION WITH USER CONTROL 54
where relevance(f, I) is a function measuring similarity between Ι and f. If f and I are repre-
sented by feature vectors, the DOI function can be expressed as the cosine similarity be-
tween the two vectors, as we have previously shown in Equation 3.2.
According to this definition, the value of DOI for a particular fragment of a page
grows as user interests become relevant to the content of the fragment. This definition differs
from the original conception of fisheye views: proximity is measured in terms of semantic
distance rather than geometrical distance. Furthermore, the focal point is determined by the
focus of user interests rather than the focus of the user’s attention. Since multiple fragments
on a page can be relevant to the current interests of the user, multiple focal points are sup-
ported.
Figure 4.9. Fisheye view of a Web page
Figure 4.9 illustrates a distorted version of a Web page, where the DOI function de-
termines the size of the visible elements of each paragraph. According to the scenario pre-
sented by the figure, the user is interested in music events. Therefore, paragraphs that relate
to music are shown with larger fonts, whereas irrelevant paragraphs have been minimized.
Image sizes have also been adapted, in the same way as the paragraphs that contain them. In
general, given a user’s current interests I, if se,max and se,min are the maximum and minimum
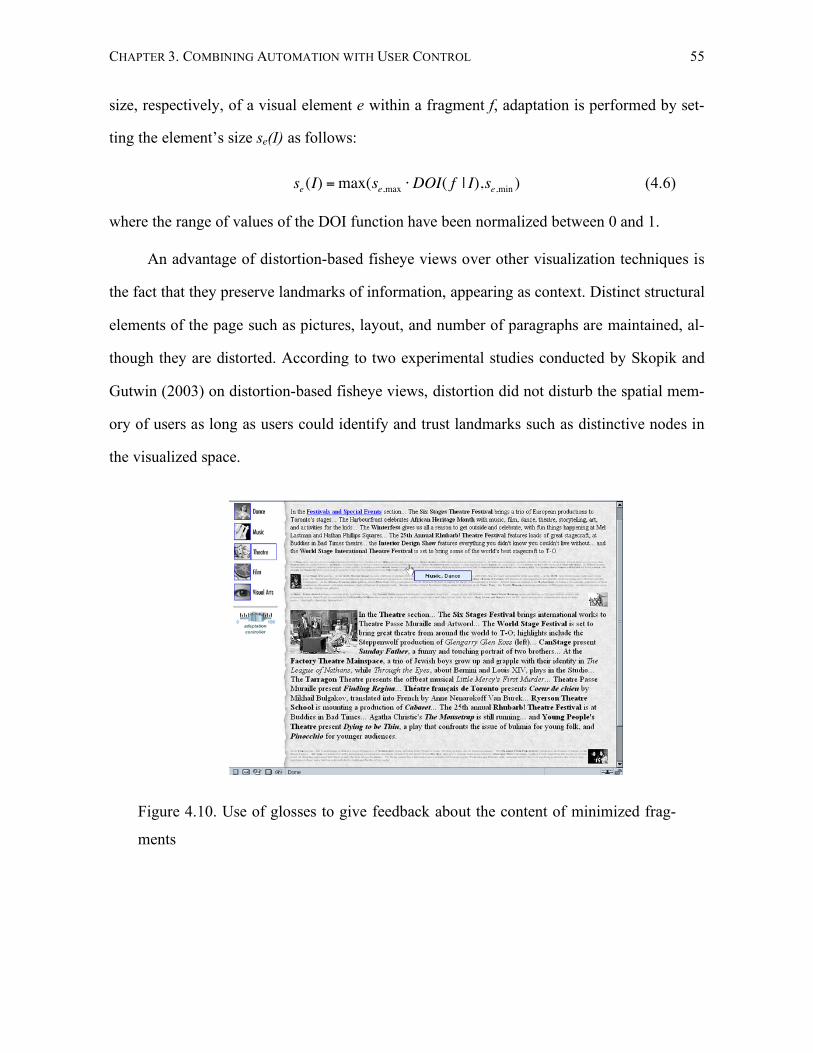
CHAPTER 3. COMBINING AUTOMATION WITH USER CONTROL 55
size, respectively, of a visual element e within a fragment f, adaptation is performed by set-
ting the element’s size se(I) as follows:
!
se (I) =max(se,max "DOI( f | I),se,min ) (4.6)
where the range of values of the DOI function have been normalized between 0 and 1.
An advantage of distortion-based fisheye views over other visualization techniques is
the fact that they preserve landmarks of information, appearing as context. Distinct structural
elements of the page such as pictures, layout, and number of paragraphs are maintained, al-
though they are distorted. According to two experimental studies conducted by Skopik and
Gutwin (2003) on distortion-based fisheye views, distortion did not disturb the spatial mem-
ory of users as long as users could identify and trust landmarks such as distinctive nodes in
the visualized space.
Figure 4.10. Use of glosses to give feedback about the content of minimized frag-
ments
CHAPTER 3. COMBINING AUTOMATION WITH USER CONTROL 56
4.3.3 Interactions
Although the fisheye-like adaptation technique preserves information about fragments that
are out of the focus of user interests, the actual content of minimized fragments becomes il-
legible. To give users access to the content of minimized paragraphs, we enhanced the tech-
nique with a set of interaction mechanisms that increase user control over the adapted views
of a page. Figure 4.10 presents a simple mechanism that we used, the use of popup glosses.
Glosses are text boxes that provide hints about the content of a paragraph when the user
hovers the mouse over its boundaries. In addition to the use of glosses, we allowed for fluid
transitions of individual paragraphs between context and focus. The mechanism that we de-
veloped to enable such transitions resembles Fluid Links (Zellweger et al., 1998). It works as
follows. By double-clicking on a paragraph that is out of focus, the user zooms in the text of
this paragraph together with its images. Animation is used to smoothly change the scale of
the paragraph. If the user double-clicks again, the paragraph is zoomed out to its initial size.
Notice that this mechanism activates a local rather than a global shift in focus. The global
adaptation of the page is not affected when a paragraph is double-clicked. In other words,
temporary changes in the user’s attention are not translated into switches of his/her interests.
The left portion of the page shown in Figure 4.10 contains widgets that give the user
additional control over adaptation. More specifically, it contains a menu with icons and titles
that represent stereotypes of user interests. The menu illustrates the current focus of naviga-
tion on which adaptation at the right part of the page is based. It also lets the user change the
current focus by selecting a different icon. The left part of the page also contains a slider,
which adjusts the level of context by setting the minimum size se,min of the visual elements.
When the value of the slider is zero, adaptation has no effect on the appearance of the pages.
When the value of the slider is maximum, non-relevant fragments are hidden, which means
that no context is provided. In other words, the slider allows users to zoom in (or zoom out)
to more (or less) adaptive versions of a page.
CHAPTER 3. COMBINING AUTOMATION WITH USER CONTROL 57
4.3.4 Making the User Model Transparent
Representing User Interests
As discussed earlier, user interests can be represented as feature vectors, where each element
in a vector is weighted according to its relevance to the interests of the user. Here, we as-
sume that a vector of user interests can be expressed as a linear combination of a set of
stereotyped user interests. Given n stereotypes, the vector tu of user interests at time t is cal-
culated as follows:
!
ut = wi,tv i
i=1
n
" (4.7)
where ivr is the vector of the ith stereotype, and wi,t is a weight that shows how relevant to the
current user interests this stereotype is. The weights are normalized so that:
!
wi,t
=1i=1
n
" (4.8)
The above representation allows for the decomposition of a user model into elements that
can be easily visualized, comprehended, and controlled by users.
Visualizing User Interests
The behaviour of an adaptive hypermedia system can be the outcome of several user actions,
and the way that these actions can be interpreted by the system is not always unique. There-
fore, if the system does not provide enough feedback to its users about how their actions are
interpreted, eventually, users will fail to understand the response of the system.
To investigate this problem, we assumed that pages could be adapted automatically
while users interacted with our second prototype. Given this assumption, we implemented a
solution that is based on our representation of user interests, as presented earlier. More spe-
cifically, we enhanced pages with simple visual representations of the vectors of the stereo-
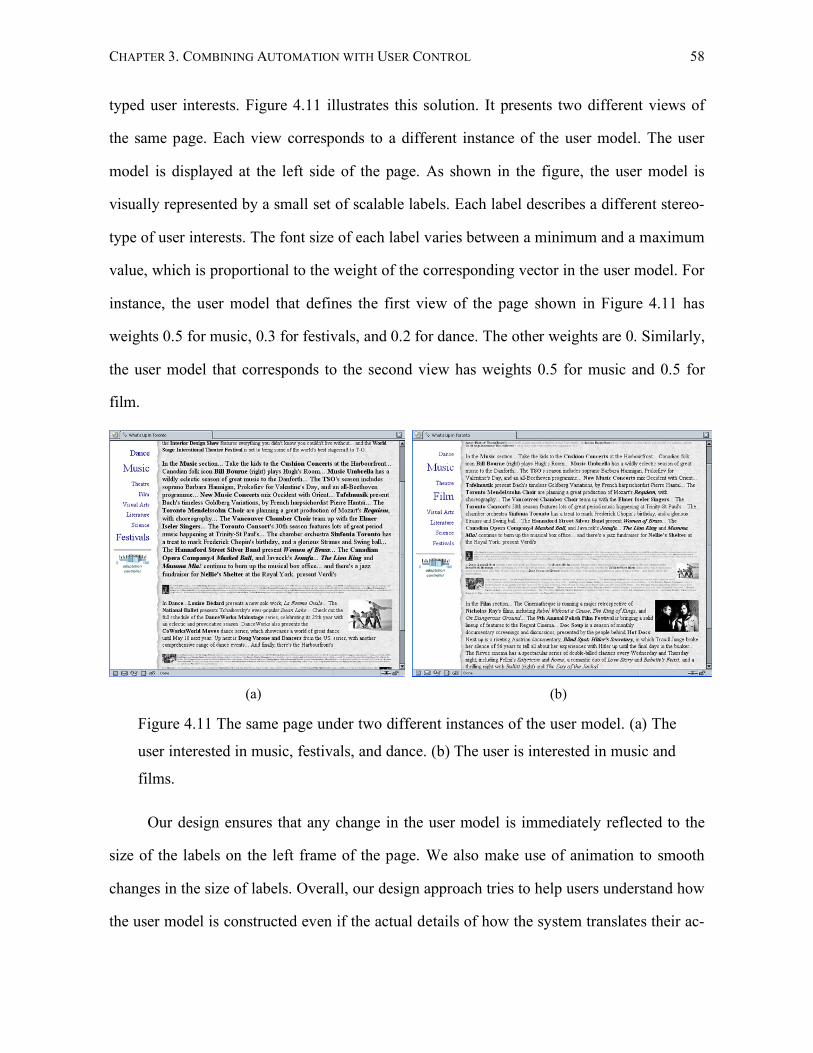
CHAPTER 3. COMBINING AUTOMATION WITH USER CONTROL 58
typed user interests. Figure 4.11 illustrates this solution. It presents two different views of
the same page. Each view corresponds to a different instance of the user model. The user
model is displayed at the left side of the page. As shown in the figure, the user model is
visually represented by a small set of scalable labels. Each label describes a different stereo-
type of user interests. The font size of each label varies between a minimum and a maximum
value, which is proportional to the weight of the corresponding vector in the user model. For
instance, the user model that defines the first view of the page shown in Figure 4.11 has
weights 0.5 for music, 0.3 for festivals, and 0.2 for dance. The other weights are 0. Similarly,
the user model that corresponds to the second view has weights 0.5 for music and 0.5 for
film.
(a)
(b)
Figure 4.11 The same page under two different instances of the user model. (a) The
user interested in music, festivals, and dance. (b) The user is interested in music and
films.
Our design ensures that any change in the user model is immediately reflected to the
size of the labels on the left frame of the page. We also make use of animation to smooth
changes in the size of labels. Overall, our design approach tries to help users understand how
the user model is constructed even if the actual details of how the system translates their ac-
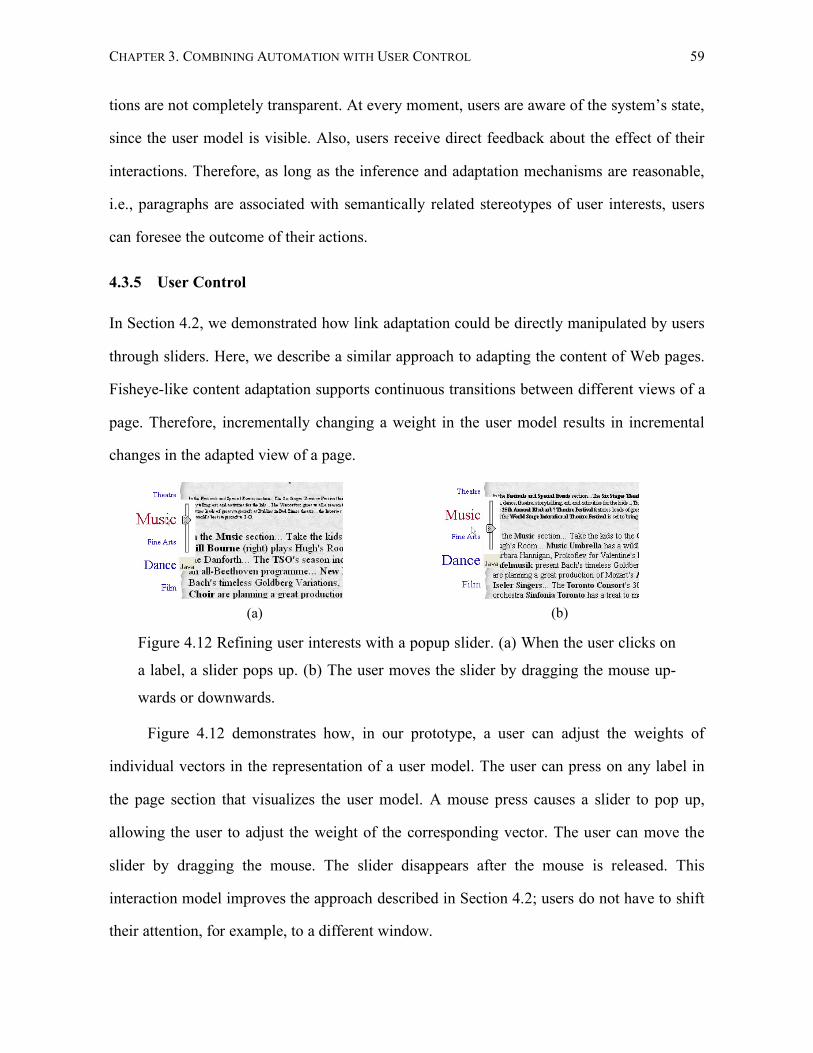
CHAPTER 3. COMBINING AUTOMATION WITH USER CONTROL 59
tions are not completely transparent. At every moment, users are aware of the system’s state,
since the user model is visible. Also, users receive direct feedback about the effect of their
interactions. Therefore, as long as the inference and adaptation mechanisms are reasonable,
i.e., paragraphs are associated with semantically related stereotypes of user interests, users
can foresee the outcome of their actions.
4.3.5 User Control
In Section 4.2, we demonstrated how link adaptation could be directly manipulated by users
through sliders. Here, we describe a similar approach to adapting the content of Web pages.
Fisheye-like content adaptation supports continuous transitions between different views of a
page. Therefore, incrementally changing a weight in the user model results in incremental
changes in the adapted view of a page.
(a)
(b)
Figure 4.12 Refining user interests with a popup slider. (a) When the user clicks on
a label, a slider pops up. (b) The user moves the slider by dragging the mouse up-
wards or downwards.
Figure 4.12 demonstrates how, in our prototype, a user can adjust the weights of
individual vectors in the representation of a user model. The user can press on any label in
the page section that visualizes the user model. A mouse press causes a slider to pop up,
allowing the user to adjust the weight of the corresponding vector. The user can move the
slider by dragging the mouse. The slider disappears after the mouse is released. This
interaction model improves the approach described in Section 4.2; users do not have to shift
their attention, for example, to a different window.
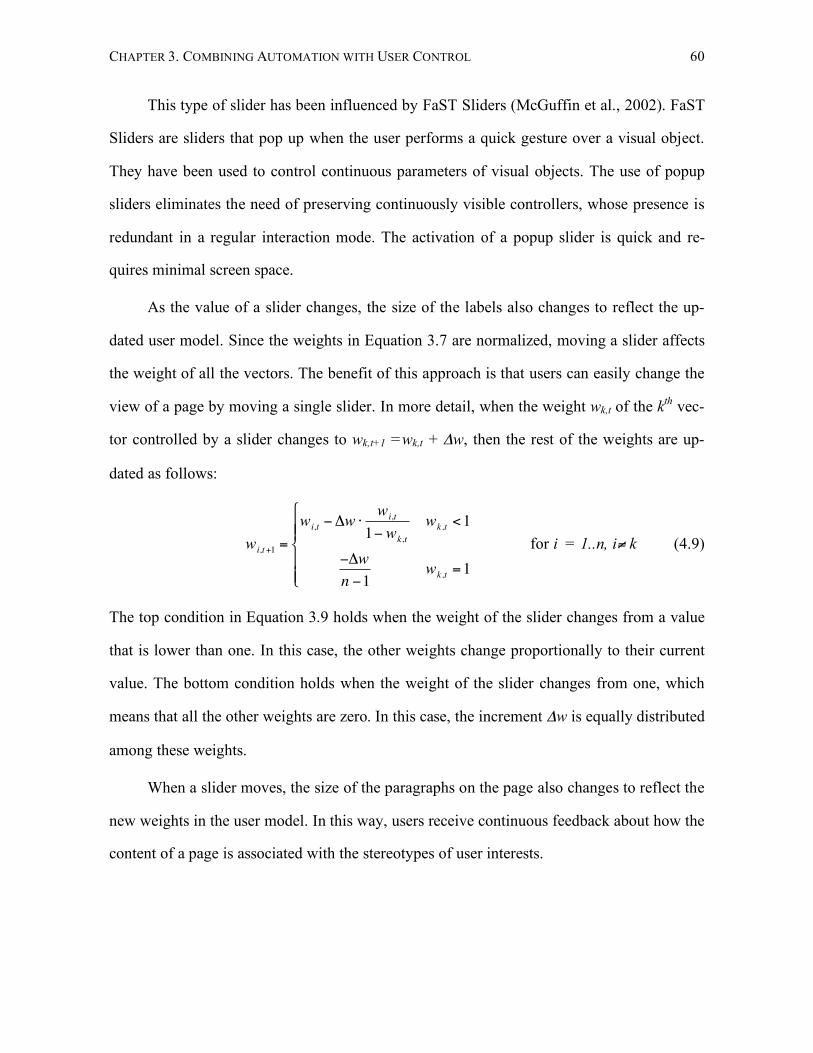
CHAPTER 3. COMBINING AUTOMATION WITH USER CONTROL 60
This type of slider has been influenced by FaST Sliders (McGuffin et al., 2002). FaST
Sliders are sliders that pop up when the user performs a quick gesture over a visual object.
They have been used to control continuous parameters of visual objects. The use of popup
sliders eliminates the need of preserving continuously visible controllers, whose presence is
redundant in a regular interaction mode. The activation of a popup slider is quick and re-
quires minimal screen space.
As the value of a slider changes, the size of the labels also changes to reflect the up-
dated user model. Since the weights in Equation 3.7 are normalized, moving a slider affects
the weight of all the vectors. The benefit of this approach is that users can easily change the
view of a page by moving a single slider. In more detail, when the weight wk,t of the kth vec-
tor controlled by a slider changes to wk,t+1 =wk,t + Δw, then the rest of the weights are up-
dated as follows:
!
wi,t+1 =
wi,t"#w $
wi,t
1" wk,t
wk,t
<1
"#w
n "1wk,t
=1
%
&
' '
(
' '
for i = 1..n, i≠ k (4.9)
The top condition in Equation 3.9 holds when the weight of the slider changes from a value
that is lower than one. In this case, the other weights change proportionally to their current
value. The bottom condition holds when the weight of the slider changes from one, which
means that all the other weights are zero. In this case, the increment Δw is equally distributed
among these weights.
When a slider moves, the size of the paragraphs on the page also changes to reflect the
new weights in the user model. In this way, users receive continuous feedback about how the
content of a page is associated with the stereotypes of user interests.
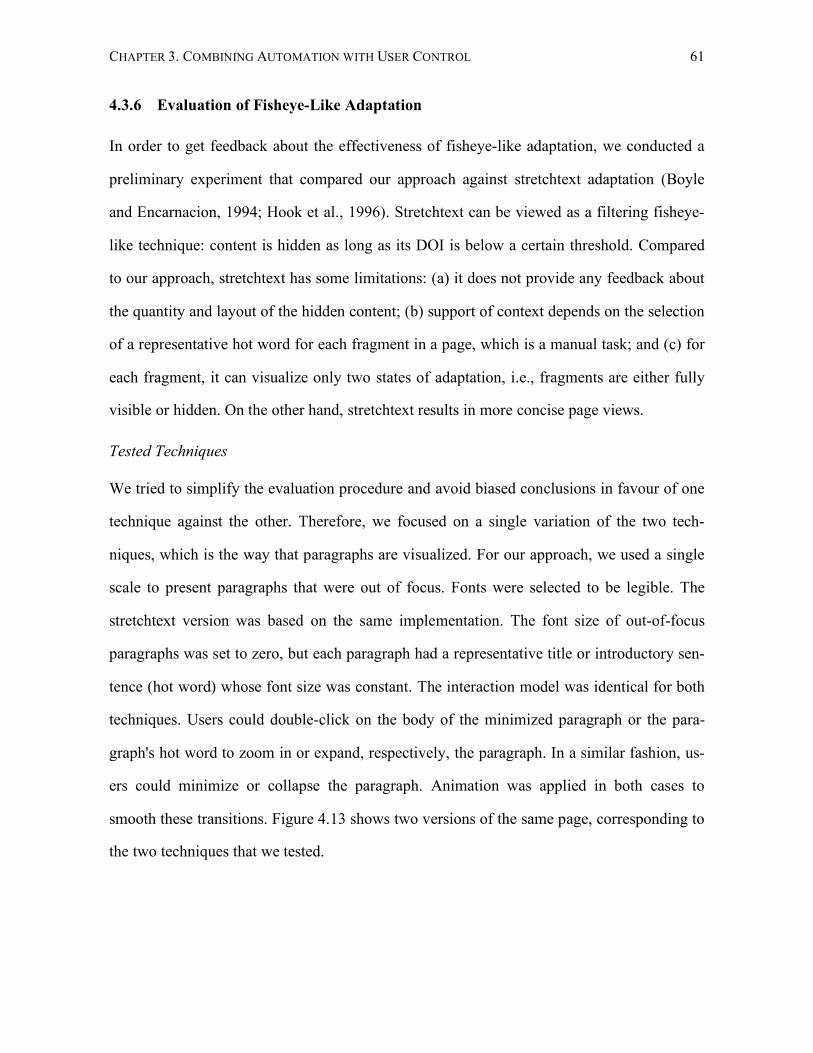
CHAPTER 3. COMBINING AUTOMATION WITH USER CONTROL 61
4.3.6 Evaluation of Fisheye-Like Adaptation
In order to get feedback about the effectiveness of fisheye-like adaptation, we conducted a
preliminary experiment that compared our approach against stretchtext adaptation (Boyle
and Encarnacion, 1994; Hook et al., 1996). Stretchtext can be viewed as a filtering fisheye-
like technique: content is hidden as long as its DOI is below a certain threshold. Compared
to our approach, stretchtext has some limitations: (a) it does not provide any feedback about
the quantity and layout of the hidden content; (b) support of context depends on the selection
of a representative hot word for each fragment in a page, which is a manual task; and (c) for
each fragment, it can visualize only two states of adaptation, i.e., fragments are either fully
visible or hidden. On the other hand, stretchtext results in more concise page views.
Tested Techniques
We tried to simplify the evaluation procedure and avoid biased conclusions in favour of one
technique against the other. Therefore, we focused on a single variation of the two tech-
niques, which is the way that paragraphs are visualized. For our approach, we used a single
scale to present paragraphs that were out of focus. Fonts were selected to be legible. The
stretchtext version was based on the same implementation. The font size of out-of-focus
paragraphs was set to zero, but each paragraph had a representative title or introductory sen-
tence (hot word) whose font size was constant. The interaction model was identical for both
techniques. Users could double-click on the body of the minimized paragraph or the para-
graph's hot word to zoom in or expand, respectively, the paragraph. In a similar fashion, us-
ers could minimize or collapse the paragraph. Animation was applied in both cases to
smooth these transitions. Figure 4.13 shows two versions of the same page, corresponding to
the two techniques that we tested.
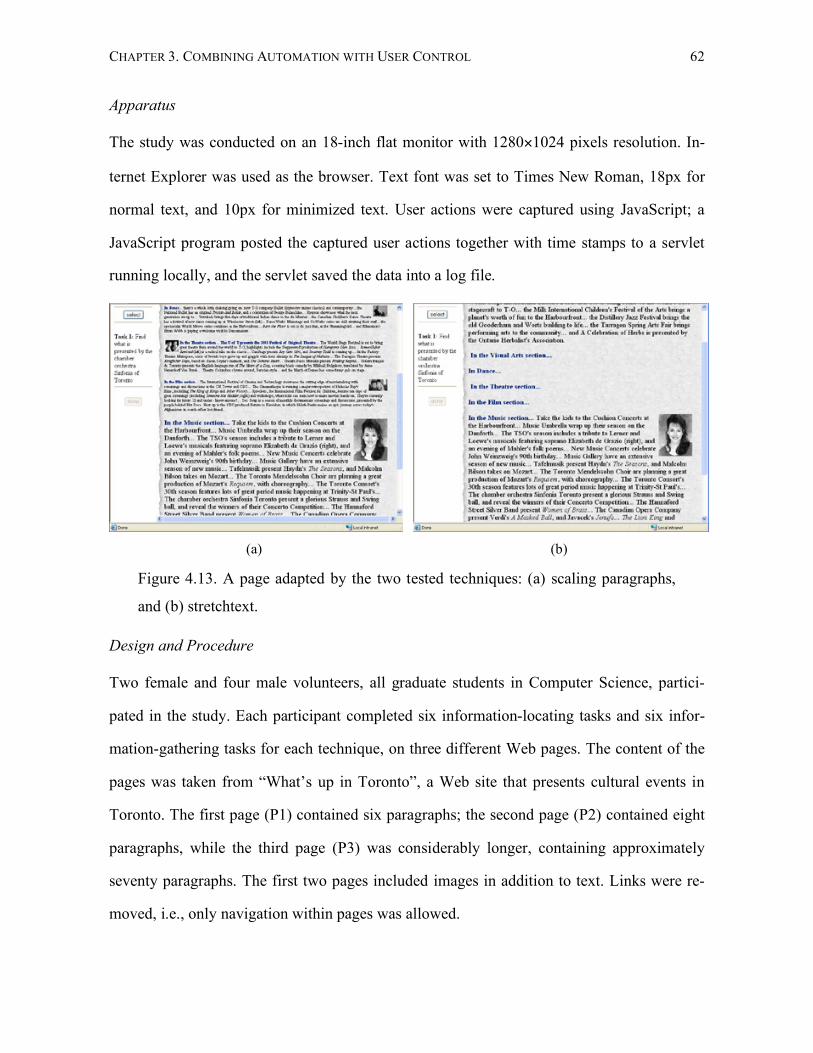
CHAPTER 3. COMBINING AUTOMATION WITH USER CONTROL 62
Apparatus
The study was conducted on an 18-inch flat monitor with 1280×1024 pixels resolution. In-
ternet Explorer was used as the browser. Text font was set to Times New Roman, 18px for
normal text, and 10px for minimized text. User actions were captured using JavaScript; a
JavaScript program posted the captured user actions together with time stamps to a servlet
running locally, and the servlet saved the data into a log file.
(a)
(b)
Figure 4.13. A page adapted by the two tested techniques: (a) scaling paragraphs,
and (b) stretchtext.
Design and Procedure
Two female and four male volunteers, all graduate students in Computer Science, partici-
pated in the study. Each participant completed six information-locating tasks and six infor-
mation-gathering tasks for each technique, on three different Web pages. The content of the
pages was taken from “What’s up in Toronto”, a Web site that presents cultural events in
Toronto. The first page (P1) contained six paragraphs; the second page (P2) contained eight
paragraphs, while the third page (P3) was considerably longer, containing approximately
seventy paragraphs. The first two pages included images in addition to text. Links were re-
moved, i.e., only navigation within pages was allowed.
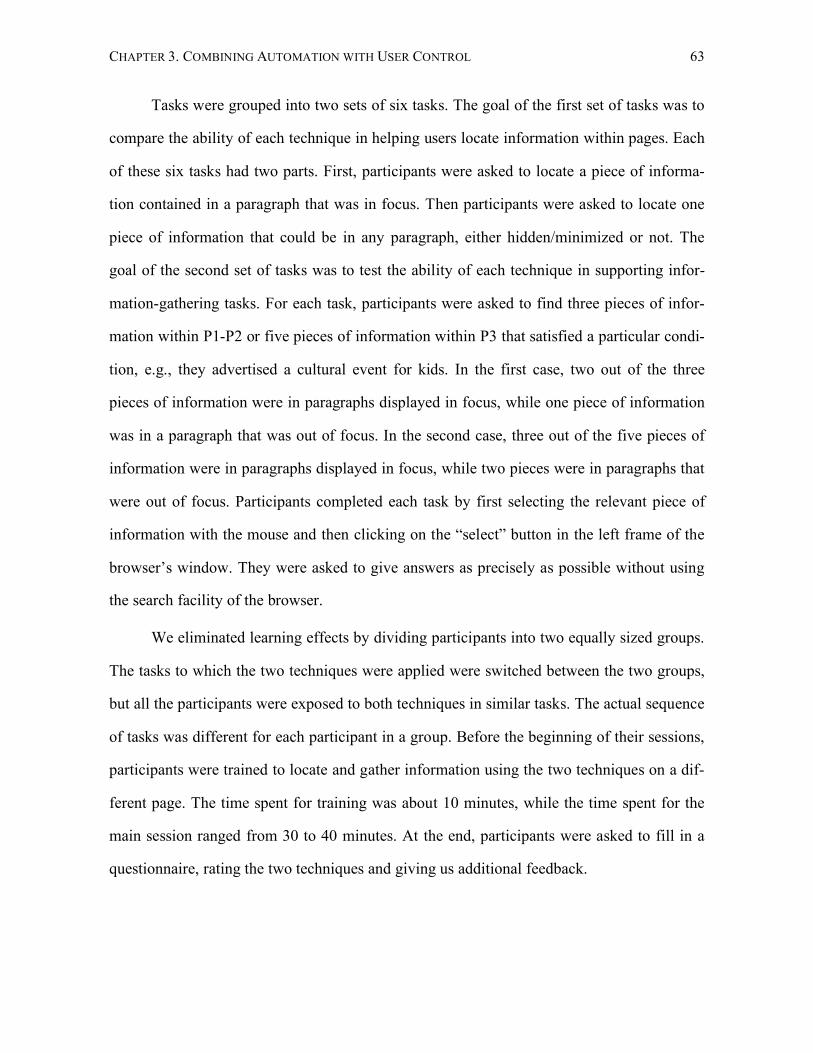
CHAPTER 3. COMBINING AUTOMATION WITH USER CONTROL 63
Tasks were grouped into two sets of six tasks. The goal of the first set of tasks was to
compare the ability of each technique in helping users locate information within pages. Each
of these six tasks had two parts. First, participants were asked to locate a piece of informa-
tion contained in a paragraph that was in focus. Then participants were asked to locate one
piece of information that could be in any paragraph, either hidden/minimized or not. The
goal of the second set of tasks was to test the ability of each technique in supporting infor-
mation-gathering tasks. For each task, participants were asked to find three pieces of infor-
mation within P1-P2 or five pieces of information within P3 that satisfied a particular condi-
tion, e.g., they advertised a cultural event for kids. In the first case, two out of the three
pieces of information were in paragraphs displayed in focus, while one piece of information
was in a paragraph that was out of focus. In the second case, three out of the five pieces of
information were in paragraphs displayed in focus, while two pieces were in paragraphs that
were out of focus. Participants completed each task by first selecting the relevant piece of
information with the mouse and then clicking on the “select” button in the left frame of the
browser’s window. They were asked to give answers as precisely as possible without using
the search facility of the browser.
We eliminated learning effects by dividing participants into two equally sized groups.
The tasks to which the two techniques were applied were switched between the two groups,
but all the participants were exposed to both techniques in similar tasks. The actual sequence
of tasks was different for each participant in a group. Before the beginning of their sessions,
participants were trained to locate and gather information using the two techniques on a dif-
ferent page. The time spent for training was about 10 minutes, while the time spent for the
main session ranged from 30 to 40 minutes. At the end, participants were asked to fill in a
questionnaire, rating the two techniques and giving us additional feedback.
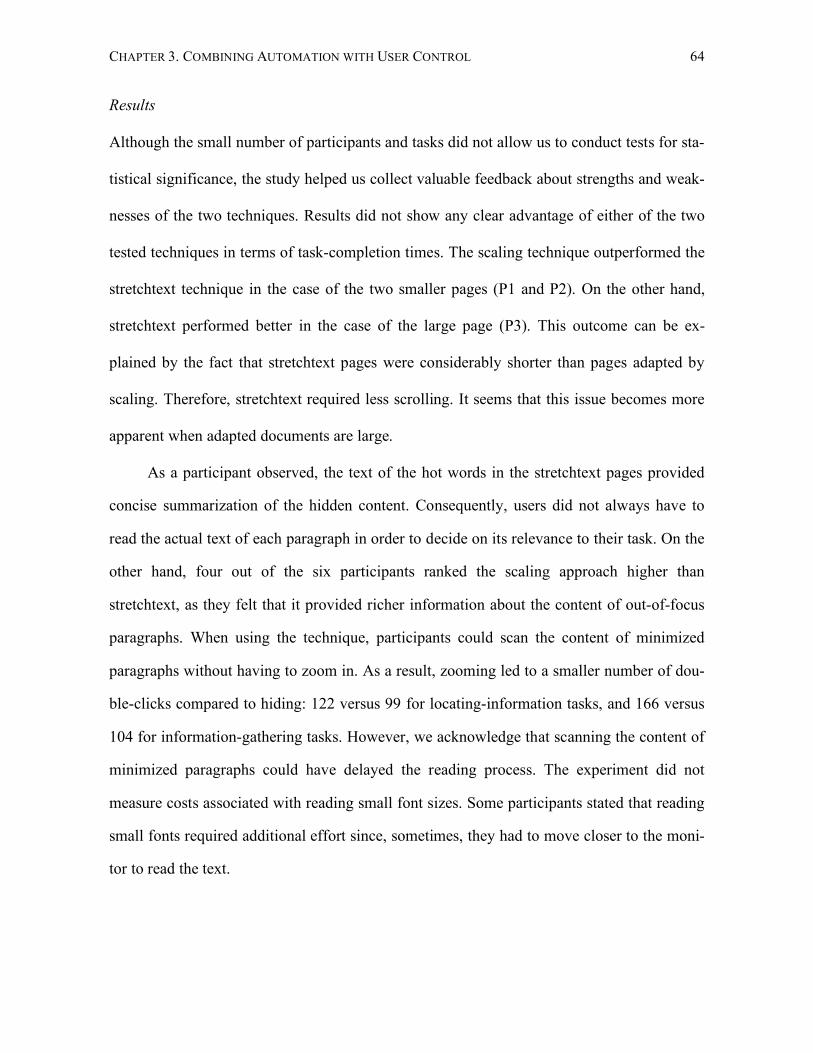
CHAPTER 3. COMBINING AUTOMATION WITH USER CONTROL 64
Results
Although the small number of participants and tasks did not allow us to conduct tests for sta-
tistical significance, the study helped us collect valuable feedback about strengths and weak-
nesses of the two techniques. Results did not show any clear advantage of either of the two
tested techniques in terms of task-completion times. The scaling technique outperformed the
stretchtext technique in the case of the two smaller pages (P1 and P2). On the other hand,
stretchtext performed better in the case of the large page (P3). This outcome can be ex-
plained by the fact that stretchtext pages were considerably shorter than pages adapted by
scaling. Therefore, stretchtext required less scrolling. It seems that this issue becomes more
apparent when adapted documents are large.
As a participant observed, the text of the hot words in the stretchtext pages provided
concise summarization of the hidden content. Consequently, users did not always have to
read the actual text of each paragraph in order to decide on its relevance to their task. On the
other hand, four out of the six participants ranked the scaling approach higher than
stretchtext, as they felt that it provided richer information about the content of out-of-focus
paragraphs. When using the technique, participants could scan the content of minimized
paragraphs without having to zoom in. As a result, zooming led to a smaller number of dou-
ble-clicks compared to hiding: 122 versus 99 for locating-information tasks, and 166 versus
104 for information-gathering tasks. However, we acknowledge that scanning the content of
minimized paragraphs could have delayed the reading process. The experiment did not
measure costs associated with reading small font sizes. Some participants stated that reading
small fonts required additional effort since, sometimes, they had to move closer to the moni-
tor to read the text.
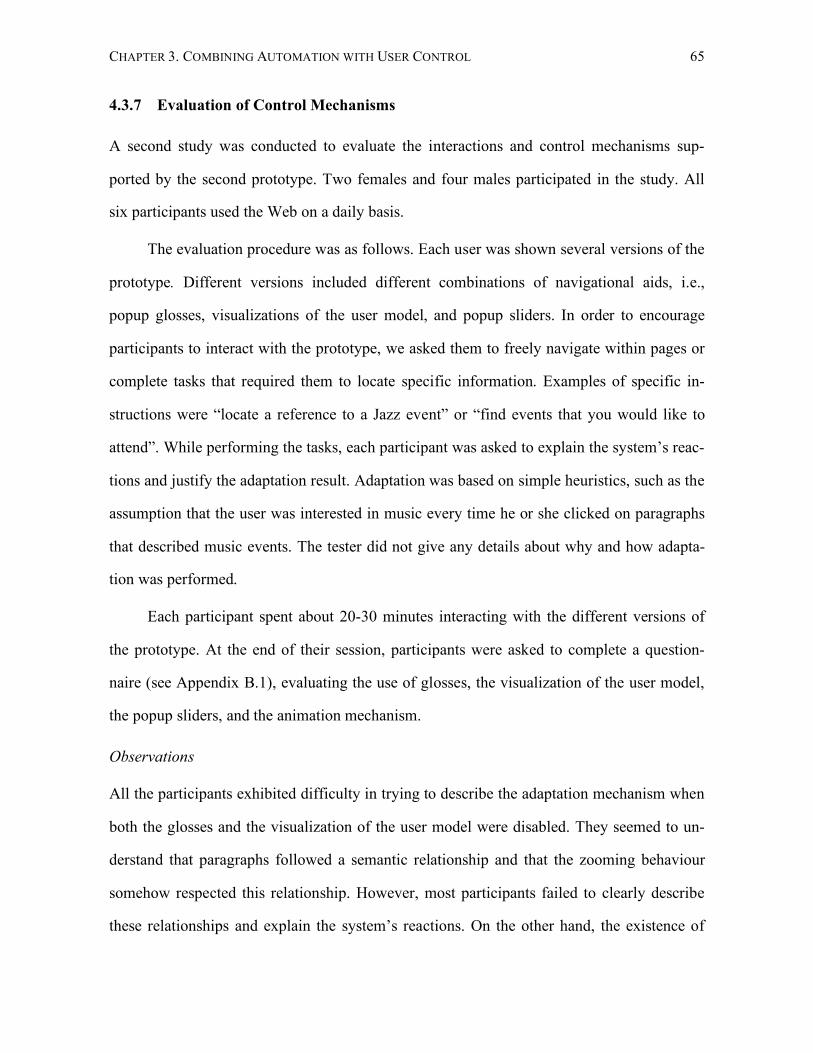
CHAPTER 3. COMBINING AUTOMATION WITH USER CONTROL 65
4.3.7 Evaluation of Control Mechanisms
A second study was conducted to evaluate the interactions and control mechanisms sup-
ported by the second prototype. Two females and four males participated in the study. All
six participants used the Web on a daily basis.
The evaluation procedure was as follows. Each user was shown several versions of the
prototype. Different versions included different combinations of navigational aids, i.e.,
popup glosses, visualizations of the user model, and popup sliders. In order to encourage
participants to interact with the prototype, we asked them to freely navigate within pages or
complete tasks that required them to locate specific information. Examples of specific in-
structions were “locate a reference to a Jazz event” or “find events that you would like to
attend”. While performing the tasks, each participant was asked to explain the system’s reac-
tions and justify the adaptation result. Adaptation was based on simple heuristics, such as the
assumption that the user was interested in music every time he or she clicked on paragraphs
that described music events. The tester did not give any details about why and how adapta-
tion was performed.
Each participant spent about 20-30 minutes interacting with the different versions of
the prototype. At the end of their session, participants were asked to complete a question-
naire (see Appendix B.1), evaluating the use of glosses, the visualization of the user model,
the popup sliders, and the animation mechanism.
Observations
All the participants exhibited difficulty in trying to describe the adaptation mechanism when
both the glosses and the visualization of the user model were disabled. They seemed to un-
derstand that paragraphs followed a semantic relationship and that the zooming behaviour
somehow respected this relationship. However, most participants failed to clearly describe
these relationships and explain the system’s reactions. On the other hand, the existence of
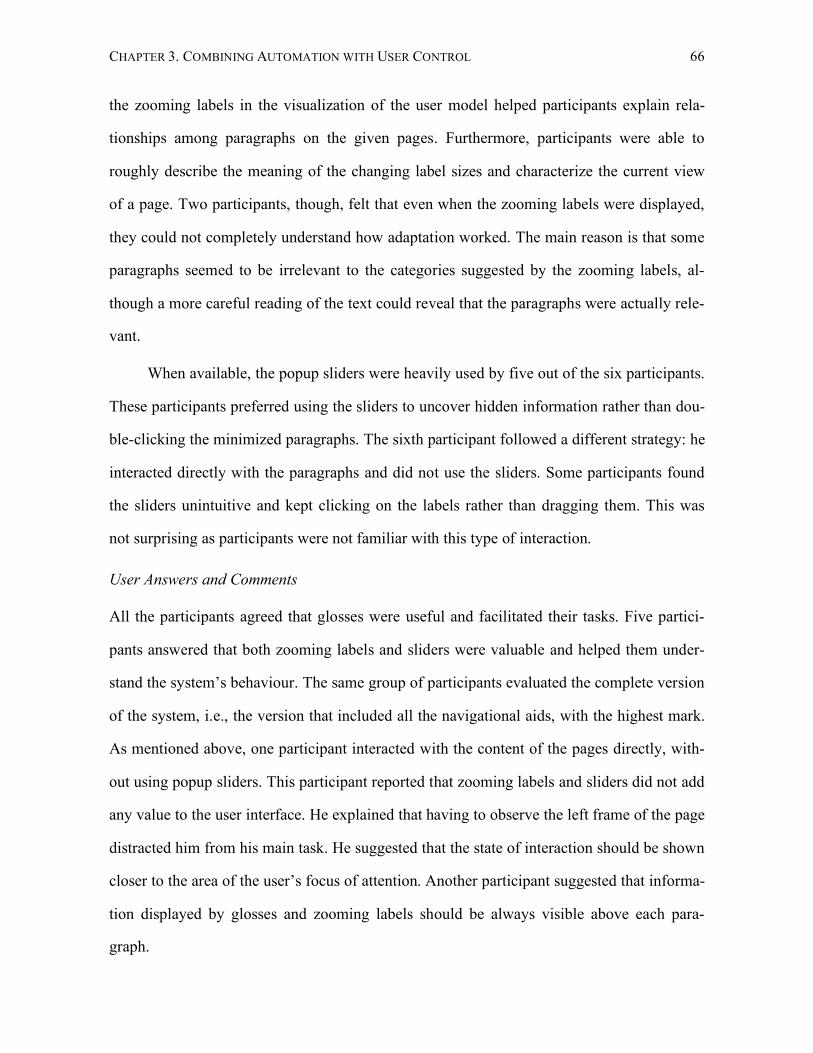
CHAPTER 3. COMBINING AUTOMATION WITH USER CONTROL 66
the zooming labels in the visualization of the user model helped participants explain rela-
tionships among paragraphs on the given pages. Furthermore, participants were able to
roughly describe the meaning of the changing label sizes and characterize the current view
of a page. Two participants, though, felt that even when the zooming labels were displayed,
they could not completely understand how adaptation worked. The main reason is that some
paragraphs seemed to be irrelevant to the categories suggested by the zooming labels, al-
though a more careful reading of the text could reveal that the paragraphs were actually rele-
vant.
When available, the popup sliders were heavily used by five out of the six participants.
These participants preferred using the sliders to uncover hidden information rather than dou-
ble-clicking the minimized paragraphs. The sixth participant followed a different strategy: he
interacted directly with the paragraphs and did not use the sliders. Some participants found
the sliders unintuitive and kept clicking on the labels rather than dragging them. This was
not surprising as participants were not familiar with this type of interaction.
User Answers and Comments
All the participants agreed that glosses were useful and facilitated their tasks. Five partici-
pants answered that both zooming labels and sliders were valuable and helped them under-
stand the system’s behaviour. The same group of participants evaluated the complete version
of the system, i.e., the version that included all the navigational aids, with the highest mark.
As mentioned above, one participant interacted with the content of the pages directly, with-
out using popup sliders. This participant reported that zooming labels and sliders did not add
any value to the user interface. He explained that having to observe the left frame of the page
distracted him from his main task. He suggested that the state of interaction should be shown
closer to the area of the user’s focus of attention. Another participant suggested that informa-
tion displayed by glosses and zooming labels should be always visible above each para-
graph.
CHAPTER 3. COMBINING AUTOMATION WITH USER CONTROL 67
Half of the participants reported that popup sliders were easy to use, whereas the other
half reported the opposite. These negative answers were consistent with our observations
mentioned earlier. In addition, two participants suggested that the values of the sliders and
the size of the corresponding labels should change independently rather than being normal-
ized. Consider, however, that participants were not given the opportunity to test this alterna-
tive design. Normalized sliders suggest a more complex conceptual model but minimize the
number of actions required to change the weights in a user model.
Finally, all the participants liked the animation used to smooth the transitions between
the views of the adaptive pages. They all agreed that animation helped them understand
these transitions.
4.4 Summary and Discussion
The two prototypes presented in this chapter combine automation and direct user control for
the personalization of Web applications. In the designs that we have described, several deci-
sions about how adaptation is performed are made automatically. For example, links are
automatically classified into topics of user interest. On the other hand, adaptation is user-
initiated and user-controlled. Note that users do not directly customize the elements of the
user interface. They rather adjust visualized parameters of the user model. Such adjustments
are tightly coupled with the adapted pages, i.e., any change in the parameters of the user
model is instantly reflected on the pages. This interaction model has been a major contribu-
tion of our work.
Each of the two prototypes has focused on a different aspect of adaptation. Through
the first prototype, we have demonstrated a system architecture that allows users to define
their own categorization schemes and use these schemes to personalize, first, the display of
links within a page and, second, visualizations of a browsing history. The second prototype
has served as a basis for exploring techniques that adapt content within Web pages. Again,
CHAPTER 3. COMBINING AUTOMATION WITH USER CONTROL 68
page adaptation has been defined over a set of classification parameters that represent stereo-
types of user interests. As discussed in Section 4.3, although we assumed that such stereo-
types were defined at design time, adopting the architecture of the first prototype would al-
low for the support of user-defined stereotypes.
The second prototype has been based on a new content adaptation technique, which
could be considered as a distortion-based fisheye-view technique. It has also introduced sev-
eral techniques that enable users to control adaptation. The new designs were evaluated by
two user studies. The first study has shown that the new technique has several advantages
over stretchtext adaptation. Compared to stretchtext, it preserves the overall layout of the
adapted pages and provides richer feedback about their original form and content. Results
also suggest that it can reduce the number of user actions required to locate or gather infor-
mation. On the other hand, the new technique results in longer pages.
We acknowledge that we did not consider several factors that could affect the success
of the evaluated techniques, such as the size of minimized paragraphs, the number of para-
graphs appearing in focus, and the ability of the decision-making mechanism to correctly
infer user needs. Given these limitations, making general statements about which technique
is better would not be appropriate. In the more general context of adaptive user interfaces,
how adaptation techniques should be evaluated and compared is an issue that needs special
consideration. Chapter 5 explores this problem more systematically.
Through the second study, six users gave their feedback on the usefulness and usabil-
ity of the techniques implemented in the second prototype. The study showed that the pres-
ence of visual representations of the user model can help users better comprehend automatic
adaptation. The user-control techniques were found to be particularly helpful. Nevertheless,
they added complexity to the user interface. For instance, some users felt that the activation
of popup sliders was not intuitive. Future work needs to evaluate the techniques with more
users, more pages, and in more realistic environments.
69
Chapter 5
Assessing Adaptation Techniques
This chapter focuses on the evaluation of adaptive user interfaces. Issues raised through the
first steps of our research, presented in Chapter 3, gave motivation for the work documented
here. How should adaptation techniques be compared? How should we decide about which
adaptation technique is more appropriate for a given user interface? What is the role of the
quality of inference when making such decisions? These are the main questions that we try
to answer in this chapter. In particular, we focus on the effect of the accuracy of inference
and come up with recommendations about how accuracy should be manipulated in experi-
mental designs. To explore the effect of accuracy, we present the design and results of an
experiment with 12 participants. The experiment compares two different adaptation tech-
niques applied to long lists.
The research described in this chapter has appeared in the Extended Abstracts of the
CHI 2005 ACM Conference on Human Factors in Computing Systems (Tsandilas and
schraefel, 2005).
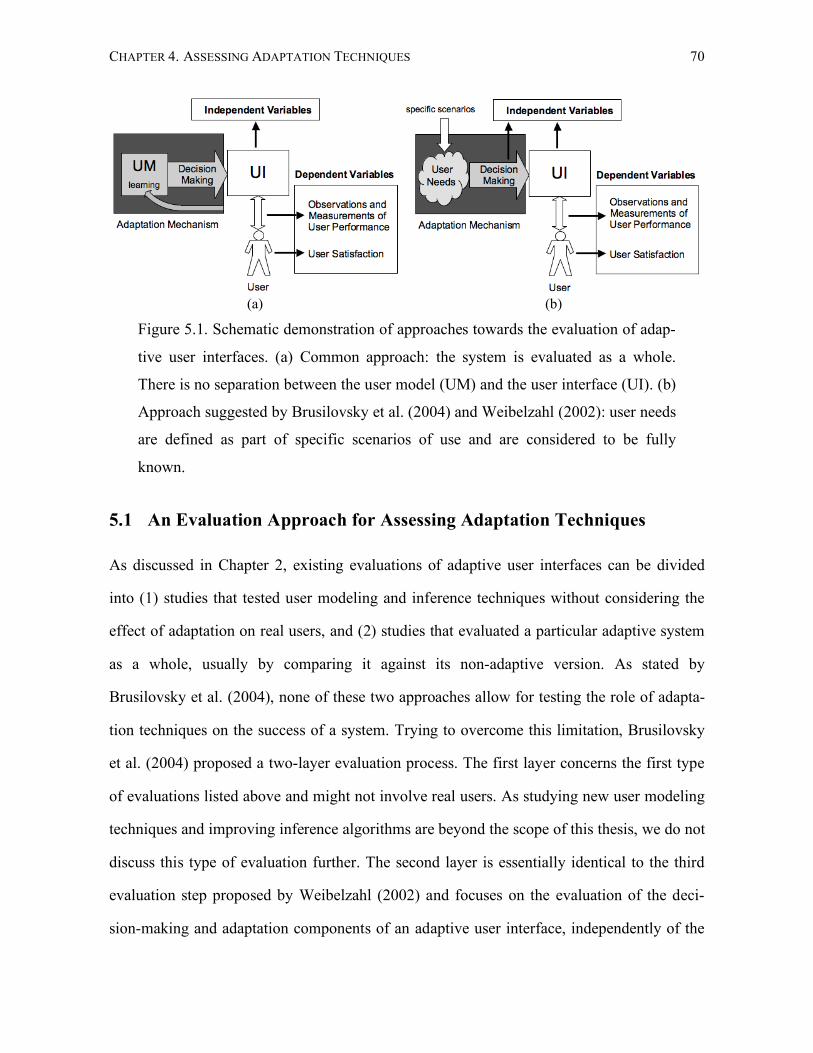
CHAPTER 4. ASSESSING ADAPTATION TECHNIQUES 70
(a)
(b)
Figure 5.1. Schematic demonstration of approaches towards the evaluation of adap-
tive user interfaces. (a) Common approach: the system is evaluated as a whole.
There is no separation between the user model (UM) and the user interface (UI). (b)
Approach suggested by Brusilovsky et al. (2004) and Weibelzahl (2002): user needs
are defined as part of specific scenarios of use and are considered to be fully
known.
5.1 An Evaluation Approach for Assessing Adaptation Techniques
As discussed in Chapter 2, existing evaluations of adaptive user interfaces can be divided
into (1) studies that tested user modeling and inference techniques without considering the
effect of adaptation on real users, and (2) studies that evaluated a particular adaptive system
as a whole, usually by comparing it against its non-adaptive version. As stated by
Brusilovsky et al. (2004), none of these two approaches allow for testing the role of adapta-
tion techniques on the success of a system. Trying to overcome this limitation, Brusilovsky
et al. (2004) proposed a two-layer evaluation process. The first layer concerns the first type
of evaluations listed above and might not involve real users. As studying new user modeling
techniques and improving inference algorithms are beyond the scope of this thesis, we do not
discuss this type of evaluation further. The second layer is essentially identical to the third
evaluation step proposed by Weibelzahl (2002) and focuses on the evaluation of the deci-
sion-making and adaptation components of an adaptive user interface, independently of the
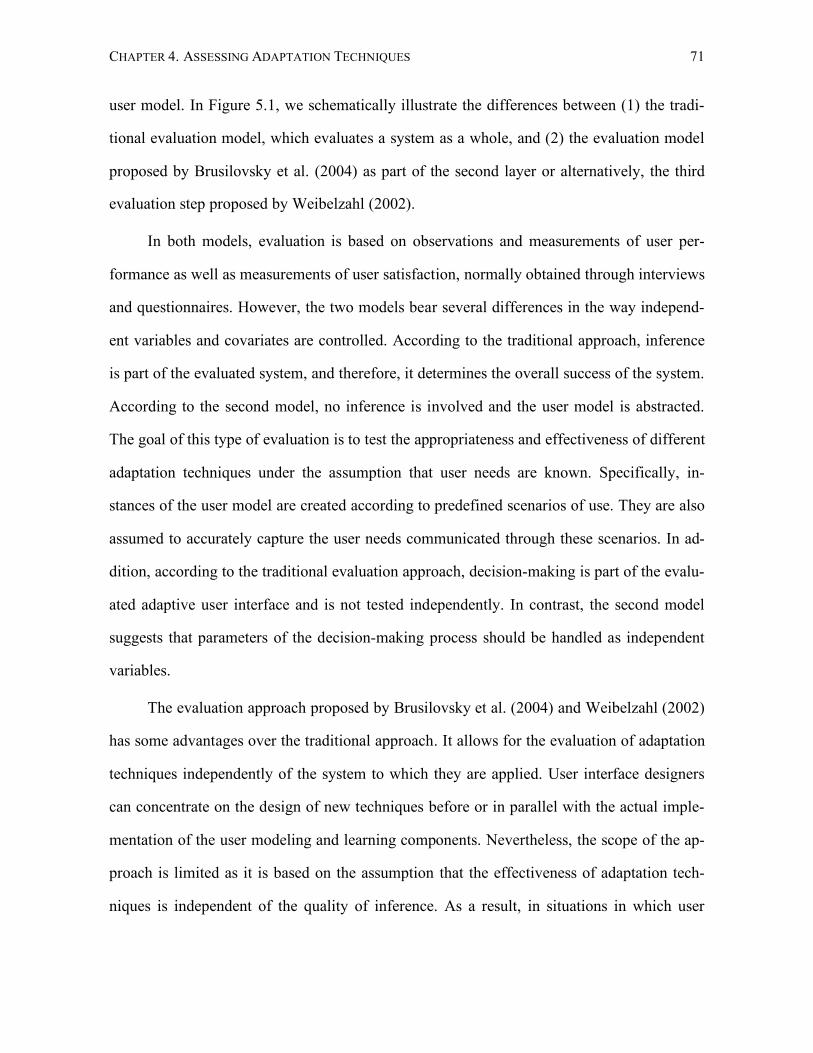
CHAPTER 4. ASSESSING ADAPTATION TECHNIQUES 71
user model. In Figure 5.1, we schematically illustrate the differences between (1) the tradi-
tional evaluation model, which evaluates a system as a whole, and (2) the evaluation model
proposed by Brusilovsky et al. (2004) as part of the second layer or alternatively, the third
evaluation step proposed by Weibelzahl (2002).
In both models, evaluation is based on observations and measurements of user per-
formance as well as measurements of user satisfaction, normally obtained through interviews
and questionnaires. However, the two models bear several differences in the way independ-
ent variables and covariates are controlled. According to the traditional approach, inference
is part of the evaluated system, and therefore, it determines the overall success of the system.
According to the second model, no inference is involved and the user model is abstracted.
The goal of this type of evaluation is to test the appropriateness and effectiveness of different
adaptation techniques under the assumption that user needs are known. Specifically, in-
stances of the user model are created according to predefined scenarios of use. They are also
assumed to accurately capture the user needs communicated through these scenarios. In ad-
dition, according to the traditional evaluation approach, decision-making is part of the evalu-
ated adaptive user interface and is not tested independently. In contrast, the second model
suggests that parameters of the decision-making process should be handled as independent
variables.
The evaluation approach proposed by Brusilovsky et al. (2004) and Weibelzahl (2002)
has some advantages over the traditional approach. It allows for the evaluation of adaptation
techniques independently of the system to which they are applied. User interface designers
can concentrate on the design of new techniques before or in parallel with the actual imple-
mentation of the user modeling and learning components. Nevertheless, the scope of the ap-
proach is limited as it is based on the assumption that the effectiveness of adaptation tech-
niques is independent of the quality of inference. As a result, in situations in which user
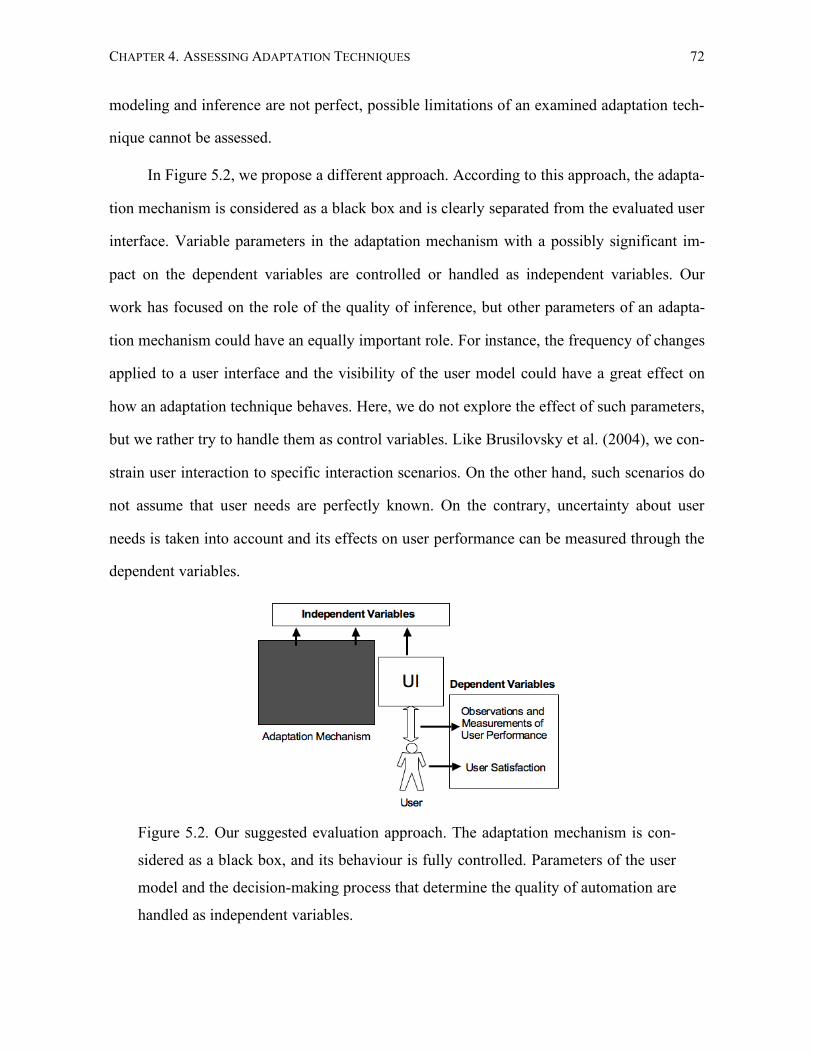
CHAPTER 4. ASSESSING ADAPTATION TECHNIQUES 72
modeling and inference are not perfect, possible limitations of an examined adaptation tech-
nique cannot be assessed.
In Figure 5.2, we propose a different approach. According to this approach, the adapta-
tion mechanism is considered as a black box and is clearly separated from the evaluated user
interface. Variable parameters in the adaptation mechanism with a possibly significant im-
pact on the dependent variables are controlled or handled as independent variables. Our
work has focused on the role of the quality of inference, but other parameters of an adapta-
tion mechanism could have an equally important role. For instance, the frequency of changes
applied to a user interface and the visibility of the user model could have a great effect on
how an adaptation technique behaves. Here, we do not explore the effect of such parameters,
but we rather try to handle them as control variables. Like Brusilovsky et al. (2004), we con-
strain user interaction to specific interaction scenarios. On the other hand, such scenarios do
not assume that user needs are perfectly known. On the contrary, uncertainty about user
needs is taken into account and its effects on user performance can be measured through the
dependent variables.
Figure 5.2. Our suggested evaluation approach. The adaptation mechanism is con-
sidered as a black box, and its behaviour is fully controlled. Parameters of the user
model and the decision-making process that determine the quality of automation are
handled as independent variables.
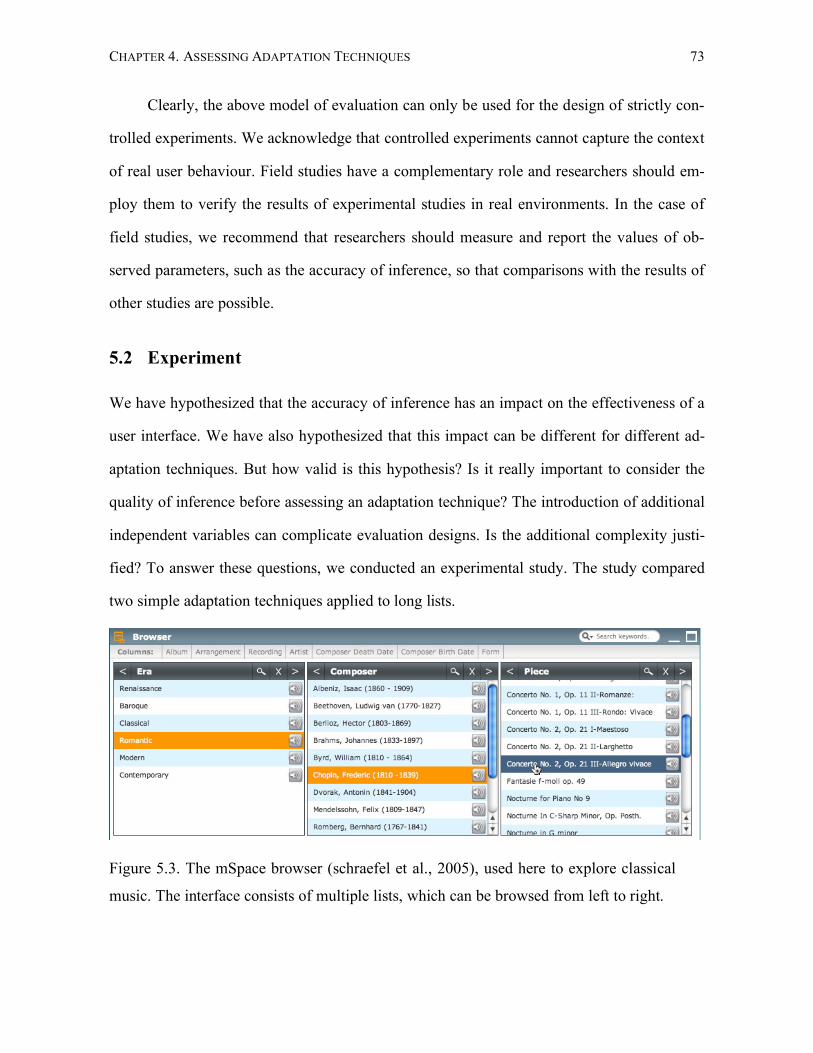
CHAPTER 4. ASSESSING ADAPTATION TECHNIQUES 73
Clearly, the above model of evaluation can only be used for the design of strictly con-
trolled experiments. We acknowledge that controlled experiments cannot capture the context
of real user behaviour. Field studies have a complementary role and researchers should em-
ploy them to verify the results of experimental studies in real environments. In the case of
field studies, we recommend that researchers should measure and report the values of ob-
served parameters, such as the accuracy of inference, so that comparisons with the results of
other studies are possible.
5.2 Experiment
We have hypothesized that the accuracy of inference has an impact on the effectiveness of a
user interface. We have also hypothesized that this impact can be different for different ad-
aptation techniques. But how valid is this hypothesis? Is it really important to consider the
quality of inference before assessing an adaptation technique? The introduction of additional
independent variables can complicate evaluation designs. Is the additional complexity justi-
fied? To answer these questions, we conducted an experimental study. The study compared
two simple adaptation techniques applied to long lists.
Figure 5.3. The mSpace browser (schraefel et al., 2005), used here to explore classical
music. The interface consists of multiple lists, which can be browsed from left to right.
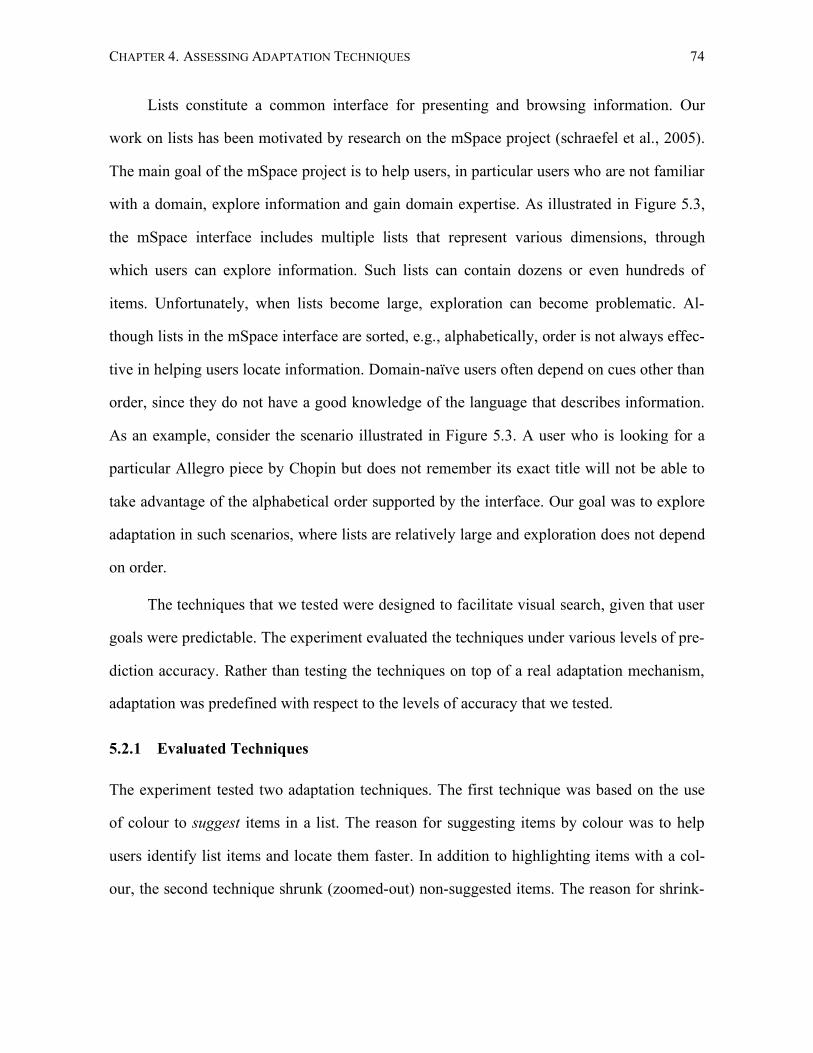
CHAPTER 4. ASSESSING ADAPTATION TECHNIQUES 74
Lists constitute a common interface for presenting and browsing information. Our
work on lists has been motivated by research on the mSpace project (schraefel et al., 2005).
The main goal of the mSpace project is to help users, in particular users who are not familiar
with a domain, explore information and gain domain expertise. As illustrated in Figure 5.3,
the mSpace interface includes multiple lists that represent various dimensions, through
which users can explore information. Such lists can contain dozens or even hundreds of
items. Unfortunately, when lists become large, exploration can become problematic. Al-
though lists in the mSpace interface are sorted, e.g., alphabetically, order is not always effec-
tive in helping users locate information. Domain-naïve users often depend on cues other than
order, since they do not have a good knowledge of the language that describes information.
As an example, consider the scenario illustrated in Figure 5.3. A user who is looking for a
particular Allegro piece by Chopin but does not remember its exact title will not be able to
take advantage of the alphabetical order supported by the interface. Our goal was to explore
adaptation in such scenarios, where lists are relatively large and exploration does not depend
on order.
The techniques that we tested were designed to facilitate visual search, given that user
goals were predictable. The experiment evaluated the techniques under various levels of pre-
diction accuracy. Rather than testing the techniques on top of a real adaptation mechanism,
adaptation was predefined with respect to the levels of accuracy that we tested.
5.2.1 Evaluated Techniques
The experiment tested two adaptation techniques. The first technique was based on the use
of colour to suggest items in a list. The reason for suggesting items by colour was to help
users identify list items and locate them faster. In addition to highlighting items with a col-
our, the second technique shrunk (zoomed-out) non-suggested items. The reason for shrink-
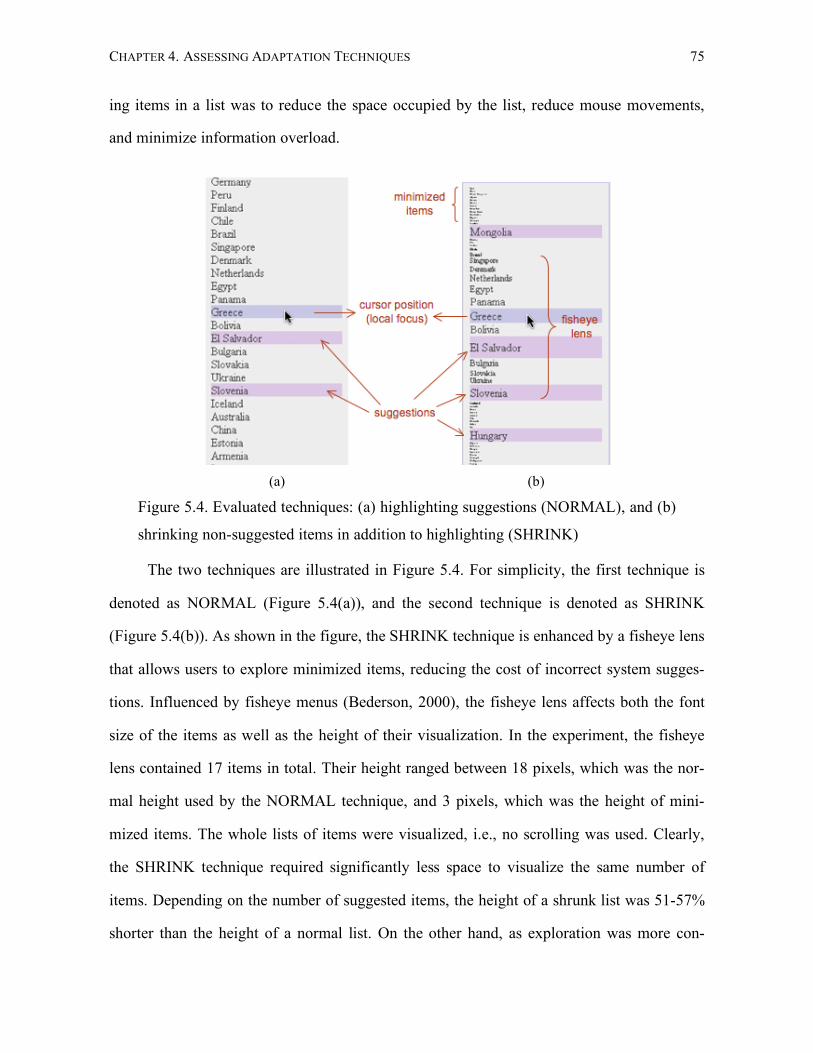
CHAPTER 4. ASSESSING ADAPTATION TECHNIQUES 75
ing items in a list was to reduce the space occupied by the list, reduce mouse movements,
and minimize information overload.
(a) (b)
Figure 5.4. Evaluated techniques: (a) highlighting suggestions (NORMAL), and (b)
shrinking non-suggested items in addition to highlighting (SHRINK)
The two techniques are illustrated in Figure 5.4. For simplicity, the first technique is
denoted as NORMAL (Figure 5.4(a)), and the second technique is denoted as SHRINK
(Figure 5.4(b)). As shown in the figure, the SHRINK technique is enhanced by a fisheye lens
that allows users to explore minimized items, reducing the cost of incorrect system sugges-
tions. Influenced by fisheye menus (Bederson, 2000), the fisheye lens affects both the font
size of the items as well as the height of their visualization. In the experiment, the fisheye
lens contained 17 items in total. Their height ranged between 18 pixels, which was the nor-
mal height used by the NORMAL technique, and 3 pixels, which was the height of mini-
mized items. The whole lists of items were visualized, i.e., no scrolling was used. Clearly,
the SHRINK technique required significantly less space to visualize the same number of
items. Depending on the number of suggested items, the height of a shrunk list was 51-57%
shorter than the height of a normal list. On the other hand, as exploration was more con-
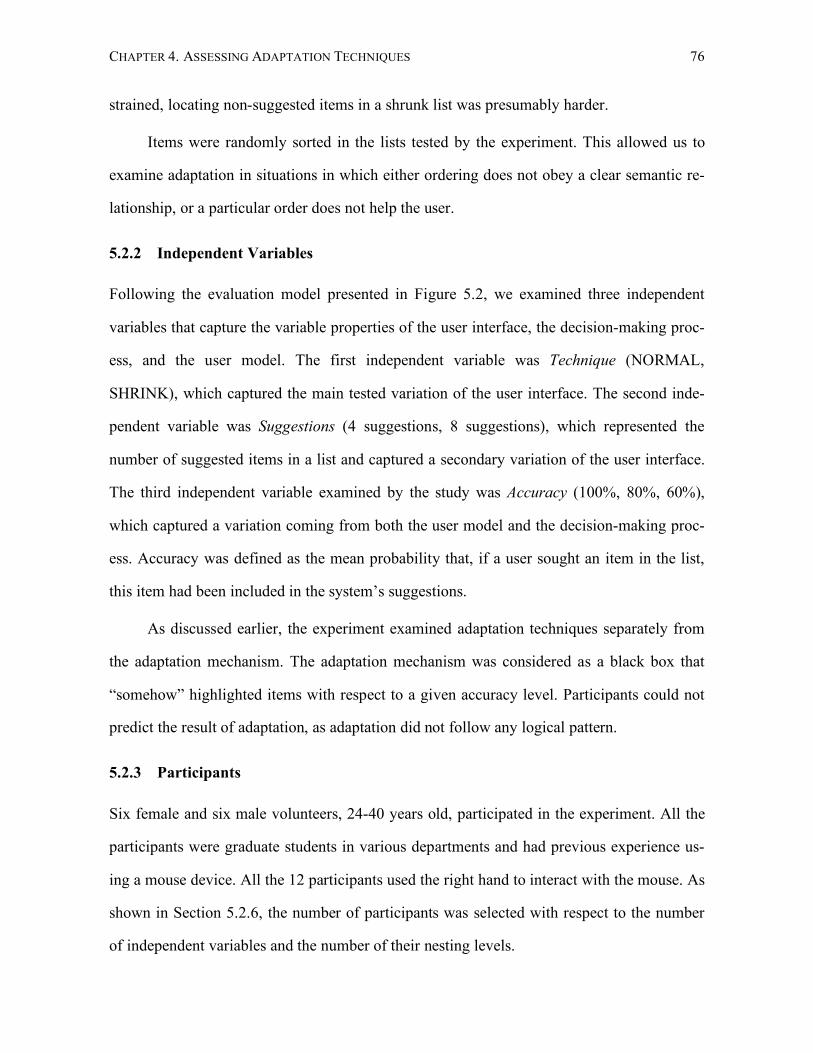
CHAPTER 4. ASSESSING ADAPTATION TECHNIQUES 76
strained, locating non-suggested items in a shrunk list was presumably harder.
Items were randomly sorted in the lists tested by the experiment. This allowed us to
examine adaptation in situations in which either ordering does not obey a clear semantic re-
lationship, or a particular order does not help the user.
5.2.2 Independent Variables
Following the evaluation model presented in Figure 5.2, we examined three independent
variables that capture the variable properties of the user interface, the decision-making proc-
ess, and the user model. The first independent variable was Technique (NORMAL,
SHRINK), which captured the main tested variation of the user interface. The second inde-
pendent variable was Suggestions (4 suggestions, 8 suggestions), which represented the
number of suggested items in a list and captured a secondary variation of the user interface.
The third independent variable examined by the study was Accuracy (100%, 80%, 60%),
which captured a variation coming from both the user model and the decision-making proc-
ess. Accuracy was defined as the mean probability that, if a user sought an item in the list,
this item had been included in the system’s suggestions.
As discussed earlier, the experiment examined adaptation techniques separately from
the adaptation mechanism. The adaptation mechanism was considered as a black box that
“somehow” highlighted items with respect to a given accuracy level. Participants could not
predict the result of adaptation, as adaptation did not follow any logical pattern.
5.2.3 Participants
Six female and six male volunteers, 24-40 years old, participated in the experiment. All the
participants were graduate students in various departments and had previous experience us-
ing a mouse device. All the 12 participants used the right hand to interact with the mouse. As
shown in Section 5.2.6, the number of participants was selected with respect to the number
of independent variables and the number of their nesting levels.
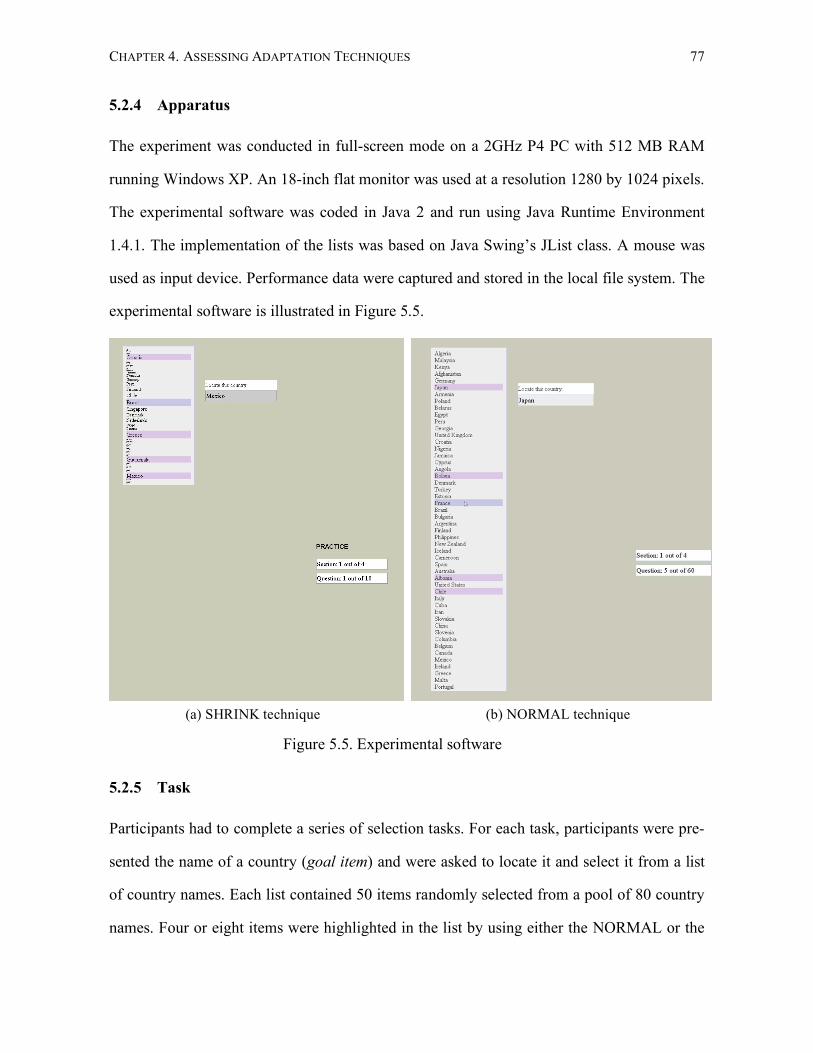
CHAPTER 4. ASSESSING ADAPTATION TECHNIQUES 77
5.2.4 Apparatus
The experiment was conducted in full-screen mode on a 2GHz P4 PC with 512 MB RAM
running Windows XP. An 18-inch flat monitor was used at a resolution 1280 by 1024 pixels.
The experimental software was coded in Java 2 and run using Java Runtime Environment
1.4.1. The implementation of the lists was based on Java Swing’s JList class. A mouse was
used as input device. Performance data were captured and stored in the local file system. The
experimental software is illustrated in Figure 5.5.
(a) SHRINK technique
(b) NORMAL technique
Figure 5.5. Experimental software
5.2.5 Task
Participants had to complete a series of selection tasks. For each task, participants were pre-
sented the name of a country (goal item) and were asked to locate it and select it from a list
of country names. Each list contained 50 items randomly selected from a pool of 80 country
names. Four or eight items were highlighted in the list by using either the NORMAL or the
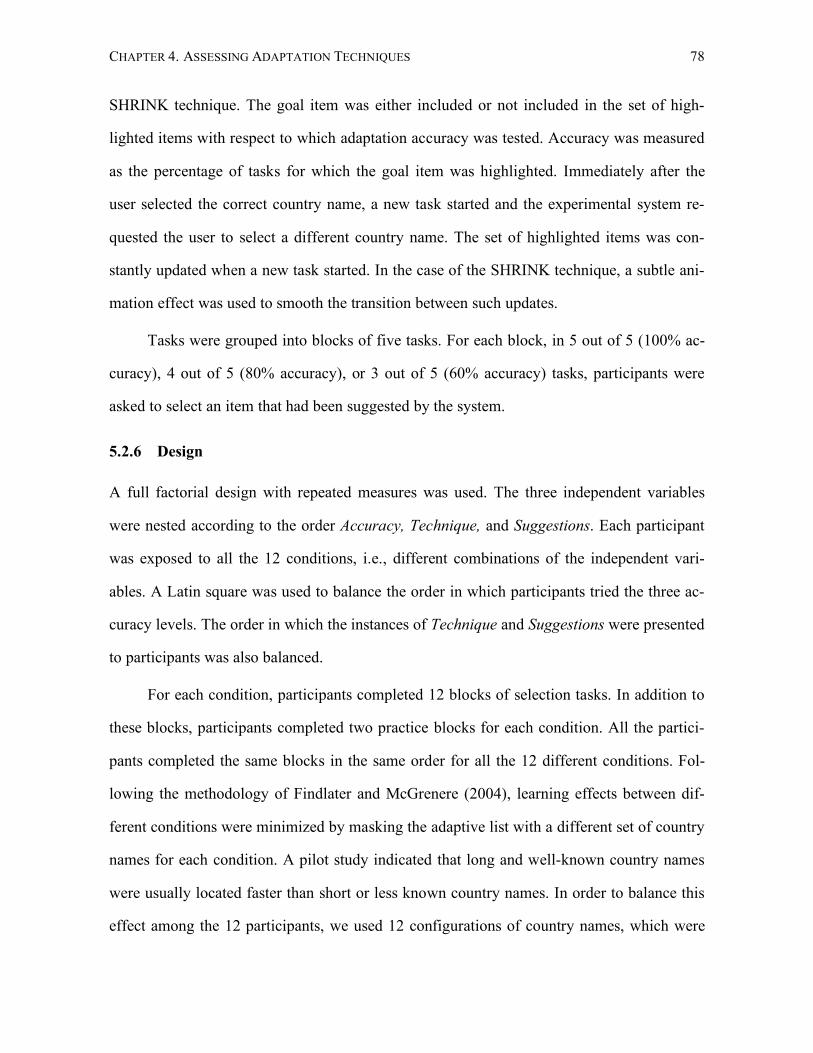
CHAPTER 4. ASSESSING ADAPTATION TECHNIQUES 78
SHRINK technique. The goal item was either included or not included in the set of high-
lighted items with respect to which adaptation accuracy was tested. Accuracy was measured
as the percentage of tasks for which the goal item was highlighted. Immediately after the
user selected the correct country name, a new task started and the experimental system re-
quested the user to select a different country name. The set of highlighted items was con-
stantly updated when a new task started. In the case of the SHRINK technique, a subtle ani-
mation effect was used to smooth the transition between such updates.
Tasks were grouped into blocks of five tasks. For each block, in 5 out of 5 (100% ac-
curacy), 4 out of 5 (80% accuracy), or 3 out of 5 (60% accuracy) tasks, participants were
asked to select an item that had been suggested by the system.
5.2.6 Design
A full factorial design with repeated measures was used. The three independent variables
were nested according to the order Accuracy, Technique, and Suggestions. Each participant
was exposed to all the 12 conditions, i.e., different combinations of the independent vari-
ables. A Latin square was used to balance the order in which participants tried the three ac-
curacy levels. The order in which the instances of Technique and Suggestions were presented
to participants was also balanced.
For each condition, participants completed 12 blocks of selection tasks. In addition to
these blocks, participants completed two practice blocks for each condition. All the partici-
pants completed the same blocks in the same order for all the 12 different conditions. Fol-
lowing the methodology of Findlater and McGrenere (2004), learning effects between dif-
ferent conditions were minimized by masking the adaptive list with a different set of country
names for each condition. A pilot study indicated that long and well-known country names
were usually located faster than short or less known country names. In order to balance this
effect among the 12 participants, we used 12 configurations of country names, which were
CHAPTER 4. ASSESSING ADAPTATION TECHNIQUES 79
assigned to the 12 conditions using a Latin square. This means that each configuration was
applied to every condition exactly once, and no participant was exposed to the same configu-
ration more than once. The selection of goal items was pseudorandom and followed an ap-
proximately uniform distribution along the length of the list. The selection of suggested
items was also randomly and uniformly distributed along the list.
In summary, the experiment was designed as follows:
12 participants
× 3 levels of adaptation accuracy (100%, 80%, 60%)
× 2 adaptation techniques (NORMAL, SHRINK)
× 2 levels of suggestions (4 suggestions, 8 suggestions)
× 12 blocks
× 5 locating tasks per block
= 8640 locating tasks in total
5.2.7 Procedure
The experiment was designed to fit in a single session, which was approximately 60-80 min-
utes long. First, participants were presented with the two techniques, in a practice session
that lasted approximately three minutes. They were also asked to locate a series of items us-
ing both techniques. The purpose of this session was to help participants become familiar
with the experimental setting and test the fisheye lens employed by the SHRINK technique.
After the end of the practice session, participants were asked to complete the experi-
mental tasks as quickly as possible, avoiding errors. Participants were not aware of any type
of separation between blocks. This design prevented participants from developing strategies
to predict the system’s adaptive behaviour. Nevertheless, there was a brief pause after every
four blocks (20 tasks). A short one-minute break was also taken after the end of each condi-
CHAPTER 4. ASSESSING ADAPTATION TECHNIQUES 80
tion. A longer three-minute break was taken after the end of all the conditions corresponding
to a particular accuracy level.
With the exception of the 100% accuracy level, participants were not informed about
the exact level of accuracy used in the experiment. The terms “low prediction accuracy”,
“high prediction accuracy”, and “perfect prediction accuracy” were used every time a par-
ticipant was introduced to an accuracy condition. Labeling the accuracy conditions was nec-
essary so that we could later refer back to these conditions when surveying the participants.
After the end of their session, participants were asked to give estimates of the accuracy lev-
els that they had experienced. They were also asked to rank the two adaptation techniques
with respect to accuracy. We did not expect that the language that we used to describe the
accuracy levels would have any impact on the strategy that participants would follow to se-
lect items in the lists. As we mentioned earlier, participants had to complete two practice
blocks before each condition. As a result, they could develop a strategy based on their own
experience.
5.2.8 Measures
We examined three main dependent variables: (1) BlockTime, which was the time to com-
plete a single block, (2) SuggestedTime, which was the time to complete a task when the
goal item had been correctly suggested, and (3) NonSuggestedTime, which was the time to
complete a task when the goal item had not been suggested.
Since the number of successfully assisted tasks varied among accuracy levels, Sug-
gestedTime was only measured for the subset of tasks in which adaptation was correct for all
the experimental conditions. Likewise, NonSuggestedTime was only measured for the subset
of tasks in which adaptation was incorrect for all the experimental conditions. Clearly, Non-
SuggestedTime was only measured for the 60% and 80% accuracy levels. In summary, there
was one measurement per block for the first dependent variable (BlockTime), three meas-

CHAPTER 4. ASSESSING ADAPTATION TECHNIQUES 81
urements per block for the second dependent variable (SuggestedTime), and zero (100% ac-
curacy) or one (60 and 80% accuracy) measurement per block for the third dependent vari-
able (NonSuggestedTime). Errors made during the selection tasks were also recorded.
5.3 Hypotheses
Our hypotheses were as follows.
Hypothesis 4.1. BlockTime will increase as accuracy decreases.
Hypothesis 4.2. The SHRINK technique will be faster than the NORMAL technique for the
selection of suggested items. In other words, SuggestedTime will decrease when the
SHRINK technique is used.
Hypothesis 4.3. The SHRINK technique will be slower than the NORMAL technique for
the selection of non-suggested items. In other words, NonSuggestedTime will increase when
the SHRINK technique is used.
Hypothesis 4.4. As accuracy decreases, BlockTime will deteriorate faster for the SHRINK
technique than the NORMAL technique. This hypothesis is a direct outcome of Hypotheses
4.2 and 4.3.
5.4 Results
This section provides information about the collected data, documents the analyses that we
conducted, and discusses their results.
5.4.1 Data
Data for a total of 8640 locating tasks were collected. Before starting the analysis of the data,
we eliminated problems in the data that could hurt the reliability of the statistical instru-
ments. These problems and their treatment are discussed in the following paragraphs.
CHAPTER 4. ASSESSING ADAPTATION TECHNIQUES 82
Normality Assumption and Transformations
Several data distributions did not follow a normal distribution, which is an assumption of
ANOVA significance tests. The existence of positively skewed distributions was the main
problem that we identified. To address this problem and ensure the reliability of our tests, we
transformed data before performing any significance tests. This is a well-documented ap-
proach (Ferketich and Verran, 1994). Transformations resulted in distributions that were
close to normal. They also eliminated most violations of the sphericity assumption (Girden,
1992). All the three main dependent variables BlockTime, SuggestedTime and NonSuggest-
edTime were transformed using a natural logarithmic function as shown below:
lnBlockTime = ln(BlockTime)
lnSuggestedTime = ln(SuggestedTime)
lnNonSuggestedTime = ln(NonSuggestedTime)
Outliers
An adaptation technique can be vulnerable to the generation of outliers, which is something
that needs to be taken into account when comparing the techniques. Outliers, therefore, were
not omitted from the analysis, as they could give valuable information about the effect of the
tested factors. Specifically, we did not remove any outlier in the case of the dependent vari-
ables BlockTime and NonSuggestedTime. Nevertheless, the impact of outliers on the effec-
tiveness of the statistical tests was reduced after data were transformed.
In the case of SuggestedTime, we followed a different approach. As several partici-
pants reported after the end of their session, they frequently failed to identify a goal item
within the set of suggested items. This situation caused large delays as participants realized
their mistake later, after failing to locate the goal item in the set of non-highlighted items.
We decided to isolate outliers generated by such situations and analyze them independently
from the rest of the data. We used 8 seconds as the cut-off value for such outliers, rather than
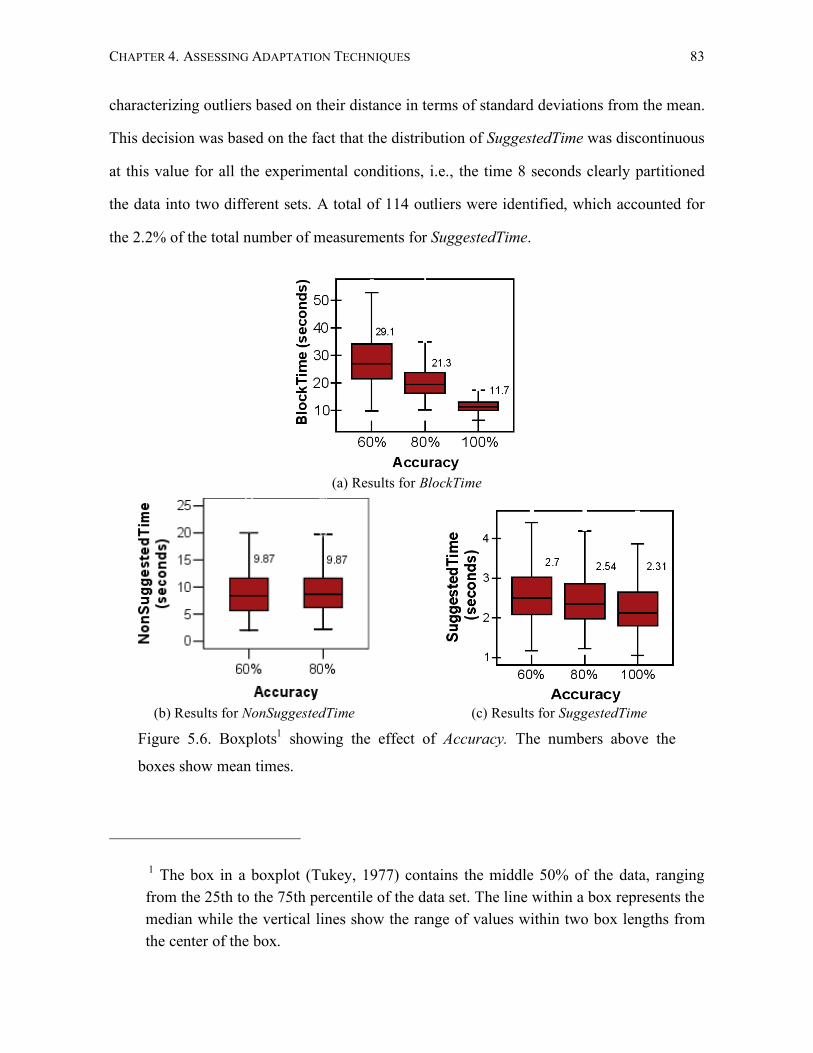
CHAPTER 4. ASSESSING ADAPTATION TECHNIQUES 83
characterizing outliers based on their distance in terms of standard deviations from the mean.
This decision was based on the fact that the distribution of SuggestedTime was discontinuous
at this value for all the experimental conditions, i.e., the time 8 seconds clearly partitioned
the data into two different sets. A total of 114 outliers were identified, which accounted for
the 2.2% of the total number of measurements for SuggestedTime.
(a) Results for BlockTime
(b) Results for NonSuggestedTime
(c) Results for SuggestedTime
Figure 5.6. Boxplots1 showing the effect of Accuracy. The numbers above the
boxes show mean times.
1 The box in a boxplot (Tukey, 1977) contains the middle 50% of the data, ranging from the 25th to the 75th percentile of the data set. The line within a box represents the median while the vertical lines show the range of values within two box lengths from the center of the box.
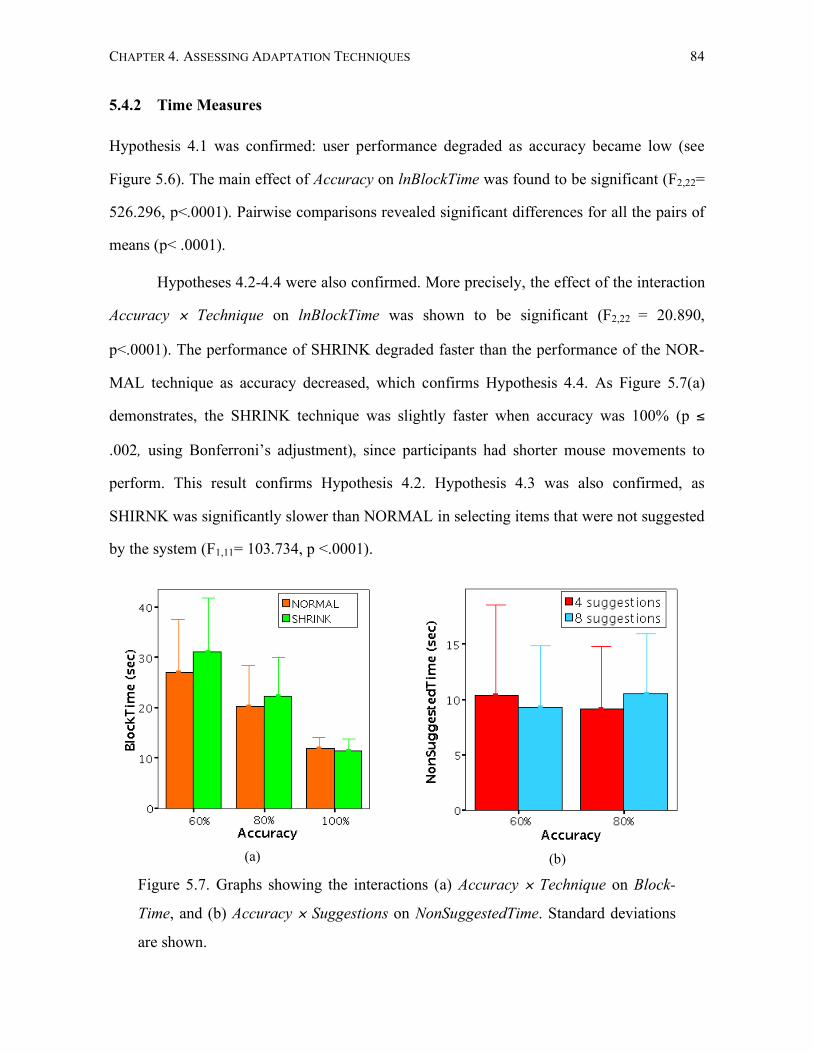
CHAPTER 4. ASSESSING ADAPTATION TECHNIQUES 84
5.4.2 Time Measures
Hypothesis 4.1 was confirmed: user performance degraded as accuracy became low (see
Figure 5.6). The main effect of Accuracy on lnBlockTime was found to be significant (F2,22=
526.296, p<.0001). Pairwise comparisons revealed significant differences for all the pairs of
means (p< .0001).
Hypotheses 4.2-4.4 were also confirmed. More precisely, the effect of the interaction
Accuracy × Technique on lnBlockTime was shown to be significant (F2,22 = 20.890,
p<.0001). The performance of SHRINK degraded faster than the performance of the NOR-
MAL technique as accuracy decreased, which confirms Hypothesis 4.4. As Figure 5.7(a)
demonstrates, the SHRINK technique was slightly faster when accuracy was 100% (p ≤
.002, using Bonferroni’s adjustment), since participants had shorter mouse movements to
perform. This result confirms Hypothesis 4.2. Hypothesis 4.3 was also confirmed, as
SHIRNK was significantly slower than NORMAL in selecting items that were not suggested
by the system (F1,11= 103.734, p <.0001).
(a) (b)
Figure 5.7. Graphs showing the interactions (a) Accuracy × Technique on Block-
Time, and (b) Accuracy × Suggestions on NonSuggestedTime. Standard deviations
are shown.
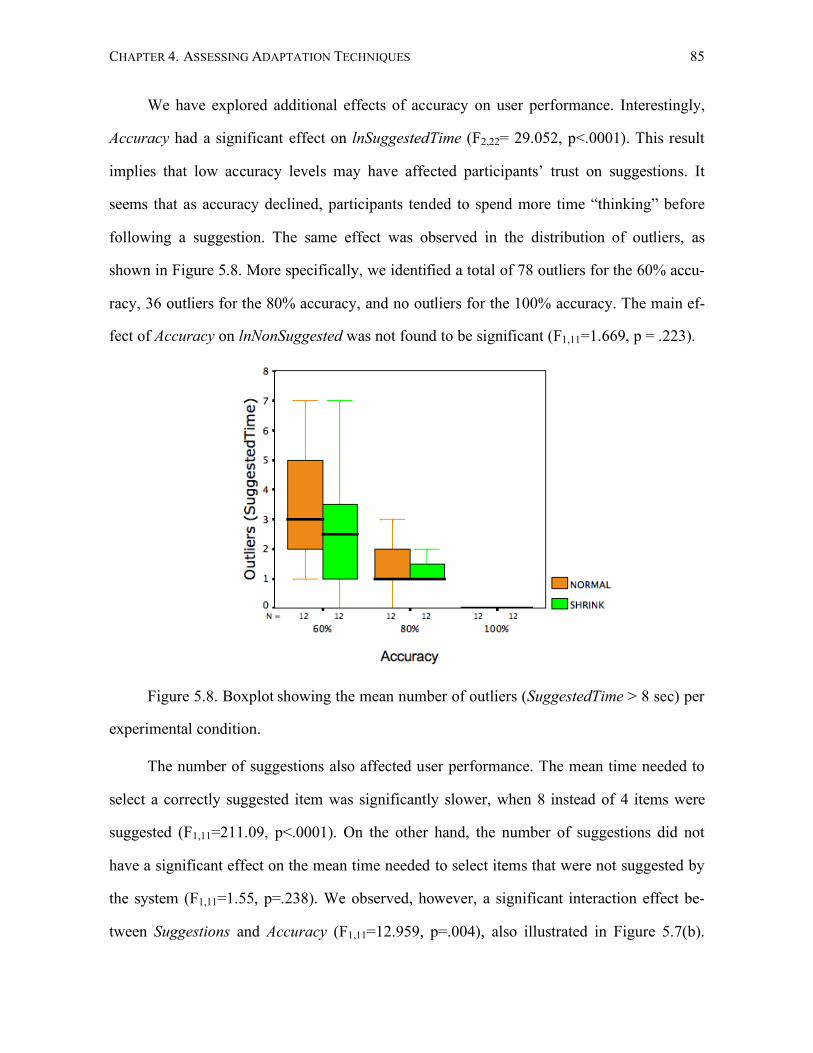
CHAPTER 4. ASSESSING ADAPTATION TECHNIQUES 85
We have explored additional effects of accuracy on user performance. Interestingly,
Accuracy had a significant effect on lnSuggestedTime (F2,22= 29.052, p<.0001). This result
implies that low accuracy levels may have affected participants’ trust on suggestions. It
seems that as accuracy declined, participants tended to spend more time “thinking” before
following a suggestion. The same effect was observed in the distribution of outliers, as
shown in Figure 5.8. More specifically, we identified a total of 78 outliers for the 60% accu-
racy, 36 outliers for the 80% accuracy, and no outliers for the 100% accuracy. The main ef-
fect of Accuracy on lnNonSuggested was not found to be significant (F1,11=1.669, p = .223).
Figure 5.8. Boxplot showing the mean number of outliers (SuggestedTime > 8 sec) per
experimental condition.
The number of suggestions also affected user performance. The mean time needed to
select a correctly suggested item was significantly slower, when 8 instead of 4 items were
suggested (F1,11=211.09, p<.0001). On the other hand, the number of suggestions did not
have a significant effect on the mean time needed to select items that were not suggested by
the system (F1,11=1.55, p=.238). We observed, however, a significant interaction effect be-
tween Suggestions and Accuracy (F1,11=12.959, p=.004), also illustrated in Figure 5.7(b).
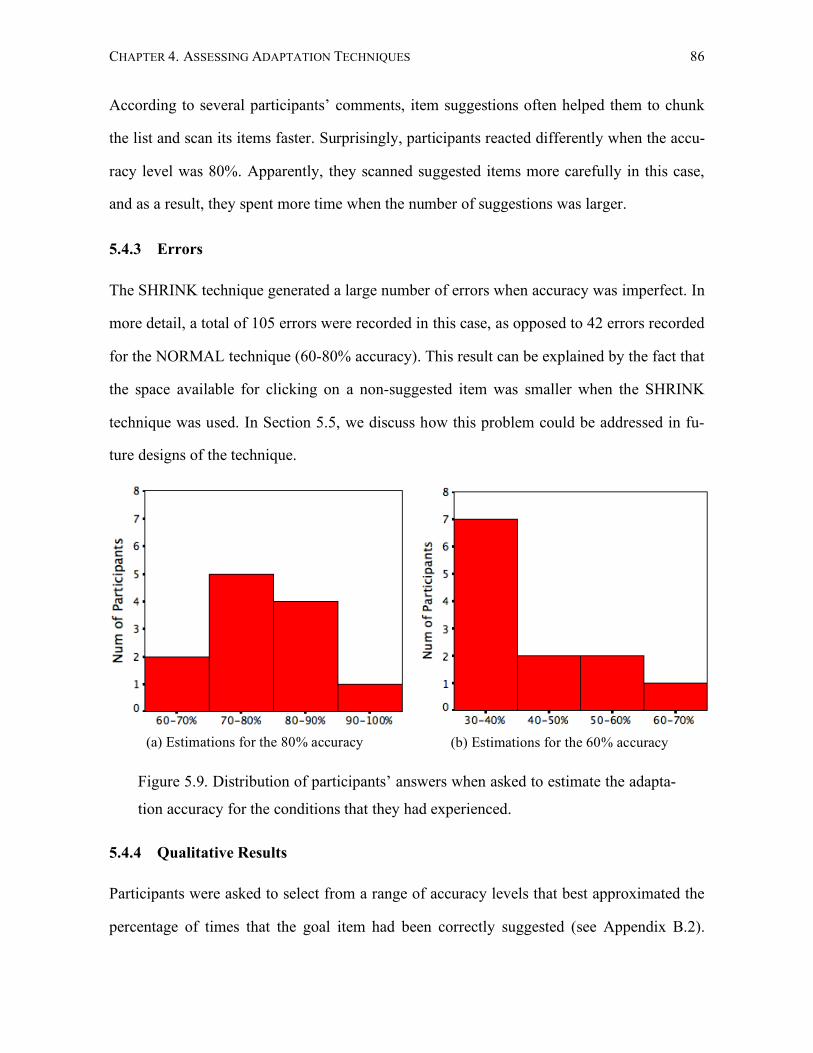
CHAPTER 4. ASSESSING ADAPTATION TECHNIQUES 86
According to several participants’ comments, item suggestions often helped them to chunk
the list and scan its items faster. Surprisingly, participants reacted differently when the accu-
racy level was 80%. Apparently, they scanned suggested items more carefully in this case,
and as a result, they spent more time when the number of suggestions was larger.
5.4.3 Errors
The SHRINK technique generated a large number of errors when accuracy was imperfect. In
more detail, a total of 105 errors were recorded in this case, as opposed to 42 errors recorded
for the NORMAL technique (60-80% accuracy). This result can be explained by the fact that
the space available for clicking on a non-suggested item was smaller when the SHRINK
technique was used. In Section 5.5, we discuss how this problem could be addressed in fu-
ture designs of the technique.
(a) Estimations for the 80% accuracy
(b) Estimations for the 60% accuracy
Figure 5.9. Distribution of participants’ answers when asked to estimate the adapta-
tion accuracy for the conditions that they had experienced.
5.4.4 Qualitative Results
Participants were asked to select from a range of accuracy levels that best approximated the
percentage of times that the goal item had been correctly suggested (see Appendix B.2).
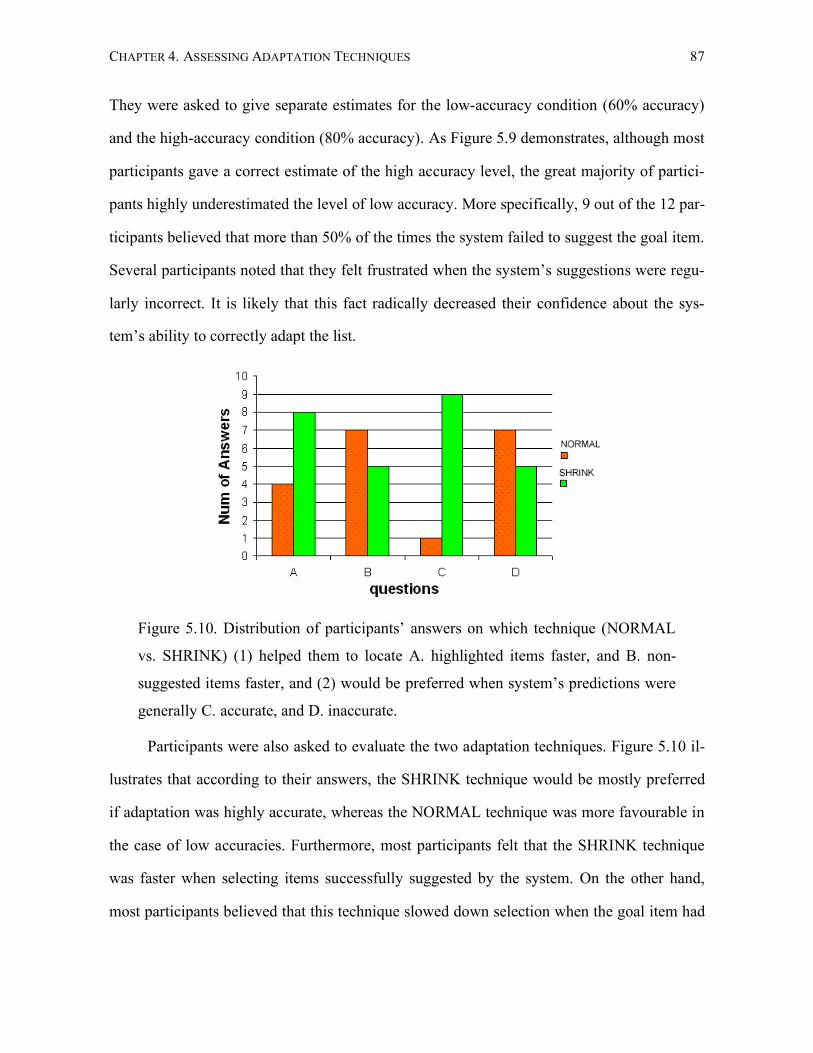
CHAPTER 4. ASSESSING ADAPTATION TECHNIQUES 87
They were asked to give separate estimates for the low-accuracy condition (60% accuracy)
and the high-accuracy condition (80% accuracy). As Figure 5.9 demonstrates, although most
participants gave a correct estimate of the high accuracy level, the great majority of partici-
pants highly underestimated the level of low accuracy. More specifically, 9 out of the 12 par-
ticipants believed that more than 50% of the times the system failed to suggest the goal item.
Several participants noted that they felt frustrated when the system’s suggestions were regu-
larly incorrect. It is likely that this fact radically decreased their confidence about the sys-
tem’s ability to correctly adapt the list.
Figure 5.10. Distribution of participants’ answers on which technique (NORMAL
vs. SHRINK) (1) helped them to locate A. highlighted items faster, and B. non-
suggested items faster, and (2) would be preferred when system’s predictions were
generally C. accurate, and D. inaccurate.
Participants were also asked to evaluate the two adaptation techniques. Figure 5.10 il-
lustrates that according to their answers, the SHRINK technique would be mostly preferred
if adaptation was highly accurate, whereas the NORMAL technique was more favourable in
the case of low accuracies. Furthermore, most participants felt that the SHRINK technique
was faster when selecting items successfully suggested by the system. On the other hand,
most participants believed that this technique slowed down selection when the goal item had
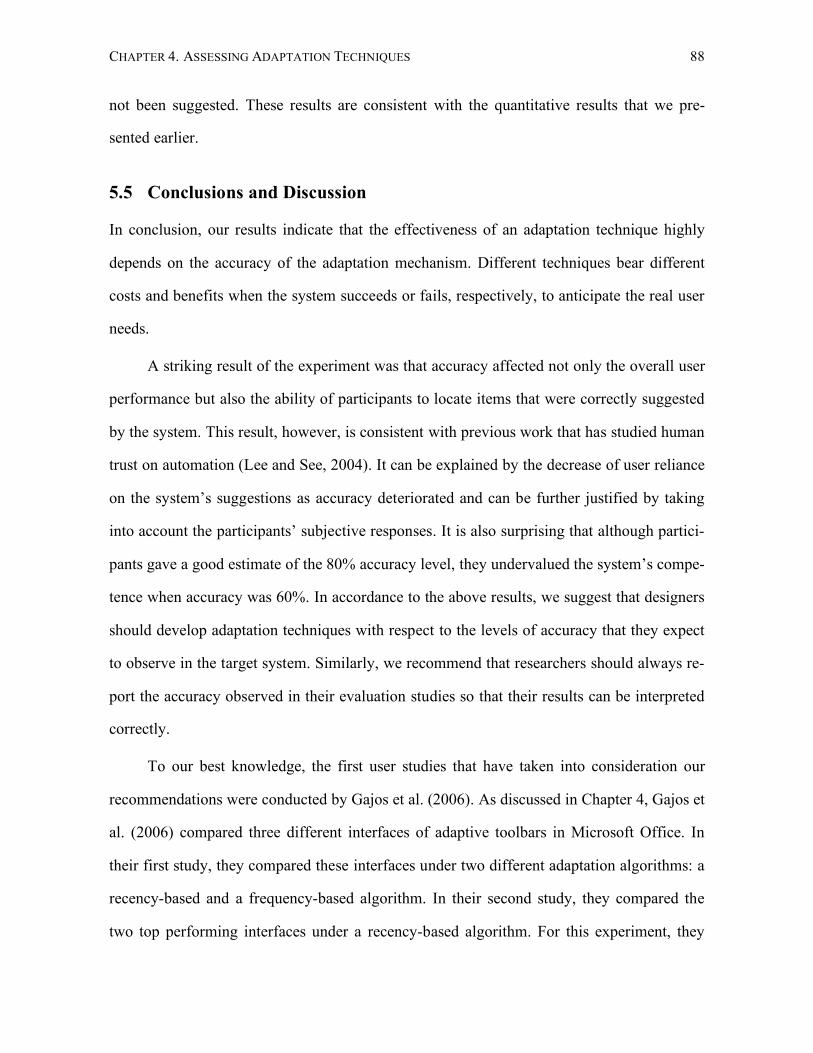
CHAPTER 4. ASSESSING ADAPTATION TECHNIQUES 88
not been suggested. These results are consistent with the quantitative results that we pre-
sented earlier.
5.5 Conclusions and Discussion
In conclusion, our results indicate that the effectiveness of an adaptation technique highly
depends on the accuracy of the adaptation mechanism. Different techniques bear different
costs and benefits when the system succeeds or fails, respectively, to anticipate the real user
needs.
A striking result of the experiment was that accuracy affected not only the overall user
performance but also the ability of participants to locate items that were correctly suggested
by the system. This result, however, is consistent with previous work that has studied human
trust on automation (Lee and See, 2004). It can be explained by the decrease of user reliance
on the system’s suggestions as accuracy deteriorated and can be further justified by taking
into account the participants’ subjective responses. It is also surprising that although partici-
pants gave a good estimate of the 80% accuracy level, they undervalued the system’s compe-
tence when accuracy was 60%. In accordance to the above results, we suggest that designers
should develop adaptation techniques with respect to the levels of accuracy that they expect
to observe in the target system. Similarly, we recommend that researchers should always re-
port the accuracy observed in their evaluation studies so that their results can be interpreted
correctly.
To our best knowledge, the first user studies that have taken into consideration our
recommendations were conducted by Gajos et al. (2006). As discussed in Chapter 4, Gajos et
al. (2006) compared three different interfaces of adaptive toolbars in Microsoft Office. In
their first study, they compared these interfaces under two different adaptation algorithms: a
recency-based and a frequency-based algorithm. In their second study, they compared the
two top performing interfaces under a recency-based algorithm. For this experiment, they
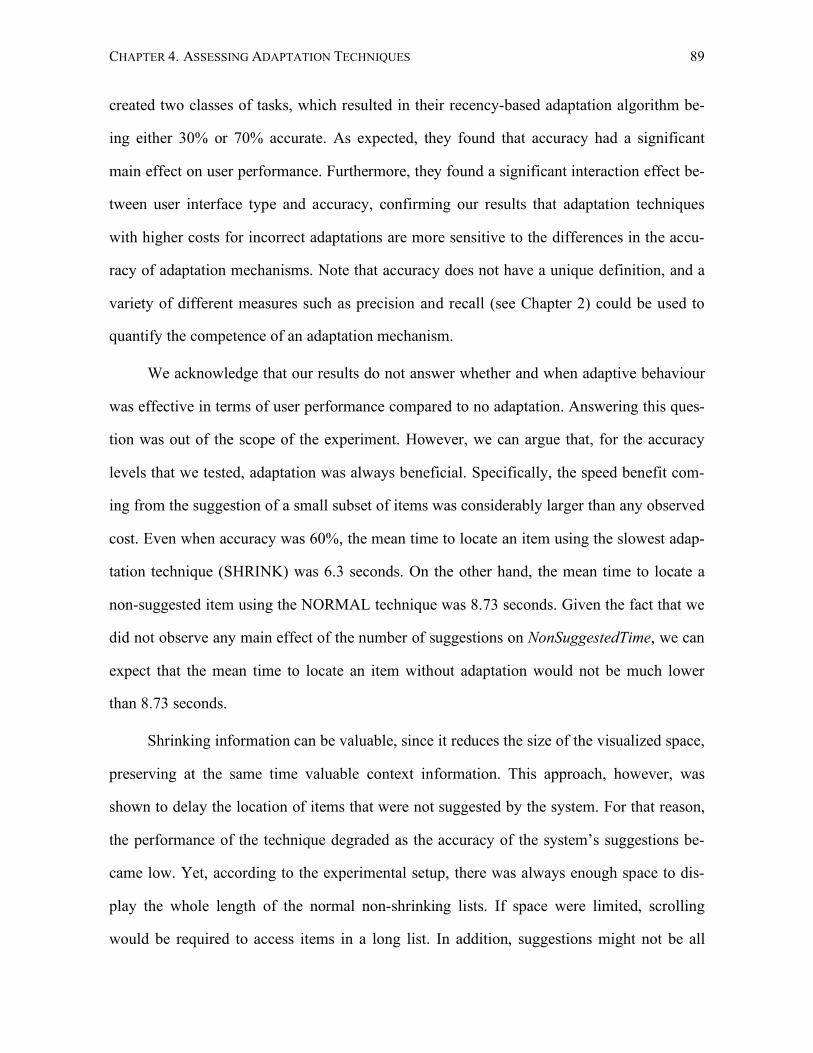
CHAPTER 4. ASSESSING ADAPTATION TECHNIQUES 89
created two classes of tasks, which resulted in their recency-based adaptation algorithm be-
ing either 30% or 70% accurate. As expected, they found that accuracy had a significant
main effect on user performance. Furthermore, they found a significant interaction effect be-
tween user interface type and accuracy, confirming our results that adaptation techniques
with higher costs for incorrect adaptations are more sensitive to the differences in the accu-
racy of adaptation mechanisms. Note that accuracy does not have a unique definition, and a
variety of different measures such as precision and recall (see Chapter 2) could be used to
quantify the competence of an adaptation mechanism.
We acknowledge that our results do not answer whether and when adaptive behaviour
was effective in terms of user performance compared to no adaptation. Answering this ques-
tion was out of the scope of the experiment. However, we can argue that, for the accuracy
levels that we tested, adaptation was always beneficial. Specifically, the speed benefit com-
ing from the suggestion of a small subset of items was considerably larger than any observed
cost. Even when accuracy was 60%, the mean time to locate an item using the slowest adap-
tation technique (SHRINK) was 6.3 seconds. On the other hand, the mean time to locate a
non-suggested item using the NORMAL technique was 8.73 seconds. Given the fact that we
did not observe any main effect of the number of suggestions on NonSuggestedTime, we can
expect that the mean time to locate an item without adaptation would not be much lower
than 8.73 seconds.
Shrinking information can be valuable, since it reduces the size of the visualized space,
preserving at the same time valuable context information. This approach, however, was
shown to delay the location of items that were not suggested by the system. For that reason,
the performance of the technique degraded as the accuracy of the system’s suggestions be-
came low. Yet, according to the experimental setup, there was always enough space to dis-
play the whole length of the normal non-shrinking lists. If space were limited, scrolling
would be required to access items in a long list. In addition, suggestions might not be all
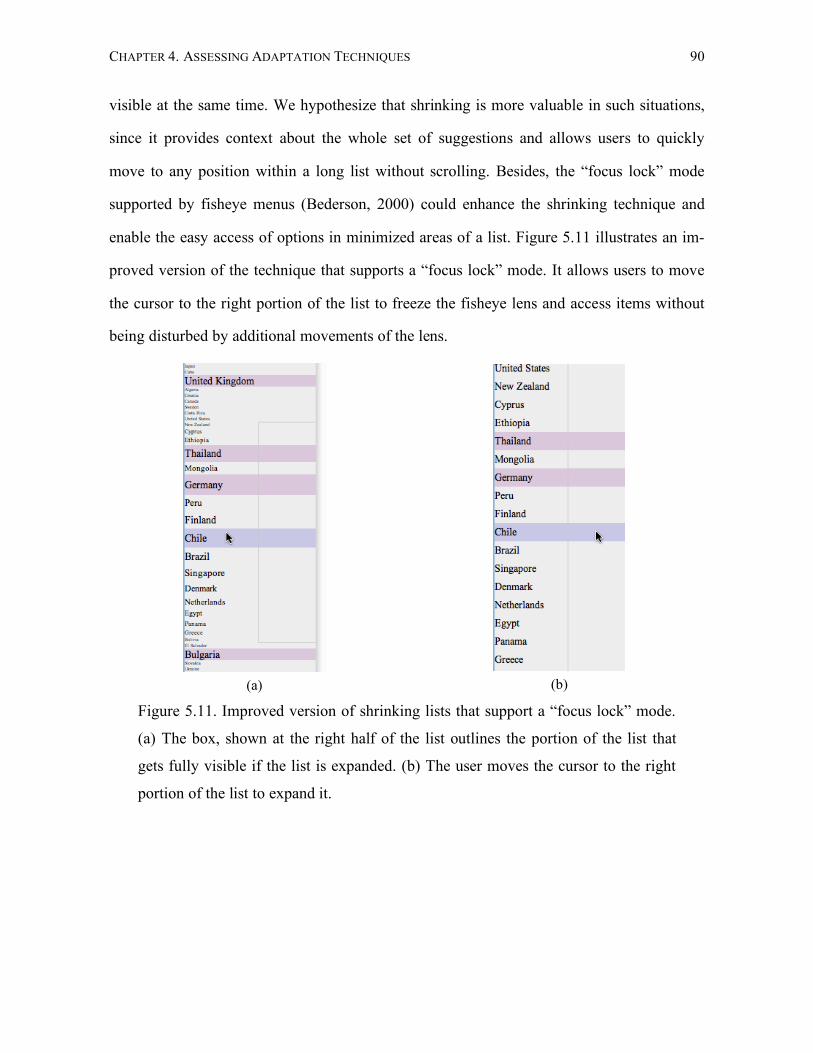
CHAPTER 4. ASSESSING ADAPTATION TECHNIQUES 90
visible at the same time. We hypothesize that shrinking is more valuable in such situations,
since it provides context about the whole set of suggestions and allows users to quickly
move to any position within a long list without scrolling. Besides, the “focus lock” mode
supported by fisheye menus (Bederson, 2000) could enhance the shrinking technique and
enable the easy access of options in minimized areas of a list. Figure 5.11 illustrates an im-
proved version of the technique that supports a “focus lock” mode. It allows users to move
the cursor to the right portion of the list to freeze the fisheye lens and access items without
being disturbed by additional movements of the lens.
(a)
(b)
Figure 5.11. Improved version of shrinking lists that support a “focus lock” mode.
(a) The box, shown at the right half of the list outlines the portion of the list that
gets fully visible if the list is expanded. (b) The user moves the cursor to the right
portion of the list to expand it.
91
Chapter 6
Bubbling Menus: A New Technique of Personalized
Menus
This chapter documents the process that we followed to design bubbling menus, a new per-
sonalization technique for cascading drop-down (or pull-down) menus. The new technique
bears similarities with the techniques that we have considered so far in the thesis. First, it
preserves the original structure of the interface and, second, it provides several mechanisms
of direct user control. However, in contrast to Chapters 3 and 4, where our analysis focused
on techniques that aid navigation and visual search, this chapter focuses on pointing per-
formance.
The process for the design of bubbling menus involved several iterations. It started
with an early experiment, moved to the first design of the technique, continued with the
evaluation of the first design, and ended with a second design and its final evaluation. This
process has been conducted in accordance with our recommendations presented in Chapter
4. In particular, the effect of adaptation accuracy has been greatly taken into account. The
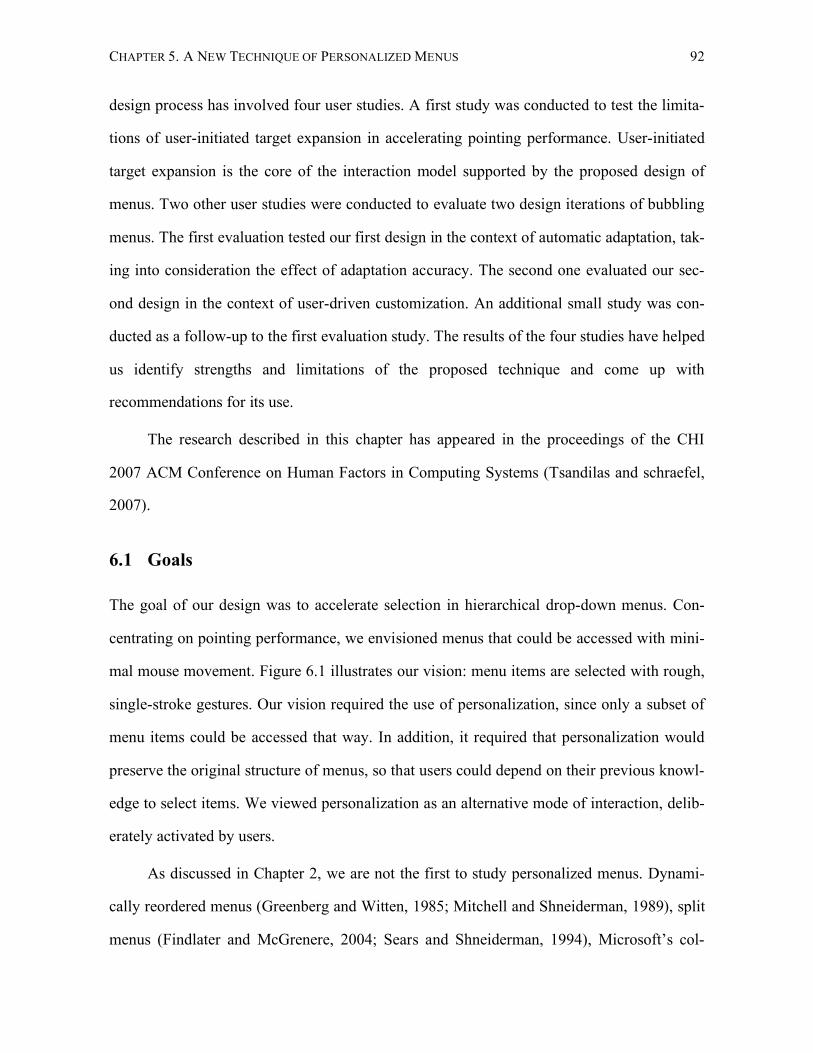
CHAPTER 5. A NEW TECHNIQUE OF PERSONALIZED MENUS 92
design process has involved four user studies. A first study was conducted to test the limita-
tions of user-initiated target expansion in accelerating pointing performance. User-initiated
target expansion is the core of the interaction model supported by the proposed design of
menus. Two other user studies were conducted to evaluate two design iterations of bubbling
menus. The first evaluation tested our first design in the context of automatic adaptation, tak-
ing into consideration the effect of adaptation accuracy. The second one evaluated our sec-
ond design in the context of user-driven customization. An additional small study was con-
ducted as a follow-up to the first evaluation study. The results of the four studies have helped
us identify strengths and limitations of the proposed technique and come up with
recommendations for its use.
The research described in this chapter has appeared in the proceedings of the CHI
2007 ACM Conference on Human Factors in Computing Systems (Tsandilas and schraefel,
2007).
6.1 Goals
The goal of our design was to accelerate selection in hierarchical drop-down menus. Con-
centrating on pointing performance, we envisioned menus that could be accessed with mini-
mal mouse movement. Figure 6.1 illustrates our vision: menu items are selected with rough,
single-stroke gestures. Our vision required the use of personalization, since only a subset of
menu items could be accessed that way. In addition, it required that personalization would
preserve the original structure of menus, so that users could depend on their previous knowl-
edge to select items. We viewed personalization as an alternative mode of interaction, delib-
erately activated by users.
As discussed in Chapter 2, we are not the first to study personalized menus. Dynami-
cally reordered menus (Greenberg and Witten, 1985; Mitchell and Shneiderman, 1989), split
menus (Findlater and McGrenere, 2004; Sears and Shneiderman, 1994), Microsoft’s col-
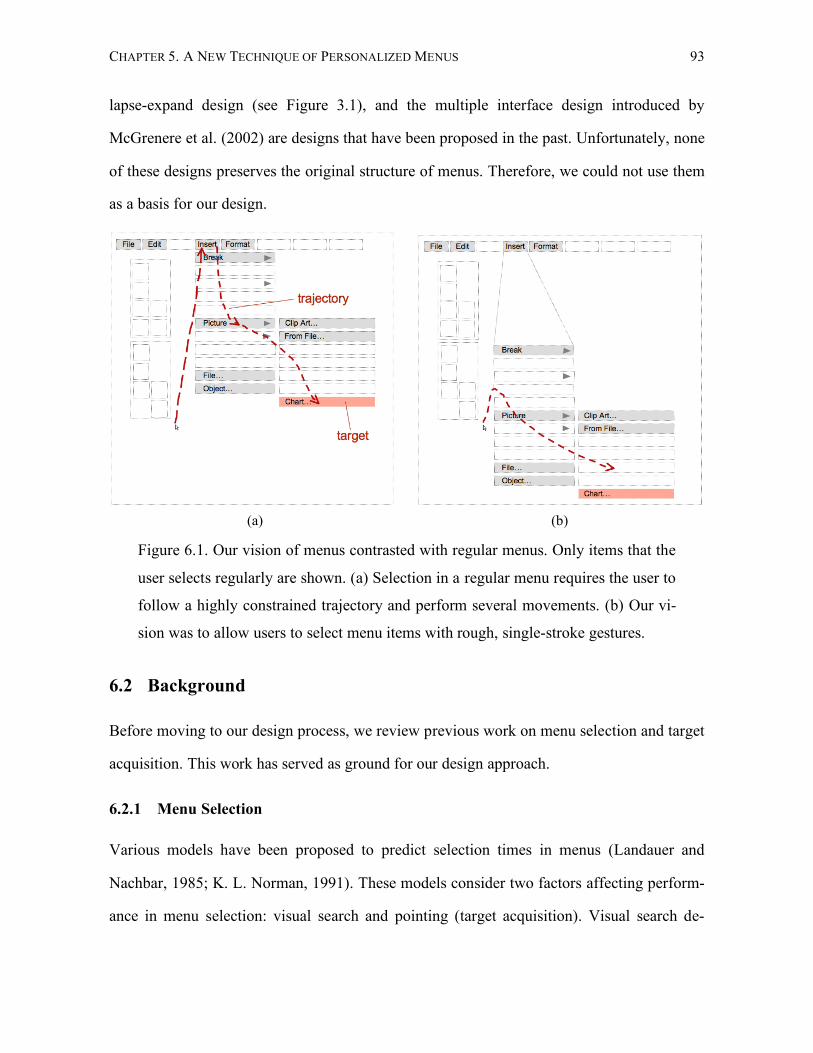
CHAPTER 5. A NEW TECHNIQUE OF PERSONALIZED MENUS 93
lapse-expand design (see Figure 3.1), and the multiple interface design introduced by
McGrenere et al. (2002) are designs that have been proposed in the past. Unfortunately, none
of these designs preserves the original structure of menus. Therefore, we could not use them
as a basis for our design.
(a)
(b)
Figure 6.1. Our vision of menus contrasted with regular menus. Only items that the
user selects regularly are shown. (a) Selection in a regular menu requires the user to
follow a highly constrained trajectory and perform several movements. (b) Our vi-
sion was to allow users to select menu items with rough, single-stroke gestures.
6.2 Background
Before moving to our design process, we review previous work on menu selection and target
acquisition. This work has served as ground for our design approach.
6.2.1 Menu Selection
Various models have been proposed to predict selection times in menus (Landauer and
Nachbar, 1985; K. L. Norman, 1991). These models consider two factors affecting perform-
ance in menu selection: visual search and pointing (target acquisition). Visual search de-
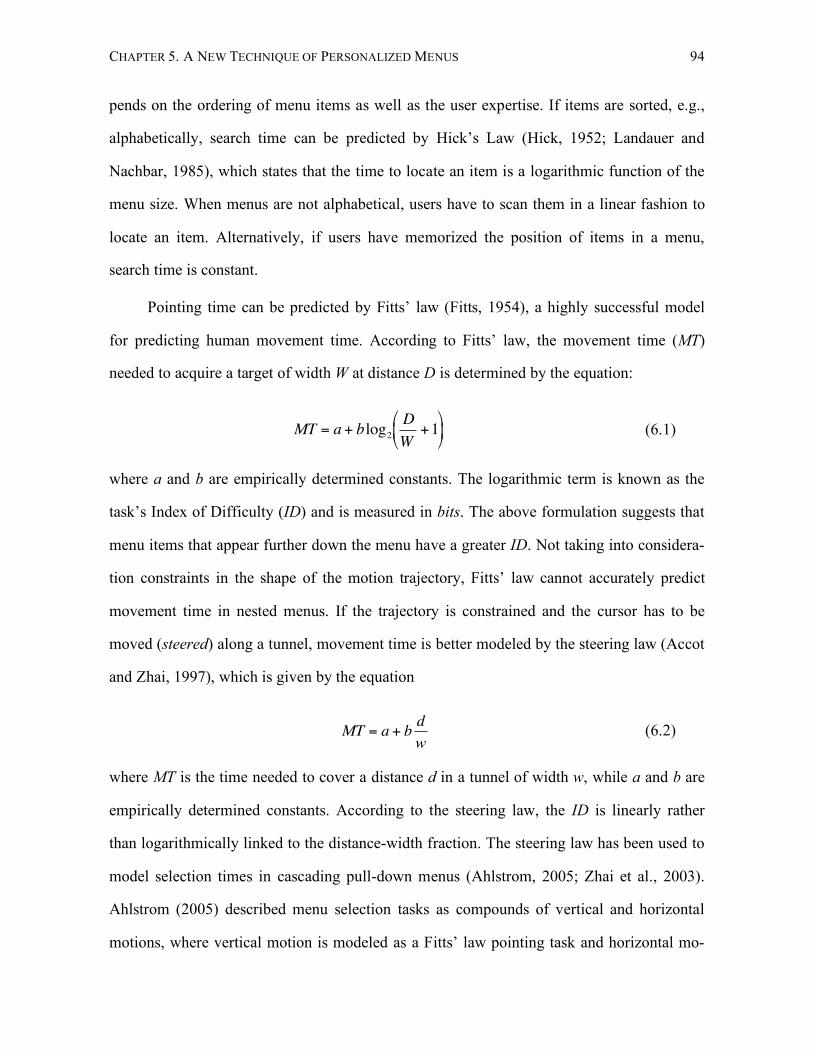
CHAPTER 5. A NEW TECHNIQUE OF PERSONALIZED MENUS 94
pends on the ordering of menu items as well as the user expertise. If items are sorted, e.g.,
alphabetically, search time can be predicted by Hick’s Law (Hick, 1952; Landauer and
Nachbar, 1985), which states that the time to locate an item is a logarithmic function of the
menu size. When menus are not alphabetical, users have to scan them in a linear fashion to
locate an item. Alternatively, if users have memorized the position of items in a menu,
search time is constant.
Pointing time can be predicted by Fitts’ law (Fitts, 1954), a highly successful model
for predicting human movement time. According to Fitts’ law, the movement time (MT)
needed to acquire a target of width W at distance D is determined by the equation:
!
MT = a + blog2D
W+1
"
# $
%
& ' (6.1)
where a and b are empirically determined constants. The logarithmic term is known as the
task’s Index of Difficulty (ID) and is measured in bits. The above formulation suggests that
menu items that appear further down the menu have a greater ID. Not taking into considera-
tion constraints in the shape of the motion trajectory, Fitts’ law cannot accurately predict
movement time in nested menus. If the trajectory is constrained and the cursor has to be
moved (steered) along a tunnel, movement time is better modeled by the steering law (Accot
and Zhai, 1997), which is given by the equation
!
MT = a + bd
w (6.2)
where MT is the time needed to cover a distance d in a tunnel of width w, while a and b are
empirically determined constants. According to the steering law, the ID is linearly rather
than logarithmically linked to the distance-width fraction. The steering law has been used to
model selection times in cascading pull-down menus (Ahlstrom, 2005; Zhai et al., 2003).
Ahlstrom (2005) described menu selection tasks as compounds of vertical and horizontal
motions, where vertical motion is modeled as a Fitts’ law pointing task and horizontal mo-
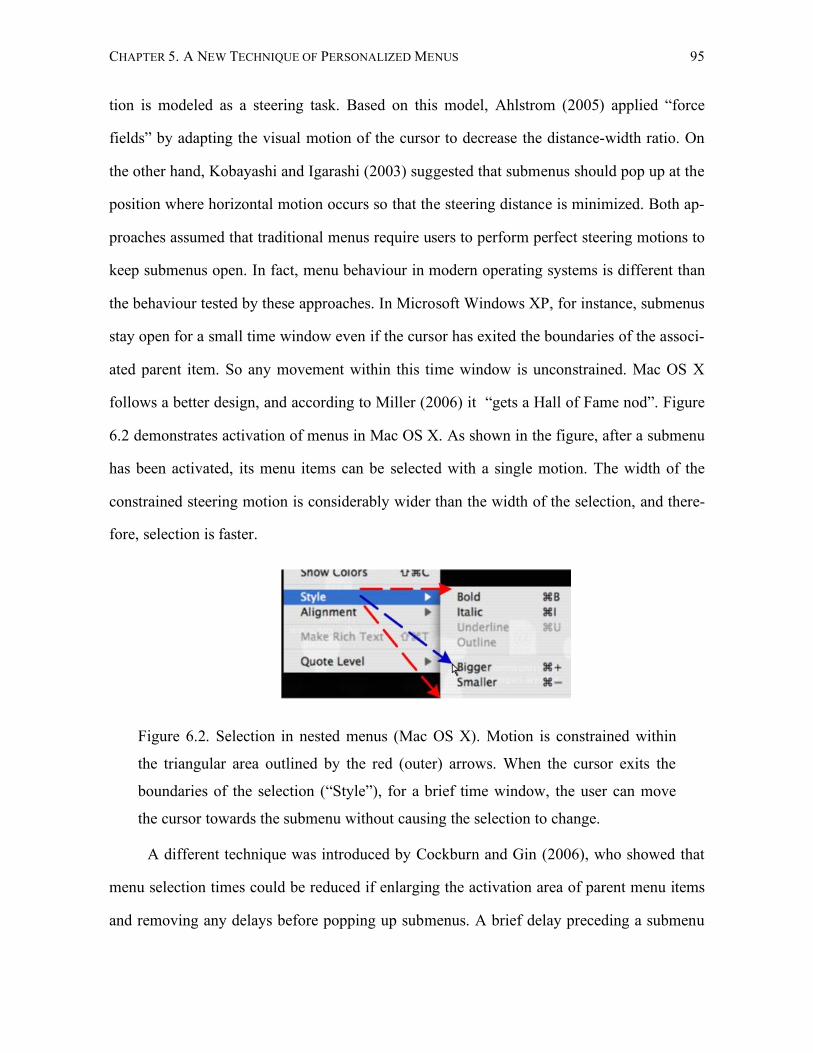
CHAPTER 5. A NEW TECHNIQUE OF PERSONALIZED MENUS 95
tion is modeled as a steering task. Based on this model, Ahlstrom (2005) applied “force
fields” by adapting the visual motion of the cursor to decrease the distance-width ratio. On
the other hand, Kobayashi and Igarashi (2003) suggested that submenus should pop up at the
position where horizontal motion occurs so that the steering distance is minimized. Both ap-
proaches assumed that traditional menus require users to perform perfect steering motions to
keep submenus open. In fact, menu behaviour in modern operating systems is different than
the behaviour tested by these approaches. In Microsoft Windows XP, for instance, submenus
stay open for a small time window even if the cursor has exited the boundaries of the associ-
ated parent item. So any movement within this time window is unconstrained. Mac OS X
follows a better design, and according to Miller (2006) it “gets a Hall of Fame nod”. Figure
6.2 demonstrates activation of menus in Mac OS X. As shown in the figure, after a submenu
has been activated, its menu items can be selected with a single motion. The width of the
constrained steering motion is considerably wider than the width of the selection, and there-
fore, selection is faster.
Figure 6.2. Selection in nested menus (Mac OS X). Motion is constrained within
the triangular area outlined by the red (outer) arrows. When the cursor exits the
boundaries of the selection (“Style”), for a brief time window, the user can move
the cursor towards the submenu without causing the selection to change.
A different technique was introduced by Cockburn and Gin (2006), who showed that
menu selection times could be reduced if enlarging the activation area of parent menu items
and removing any delays before popping up submenus. A brief delay preceding a submenu
CHAPTER 5. A NEW TECHNIQUE OF PERSONALIZED MENUS 96
popup is commonly used to (1) prevent fluttering and (2) force users to target the correct
parent item before starting a steering motion, and (3) allow for optimal diagonal movements
as shown in Figure 6.2. When the activation area of a parent item grows, targeting this item
becomes easier, and the need for such a delay disappears. The results reported by Cockburn
and Gin (2006) suggest that a delay might be inappropriate even if the activation area of par-
ent menu items was not enlarged. This result challenges exiting practices in commercial
software, but Cockburn and Gin (2006) acknowledge that a zero delay could “harm acquisi-
tion because users must accurately steer across the item to reach the correct cascade menu”.
We examine this issue in more detail later in this chapter.
6.2.2 Improving Pointing Performance
Several interaction techniques have used Fitts’ law to improve target acquisition either by
decreasing the distance D (Baudisch et al., 2003) or by increasing the width W (Cockburn
and Firth, 2003; McGuffin and Balakrishnan, 2002; Zhai et al., 2003). Decreasing the dis-
tance can be achieved by either bringing a target closer to the cursor’s position (Baudisch et
al., 2003) or by jumping the cursor closer to the target (Guirard et al., 2004). The width of a
target can be increased by simply expanding the target as the cursor approaches the target
(McGuffin and Balakrishnan, 2002; Zhai et al., 2003). This technique is used by the MacOS
X Dock. Instead of expanding the actual target, Cockburn and Firth (2003) tested a similar
technique where a bubble of a fixed radius (e.g. 40 pixels) appears around the target as it is
approached by the cursor within a fixed distance (e.g., 50 pixels). McGuffin and Balakrish-
nan (2002) showed that dynamically expanding targets can improve selection time even
when expansion occurs after 90% of the distance to the target has been traveled. Zhai et al.
(2003) revalidated this result and found that selection time can improve even when target
expansion is unpredictable. Nevertheless, they observed that target expansion inflated error
rates.
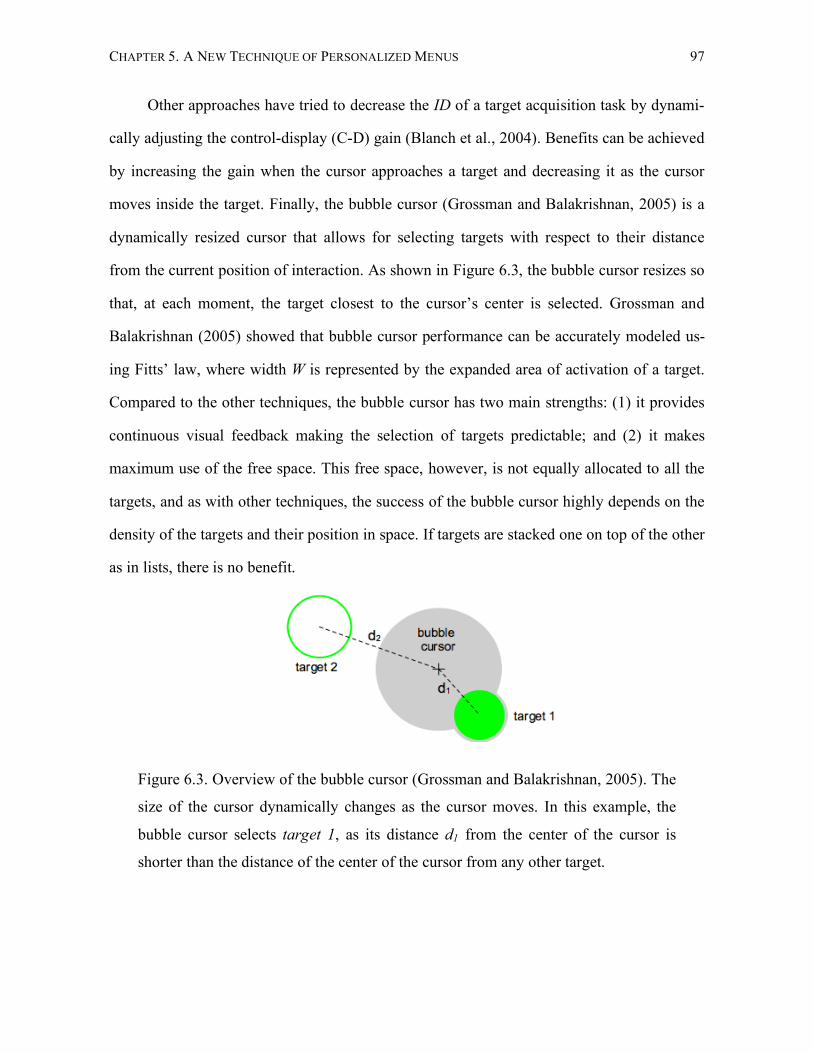
CHAPTER 5. A NEW TECHNIQUE OF PERSONALIZED MENUS 97
Other approaches have tried to decrease the ID of a target acquisition task by dynami-
cally adjusting the control-display (C-D) gain (Blanch et al., 2004). Benefits can be achieved
by increasing the gain when the cursor approaches a target and decreasing it as the cursor
moves inside the target. Finally, the bubble cursor (Grossman and Balakrishnan, 2005) is a
dynamically resized cursor that allows for selecting targets with respect to their distance
from the current position of interaction. As shown in Figure 6.3, the bubble cursor resizes so
that, at each moment, the target closest to the cursor’s center is selected. Grossman and
Balakrishnan (2005) showed that bubble cursor performance can be accurately modeled us-
ing Fitts’ law, where width W is represented by the expanded area of activation of a target.
Compared to the other techniques, the bubble cursor has two main strengths: (1) it provides
continuous visual feedback making the selection of targets predictable; and (2) it makes
maximum use of the free space. This free space, however, is not equally allocated to all the
targets, and as with other techniques, the success of the bubble cursor highly depends on the
density of the targets and their position in space. If targets are stacked one on top of the other
as in lists, there is no benefit.
Figure 6.3. Overview of the bubble cursor (Grossman and Balakrishnan, 2005). The
size of the cursor dynamically changes as the cursor moves. In this example, the
bubble cursor selects target 1, as its distance d1 from the center of the cursor is
shorter than the distance of the center of the cursor from any other target.
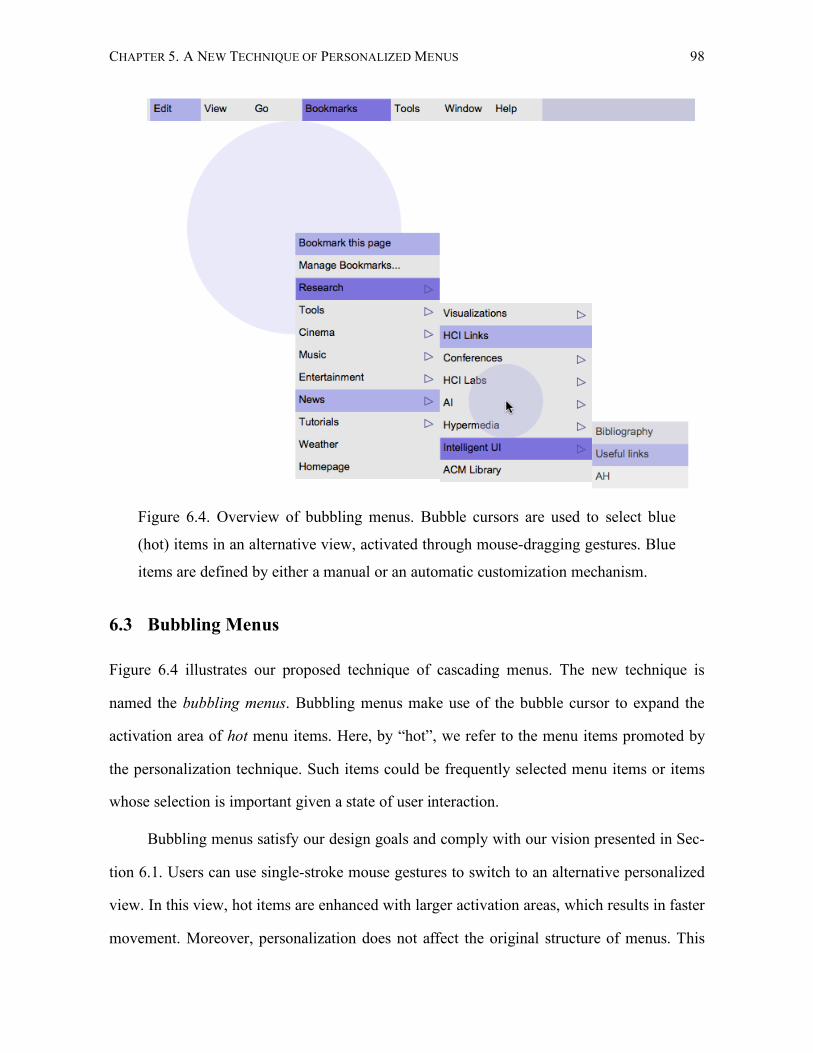
CHAPTER 5. A NEW TECHNIQUE OF PERSONALIZED MENUS 98
Figure 6.4. Overview of bubbling menus. Bubble cursors are used to select blue
(hot) items in an alternative view, activated through mouse-dragging gestures. Blue
items are defined by either a manual or an automatic customization mechanism.
6.3 Bubbling Menus
Figure 6.4 illustrates our proposed technique of cascading menus. The new technique is
named the bubbling menus. Bubbling menus make use of the bubble cursor to expand the
activation area of hot menu items. Here, by “hot”, we refer to the menu items promoted by
the personalization technique. Such items could be frequently selected menu items or items
whose selection is important given a state of user interaction.
Bubbling menus satisfy our design goals and comply with our vision presented in Sec-
tion 6.1. Users can use single-stroke mouse gestures to switch to an alternative personalized
view. In this view, hot items are enhanced with larger activation areas, which results in faster
movement. Moreover, personalization does not affect the original structure of menus. This
CHAPTER 5. A NEW TECHNIQUE OF PERSONALIZED MENUS 99
property makes the proposed design particularly useful for expert users, who, having memo-
rized a menu structure, can select items with directional mouse gestures. At the same time, it
does not prevent novice users from learning the position of items in a menu. Besides, unlike
other designs, bubbling menus let users activate pull-down menus by initiating the selection
gesture far from a menubar.
Bubbling menus support two different views, the goal of which is to provide a clear
separation between the traditional behaviour of menus and adaptation. When users use the
left mouse button to interact with bubbling menus, the menu’s behaviour is almost identical
to the behaviour of regular menus. The difference is that hot items are highlighted with a
subtle background colour, letting users know which items could be accessed with the bubble
cursor. The bubble cursor appears when users switch to the alternative view of the menus.
Switching to the alternative (adapted) view of a menu is initiated by pressing and dragging
the right mouse button. As shown in Figure 6.4, interaction can result in the activation of two
bubbles: the first bubble is used to select a menu category from the menubar; and the second
bubble is used to select a menu item within an open menu. The design incorporates several
motion-aware techniques to improve motor control and facilitate menu selection.
Selection in bubbling menus requires users to make decisions about which of the two
views to use to select menu items. If users knew beforehand which items could be selected
with the bubble cursor, such decisions would be fast. However, a user may not be always
able to remember or predict which items are classified as hot. Our work has investigated this
problem and tried to explore designs that would minimize the overhead associated with deci-
sion-making. As a first step, we conducted a preliminary experiment, testing the cost of deci-
sion-making in the context of simple pointing tasks. Taking into consideration the results of
this experiment, we designed a first version of bubbling menus. This version did not include
the full capabilities of our final design. For instance, it did not support menu activation far
from a menubar. It allowed us, however, to test several aspects of our approach through two
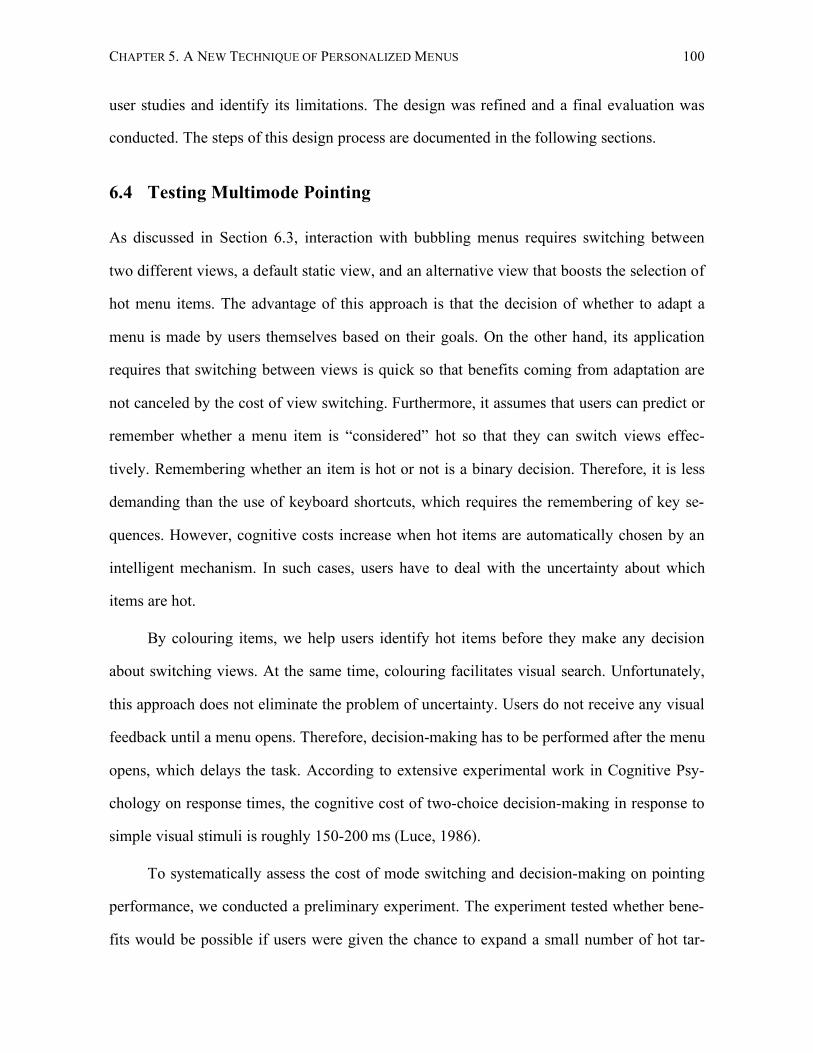
CHAPTER 5. A NEW TECHNIQUE OF PERSONALIZED MENUS 100
user studies and identify its limitations. The design was refined and a final evaluation was
conducted. The steps of this design process are documented in the following sections.
6.4 Testing Multimode Pointing
As discussed in Section 6.3, interaction with bubbling menus requires switching between
two different views, a default static view, and an alternative view that boosts the selection of
hot menu items. The advantage of this approach is that the decision of whether to adapt a
menu is made by users themselves based on their goals. On the other hand, its application
requires that switching between views is quick so that benefits coming from adaptation are
not canceled by the cost of view switching. Furthermore, it assumes that users can predict or
remember whether a menu item is “considered” hot so that they can switch views effec-
tively. Remembering whether an item is hot or not is a binary decision. Therefore, it is less
demanding than the use of keyboard shortcuts, which requires the remembering of key se-
quences. However, cognitive costs increase when hot items are automatically chosen by an
intelligent mechanism. In such cases, users have to deal with the uncertainty about which
items are hot.
By colouring items, we help users identify hot items before they make any decision
about switching views. At the same time, colouring facilitates visual search. Unfortunately,
this approach does not eliminate the problem of uncertainty. Users do not receive any visual
feedback until a menu opens. Therefore, decision-making has to be performed after the menu
opens, which delays the task. According to extensive experimental work in Cognitive Psy-
chology on response times, the cognitive cost of two-choice decision-making in response to
simple visual stimuli is roughly 150-200 ms (Luce, 1986).
To systematically assess the cost of mode switching and decision-making on pointing
performance, we conducted a preliminary experiment. The experiment tested whether bene-
fits would be possible if users were given the chance to expand a small number of hot tar-
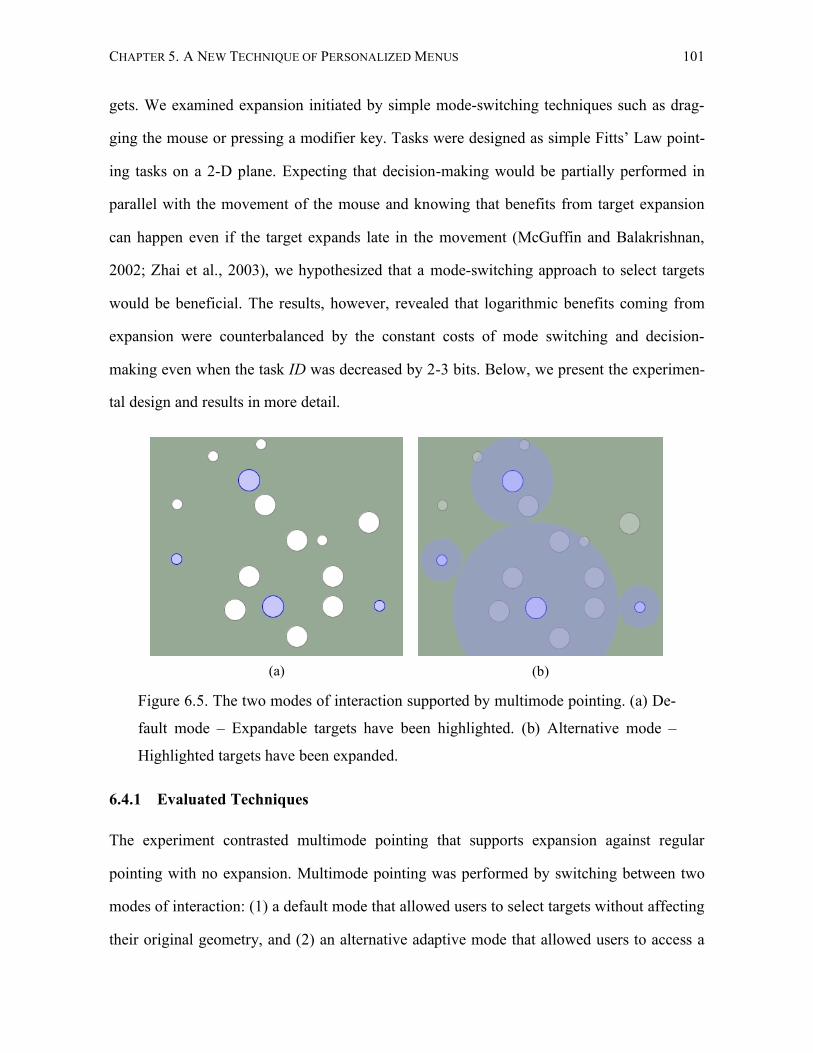
CHAPTER 5. A NEW TECHNIQUE OF PERSONALIZED MENUS 101
gets. We examined expansion initiated by simple mode-switching techniques such as drag-
ging the mouse or pressing a modifier key. Tasks were designed as simple Fitts’ Law point-
ing tasks on a 2-D plane. Expecting that decision-making would be partially performed in
parallel with the movement of the mouse and knowing that benefits from target expansion
can happen even if the target expands late in the movement (McGuffin and Balakrishnan,
2002; Zhai et al., 2003), we hypothesized that a mode-switching approach to select targets
would be beneficial. The results, however, revealed that logarithmic benefits coming from
expansion were counterbalanced by the constant costs of mode switching and decision-
making even when the task ID was decreased by 2-3 bits. Below, we present the experimen-
tal design and results in more detail.
(a)
(b)
Figure 6.5. The two modes of interaction supported by multimode pointing. (a) De-
fault mode – Expandable targets have been highlighted. (b) Alternative mode –
Highlighted targets have been expanded.
6.4.1 Evaluated Techniques
The experiment contrasted multimode pointing that supports expansion against regular
pointing with no expansion. Multimode pointing was performed by switching between two
modes of interaction: (1) a default mode that allowed users to select targets without affecting
their original geometry, and (2) an alternative adaptive mode that allowed users to access a
CHAPTER 5. A NEW TECHNIQUE OF PERSONALIZED MENUS 102
small subset of targets (hot targets), hypothetically faster, by expanding their motor space.
Targets were represented as circles and were spread in a 2D space, as shown in Figure 6.5.
Expandable targets were highlighted with a light-blue background colour.
As shown in Figure 6.5, expansion was implemented by introducing a bubble around
the expanded target (Cockburn and Firth, 2003). The bubble of a target could cover the area
of non-expandable targets. Only expanded targets could be acquired when the adaptive mode
was activated. Semitransparent bubbles were used to minimize visual occlusion. We tested
two techniques for switching between modes and selecting expended targets. The first tech-
nique required the user to press a key (the key “z”) to switch from the default to the adaptive
mode. After releasing the key, the default mode was activated again. In the alternative mode,
expanded targets were selected by clicking within the area of their bubble while the key was
pressed. The second technique did not require the use of a keyboard. The user could drag the
mouse while pressing the right mouse button to activate the alternative mode. A target was
selected by releasing the button within the area of the target’s bubble.
6.4.2 Apparatus and Participants
The experiment was conducted on a 2GHz P4 PC with 1GB RAM, running Windows XP. A
21-inch monitor was used at a resolution 1280 by 1024 pixels. The software was imple-
mented in Java. Six male and six female volunteers, 24-35 years old participated in the ex-
periment. All the participants used the right hand to interact with the mouse.
6.4.3 Task
Each participant had to perform a series of 2D pointing tasks. For each task, the participant
had to move the mouse to a home position marked by a small red circle, rest there for 0.5
second, and start moving to the target as soon as it appeared on the screen. The home posi-
tion was different for each task. The goal target was marked with a red overlaying circle and
was surrounded by a set of 15 distracter targets (see Figure 6.6). The diameter of targets was
CHAPTER 5. A NEW TECHNIQUE OF PERSONALIZED MENUS 103
either 16 or 32 pixels. Each participant tested three techniques to select targets: (1) normal
clicking (Static), (2) clicking plus switching to the adaptive mode by key pressing
(KeyPress), and (3) clicking plus switching to the adaptive mode by dragging (Dragging).
In the case of KeyPress and Dragging, either two or four out of the 15 targets were marked
as expandable. The goal target was expandable with a 50% probability. Its size was ex-
panded by a factor of four or eight in an unpredictable manner.
Figure 6.6. Experimental task. After the task begins, the participant has to select the
target within the red circle. Blue targets are expanded by switching to the alterna-
tive mode.
The experimental task simulated the situation in which an intelligent system identifies
a small number of hot targets and suggests them to the user by highlighting them. After be-
ing highlighted, targets become expandable. Ideally, the intelligent system will always sug-
gest the targets that the user looks for. The experimental task tested a scenario in which sys-
tem suggestions were wrong with a 50% probability. Trying to control the uncertainty about
when the system fails to highlight a goal target, we tested two different conditions. Under the
first condition, participants knew whether a goal target was expandable before starting a task
(predictable adaptation). Under the second condition, participants had no information about
whether the goal target was expandable (unpredictable adaptation). The first condition simu-
lated the situation in which either the prediction mechanism is transparent to the user or tar-
get suggestions are static, e.g., they have been manually set by the user, or change slowly
over time. Predictability was simulated by informing participants before the beginning of
CHAPTER 5. A NEW TECHNIQUE OF PERSONALIZED MENUS 104
each task about whether the goal target was expandable or not. Before a participant started a
task, a blue square surrounding the home position indicated that the goal target would be ex-
pandable. The lack of the blue square indicated that the goal target was not expandable.
6.4.4 Design and Procedure
A full factorial within-participants design was used. The independent variables were the pre-
dictability condition Predictable (True, False), the selection technique Technique (Static,
KeyPress, Dragging), the type of goal target Suggested (True, False), the distance D (256,
512, 1024 pixels), the width W (16, 32), the expansion-width-to-width ratio EW/W (4, 8),
and the number of expandable targets ExpandNum (2, 4). Each participant completed two
blocks for each combination of the variables Predictable and Technique. Each block con-
sisted of 48 trials, presented in a random order. In total, 576 trials were completed by each
participant in one session lasting from 45 to 60 minutes.
The order in which the two predictability conditions and the three techniques were pre-
sented was balanced among the 12 participants. For each condition and technique, each par-
ticipant had to complete a series of practice trials. Participants were instructed to complete
the tasks as quickly as possible, while trying to keep the error rate around 2 - 4%. An estima-
tion of the within-block error rate based on their ongoing frequency of errors was constantly
shown. In the case of an error, participants had to continue with the task until the goal target
was selected. This prevented participants from deliberately making errors to complete tasks
faster.
6.4.5 Measures
As Zhai et al. (2003), we analyzed three dependent variables: movement time MT, the time
elapsed from the beginning of the movement until releasing the mouse button over the goal
target, response time RT, the time elapsed between the presentation of the targets and the be-
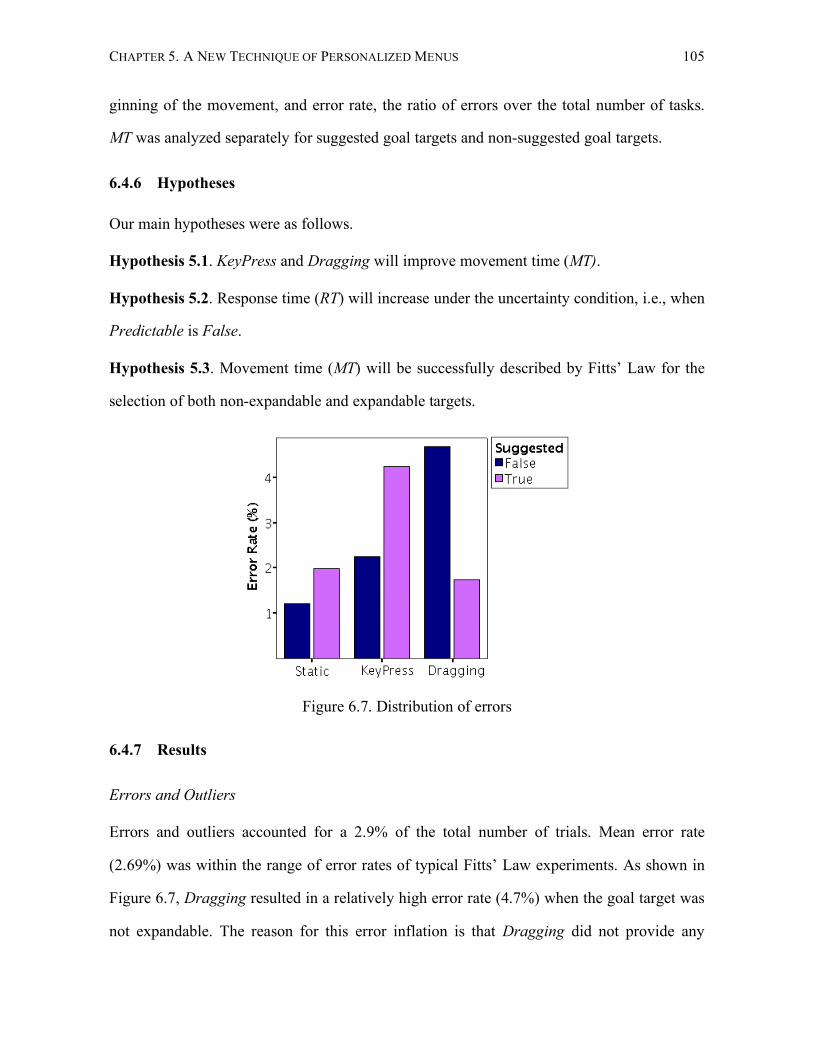
CHAPTER 5. A NEW TECHNIQUE OF PERSONALIZED MENUS 105
ginning of the movement, and error rate, the ratio of errors over the total number of tasks.
MT was analyzed separately for suggested goal targets and non-suggested goal targets.
6.4.6 Hypotheses
Our main hypotheses were as follows.
Hypothesis 5.1. KeyPress and Dragging will improve movement time (MT).
Hypothesis 5.2. Response time (RT) will increase under the uncertainty condition, i.e., when
Predictable is False.
Hypothesis 5.3. Movement time (MT) will be successfully described by Fitts’ Law for the
selection of both non-expandable and expandable targets.
Figure 6.7. Distribution of errors
6.4.7 Results
Errors and Outliers
Errors and outliers accounted for a 2.9% of the total number of trials. Mean error rate
(2.69%) was within the range of error rates of typical Fitts’ Law experiments. As shown in
Figure 6.7, Dragging resulted in a relatively high error rate (4.7%) when the goal target was
not expandable. The reason for this error inflation is that Dragging did not provide any
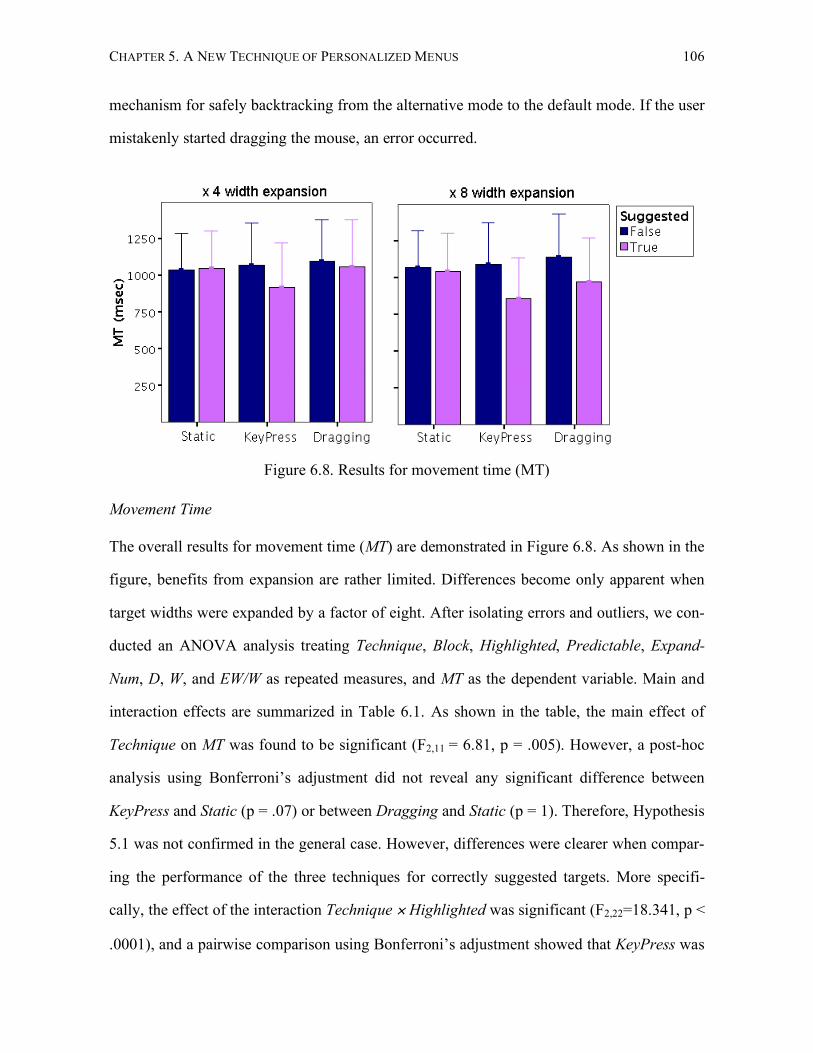
CHAPTER 5. A NEW TECHNIQUE OF PERSONALIZED MENUS 106
mechanism for safely backtracking from the alternative mode to the default mode. If the user
mistakenly started dragging the mouse, an error occurred.
Figure 6.8. Results for movement time (MT)
Movement Time
The overall results for movement time (MT) are demonstrated in Figure 6.8. As shown in the
figure, benefits from expansion are rather limited. Differences become only apparent when
target widths were expanded by a factor of eight. After isolating errors and outliers, we con-
ducted an ANOVA analysis treating Technique, Block, Highlighted, Predictable, Expand-
Num, D, W, and EW/W as repeated measures, and MT as the dependent variable. Main and
interaction effects are summarized in Table 6.1. As shown in the table, the main effect of
Technique on MT was found to be significant (F2,11 = 6.81, p = .005). However, a post-hoc
analysis using Bonferroni’s adjustment did not reveal any significant difference between
KeyPress and Static (p = .07) or between Dragging and Static (p = 1). Therefore, Hypothesis
5.1 was not confirmed in the general case. However, differences were clearer when compar-
ing the performance of the three techniques for correctly suggested targets. More specifi-
cally, the effect of the interaction Technique × Highlighted was significant (F2,22=18.341, p <
.0001), and a pairwise comparison using Bonferroni’s adjustment showed that KeyPress was
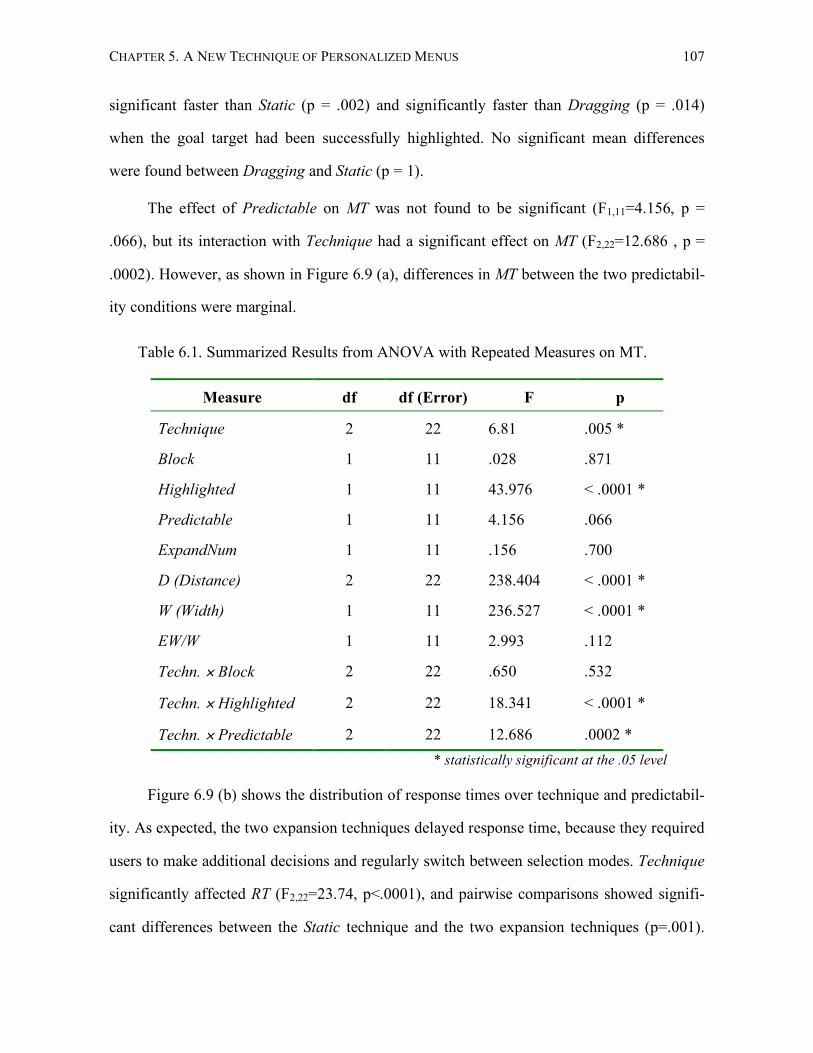
CHAPTER 5. A NEW TECHNIQUE OF PERSONALIZED MENUS 107
significant faster than Static (p = .002) and significantly faster than Dragging (p = .014)
when the goal target had been successfully highlighted. No significant mean differences
were found between Dragging and Static (p = 1).
The effect of Predictable on MT was not found to be significant (F1,11=4.156, p =
.066), but its interaction with Technique had a significant effect on MT (F2,22=12.686 , p =
.0002). However, as shown in Figure 6.9 (a), differences in MT between the two predictabil-
ity conditions were marginal.
Table 6.1. Summarized Results from ANOVA with Repeated Measures on MT.
Measure df df (Error) F p
Technique 2 22 6.81 .005 *
Block 1 11 .028 .871
Highlighted 1 11 43.976 < .0001 *
Predictable 1 11 4.156 .066
ExpandNum 1 11 .156 .700
D (Distance) 2 22 238.404 < .0001 *
W (Width) 1 11 236.527 < .0001 *
EW/W 1 11 2.993 .112
Techn. × Block 2 22 .650 .532
Techn. × Highlighted 2 22 18.341 < .0001 *
Techn. × Predictable 2 22 12.686 .0002 * * statistically significant at the .05 level
Figure 6.9 (b) shows the distribution of response times over technique and predictabil-
ity. As expected, the two expansion techniques delayed response time, because they required
users to make additional decisions and regularly switch between selection modes. Technique
significantly affected RT (F2,22=23.74, p<.0001), and pairwise comparisons showed signifi-
cant differences between the Static technique and the two expansion techniques (p=.001).
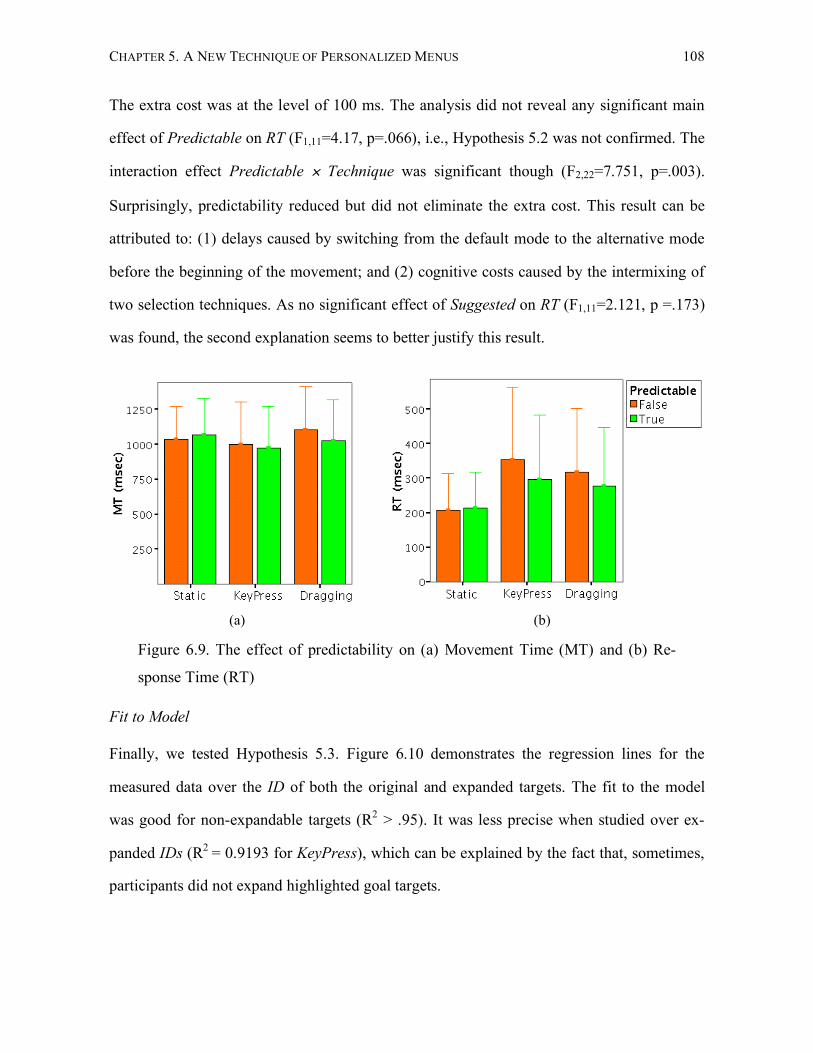
CHAPTER 5. A NEW TECHNIQUE OF PERSONALIZED MENUS 108
The extra cost was at the level of 100 ms. The analysis did not reveal any significant main
effect of Predictable on RT (F1,11=4.17, p=.066), i.e., Hypothesis 5.2 was not confirmed. The
interaction effect Predictable × Technique was significant though (F2,22=7.751, p=.003).
Surprisingly, predictability reduced but did not eliminate the extra cost. This result can be
attributed to: (1) delays caused by switching from the default mode to the alternative mode
before the beginning of the movement; and (2) cognitive costs caused by the intermixing of
two selection techniques. As no significant effect of Suggested on RT (F1,11=2.121, p =.173)
was found, the second explanation seems to better justify this result.
(a)
(b)
Figure 6.9. The effect of predictability on (a) Movement Time (MT) and (b) Re-
sponse Time (RT)
Fit to Model
Finally, we tested Hypothesis 5.3. Figure 6.10 demonstrates the regression lines for the
measured data over the ID of both the original and expanded targets. The fit to the model
was good for non-expandable targets (R2 > .95). It was less precise when studied over ex-
panded IDs (R2 = 0.9193 for KeyPress), which can be explained by the fact that, sometimes,
participants did not expand highlighted goal targets.
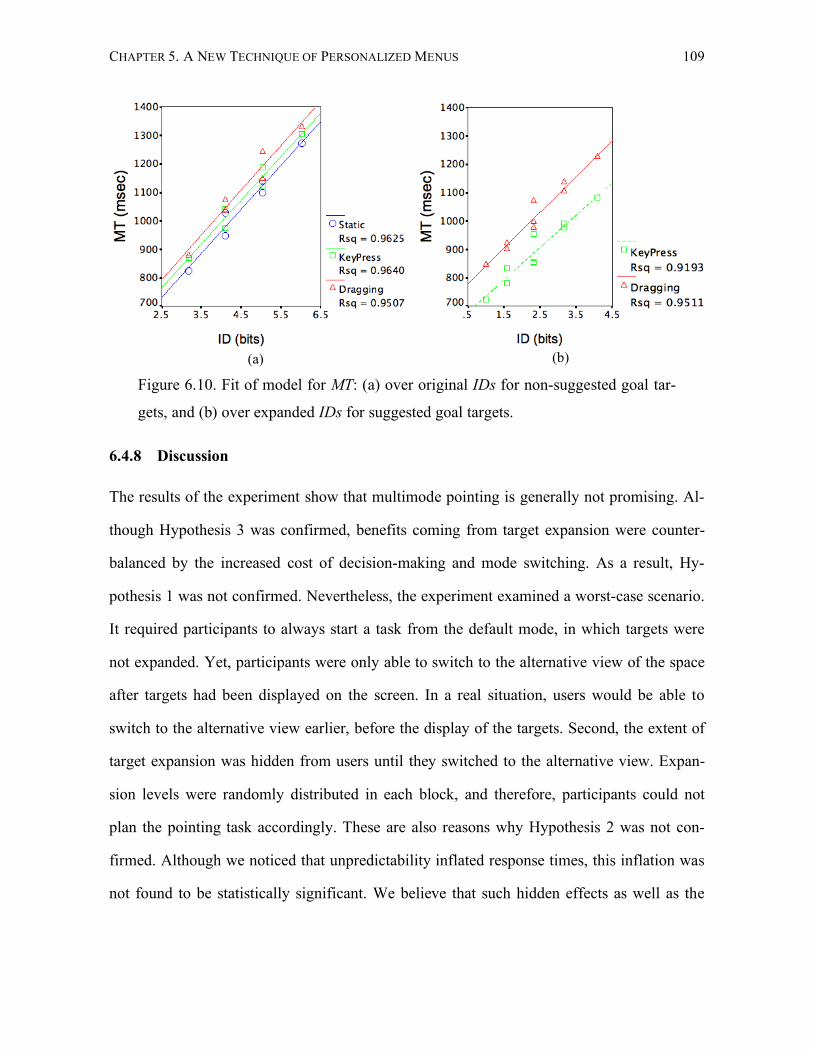
CHAPTER 5. A NEW TECHNIQUE OF PERSONALIZED MENUS 109
(a) (b)
Figure 6.10. Fit of model for MT: (a) over original IDs for non-suggested goal tar-
gets, and (b) over expanded IDs for suggested goal targets.
6.4.8 Discussion
The results of the experiment show that multimode pointing is generally not promising. Al-
though Hypothesis 3 was confirmed, benefits coming from target expansion were counter-
balanced by the increased cost of decision-making and mode switching. As a result, Hy-
pothesis 1 was not confirmed. Nevertheless, the experiment examined a worst-case scenario.
It required participants to always start a task from the default mode, in which targets were
not expanded. Yet, participants were only able to switch to the alternative view of the space
after targets had been displayed on the screen. In a real situation, users would be able to
switch to the alternative view earlier, before the display of the targets. Second, the extent of
target expansion was hidden from users until they switched to the alternative view. Expan-
sion levels were randomly distributed in each block, and therefore, participants could not
plan the pointing task accordingly. These are also reasons why Hypothesis 2 was not con-
firmed. Although we noticed that unpredictability inflated response times, this inflation was
not found to be statistically significant. We believe that such hidden effects as well as the
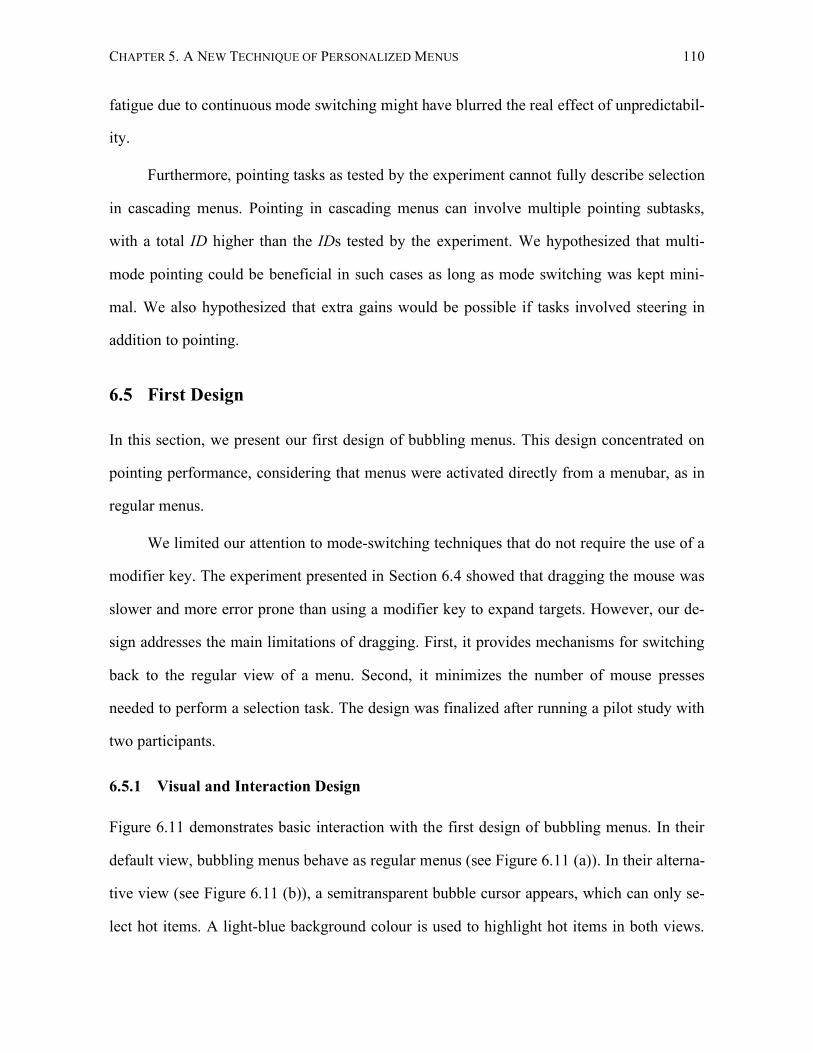
CHAPTER 5. A NEW TECHNIQUE OF PERSONALIZED MENUS 110
fatigue due to continuous mode switching might have blurred the real effect of unpredictabil-
ity.
Furthermore, pointing tasks as tested by the experiment cannot fully describe selection
in cascading menus. Pointing in cascading menus can involve multiple pointing subtasks,
with a total ID higher than the IDs tested by the experiment. We hypothesized that multi-
mode pointing could be beneficial in such cases as long as mode switching was kept mini-
mal. We also hypothesized that extra gains would be possible if tasks involved steering in
addition to pointing.
6.5 First Design
In this section, we present our first design of bubbling menus. This design concentrated on
pointing performance, considering that menus were activated directly from a menubar, as in
regular menus.
We limited our attention to mode-switching techniques that do not require the use of a
modifier key. The experiment presented in Section 6.4 showed that dragging the mouse was
slower and more error prone than using a modifier key to expand targets. However, our de-
sign addresses the main limitations of dragging. First, it provides mechanisms for switching
back to the regular view of a menu. Second, it minimizes the number of mouse presses
needed to perform a selection task. The design was finalized after running a pilot study with
two participants.
6.5.1 Visual and Interaction Design
Figure 6.11 demonstrates basic interaction with the first design of bubbling menus. In their
default view, bubbling menus behave as regular menus (see Figure 6.11 (a)). In their alterna-
tive view (see Figure 6.11 (b)), a semitransparent bubble cursor appears, which can only se-
lect hot items. A light-blue background colour is used to highlight hot items in both views.
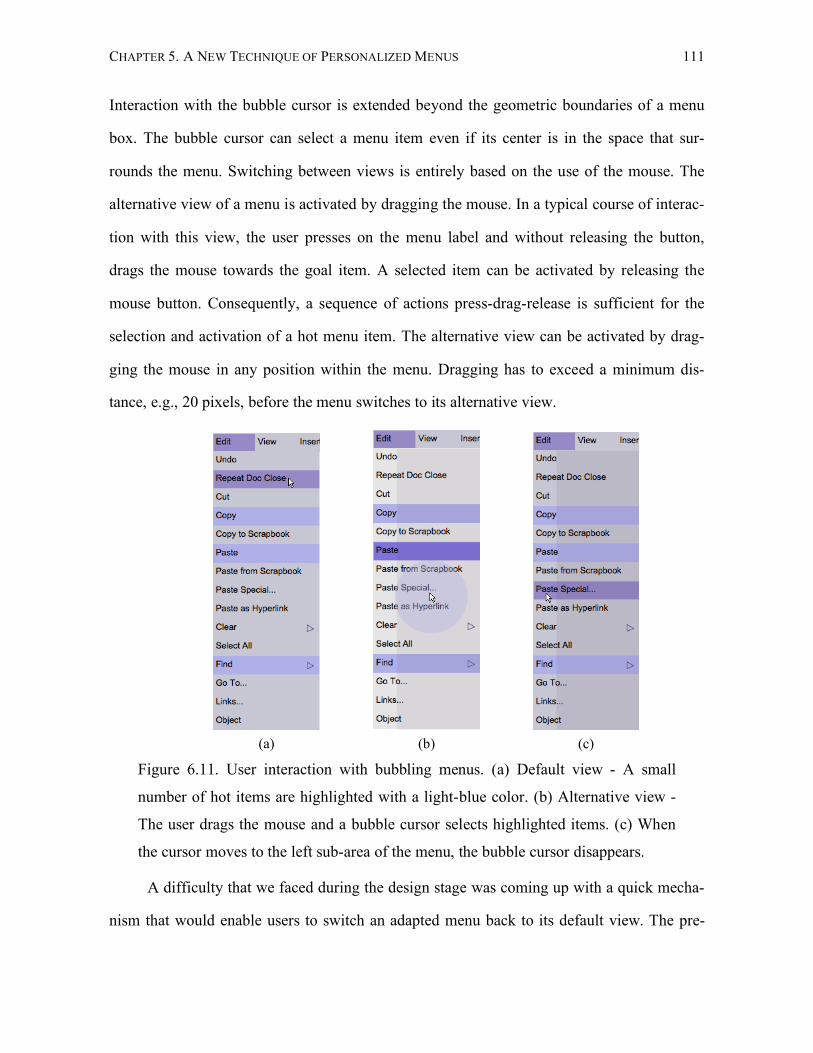
CHAPTER 5. A NEW TECHNIQUE OF PERSONALIZED MENUS 111
Interaction with the bubble cursor is extended beyond the geometric boundaries of a menu
box. The bubble cursor can select a menu item even if its center is in the space that sur-
rounds the menu. Switching between views is entirely based on the use of the mouse. The
alternative view of a menu is activated by dragging the mouse. In a typical course of interac-
tion with this view, the user presses on the menu label and without releasing the button,
drags the mouse towards the goal item. A selected item can be activated by releasing the
mouse button. Consequently, a sequence of actions press-drag-release is sufficient for the
selection and activation of a hot menu item. The alternative view can be activated by drag-
ging the mouse in any position within the menu. Dragging has to exceed a minimum dis-
tance, e.g., 20 pixels, before the menu switches to its alternative view.
(a)
(b)
(c)
Figure 6.11. User interaction with bubbling menus. (a) Default view - A small
number of hot items are highlighted with a light-blue color. (b) Alternative view -
The user drags the mouse and a bubble cursor selects highlighted items. (c) When
the cursor moves to the left sub-area of the menu, the bubble cursor disappears.
A difficulty that we faced during the design stage was coming up with a quick mecha-
nism that would enable users to switch an adapted menu back to its default view. The pre-
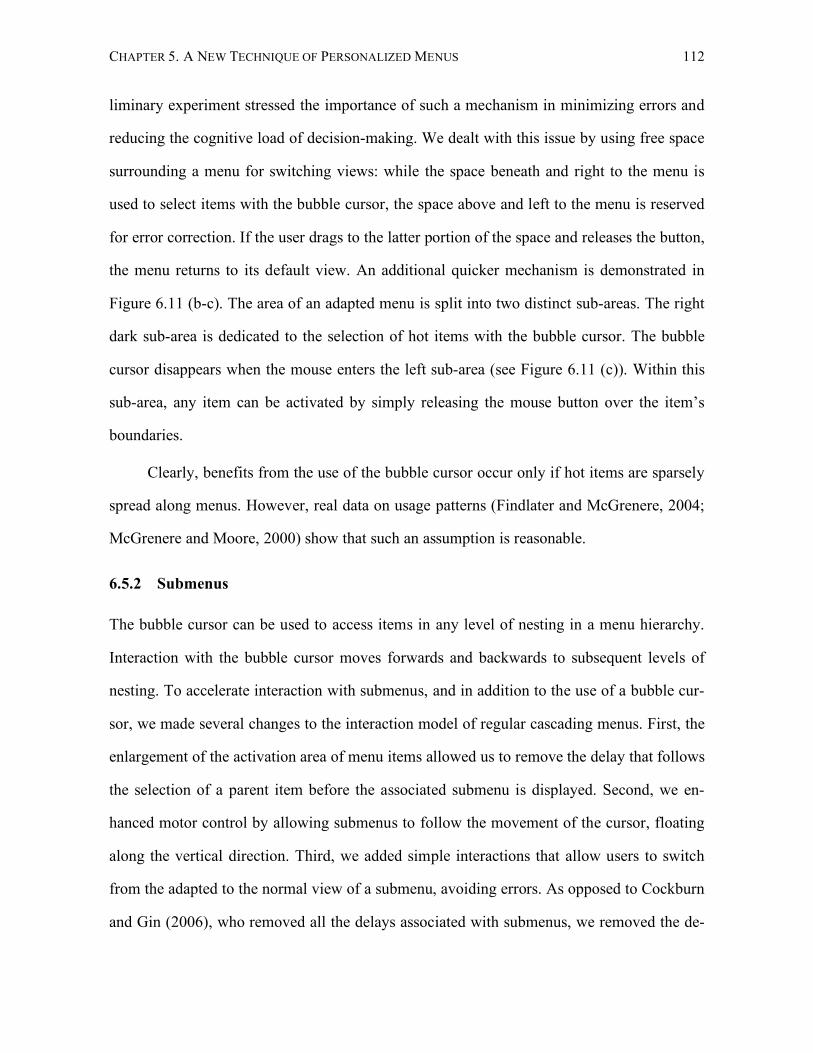
CHAPTER 5. A NEW TECHNIQUE OF PERSONALIZED MENUS 112
liminary experiment stressed the importance of such a mechanism in minimizing errors and
reducing the cognitive load of decision-making. We dealt with this issue by using free space
surrounding a menu for switching views: while the space beneath and right to the menu is
used to select items with the bubble cursor, the space above and left to the menu is reserved
for error correction. If the user drags to the latter portion of the space and releases the button,
the menu returns to its default view. An additional quicker mechanism is demonstrated in
Figure 6.11 (b-c). The area of an adapted menu is split into two distinct sub-areas. The right
dark sub-area is dedicated to the selection of hot items with the bubble cursor. The bubble
cursor disappears when the mouse enters the left sub-area (see Figure 6.11 (c)). Within this
sub-area, any item can be activated by simply releasing the mouse button over the item’s
boundaries.
Clearly, benefits from the use of the bubble cursor occur only if hot items are sparsely
spread along menus. However, real data on usage patterns (Findlater and McGrenere, 2004;
McGrenere and Moore, 2000) show that such an assumption is reasonable.
6.5.2 Submenus
The bubble cursor can be used to access items in any level of nesting in a menu hierarchy.
Interaction with the bubble cursor moves forwards and backwards to subsequent levels of
nesting. To accelerate interaction with submenus, and in addition to the use of a bubble cur-
sor, we made several changes to the interaction model of regular cascading menus. First, the
enlargement of the activation area of menu items allowed us to remove the delay that follows
the selection of a parent item before the associated submenu is displayed. Second, we en-
hanced motor control by allowing submenus to follow the movement of the cursor, floating
along the vertical direction. Third, we added simple interactions that allow users to switch
from the adapted to the normal view of a submenu, avoiding errors. As opposed to Cockburn
and Gin (2006), who removed all the delays associated with submenus, we removed the de-
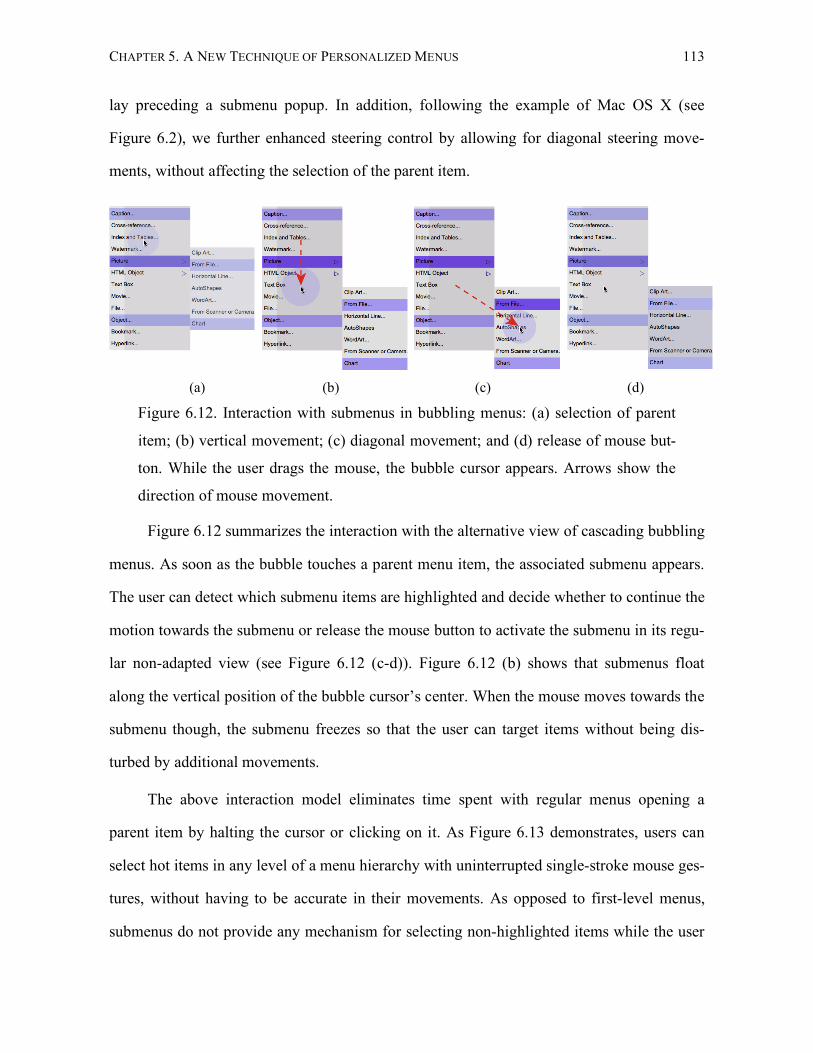
CHAPTER 5. A NEW TECHNIQUE OF PERSONALIZED MENUS 113
lay preceding a submenu popup. In addition, following the example of Mac OS X (see
Figure 6.2), we further enhanced steering control by allowing for diagonal steering move-
ments, without affecting the selection of the parent item.
(a)
(b)
(c)
(d)
Figure 6.12. Interaction with submenus in bubbling menus: (a) selection of parent
item; (b) vertical movement; (c) diagonal movement; and (d) release of mouse but-
ton. While the user drags the mouse, the bubble cursor appears. Arrows show the
direction of mouse movement.
Figure 6.12 summarizes the interaction with the alternative view of cascading bubbling
menus. As soon as the bubble touches a parent menu item, the associated submenu appears.
The user can detect which submenu items are highlighted and decide whether to continue the
motion towards the submenu or release the mouse button to activate the submenu in its regu-
lar non-adapted view (see Figure 6.12 (c-d)). Figure 6.12 (b) shows that submenus float
along the vertical position of the bubble cursor’s center. When the mouse moves towards the
submenu though, the submenu freezes so that the user can target items without being dis-
turbed by additional movements.
The above interaction model eliminates time spent with regular menus opening a
parent item by halting the cursor or clicking on it. As Figure 6.13 demonstrates, users can
select hot items in any level of a menu hierarchy with uninterrupted single-stroke mouse ges-
tures, without having to be accurate in their movements. As opposed to first-level menus,
submenus do not provide any mechanism for selecting non-highlighted items while the user
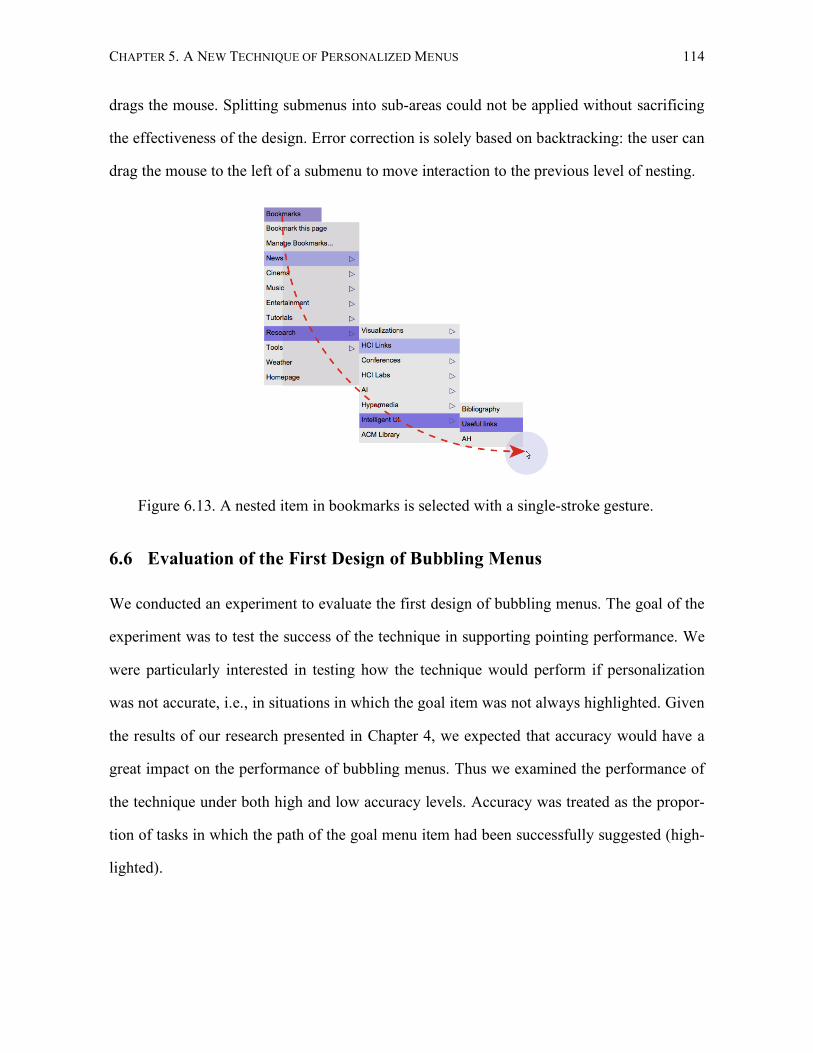
CHAPTER 5. A NEW TECHNIQUE OF PERSONALIZED MENUS 114
drags the mouse. Splitting submenus into sub-areas could not be applied without sacrificing
the effectiveness of the design. Error correction is solely based on backtracking: the user can
drag the mouse to the left of a submenu to move interaction to the previous level of nesting.
Figure 6.13. A nested item in bookmarks is selected with a single-stroke gesture.
6.6 Evaluation of the First Design of Bubbling Menus
We conducted an experiment to evaluate the first design of bubbling menus. The goal of the
experiment was to test the success of the technique in supporting pointing performance. We
were particularly interested in testing how the technique would perform if personalization
was not accurate, i.e., in situations in which the goal item was not always highlighted. Given
the results of our research presented in Chapter 4, we expected that accuracy would have a
great impact on the performance of bubbling menus. Thus we examined the performance of
the technique under both high and low accuracy levels. Accuracy was treated as the propor-
tion of tasks in which the path of the goal menu item had been successfully suggested (high-
lighted).
CHAPTER 5. A NEW TECHNIQUE OF PERSONALIZED MENUS 115
6.6.1 Experimental Conditions
The experiment compared bubbling menus against regular static menus. The interaction de-
sign of static menus was based on the Mac OS X interaction model (Figure 6.2):
- A menu item was selected after releasing the mouse button over its boundaries; i.e., an
item could be selected by either clicking or by dragging and releasing.
- A submenu was activated by either clicking on its parent item or by keeping the cursor
over its boundaries for a short period of time (300 msec).
- Items within a submenu were selected according to the interaction model demonstrated
in Figure 6.2. The time window in which motion was constrained by the triangular
area shown in the figure was set to 400 msec.
Participants could use the selection strategy that best fitted their past experience. The
same interactions were supported by the default view of bubbling menus with the exception
that dragging for more than 20 pixels activated their adaptive views.
6.6.2 Apparatus
The experiment was conducted on a PowerBook G4 12-inch laptop with screen resolution
1024x768 and 768 MB RAM, running Mac OS X 10.4.4. A USB mouse was used as input
device. The experimental software was implemented in Java 1.4.2 and used the Piccolo
framework (Bederson et al., 2004).
6.6.3 Participants
Six female and ten male volunteers, 24-35 years old, participated in the experiment. All the
participants had experience interacting with pull-down menus and a mouse. 15 participants
used the right hand to interact with the mouse and one participant used the left hand.
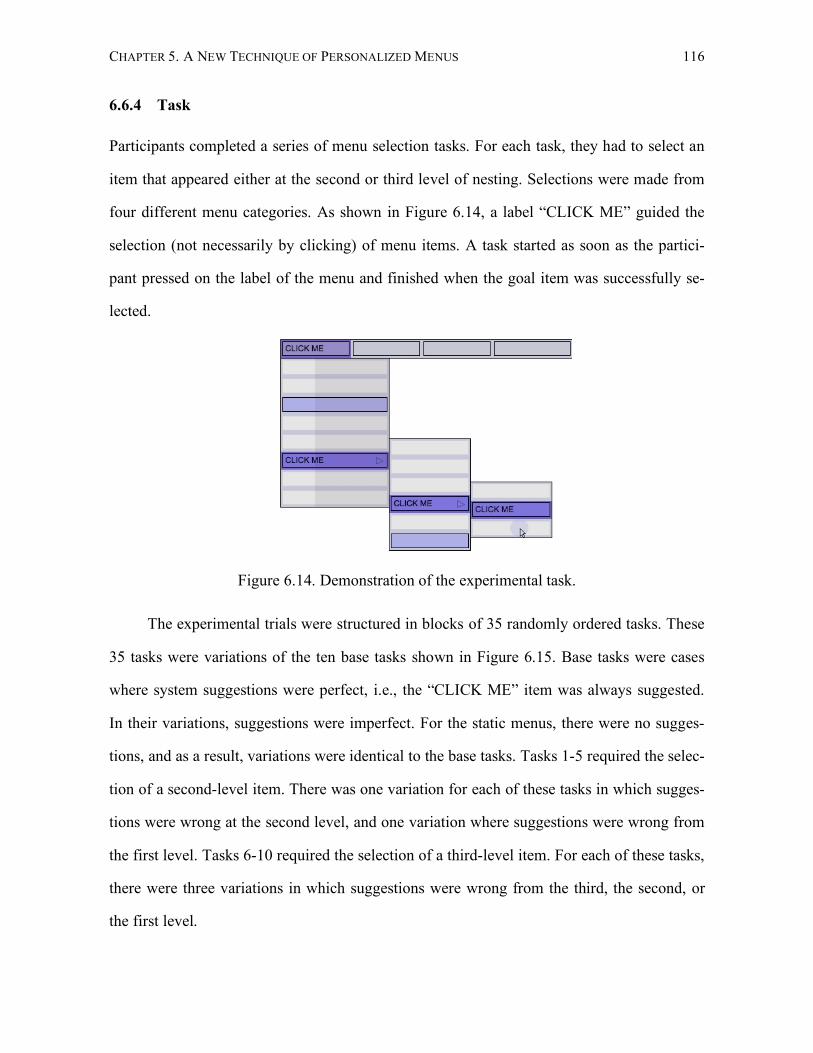
CHAPTER 5. A NEW TECHNIQUE OF PERSONALIZED MENUS 116
6.6.4 Task
Participants completed a series of menu selection tasks. For each task, they had to select an
item that appeared either at the second or third level of nesting. Selections were made from
four different menu categories. As shown in Figure 6.14, a label “CLICK ME” guided the
selection (not necessarily by clicking) of menu items. A task started as soon as the partici-
pant pressed on the label of the menu and finished when the goal item was successfully se-
lected.
Figure 6.14. Demonstration of the experimental task.
The experimental trials were structured in blocks of 35 randomly ordered tasks. These
35 tasks were variations of the ten base tasks shown in Figure 6.15. Base tasks were cases
where system suggestions were perfect, i.e., the “CLICK ME” item was always suggested.
In their variations, suggestions were imperfect. For the static menus, there were no sugges-
tions, and as a result, variations were identical to the base tasks. Tasks 1-5 required the selec-
tion of a second-level item. There was one variation for each of these tasks in which sugges-
tions were wrong at the second level, and one variation where suggestions were wrong from
the first level. Tasks 6-10 required the selection of a third-level item. For each of these tasks,
there were three variations in which suggestions were wrong from the third, the second, or
the first level.
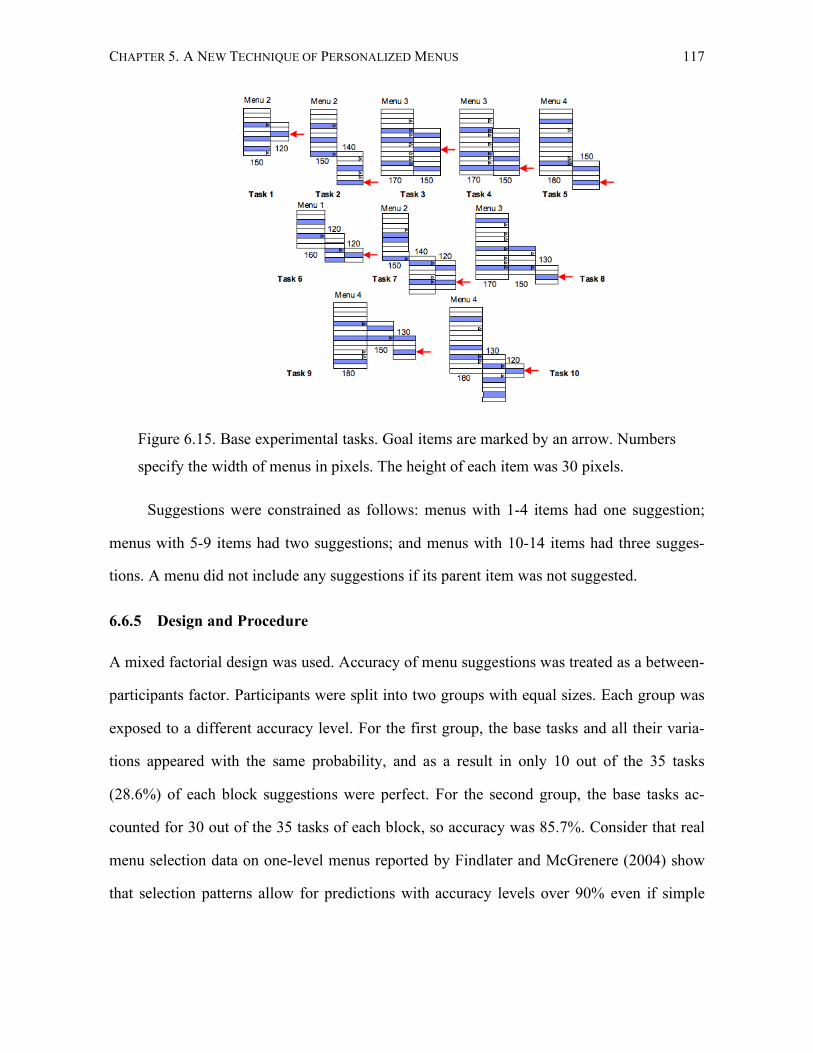
CHAPTER 5. A NEW TECHNIQUE OF PERSONALIZED MENUS 117
Figure 6.15. Base experimental tasks. Goal items are marked by an arrow. Numbers
specify the width of menus in pixels. The height of each item was 30 pixels.
Suggestions were constrained as follows: menus with 1-4 items had one suggestion;
menus with 5-9 items had two suggestions; and menus with 10-14 items had three sugges-
tions. A menu did not include any suggestions if its parent item was not suggested.
6.6.5 Design and Procedure
A mixed factorial design was used. Accuracy of menu suggestions was treated as a between-
participants factor. Participants were split into two groups with equal sizes. Each group was
exposed to a different accuracy level. For the first group, the base tasks and all their varia-
tions appeared with the same probability, and as a result in only 10 out of the 35 tasks
(28.6%) of each block suggestions were perfect. For the second group, the base tasks ac-
counted for 30 out of the 35 tasks of each block, so accuracy was 85.7%. Consider that real
menu selection data on one-level menus reported by Findlater and McGrenere (2004) show
that selection patterns allow for predictions with accuracy levels over 90% even if simple
CHAPTER 5. A NEW TECHNIQUE OF PERSONALIZED MENUS 118
heuristics such as selection frequencies are used and a small number of items, e.g. 3 out of
15, is suggested.
Tasks were randomly ordered within each block. In other words, we simulated a worst-
case scenario of adaptive behaviour, according to which participants could not predict how
menus were adapted before starting a task. Each participant was exposed to both bubbling
menus and static menus. The design can be summarized as follows:
2 accuracy conditions (low, high)
× 8 participants
× 2 techniques (static, bubbling)
× 4 blocks
× 35 tasks
= 4480 trials in total.
As bubbling menus was a new technique to which participants were not previously ex-
posed, we tried to minimize the learning curve in the recorded data by including training ses-
sions adapted to the individual needs of each participant. More specifically, participants
started the experiment after they felt that they had learned how to use the technique. Also,
for both techniques, before the four main blocks, we added an extra block not included in the
analysis. For this block only, participants were instructed to start completing the tasks slowly
but accurately and accelerate as soon as they felt confident. For the four main blocks, they
were asked to complete the tasks as fast as possible, trying to avoid errors. Each participant
completed the experiment in one session lasting 45-60 minutes. The order in which the two
menu techniques were presented was balanced among participants.
CHAPTER 5. A NEW TECHNIQUE OF PERSONALIZED MENUS 119
6.6.6 Measures
We analyzed the total time TT to complete a selection task as well as the response time RT
measured from the beginning of the task until the cursor entered the menu. We also con-
ducted a separate analysis for the total time (TTperfect) needed to complete tasks for which
system suggestions were correct.
6.6.7 Hypotheses
Our hypotheses were as follows.
Hypothesis 5.4. Bubbling menus will decrease total selection time (TT) in high accuracy.
Hypothesis 5.5. Bubbling menus will increase total selection time (TT) in low accuracy.
6.6.8 Results
Errors due to wrong item selections or accidental collapses of first-level menus were re-
moved from our analysis. Error rates were 1.68% for static menus and 3.41% for bubbling
menus. Although higher, the error rate for bubbling menus is reasonable if taking into con-
sideration the novelty of the technique and the unpredictability of suggestions. Besides, this
error rate was considerably lower (2.59%) for the high-accuracy condition compared to its
value (4.22%) for the low-accuracy condition.
Figure 6.16 (a) demonstrates mean times as measured for the two accuracy conditions.
Hypotheses 5.4 and 5.5 were confirmed. Bubbling menus improved mean selection speed by
20% when accuracy was high (Hypothesis 5.4). However, they reduced mean performance
by approximately 14% when accuracy was low (Hypothesis 5.5). An ANOVA analysis with
accuracy treated as a between-participants variable and technique, block, and task treaded as
repeated measures showed that the main effect of accuracy on TT was statistically significant
(F1,14=35.308, p<.0001). Its interaction effect with technique was also significant
(F1,14=36.846, p<.0001). A post hoc comparison using Bonferroni’s adjustment showed that
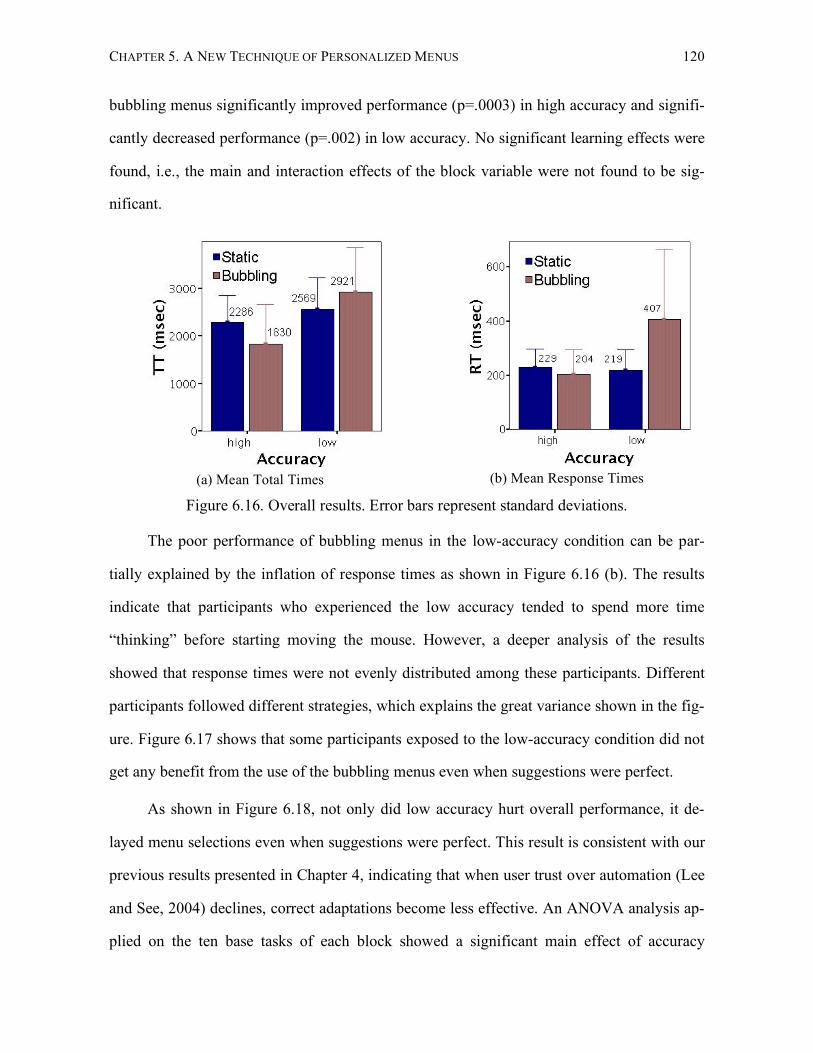
CHAPTER 5. A NEW TECHNIQUE OF PERSONALIZED MENUS 120
bubbling menus significantly improved performance (p=.0003) in high accuracy and signifi-
cantly decreased performance (p=.002) in low accuracy. No significant learning effects were
found, i.e., the main and interaction effects of the block variable were not found to be sig-
nificant.
(a) Mean Total Times
(b) Mean Response Times
Figure 6.16. Overall results. Error bars represent standard deviations.
The poor performance of bubbling menus in the low-accuracy condition can be par-
tially explained by the inflation of response times as shown in Figure 6.16 (b). The results
indicate that participants who experienced the low accuracy tended to spend more time
“thinking” before starting moving the mouse. However, a deeper analysis of the results
showed that response times were not evenly distributed among these participants. Different
participants followed different strategies, which explains the great variance shown in the fig-
ure. Figure 6.17 shows that some participants exposed to the low-accuracy condition did not
get any benefit from the use of the bubbling menus even when suggestions were perfect.
As shown in Figure 6.18, not only did low accuracy hurt overall performance, it de-
layed menu selections even when suggestions were perfect. This result is consistent with our
previous results presented in Chapter 4, indicating that when user trust over automation (Lee
and See, 2004) declines, correct adaptations become less effective. An ANOVA analysis ap-
plied on the ten base tasks of each block showed a significant main effect of accuracy
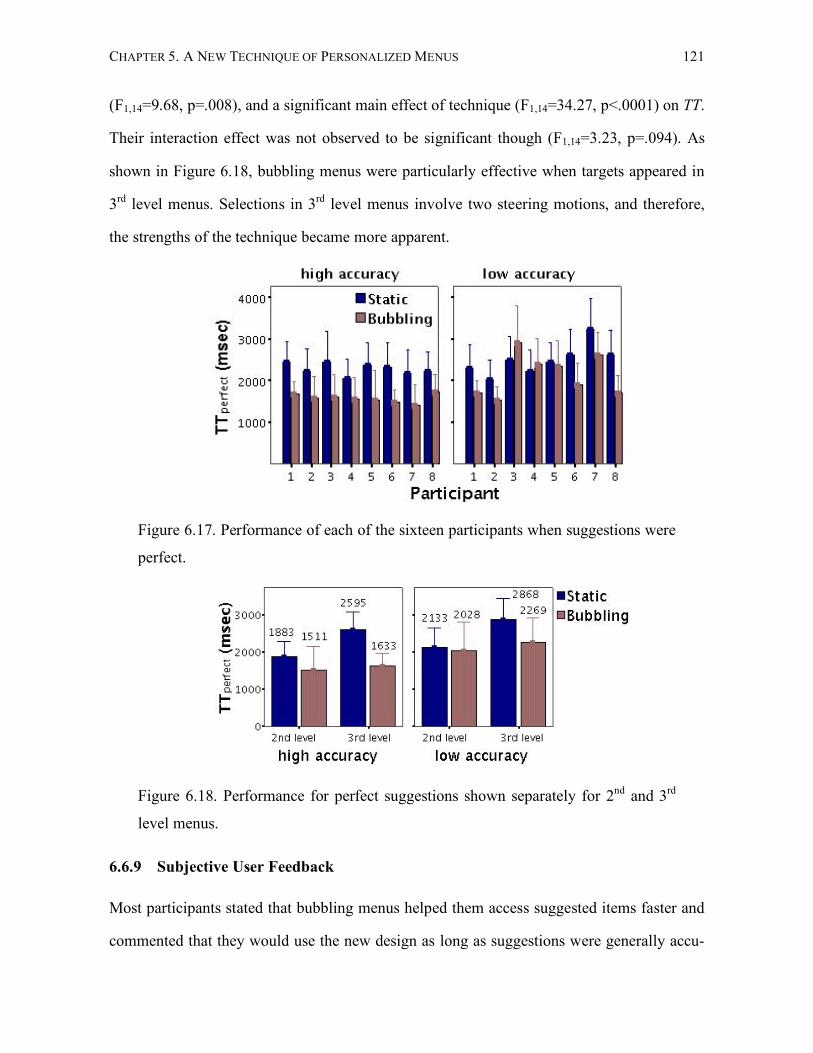
CHAPTER 5. A NEW TECHNIQUE OF PERSONALIZED MENUS 121
(F1,14=9.68, p=.008), and a significant main effect of technique (F1,14=34.27, p<.0001) on TT.
Their interaction effect was not observed to be significant though (F1,14=3.23, p=.094). As
shown in Figure 6.18, bubbling menus were particularly effective when targets appeared in
3rd level menus. Selections in 3rd level menus involve two steering motions, and therefore,
the strengths of the technique became more apparent.
Figure 6.17. Performance of each of the sixteen participants when suggestions were
perfect.
Figure 6.18. Performance for perfect suggestions shown separately for 2nd and 3rd
level menus.
6.6.9 Subjective User Feedback
Most participants stated that bubbling menus helped them access suggested items faster and
commented that they would use the new design as long as suggestions were generally accu-
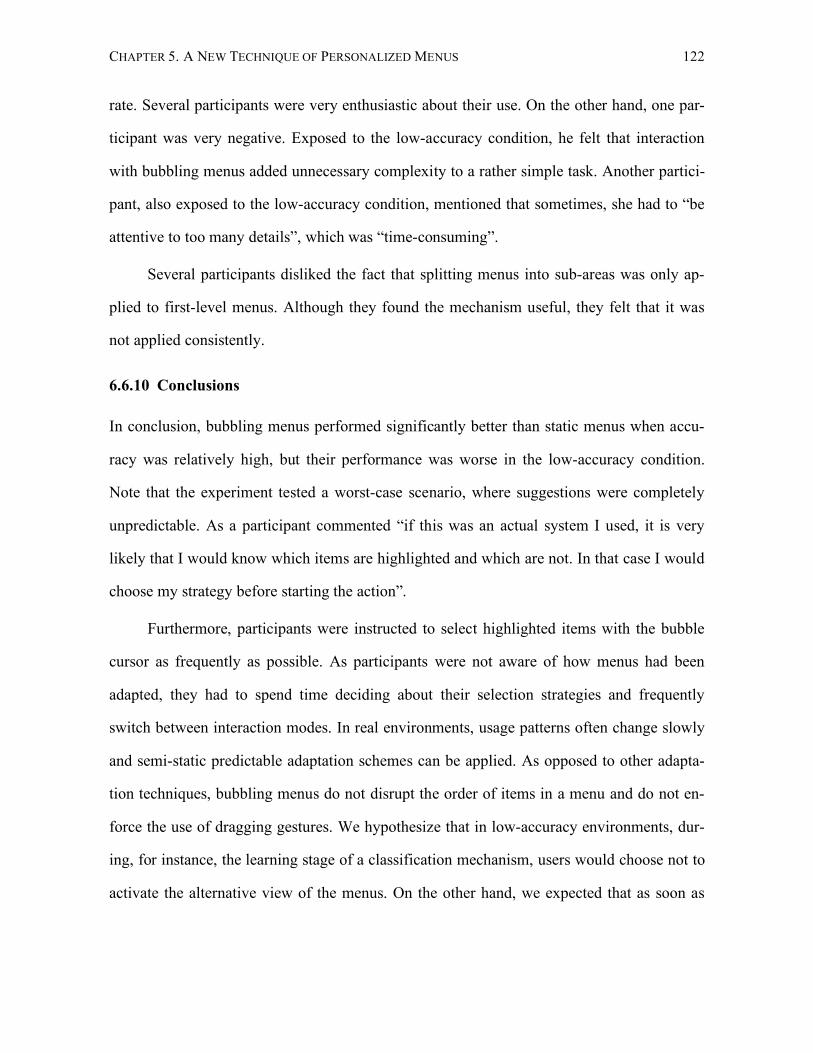
CHAPTER 5. A NEW TECHNIQUE OF PERSONALIZED MENUS 122
rate. Several participants were very enthusiastic about their use. On the other hand, one par-
ticipant was very negative. Exposed to the low-accuracy condition, he felt that interaction
with bubbling menus added unnecessary complexity to a rather simple task. Another partici-
pant, also exposed to the low-accuracy condition, mentioned that sometimes, she had to “be
attentive to too many details”, which was “time-consuming”.
Several participants disliked the fact that splitting menus into sub-areas was only ap-
plied to first-level menus. Although they found the mechanism useful, they felt that it was
not applied consistently.
6.6.10 Conclusions
In conclusion, bubbling menus performed significantly better than static menus when accu-
racy was relatively high, but their performance was worse in the low-accuracy condition.
Note that the experiment tested a worst-case scenario, where suggestions were completely
unpredictable. As a participant commented “if this was an actual system I used, it is very
likely that I would know which items are highlighted and which are not. In that case I would
choose my strategy before starting the action”.
Furthermore, participants were instructed to select highlighted items with the bubble
cursor as frequently as possible. As participants were not aware of how menus had been
adapted, they had to spend time deciding about their selection strategies and frequently
switch between interaction modes. In real environments, usage patterns often change slowly
and semi-static predictable adaptation schemes can be applied. As opposed to other adapta-
tion techniques, bubbling menus do not disrupt the order of items in a menu and do not en-
force the use of dragging gestures. We hypothesize that in low-accuracy environments, dur-
ing, for instance, the learning stage of a classification mechanism, users would choose not to
activate the alternative view of the menus. On the other hand, we expected that as soon as
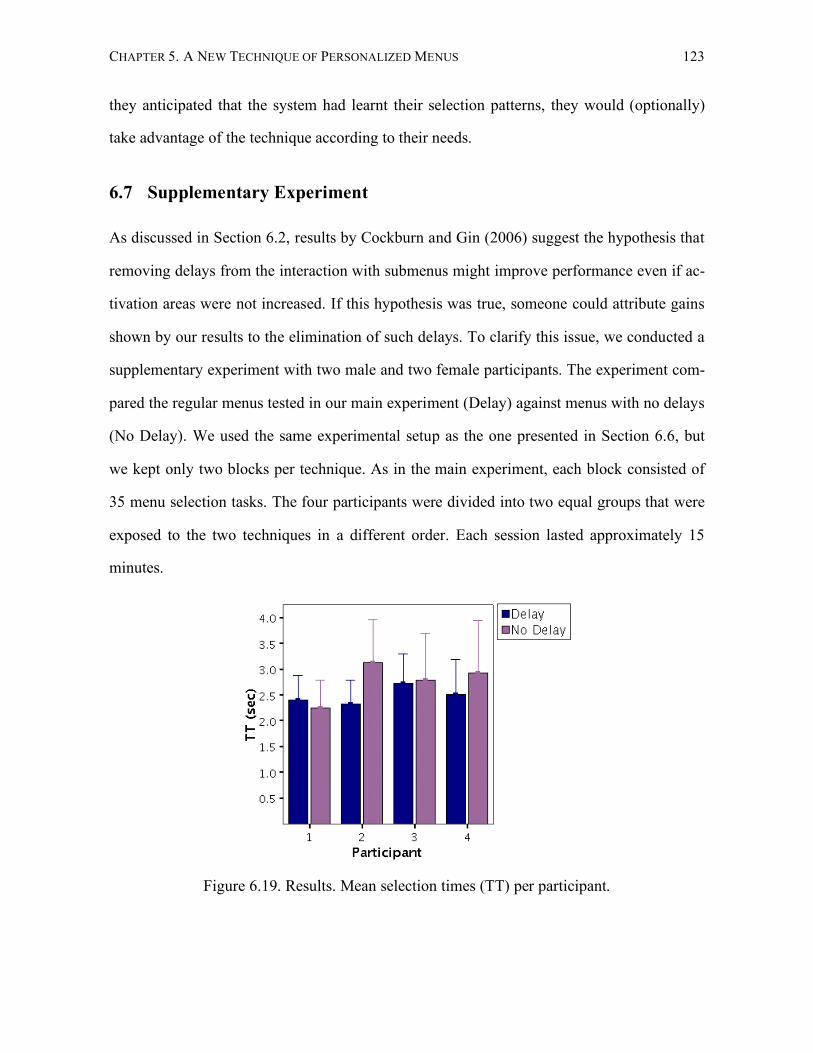
CHAPTER 5. A NEW TECHNIQUE OF PERSONALIZED MENUS 123
they anticipated that the system had learnt their selection patterns, they would (optionally)
take advantage of the technique according to their needs.
6.7 Supplementary Experiment
As discussed in Section 6.2, results by Cockburn and Gin (2006) suggest the hypothesis that
removing delays from the interaction with submenus might improve performance even if ac-
tivation areas were not increased. If this hypothesis was true, someone could attribute gains
shown by our results to the elimination of such delays. To clarify this issue, we conducted a
supplementary experiment with two male and two female participants. The experiment com-
pared the regular menus tested in our main experiment (Delay) against menus with no delays
(No Delay). We used the same experimental setup as the one presented in Section 6.6, but
we kept only two blocks per technique. As in the main experiment, each block consisted of
35 menu selection tasks. The four participants were divided into two equal groups that were
exposed to the two techniques in a different order. Each session lasted approximately 15
minutes.
Figure 6.19. Results. Mean selection times (TT) per participant.
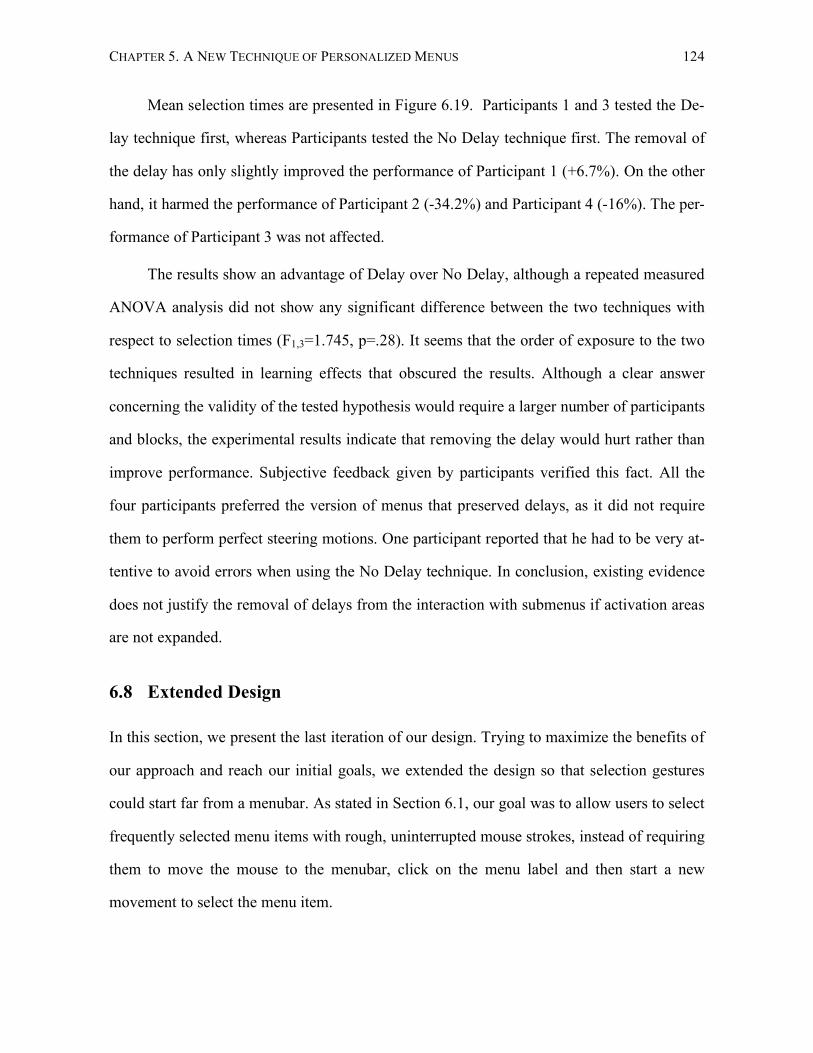
CHAPTER 5. A NEW TECHNIQUE OF PERSONALIZED MENUS 124
Mean selection times are presented in Figure 6.19. Participants 1 and 3 tested the De-
lay technique first, whereas Participants tested the No Delay technique first. The removal of
the delay has only slightly improved the performance of Participant 1 (+6.7%). On the other
hand, it harmed the performance of Participant 2 (-34.2%) and Participant 4 (-16%). The per-
formance of Participant 3 was not affected.
The results show an advantage of Delay over No Delay, although a repeated measured
ANOVA analysis did not show any significant difference between the two techniques with
respect to selection times (F1,3=1.745, p=.28). It seems that the order of exposure to the two
techniques resulted in learning effects that obscured the results. Although a clear answer
concerning the validity of the tested hypothesis would require a larger number of participants
and blocks, the experimental results indicate that removing the delay would hurt rather than
improve performance. Subjective feedback given by participants verified this fact. All the
four participants preferred the version of menus that preserved delays, as it did not require
them to perform perfect steering motions. One participant reported that he had to be very at-
tentive to avoid errors when using the No Delay technique. In conclusion, existing evidence
does not justify the removal of delays from the interaction with submenus if activation areas
are not expanded.
6.8 Extended Design
In this section, we present the last iteration of our design. Trying to maximize the benefits of
our approach and reach our initial goals, we extended the design so that selection gestures
could start far from a menubar. As stated in Section 6.1, our goal was to allow users to select
frequently selected menu items with rough, uninterrupted mouse strokes, instead of requiring
them to move the mouse to the menubar, click on the menu label and then start a new
movement to select the menu item.
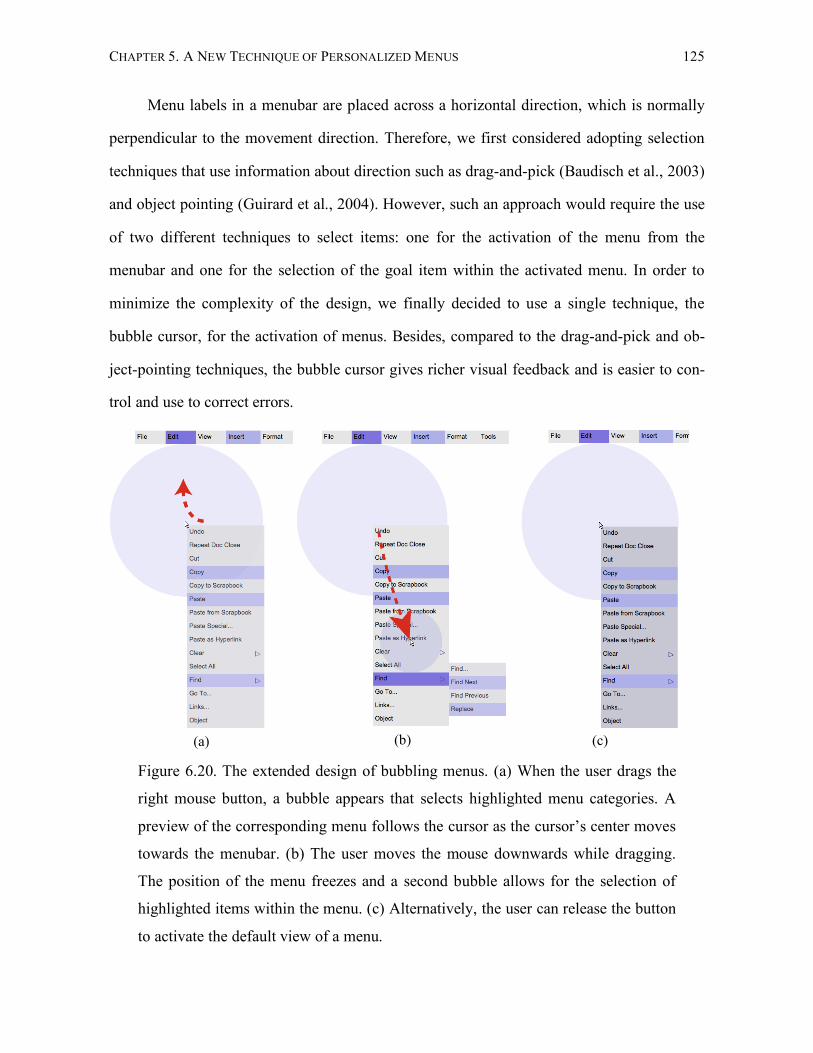
CHAPTER 5. A NEW TECHNIQUE OF PERSONALIZED MENUS 125
Menu labels in a menubar are placed across a horizontal direction, which is normally
perpendicular to the movement direction. Therefore, we first considered adopting selection
techniques that use information about direction such as drag-and-pick (Baudisch et al., 2003)
and object pointing (Guirard et al., 2004). However, such an approach would require the use
of two different techniques to select items: one for the activation of the menu from the
menubar and one for the selection of the goal item within the activated menu. In order to
minimize the complexity of the design, we finally decided to use a single technique, the
bubble cursor, for the activation of menus. Besides, compared to the drag-and-pick and ob-
ject-pointing techniques, the bubble cursor gives richer visual feedback and is easier to con-
trol and use to correct errors.
(a)
(b)
(c)
Figure 6.20. The extended design of bubbling menus. (a) When the user drags the
right mouse button, a bubble appears that selects highlighted menu categories. A
preview of the corresponding menu follows the cursor as the cursor’s center moves
towards the menubar. (b) The user moves the mouse downwards while dragging.
The position of the menu freezes and a second bubble allows for the selection of
highlighted items within the menu. (c) Alternatively, the user can release the button
to activate the default view of a menu.
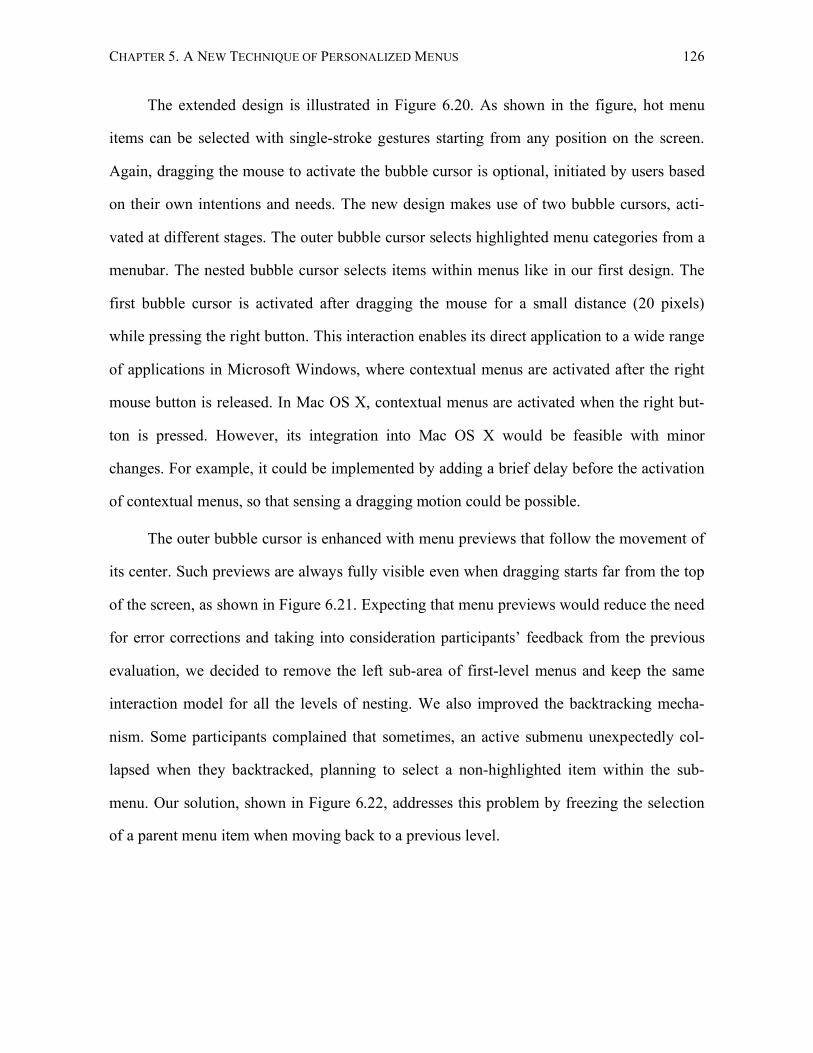
CHAPTER 5. A NEW TECHNIQUE OF PERSONALIZED MENUS 126
The extended design is illustrated in Figure 6.20. As shown in the figure, hot menu
items can be selected with single-stroke gestures starting from any position on the screen.
Again, dragging the mouse to activate the bubble cursor is optional, initiated by users based
on their own intentions and needs. The new design makes use of two bubble cursors, acti-
vated at different stages. The outer bubble cursor selects highlighted menu categories from a
menubar. The nested bubble cursor selects items within menus like in our first design. The
first bubble cursor is activated after dragging the mouse for a small distance (20 pixels)
while pressing the right button. This interaction enables its direct application to a wide range
of applications in Microsoft Windows, where contextual menus are activated after the right
mouse button is released. In Mac OS X, contextual menus are activated when the right but-
ton is pressed. However, its integration into Mac OS X would be feasible with minor
changes. For example, it could be implemented by adding a brief delay before the activation
of contextual menus, so that sensing a dragging motion could be possible.
The outer bubble cursor is enhanced with menu previews that follow the movement of
its center. Such previews are always fully visible even when dragging starts far from the top
of the screen, as shown in Figure 6.21. Expecting that menu previews would reduce the need
for error corrections and taking into consideration participants’ feedback from the previous
evaluation, we decided to remove the left sub-area of first-level menus and keep the same
interaction model for all the levels of nesting. We also improved the backtracking mecha-
nism. Some participants complained that sometimes, an active submenu unexpectedly col-
lapsed when they backtracked, planning to select a non-highlighted item within the sub-
menu. Our solution, shown in Figure 6.22, addresses this problem by freezing the selection
of a parent menu item when moving back to a previous level.
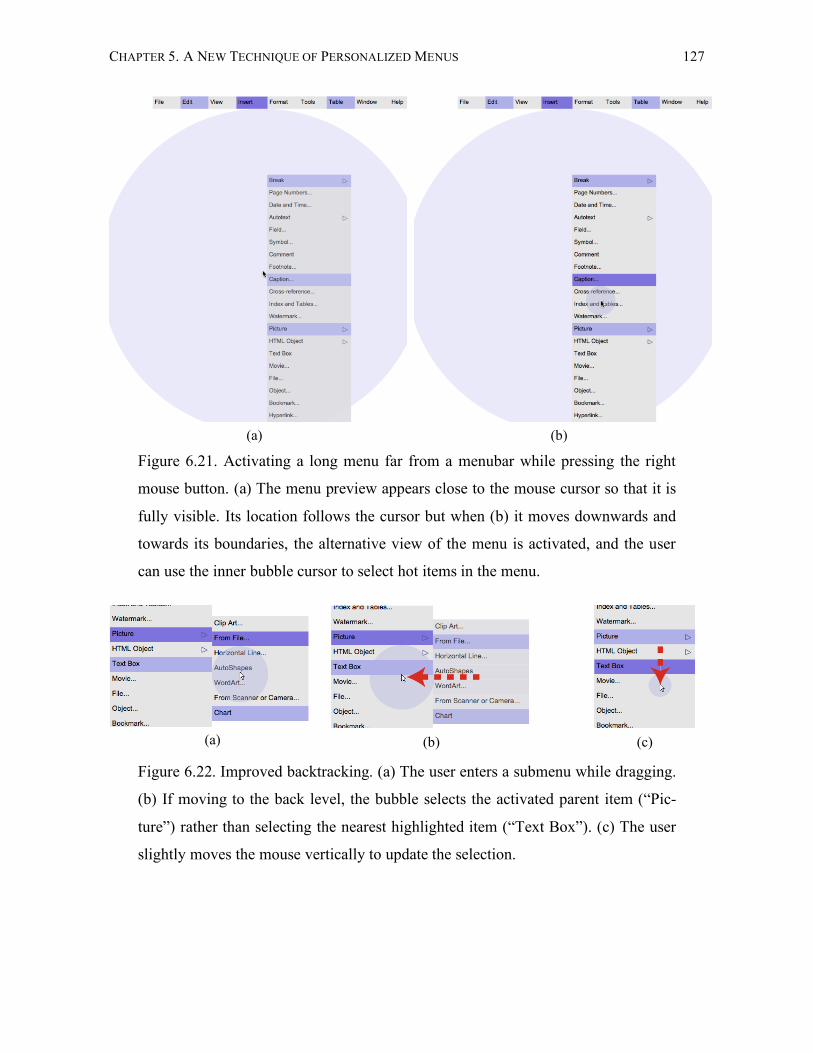
CHAPTER 5. A NEW TECHNIQUE OF PERSONALIZED MENUS 127
(a)
(b)
Figure 6.21. Activating a long menu far from a menubar while pressing the right
mouse button. (a) The menu preview appears close to the mouse cursor so that it is
fully visible. Its location follows the cursor but when (b) it moves downwards and
towards its boundaries, the alternative view of the menu is activated, and the user
can use the inner bubble cursor to select hot items in the menu.
(a)
(b)
(c)
Figure 6.22. Improved backtracking. (a) The user enters a submenu while dragging.
(b) If moving to the back level, the bubble selects the activated parent item (“Pic-
ture”) rather than selecting the nearest highlighted item (“Text Box”). (c) The user
slightly moves the mouse vertically to update the selection.
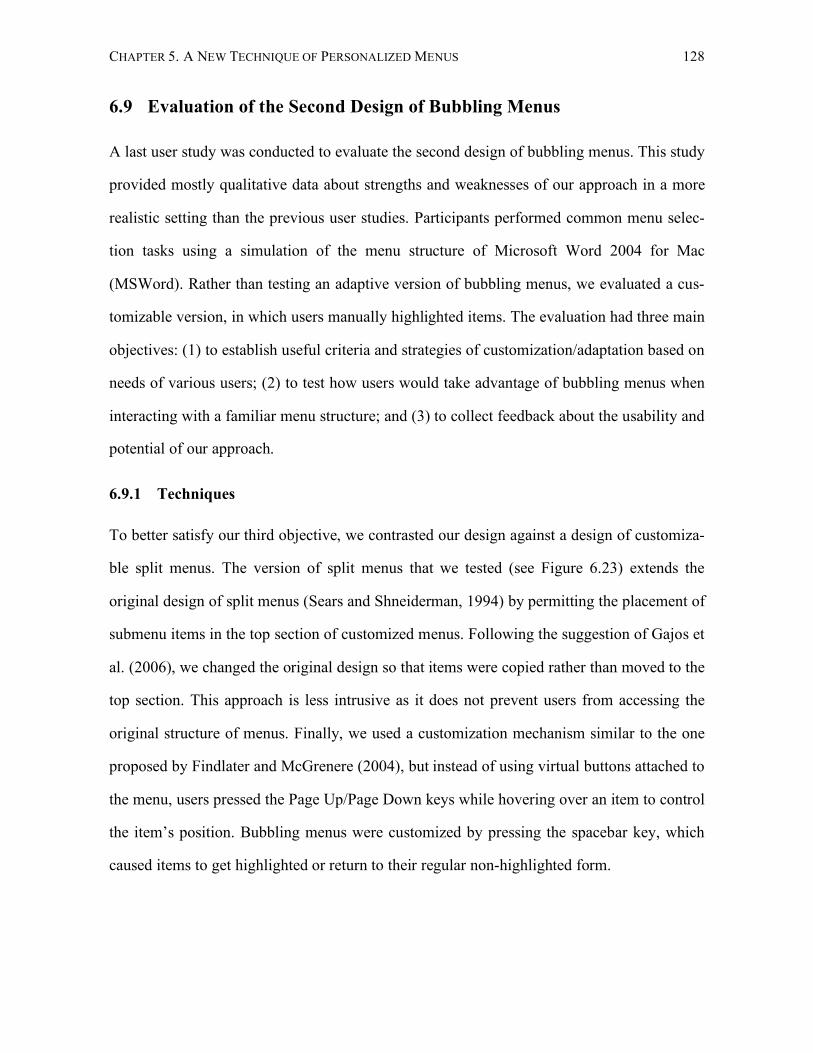
CHAPTER 5. A NEW TECHNIQUE OF PERSONALIZED MENUS 128
6.9 Evaluation of the Second Design of Bubbling Menus
A last user study was conducted to evaluate the second design of bubbling menus. This study
provided mostly qualitative data about strengths and weaknesses of our approach in a more
realistic setting than the previous user studies. Participants performed common menu selec-
tion tasks using a simulation of the menu structure of Microsoft Word 2004 for Mac
(MSWord). Rather than testing an adaptive version of bubbling menus, we evaluated a cus-
tomizable version, in which users manually highlighted items. The evaluation had three main
objectives: (1) to establish useful criteria and strategies of customization/adaptation based on
needs of various users; (2) to test how users would take advantage of bubbling menus when
interacting with a familiar menu structure; and (3) to collect feedback about the usability and
potential of our approach.
6.9.1 Techniques
To better satisfy our third objective, we contrasted our design against a design of customiza-
ble split menus. The version of split menus that we tested (see Figure 6.23) extends the
original design of split menus (Sears and Shneiderman, 1994) by permitting the placement of
submenu items in the top section of customized menus. Following the suggestion of Gajos et
al. (2006), we changed the original design so that items were copied rather than moved to the
top section. This approach is less intrusive as it does not prevent users from accessing the
original structure of menus. Finally, we used a customization mechanism similar to the one
proposed by Findlater and McGrenere (2004), but instead of using virtual buttons attached to
the menu, users pressed the Page Up/Page Down keys while hovering over an item to control
the item’s position. Bubbling menus were customized by pressing the spacebar key, which
caused items to get highlighted or return to their regular non-highlighted form.
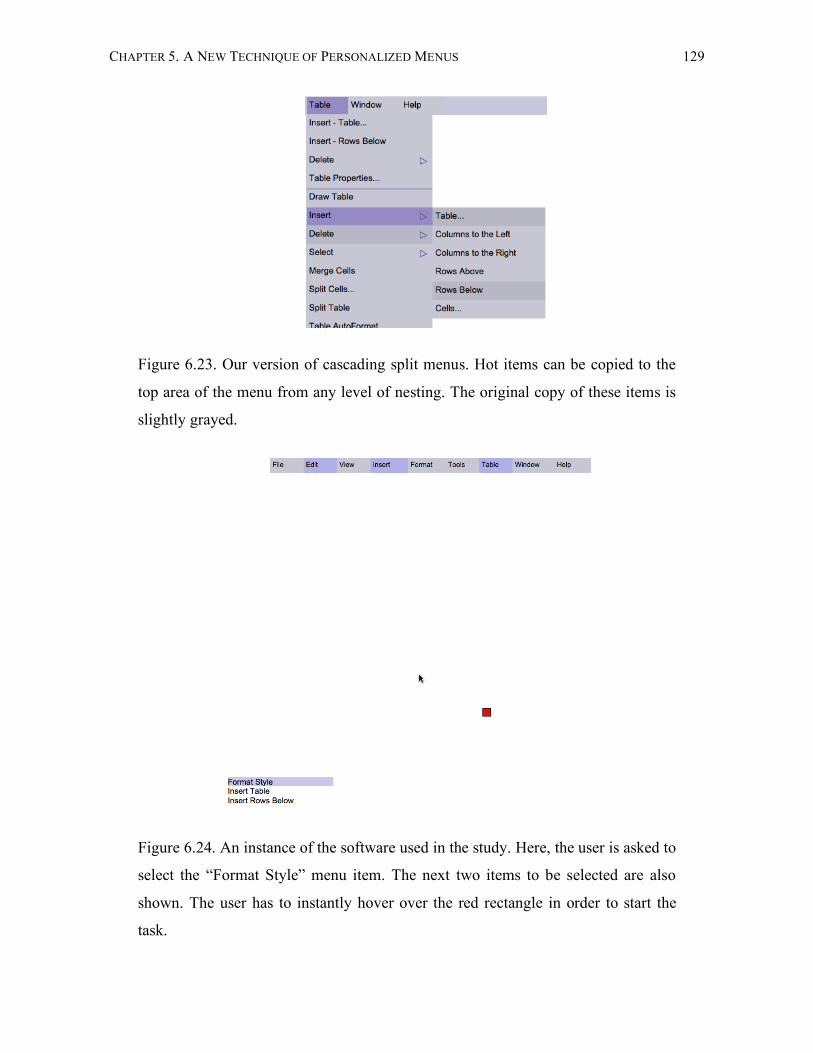
CHAPTER 5. A NEW TECHNIQUE OF PERSONALIZED MENUS 129
Figure 6.23. Our version of cascading split menus. Hot items can be copied to the
top area of the menu from any level of nesting. The original copy of these items is
slightly grayed.
Figure 6.24. An instance of the software used in the study. Here, the user is asked to
select the “Format Style” menu item. The next two items to be selected are also
shown. The user has to instantly hover over the red rectangle in order to start the
task.
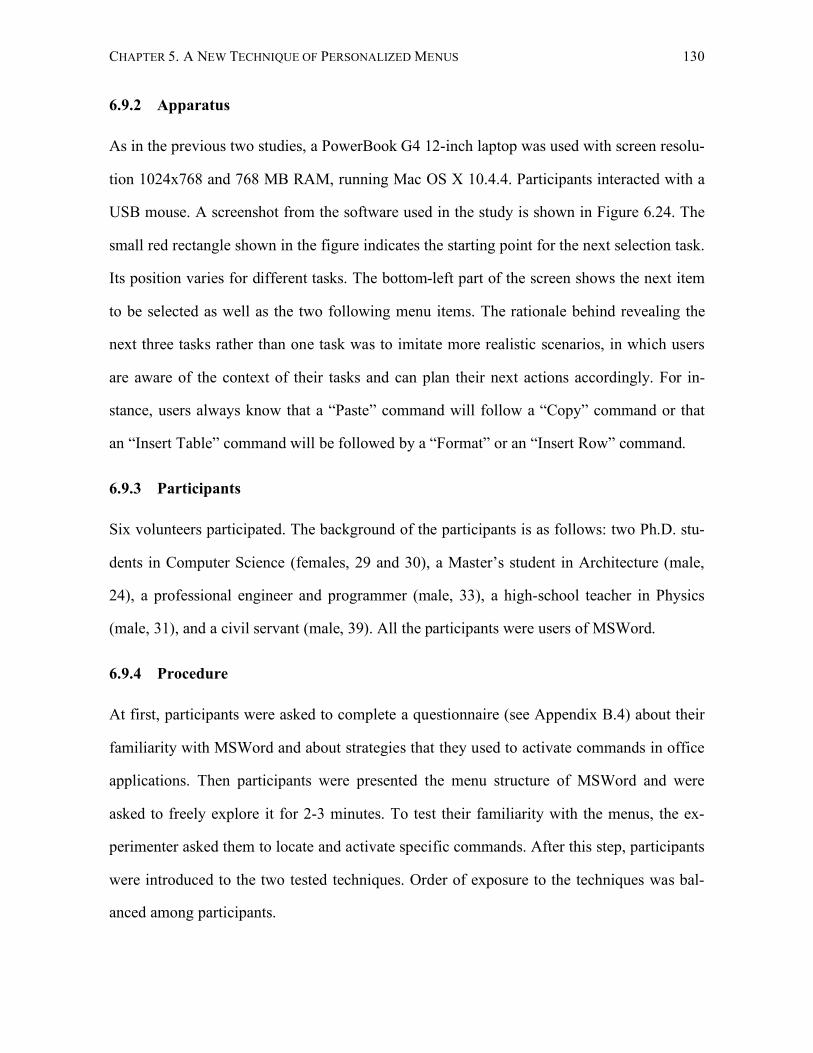
CHAPTER 5. A NEW TECHNIQUE OF PERSONALIZED MENUS 130
6.9.2 Apparatus
As in the previous two studies, a PowerBook G4 12-inch laptop was used with screen resolu-
tion 1024x768 and 768 MB RAM, running Mac OS X 10.4.4. Participants interacted with a
USB mouse. A screenshot from the software used in the study is shown in Figure 6.24. The
small red rectangle shown in the figure indicates the starting point for the next selection task.
Its position varies for different tasks. The bottom-left part of the screen shows the next item
to be selected as well as the two following menu items. The rationale behind revealing the
next three tasks rather than one task was to imitate more realistic scenarios, in which users
are aware of the context of their tasks and can plan their next actions accordingly. For in-
stance, users always know that a “Paste” command will follow a “Copy” command or that
an “Insert Table” command will be followed by a “Format” or an “Insert Row” command.
6.9.3 Participants
Six volunteers participated. The background of the participants is as follows: two Ph.D. stu-
dents in Computer Science (females, 29 and 30), a Master’s student in Architecture (male,
24), a professional engineer and programmer (male, 33), a high-school teacher in Physics
(male, 31), and a civil servant (male, 39). All the participants were users of MSWord.
6.9.4 Procedure
At first, participants were asked to complete a questionnaire (see Appendix B.4) about their
familiarity with MSWord and about strategies that they used to activate commands in office
applications. Then participants were presented the menu structure of MSWord and were
asked to freely explore it for 2-3 minutes. To test their familiarity with the menus, the ex-
perimenter asked them to locate and activate specific commands. After this step, participants
were introduced to the two tested techniques. Order of exposure to the techniques was bal-
anced among participants.
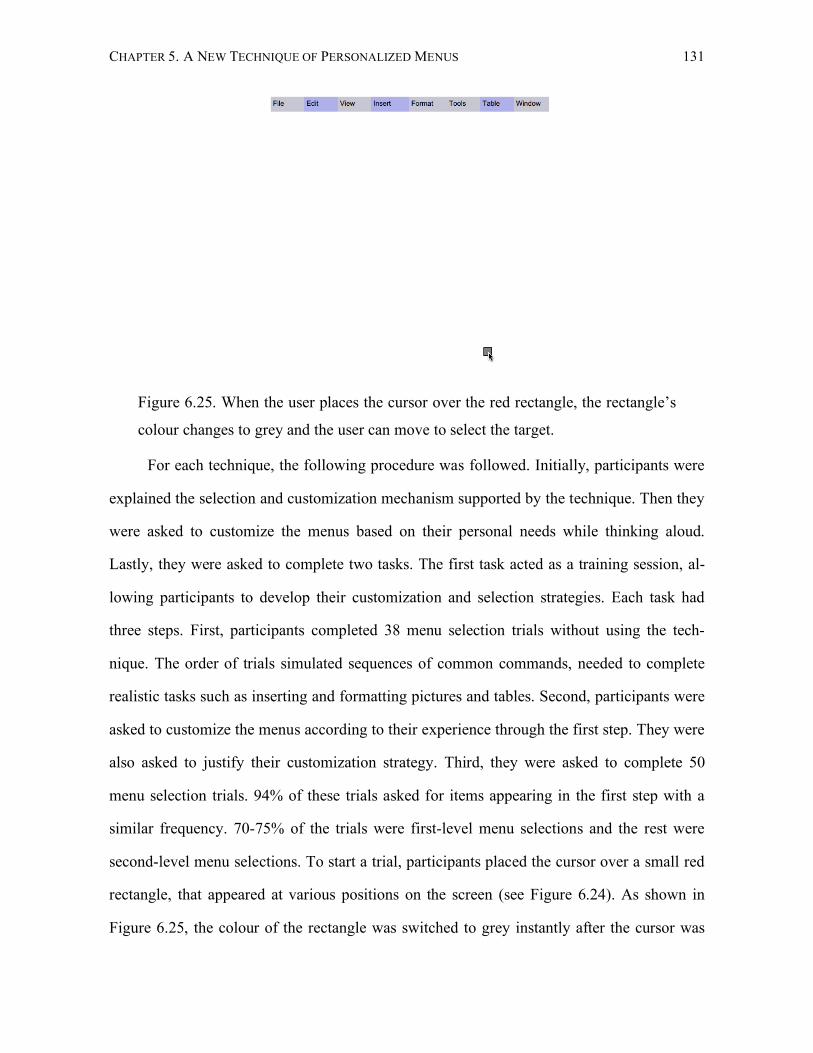
CHAPTER 5. A NEW TECHNIQUE OF PERSONALIZED MENUS 131
Figure 6.25. When the user places the cursor over the red rectangle, the rectangle’s
colour changes to grey and the user can move to select the target.
For each technique, the following procedure was followed. Initially, participants were
explained the selection and customization mechanism supported by the technique. Then they
were asked to customize the menus based on their personal needs while thinking aloud.
Lastly, they were asked to complete two tasks. The first task acted as a training session, al-
lowing participants to develop their customization and selection strategies. Each task had
three steps. First, participants completed 38 menu selection trials without using the tech-
nique. The order of trials simulated sequences of common commands, needed to complete
realistic tasks such as inserting and formatting pictures and tables. Second, participants were
asked to customize the menus according to their experience through the first step. They were
also asked to justify their customization strategy. Third, they were asked to complete 50
menu selection trials. 94% of these trials asked for items appearing in the first step with a
similar frequency. 70-75% of the trials were first-level menu selections and the rest were
second-level menu selections. To start a trial, participants placed the cursor over a small red
rectangle, that appeared at various positions on the screen (see Figure 6.24). As shown in
Figure 6.25, the colour of the rectangle was switched to grey instantly after the cursor was
CHAPTER 5. A NEW TECHNIQUE OF PERSONALIZED MENUS 132
placed over its boundaries, notifying the participant to start the selection task. Together with
the colour change, a brief beep sound was produced as audio feedback
Participants were instructed to follow strategies that would best facilitate their tasks
without rushing. The use of the customization and selection mechanisms supported by the
techniques was optional. At the end, participants were given a questionnaire (see Appendix
B.4) to evaluate the two techniques and rank them against traditional menus. Evaluation ses-
sions lasted from 80 to 120 minutes.
6.9.5 Results
Familiarity with the MSWord menus varied across participants. Two participants (Architec-
ture student and civil servant) spent time searching before being able to locate several com-
mands. The rest of participants could select nearly all the commands required by the tasks
without any searching. The following paragraphs summarize our results. The summary is
based on data recorded in log files, notes taken by the experimenter during the sessions, and
answers given to the questionnaires.
Customization Strategies
Although frequency of use was the primary criterion of customization for all the participants,
customization strategies varied greatly among them. For split menus, the maximum number
of items copied to the top section of a menu ranged from four up to seven items. Partici-
pants’ comments indicated four distinct strategies used to sort items within the top section of
a split menu: (1) sorting items according to the frequency of their selection from top to bot-
tom; (2) preserving the original order of items; (3) grouping items based on logical relation-
ships, e.g., keeping Cut, Copy and Paste together; and (4) ignoring order. Copying nested
items to the top section was a common strategy. According to two participants, replicating
frequently selected items that were either nested or appeared near the bottom of a long menu
was particularly useful.
CHAPTER 5. A NEW TECHNIQUE OF PERSONALIZED MENUS 133
For bubbling menus, the maximum number of highlighted items in a menu ranged
from four to ten. Proximity between menu items did not seem to determine the customization
patterns of participants. Neighbouring items such as Undo, Cut, and Copy were all high-
lighted as they were all used. A participant explained that he chose to highlight all the items
belonging to frequent command sequences. This strategy helped him to easily remember
how items had been customized and minimized the need for switching between different se-
lection techniques. Various strategies were used for customizing the menubar. Two partici-
pants highlighted all the menu categories as long as they were selected at least once through-
out the task. Other participants did not highlight menu categories if they did not contain a
minimum number of frequently selected items, e.g., more than two items. A participant ob-
served that highlighting both the File and Edit menus reduced the effectiveness of the bubble
cursor. He explained that File was an important menu but its items were less frequently se-
lected. Therefore he preferred highlighting only the Edit menu. Finally, two participants
stated that if hotkeys were available, they would use the customization mechanisms only for
commands not usually being selected through hotkeys.
Selection Patterns
After split menus had been customized, items could be found in the top section of split
menus with an average success rate of 68%. In bubbling menus, the average success rate for
highlighted goal items and highlighted top menu categories was 73% and 87%, respectively.
Error rates due to incorrect selections were 1.7% for split menus and 2.6% for bubbling
menus.
Surprisingly, one participant (civil servant) did not use any dragging gestures to inter-
act with bubbling menus. He explained that the use of bubbling menus increased the mental
load required to complete selection tasks. He kept, however, customizing the menus because,
as he explained, highlighting improved visual search. The other five participants used the
technique heavily. On average, in 80% of the trials, users activated the outer bubble cursor.
CHAPTER 5. A NEW TECHNIQUE OF PERSONALIZED MENUS 134
Also, in 70% of the trials, the goal command was selected with the bubble cursor. Besides,
results indicate that the five participants remembered how menus had been customized and
used the bubbling menus selectively. More specifically, the probability that highlighted goal
items were not selected with the bubble cursor was only 4%. Also, the probability that a
bubble cursor was falsely activated to select a non-highlighted goal item under a non-
highlighted menu category was 12%. Overall, for these five participants, the alternative view
of bubbling menus was falsely activated in approximately 7% of the total number of trials.
The same participants “missed” activating the bubble cursor in approximately 3% of the total
number of trials.
Preferences
Three participants, a computer scientist, the Physics teacher, and the professional engineer,
ranked bubbling menus as their first choice, split menus as their second choice, and tradi-
tional menus as their last choice. According to the first participant, bubbling menus “allow
eyes-free selection and gracefully deal with more items than split menus”. The second par-
ticipant stated that bubbling menus “are not very easy to learn but when you do learn they
are very fast in use”. He also noted that “you don’t have to be very accurate with the
mouse”, as the activation area of menu items is larger than in normal menus. The third par-
ticipant commented that bubbling menus would be more appropriate for expert users. He ex-
plained that they better supported selection speed, whereas split menus might be more ap-
propriate for menu-browsing tasks as opposed to goal-oriented tasks.
The second computer scientist and the civil servant ranked split menus as their first
choice followed by bubbling menus. The former explained that split menus were faster than
traditional menus and “less problematic to control” than bubbling menus. She noted, how-
ever, that bubbling menus did “not require accurate motor control” and if she had “mastered”
the technique, bubbling menus might have been ranked as a first choice. Finally, the Archi-
tecture student ranked split menus as his first choice followed by traditional menus. He
CHAPTER 5. A NEW TECHNIQUE OF PERSONALIZED MENUS 135
found that bubbling menus were sometimes “confusing” stating that “speed is the strength of
the mechanism, but it needs awareness”.
Participants were asked whether they would prefer a different version of split menus,
where items were moved instead of copied to the top section. Five out of the six participants
preferred our version of split menus because it supported memorization and allowed them to
ignore the top section. On the other hand, one participant observed that copying instead of
moving menu items overloaded menus with redundant information.
6.9.6 Conclusions
In conclusion, five out of the six participants activated the bubble cursor regularly and rather
effectively. On the other hand, participants’ preferences varied greatly. Only half of the par-
ticipants preferred bubbling menus to split menus.
Results suggest that bubbling menus could be more appropriate for experienced users,
who having familiarized with the menu structure can make selections with single-stroke ges-
tures. We expect that if customization remains constant over time, experienced users can use
bubbling menus in a fashion similar to using marking menus (Kurtenbach and Buxton,
1993). On the other hand, we recognize that some participants found that bubbling menus
were harder to use than traditional menus and split menus. A common difficulty that partici-
pants encountered was using the backtracking mechanism to cancel the bubble cursor. More
intuitive view-switching mechanisms, such automatically canceling the bubble cursor when
the cursor’s center is halted over a menu option, would allow for reducing the cognitive load
associated with decision-making and error correction.
6.10 Summary and Discussion
This chapter presented a user-centered design process to develop bubbling menus, a new
personalization technique for cascading drop-down menus. Bubbling menus facilitate the
CHAPTER 5. A NEW TECHNIQUE OF PERSONALIZED MENUS 136
selection of a subset of menu items, for example, frequently selected items. The design has
been based on the bubble cursor (Grossman and Balakrishnan, 2005), directional mouse-
gestures and floating menus to accelerate menu selection. Bubbling menus do not disturb the
structure of menus and allow users to decide on their own on whether and when to initiate
adaptation. These have been major goals for our design approach, significantly differentiat-
ing it from previous work on adaptive and adaptable menus.
The proposed technique has evolved through two design iterations and has been evalu-
ated extensively. In particular, we have conducted four user studies. Results and observa-
tions coming from these studies have suggested that bubbling menus have several strengths:
1. Menu selection is quick. Menus can be accessed with rough, single-stroke mouse
gestures. The user does not have to move the mouse over a menubar to initiate a se-
lection task.
2. The use of dragging gestures to initiate the bubble cursor is optional. By default, us-
ers can access menus in their traditional form. Yet, even if they choose not to activate
the bubble cursor, users can benefit from the fact that “hot” items are highlighted.
3. Users can initiate the bubble cursor at will, without having to interrupt their ongoing
selection tasks.
4. Bubbling menus allow for simple customization mechanisms. Customization can be
performed incrementally, in parallel with menu selection.
On the other hand, we have identified some limitations of the new technique.
1. Bubbling menus increase the complexity of the interface. Learning how to use them
effectively requires practice. The additional complexity can discourage some users
from using the technique.
CHAPTER 5. A NEW TECHNIQUE OF PERSONALIZED MENUS 137
2. Having to switch between two modes of interaction increases the cognitive overhead,
particularly when users are uncertain about how menus are adapted. This additional
overhead could hurt rather than improve performance.
3. Mainly due to the above two problems, bubbling menus can increase the error rate
when compared to regular or split menus. The first evaluation study revealed an in-
crease in error rate from 1.68% to 2.59% in the best case. Results from the second
evaluation showed a similar trend. Although error inflation is a common problem of
newly-introduced techniques that support fast target selection, e.g., see (Kurtenbach
and Buxton, 1993), (Zhai et al., 2003), (Baudisch et al., 2003), and (Ahlstrom, 2005),
it is a problem that designers should consider.
Given the above limitations, we suggest that the new design should be used in envi-
ronments where any uncertainty about how menus are personalized is minimal. This is pos-
sible if menus are manually customized by the user or alternatively, if they are adapted based
on usage patterns that quickly stabilize over time. In such scenarios, the cognitive overhead
due to decision-making can be minimal. Notice that according to the first evaluation study,
users can still benefit from the technique even if they do not have perfect knowledge of
which items are highlighted. Low uncertainty levels in the range of 10-15% seem to be ac-
ceptable. Finally, as discussed in Section 6.9.6, we believe that the technique can improve if
more intuitive mechanisms for switching between views are added. Such mechanisms could
reduce the complexity of the design, improve error rates, and increase learnability.
138
Chapter 7
Conclusions and Future Directions
The goal of this dissertation has been to gain a systematic understanding of the design and
evaluation of adaptive and adaptable user interfaces. With respect to this goal, its main ob-
jectives have been: (1) to design new adaptation techniques for a range of interfaces; (2) to
explore tradeoffs between adaptive user interfaces and adaptable user interfaces; and (3) to
investigate approaches for the systematic evaluation of adaptation techniques. These objec-
tives have been met, within the scope of specific application domains.
7.1 Contributions
Below, we summarize the main contributions of the dissertation.
7.1.1 Design of Techniques for Adaptive and Adaptable Hypermedia
The dissertation has introduced a range of techniques for adapting hypermedia applications.
We have focused on how automation and user control can be effectively coupled. Specifi-
cally, we have presented two prototypes that introduce new techniques to help users person-
CHAPTER 6. CONCLUSIONS AND FUTURE DIRECTIONS 139
alize the presentation of Web content, hyperlinks on Web pages, and browsing histories. The
prototypes include mechanisms that allow users to define their own classification schemes,
represent the parameters of these schemes by sliders, and manipulate the sliders to filter in-
formation on Web pages. We have demonstrated how such interactions can be realized in a
Web environment. We have also explored several interaction techniques that let users con-
trol the adaptation of hypermedia content: zoomable tags to represent parameters of a user
model, popup sliders to control the user model, popup glosses to provide feedback about
hidden information, and animation to support fluid transitions between adapted views of
Web content. The dissertation documented two small user studies that evaluated these tech-
niques.
7.1.2 Systematic Treatment of Accuracy Effects in Experimental Designs
As opposed to static user interfaces, adaptive user interfaces are built on top of user model-
ing and decision-making mechanisms, whose actions are out of the direct control of users. A
result of this is that the success of an adaptive interface relies on the ability of the underlying
adaptation mechanisms to infer the needs of users and make correct decisions. If an adapta-
tion technique is tested on top of poor inference and poor decision-making, it is likely that no
benefits will be observed.
The dissertation explored this issue in connection with previous work on the evalua-
tion of adaptive user interfaces. It suggested that evaluations of adaptive user interfaces
should separate the user interface from the underlying adaptation mechanism, ensuring, at
the same time, that variable properties of the adaptation mechanism are identified and con-
trolled or treated as independent variables. Our work primarily focused on the effect of adap-
tation accuracy on the performance of adaptation techniques. To explore this effect, we con-
ducted an experiment with 12 participants that compared two adaptation techniques for long
lists, under various accuracy levels. We found accuracy affects the overall success of an ad-
CHAPTER 6. CONCLUSIONS AND FUTURE DIRECTIONS 140
aptation technique and determines how it compares with others. For instance, scaling out
items that are infrequently selected reduces the visual space of the list and facilitates the se-
lection of frequently selected items. However, this technique can seriously hinder user per-
formance if the adaptation mechanism cannot accurately predict the real selection patterns of
the user. We also found that accuracy had a great impact on how users made use of auto-
matic assistance. We observed that user reliance on adaptation decreases as accuracy be-
comes low. When interacting with adaptive lists, participants tended to miss system sugges-
tions if there was a high probability that the suggestions would be wrong. We observed simi-
lar effects when, later, we evaluated a new design of personalized menus. When participants
interacted with an adaptive version of the menus, they tended to be more cautious about sys-
tem suggestions when accuracy was low than when accuracy was high. In particular, they
spent more time “thinking” before following suggestions, even when suggestions were cor-
rect.
Based on our findings, we made recommendations about how accuracy should be con-
sidered when evaluating adaptive user interfaces.
7.1.3 Design and Evaluation of Bubbling Menus
The dissertation has introduced bubbling menus, a new design of personalized cascading
menus. To our best knowledge, bubbling menus is the first widget implementation that
makes use of the bubble cursor (Grossman and Balakrishnan, 2005). The new technique im-
proves selection performance, allowing users to access menu items with rough mouse move-
ments. Contrary to other designs, it does not change the original structure of menus to
provide adaptation. Furthermore, the activation of the quick selection mechanism supported
by its design is optional. Users can activate it at any time and only if they think that it can
facilitate their task.
CHAPTER 6. CONCLUSIONS AND FUTURE DIRECTIONS 141
Bubbling menus have been developed through an extensive user-centered design proc-
ess. This process involved two main design iterations and four user studies. First, an experi-
ment with 12 participants was conducted, in the context of simple pointing tasks, to assess
cognitive overheads associated with decision-making when target expansion is user-initiated.
A second user study with 16 participants evaluated our first design of menus, focusing on
motor performance. A third study with four participants tested a potential bias of the control
condition tested by the second study. Finally, a fourth study with six participants was con-
ducted to evaluate the final design of bubbling menus in more realistic tasks. The second
study tested an adaptive version of the proposed design, whereas the fourth study tested a
customizable version of the design, contrasting it with customizable split menus (Findlater
and McGrenere, 2004).
We have concluded that bubbling menus are more useful for experienced users. We
have also suggested that they are appropriate when uncertainty about how menus are adapted
is low. Therefore, personalization in bubbling menus should be based on customization or
selection patterns that become stable over time.
7.2 Future Directions
We see three main directions for future work: (1) improving our designs and extending them
to other types of widgets and interfaces; (2) exploring aspects of adaptive behaviour that
were not examined by this dissertation; and (3) establishing detailed design guidelines for
adaptive/-able user interfaces through comparative evaluation studies.
7.2.1 Improving and Extending the Proposed Designs
There are many possibilities for improving and extending the interaction techniques pre-
sented in this dissertation. First, our proposed Web-based adaptation techniques have been
applied to a small range of pages. Their generalization to a broader class of pages is not
CHAPTER 6. CONCLUSIONS AND FUTURE DIRECTIONS 142
straightforward. For instance, the fisheye-like adaptation technique cannot be applied di-
rectly to pages that contain multiple columns like a front page of a newspaper. New tech-
niques should be developed for more general page layouts. Furthermore, we need to evaluate
our designs in more realistic scenarios and verify whether users would make use of the pro-
posed controllers to adapt Web pages.
The implementation of more effective mechanisms for controlling adaptation is an-
other future goal. In Chapter 4 (Section 5.5), we have proposed an improved design of
shrinking lists, which allows users to fluidly switch from shrunk views, that provide global
context, to expanded views, that support local focus and better motor control. View switch-
ing in bubbling menus could be improved with mechanisms that do not require users to
move the mouse to the right of a menu. A mechanism that we have considered is the use of
time-sensitive target selection: when the user pauses over an item for more than a threshold
time, the menu switches from the adapted to its normal view. We expect that this approach
will reduce the cognitive overhead associated with decision-making under uncertainty. We
also believe that such techniques can be useful for generic target-acquisition tasks. In par-
ticular, we have started experimenting with interaction designs, where frequently selected
targets are selected with fast movements that expand their activation areas, while normal tar-
gets are selected with slower movements. Exploring time thresholds over which transitions
between these two types of selection occurs is a challenging problem.
Another direction for future work is the application of bubbling menus to pen-based
interfaces, where the absence of a keyboard disallows the use of hotkeys. Also, the technique
could be extended to other types of widgets, such as contextual menus, toolbars and tree
structures. When targets in an interface component cannot all fit on the screen, expansion of
activation areas could be combined with distortion-based fisheye view techniques that visu-
ally shrink information to provide summarization. This approach would facilitate the access
of frequently selected items in large lists of items.
CHAPTER 6. CONCLUSIONS AND FUTURE DIRECTIONS 143
Finally, it would be interesting to examine whether selection techniques other than the
bubble cursor could be used to accelerate the selection of frequently selected menu items.
The design of the bubble cursor does not take into consideration the direction of movement
and other parameters of motion such as velocity and acceleration. Non-circular shapes of
dynamically resizable cursors, e.g., ellipses, could be used to address this limitation. For in-
stance, we have been considering designs in which the shape of a bubble cursor changes
from circular to ellipsoid. Such designs can use information about motion and boost the se-
lection of targets appearing along the movement direction. As an example, consider an ellip-
soid cursor, whose major axis, parallel to the movement direction, grows as velocity in-
creases, while the minor axis becomes shorter.
7.2.2 Studying Additional Parameters of Adaptation
The dissertation investigated the effect of accuracy, but other important parameters of adap-
tation have not been examined. For instance, we hypothesize that the stability of an adaptive
user interface over time could greatly affect user performance. Slow changes in a user inter-
face support predictability. On the other hand, slow changes cannot reflect rapid changes in
user needs. Furthermore, Some widgets could be more sensitive to changes than others, e.g.,
menus compared to toolbars, depending on the frequency of their use and the type of tasks
that dominate their manipulation, e.g., motor versus cognitive. Similarly, adaptation tech-
niques that change the structure of the interface could be more sensitive to changes than
techniques that simply annotate it. Testing the scope of these hypotheses will provide addi-
tional insight about the design of adaptation techniques.
Our evaluations were not conducted over real intelligent systems. On the one hand,
this allowed us to control potential confounding variables. On the other hand, the effect of
individual characteristics of inference mechanisms was not examined. Inference heuristics
such as frequency of use and recency are easy to understand. Therefore, they are expected to
CHAPTER 6. CONCLUSIONS AND FUTURE DIRECTIONS 144
result in adaptive user interfaces with simple conceptual models. Adaptive menus in MS Of-
fice 2000 intermixed both recency and frequency of use (Findlater and McGrenere, 2004),
possibly resulting in a complex conceptual model. Whether and to which extent this ap-
proach has affected the success of this interface is unknown. On the other hand, sophisti-
cated inference mechanisms that combine multiple heuristics to predict user goals can be
more accurate. Systematically studying this trade-off is a future goal.
Finally, we are interested in models that could describe performance in adaptive user
interfaces. Cockburn et al. (2007) recently proposed a predictive model of menu perform-
ance, which models pointing time, as well as visual search and decision time. It also takes
into consideration the transition of users from novices to experts. Using this model as a
framework to study adaptation and model the performance of a wide range of adaptation
techniques is a research direction worth of future investigation.
7.2.3 Establishing Detailed Design Guidelines for Adaptive and Adaptable User Inter-
faces
Despite the fact that adaptive user interfaces have existed for more than 20 years, research
has not resulted yet in clear guidelines about the design of adaptive user interfaces. How-
ever, we envision that the systematic assessment of adaptation techniques through compara-
tive studies will eventually lead to extensive guidelines about their design. Our experience
has shown that adaptive user interfaces cannot completely change the way users interact with
computers. Nevertheless, they can considerably improve usability, provided that they are
carefully designed, take into consideration real user needs and respect well-established de-
sign principles. Some general guidelines about the design and evaluation of adaptive user
interface, coming from our own research, as well as the work of other researchers, are sum-
marized below.
CHAPTER 6. CONCLUSIONS AND FUTURE DIRECTIONS 145
- Expected benefits coming from the use of adaptation should be large enough to outweigh
any potential costs. If benefits are expected to be tiny, adaptation should not be considered
as an alternative solution, since adding complexity to the user interface might introduce
new costs and hinder rather than help users.
- Adaptation techniques applied to an interface should be selected with respect to the ex-
pected accuracy. If accuracy is expected to be low, the technique should be as less intrusive
as possible. Also, it should support mechanisms that let users overcome inaccurate system
actions with minimal cost. The cost of inaccurate system actions could be further reduced
by making adaptive behaviour transparent, helping the user predict its outcome and de-
velop appropriate interaction strategies.
- Allowing users to adapt a user interface on their own could be more effective than auto-
matically adapting it. Designers should consider effective ways to combine automation
with adaptability.
- User characteristics such as user expertise should be carefully considered when designing
adaptation techniques. For instance, adaptive behaviour should not disrupt the past experi-
ence of expert users, since they highly depend on it to complete their tasks. Novice users,
on the other hand, might not notice changes in an adaptive interface, as their mental model
is incomplete. However, in the long run, such changes could prevent them from learning to
use the interface effectively.
Future work needs to explore these issues more systematically in various application
domains and find the best trade-offs between benefits coming from adaptation and its costs.
146
References
Abrams, D., Baecker, R. and Chignell, M. (1998). Information Archiving with Bookmarks:
Personal Web Space Construction and Organization. ACM CHI Conference on Hu-
man Factors in Computing Systems, pp. 41-48.
Accot, J. and Zhai, S. (1997). Beyond Fitts' Law: Models for Trajectory-Based Hci Tasks.
ACM CHI Conference on Human Factors in Computing Systems, pp. 295-302.
Ahlberg, C. and Shneiderman, B. (1994). Visual Information Seeking: Tight Coupling of
Dynamic Query Filters with Starfield Displays. ACM CHI Conference on Human
Factors in Computing Systems, pp. 313-317.
Ahlstrom, D. (2005). Modeling and Improving Selection in Cascading Pull-Down Menus
Using Fitts' Law, the Steering Law and Force Fields. ACM CHI Conference on Hu-
man Factors in Computing Systems, pp. 61-70.
Anderson, C. R. and Horvitz, E. (2002). Web Montage: A Dynamic Personalized Start Page.
International World Wide Web Conference, pp. 704-712.
Andre, E. and Rist, T. (2002). From Adaptive Hypertext to Personalized Web Companions.
Communications of the ACM, 45(5), 43-46.
REFERENCES 147
Bailey, C., El-Beltagy, S. R. and Hall, W. (2001). Link Augmentation: A Context-Based
Approach to Support Adaptive Hypermedia. Workshop on Adaptive Hypertext and
Hypermedia, pp. 239-251.
Baudisch, P., Cutrell, E., Robbins, D., Czerwinski, M., Tandler, P., Bederson, B., et al.
(2003). Drag-and-Pop and Drag-and-Pick: Techniques for Accessing Remote Screen
Content on Touch- and Pen-Operated Systems. Interact, pp. 57-64.
Bauer, T. and Leake, D. B. (2001). Wordsieve: A Method for Real-Time Context Extraction.
International and Interdisciplinary Conference, Context, pp. 30-44.
Bederson, B., Grosjean, J. and Meyer, J. (2004). Toolkit Design for Interactive Structured
Graphics. IEEE Transactions on Software Engineering, 30(8), 535-546.
Bederson, B. (2000). Fisheye Menus. ACM UIST Symposium on User Interface Software
and Technology, pp. 217-225.
Bederson, B., Hollan, J. D., Stewart, J., Rogers, D., Druin, A. and Vick, D. (1998). A Zoom-
ing Web Browser. Human Factors and Web Development, Ch. 19, 255-266.
Blanch, R., Guiard, Y. and Beaudouin-Lafon, M. (2004). Semantic Pointing: Improving Tar-
get Acquisition with Control-Display Ratio Adaptation. ACM CHI Conference on
Human Factors in Computing Systems, pp. 519-525.
Boyle, C. and Encarnacion, A. O. (1994). Metadoc: An Adaptive Hypertext Reading System.
User Modeling and User-Adapted Interaction, 4(1), 1-19.
Brusilovsky, P. (1996). Methods and Techniques of Adaptive Hypermedia. User Modeling
and User-Adapted Interaction, 6(2-3), 87-129.
Brusilovsky, P. (2001). Adaptive Hypermedia. Modeling and User Adapted Interaction,
11(1-2), 87-110.
REFERENCES 148
Brusilovsky, P., Karagiannidis, C. and Sampson, D. (2004). The Benefits of Layered Evalua-
tion of Adaptive Applications and Services. International Journal of Continuing En-
gineering Education and Lifelong Learning, 14(4/5), 402-421.
Budzik, J., K., H. and Birnbaum, L. (2001). Information Access in Context. Knowledge
based systems, 14(1-2), 37-53.
Bunt, A., Conati, C. and McGrenere, J. (2004). What Role Can Adaptive Support Play in and
Adaptable System? ACM International Conference Intelligent User Interfaces, pp.
117-124.
Bunt, A., Conati, C. and McGrenere, J. (2007). Supporting Interface Customization Using a
Mixed-Initiative Approach. ACM International Conference Intelligent User Inter-
faces, pp. 92-101.
Carlis, J. V. and Konstan, J. A. (1998). Interactive Visualization of Serial Periodic Data.
ACM UIST Symposium on User Interface Software and Technology, pp. 29-38.
Catledge, L. D. and Pitkow, J. E. (1995). Characterizing Browsing Strategies in the World-
Wide Web. International World Wide Web Conference.
Chin, D. (2001). Empirical Evaluations of User Models and User-Adapted Systems. User
Modeling and User-Adapted Interaction.
Cockburn, A. and Firth, A. (2003). Improving the Acquisition of Small Targets. British HCI
Conference, pp. 181-196.
Cockburn, A. and Gin, A. (2006). Faster Cascading Menu Selections with Enlarged Activa-
tion Areas. Conference on Graphics Interface, pp. 65-71.
Cockburn, A. and Greenberg, S. (1999). Issues of Page Representation and Organisation in
Web Navigation Tools. OZCHI Australian Conference on Human Computer Interac-
tion.
REFERENCES 149
Cockburn, A., Greenberg, S., McKenzie, B., Jasonsmith, M. and Kaasten, S. (1999).
Webview: A Graphical Aid for Revisiting Web Pages. OZCHI Australian Confer-
ence on Human Computer Interaction.
Cockburn, A., Gutwin, C. and Greenberg, S. (2007). A Predictive Model of Menu Per-
fomance. ACM CHI Conference on Human Factors in Computing Systems.
Conklin, J. (1987). Hypertext: An Introduction and Survey. Computer, IEEE Computer So-
ciety Press, 20(9), 17-41.
Cook, R. and Kay, J. (1994). The Justified User Model: A Viewable, Explained User Model.
International Conference on User Modeling, pp. 145-150.
Czarkowski, M. and Kay, J. (2003). How to Give the User a Sense of Control over the Per-
sonalization of Ah? Workshop on Adaptive Hypermedia and Adaptive Web-Based
Systems, pp. 121-132.
El-Beltagy, S. R., Hall, W., Roure, D. D. and Carr, L. (2001). Linking in Context. ACM
Conference on Hypertext and Hypermedia, pp. 151-160.
Faaborg, A. and Lieberman, H. (2006). A Goal-Oriented Web Browser. ACM CHI Confer-
ence on Human Factors in Computing Systems, pp. 751-760.
Ferketich, S. and Verran, J. (1994). An Overview of Data Transformation. Research in Nurs-
ing & Health, 17(5), 393 - 396.
Findlater, L. and McGrenere, J. (2004). A Comparison of Static, Adaptive, and Adaptable
Menus. ACM CHI Conference on Human Factors in Computing Systems, pp. 89-96.
Fischer, G. (2001). User Modeling in Human-Computer Interaction. User Modeling and
User-Adapted Interaction, 11(1-2), 65-86.
Fitts, P. M. (1954). The Information Capacity of the Human Motor System in Controlling
the Amplitude of Movement. Journal of Experimental Psychology, 47(6), 381-391.
REFERENCES 150
Furnas, G. W. (1986). Generalized Fisheye Views. ACM CHI Conference on Human Factors
in Computing Systems, pp. 16-23.
Gajos, K. Z., Christianson, D., Hoffmann, R., Shaked, T., Henning, K., Long, J. J., et al.
(2005). Fast and Robust Interface Generation for Ubiquitous Applications. UBI-
COMP, pp. 37-55.
Gajos, K. Z., Czerwinski, M., Tan, D. S. and Weld, D. S. (2006). Exploring the Design
Space for Adaptive Graphical User Interfaces. ACM AVI Conference on Advanced
Visual Interfaces, pp. 201-208.
Girden, E. R. (1992). Anova Repeated Measures: Sage Publications.
Greenberg, S., Gutwin, C. and Cockburn, A. (1996). Using Distortion-Oriented Displays to
Support Workspace Awareness. British HCI Conference, pp. 299-314.
Greenberg, S. and Witten, I. (1985). Adaptive Personalized Interfaces: A Question of Viabil-
ity. Behaviour and Information Technology, 4(1), 31-45.
Grossman, T. and Balakrishnan, R. (2005). The Bubble Cursor: Enhancing Target Acquisi-
tion by Dynamic Resizing of the Cursor's Activation Area. ACM CHI Conference on
Human Factors in Computing Systems, pp. 281-290.
Guirard, Y., Blanch, R. and Beaudouin-Lafon, M. (2004). Object Pointing: A Complement
to Bitmap Pointing in Guis. Conference on Graphics Interface, pp. 9-16.
Hascoet, M. (2001). Interaction and Visualization Supporting Web Browsing Patterns. IEEE
International Conference on Information Visualization, pp. 413-418.
Hick, W. E. (1952). On the Rate of Gain of Information. Quarterly Journal of Exmperimen-
tal Psychology, 4, 11-26.
Hirashima, T., Matsuda, N., Nomoto, T. and Toyoda, J. (1998). Context-Sensitive Filtering
for Browsing in Hypertext. ACM International Conference on Intelligent User Inter-
faces, pp. 119-126.
REFERENCES 151
Hochheiser, H. and Shneiderman, B. (1999). Understanding Patterns of User Visits to Web
Sites: Interactive Starfield Visualizations of Www Log Data. Journal of the Ameri-
can Society for Information Science and Technology, 54(4), 331-343.
Hohl, H., Böcker, H.-D. and Gunzenhäuser, R. (1996). Hypadapter: An Adaptive Hypertext
System for Exploratory Learning and Programming. User Modeling and User-
Adapted Interaction, 6(2-3), 131-155.
Holmquist, L. E. (1997). Focus+Context Visualization with Flip Zooming and the Zoom
Browser. ACM CHI Conference on Human Factors in Computing Systems, Extended
Abstracts, pp. 263-264.
Hook, K. (1997). Evaluating the Utility and Usability of an Adaptive Hypermedia System.
ACM International Conference Intelligent User Interfaces, pp. 179-186.
Hook, K. (2000). Steps to Take before Intelligent User Interfaces Become Real. Interacting
with Computers, 12(4), 409-426.
Hook, K., Karlgren, J., Waern, A., Dahlback, N., Jansson, C. G., Karlgren, K., et al. (1996).
A Glass Box Approach to Adaptive Hypermedia. User Modeling and User-Adapted
Interaction, 6(2-3), 157-184.
Horvitz, E. (1999). Principles of Mixed-Initiative User Interfaces. ACM CHI Conference on
Human Factors in Computing Systems, pp. 159-166.
Horvitz, E. and Apacible, J. (2003). Learning and Reasoning About Interruption. ICMI,
ACM International Conference on Multimodal Interfaces, pp. 20-27.
Horvitz, E., Breese, J., Heckerman, D., Hovel, D. and Rommelse, K. (1998). The Lumiere
Project: Bayesian User Modeling for Inferring the Goals and Needs of Software Us-
ers. Conference on Uncertainty in Artificial Intelligence, pp. 256-265.
Hothi, J. K., Hall, W. and Sly, T. (2000). A Study Comparing the Use of Shaded Text and
Adaptive Navigational Support in Adaptive Hypermedia. International Conference
on Adaptive Hypermedia and Adaptive Web-Based Systems, pp. 335-342.
REFERENCES 152
Hui, B. and Boutilier, C. (2006). Who's Asking for Help? A Bayesian Approach to Intelli-
gent Assistance. ACM International Conference Intelligent User Interfaces, pp. 117-
124
Jameson, A. and Schwarzkopf, E. (2002). Pros and Cons of Controllability: An Empirical
Study. Adaptive Hypermedia and Adaptive Web-Based Systems. International Con-
ference on Adaptive Hypermedia and Adaptive Web-Based Systems, pp. 193-202.
Janecek, P. and Pu, P. (2002). A Framework for Designing Fisheye Views to Support Multi-
ple Semantic Contexts. ACM AVI Conference on Advanced Visual Interfaces, pp.
51-58.
Joachims, T., Freitag, D. and Mitchell, T. M. (1997). Webwatcher: A Tour Guide for the
World Wide Web. International Joint Conference on Artificial Intelligence, pp. 770-
777.
Johnson, B. and Shneiderman, B. (1991). Tree-Maps: A Space-Filling Approach to the Visu-
alization of Hierarchical Information Structures. IEEE Visualization Conference, pp.
284-291.
Kaplan, C., Fenwick, J. and Chen, J. (1993). Adaptive Hypertext Navigation Based on User
Goals and Context. User Modeling and User-Adapted Interaction, 3, 193-220.
Kay, J. (2001). Learner Control. User Modeling and User-Adapted Interaction, 11(1-2), 111-
127.
Kobayashi, M. and Igarashi, T. (2003). Considering the Direction of Cursor Movement for
Efficient Traversal of Cascading Menus. ACM UIST Symposium on User Interface
Software and Technology, pp. 91-94.
Koda, T. and Maes, P. (1996). Agents with Faces: The Effects of Personification of Agents.
British HCI Conference, pp. 98-103.
REFERENCES 153
Konstan, J. A., Miller, B. N., Maltz, D., Herlocker, J. L., Gordon, L. R. and Riedl, J. (1997).
Grouplens: Applying Collaborative Filtering to Usenet News. Communications of the
ACM, 40(3), 77-87.
Kuhme, T. (1993). A User-Centered Approach to Adaptive Interfaces. ACM International
Conference Intelligent User Interfaces, pp. 243-245.
Kuhme, T., Dieterich, H., Malinowski, U. and Schneider-Hufschmidt, M. (1992). Ap-
proaches to Adaptivity in User Interface Technology: Survey and Taxonomy. IFIP
TC2/WG2.7 Working Conference on Engineering for Human-Computer Interaction,
pp. 225-252.
Kurtenbach, G. and Buxton, W. (1993). The Limits of Expert Performance Using Hierarchic
Marking Menus. InterCHI, pp. 482-487.
Lamping, J., Rao, R. and Pirolli, P. (1995). A Focus+Context Technique Based on Hyper-
bolic Geometry for Visualizing Large Hierarchies. ACM CHI Conference on Human
Factors in Computing Systems, pp. 401-408.
Landauer, T. K. and Nachbar, D. W. (1985). Selection from Alphabetic and Numeric Menu
Trees Using a Touch Screen: Breadth, Depth, and Width. ACM CHI Conference on
Human Factors in Computing Systems, pp. 73-78.
Lane, D. M., Napier, A. H., Peres, C. S. and Sandor, A. (2005). The Hidden Costs of
Graphical User Interfaces: The Failure to Make the Transition from Menus and Icon
Tool Bars to Keyboard Shortcuts. International Journal of Human-Computer Inter-
action, 18(2), 133-144.
Lee, J. D. and See, K. A. (2004). Trust in Automation: Designing for Appropriate Reliance.
Human Factors, 46(1), 50-80.
Lewis, M. (1998). Designing for Human-Agent Interaction. AI Magazine, 19(2), 67-78.
REFERENCES 154
Li, W.-S., Vu, Q., Agrawal, D., Hara, Y. and Takano, H. (1999). Powerbookmarks: A Sys-
tem for Personalizable Web Information Organization, Sharing, and Management.
International World Wide Web Conference, pp. 1375-1389.
Lieberman, H. (1995). Letizia: An Agent That Assists Web Browsing. International Joint
Conference on Artificial Intelligence, pp. 924-929.
Linton, F., Joy, D. and Schaefer, H.-P. (1999). Building User and Expert Models by Long-
Term Observation of Application Usage. International Conference on User Model-
ing, pp. 129-138.
Luce, R. D. (1986). Response Times and Their Role in Inferring Elementary Mental Organi-
zation: Oxford University Press.
Mackay, W. E. (1991). Triggers and Barriers to Customizing Software. ACM CHI Confer-
ence on Human Factors in Computing Systems, pp. 153-160.
Marchionini, G. (1995). Information Seeking in Electronic Environments: Cambridge Uni-
versity Press.
McGrenere, J. (2002). The Design and Evaluation of Mutliple Interfaces: A Solution for
Complex Software. Ph.D. Dissertation, University of Toronto, Toronto, Canada.
McGrenere, J., Baecker, R. M. and Booth, K. S. (2002). An Evaluation of a Multiple Inter-
face Design Solution for Bloated Software. ACM CHI Conference on Human Factors
in Computing Systems, pp. 163-170.
McGrenere, J. and Moore, G. (2000). Are We All in the Same "Bloat"? Conference on
Graphics Interface, pp. 187-196.
McGuffin, M. and Balakrishnan, R. (2002). Acquisition of Expanding Targets. ACM CHI
Conference on Human Factors in Computing Systems, pp. 57-64.
REFERENCES 155
McGuffin, M., Burtnyk, N. and Kurtenbach, G. (2002). Fast Sliders: Integrating Marking
Menus and the Adjustment of Continuous Values. Conference on Graphics Interface,
pp. 25-34.
McGuffin, M., Davison, G. and Balakrishnan, R. (2004). Expand-Ahead: A Space-Filling
Strategy for Browsing Trees. IEEE InfoVis Conference, pp. 119-126.
McKenzie, B. and Cockburn, A. (2001). An Empirical Analysis of Web Page Revisitation.
Hawaiian International Conference on System Sciences.
Miller, R. C. (2006). Human Capabilities - Lecture Notes. Department of Electrical Engi-
neering and Computer Science, MIT,
http://courses.csail.mit.edu/6.831/lectures/L3.pdf.
Mitchell, J. and Shneiderman, B. (1989). Dynamic Versus Static Menus: An Exploratory
Comparison. SIGCHI Bulletin, 20(4), 33-37.
Mladenic, D. (1996). Personal Webwatcher: Implementation and Design., Technical Report.
Department of Intelligent Systems, J.Stefan Institute.
Mozilla. Xml User Interface Language (Xul). http://www.mozilla.org/projects/xul/
Muir, B. and Moray, N. (1996). Trust in Automation. Part Ii. Experimental Studies of Trust
and Human Intervention in a Process Control Simulation. Ergonomics, 39(3), 429-
460.
Nielsen, J. (1990). Hypertext and Hypermedia: Academic Press.
Noik, E. G. (1993). Exploring Large Hyperdocuments: Fisheye Views of Nested Networks.
ACM Conference on Hypertext and Hypermedia, pp. 192-205.
Norman, D. A. (1986). Some Observations on Mental Models: Hillsdale, New Jersey: Law-
rence Erlbaum Associates.
Norman, K. L. (1991). The Psychology of Menu Selection: Designing Cognitive Control at
the Human/Computer Interface: Alex Publishing Corporation.
REFERENCES 156
Paramythis, A., Totter, A. and Stephanidis, C. (2001). A Modular Approach to the Evalua-
tion of Adaptive User Interfaces. Workshop on Empirical Evaluation of Adaptive
Systems, pp. 9-24.
Parasuraman, R. (1997). Humans and Automation: Use, Misuse, Disuse, Abuse. Human
Factors, 39(2), 230-253.
Pazzani, M. J., Muramatsu, J. and Billsus, D. (1996). Syskill & Webert: Identifying Interest-
ing Web Sites. National Conference on Artificial Intelligence, pp. 54-61.
Salton, G. (1991). Developments in Automatic Text Retrieval. Science, 253, 974-979.
Sarkar, M. and Brown, M. H. (1992). Graphical Fisheye Views of Graphs. ACM CHI Con-
ference on Human Factors in Computing Systems, pp. 83-91.
schraefel, m. c., Smith, D. A., Owens, A., Russell, A., Harris, C. and Wilson, M. (2005). The
Evolving Mspace Platform: Leveraging the Semantic Web on the Trail of the Me-
mex. ACM Conference on Hypertext and Hypermedia, pp. 174-183.
Sears, A. and Shneiderman, B. (1994). Split Menus: Effectively Using Selection Frequency
to Organize Menus. ACM Transactions on Computer-Human Interaction, 1(1), 27-
51.
Sebastiani, F. (2002). Machine Learning in Automated Text Categorization. ACM Comput-
ing Surveys, 34(1), 1-47.
Shneiderman, B. (1983). Direct Manipulation: A Step Beyond Programming. IEEE Com-
puter, 16(8), 57-69.
Shneiderman, B. and Maes, P. (1997). Direct Manipulation Vs. Interface Agents. Interac-
tions, ACM, 4(6), 42-61.
Skopik, A. and Gutwin, C. (2003). Finding Things in Fisheyes: Memorability in Distorted
Spaces. Conference on Graphics Interface, pp. 67-75.
Sun. Java Sevlet Technology. http://java.sun.com/products/servlet/.
REFERENCES 157
Tauscher, L. and Greenberg, S. (1997). How People Revisit Web Pages: Empirical Findings
and Implications for the Design of History Systems. International Journal of Human-
Computer Studies, 47, 97-137.
Tsandilas, T. and schraefel, m. c. (2003). Adaptive Presentation Supporting Focus and Con-
text. Workshop on Adaptive Hypermedia and Adaptive Web-Based Systems, pp.
193-204.
Tsandilas, T. and schraefel, m. c. (2003). User-Controlled Link Adaptation. ACM Confer-
ence on Hypertext and Hypermedia, pp. 152-160.
Tsandilas, T. and schraefel, m. c. (2004). Usable Adaptive Hypermedia Systems. New Re-
view of Hypermedia and Multimedia, 10(1), 5-29.
Tsandilas, T. and schraefel, m. c. (2005). An Empirical Assessment of Adaptation Tech-
niques. ACM CHI Conference on Human Factors in Computing Systems, Extended
Abstracts, pp. 2009-2012.
Tsandilas, T. and schraefel, m. c. (2007). Bubbling Menus: A Selective Mechanism for Ac-
cessing Hierarchical Drop-Down Menus. ACM CHI Conference on Human Factors
in Computing Systems, pp. 1195-1204.
Vinson, N. G. (1999). Design Guidelines for Landmarks to Support Navigation in Virtual
Environments. ACM CHI Conference on Human Factors in Computing Systems, pp.
278-285.
Weibelzahl, S. (2002). Evaluation of Adaptive Systems. Ph.D. Dissertation, University of
Trier, Germany.
Weld, D. S., Anderson, C., Domingos, P., Etzioni, O., Gajos, K., Lau, T., et al. (2003).
Automatically Personalizing User Interfaces. International Joint Conference on Arti-
ficial Intelligence, pp. 1613-1619.
REFERENCES 158
Whittaker, S. and Sidner, C. (1996). Email Overload: Exploring Personal Information Man-
agement of Email. ACM CHI Conference on Human Factors in Computing Systems,
pp. 276-283.
Zellweger, P. T., Chang, B.-W. and Mackinlay, J. D. (1998). Fluid Links for Informed and
Incremental Link Transitions. ACM Conference on Hypertext and Hypermedia, pp.
50-57.
Zhai, S., Conversy, S., Beaudouin-Lafon, M. and Guiard, Y. (2003). Human on-Line Re-
sponse to Target Expansion. ACM CHI Conference on Human Factors in Computing
Systems, pp. 177-184.
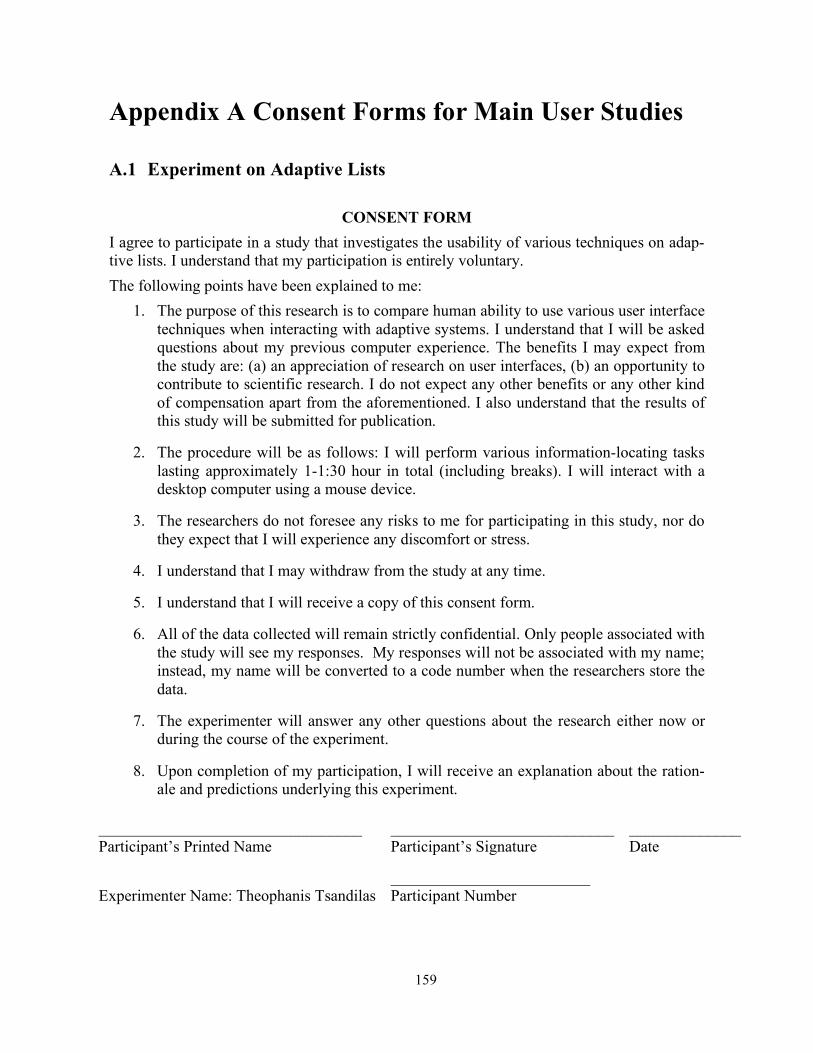
159
Appendix A Consent Forms for Main User Studies
A.1 Experiment on Adaptive Lists
CONSENT FORM I agree to participate in a study that investigates the usability of various techniques on adap-tive lists. I understand that my participation is entirely voluntary. The following points have been explained to me:
1. The purpose of this research is to compare human ability to use various user interface techniques when interacting with adaptive systems. I understand that I will be asked questions about my previous computer experience. The benefits I may expect from the study are: (a) an appreciation of research on user interfaces, (b) an opportunity to contribute to scientific research. I do not expect any other benefits or any other kind of compensation apart from the aforementioned. I also understand that the results of this study will be submitted for publication.
2. The procedure will be as follows: I will perform various information-locating tasks lasting approximately 1-1:30 hour in total (including breaks). I will interact with a desktop computer using a mouse device.
3. The researchers do not foresee any risks to me for participating in this study, nor do they expect that I will experience any discomfort or stress.
4. I understand that I may withdraw from the study at any time.
5. I understand that I will receive a copy of this consent form.
6. All of the data collected will remain strictly confidential. Only people associated with the study will see my responses. My responses will not be associated with my name; instead, my name will be converted to a code number when the researchers store the data.
7. The experimenter will answer any other questions about the research either now or during the course of the experiment.
8. Upon completion of my participation, I will receive an explanation about the ration-ale and predictions underlying this experiment.
_________________________________ Participant’s Printed Name
____________________________ Participant’s Signature
______________ Date
Experimenter Name: Theophanis Tsandilas
_________________________ Participant Number
APPENDIX A. CONSENT FORMS FOR MAIN USER STUDIES 160
A.2 Experiment on Multimode Target Acquisition
CONSENT FORM I agree to participate in a study that investigates the usability of various forms of adaptable user interaction. I understand that my participation is entirely voluntary.
The following points have been explained to me:
1. The purpose of this research is to compare human ability in using various techniques that have been designed to accelerate targeting performance in desktop environments. The research is part of the Ph.D. thesis of the experimenter. I understand that I will be asked questions about my previous computer experience. The benefits I may ex-pect from the study are: (a) an appreciation of research on user interfaces, and (b) an opportunity to contribute to scientific research. I do not expect any other benefits or any other kind of compensation apart from the aforementioned. I also understand that the results of this study may be submitted for publication.
2. The procedure will be as follows: I will perform various targeting tasks lasting ap-proximately 40-50 minutes (including breaks). I will interact with a desktop com-puter using a mouse device and a keyboard.
3. The researchers do not foresee any risks to me for participating in this study, nor do they expect that I will experience any discomfort or stress.
4. I understand that I may withdraw from the study at any time.
5. I understand that I will receive a copy of this consent form.
6. All of the data collected will remain strictly confidential. Only people associated with the study will see my results. The results will not be associated with my name; in-stead, my name will be converted to a code number when the researchers store the data.
7. The experimenter will answer any other questions about the research either now or during the course of the experiment.
8. Upon completion of my participation, I will receive an explanation about the ration-ale and predictions underlying this experiment.
_________________________________ Participant’s Printed Name
_______________________ Participant’s Signature
______________ Date
Experimenter’s Name: Theophanis Tsandilas
_______________________ Participant Number

APPENDIX A. CONSENT FORMS FOR MAIN USER STUDIES 161
A.3 First Study on Bubbling Menus
CONSENT FORM I agree to participate in a study that investigates the usability of various forms of adaptable user interaction. I understand that my participation is entirely voluntary.
The following points have been explained to me:
1. The purpose of this research is to compare human ability to use various user interface techniques that have been designed to facilitate selection in pull-down menus. The research is part of the Ph.D. thesis of the experimenter. I understand that I will be asked questions about my previous computer experience. The benefits I may expect from the study are: (a) an appreciation of research on user interfaces, (b) an opportu-nity to contribute to scientific research. I do not expect any other benefits or any other kind of compensation apart from the aforementioned. I also understand that the results of this study may be submitted for publication.
2. The procedure will be as follows: I will perform various menu selection tasks lasting approximately 1 hour (including breaks). I will interact with a laptop using an exter-nal mouse device.
3. The researchers do not foresee any risks to me for participating in this study, nor do they expect that I will experience any discomfort or stress.
4. I understand that I may withdraw from the study at any time.
5. I understand that I will receive a copy of this consent form.
6. All of the data collected will remain strictly confidential. Only people associated with the study will see my responses. My responses will not be associated with my name; instead, my name will be converted to a code number when the researchers store the data.
7. The experimenter will answer any other questions about the research either now or during the course of the experiment.
8. Upon completion of my participation, I will receive an explanation about the ration-ale and predictions underlying this experiment.
_________________________________ Participant’s Printed Name
______________________________ Participant’s Signature
____________ Date
Experimenter Name: Theophanis Tsandilas
_________________________ Participant Number

APPENDIX A. CONSENT FORMS FOR MAIN USER STUDIES 162
A.4 Second Study on Bubbling Menus
CONSENT FORM I agree to participate in a study that investigates the usability of various forms of customiza-ble user interfaces. I understand that my participation is entirely voluntary. The following points have been explained to me:
1. The purpose of this research is to evaluate various customization techniques that have been designed to facilitate selection in pull-down menus. The research is part of the Ph.D. thesis of the experimenter. I understand that I will be asked questions about my previous computer experience. The benefits I may expect from the study are: (a) an appreciation of research on user interfaces, (b) an opportunity to contribute to sci-entific research. I do not expect any other benefits or any other kind of compensation apart from the aforementioned. I also understand that the results of this study may be submitted for publication.
2. The procedure will be as follows: First, I will be asked questions concerning my pre-vious experience with using menus in office applications. Then, I will perform vari-ous menu selection tasks using two different techniques. Finally, I will be asked questions concerning my experience with the techniques presented to me. The whole procedure will last approximately 90-100 minutes (including breaks). I will interact with a laptop using an external mouse device and a keyboard.
3. The researchers do not foresee any risks to me for participating in this study, nor do they expect that I will experience any discomfort or stress.
4. I understand that I may withdraw from the study at any time.
5. I understand that I will receive a copy of this consent form.
6. All of the data collected will remain strictly confidential. Only people associated with the study will see my responses. My responses will not be associated with my name; instead, my name will be converted to a code number when the researchers store the data.
7. The experimenter will answer any other questions about the research either now or during the course of the experiment.
8. Upon completion of my participation, I will receive an explanation about the ration-ale and predictions underlying this experiment.
_________________________________ Participant’s Printed Name
_____________________________ Participant’s Signature
_____________ Date
Experimenter Name: Theophanis Tsandilas _________________________ Participant Number
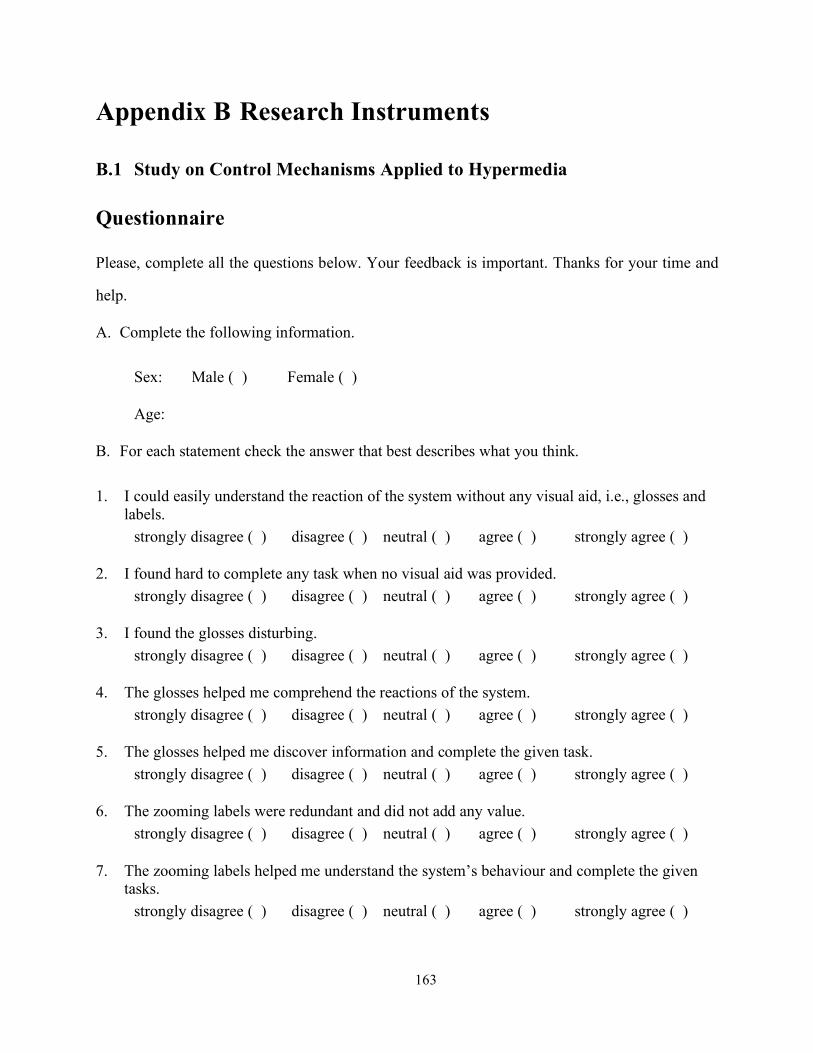
163
Appendix B Research Instruments
B.1 Study on Control Mechanisms Applied to Hypermedia
Questionnaire
Please, complete all the questions below. Your feedback is important. Thanks for your time and
help.
A. Complete the following information.
Sex: Male ( ) Female ( )
Age:
B. For each statement check the answer that best describes what you think. 1. I could easily understand the reaction of the system without any visual aid, i.e., glosses and
labels. strongly disagree ( ) disagree ( ) neutral ( ) agree ( ) strongly agree ( )
2. I found hard to complete any task when no visual aid was provided. strongly disagree ( ) disagree ( ) neutral ( ) agree ( ) strongly agree ( )
3. I found the glosses disturbing. strongly disagree ( ) disagree ( ) neutral ( ) agree ( ) strongly agree ( )
4. The glosses helped me comprehend the reactions of the system. strongly disagree ( ) disagree ( ) neutral ( ) agree ( ) strongly agree ( )
5. The glosses helped me discover information and complete the given task. strongly disagree ( ) disagree ( ) neutral ( ) agree ( ) strongly agree ( )
6. The zooming labels were redundant and did not add any value. strongly disagree ( ) disagree ( ) neutral ( ) agree ( ) strongly agree ( )
7. The zooming labels helped me understand the system’s behaviour and complete the given tasks.
strongly disagree ( ) disagree ( ) neutral ( ) agree ( ) strongly agree ( )
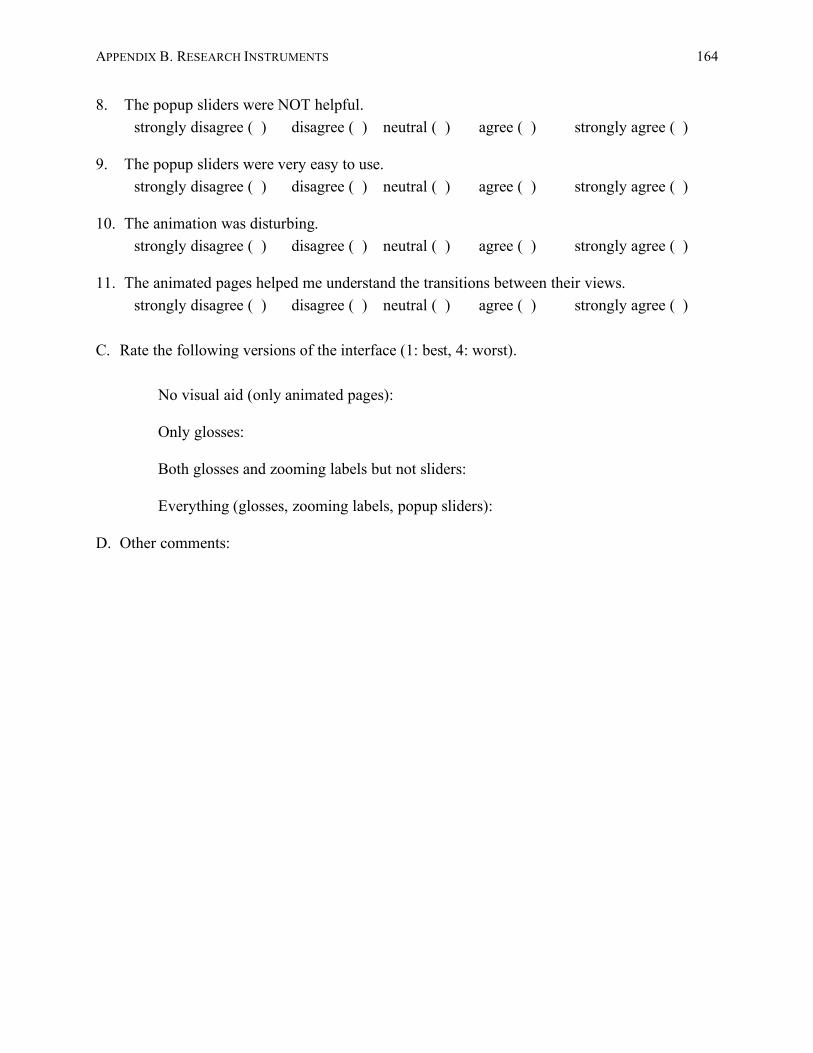
APPENDIX B. RESEARCH INSTRUMENTS 164
8. The popup sliders were NOT helpful. strongly disagree ( ) disagree ( ) neutral ( ) agree ( ) strongly agree ( )
9. The popup sliders were very easy to use. strongly disagree ( ) disagree ( ) neutral ( ) agree ( ) strongly agree ( )
10. The animation was disturbing. strongly disagree ( ) disagree ( ) neutral ( ) agree ( ) strongly agree ( )
11. The animated pages helped me understand the transitions between their views. strongly disagree ( ) disagree ( ) neutral ( ) agree ( ) strongly agree ( )
C. Rate the following versions of the interface (1: best, 4: worst).
No visual aid (only animated pages):
Only glosses:
Both glosses and zooming labels but not sliders:
Everything (glosses, zooming labels, popup sliders):
D. Other comments:
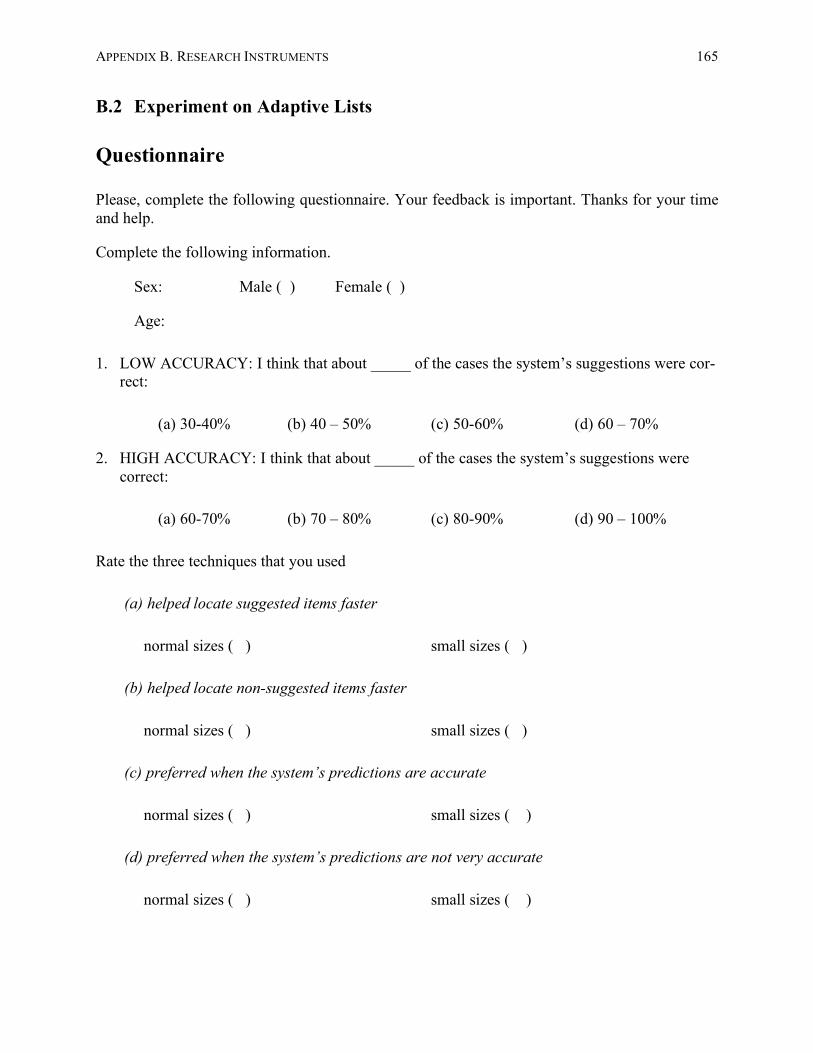
APPENDIX B. RESEARCH INSTRUMENTS 165
B.2 Experiment on Adaptive Lists
Questionnaire
Please, complete the following questionnaire. Your feedback is important. Thanks for your time and help.
Complete the following information.
Sex: Male ( ) Female ( )
Age:
1. LOW ACCURACY: I think that about _____ of the cases the system’s suggestions were cor-rect:
(a) 30-40% (b) 40 – 50% (c) 50-60% (d) 60 – 70%
2. HIGH ACCURACY: I think that about _____ of the cases the system’s suggestions were correct:
(a) 60-70% (b) 70 – 80% (c) 80-90% (d) 90 – 100%
Rate the three techniques that you used
(a) helped locate suggested items faster
normal sizes ( ) small sizes ( )
(b) helped locate non-suggested items faster
normal sizes ( ) small sizes ( )
(c) preferred when the system’s predictions are accurate
normal sizes ( ) small sizes ( )
(d) preferred when the system’s predictions are not very accurate
normal sizes ( ) small sizes ( )
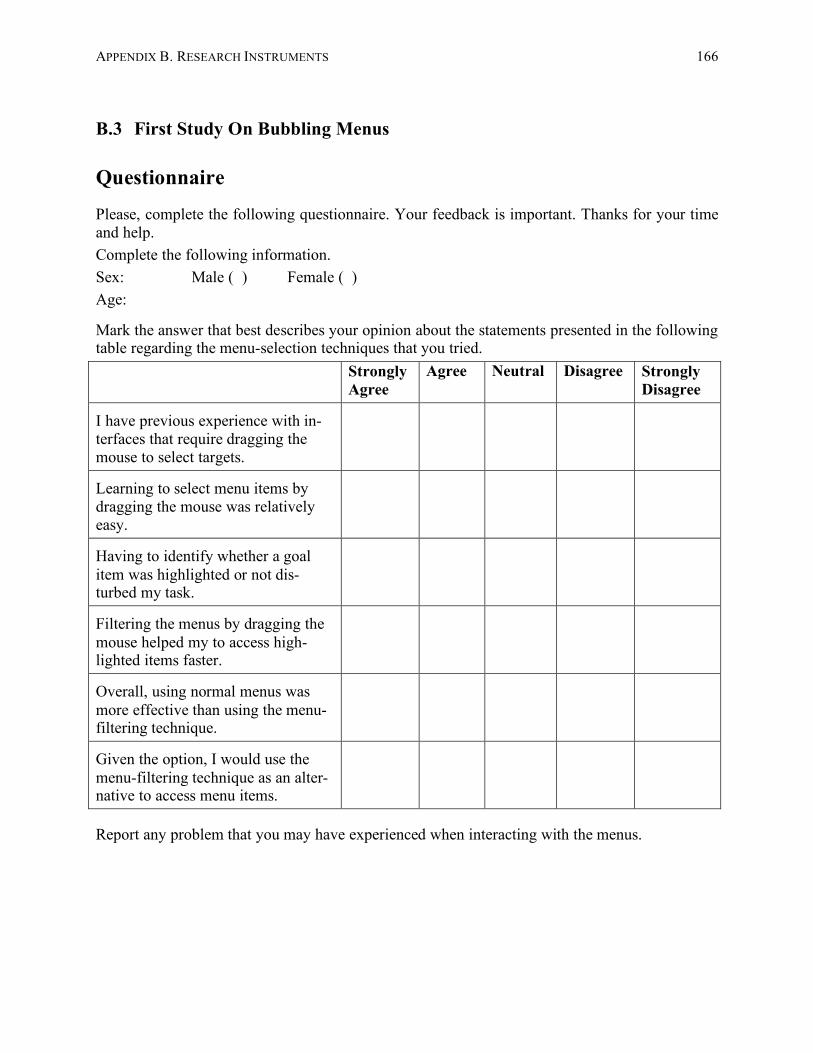
APPENDIX B. RESEARCH INSTRUMENTS 166
B.3 First Study On Bubbling Menus
Questionnaire
Please, complete the following questionnaire. Your feedback is important. Thanks for your time and help. Complete the following information. Sex: Male ( ) Female ( ) Age:
Mark the answer that best describes your opinion about the statements presented in the following table regarding the menu-selection techniques that you tried. Strongly
Agree Agree Neutral Disagree Strongly
Disagree
I have previous experience with in-terfaces that require dragging the mouse to select targets.
Learning to select menu items by dragging the mouse was relatively easy.
Having to identify whether a goal item was highlighted or not dis-turbed my task.
Filtering the menus by dragging the mouse helped my to access high-lighted items faster.
Overall, using normal menus was more effective than using the menu-filtering technique.
Given the option, I would use the menu-filtering technique as an alter-native to access menu items.
Report any problem that you may have experienced when interacting with the menus.
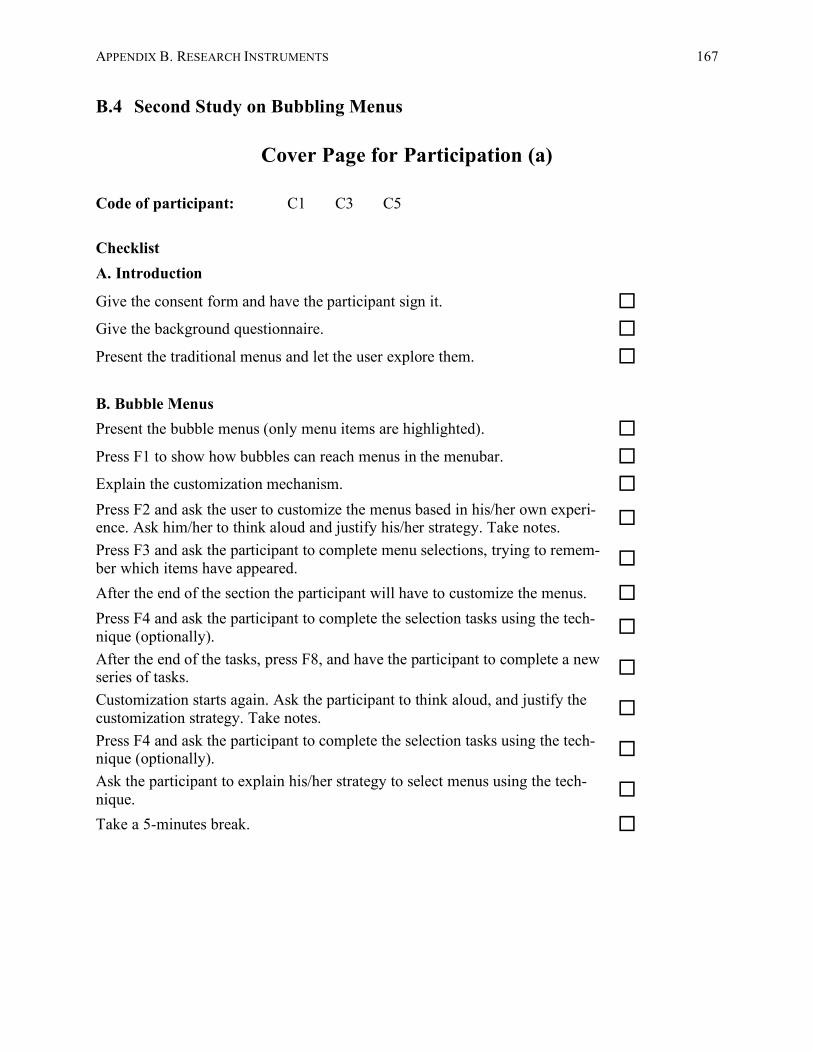
APPENDIX B. RESEARCH INSTRUMENTS 167
B.4 Second Study on Bubbling Menus
Cover Page for Participation (a)
Code of participant: C1 C3 C5 Checklist A. Introduction Give the consent form and have the participant sign it. Give the background questionnaire. Present the traditional menus and let the user explore them. B. Bubble Menus Present the bubble menus (only menu items are highlighted). Press F1 to show how bubbles can reach menus in the menubar. Explain the customization mechanism. Press F2 and ask the user to customize the menus based in his/her own experi-ence. Ask him/her to think aloud and justify his/her strategy. Take notes.
Press F3 and ask the participant to complete menu selections, trying to remem-ber which items have appeared.
After the end of the section the participant will have to customize the menus. Press F4 and ask the participant to complete the selection tasks using the tech-nique (optionally).
After the end of the tasks, press F8, and have the participant to complete a new series of tasks.
Customization starts again. Ask the participant to think aloud, and justify the customization strategy. Take notes.
Press F4 and ask the participant to complete the selection tasks using the tech-nique (optionally).
Ask the participant to explain his/her strategy to select menus using the tech-nique.
Take a 5-minutes break.
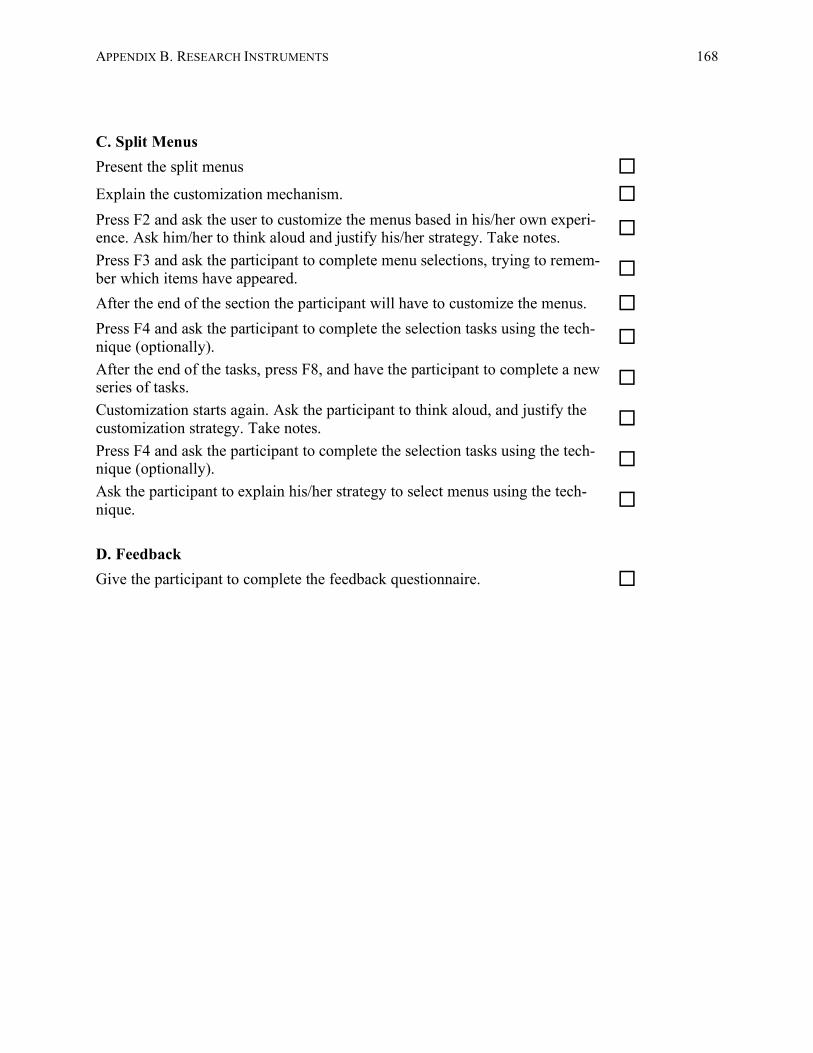
APPENDIX B. RESEARCH INSTRUMENTS 168
C. Split Menus Present the split menus Explain the customization mechanism. Press F2 and ask the user to customize the menus based in his/her own experi-ence. Ask him/her to think aloud and justify his/her strategy. Take notes.
Press F3 and ask the participant to complete menu selections, trying to remem-ber which items have appeared.
After the end of the section the participant will have to customize the menus. Press F4 and ask the participant to complete the selection tasks using the tech-nique (optionally).
After the end of the tasks, press F8, and have the participant to complete a new series of tasks.
Customization starts again. Ask the participant to think aloud, and justify the customization strategy. Take notes.
Press F4 and ask the participant to complete the selection tasks using the tech-nique (optionally).
Ask the participant to explain his/her strategy to select menus using the tech-nique.
D. Feedback Give the participant to complete the feedback questionnaire.
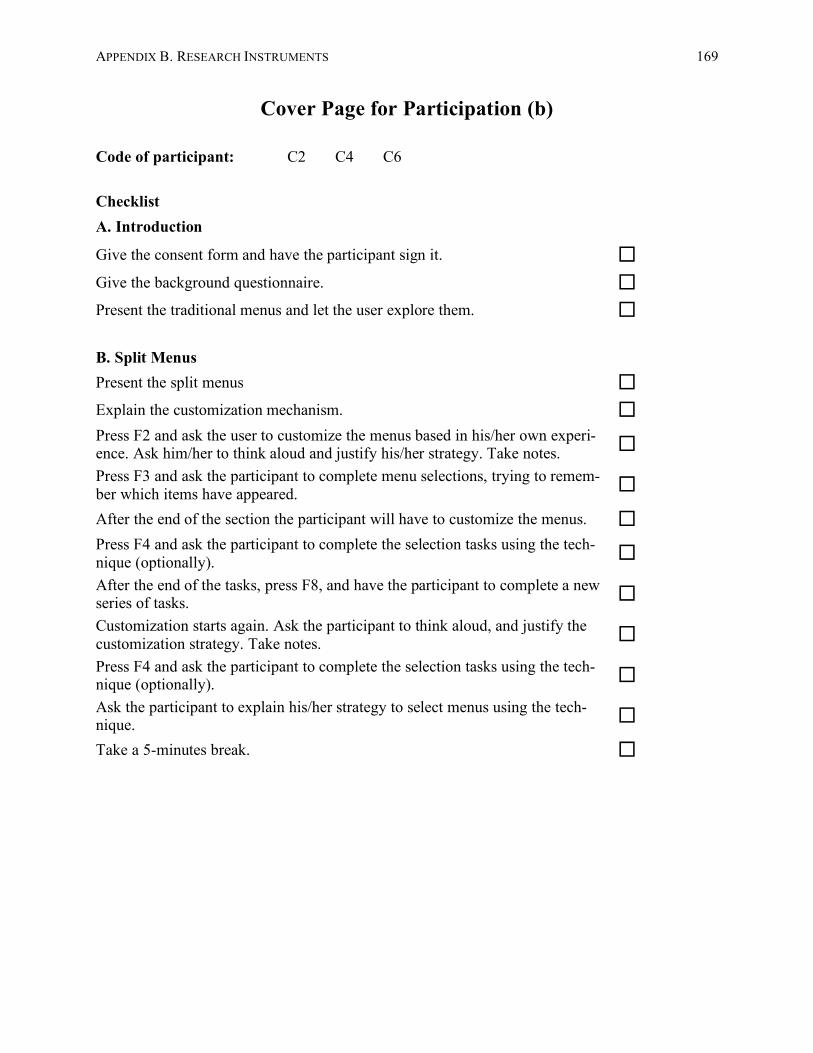
APPENDIX B. RESEARCH INSTRUMENTS 169
Cover Page for Participation (b)
Code of participant: C2 C4 C6 Checklist A. Introduction Give the consent form and have the participant sign it. Give the background questionnaire. Present the traditional menus and let the user explore them. B. Split Menus Present the split menus Explain the customization mechanism. Press F2 and ask the user to customize the menus based in his/her own experi-ence. Ask him/her to think aloud and justify his/her strategy. Take notes.
Press F3 and ask the participant to complete menu selections, trying to remem-ber which items have appeared.
After the end of the section the participant will have to customize the menus. Press F4 and ask the participant to complete the selection tasks using the tech-nique (optionally).
After the end of the tasks, press F8, and have the participant to complete a new series of tasks.
Customization starts again. Ask the participant to think aloud, and justify the customization strategy. Take notes.
Press F4 and ask the participant to complete the selection tasks using the tech-nique (optionally).
Ask the participant to explain his/her strategy to select menus using the tech-nique.
Take a 5-minutes break.
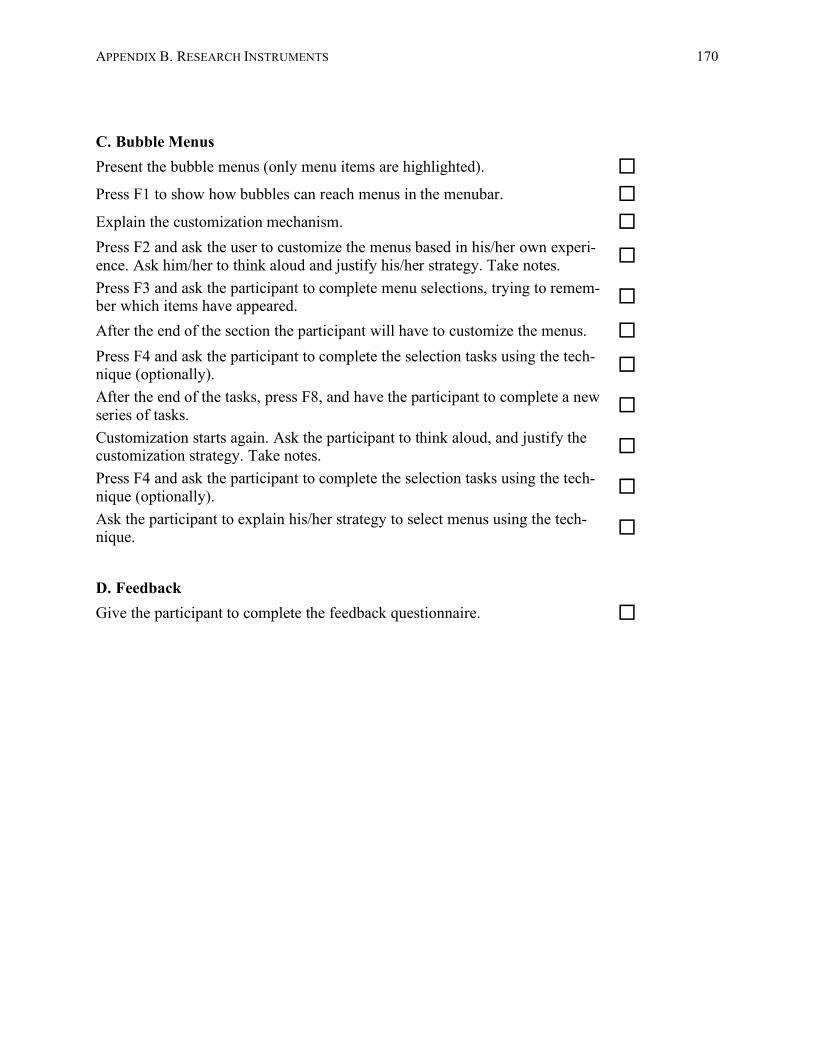
APPENDIX B. RESEARCH INSTRUMENTS 170
C. Bubble Menus Present the bubble menus (only menu items are highlighted). Press F1 to show how bubbles can reach menus in the menubar. Explain the customization mechanism. Press F2 and ask the user to customize the menus based in his/her own experi-ence. Ask him/her to think aloud and justify his/her strategy. Take notes.
Press F3 and ask the participant to complete menu selections, trying to remem-ber which items have appeared.
After the end of the section the participant will have to customize the menus. Press F4 and ask the participant to complete the selection tasks using the tech-nique (optionally).
After the end of the tasks, press F8, and have the participant to complete a new series of tasks.
Customization starts again. Ask the participant to think aloud, and justify the customization strategy. Take notes.
Press F4 and ask the participant to complete the selection tasks using the tech-nique (optionally).
Ask the participant to explain his/her strategy to select menus using the tech-nique.
D. Feedback Give the participant to complete the feedback questionnaire.

APPENDIX B. RESEARCH INSTRUMENTS 171
Background Questionnaire
The purpose of this questionnaire is to see if you will be a good fit for the study and collect background information concerning your experience in using menus in office applications. Note that all information provided will remain strictly confidential.
Section I: Personal Information 1. Age: 2. Gender:
Male [ ] Female [ ] 3. Occupation:
Section II: Use of Office Applications
4. Which operating systems do you currently use on a regular basis? Tick all that apply. MS Windows [ ] Mac OS [ ] Linux [ ] Other(s), please specify: ______________ 5. Please indicate your experience with the following word processors. MS Word Not Used [ ] Occasionally Used [ ] Frequently Used [ ] Open Office Not Used [ ] Occasionally Used [ ] Frequently Used [ ] Word Perfect Not Used [ ] Occasionally Used [ ] Frequently Used [ ] LaTeX Not Used [ ] Occasionally Used [ ] Frequently Used [ ] Other: ________ Not Used [ ] Occasionally Used [ ] Frequently Used [ ]
6. How would you characterize yourself in terms of your overall knowledge of MS Word? I have basic knowledge [ ] I have moderate knowledge [ ] I have extensive knowledge [ ]
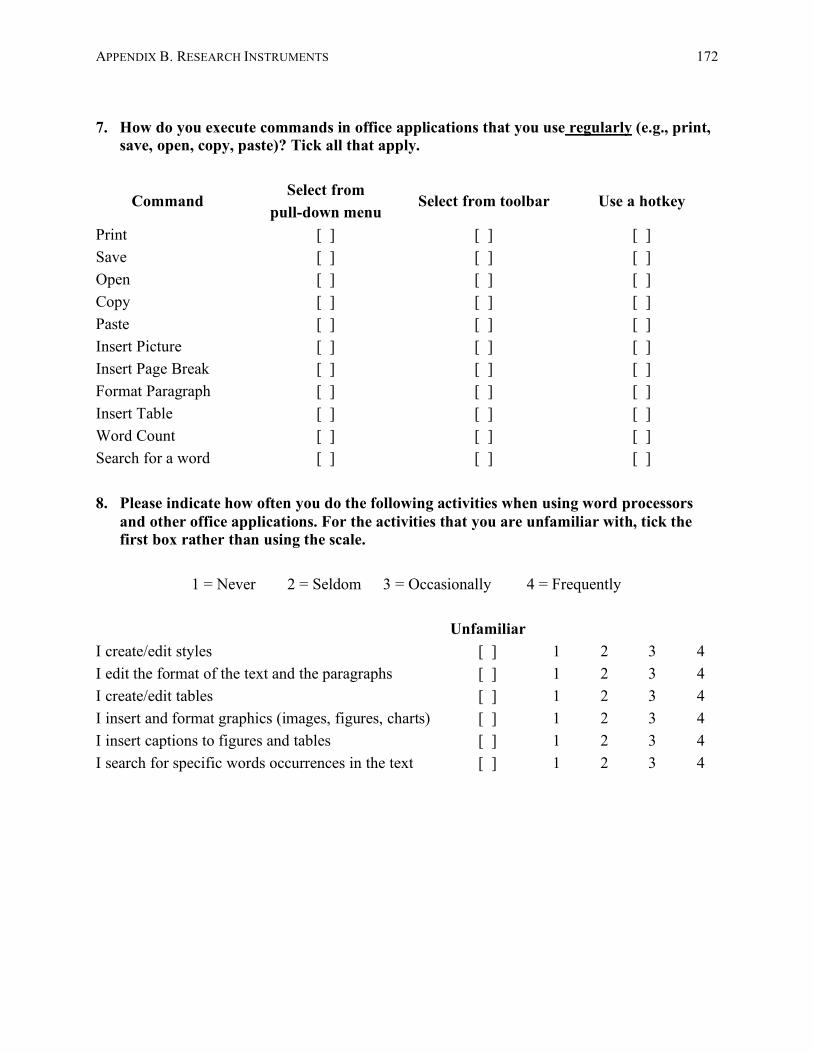
APPENDIX B. RESEARCH INSTRUMENTS 172
7. How do you execute commands in office applications that you use regularly (e.g., print,
save, open, copy, paste)? Tick all that apply.
Command Select from
pull-down menu Select from toolbar Use a hotkey
Print [ ] [ ] [ ] Save [ ] [ ] [ ] Open [ ] [ ] [ ] Copy [ ] [ ] [ ] Paste [ ] [ ] [ ] Insert Picture [ ] [ ] [ ] Insert Page Break [ ] [ ] [ ] Format Paragraph [ ] [ ] [ ] Insert Table [ ] [ ] [ ] Word Count [ ] [ ] [ ] Search for a word [ ] [ ] [ ] 8. Please indicate how often you do the following activities when using word processors
and other office applications. For the activities that you are unfamiliar with, tick the first box rather than using the scale.
1 = Never 2 = Seldom 3 = Occasionally 4 = Frequently
Unfamiliar I create/edit styles [ ] 1 2 3 4 I edit the format of the text and the paragraphs [ ] 1 2 3 4 I create/edit tables [ ] 1 2 3 4 I insert and format graphics (images, figures, charts) [ ] 1 2 3 4 I insert captions to figures and tables [ ] 1 2 3 4 I search for specific words occurrences in the text [ ] 1 2 3 4
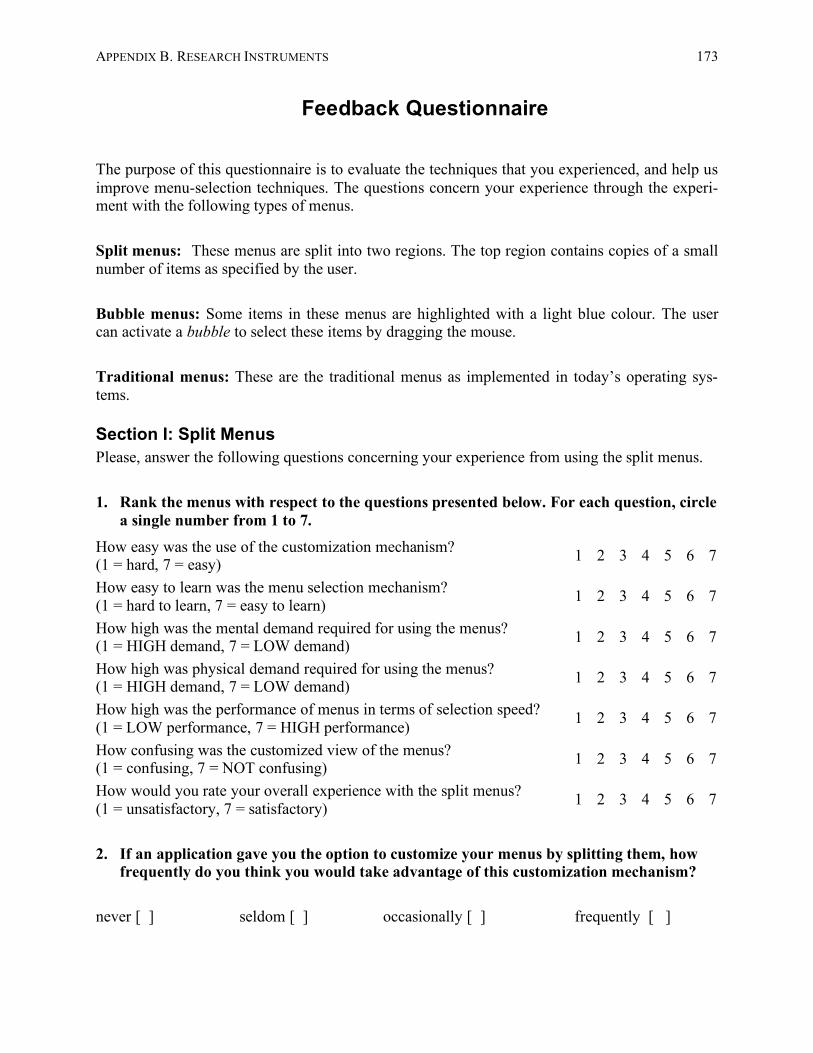
APPENDIX B. RESEARCH INSTRUMENTS 173
Feedback Questionnaire
The purpose of this questionnaire is to evaluate the techniques that you experienced, and help us improve menu-selection techniques. The questions concern your experience through the experi-ment with the following types of menus. Split menus: These menus are split into two regions. The top region contains copies of a small number of items as specified by the user. Bubble menus: Some items in these menus are highlighted with a light blue colour. The user can activate a bubble to select these items by dragging the mouse. Traditional menus: These are the traditional menus as implemented in today’s operating sys-tems.
Section I: Split Menus Please, answer the following questions concerning your experience from using the split menus. 1. Rank the menus with respect to the questions presented below. For each question, circle
a single number from 1 to 7. How easy was the use of the customization mechanism? (1 = hard, 7 = easy) 1 2 3 4 5 6 7
How easy to learn was the menu selection mechanism? (1 = hard to learn, 7 = easy to learn) 1 2 3 4 5 6 7
How high was the mental demand required for using the menus? (1 = HIGH demand, 7 = LOW demand) 1 2 3 4 5 6 7
How high was physical demand required for using the menus? (1 = HIGH demand, 7 = LOW demand) 1 2 3 4 5 6 7
How high was the performance of menus in terms of selection speed? (1 = LOW performance, 7 = HIGH performance) 1 2 3 4 5 6 7
How confusing was the customized view of the menus? (1 = confusing, 7 = NOT confusing) 1 2 3 4 5 6 7
How would you rate your overall experience with the split menus? (1 = unsatisfactory, 7 = satisfactory) 1 2 3 4 5 6 7
2. If an application gave you the option to customize your menus by splitting them, how
frequently do you think you would take advantage of this customization mechanism? never [ ] seldom [ ] occasionally [ ] frequently [ ]
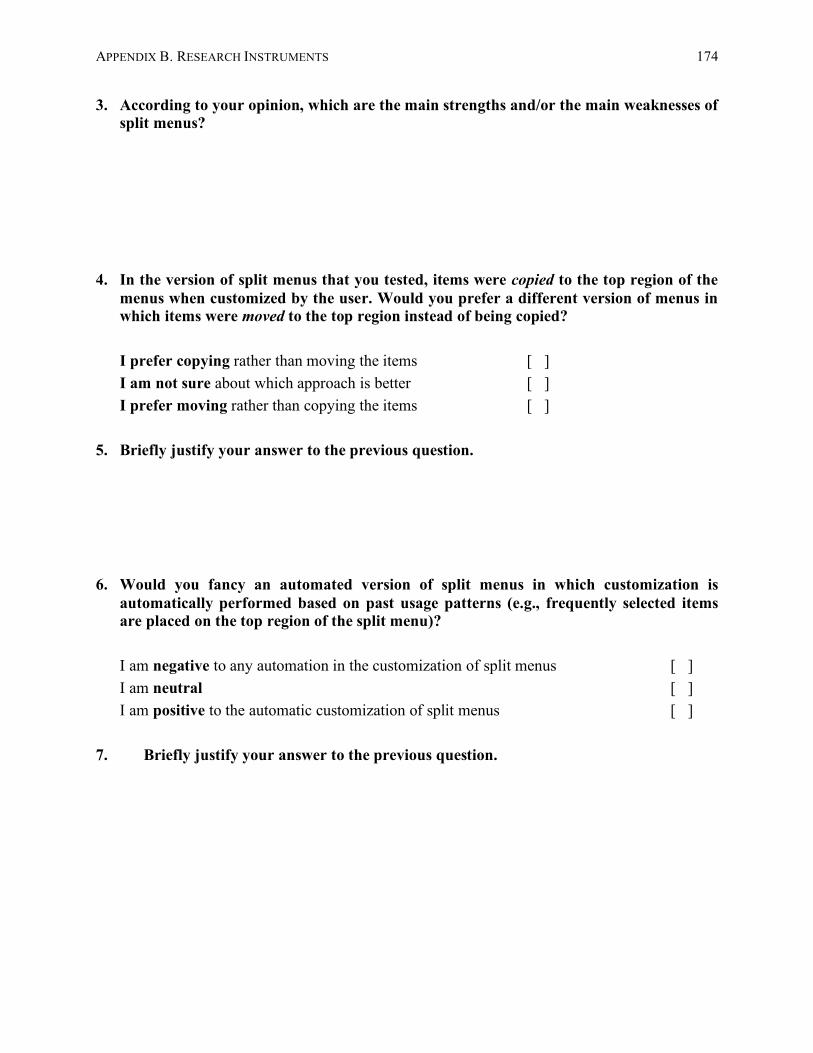
APPENDIX B. RESEARCH INSTRUMENTS 174
3. According to your opinion, which are the main strengths and/or the main weaknesses of split menus?
4. In the version of split menus that you tested, items were copied to the top region of the
menus when customized by the user. Would you prefer a different version of menus in which items were moved to the top region instead of being copied?
I prefer copying rather than moving the items [ ] I am not sure about which approach is better [ ] I prefer moving rather than copying the items [ ]
5. Briefly justify your answer to the previous question. 6. Would you fancy an automated version of split menus in which customization is
automatically performed based on past usage patterns (e.g., frequently selected items are placed on the top region of the split menu)?
I am negative to any automation in the customization of split menus [ ] I am neutral [ ] I am positive to the automatic customization of split menus [ ]
7. Briefly justify your answer to the previous question.
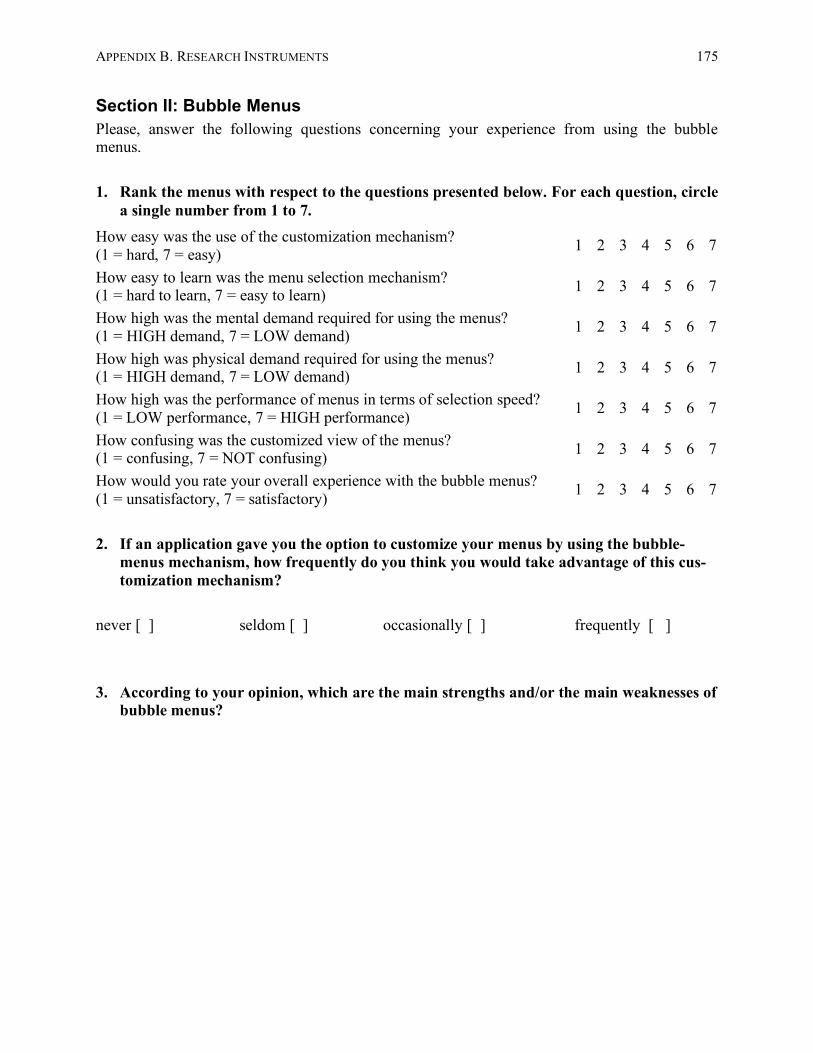
APPENDIX B. RESEARCH INSTRUMENTS 175
Section II: Bubble Menus Please, answer the following questions concerning your experience from using the bubble menus. 1. Rank the menus with respect to the questions presented below. For each question, circle
a single number from 1 to 7. How easy was the use of the customization mechanism? (1 = hard, 7 = easy) 1 2 3 4 5 6 7
How easy to learn was the menu selection mechanism? (1 = hard to learn, 7 = easy to learn) 1 2 3 4 5 6 7
How high was the mental demand required for using the menus? (1 = HIGH demand, 7 = LOW demand) 1 2 3 4 5 6 7
How high was physical demand required for using the menus? (1 = HIGH demand, 7 = LOW demand) 1 2 3 4 5 6 7
How high was the performance of menus in terms of selection speed? (1 = LOW performance, 7 = HIGH performance) 1 2 3 4 5 6 7
How confusing was the customized view of the menus? (1 = confusing, 7 = NOT confusing) 1 2 3 4 5 6 7
How would you rate your overall experience with the bubble menus? (1 = unsatisfactory, 7 = satisfactory) 1 2 3 4 5 6 7
2. If an application gave you the option to customize your menus by using the bubble-
menus mechanism, how frequently do you think you would take advantage of this cus-tomization mechanism?
never [ ] seldom [ ] occasionally [ ] frequently [ ] 3. According to your opinion, which are the main strengths and/or the main weaknesses of
bubble menus?

APPENDIX B. RESEARCH INSTRUMENTS 176
4. Would you fancy an automated version of bubble menus in which customization is automatically performed based on past usage patterns (e.g., frequently selected items are highlighted)?
I am negative to any automation in the customization of bubble menus [ ] I am neutral [ ] I am positive to the automatic customization of bubble menus [ ]
5. Briefly justify your answer to the previous question. Section III: Overall Experience 1. Given the option to choose among Traditional Menus, Split Menus, and Bubble Menus,
which would be your 1st, 2nd and 3rd choice? ____Traditional Menus _____Split Menus _____Bubble Menus 2. Why have you ranked them this way? 3. Do you have any other comments about the above versions of menus or your participa-
tion in this study?
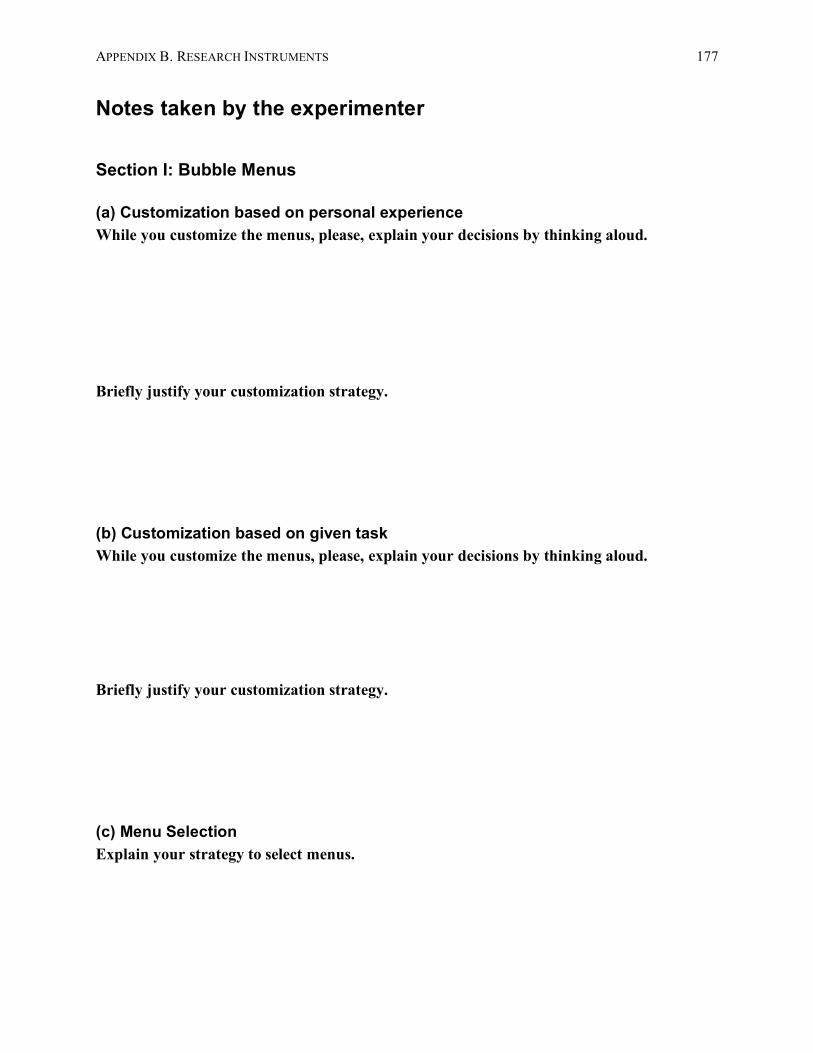
APPENDIX B. RESEARCH INSTRUMENTS 177
Notes taken by the experimenter
Section I: Bubble Menus
(a) Customization based on personal experience While you customize the menus, please, explain your decisions by thinking aloud. Briefly justify your customization strategy.
(b) Customization based on given task While you customize the menus, please, explain your decisions by thinking aloud. Briefly justify your customization strategy.
(c) Menu Selection Explain your strategy to select menus.

APPENDIX B. RESEARCH INSTRUMENTS 178
Section II: Split Menus
(a) Customization based on personal experience While you customize the menus, please, explain your decisions by thinking aloud. Briefly justify your customization strategy.
(b) Customization based on given task While you customize the menus, please, explain your decisions by thinking aloud. Briefly justify your customization strategy.
(c) Menu Selection Explain your strategy to select menus.


![TUA LRI 2010 [Compatibility Mode]](https://img.pdfslide.net/doc/110x75/5476e6215806b5be598b45d0/tua-lri-2010-compatibility-mode.jpg)