Embed Size (px)
Citation preview
1
Intermediate Level Intermediate Level Qualitative Qualitative
Comparative Comparative Analysis Including Analysis Including
Fuzzy SetsFuzzy SetsBy Wendy OlsenBy Wendy Olsen
----Notes for BeginnersNotes for Beginners
[email protected]@manchester.ac.ukPlease cite as:Please cite as:Olsen W. 2004 Intermediate Level Qualitative Comparative AnalysiOlsen W. 2004 Intermediate Level Qualitative Comparative Analysis including Fuzzy s including Fuzzy Sets. Paper presented as part of the Focusing on the Case WorksSets. Paper presented as part of the Focusing on the Case Workshop Series, hop Series, September 2004.September 2004.
2
QCAQCA• Comparative social research is always
substantivist. Please ensure that you create your own data set rather than simply accepting someone else’s categorisations as good measures.
• Examples of the use of QCA include Ragin, et al. (2003), Kvist (1999), Levi-Faur(2002), Miethe and Drass (1999), and Snow and Cress (2000) in the AJS. The latter will be used in this presentation.
3
What About Methodological What About Methodological Problems with a Flat Data Problems with a Flat Data
Table?Table?
• You have to consider the macro, meso and micro as well as psychological and cultural factors (see Layder, 1991, for a superb overview and guide)
• You place data in one table after allowing for commonalities of experience of the ‘units’
• Avoid reductionism
4
References on Research References on Research Design For ComplexityDesign For Complexity
• Blaikie, N. W. H. (2000). Designing social research : the logic of anticipation. Cambridge, Polity Press.
• Layder, D. (1993). New Strategies in Social Research. Cambridge, Polity Press.
• Layder, D. (1998). The Reality of Social Domains: Implications for Theory. Knowing the Social World. T. May, and Malcolm Williams. Buckingham and Philadelphia, Open University Press: 86-102.
• Ragin, et al. (2003) “Complexity, Generality, and Qualitative Comparative Analysis”, Field Methods, 15:4, 323-340 (TO BE HANDED OUT)-allows for social and ecological causes
5
Your ontology should not be Your ontology should not be flatflat
• Byrne, D. (1999). Complexity theory and the social sciences: an introduction. London, Routledge.
• Danermark, B. (2002). Explaining society: critical realism in the social sciences. London, Routledge.
• Sayer, A. (1992). Method in Social Science. London, Routledge.
6
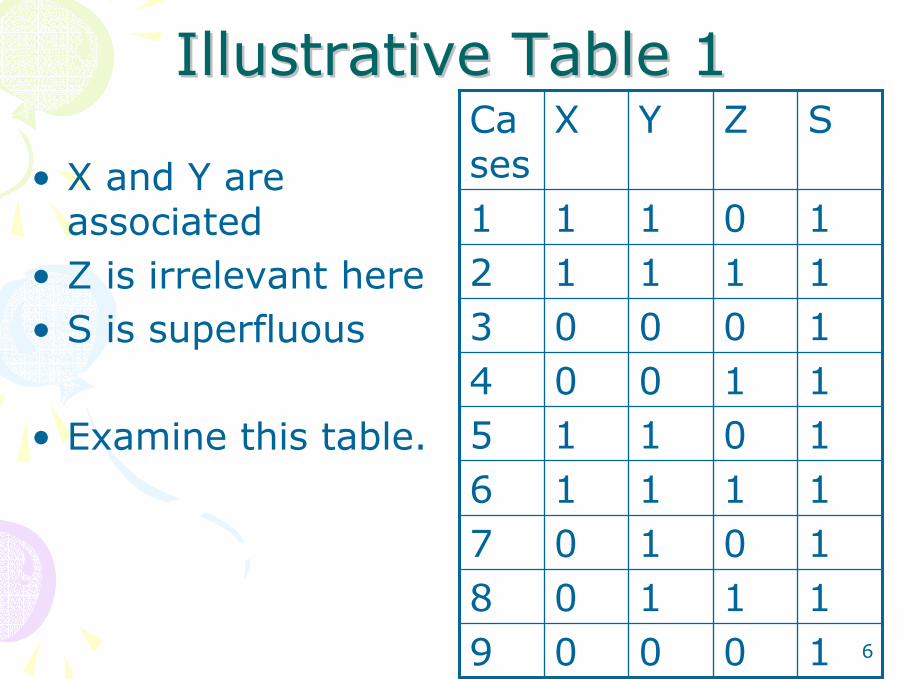
Illustrative Table 1Illustrative Table 1
• X and Y are associated
• Z is irrelevant here• S is superfluous
• Examine this table.
100091110810107111161011511004100031111210111
SZYXCases
7
Two ideal types of causalityTwo ideal types of causality• X could be a part of Y.• If X is intrinsically a part of Y, then X co-
occurs with Y whenever Y occurs. Being-together is not necessarily what we mean by X causing Y!
• Otherwise X could be independent of Y, yet causal of Y, as ‘medical treatment’ is thought to be independent of its effects on the patient.
8
QuizQuiz• Which of these 2 ideal types is
‘natural necessity’, and which is ‘contingent causality’?
• If X is part of Y then does Y cause X or does X cause Y?
9
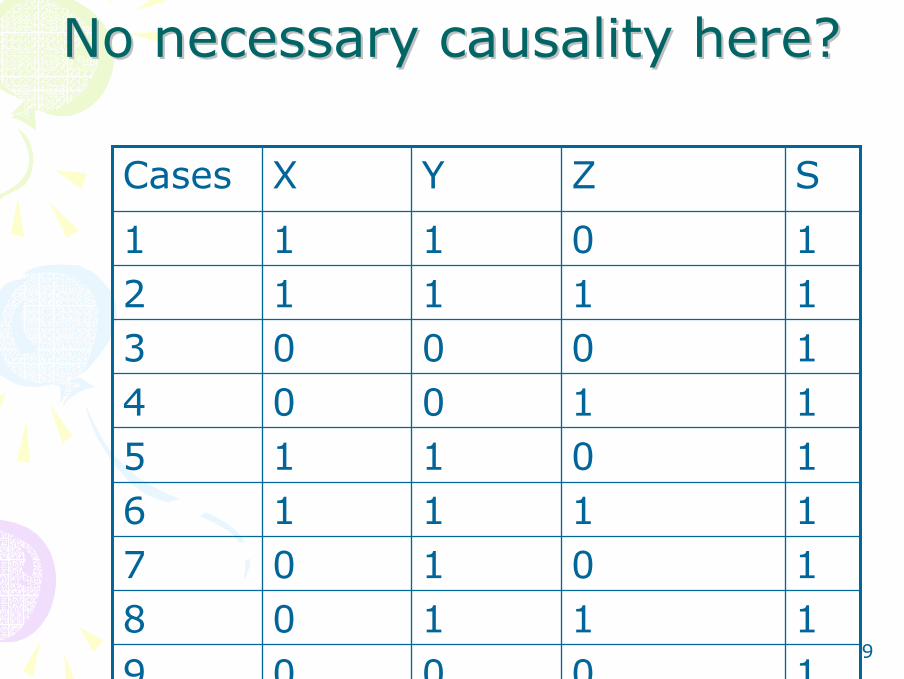
No necessary causality here?No necessary causality here?
100091110810107111161011511004100031111210111
SZYXCases
10
Notation for Boolean Notation for Boolean AlgebraAlgebra
• You need to know Y and not-Y (Y, ~Y)• The ‘and’ symbol is usually a * or simply
omitted; this is called Boolean Multiplication.
• The ‘or’ symbol can be a comma or a +. • You can denote X as ORGANIZATION and
not-X as organisation (note caps)
11
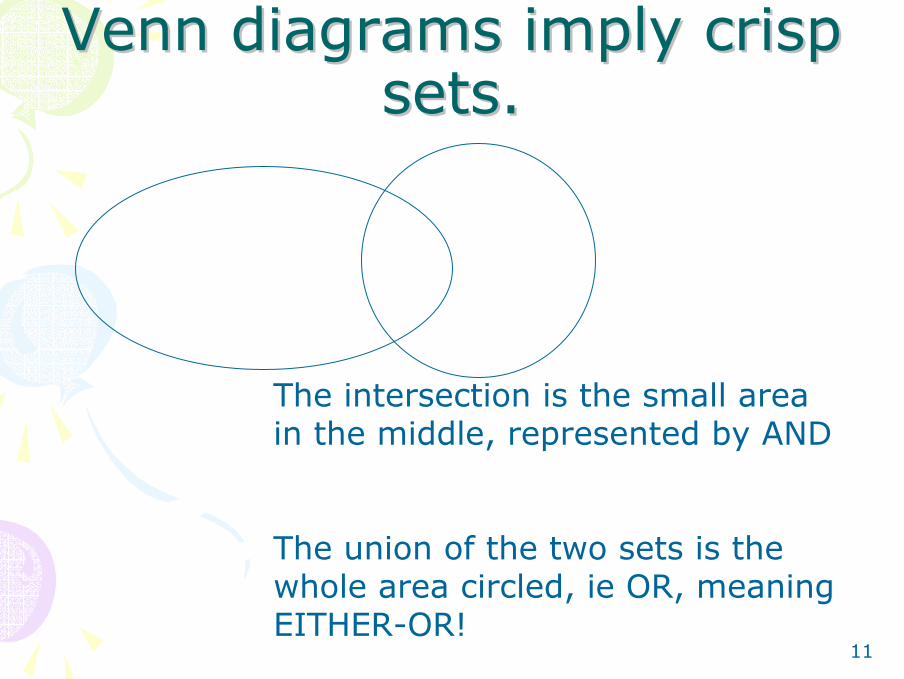
Venn diagrams imply crisp Venn diagrams imply crisp sets.sets.
The intersection is the small area in the middle, represented by AND
The union of the two sets is the whole area circled, ie OR, meaning EITHER-OR!

12
Venn diagrams and Boolean Venn diagrams and Boolean algebraalgebra
Z XZ X
The intersection of XYZ is what regression interaction effects would focus upon. It is the tiny area in the middle, X AND Y AND Z.
XZ does not imply ~Y but it could if there were a ‘negative interaction effect’
Y
13
Causal trajectoriesCausal trajectories• It could be that:
– X and Z together could cause Y – e.g. medicine plus positive thinking cause a cure – but Z and X each do not cause a cure.
– Neither is sufficient for Y but XZ is.– Meanwhile P and Q together also cause Y, so XZ is not
necessary to cause Y. But XZ can still be sufficient to cause Y. No single cause is now ‘necessary’ in the set.
• Cluster analysis could discover patterns of configurations.
• You would have to interpret them in causal terms.
14
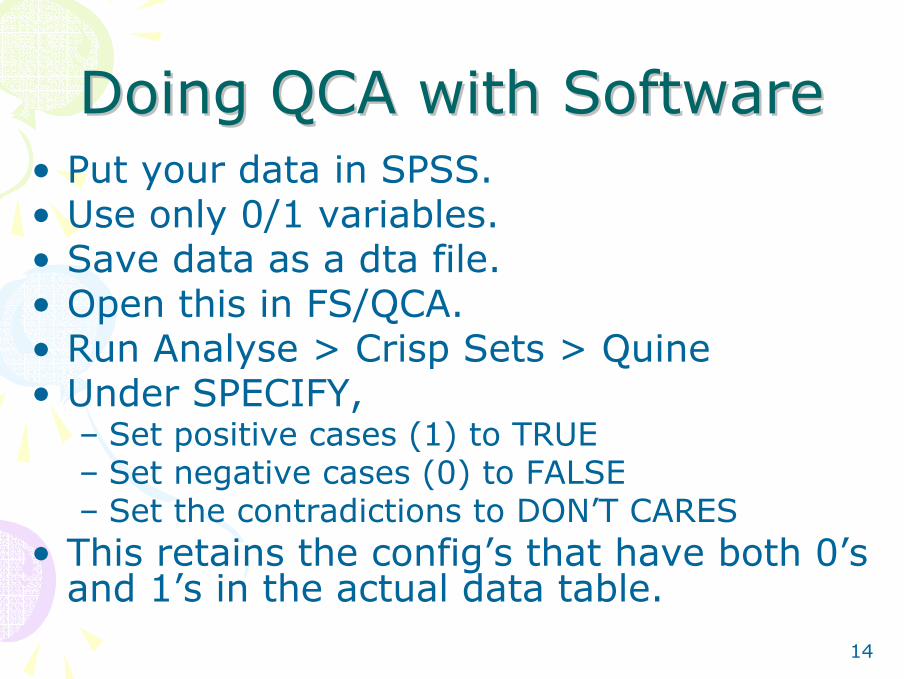
Doing QCA with SoftwareDoing QCA with Software• Put your data in SPSS.• Use only 0/1 variables.• Save data as a dta file.• Open this in FS/QCA.• Run Analyse > Crisp Sets > Quine• Under SPECIFY,
– Set positive cases (1) to TRUE– Set negative cases (0) to FALSE– Set the contradictions to DON’T CARES
• This retains the config’s that have both 0’s and 1’s in the actual data table.
15
WarningWarning• You have to set the SPECIFY settings.
• Otherwise you will get the message:– Warning: Select configurations to minimise
• This means you have ‘excluded’ (the default) the Positive cases! The default is rotten so ‘specify’ must be set.
16
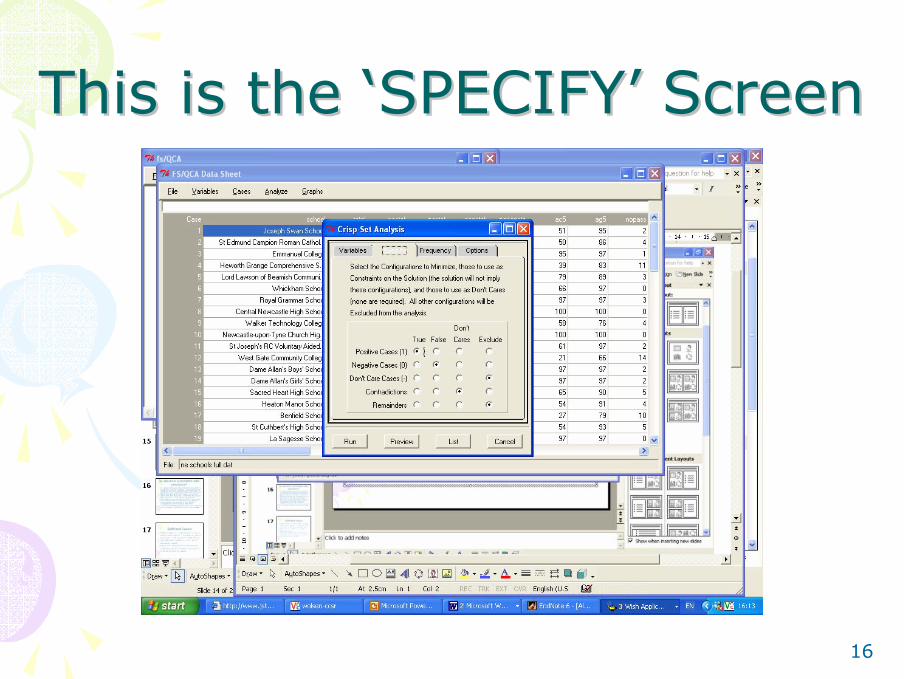
This is the ‘SPECIFY’ ScreenThis is the ‘SPECIFY’ Screen
17
This exampleThis example• CATHOLIC = typ3 =1• SOCIALLY DEPRIVED = socdep2 =1• SELECTIVE SCHOOLS = adpol2 =1• SPECIAL NEEDS, or SEN, the number
of cases of Statemented special needs, coded crisply ins SPECNEED
• GOOD EXAM PERFORMANCE is coded 0/1 in GOODEXAM (recoded FZplcl2)
18
Next StepsNext Steps• Click on LIST to see the
configurations that you have in the data – these actually have cases in them.
• It lists those with TRUE, FALSE, and contradictory results.
• Click on RUN to see the minimised truth table. Here is an example.
19
The List of Configurations The List of Configurations (i)(i)
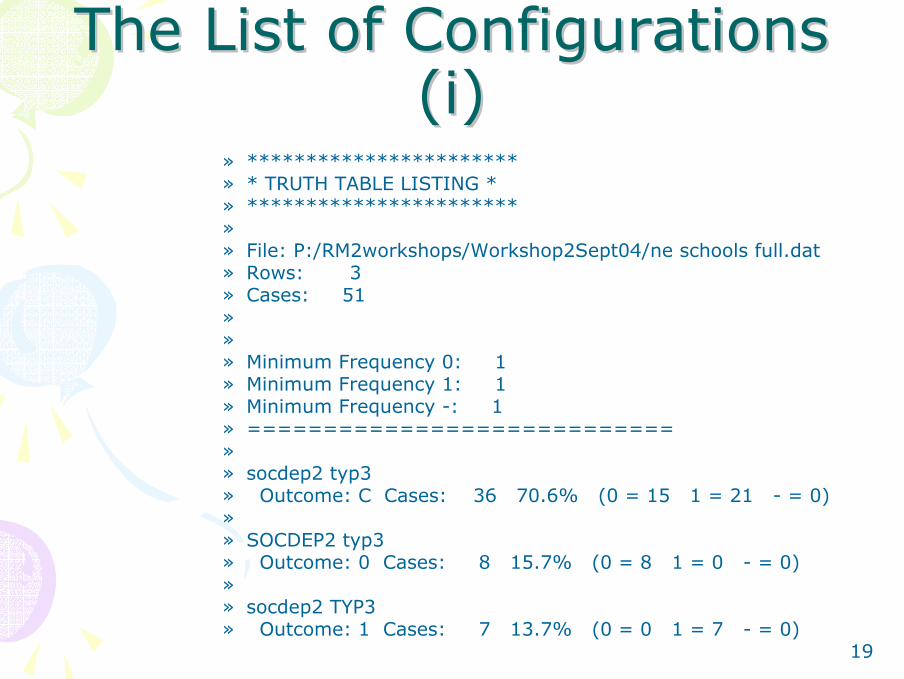
» *********************** » * TRUTH TABLE LISTING * » *********************** »» File: P:/RM2workshops/Workshop2Sept04/ne schools full.dat» Rows: 3 » Cases: 51 »»» Minimum Frequency 0: 1 » Minimum Frequency 1: 1 » Minimum Frequency -: 1 » ============================ »» socdep2 typ3 » Outcome: C Cases: 36 70.6% (0 = 15 1 = 21 - = 0) »» SOCDEP2 typ3 » Outcome: 0 Cases: 8 15.7% (0 = 8 1 = 0 - = 0) »» socdep2 TYP3 » Outcome: 1 Cases: 7 13.7% (0 = 0 1 = 7 - = 0)
20
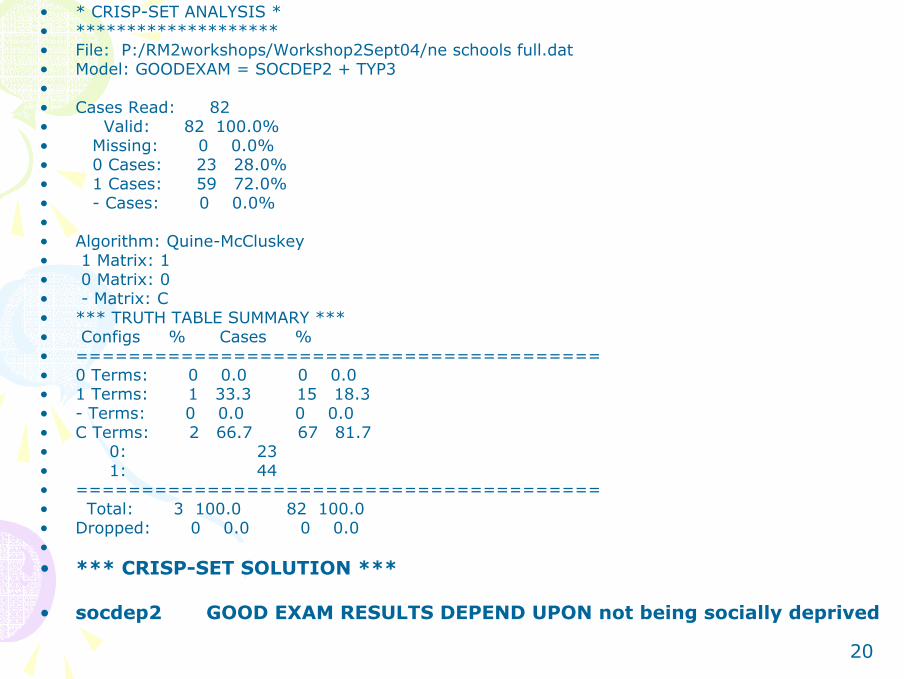
• ********************** • * CRISP-SET ANALYSIS * • ******************** • File: P:/RM2workshops/Workshop2Sept04/ne schools full.dat• Model: GOODEXAM = SOCDEP2 + TYP3 •• Cases Read: 82 • Valid: 82 100.0% • Missing: 0 0.0% • 0 Cases: 23 28.0% • 1 Cases: 59 72.0% • - Cases: 0 0.0% •• Algorithm: Quine-McCluskey• 1 Matrix: 1 • 0 Matrix: 0 • - Matrix: C • *** TRUTH TABLE SUMMARY *** • Configs % Cases % • ======================================== • 0 Terms: 0 0.0 0 0.0 • 1 Terms: 1 33.3 15 18.3 • - Terms: 0 0.0 0 0.0 • C Terms: 2 66.7 67 81.7 • 0: 23 • 1: 44 • ======================================== • Total: 3 100.0 82 100.0 • Dropped: 0 0.0 0 0.0 •• *** CRISP-SET SOLUTION ***
• socdep2 GOOD EXAM RESULTS DEPEND UPON not being socially deprived
21
The TruthThe Truth--Table SummaryTable Summary• Configurations are those which have either
a positive or negative outcome, or a Contradictory outcome across cases, but if there were a missing value on the outcome, it would be a “don’t care case” and wouldn’t count here.
• Instances, or “cases” in the truth table, are those with a positive outcome.
22
ConcludingConcluding• Using more terms in the algorithm, you
will get more complex solutions like:
• CATHOLIC&socdep + SEN&comp
• Which reads: If (CATHOLIC AND not socially deprived) OR (Special Educ. Needs AND not comprehensive) then GOOD EXAM RESULTS
23
Is absence symmetric with Is absence symmetric with presence?presence?
• In standard Boolean logic with crisp sets, Not-Y is symmetric with Y’s presence. The algorithm for reducing the set of configurations that cause Y is dependent upon the absence of Y implying not-Y.
• But if you use Fuzzy Sets, then you lose this symmetry. You have NOT-Y referring to all cases from 0 to .87 ----not just to the 0 values.
• Alternatively one can consider NOT-Y to be from 0 to .5 only. You will need to set cut-off level. Changing the cut-off causes the complex configurations to be merged differently.
• The FS/QCA software ignores the cases which are not ‘instances’. (Note the jargon in the manual.)
24
The Fuzzy Set Equivalent to The Fuzzy Set Equivalent to Boolean AlgebraBoolean Algebra
• We can’t simply add up 1 * 1 = 1 in fuzzy sets, since not all cases are on 1 or 0.
• So now {>.5 to 1} * {>.5 to 1} = 1
This is the combinatorial algebra used for Boolean logic with fuzzy sets.
AND implies that both must be >.5
25
‘‘OR’ in the fuzzy set algebraOR’ in the fuzzy set algebra• OR is inclusive or• It allows as a result of X,Y,Z all those
cases if either X, or Y, or Z are >.5
• Thus this is really inclusive and loose.
• However, XYZ indicating X&Y&Z is very exclusive.
26
Sufficient CauseSufficient Cause• Furthermore, it is necessary to have some cases
where Y is present (>.5), but X is absent(.5 or less), if we want to argue that X is a sufficient cause of Y yet not a necessary cause. These cases negate the claim that X is a necessary cause of Y but they do not negate the claim that it is part of a larger, complex, sufficient cause of Y.
• Ragin has summarised the possible combinations for multiple X’s and Y’s but if we use fuzzy sets, then Y {.17 to 1.00) has to be considered separately from NOT-Y (0 to .83).
27
Reminder: The Details of Reminder: The Details of Steps:Steps:
• small N of cases• compare them deliberately • use various types of evidence, • summarise the intermediate results in a table• reduce the table using Boolean logic – you simplify the
table– Look for necessary causes– Look for sufficient causes– Decide whether your outcome was well enough specified or not
• iterate: move back to earlier steps and re-do it all• then draw conclusions.
• USE FUZZY ALGORITHM FOR FUZZY SETS all on 0-1 scale• Fascinating.
28
Illustrations of QCAIllustrations of QCA• Levi-Faur (2002). Comparative Research Designs in the
Study of Regulation: How to Increase the Number of Cases Without Compromising the Strengths of Case-Oriented Analysis. The Politics of Regulation. J. Jacint and D. Levi-Faur. London, Elgar.
• Miethe, T. D. and K. A. Drass (1999). "Exploring the Social Context of Instrumental and Expressive Homicides: an Application of Qualitative Comparative Analysis." Journal of Quantitative Criminology 15(1): 1-21.
• Snow, D. and D. Cress (2000). "The Outcome of Homeless Mobilization: the Influence of Organization, Disruption, Political Mediation, and Framing." American Journal of Sociology 105(4): 1063-1104.
29
Taking QCA FurtherTaking QCA Further• Ragin, C. C. (1989). "The Logic of the
Comparative Method and the Algebra of Logic." Journal of Quantitative Anthropology 1(2): 373-398.
• Rantala, K. a. H., Eeva . (2001). "Qualitative Comparative Analysis - a Hermeneutic Approach to Interview Data." International Journal of Social Research Methodology 4(2): 87-100.
30
Illustrations of Fuzzy SetIllustrations of Fuzzy Set• Kvist, J. (1999). "Welfare Reform in the
Nordic Countries in the 1990s: Using Fuzzy-Set Theory to Assess Conformity to Ideal-Types." Journal of European Social Policy 9(3): 231-252.
• Pennings, Paul (2003). "Beyond Dichotomous Explanations: Explaining Constitutional Control of the Executive With Fuzzy-Sets." European Journal of Political Research 42(4): 541-568.
• Ragin, C. (2000) Fuzzy Set Social Science Chicago: University of Chicago Press.
31
Technical ReadingsTechnical Readings• If you want to help advance the state of fuzzy set
comparative analysis, then read:• Ragin, C. (2003). "Recent Advances in Fuzzy-Set
Methods and their Application to Policy Questions." Copies can be obtained via www.compasss.org or from [email protected] (as a pdf document).
• FUZZY:Schneider, C. Q. and C. Wagemann(2004). "How to Draw Causal Inference (Despite) Using QCA: The 'Two-Step, Multi-Equation FS/QCA Approach'." submitted paper. Copies can be obtained via www.compasss.org or from [email protected] (as a pdf document).