Embed Size (px)
Citation preview
Maricopa Commercial LandFOR SALE OR LEASE Maricopa Hwy & Stonegate Rd, Maricopa AZ
7377 E Doubletree Ranch Road • Suite A-160 • Scottsdale, Arizona 85258 • 480.505.0919 • www.esceeproperties.com
Sellers and brokers make no representation as to the environment or other conditions of the property and recommend the purchaser investigate fully. Information contained herein has been obtained from the owner or other sources. Brokers do not guarantee the accuracy of the information
Steve [email protected]
Scott [email protected]
Presented By:
SUBJECT
Proposed
� Build-To-Suit & Parcel Sales - Multiple Uses
� Unprecedented population growth (more than 4,000% over the past decade)
� Significant need / opportunity for Retail Services
� Prime frontage along the Maricopa-Casa Grande Hwy
� The site is adjacent to Walmart Supercenter development
� A young, active community wanting local shopping and dining options
� Maricopa path of growth
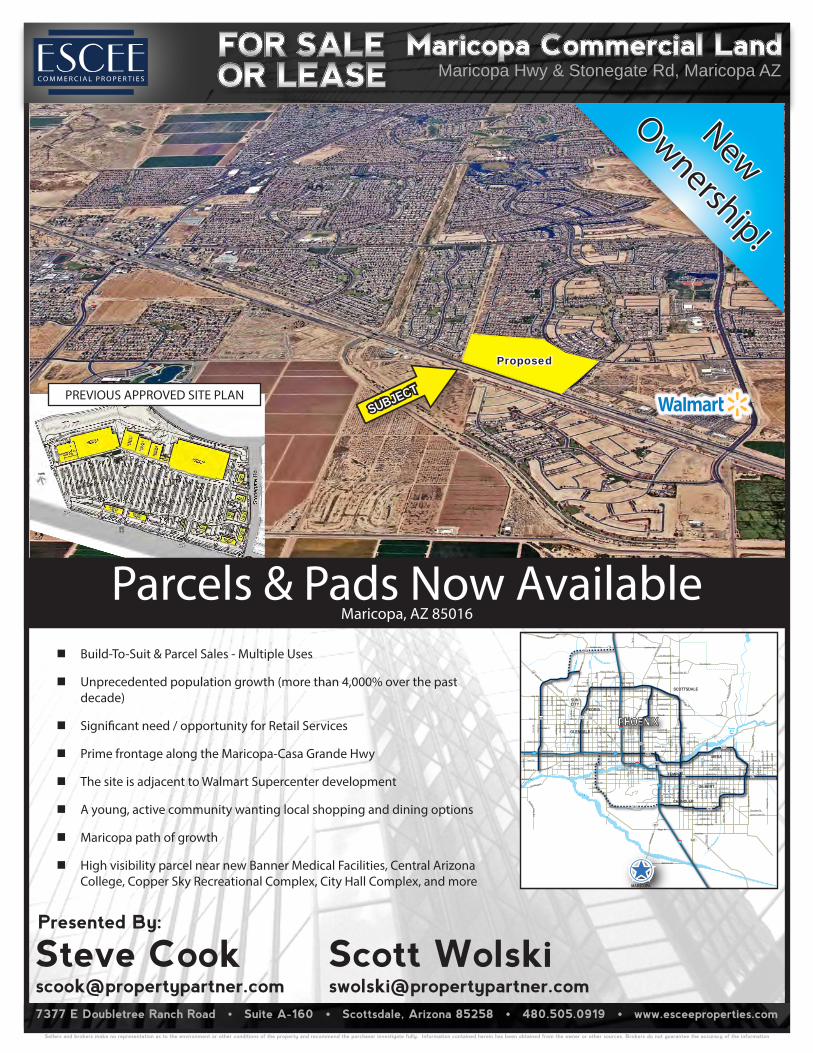
� High visibility parcel near new Banner Medical Facilities, Central Arizona College, Copper Sky Recreational Complex, City Hall Complex, and more
Parcels & Pads Now AvailableMaricopa, AZ 85016
PREVIOUS APPROVED SITE PLAN
NewOwnership!
74
74
51
87
87
87
87
303 101
101
587
347
202
143
202
202
303
202
60
60
60 60
17
17
10 10
10
10
17
Union Hills Dr Union Hills Dr
Thunderbird Rd
Cactus Rd
Greenway Rd Greenway Rd
Thunderbird Rd
Peoria Av
Olive AvOlive Av Dunlap Av
Glendale AvGlendale Av
Camelback Rd Camelback Rd Chaparral Rd
Bethany Home Rd
Indian School RdIndian School Rd Indian School Rd Indian SchoolRd
Lincoln DrIndian Bend Rd
McDonald Dr
Thomas Rd Thomas Rd
Lower Buckeye Rd
Happy Valley Rd
Beardsley RdBeardsley Rd
Pinnacle Peak Rd
Dynamite Bl Rio Verde Dr
Cave
Cree
k Rd
Lone Mountain Rd
Happy Valley Rd
Waddell Rd
Greenway Rd
Cactus Rd
Peoria Av
Cotto
n Ln
Citru
s Rd
El M
irage
Rd
Dysa
rt Rd
99th
Av
107t
h Av
111t
h Av
107t
h Av
83rd
Av
83rd
Av
91st
Av
67th
Av
67th
Av
75th
Av
75th
Av
59th
Av
59th
Av
35th
Av
43rd
Av
43rd
Av
35th
Av
19th
Av
19th
Av
7th A
v7t
h Av
Cent
ral A
vCe
ntra
l Av
7th
St
16th
St
16th
St
7th
St
32nd
St
40th
St
Pinnacle Peak Rd
Bartlett
Dam
Rd
McD
owell
Mtn
Rd
Frank Lloyd Wright Bl
Cactus Rd
Tatu
m B
l
Yuma Rd
Broadway Rd
Estrella Pkwy
Rainbow Valley Rd
Avon
dale
Blvd
Broadway Rd Broadway Rd
Southern Av Southern Av Southern Av Southern Av
Broadway Rd Broadway Rd
Baseline Rd
Dobbins Rd
Elliot Rd
Estrella Dr
Baseline Rd
University Dr University Dr
Baseline Rd
Guadalupe Rd
Elliot Rd
Warner Rd
Ray Rd
Pecos Rd
Germann Rd Germann Rd
Ray Rd
Pecos Rd
Rura
l Rd
Kyre
ne R
d
McC
linto
ck D
r
Price
Rd
Dobs
on R
d
Alm
a Sc
hool
Rd
Gilbe
rt Rd
Gilbe
rt Rd
Gilbe
rt Rd
Coop
er R
dSt
apley
Dr
McQ
ueen
Rd
Linds
ay R
d
Gree
nfiel
d Rd
Val V
ista
DrVa
l Vist
a Dr
Higle
y Rd
Idah
o Rd
Ironw
ood
RdVi
neya
rd R
d
Mer
idian
Rd
Crim
son
Rd
Soss
aman
Rd
Reck
er R
d
Higle
y Rd
Hawe
sRd
Sign
alBu
tte R
d
McDowell Rd
McKellips Rd
Brown Rd Brown Rd
Pim
a Rd
Pim
a Rd
New River Rd
7th
St
Queen Creek Rd
Ocotillo Rd
Queen Creek Rd
Mill
AvJack
rabb
it Tr
R.H. Johnson Bl
99th Av
Cave
Creek R
d
New River Rd
Elliot Rd
24th
St
24th
St
Hayd
en R
d
Deer Valley Rd
Warner Rd
56th
St
Bapchule Rd
Morristown-New River Hwy
Lak
e Pl
easa
nt R
d
Scot
tsdale
Rd
Scot
tsdale
Rd
Carefree Hwy Carefree Hwy
Shea Bl
Main StApache Bl Apache Tr
Chandler Heights Rd
Hunt Hwy
Ellsw
orth
Rd
Arizo
na A
v
Riggs Rd
51st
Av
Northern Av
Litch
field
Rd
Bulla
rd A
ve
Reem
s RdBell Rd Bell Rd
Grand Av
Grand Av
51st
Av51
st Av
Bell Rd
McDowell Rd McDowell Rd McDowell Rd
Van Buren St Van Buren St
Buckeye RdBuckeye Rd
Baseline Rd
Chandler Bl Williams Field Rd
Coun
try C
lub D
r
User
y Pa
ss R
d
County Rd 85
Maric
opa R
d
Beeline HwyShea Bl
Bush
Hwy
Powe
r Rd
LakePleasant BARTLETT
RESERVOIRWaddellDam
GraniteReefDam
Agua
Fria
Rive
r
Salt River
Gila River
Salt R.
Fannin-McFarland Aqueduct
Roosevel
t Can
al
Southern Canal
Western Canal
Grand Canal
Arizona Canal
Hayden-Rhodes Aqueduct
New
Rive
r
CHANDLER
GILBERT
PEORIA
SUN CITY
TEMPE
SCOTTSDALE
MESA
GLENDALE
MARICOPA
PHOENIX
Maricopa Commercial LandFOR SALE OR LEASE Maricopa Hwy & Stonegate Rd, Maricopa AZ
7377 E Doubletree Ranch Road • Suite A-160 • Scottsdale, Arizona 85258 • 480.505.0919 • www.esceeproperties.com
Sellers and brokers make no representation as to the environment or other conditions of the property and recommend the purchaser investigate fully. Information contained herein has been obtained from the owner or other sources. Brokers do not guarantee the accuracy of the information
Steve [email protected]
Scott [email protected]
Presented By:
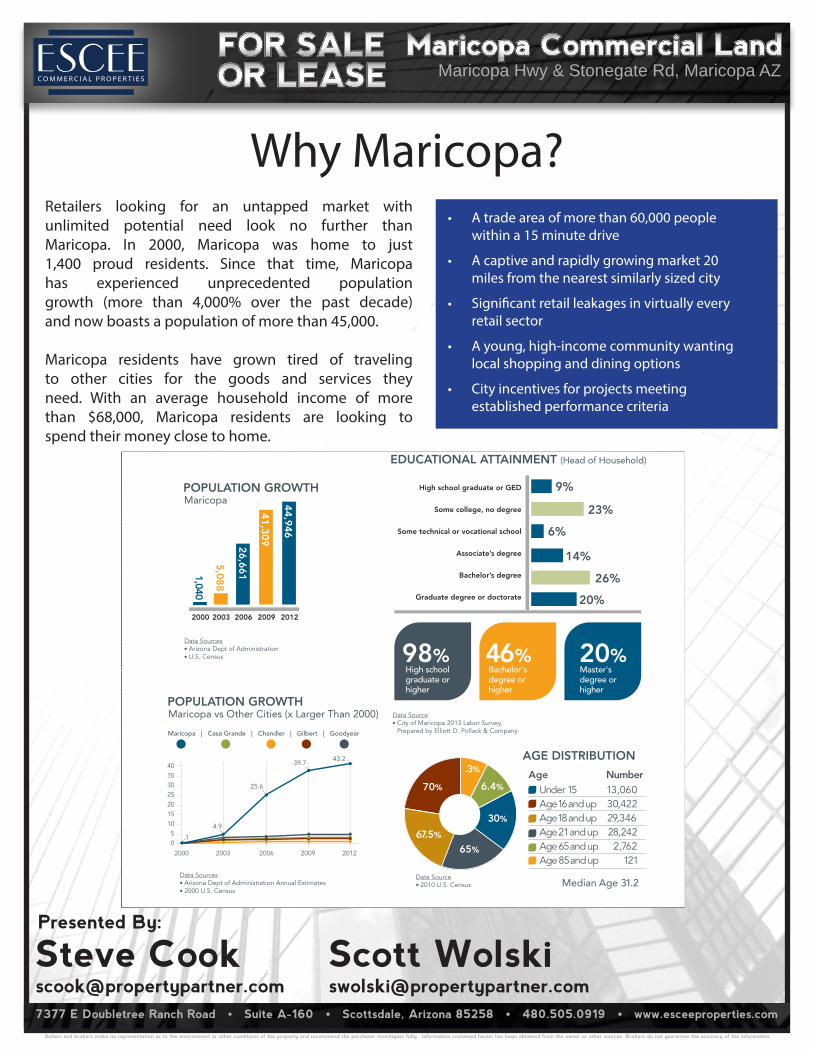
Why Maricopa?
23
79% 85%16 +MILES
AGE DISTRIBUTION
EDUCATIONAL ATTAINMENT (Head of Household)
Under 15 13,060Age 16 and up 30,422Age 18 and up 29,346Age 21 and up 28,242Age 65 and up 2,762Age 85 and up 121
Average household size 3.03
Maricopa
67.5%
70%
65%
30%
6.4%
.3% Age Number
EMPLOYMENT CHARACTERISTICS
Finance/Insurance/Professional ServicesEducationRetailMedical/HealthcareManufacturing
Work outside Maricopa
Would prefer to work in Maricopa
Average Commute
15%
13 %
13 %
TOP INDUSTRIES FOR EMPLOYMENT
Data Sources
Data Sources
98%
9%
14%
20%
6%
23% 292
14,359
15,791
5,565
26%
46% 20%High school graduate or higher
Bachelor's degree or higher
Master's degree or higher
High school graduate or GED
Some college, no degree
Some technical or vocational school
Associate’s degree
Bachelor’s degree
Graduate degree or doctorate
HOUSEHOLD INCOME
HOUSEHOLDS
$62,131
$22,841
$68,226
2000 2005 2010 2017 (prj)
10 %
SAFETY FIRST Valley Cities Comparison: 2nd Lowest Overall
1924
323435
3849
5959
69
0 18 35 53 70
Gilbert
Maricopa
Scottsdale
Chandler
El Mirage
Mesa
Phoenix
Tempe
Casa Grande
Glendale
Maricopa
1,040
26,661
41,309
5,088
POPULATION GROWTH
44,946
Maricopa | Casa Grande | Chandler | Gilbert | Goodyear
40353025201510 5 0
2000 2003 2006 2009 2012
1
4.9
25.6
39.743.2
Maricopa vs Other Cities (x Larger Than 2000)POPULATION GROWTH
2000 2003 2006 2009 2012
Median Age 31.2
2000 and 2010 U.S. Census2005 Special Census2013 ESRI BAO Projection
Data Sources2009-2011 American Community Survey2010 U.S. Census
Data Source2010 U.S. Census
Data SourceCity of Maricopa 2013 Labor Survey, Prepared by Elliott D. Pollack & Company
Data SourcesArizona Dept of AdministrationU.S. Census
Data SourceFBI Uniform Crime Reports, Overall crime rate per 1,000 residents (FY 2011-2012)
Data SourceCity of Maricopa 2013 Labor Survey, Prepared by Elliott D. Pollack & Company
Data SourcesArizona Dept of Administration Annual Estimates2000 U.S. Census
13 %
Median household income
Mean household income
Per capita income
COMMUNITY DATA
Retailers looking for an untapped market with unlimited potential need look no further than Maricopa. In 2000, Maricopa was home to just 1,400 proud residents. Since that time, Maricopa has experienced unprecedented population growth (more than 4,000% over the past decade) and now boasts a population of more than 45,000.
Maricopa residents have grown tired of traveling to other cities for the goods and services they need. With an average household income of more than $68,000, Maricopa residents are looking to spend their money close to home.
• A trade area of more than 60,000 people within a 15 minute drive
• A captive and rapidly growing market 20 miles from the nearest similarly sized city
• Significant retail leakages in virtually every retail sector
• A young, high-income community wanting local shopping and dining options
• City incentives for projects meeting established performance criteria