Embed Size (px)
Citation preview
CESRTA R&D Program
Mark Palmer for the CESRTA CollaborationMay 13, 2010
ILC PAC Meeting - Valencia
May 13, 2010 ILC PAC Meeting, Valencia 2
Outline
• Project Overview– Motivation– Project Goals– Reconfiguration– Status
• R&D Effort (Selected Items)– Low Emittance Correction and Tuning– EC Studies
• Build-Up and Mitigation• EC Beam Dynamics• Simulation Program
• Conclusion
May 13, 2010 ILC PAC Meeting, Valencia 3
Motivation for CESRTA
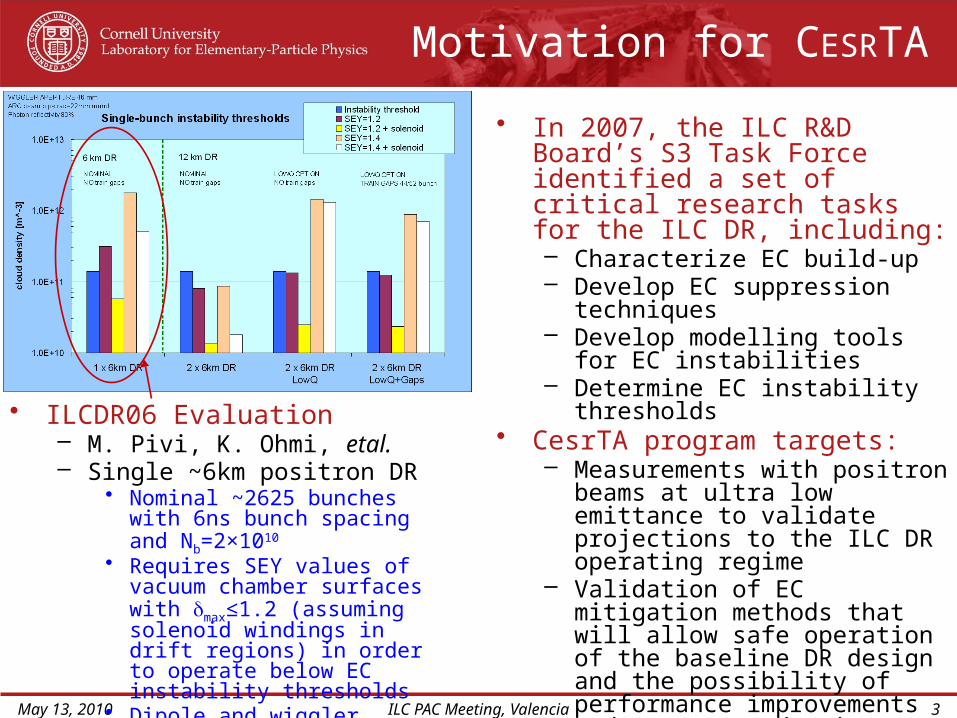
• ILCDR06 Evaluation– M. Pivi, K. Ohmi, etal.– Single ~6km positron DR
• Nominal ~2625 bunches with 6ns bunch spacing and Nb=2×10¹⁰
• Requires SEY values of vacuum chamber surfaces with dmax≤1.2 (assuming solenoid windings in drift regions) in order to operate below EC instability thresholds
• Dipole and wiggler regions of greatest concern for EC build-up
• In 2007, the ILC R&D Board’s S3 Task Force identified a set of critical research tasks for the ILC DR, including:– Characterize EC build-up– Develop EC suppression
techniques– Develop modelling tools for EC
instabilities– Determine EC instability thresholds
• CesrTA program targets:– Measurements with positron
beams at ultra low emittance to validate projections to the ILC DR operating regime
– Validation of EC mitigation methods that will allow safe operation of the baseline DR design and the possibility of performance improvements and/or cost reductions
May 13, 2010 ILC PAC Meeting, Valencia 4
R&D Goals
– Studies of Electron Cloud Growth and Mitigation• Study EC growth and methods to mitigate it, particularly in the wigglers and
dipoles which are of greatest concern in the ILC DR design. • Use these studies to benchmark and expand existing simulation codes and to
validate our projections for the ILC DR design.– Low Emittance Operations
• Support EC studies with beam emittances approaching those specified for the ILC DR (CesrTA vertical emittance target: ev<20 pm-rad).
• Implement beam instrumentation needed to achieve and characterize ultra low emittance beams
– x-Ray Beam Size Monitor targeting bunch-by-bunch (single pass) readout– Beam Position Monitor upgrade
• Develop tuning tools to achieve and maintain ultra low emittance operation in coordination with the ILC DR LET effort
– Studies of EC Induced Instability Thresholds and Emittance Dilution• Measure instability thresholds and emittance growth due to the EC in a low
emittance regime approaching that of the ILC DR. • Validate EC simulations in the low emittance parameter regime. • Confirm the projected impact of the EC on ILC DR performance.
– Inputs for the ILC DR Technical Design• Support an experimental program to provide key results on the 2010
timescale
May 13, 2010 ILC PAC Meeting, Valencia 5
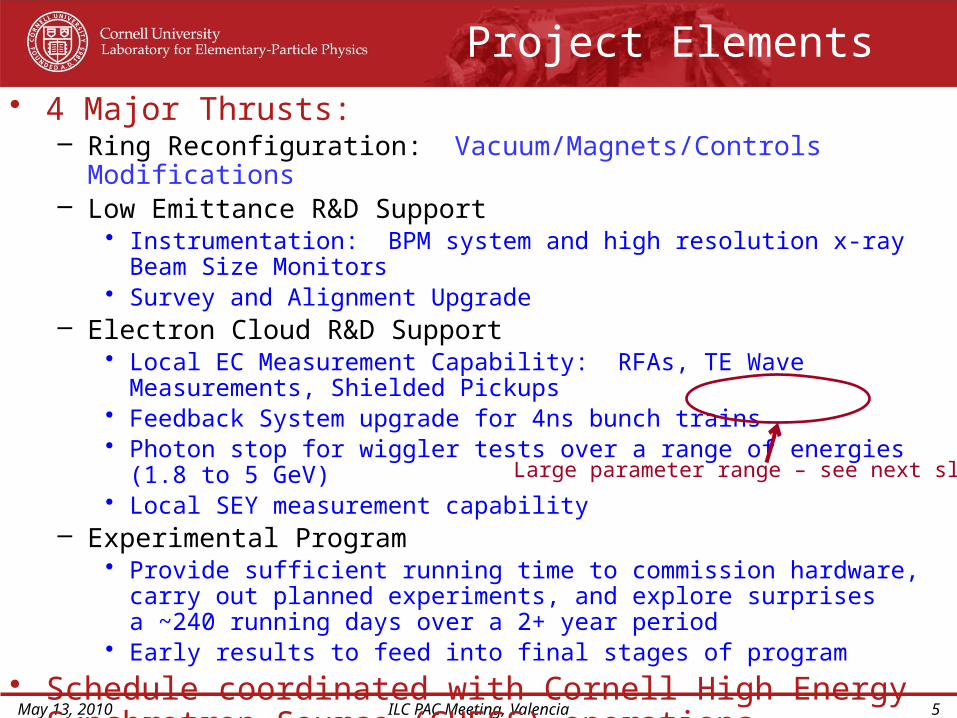
Project Elements• 4 Major Thrusts:
– Ring Reconfiguration: Vacuum/Magnets/Controls Modifications– Low Emittance R&D Support
• Instrumentation: BPM system and high resolution x-ray Beam Size Monitors• Survey and Alignment Upgrade
– Electron Cloud R&D Support• Local EC Measurement Capability: RFAs, TE Wave Measurements,
Shielded Pickups• Feedback System upgrade for 4ns bunch trains• Photon stop for wiggler tests over a range of energies (1.8 to 5 GeV)• Local SEY measurement capability
– Experimental Program• Provide sufficient running time to commission hardware, carry out planned
experiments, and explore surprises a ~240 running days over a 2+ year period
• Early results to feed into final stages of program
• Schedule coordinated with Cornell High Energy Synchrotron Source (CHESS) operations
Large parameter range – see next slide
May 13, 2010 ILC PAC Meeting, Valencia 6
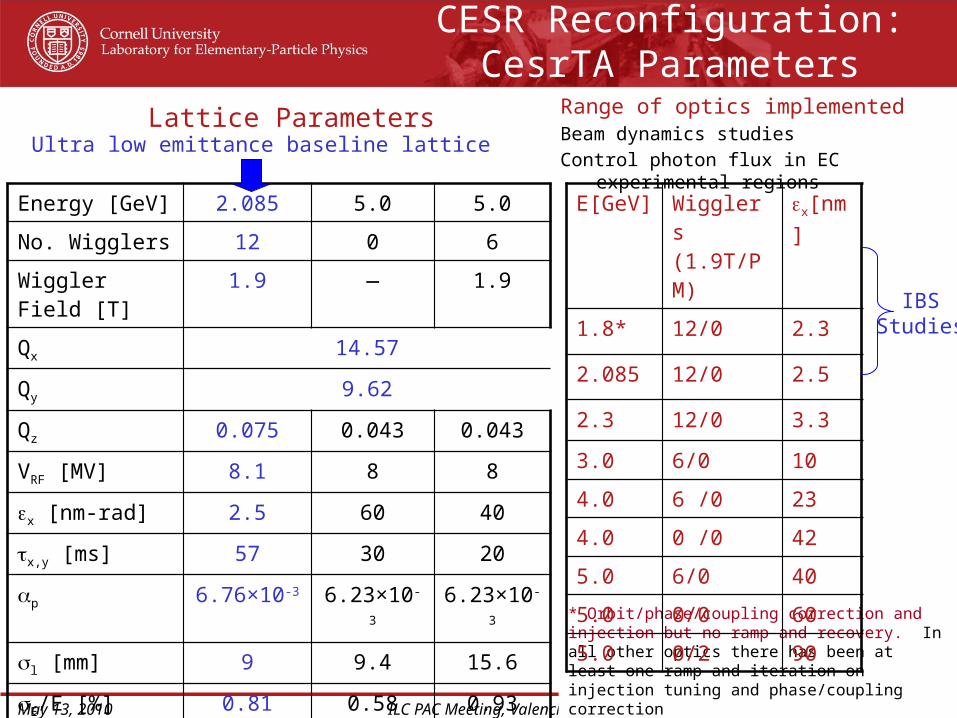
* Orbit/phase/coupling correction and injection but no ramp and recovery. In all other optics there has been at least one ramp and iteration on injection tuning and phase/coupling correction
CESR Reconfiguration:CesrTA Parameters
Energy [GeV] 2.085 5.0 5.0
No. Wigglers 12 0 6
Wiggler Field [T] 1.9 ― 1.9
Qx 14.57
Qy 9.62
Qz 0.075 0.043 0.043
VRF [MV] 8.1 8 8
ex [nm-rad] 2.5 60 40
tx,y [ms] 57 30 20
ap 6.76×10⁻³ 6.23×10⁻³ 6.23×10⁻³
sl [mm] 9 9.4 15.6
sE/E [%] 0.81 0.58 0.93
tb [ns] ≥4, steps of 2
Range of optics implementedBeam dynamics studies
Control photon flux in EC experimental regions
E[GeV] Wigglers (1.9T/PM)
x[nm]
1.8* 12/0 2.3
2.085 12/0 2.5
2.3 12/0 3.3
3.0 6/0 10
4.0 6 /0 23
4.0 0 /0 42
5.0 6/0 40
5.0 0/0 60
5.0 0/2 90
Lattice ParametersUltra low emittance baseline lattice
IBSStudies
May 13, 2010 ILC PAC Meeting, Valencia 7
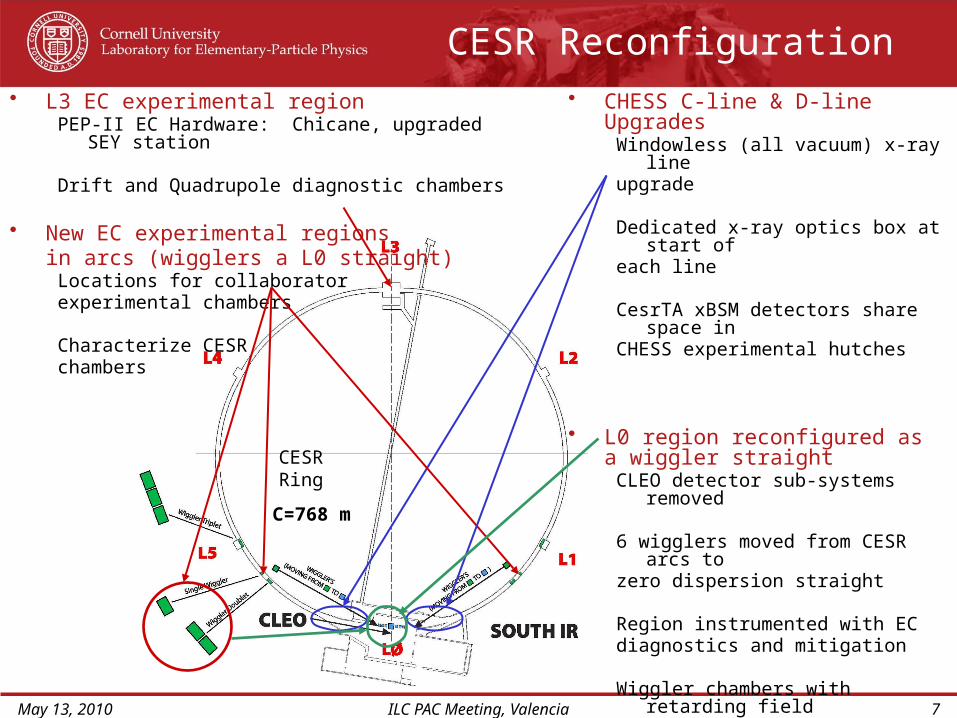
CESR Reconfiguration• L3 EC experimental region
PEP-II EC Hardware: Chicane, upgraded SEY station
Drift and Quadrupole diagnostic chambers
• New EC experimental regions in arcs (wigglers a L0 straight)
Locations for collaborator experimental chambers
Characterize CESR chambers
• CHESS C-line & D-line UpgradesWindowless (all vacuum) x-ray lineupgrade
Dedicated x-ray optics box at start ofeach line
CesrTA xBSM detectors share space inCHESS experimental hutches
• L0 region reconfigured as a wiggler straight
CLEO detector sub-systems removed
6 wigglers moved from CESR arcs tozero dispersion straight
Region instrumented with ECdiagnostics and mitigation
Wiggler chambers with retarding field analyzers and various EC mitigation methods (fabricated at LBNL in CU/SLAC/KEK/LBNL collaboration)
CESRRing
C=768 m
May 13, 2010 ILC PAC Meeting, Valencia 8
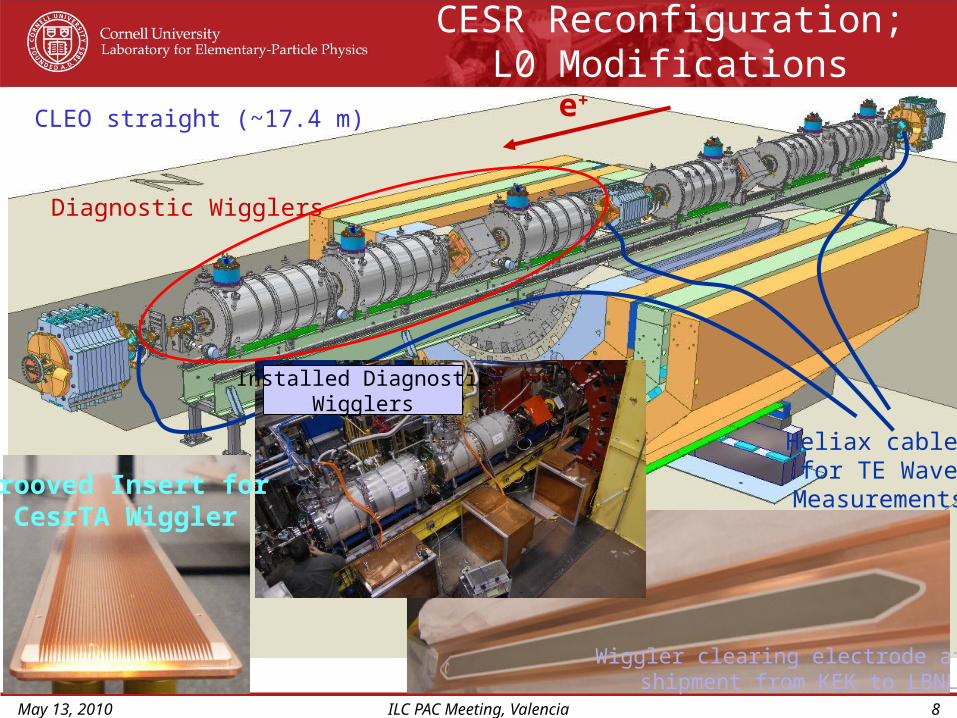
CESR Reconfiguration;L0 Modifications
CLEO straight (~17.4 m)
Heliax cablesfor TE Wave
Measurements
Installed DiagnosticWigglers
e+
Diagnostic Wigglers
Grooved Insert forCesrTA Wiggler
Wiggler clearing electrode aftershipment from KEK to LBNL
May 13, 2010 ILC PAC Meeting, Valencia 9
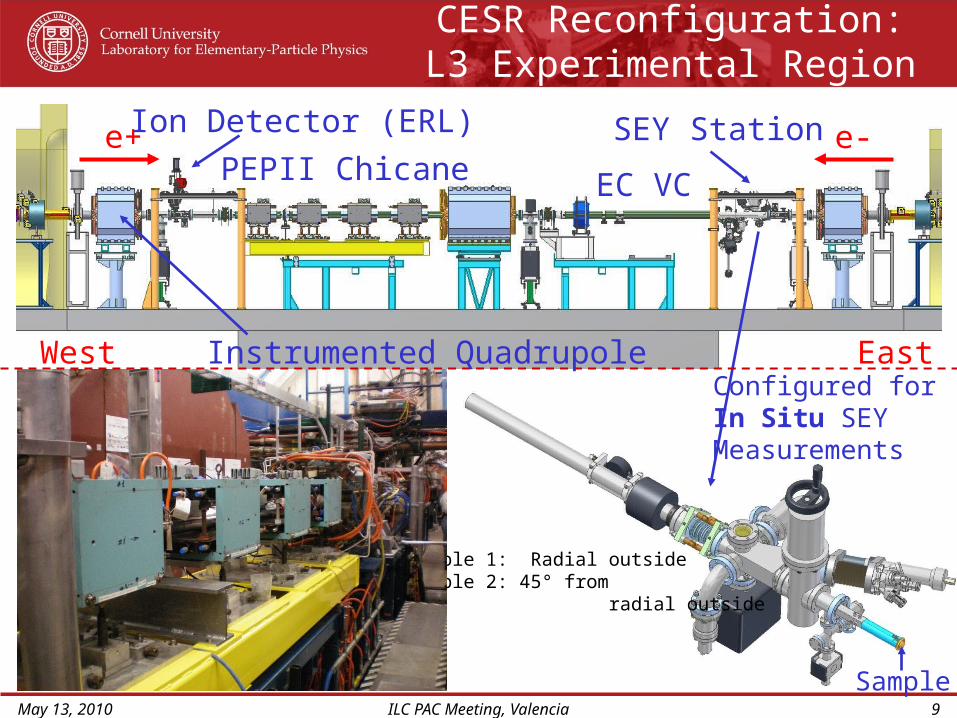
CESR Reconfiguration:L3 Experimental Region
e+ e-
West East
Ion Detector (ERL)
PEPII Chicane EC VC
SEY Station
Configured forIn Situ SEYMeasurements
Sample
Sample 1: Radial outsideSample 2: 45° from radial outside
Instrumented Quadrupole
May 13, 2010 ILC PAC Meeting, Valencia 10
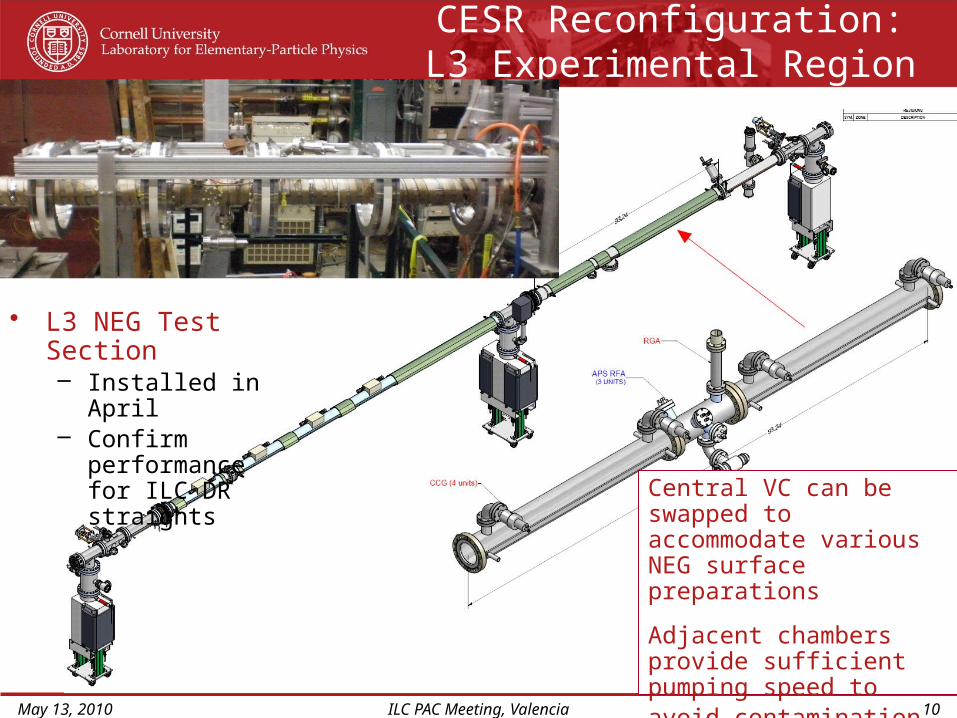
CESR Reconfiguration:L3 Experimental Region
• L3 NEG Test Section– Installed in April– Confirm performance
for ILC DR straights
Central VC can be swapped to accommodate various NEG surface preparations
Adjacent chambers provide sufficient pumping speed to avoid contamination of test chamber during studies
May 13, 2010 ILC PAC Meeting, Valencia 11
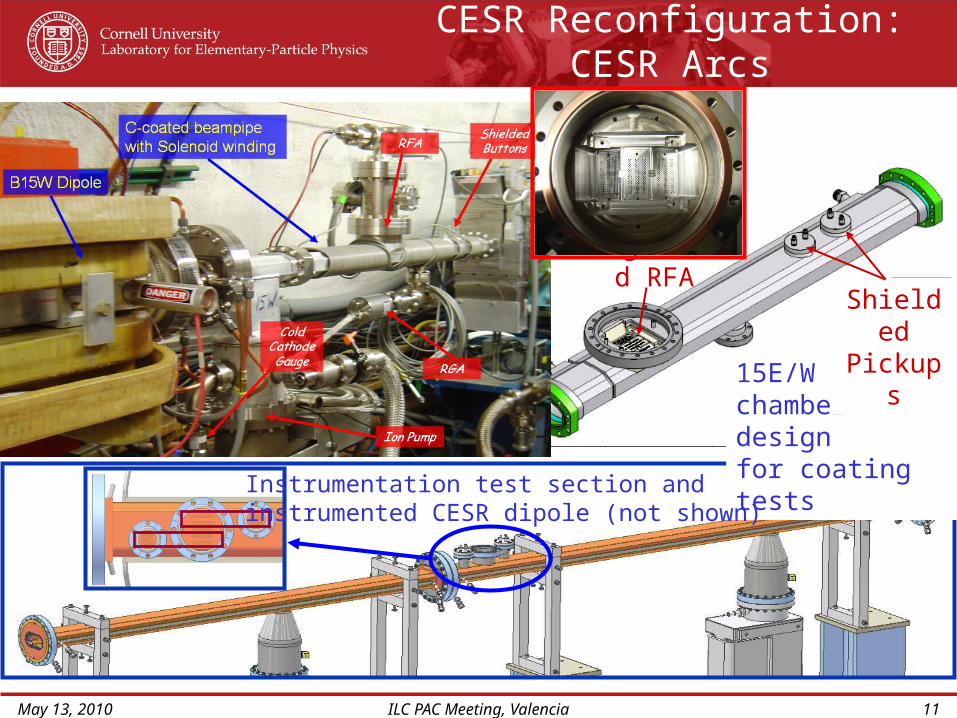
CESR Reconfiguration:CESR Arcs
15E/W testchamber design for coating tests
Segmented RFA
Shielded Pickups
Instrumentation test section and instrumented CESR dipole (not shown)
May 13, 2010 ILC PAC Meeting, Valencia 12
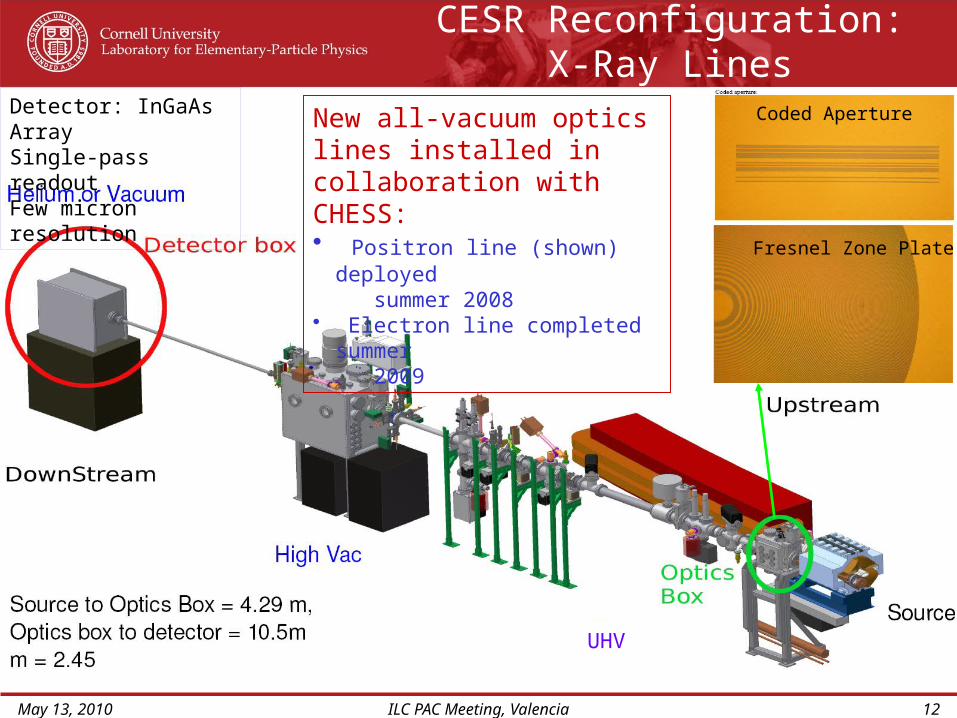
CESR Reconfiguration:X-Ray Lines
New all-vacuum optics lines installed in collaboration with CHESS:• Positron line (shown) deployed
summer 2008• Electron line completed summer
2009
UHV
Coded Aperture
Fresnel Zone Plate
Detector: InGaAs ArraySingle-pass readoutFew micron resolution
May 13, 2010 ILC PAC Meeting, Valencia 13
Status and Ongoing Effort
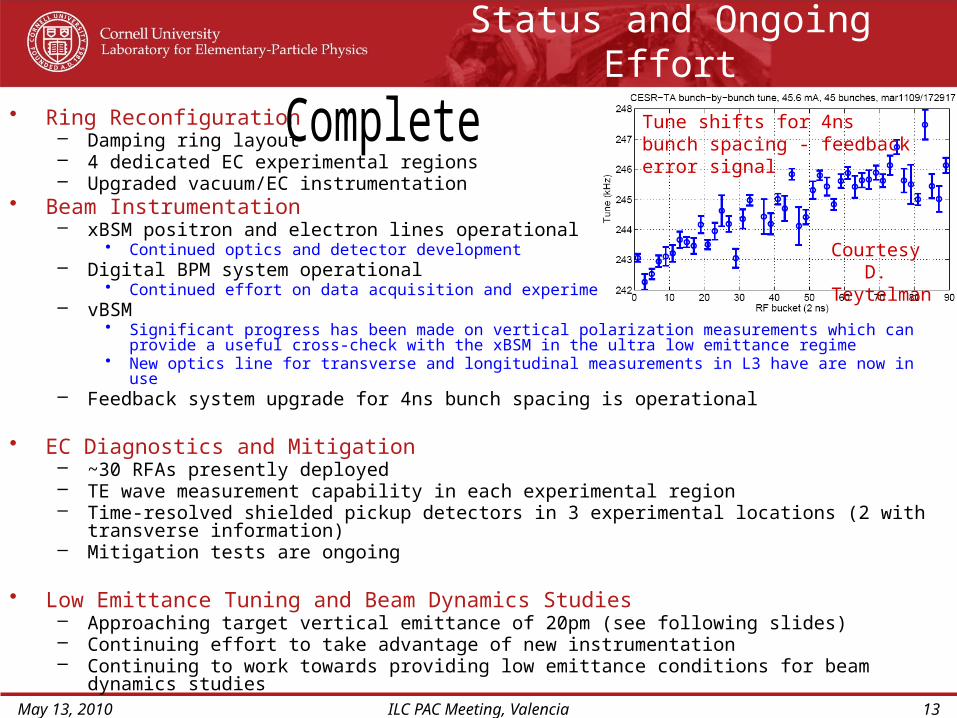
• Ring Reconfiguration– Damping ring layout– 4 dedicated EC experimental regions– Upgraded vacuum/EC instrumentation
• Beam Instrumentation– xBSM positron and electron lines operational
• Continued optics and detector development– Digital BPM system operational
• Continued effort on data acquisition and experimental data modes– vBSM
• Significant progress has been made on vertical polarization measurements which can provide a useful cross-check with the xBSM in the ultra low emittance regime
• New optics line for transverse and longitudinal measurements in L3 have are now in use– Feedback system upgrade for 4ns bunch spacing is operational
• EC Diagnostics and Mitigation– ~30 RFAs presently deployed– TE wave measurement capability in each experimental region– Time-resolved shielded pickup detectors in 3 experimental locations (2 with transverse information)– Mitigation tests are ongoing
• Low Emittance Tuning and Beam Dynamics Studies– Approaching target vertical emittance of 20pm (see following slides)– Continuing effort to take advantage of new instrumentation– Continuing to work towards providing low emittance conditions for beam dynamics studies
Tune shifts for 4ns bunch spacing - feedback error signal
Courtesy D. Teytelman
R&D Effort
• Will Highlight A Few Items• Low Emittance Correction and Tuning• EC Studies
– Build-Up and Mitigation– EC Beam Dynamics– Simulation Program
May 13, 2010 ILC PAC Meeting, Valencia 14
May 13, 2010 ILC PAC Meeting, Valencia 15
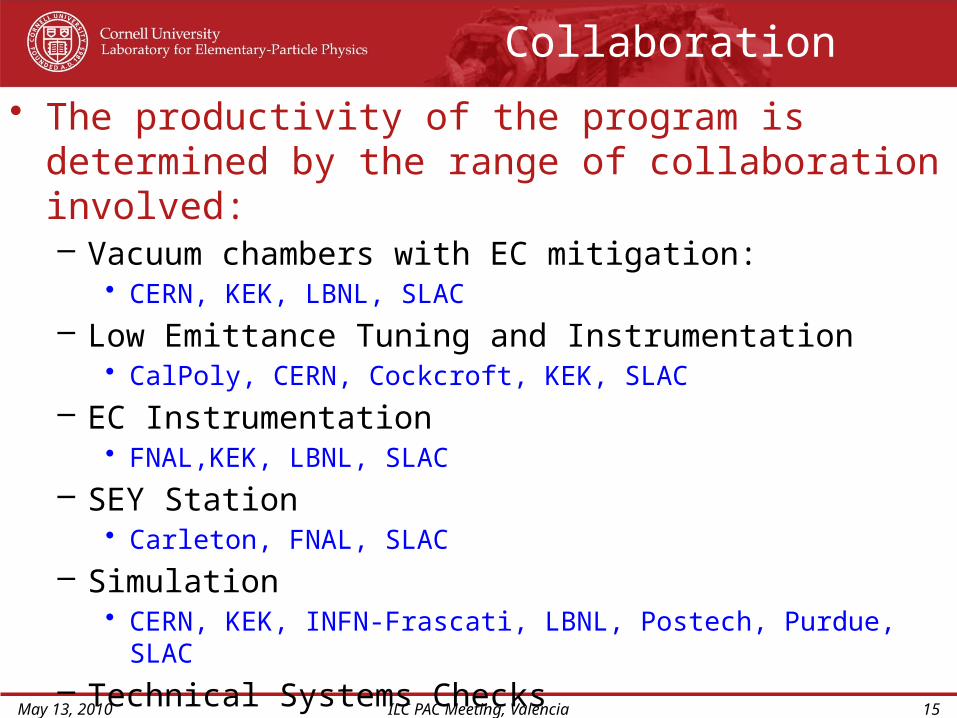
Collaboration
• The productivity of the program is determined by the range of collaboration involved:– Vacuum chambers with EC mitigation:
• CERN, KEK, LBNL, SLAC
– Low Emittance Tuning and Instrumentation• CalPoly, CERN, Cockcroft, KEK, SLAC
– EC Instrumentation• FNAL,KEK, LBNL, SLAC
– SEY Station• Carleton, FNAL, SLAC
– Simulation• CERN, KEK, INFN-Frascati, LBNL, Postech, Purdue, SLAC
– Technical Systems Checks• BNL, CERN, KEK
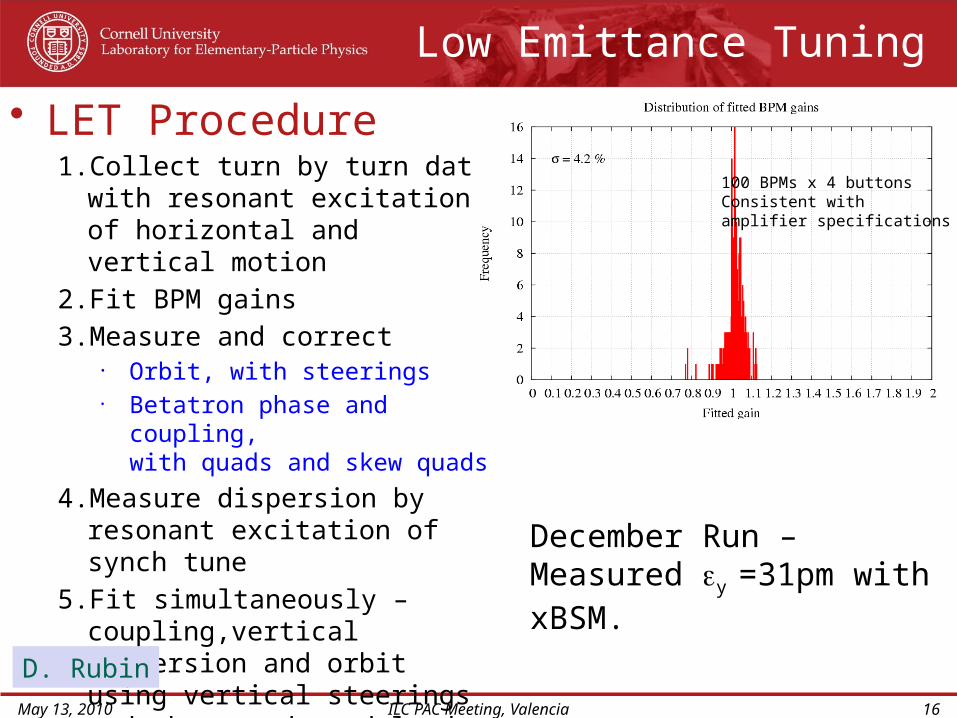
Low Emittance Tuning
• LET Procedure1. Collect turn by turn data with
resonant excitation of horizontal and vertical motion
2. Fit BPM gains
3. Measure and correct • Orbit, with steerings• Betatron phase and coupling,
with quads and skew quads
4. Measure dispersion by resonant excitation of synch tune
5. Fit simultaneously – coupling,vertical dispersion and orbit using vertical steerings and skew quads and load corrections
May 13, 2010 ILC PAC Meeting, Valencia 16
100 BPMs x 4 buttonsConsistent withamplifier specifications
December Run – Measured ey =31pm with xBSM.
D. Rubin
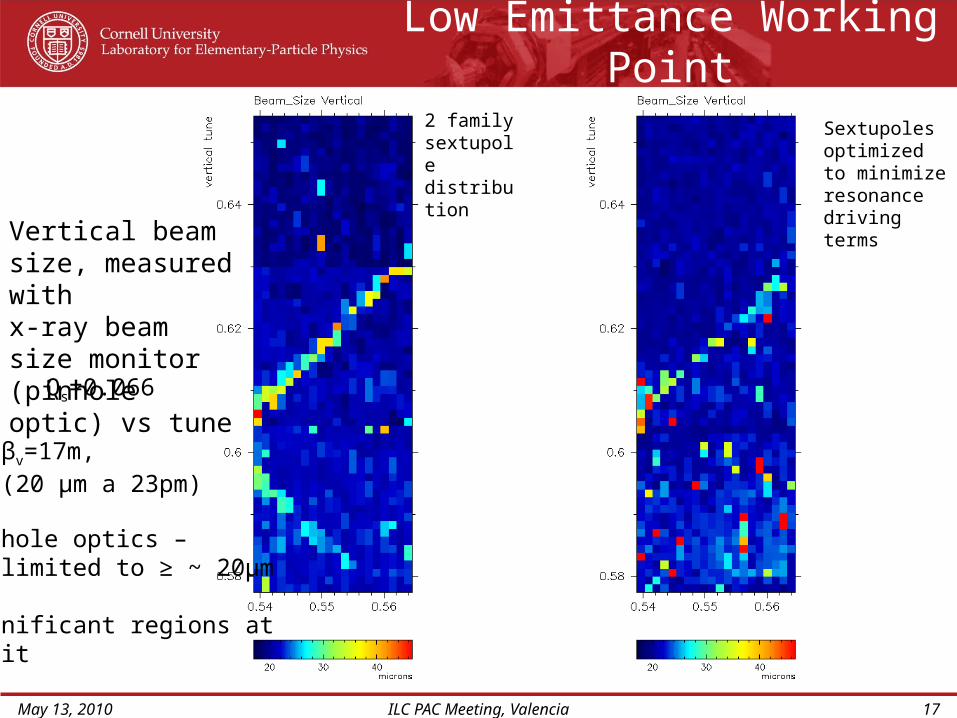
2 family sextupole distribution
Sextupoles optimized to minimize resonance driving terms
Vertical beam size, measured with x-ray beam size monitor (pinholeoptic) vs tune
βv=17m,(20 μm a 23pm)
Qs=0.066
Pinhole optics – limited to ≥ ~ 20μm
Significant regions atlimit
Low Emittance Working Point
May 13, 2010 ILC PAC Meeting, Valencia 17
May 13, 2010 ILC PAC Meeting, Valencia 18
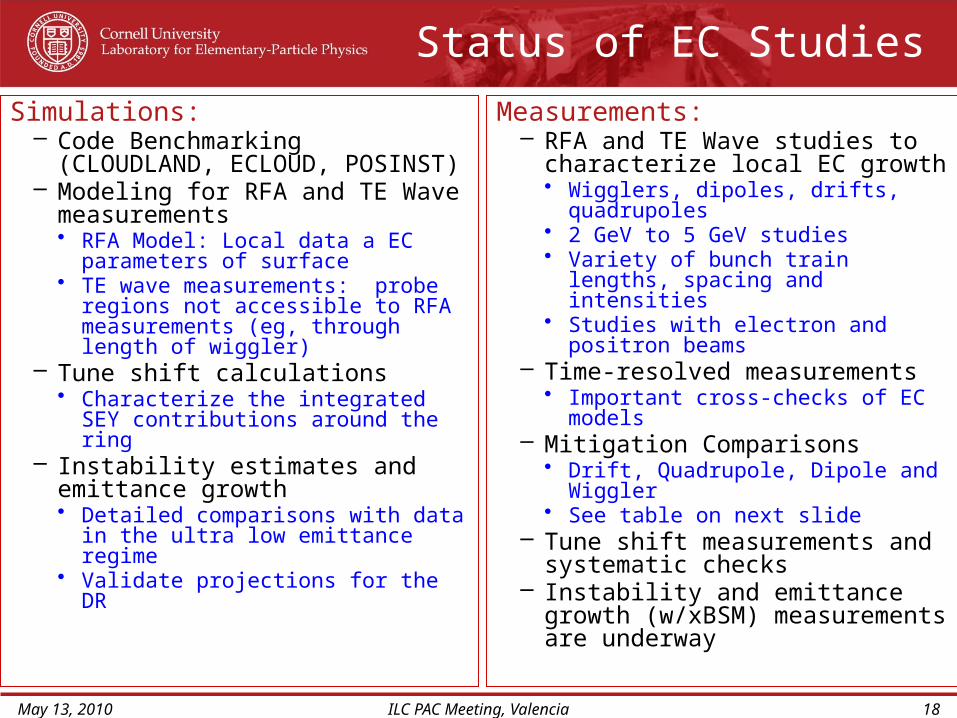
Status of EC Studies
Simulations:– Code Benchmarking (CLOUDLAND,
ECLOUD, POSINST) – Modeling for RFA and TE Wave
measurements• RFA Model: Local data a EC parameters
of surface• TE wave measurements: probe regions
not accessible to RFA measurements (eg, through length of wiggler)
– Tune shift calculations• Characterize the integrated SEY
contributions around the ring– Instability estimates and emittance
growth • Detailed comparisons with data in the
ultra low emittance regime• Validate projections for the DR
Measurements:– RFA and TE Wave studies to
characterize local EC growth• Wigglers, dipoles, drifts, quadrupoles• 2 GeV to 5 GeV studies• Variety of bunch train lengths, spacing
and intensities• Studies with electron and positron
beams– Time-resolved measurements
• Important cross-checks of EC models– Mitigation Comparisons
• Drift, Quadrupole, Dipole and Wiggler• See table on next slide
– Tune shift measurements and systematic checks
– Instability and emittance growth (w/xBSM) measurements are underway
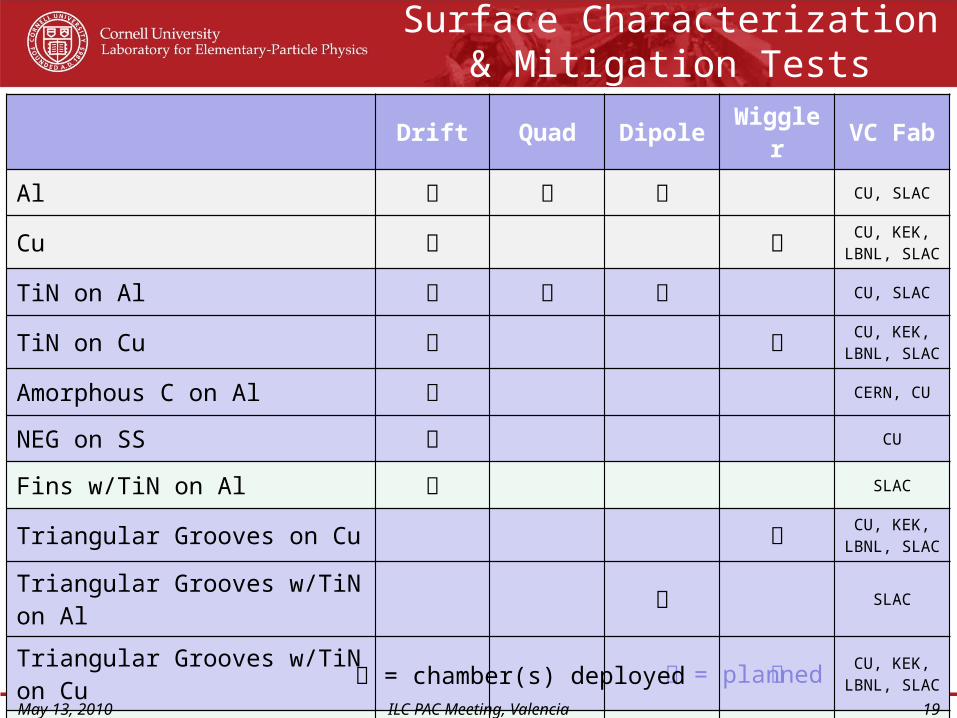
Surface Characterization & Mitigation Tests
Drift Quad Dipole Wiggler VC Fab
Al CU, SLAC
Cu CU, KEK, LBNL, SLAC
TiN on Al CU, SLAC
TiN on Cu CU, KEK, LBNL, SLAC
Amorphous C on Al CERN, CU
NEG on SS CU
Fins w/TiN on Al SLAC
Triangular Grooves on Cu CU, KEK, LBNL, SLAC
Triangular Grooves w/TiN on Al SLAC
Triangular Grooves w/TiN on Cu CU, KEK, LBNL, SLAC
Clearing Electrode CU, KEK, LBNL, SLAC
May 13, 2010 ILC PAC Meeting, Valencia 19
= planned = chamber(s) deployed
May 13, 2010 ILC PAC Meeting, Valencia 20
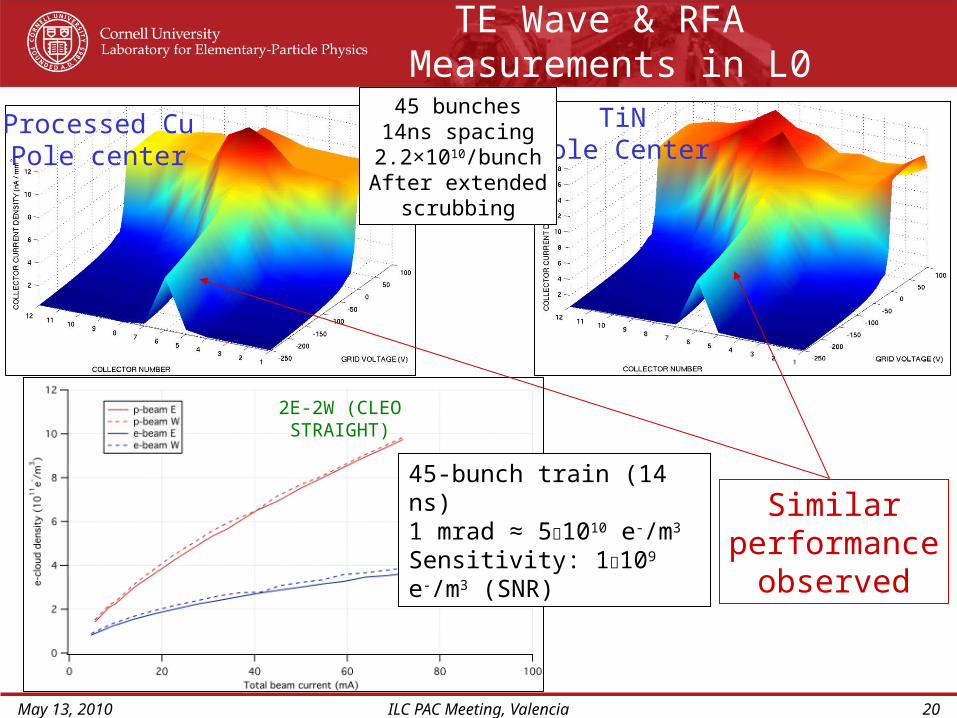
TE Wave & RFA Measurements in L0
45-bunch train (14 ns)1 mrad ≈ 51010 e-/m3 Sensitivity: 1109 e-/m3 (SNR)
2E-2W (CLEO STRAIGHT)
Processed CuPole center
TiNPole Center
45 bunches14ns spacing
2.2×10¹⁰/bunchAfter extended
scrubbing
Similarperformance
observed
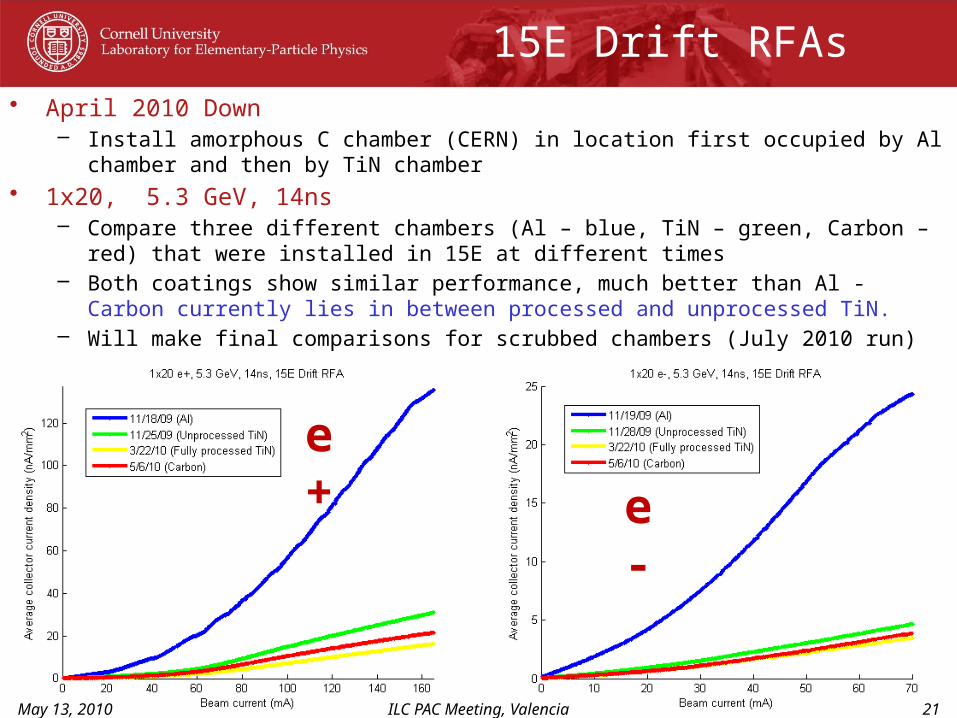
15E Drift RFAs
e+
e-
• April 2010 Down – Install amorphous C chamber (CERN) in location first occupied by Al chamber and then by
TiN chamber• 1x20, 5.3 GeV, 14ns
– Compare three different chambers (Al – blue, TiN – green, Carbon – red) that were installed in 15E at different times
– Both coatings show similar performance, much better than Al - Carbon currently lies in between processed and unprocessed TiN.
– Will make final comparisons for scrubbed chambers (July 2010 run)
May 13, 2010 21ILC PAC Meeting, Valencia
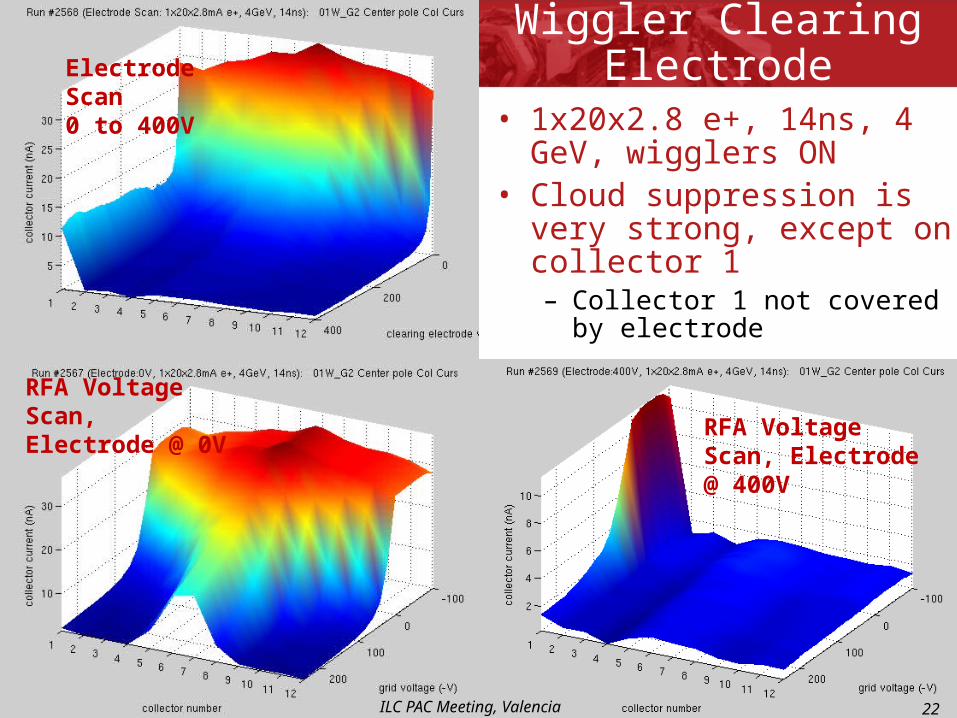
Wiggler Clearing Electrode
• 1x20x2.8 e+, 14ns, 4 GeV, wigglers ON
• Cloud suppression is very strong, except on collector 1– Collector 1 not covered by
electrode
Electrode Scan 0 to 400V
RFA Voltage Scan, Electrode @ 0V RFA Voltage Scan,
Electrode @ 400V
22ILC PAC Meeting, Valencia
May 13, 2010 ILC PAC Meeting, Valencia 23
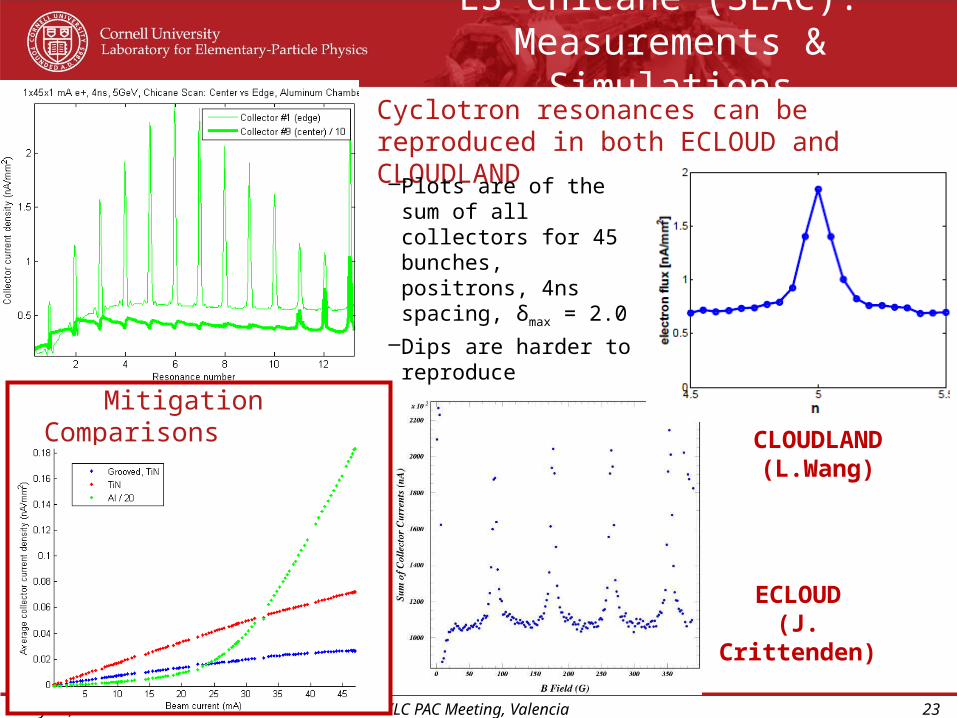
Mitigation ComparisonsAl (÷20) vs TiN vs TiN+Grooves
L3 Chicane (SLAC): Measurements & Simulations
ECLOUD(J. Crittenden)
CLOUDLAND (L.Wang)
Cyclotron resonances can be reproduced in both ECLOUD and CLOUDLAND
–Plots are of the sum of all collectors for 45 bunches, positrons, 4ns spacing, δmax = 2.0
–Dips are harder to reproduce
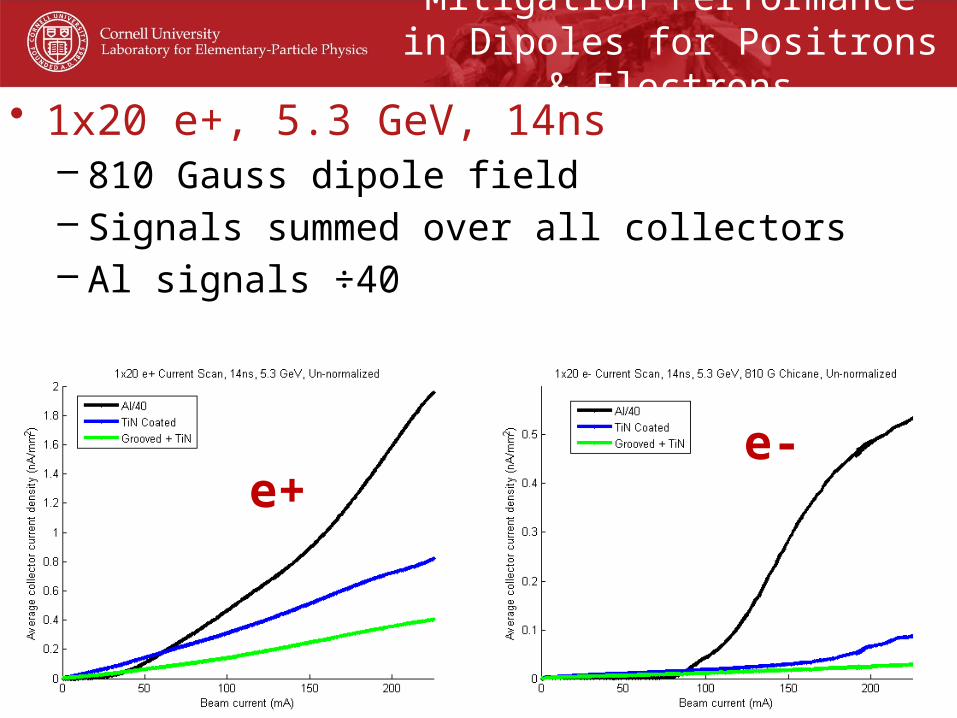
Mitigation Performance in Dipoles for Positrons & Electrons
• 1x20 e+, 5.3 GeV, 14ns– 810 Gauss dipole field– Signals summed over all collectors– Al signals ÷40
May 13, 2010 ILC PAC Meeting, Valencia 24
e+e-
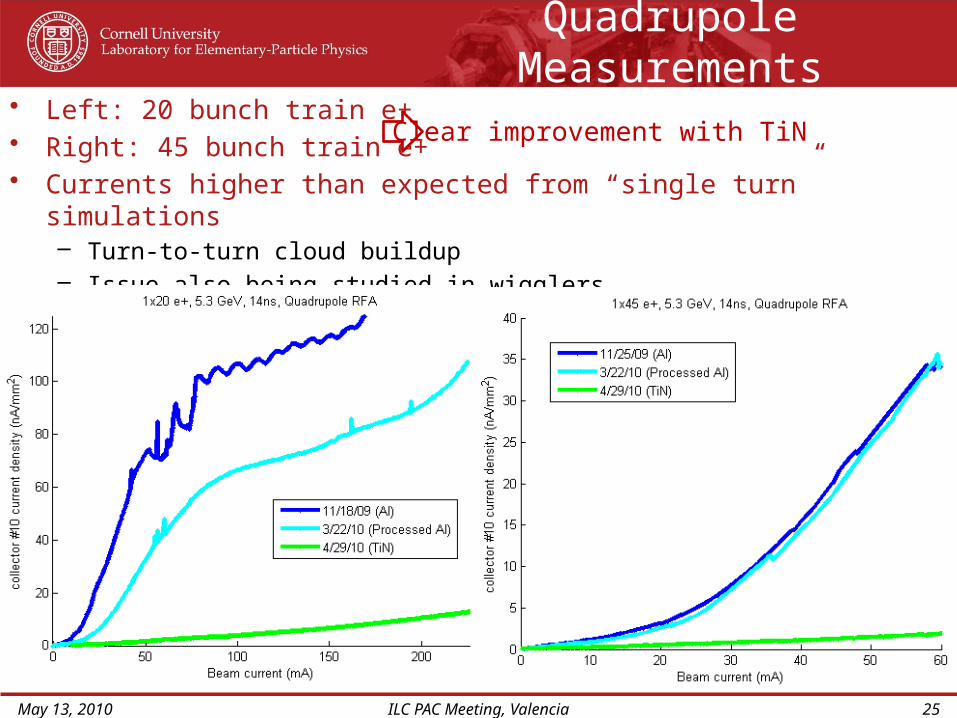
Quadrupole Measurements• Left: 20 bunch train e+• Right: 45 bunch train e+• Currents higher than expected from “single turn” simulations
– Turn-to-turn cloud buildup– Issue also being studied in wigglers
Clear improvement with TiN
May 13, 2010 25ILC PAC Meeting, Valencia
In Situ SEY Measurement System
May 13, 2010 ILC PAC Meeting, Valencia 26
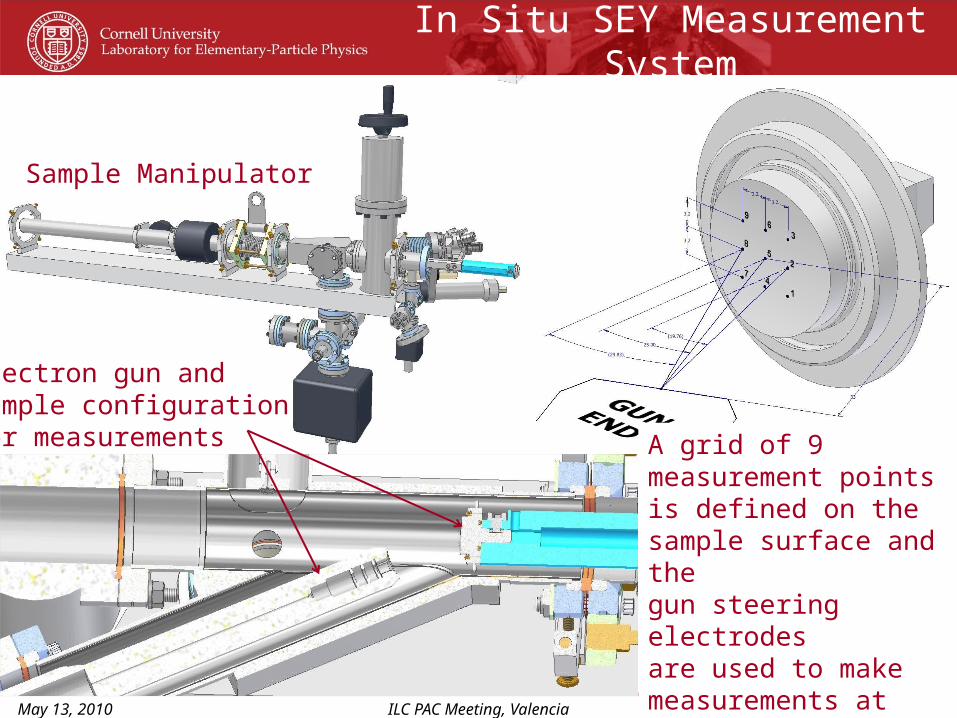
Sample Manipulator
Electron gun and sample configuration for measurements A grid of 9 measurement
points is defined on the sample surface and thegun steering electrodesare used to make measurements at eachpointAngles: 20˚, 25˚, 30˚
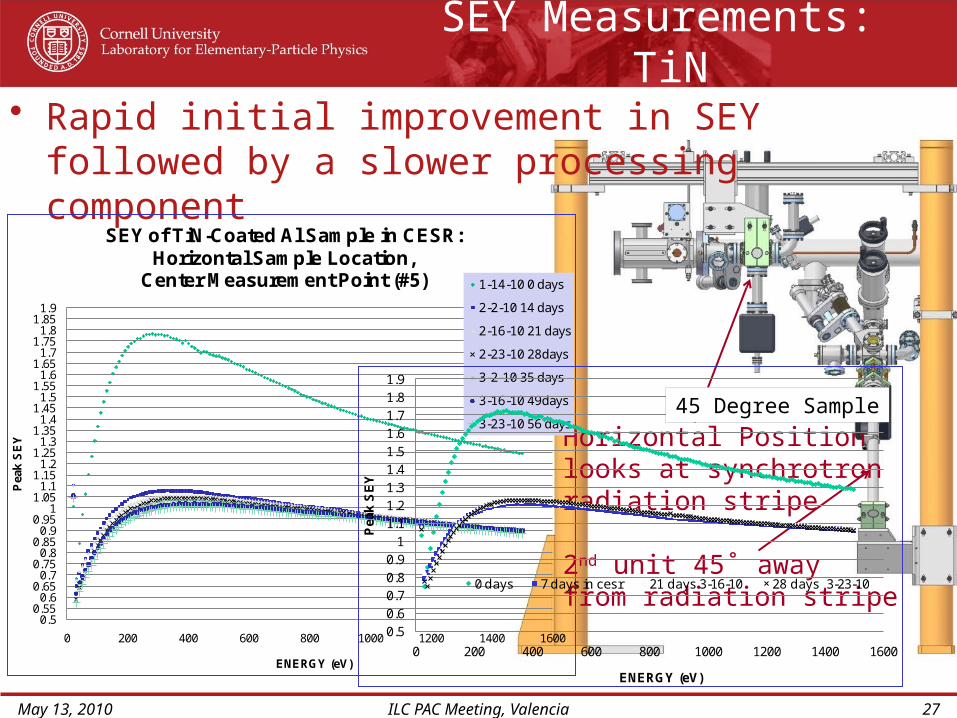
SEY Measurements: TiN
• Rapid initial improvement in SEY followed by a slower processing component
May 13, 2010 ILC PAC Meeting, Valencia 27
Horizontal Positionlooks at synchrotronradiation stripe
2nd unit 45˚ away from radiation stripe
0.50.55
0.60.65
0.70.75
0.80.85
0.90.95
11.05
1.11.15
1.21.25
1.31.35
1.41.45
1.51.55
1.61.65
1.71.75
1.81.85
1.9
0 200 400 600 800 1000 1200 1400 1600
Pea
k S
EY
ENERGY (eV)
SEY of TiN-Coated Al Sample in CESR: Horizontal Sample Location,
Center Measurement Point (#5) 1-14-10 0 days
2-2-10 14 days
2-16-10 21 days
2-23-10 28days
3-2-10 35 days
3-16-10 49days
3-23-10 56 days
0.50.60.7
0.80.9
1
1.11.21.31.4
1.51.61.7
1.81.9
0 200 400 600 800 1000 1200 1400 1600
Pea
k S
EY
ENERGY (eV)
0 days 7 days in cesr 21 days 3-16-10 28 days 3-23-10
45 Degree Sample
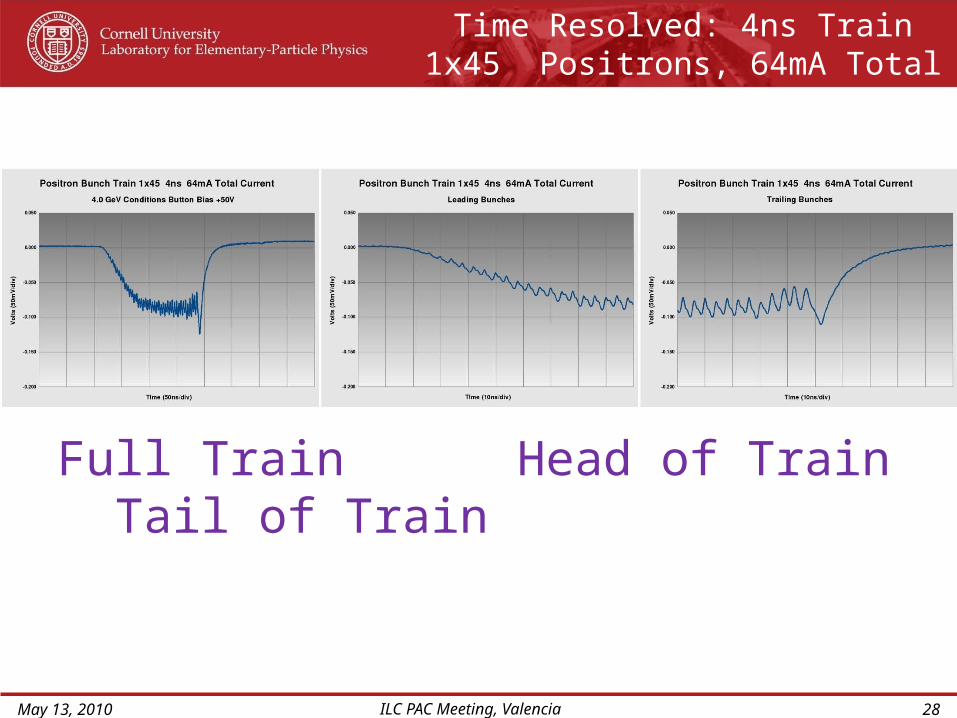
Time Resolved: 4ns Train 1x45 Positrons, 64mA Total
May 13, 2010 28ILC PAC Meeting, Valencia
Full Train Head of Train Tail of Train
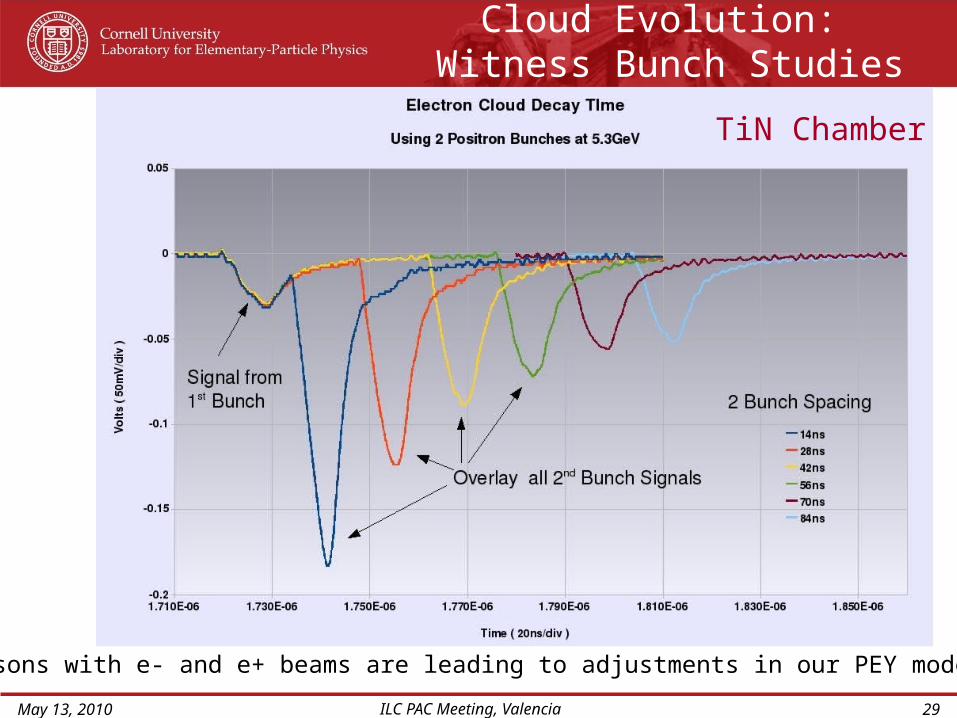
Cloud Evolution: Witness Bunch Studies
TiN Chamber
May 13, 2010 29ILC PAC Meeting, Valencia
Comparisons with e- and e+ beams are leading to adjustments in our PEY model
Beam Instabilities and Emittance Growth
• A major focus of present run is to explore beam instabilities and emittance growth at ultra low emittance
• Bunch-by-bunch measurements with the xBSM
• Signatures of the onset of the Head-Tail instability
• Much work to do (including more detailed modeling of experiments), but very promising initial results…
• Modeling of instabilities underway– KEK-Postech (analytical estimates and simulation)
– SLAC-Cornell (CMAD)
– Frascati (multi-bunch instability)
May 13, 2010 ILC PAC Meeting, Valencia 30
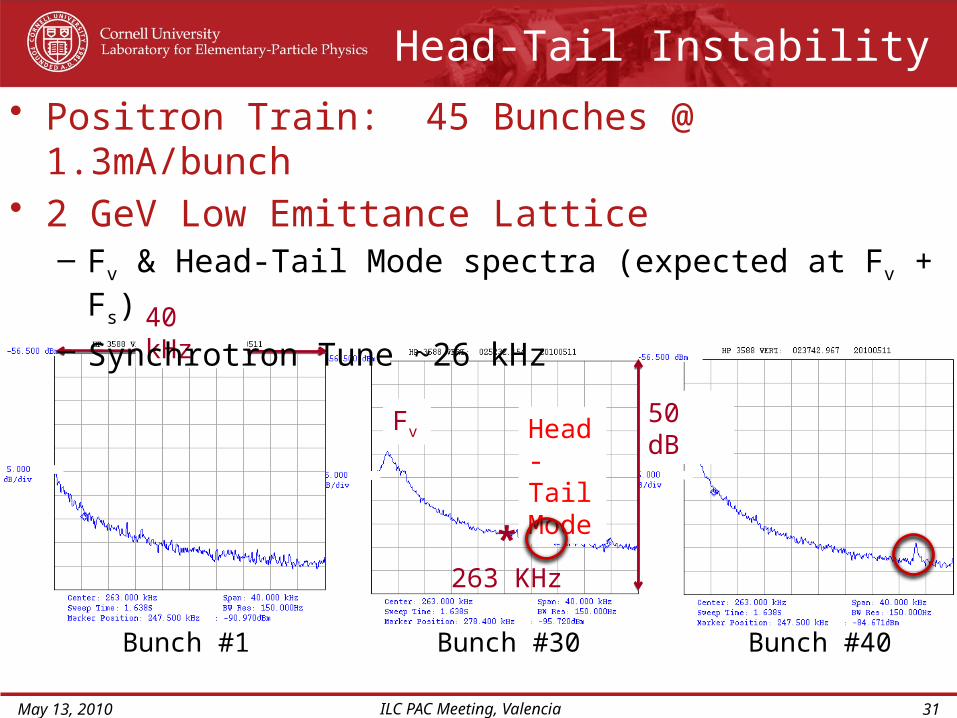
Head-Tail Instability
May 13, 2010 ILC PAC Meeting, Valencia 31
50 dBHead-Tail Mode
Fv
*263 KHz
40 kHz
Bunch #1 Bunch #30 Bunch #40
• Positron Train: 45 Bunches @ 1.3mA/bunch• 2 GeV Low Emittance Lattice
– Fv & Head-Tail Mode spectra (expected at Fv + Fs)
– Synchrotron Tune ~26 kHz
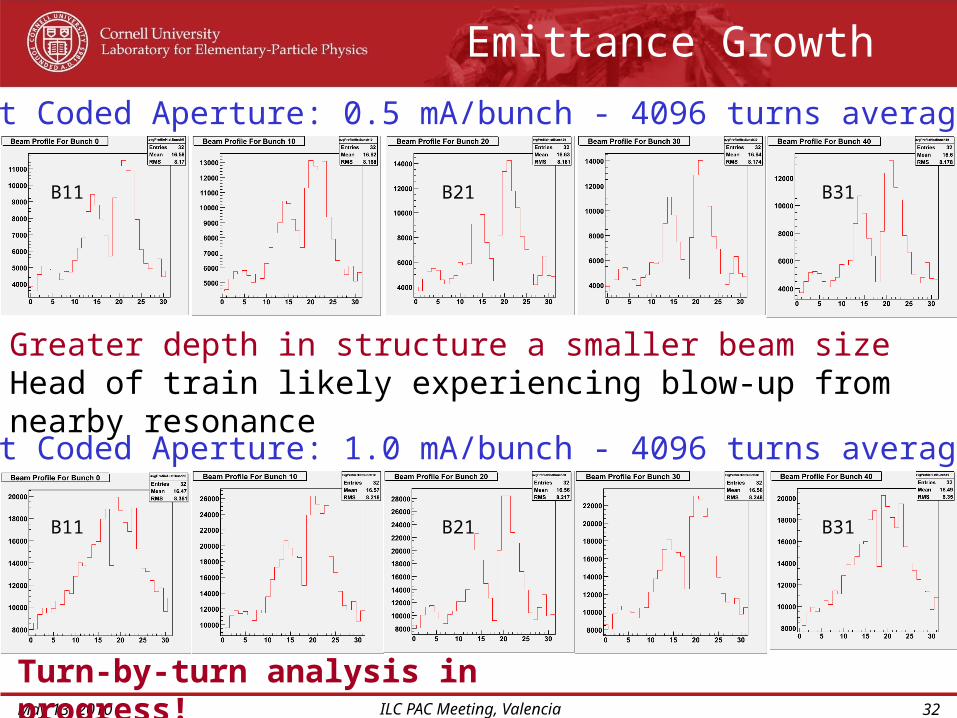
Emittance Growth
May 13, 2010 ILC PAC Meeting, Valencia 32
Greater depth in structure a smaller beam sizeHead of train likely experiencing blow-up from nearby resonance
Turn-by-turn analysis in progress!
Fast Coded Aperture: 0.5 mA/bunch - 4096 turns averages
Fast Coded Aperture: 1.0 mA/bunch - 4096 turns averages
B1 B11 B21 B31 B41
B1 B11 B21 B31 B41
Simulation Effort
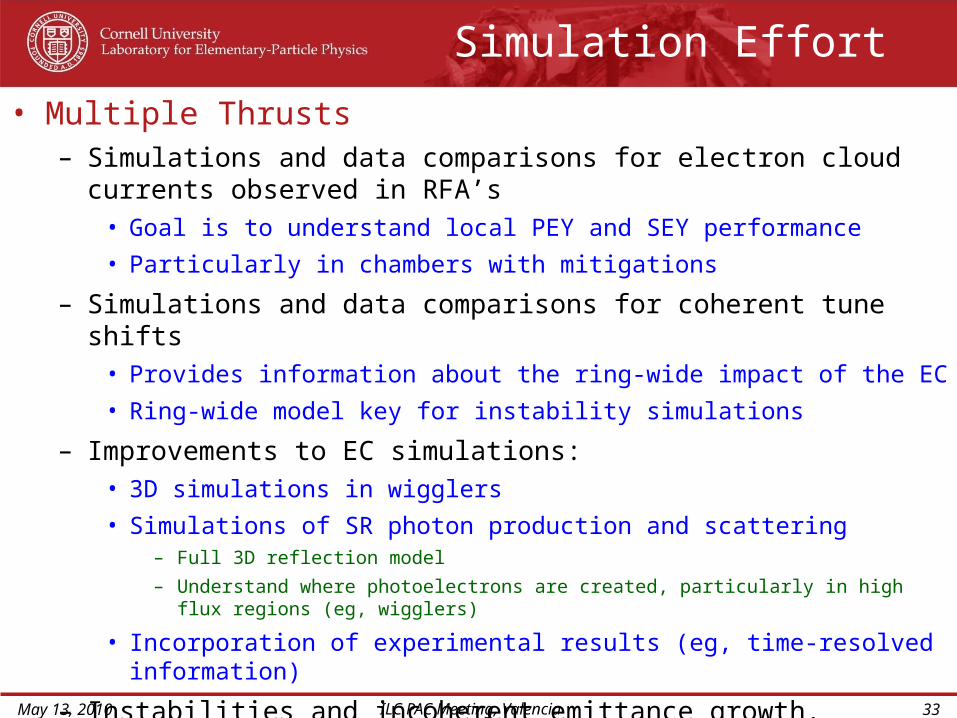
• Multiple Thrusts– Simulations and data comparisons for electron cloud currents observed
in RFA’s • Goal is to understand local PEY and SEY performance
• Particularly in chambers with mitigations
– Simulations and data comparisons for coherent tune shifts • Provides information about the ring-wide impact of the EC
• Ring-wide model key for instability simulations
– Improvements to EC simulations: • 3D simulations in wigglers
• Simulations of SR photon production and scattering– Full 3D reflection model
– Understand where photoelectrons are created, particularly in high flux regions (eg, wigglers)
• Incorporation of experimental results (eg, time-resolved information)
– Instabilities and incoherent emittance growth.
• Will only be able to touch on a few examplesMay 13, 2010 ILC PAC Meeting, Valencia 33
34
Coherent Tune Shifts
• At CESRTA, we have made measurements of bunch-by-bunch coherent tune shifts along bunch trains, over a wide range of beam energies, emittances, bunch currents, bunch spacings, and train lengths, for both positrons and electrons.
• These measurements have been done by exciting coherent oscillations of whole trains using a single-turn pinger, by observing the tune of self-excited bunches using the Dimtel feedback system diagnostics, and by exciting individual bunches using a fast kicker.
• We have compared the tune measurements with predictions from two electron cloud (EC) simulation programs: POSINST and ECLOUD. We include drifts and dipoles only, so far.
• A range of data were compared with simulations to determine 6 EC model parameters: peak SEY, photon reflectivity, quantum efficiency, rediffused yield, elastic yield, peak secondary energy.
May 13, 2010 ILC PAC Meeting, Valencia G. Dugan
35
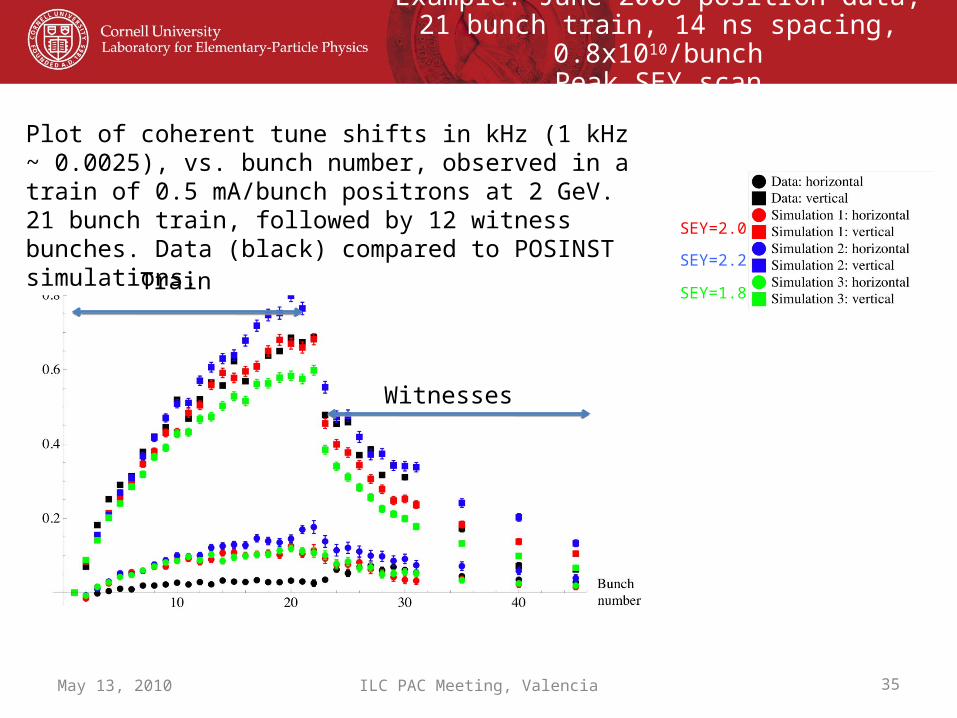
Example: June 2008 positron data, 21 bunch train, 14 ns spacing, 0.8x10¹⁰/bunch
Peak SEY scan
May 13, 2010 ILC PAC Meeting, Valencia
Plot of coherent tune shifts in kHz (1 kHz ~ 0.0025), vs. bunch number, observed in a train of 0.5 mA/bunch positrons at 2 GeV. 21 bunch train, followed by 12 witness bunches. Data (black) compared to POSINST simulations. SEY=2.0
SEY=1.8
SEY=2.2
Train
Witnesses
36May 13, 2010 ILC PAC Meeting, Valencia
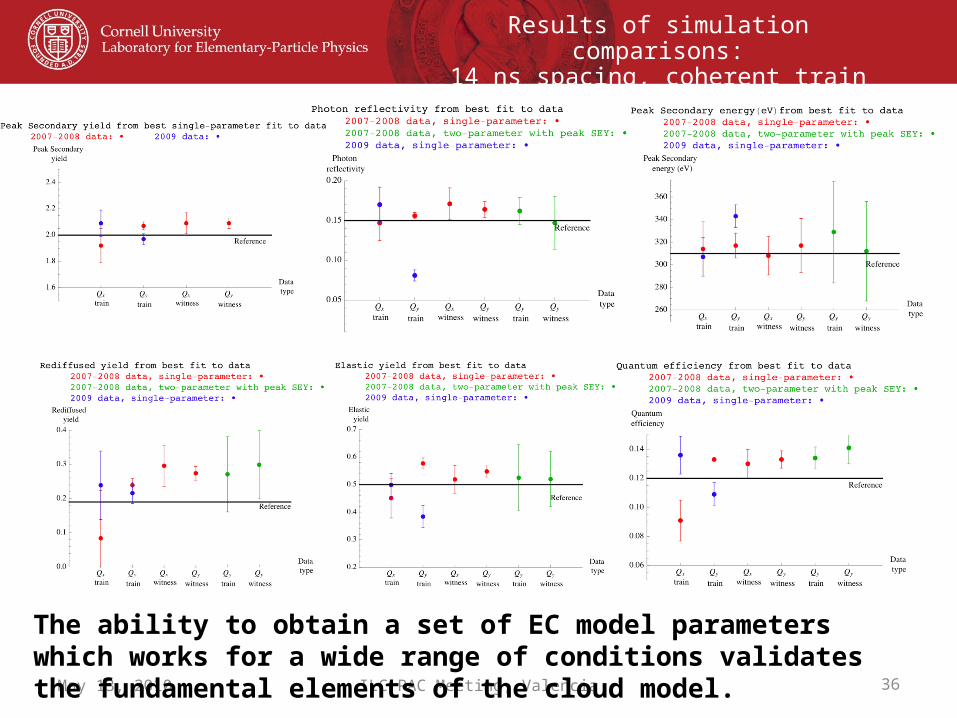
Results of simulation comparisons:14 ns spacing, coherent train motion
The ability to obtain a set of EC model parameters which works for a wide range of conditions validates the fundamental elements of the cloud model.
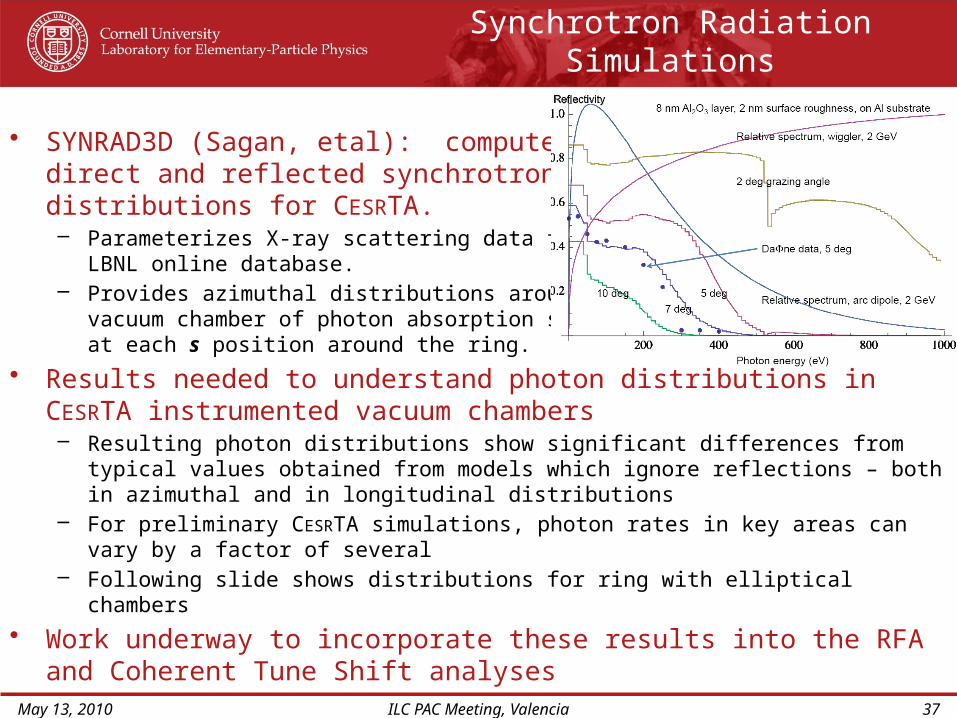
Synchrotron Radiation Simulations
• SYNRAD3D (Sagan, etal): computes the direct and reflected synchrotron radiation distributions for CESRTA. – Parameterizes X-ray scattering data from the
LBNL online database.– Provides azimuthal distributions around the
vacuum chamber of photon absorption sites at each s position around the ring.
• Results needed to understand photon distributions in CESRTA instrumented vacuum chambers– Resulting photon distributions show significant differences from typical values obtained
from models which ignore reflections – both in azimuthal and in longitudinal distributions– For preliminary CESRTA simulations, photon rates in key areas can vary by a factor of
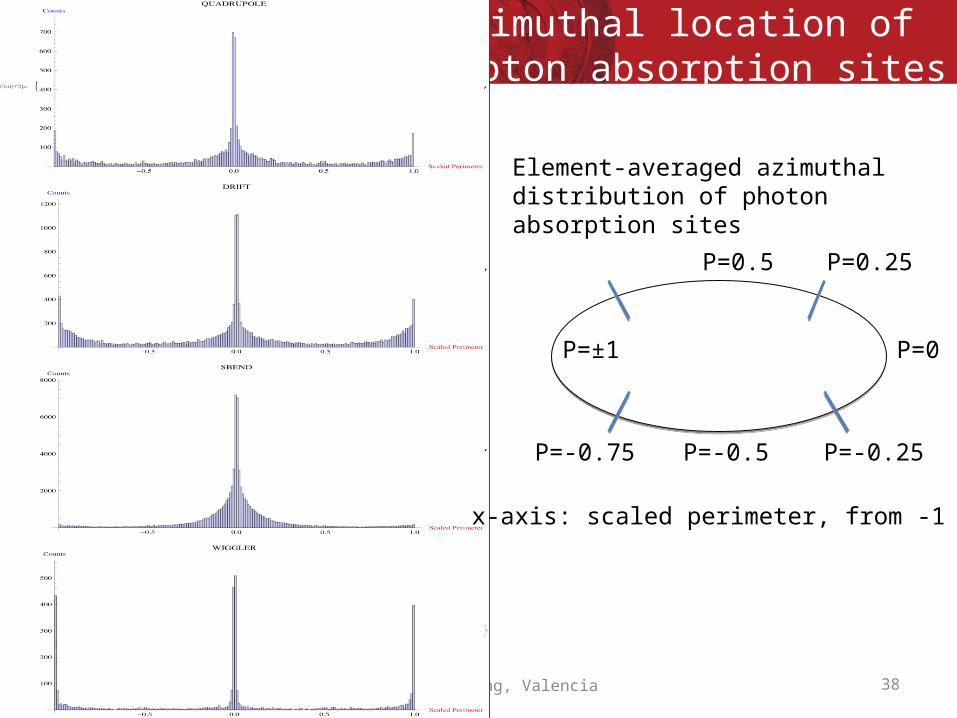
several– Following slide shows distributions for ring with elliptical chambers
• Work underway to incorporate these results into the RFA and Coherent Tune Shift analyses
May 13, 2010 ILC PAC Meeting, Valencia 37
38May 13, 2010 ILC PAC Meeting, Valencia
Azimuthal location of photon absorption sites
Element-averaged azimuthal distribution of photon absorption sites
x-axis: scaled perimeter, from -1 to 1
P=0
P=0.5
P=-0.5
P=±1
P=0.25
P=-0.75 P=-0.25
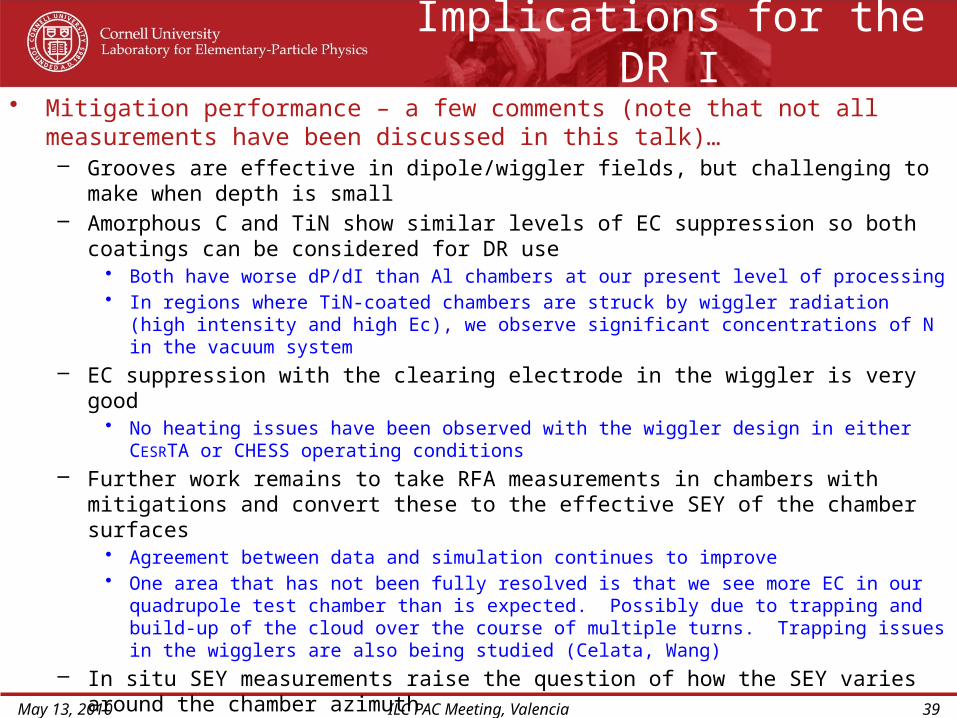
Implications for the DR I• Mitigation performance – a few comments (note that not all measurements have
been discussed in this talk)…– Grooves are effective in dipole/wiggler fields, but challenging to make when depth is small– Amorphous C and TiN show similar levels of EC suppression so both coatings can be
considered for DR use• Both have worse dP/dI than Al chambers at our present level of processing• In regions where TiN-coated chambers are struck by wiggler radiation (high intensity and high Ec),
we observe significant concentrations of N in the vacuum system– EC suppression with the clearing electrode in the wiggler is very good
• No heating issues have been observed with the wiggler design in either CESRTA or CHESS operating conditions
– Further work remains to take RFA measurements in chambers with mitigations and convert these to the effective SEY of the chamber surfaces
• Agreement between data and simulation continues to improve• One area that has not been fully resolved is that we see more EC in our quadrupole test chamber
than is expected. Possibly due to trapping and build-up of the cloud over the course of multiple turns. Trapping issues in the wigglers are also being studied (Celata, Wang)
– In situ SEY measurements raise the question of how the SEY varies around the chamber azimuth
– First measurements in NEG chamber are underway• Also want to test new NEG formulations (lower activation temperature) being proposed for DR use
– Quadrupole chamber measurements continue (new quad chamber with TiN coating)
May 13, 2010 ILC PAC Meeting, Valencia 39
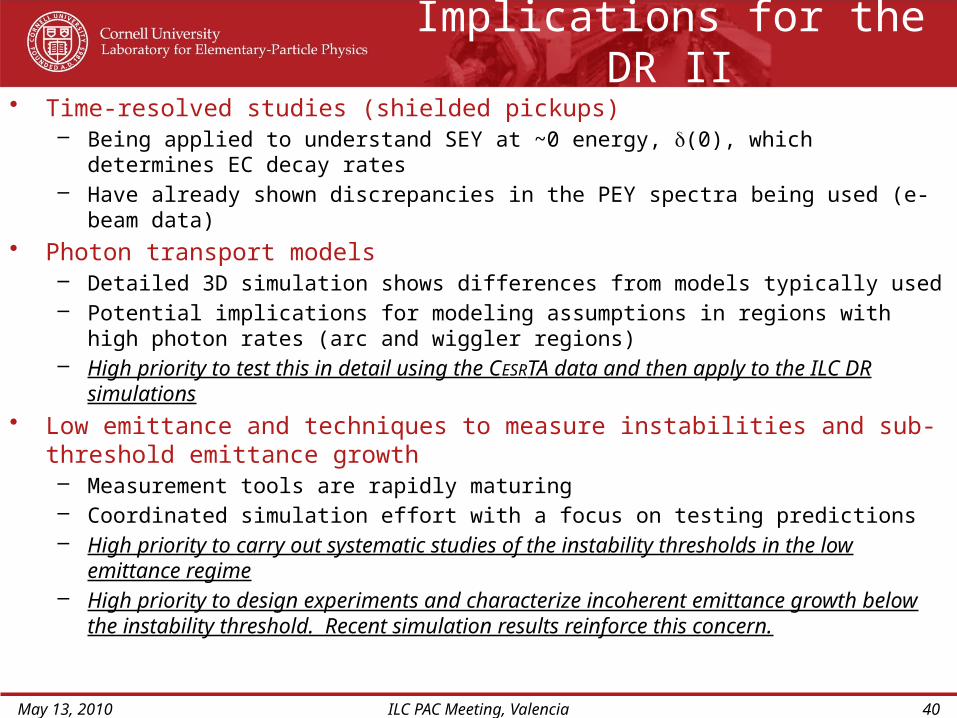
Implications for the DR II• Time-resolved studies (shielded pickups)
– Being applied to understand SEY at ~0 energy, d(0), which determines EC decay rates– Have already shown discrepancies in the PEY spectra being used (e- beam data)
• Photon transport models– Detailed 3D simulation shows differences from models typically used– Potential implications for modeling assumptions in regions with high photon rates (arc and
wiggler regions) – High priority to test this in detail using the CESRTA data and then apply to the ILC DR
simulations• Low emittance and techniques to measure instabilities and sub-threshold emittance
growth– Measurement tools are rapidly maturing– Coordinated simulation effort with a focus on testing predictions– High priority to carry out systematic studies of the instability thresholds in the low emittance
regime– High priority to design experiments and characterize incoherent emittance growth below the
instability threshold. Recent simulation results reinforce this concern.
May 13, 2010 ILC PAC Meeting, Valencia 40
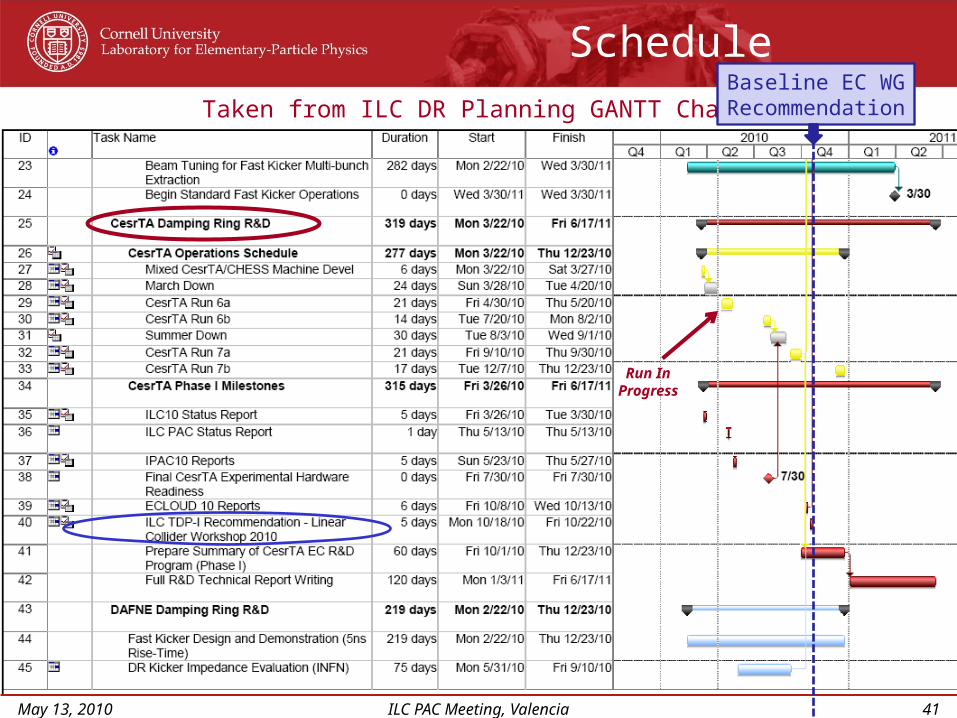
Schedule
May 13, 2010 ILC PAC Meeting, Valencia 41
Taken from ILC DR Planning GANTT ChartBaseline EC WGRecommendation
Run InProgress
May 13, 2010 ILC PAC Meeting, Valencia 42
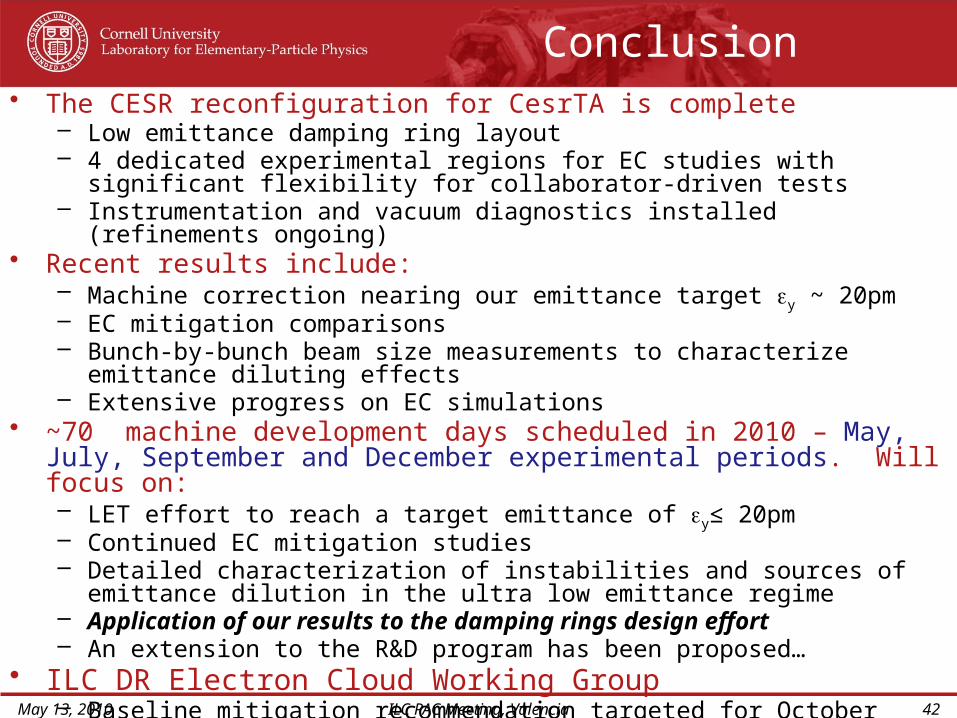
Conclusion• The CESR reconfiguration for CesrTA is complete
– Low emittance damping ring layout– 4 dedicated experimental regions for EC studies with significant flexibility for
collaborator-driven tests– Instrumentation and vacuum diagnostics installed (refinements ongoing)
• Recent results include:– Machine correction nearing our emittance target ey ~ 20pm– EC mitigation comparisons – Bunch-by-bunch beam size measurements to characterize emittance diluting
effects– Extensive progress on EC simulations
• ~70 machine development days scheduled in 2010 – May, July, September and December experimental periods. Will focus on:– LET effort to reach a target emittance of ey≤ 20pm– Continued EC mitigation studies– Detailed characterization of instabilities and sources of emittance dilution in the
ultra low emittance regime– Application of our results to the damping rings design effort– An extension to the R&D program has been proposed…
• ILC DR Electron Cloud Working Group– Baseline mitigation recommendation targeted for October 2010
The End
Thank you for your attention!
May 13, 2010 ILC PAC Meeting, Valencia 43
• Extra Slides begin here
May 13, 2010 ILC PAC Meeting, Valencia 44
0 50 100 150 200 250 300 3500
2
4
6
8
10
12x 10
12
Time (sp)
e (
m-3
)
3km Ring
=0.9=1.0=1.1=1.2=1.3=1.4
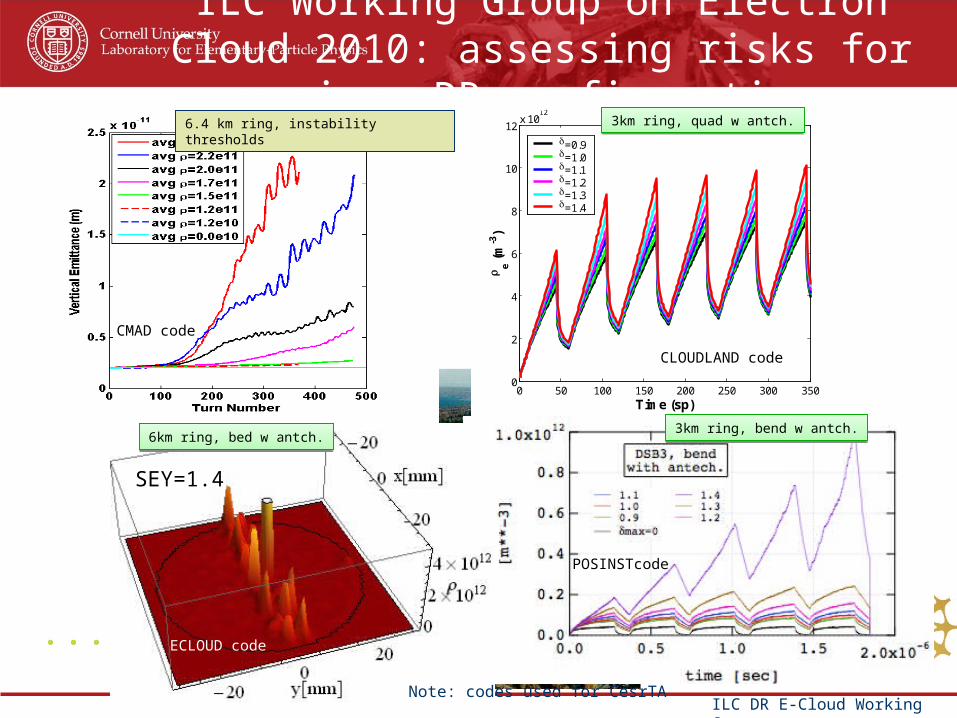
ILC Working Group on Electron Cloud 2010: assessing risks for various DR configurations
3km ring, bend w antch.3km ring, bend w antch.
3km ring, quad w antch.3km ring, quad w antch.6.4 km ring, instability thresholds
SEY=1.4
6km ring, bed w antch.6km ring, bed w antch.
CMAD code
CLOUDLAND code
POSINSTcode
ECLOUD code
Note: codes used for CesrTAILC DR E-Cloud Working Group
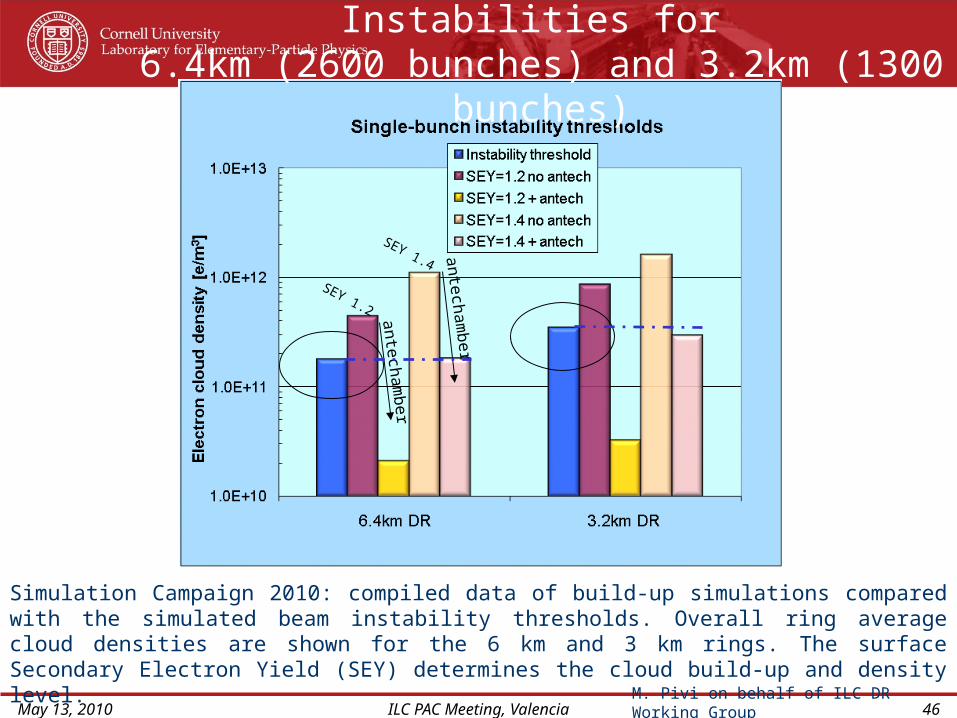
Compare Thresholds for EC Instabilities for 6.4km (2600 bunches) and 3.2km (1300 bunches)
antechamber
SEY 1.2
SEY 1.4 antechamber
Simulation Campaign 2010: compiled data of build-up simulations compared with the simulated beam instability thresholds. Overall ring average cloud densities are shown for the 6 km and 3 km rings. The surface Secondary Electron Yield (SEY) determines the cloud build-up and density level.
M. Pivi on behalf of ILC DR Working GroupMay 13, 2010 46ILC PAC Meeting, Valencia