Embed Size (px)
Citation preview

Phylodynamics of vampire bat-transmitted rabies in Argentina
C. TORRES#*,†, C. LEMA#‡, F. GURY DOHMEN§, F. BELTRAN§, L. NOVARO¶, S. RUSSO¶, M. C. FREIRE‡, A. VELASCO-VILLA**, V. A. MBAYED*,†, and D. M. CISTERNA‡
*Cátedra de Virología, Facultad de Farmacia y Bioquímica, Universidad de Buenos Aires, Junin 956, 4° piso, Ciudad Autónoma de Buenos Aires C1113AAD, Argentina
†CONICET, Av. Rivadavia 1917, Ciudad Autónoma de Buenos Aires C1033AAJ, Argentina
‡Servicio de Neurovirosis, Instituto Nacional de Enfermedades Infecciosas, Administración Nacional de Laboratorios e Institutos de Salud (ANLIS) “Dr. Carlos G. Malbrán,” Av.Velez Sarsfield 563, Ciudad Autónoma de Buenos Aires C1282AFF, Argentina
§Instituto de Zoonosis “Dr. Luis Pasteur”, Av Díaz Vélez 4821 Ciudad Autónoma de Buenos Aires C1405DCD, Argentina
¶DILAB, SENASA, Av. Paseo Colon 367, Ciudad Autónoma de Buenos Aires C1063ACD, Argentina
**Centers for Disease Control and Prevention, 1600 Clifton Rd, Atlanta, Georgia 30333, USA
# These authors contributed equally to this work.
Abstract
Common vampire bat populations distributed from Mexico to Argentina are important rabies
reservoir hosts in Latin America. The aim of this work was to analyse the population structure of
the rabies virus (RABV) variants associated with vampire bats in the Americas and to study their
phylodynamic pattern within Argentina. The phylogenetic analysis based on all available vampire
bat-related N gene sequences showed both a geographical and a temporal structure. The two
largest groups of RABV variants from Argentina were isolated from northwestern Argentina and
from the central western zone of northeastern Argentina, corresponding to livestock areas with
different climatic, topographic and biogeographical conditions, which determined their
dissemination and evolutionary patterns. In addition, multiple introductions of the infection into
Argentina, possibly from Brazil, were detected. The phylodynamic analysis suggests that RABV
transmission dynamics is characterized by initial epizootic waves followed by local enzootic
cycles with variable persistence. Anthropogenic interventions in the ecosystem should be assessed
taking into account not only the environmental impact but also the potential risk of disease
Correspondence: Daniel M. Cisterna, Fax: +54 11 43025064 (ext 213); ; Email: [email protected].
CT, CL, VAM and DMC designed the research. CT and CL performed the experiments. CT, CL, VAM and DMC analysed the data. FGD, FB, LN, SR, MCF, AVV contributed with reagents and analysis tools. CT, CL, AVV, VAM and DMC wrote the study.
Data accessibilityNucleoprotein gene sequences reported in this work have been deposited in GenBank under the Accession nos.: KF864233-KF864415 (complete N gene), KF864416-KF864459 (partial N gene; Table S1 and Table S2, Supporting information). Input files (XML and alignments), phylogenetic trees and sampling locations are included as online Supporting information.
HHS Public AccessAuthor manuscriptMol Ecol. Author manuscript; available in PMC 2016 May 18.
Published in final edited form as:Mol Ecol. 2014 May ; 23(9): 2340–2352. doi:10.1111/mec.12728.
Author M
anuscriptA
uthor Manuscript
Author M
anuscriptA
uthor Manuscript
spreading through dissemination of current RABV lineages or the emergence of novel ones
associated with vampire bats.
Keywords
Argentina; phylodynamics; phylogeography; rabies virus; vampire bats
Introduction
The rabies virus (RABV), the prototype species of the genus Lyssavirus, family
Rhabdoviridae, is the aetiological agent of most fatal infections of the central nervous
system of mammals, including humans (Dietzgen et al. 2011). Rabid reservoir hosts transmit
disease mainly by bite while other susceptible mammals are most of the times transmission
dead ends. RABV circulation is maintained through terrestrial and aerial cycles, associated
with different species within the orders Carnivora and Chiroptera. The vampire bat,
distributed from Mexico to Argentina, is an important rabies reservoir host in the region.
There are several vampire bat-transmitted RABV antigenic variants and genetic lineages that
have been defined by immunological and molecular methods (Diaz et al. 1994; Ito et al. 2001). Because of its higher cost-effectiveness, antigenic typing with a reduced panel of
eight monoclonal antibodies has been the tool of choice in Latin American countries for
decades (Diaz et al. 1994). This approach identifies more than three antigenic variants
(AgV) specifically associated with vampire bats. AgV3 has been the most widely spread
throughout the Americas, while AgV5, AgV8 and AgV11 and other RABV presenting novel
antigenic patterns, yet associated with vampire bats, have a limited distribution in some
countries of the Americas (Velasco-Villa et al. 2006).
In the North of Argentina, rabies associated with the haematophagous bat Desmodus rotundus is enzootic in cattle (paralytic rabies; Delpietro & Russo 1996). Sporadic cases
may also occur in humans, with the most recent ones reported in 1997 and 2001 (Larghi &
Delpietro 2004). Beyond the important economic impact on the livestock industry attributed
to vampire bat attacks and rabies disease, rabies in vampire bats should be considered as a
major public health threat for its growing impact on human beings (Schneider et al. 2009).
Although many investigations have studied the molecular epidemiological characteristics of
bat-associated rabies, a comprehensive analysis about the population structure and the
spatio-temporal dissemination dynamics of the vampire bat-transmitted RABV is still
lacking for several countries of the Americas.
The aim of this work was to analyse the population structure of vampire bat-transmitted
rabies in America and to study the phylodynamic pattern of the variants found in Argentina.
TORRES et al. Page 2
Mol Ecol. Author manuscript; available in PMC 2016 May 18.
Author M
anuscriptA
uthor Manuscript
Author M
anuscriptA
uthor Manuscript
Methods
Samples
A total of 357 brain samples were collected from different species, mainly from cattle and
horses between 1991 and 2009, from the Argentinean National Rabies Network. Sampling
included vampire bats (n = 4) and human (n = 2) cases. RABV was detected mainly by
direct immunofluorescence and by mouse inoculation test (Koprowski 1996). Later, RABV
isolates were sent to two National Reference Laboratories for antigenic characterization
(DILACOT, SENASA or Instituto de Zoonosis ‘Dr Luis Pasteur’). Rabies isolates were
characterized as antigenic variant 3 (AgV3) using a panel of eight monoclonal antibodies
directed against the viral nucleoprotein kindly provided by the Centers for Disease Control
and Prevention (Atlanta, GA, USA; Delpietro et al. 1997).
RT–PCR amplification and sequencing of rabies viruses
Viral RNA was extracted from rabies isolates using TRI-zol® (Invitrogen, Carlsbad, CA,
USA) according to the manufacturer's instructions. Reverse transcription and PCR
amplification of the complete nucleoprotein gene were carried out using 001-921B and 550F
and 304 primers as described previously (Streicker et al. 2010). Amplicons were purified
using ExoSAP-IT® (USB Corporation). Sequencing was performed using an Applied
Biosystems 3730 DNA Analyzer. Successful sequencing was performed on 227 samples
(183 complete and 44 partial N gene; Table S1, Table S2, Fig. 2 and ‘SamplingSites.kml’,
Supporting information).
Phylogenetic analysis
Complete N sequences introduced in this work (n = 183) were analysed along with all
vampire bat-associated N sequences longer than 1250 bp available from GenBank up to 1
May 2013 (n = 607).
Sequences were aligned with CLUSTALX v2.1 (Larkin et al. 2007) and edited with BIOEDIT v7.0
(Hall 1999). Maximum-likelihood (ML) phylogenetic tree and bootstrap analysis (1000
replicates) were obtained using the RAXML software with rapid bootstrap algorithm
(Stamatakis 2006; Stamatakis et al. 2008) implemented in the CIPRES Science Gateway
server (Miller et al. 2010).
In addition, the 5′ end of the nucleoprotein gene (264 bp) was analysed. The data set
included sequences introduced in this work (n = 227) and all vampire bat-associated
sequences from GenBank up to 1 May 2013 (n = 1005). Analysis was performed as
described above.
Spatial and temporal structure
The spatial and temporal structure was studied for the complete N sequences data set and for
the NWA and NEA groups, using the Parsimony Score (PS) and the Association Index (AI)
statistics, estimated with the BATS v0.1 software (Parker et al. 2008).
TORRES et al. Page 3
Mol Ecol. Author manuscript; available in PMC 2016 May 18.
Author M
anuscriptA
uthor Manuscript
Author M
anuscriptA
uthor Manuscript
Two analyses were performed for the complete N sequences data set. On one hand, it was
analysed labelling tips according to the country of origin or the year of isolation (n
sequences = 790). On the other hand, only sequences with information about the state/
province or year of isolation (labelling by state/province or by year) were included (n
sequences = 547).
For both analyses, AI and PS statistics were computed for a null distribution with 1000
replicates (expected values) and for the posterior distribution of trees obtained from a
Bayesian analysis (observed values). This analysis was performed using an appropriate
substitution model (estimated with the JMODELTEST v2.1 software (Darriba et al. 2012),
according to the Akaike Information Criterion), the uncorrelated lognormal (UCLN)
molecular clock model (Drummond et al. 2006) and a constant population size implemented
in BEAST v1.8 (Drummond et al. 2012). Analyses were run using BEAGLE library (Suchard
& Rambaut 2009; Ayres et al. 2012) at the CIPRES Science Gateway server (Miller et al. 2010). Convergence was assessed by effective sample size (ESS) values higher than 200
using the TRACER v1.5 software (Rambaut et al. 2013), and 10% of the sampling was
discarded as burn-in.
In addition, the spatial and temporal structure was also studied for the NWA and NEA
groups. Data sets were analysed labelling tips according to the province of origin or the year
of isolation. For both analyses, the posterior distribution of trees used as input for BATS was
obtained from the phylodynamic analyses.
BATS analysis for temporal structure allow us to evaluate the association among phylogeny
and year of isolation in NWA and NEA data sets (i.e. how samples from different years of
isolation are distributed in the phylogeny) but do not allow us to study whether the temporal
signal is adequate for phylodynamic studies (i.e. how informative the years of isolation are
to calibrate the phylodynamic analysis).
Thus, to study the temporal signal of NWA and NEA data sets, a previously described
strategy was used (Faria et al. 2012). Briefly, strict molecular clock models including and
excluding temporal information (dated versus contemporaneous tips) were compared
through Bayes factor using the marginal-likelihood values estimated by the path sampling
and stepping stone methods (Baele et al. 2012).
Phylodynamic analysis
Sequences of Argentinean samples belonging to the two main groups described by the
phylogenetic analysis were used in Bayesian coalescent analyses to study the spatio-
temporal dynamics along with the substitution rate and the time to the most recent common
ancestors (tMRCAs) for the different RABV lineages found in Argentina. Only sequences
with complete sampling information (Department-Province and month-year) were included,
and sequences from samples associated with documented or presumptive imported cases for
each region were excluded (Table S1, Supporting information).
Analyses were carried out using an appropriate substitution model estimated with the
JMODELTEST v2.1 software, according to the Akaike Information Criterion, the uncorrelated
TORRES et al. Page 4
Mol Ecol. Author manuscript; available in PMC 2016 May 18.
Author M
anuscriptA
uthor Manuscript
Author M
anuscriptA
uthor Manuscript
lognormal (UCLN) molecular clock model and the GMRF Bayesian Skyride coalescent
model (Minin et al. 2008) implemented in the BEAST v1.8 software package. A spatial
diffusion process was modelled on time-measured genealogies over continuous sampling
locations (geographical coordinates). Different diffusion models were tested: Homogenous
Brownian, Cauchy and Gamma distributions (Lemey et al. 2010).
Convergence was assessed by effective sample size (ESS) values higher than 200 using the
TRACER v1.5 software, and 10% of the sampling was discarded as burn-in. The uncertainty in
parameter estimates was evaluated in the 95% highest posterior density (HPD95%) interval.
The diffusion model that best fits to the data was selected through Bayes factor, using the
marginal-likelihood values estimated by the path sampling and stepping stone methods.
Visualizations of the selected diffusion processes were generated with the SPREAD v1.0
software (Bielejec et al. 2011).
In addition, to study the relation among the Ne x τ (Ne: effective population size; τ:
generation time) as an approximation to the effective number of infections (median values
for each year), the mean dispersal rates and rabies cases in cattle, a Pearson correlation test
was performed using the GRAPHPAD INSTAT software v3.1 (San Diego California USA,
www.graphpad.com).
Sensitivity analysis
In spite of no changes in surveillance strategy were documented or epidemiologically linked
cases were not processed, the distribution of sequences over the study period was not
uniform. Thus, to determine whether results obtained with NEA data set could be influenced
by a possible biased sampling, two analyses were performed. On one hand, to study a
possible bias related to oversampling in some years, the median number of sequences per
year was calculated (resulting 5.5 sequences per year). Based on that, the data set was
randomly subsampled to obtain five sequences per year (the final data set contained 54
sequences), and analysis was carried out as previously described for the complete NEA data
set.
On the other hand, to study a possible bias related to oversampling for hypothetical linked
cases, data set was randomly subsampled to obtain only one sequence per department per
year (the final data set contained 77 sequences), and analysis was carried out as previously
described for the complete NEA data set.
Rabies cases in cattle
The number of rabies cases was obtained from Departamento de Zoonosis y Vectores.
Ministerio de Salud de la Nación and from Dirección Nacional de Sanidad Animal,
SENASA Argentina.
Results
Phylogenetic analysis
Phylogenetic and statistical analyses on all available vampire bat-related complete N gene
sequences showed both a geographical and a temporal structure (P < 0.001 for the AI and PS
TORRES et al. Page 5
Mol Ecol. Author manuscript; available in PMC 2016 May 18.
Author M
anuscriptA
uthor Manuscript
Author M
anuscriptA
uthor Manuscript
statistics; Fig. 1 and Table S3, Supporting information). Basal diversification events
separated some sequences from Mexico (described as AgV8) and from Peru and Colombia
(with an unavailable AgV pattern) from AgV3 sequences.
Two major groups were observed among AgV3 sequences. One of them comprised
sequences from Central America and the north of South America, including sequences
described as AgV11 from Mexico (Velasco-Villa et al. 2006). The other group was formed
exclusively by South American sequences and presented six main clusters and subclusters
named with roman numbers and letters, respectively, for description purposes only (Fig. 1).
Sequences from Argentina were located in four groups with highly supported bootstrap
values (Fig. 1). The two largest groups were formed by sequences from northwestern (NWA,
group V) and northeastern (NEA, within group VI) Argentina (Figs 2, S1 and S2,
Supporting information). It is worth noting that three samples from NWA were found into
the NEA group (Fig. S2, Supporting information). Although these samples were detected in
NWA, animals presumably acquired RABV infection in the NEA region, considering
documented cattle movements from the NEA to the NWA region (DNSA 2013a).
Furthermore, the NWA and NEA groups also showed a geographical and temporal structure
when sequences were labelled according to its province of origin or the year of isolation (P < 0.001 for AI and PS statistics for both regions; Table S3, Supporting information).
In addition, some sequences from the Province of Misiones, which is part of the NEA
region, bordering Paraguay and Brazil, were located in groups formed by sequences from
Brazil [group II, Fig. S3(a), Supporting information], and from Brazil, Peru and Uruguay
[group Ib, Fig. S3(b), Supporting information]. It is remarkable that group II included a high
number of AgV3 sequences isolated from nonvampire bats.
Equivalent phylogenetic groups of sequences from Argentina were also observed in the
analysis of partial N sequences, although lower bootstrap values were obtained (Fig. S4–S7,
Supporting information). The lower phylogenetic resolution was also reflected in the loss of
monophyly of the NEA group, owing to the introduction of sequences from Colombia and
Ecuador. However, this analysis allowed observing crossing patterns of the RABV other than
those evidenced in the analysis of the complete N gene finding sequences from NWA in the
NEA group but also sequences from NEA in the NWA group.
Phylodynamic analysis
First, to evaluate whether the temporal signal of sequences of the largest groups from
Argentina (NWA and NEA) was adequate for calibrating phylodynamic studies, the
marginal-likelihood estimates for models including and excluding sampling dates were
compared through Bayes factor. For both data sets, BF favoured the model that incorporates
sampling dates, suggesting a temporal signal enough for calibrating phylodynamic analysis.
For NWA data set, it was obtained a log BF = 7.9 (for Path Sampling method) and a log BF
= 8.5 (for Stepping Stone method), indicating a strong evidence against the model that
excludes sampling dates (Kass & Raftery 1995). While for the NEA data set, BF resulted in
TORRES et al. Page 6
Mol Ecol. Author manuscript; available in PMC 2016 May 18.
Author M
anuscriptA
uthor Manuscript
Author M
anuscriptA
uthor Manuscript
log BF = 159.9 (for Path Sampling method) and log BF = 158.9 (for stepping stone method),
strongly favouring the model that incorporates sampling dates.
Thus, the phylodynamic pattern of the NWA and NEA groups from Argentina was studied
using complete nucleoprotein gene sequences under a Bayesian approach that considers the
phylogenetic dispersion in time and space.
Homogeneous and relaxed diffusion models were tested for the NWA and NEA groups. For
both cases, Gamma distribution was selected by the Bayes factor test as the best fitting
model (Table S4, Supporting information).
Under this model, both groups showed similar median tMRCA dated in 1987 (HPD95% =
1959–1998) for NWA and in 1992 (HPD95% = 1991–1994) for NEA. Similarly, substitution
rates were estimated as 1.9 × 10⁻⁴ substitutions/site/year (s/s/y) (HPD95% = 3.1 × 10⁻⁵ –
3.9 × 10⁻⁴) for NWA, and as 2.6 × 10⁻⁴ s/s/y (HPD95% = 1.9 × 10⁻⁴ – 3.4 × 10⁻⁴) for NEA.
Demographic reconstructions showed that viral diversity in NWA has remained almost
constant since the tMRCA (Fig. 3). In contrast, in the NEA region, the effective number of
infections has increased slightly since 1992, with a maximum in ~1998–2001, which seems
to continue up to the present (Fig. 4). In addition, this increase in NEA was possibly
characterized by a strong diversification process occurring soon after the tMRCA, preceded
by an increase in the dispersal rate, suggesting that this diversification occurred
simultaneously in different sites of NEA (Fig. 4 and ‘NEA_diffusion_process.kml’,
Supporting information). The most recent cases would have derived from two main
diversification foci located in the north of the NEA region (mainly in the Departments Pirané
and Patiño, Province of Formosa) and in the south of the NEA region (mainly in the
Department Laishi, Province of Formosa and in the Province of Chaco; Fig. 4, Fig. 5 and
‘NWA_diffusion_process.kml’, Supporting information).
In addition, the NWA group showed a median dispersal rate of 21.0 km/year (HPD95% =
0.9–40.6) with a maximum in 2007 (Fig. 3). Conversely, a median rate of 37.1 km/year
(HPD95% = 28.9–44.1) was observed for the NEA group, which showed fluctuating
patterns of high and low dispersal rates with marked increases in 1996, 2003 and 2007 (Fig.
4). It is worth noting that the NWA group showed higher uncertainty in all estimations
performed, evidenced by wider HPD intervals.
Furthermore, increments in RABV dispersal rates preceded or accompanied the increments
in the number of rabies cases in cattle that occurred in ~2008 in NWA, and in ~1996–1997
and ~2006–2008 in NEA. By visual inspection of the rate-through-time plot superimposed
to the number of rabies cases in cattle for each region (Figs 3 and 4), a tendency of a positive
correlation has been observed between dispersal rates and rabies cases in cattle but not for
the effective number of infection and cases, particularly for NEA region.
However, the correlation analysis carried out to study the relation among these estimates and
cases showed no significant correlation for neither the dispersal rates and cases nor the
effective number of infections and cases for NWA and NEA regions (all P > 0.05).
TORRES et al. Page 7
Mol Ecol. Author manuscript; available in PMC 2016 May 18.
Author M
anuscriptA
uthor Manuscript
Author M
anuscriptA
uthor Manuscript

Finally, to study the influence of a possible biased sampling, sensitivity analyses were
performed on the NEA data set, showing consistent results with those obtained with the
complete NEA data set, suggesting that results are not biased for an uneven distribution per
year o per department (Table S5, Table S6, Fig. S8 and Fig. S9, Supporting information).
Discussion
Understanding the epidemiological characteristics and dissemination trends of vampire bat-
transmitted rabies allows evaluating the existing control and prevention strategies as well as
proposing alternative measures to block spreading and further impact on human health, and
reducing the economic losses in the cattle raising industry.
In this study, a comprehensive phylogenetic analysis was carried out to study the
diversification of Argentinean isolates in the context of all available vampire bat sequences
and to identify groups for analysing the spatio-temporal diffusion process of the RABV in
Argentina. Viral population showed a geographical and a temporal structure that is
consistent with the nonmigratory behaviour of the common vampire bat (Desmodus rotundus), suggesting that the dispersion of the RABV lineages would be better explained by
the ecology of the bat populations, as previously proposed (Velasco-Villa et al. 2006;
Barbosa et al. 2008; Kobayashi et al. 2008; Streicker et al. 2010; Condori-Condori et al. 2013).
The north of Argentina is considered an endemic area for RABV transmitted by vampire
bats. This area is located north of parallel 29th S and east of meridian 66th W, encompassing
a surface of approximately 550,000 km2, with different climatic, topographic and
biogeographical conditions where livestock is raised under different ecosystems (Delpietro
& Russo 1996), altogether affecting vampire bats ecology. Traditionally, the central western
zone of northeastern Argentina (NEA) is characterized by an extensive plain with densely
populated livestock areas (more than three cattle heads per km2) almost not interrupted for
hundreds of kilometres. Conversely, the eastern zone of NEA and northwestern Argentina
(NWA) present livestock areas with dense population, frequently interrupted for areas with
low population (Delpietro & Russo 1996). In highly populated areas, vampire bats feed
almost exclusively on cattle; their population reaches higher densities and lives in roosts
mainly located in human buildings. Meanwhile, in low populated areas, the natural living
conditions of vampire bats are less altered, and bats feed on diverse species and live in
natural roosts in significantly smaller colonies (Delpietro et al. 1992).
It has been postulated that the transmission dynamics of RABV associated with vampire bats
might be explained by two alternative hypotheses. One considers it as a migrating epizooty
and the other as a long-term locally maintained enzootic disease (Fornes et al. 1974;
Delpietro & Russo 1996; Streicker et al. 2012). In Argentina, the viral spreading has been
more associated with the hypothesis of epizootics, with interepidemic periods with no rabies
for at least 4–5 years (during which the vampire population would increase after an initial
high mortality; Fornes et al. 1974; Delpietro & Nader 1989; Delpietro & Russo 1996).
However, rabies cases in cattle were continuously registered throughout the period here
studied, since 1991 to 2009 (with the exception of 1998), demonstrating that enzootic cycles
TORRES et al. Page 8
Mol Ecol. Author manuscript; available in PMC 2016 May 18.
Author M
anuscriptA
uthor Manuscript
Author M
anuscriptA
uthor Manuscript
are present in South America (Brazil would also participate in the regional circulation of
RABV in Argentina). Nonetheless, the hypotheses of a migrating epizooty and an enzootic
disease would not be mutually exclusive, indicating that initial epizootic waves might be
followed by local enzootic cycles with variable persistence, as previously suggested
(Streicker et al. 2012).
The two main groups of viruses found in this study were associated with rabies foci in NWA
and NEA. Even though the first reports of paralytic rabies in Argentina date from 1928
(Quiroga et al. 1931), the currently circulating lineages might be associated with more recent
diversification events, according to the median ancestral times estimated for the NWA and
NEA groups (1987 and 1992, respectively). Different bottlenecks in transmission related to
the epizootic waves with high bat mortality or culling could explain the extinction of the first
lineages introduced in the country, probably through the North (López Adaros et al. 1969),
which precludes tracing back the disease to its more ancient origin. Recent evidence for this
process might be observed in the diversification of sequences from the highly endemic NEA
region, where current RABV variants would be related to the diversification of two major
lineages in the NEA region, whereas many other lineages detected in older samples might
have not been widely transmitted.
The ecosystem characteristics and the livestock density could be some of the most important
factors that might influence the RABV dispersal rate. This rate was estimated as ~21 and
~37 km/year for NWA and NEA, respectively. A previous epidemiological study had
estimated a 40 km/year rate for the NEA region (Fornes et al. 1974). A slower dispersion in
NWA would correlate with the presence of geographical barriers that make livestock raising
more difficult and less cost-effective, while a faster dispersion in NEA would occur due to
the presence of uninterrupted grasslands favouring denser livestock areas.
Relation among the number of rabies cases in cattle, the dispersal rate and the effective
number of infections (inferred from the viral diversity) was also studied. Particularly for
NEA region, despite the number of cases tended to correlate better with dispersal rates than
with the effective number of infections, none significant correlation was found.
This might indicate that the viral dispersion allowed the infection of new susceptible hosts
but maintaining the viral diversity (as equilibrium among the appearance of new variants and
elimination of transient lineages). Particularly, the higher number of rabies cases in cattle
(DNSA 2013a) and the higher dispersal rates estimated for the recent times in NWA might
be traced to the application of novel government policies and economic conditions that have
encouraged agricultural production and cattle raising in this region (DNSA 2013b).
In the NEA, increments in RABV dispersal rates preceded or accompanied the high number
of rabies cases in cattle occurred in ~1997 and ~2006 (Fig. 4), defined as epidemic periods
(Ministerio de Salud de la Nación 2007). However, population dynamics only showed a
slight increase in the effective number of infections during ~1995–1997. This pattern was
also observed in the terrestrial rabies in North America (Biek et al. 2007; Lemey et al. 2010).
TORRES et al. Page 9
Mol Ecol. Author manuscript; available in PMC 2016 May 18.
Author M
anuscriptA
uthor Manuscript
Author M
anuscriptA
uthor Manuscript
It is worth noting that different factors, such as variation in offspring number, population
structure and changing generation times (that can vary over the course of an epidemic), may
influence the estimation of Ne x τ and possibly also explain the lack of correlation with
cases (Charlesworth 2009; Frost & Volz 2010; Ho & Shapiro 2011).
Fluctuations in RABV dispersal rates agree with earlier observations made by Delpietro &
Russo (1996), who described a rabies epizootic in the region as merged rabies outbreaks
from several contiguous geographical areas.
Temporal distribution of sampling could influence the inference of population dynamics
(Stack et al. 2010); then, it is worth noting that results presented in this study would not be
biased for an uneven distribution of samples per year or per department, as suggested by
sensitivity analyses performed.
On the other hand, in addition to the main phylogenetic groups described, other sequences
from Argentina that belong to the eastern zone of the NEA region grouped with different
clusters of foreign samples. This likely reflects the interrupted nature of the ecosystem in
this Argentinean region and the potential interconnection between distant outbreaks
suggesting multiple rabies introductions in the country, possibly from Brazil. It is worth
noting that one of these groups included a high number of AgV3 sequences isolated from
Artibeus spp bats and multiple other bat species (Fig. S3, Supporting information),
suggesting that they could have been disease spillovers from vampire bats into other bat
species (Shoji et al. 2004).
It is remarkable how useful modern phylogenetic/phylogeographic tools are to discern
potential sources of disease introduction, given that the predicted imported rabies cases from
NWA to NEA (and vice versa) inferred by our study were corroborated in some cases with
actual records of the National Health Service and Food Quality (SENASA). These are
powerful tools also to define dissemination trends of infectious diseases and even more to
further characterize the dynamics of rabies virus in different hosts (Streicker et al. 2010;
Faria et al. 2013).
Finally, a continuous surveillance strategy in different reservoir host species, including bats,
associated with dissimilar ecosystems along with the implementation of ecological models is
needed to better understand the complex evolutionary, transmission and diversification
patterns of RABVs.
Supplementary Material
Refer to Web version on PubMed Central for supplementary material.
Acknowledgements
We thank Dr. Philippe Lemey for kindly providing a code for the analysis of dispersal rates and Dr. Gustavo Palacios for comments that greatly improved the manuscript. We are very grateful to Bernardo Cosentino and Mariano Ramos from Dirección de Epidemiología y Análisis de Riesgo, SENASA, and to the staff of Dirección Nacional de Sanidad Animal (DNSA) for providing valuable information. We also thank three anonymous reviewers for their helpful comments.
TORRES et al. Page 10
Mol Ecol. Author manuscript; available in PMC 2016 May 18.
Author M
anuscriptA
uthor Manuscript
Author M
anuscriptA
uthor Manuscript
This study was supported by INEI-ANLIS ‘Dr. Carlos G. Malbrán, the Centers for Disease Control and Prevention, Atlanta GA, USA; and the American Fellows Program, Partners of the Americas of the USA Government’.
References
Ayres DL, Darling A, Zwickl DJ, et al. BEAGLE: an application programming interface and high-performance computing library for statistical phylogenetics. Systematic Biology. 2012; 61:170–173. [PubMed: 21963610]
Baele G, Lemey P, Bedford T, et al. Improving the accuracy of demographic and molecular clock model comparison while accommodating phylogenetic uncertainty. Molecular Biology and Evolution. 2012; 29:2157–2167. [PubMed: 22403239]
Barbosa TF, Medeiros DB, Travassos da Rosa ES, et al. Molecular epidemiology of rabies virus isolated from different sources during a bat-transmitted human outbreak occurring in Augusto Correa municipality, Brazilian Amazon. Virology. 2008; 370:228–236. [PubMed: 17996263]
Biek R, Henderson JC, Waller LA, Rupprecht CE, Real LA. A high-resolution genetic signature of demographic and spatial expansion in epizootic rabies virus. Proceedings of the National Academy of Sciences of the United States of America. 2007; 104:7993–7998. [PubMed: 17470818]
Bielejec F, Rambaut A, Suchard MA, Lemey P. SPREAD: spatial phylogenetic reconstruction of evolutionary dynamics. Bioinformatics. 2011; 27:2910–2912. [PubMed: 21911333]
Charlesworth B. Fundamental concepts in genetics: effective population size and patterns of molecular evolution and variation. Nature Reviews Genetics. 2009; 10:195–205.
Condori-Condori RE, Streicker DG, Cabezas-Sanchez C, Velasco-Villa A. Enzootic and epizootic rabies associated with vampire bats, Peru. Emerging Infectious Diseases. 2013; 19:1463–1469.
Darriba D, Taboada GL, Doallo R, Posada D. JMODELTEST 2: more models, new heuristics and parallel computing. Nature Methods. 2012; 9:772. [PubMed: 22847109]
Delpietro HA, Nader AJ. Rabies of herbivores transmitted by vampire bats in north-eastern Argentina. Revue Scientifique et Technique - Office International des Épizooties. 1989; 8:177–198.
Delpietro HA, Russo RG. Ecological and epidemiologic aspects of the attacks by vampire bats and paralytic rabies in Argentina and analysis of the proposals carried out for their control. Revue Scientifique et Technique. 1996; 15:971–984. [PubMed: 9376648]
Delpietro HA, Marchevsky N, Simonetti E. Relative population densities and predation of the common vampire bat (Desmodus rotundus) in natural and cattle-raising areas in north-east Argentina. Preventive Veterinary Medicine. 1992; 14:13–20.
Delpietro HA, Gury-Dhomen F, Larghi OP, Mena-Segura C, Abramo L. Monoclonal antibody characterization of rabies virus strains isolated in the River Plate Basin. Zentralbl Veterinarmed B. 1997; 44:477–483. [PubMed: 9394612]
Diaz AM, Papo S, Rodriguez A, Smith JS. Antigenic analysis of rabies-virus isolates from Latin America and the Caribbean. Zentralbl Veterinarmed B. 1994; 41:153–160. [PubMed: 7801717]
Dietzgen, R.; Calisher, C.; Kurath, G.; Kuzmin, I.; Rodriguez, L. Family - Rhabdoviridae. Genus Lyssavirus.. In: King, A.; Lefkowitz, E.; Adams, M.; Carstens, E., editors. Virus Taxonomy: Ninth Report of the International Committee on Taxonomy of Viruses. Elsevier; London: 2011. p. 686-713.
Dirección Nacional de Sanidad Animal. Direccion de Control de Gestión y Programas Especiales. Dirección Nacional de Sanidad Animal, SENASA; Argentina: 2013a.
Dirección Nacional de Sanidad Animal. Dirección de Epidemiología y Análisis de Riesgo. Dirección Nacional de Sanidad Animal, SENASA; Argentina: 2013b.
Drummond AJ, Ho SY, Phillips MJ, Rambaut A. Relaxed phylogenetics and dating with confidence. PLoS Biology. 2006; 4:e88. [PubMed: 16683862]
Drummond AJ, Suchard MA, Xie D, Rambaut A. Bayesian phylogenetics with BEAUti and the BEAST 1.7. Molecular Biology and Evolution. 2012; 29:1969–1973. [PubMed: 22367748]
Faria NR, Hodges-Mameletzis I, Silva JC, et al. Phylogeo-graphical footprint of colonial history in the global dispersal of human immunodeficiency virus type 2 group A. Journal of General Virology. 2012; 93:889–899. [PubMed: 22190015]
TORRES et al. Page 11
Mol Ecol. Author manuscript; available in PMC 2016 May 18.
Author M
anuscriptA
uthor Manuscript
Author M
anuscriptA
uthor Manuscript
Faria NR, Suchard MA, Rambaut A, Streicker DG, Lemey P. Simultaneously reconstructing viral cross-species transmission history and identifying the underlying constraints. Philosophical Transactions of the Royal Society of London. Series B, Biological sciences. 2013; 368:20120196. [PubMed: 23382420]
Fornes A, Lord RD, Kuns ML, et al. Control of bovine rabies through vampire bat control. Journal of Wildlife Diseases. 1974; 10:310–316. [PubMed: 4436917]
Frost SD, Volz EM. Viral phylodynamics and the search for an ‘effective number of infections’. Philosophical Transactions of the Royal Society of London. Series B, Biological sciences. 2010; 365:1879–1890. [PubMed: 20478883]
Hall T. BioEdit: a user-friendly biological sequence alignment editor and analysis program for Windows 95/98/NT. Nucleic Acids Symposium Series. 1999; 41:95–98.
Ho SY, Shapiro B. Skyline-plot methods for estimating demographic history from nucleotide sequences. Molecular Ecology Resources. 2011; 11:423–434. [PubMed: 21481200]
Ito M, Arai YT, Itou T, et al. Genetic characterization and geographic distribution of rabies virus isolates in Brazil: identification of two reservoirs, dogs and vampire bats. Virology. 2001; 284:214–222. [PubMed: 11384221]
Kass RE, Raftery AE. Bayes factors. Journal of the American Statistical Association. 1995; 90:773–795.
Kobayashi Y, Sato G, Mochizuki N, et al. Molecular and geographic analyses of vampire bat-transmitted cattle rabies in central Brazil. BMC Veterinary Research. 2008; 4:44. [PubMed: 18983685]
Koprowski, H. The mouse inoculation test.. In: Merlin, F.; Kaplan, M.; Koprowski, H., editors. Laboratories Techniques in Rabies. World Health Organization; Geneva: 1996. p. 80-87.
Larghi, OP.; Delpietro, H. Casos de rabia humana transmitida por murciélagos, Argentina. Asociación Argentina de Zoonosis; Buenos Aires: 2004.
Larkin MA, Blackshields G, Brown NP, et al. Clustal W and Clustal X version 2.0. Bioinformatics. 2007; 23:2947–2948. [PubMed: 17846036]
Lemey P, Rambaut A, Welch JJ, Suchard MA. Phylogeography takes a relaxed random walk in continuous space and time. Molecular Biology and Evolution. 2010; 27:1877–1885. [PubMed: 20203288]
López Adaros, H.; Silva, M.; La Mata, M. Rabia paralítica en el norte argentino. Pan American Health Organization; Washington D.C.: 1969. p. 161-203.Seminario sobre Rabia para los Países de la Zona IV - Bolivia, Colombia, Ecuador y Perú. Lima, 6–11 de octubre
Miller, M.; Pfeiffer, W.; Schwartz, T. Creating the CIPRES Science Gateway for Inference of Large Phylogenetic Trees. Proceedings of the Gateway Computing Environments Workshop (GCE); New Orleans, LA.. 14 Nov. 2010; 2010. p. 1-8.
Minin VN, Bloomquist EW, Suchard MA. Smooth sky-ride through a rough skyline: Bayesian coalescent-based inference of population dynamics. Molecular Biology and Evolution. 2008; 25:1459–1471. [PubMed: 18408232]
Ministerio de Salud de la Nación. Departamento de Zoonosis y Vectores, Ministerio de Salud de la Nacion; Buenos Aires, Argentina: 2007.
Parker J, Rambaut A, Pybus OG. Correlating viral pheno-types with phylogeny: accounting for phylogenetic uncertainty. Infection, Genetics and Evolution. 2008; 8:239–246.
Quiroga SS, Acosta J, Rottgardt A, Masselin JN, Scasso R. Observaciones y estudios experimentales acerca del mal de caderas de los vacunos del norte de la provincia de Corrientes: su identidad con la rabia. Revista de Medicina Veterinaria. 1931; 13:191–223.
Rambaut, A.; Suchard, MA.; Xie, D.; Drummond, AJ. TRACER v1.5. 2013. Available from http://beast.bio.ed.ac.uk/software/ tracer/
Schneider MC, Romijn PC, Uieda W, et al. Rabies transmitted by vampire bats to humans: an emerging zoonotic disease in Latin America? Revista Panamericana de Salud Publica. 2009; 25:260–269. [PubMed: 19454154]
Shoji Y, Kobayashi Y, Sato G, et al. Genetic characterization of rabies viruses isolated from frugivorous bat (Artibeus spp.). Brazil. Journal of Veterinary Medical Science. 2004; 66:1271–1273. [PubMed: 15528863]
TORRES et al. Page 12
Mol Ecol. Author manuscript; available in PMC 2016 May 18.
Author M
anuscriptA
uthor Manuscript
Author M
anuscriptA
uthor Manuscript
Stack JC, Welch JD, Ferrari MJ, Shapiro BU, Grenfell BT. Protocols for sampling viral sequences to study epidemic dynamics. Journal of the Royal Society, Interface. 2010; 7:1119–1127.
Stamatakis A. RAxML-VI-HPC: maximum likelihood-based phylogenetic analyses with thousands of taxa and mixed models. Bioinformatics. 2006; 22:2688–2690. [PubMed: 16928733]
Stamatakis A, Hoover P, Rougemont J. A rapid bootstrap algorithm for the RAxML Web servers. Systematic Biology. 2008; 57:758–771. [PubMed: 18853362]
Streicker DG, Turmelle AS, Vonhof MJ, et al. Host phylogeny constrains cross-species emergence and establishment of rabies virus in bats. Science. 2010; 329:676–679. [PubMed: 20689015]
Streicker DG, Recuenco S, Valderrama W, et al. Ecological and anthropogenic drivers of rabies exposure in vampire bats: implications for transmission and control. Proceedings of the National Academy of Sciences of the United States of America. 2012; 279:3384–3392.
Suchard MA, Rambaut A. Many-core algorithms for statistical phylogenetics. Bioinformatics. 2009; 25:1370–1376. [PubMed: 19369496]
Velasco-Villa A, Orciari LA, Juarez-Islas V, et al. Molecular diversity of rabies viruses associated with bats in Mexico and other countries of the Americas. Journal of Clinical Micro-biology. 2006; 44:1697–1710.
TORRES et al. Page 13
Mol Ecol. Author manuscript; available in PMC 2016 May 18.
Author M
anuscriptA
uthor Manuscript
Author M
anuscriptA
uthor Manuscript

Fig. 1. Maximum-likelihood (ML) phylogenetic tree of complete N sequences of rabies virus
related to vampire bats. Bootstrap values higher than 50% are shown at nodes for relevant
groups. Individual sequences or groups of sequences containing isolates introduced in this
work are shown in bold. Groups containing isolates from Argentina are indicated with
coloured triangles and shown in Figs S1, S2 and S3, Supporting information (dotted lines).
State or province, country (abbreviated in uppercase) and year of isolation are indicated
TORRES et al. Page 14
Mol Ecol. Author manuscript; available in PMC 2016 May 18.
Author M
anuscriptA
uthor Manuscript
Author M
anuscriptA
uthor Manuscript
when available. ARG: Argentina, BRA: Brazil, COL: Colombia, ECU; Ecuador, ESa: El
Salvador, GUY: French Guyana, MEX: Mexico, PER: Peru, URU: Uruguay.
TORRES et al. Page 15
Mol Ecol. Author manuscript; available in PMC 2016 May 18.
Author M
anuscriptA
uthor Manuscript
Author M
anuscriptA
uthor Manuscript

Fig. 2. Sampling sites coloured according to the phylogenetic analysis.
TORRES et al. Page 16
Mol Ecol. Author manuscript; available in PMC 2016 May 18.
Author M
anuscriptA
uthor Manuscript
Author M
anuscriptA
uthor Manuscript
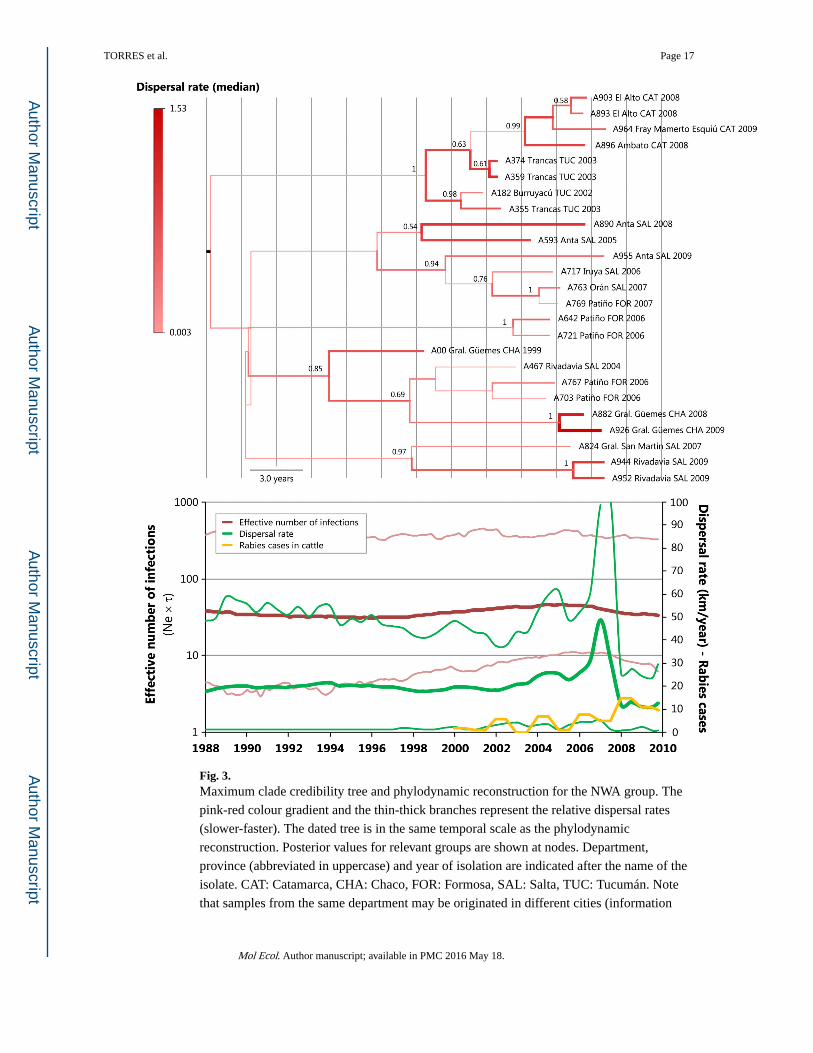
Fig. 3. Maximum clade credibility tree and phylodynamic reconstruction for the NWA group. The
pink-red colour gradient and the thin-thick branches represent the relative dispersal rates
(slower-faster). The dated tree is in the same temporal scale as the phylodynamic
reconstruction. Posterior values for relevant groups are shown at nodes. Department,
province (abbreviated in uppercase) and year of isolation are indicated after the name of the
isolate. CAT: Catamarca, CHA: Chaco, FOR: Formosa, SAL: Salta, TUC: Tucumán. Note
that samples from the same department may be originated in different cities (information
TORRES et al. Page 17
Mol Ecol. Author manuscript; available in PMC 2016 May 18.
Author M
anuscriptA
uthor Manuscript
Author M
anuscriptA
uthor Manuscript
available in Table S1, Supporting information). For the phylodynamic reconstruction, the
RABV dispersal rate (median and HPD80%) was superimposed on the viral demography
(median and HPD95%).
TORRES et al. Page 18
Mol Ecol. Author manuscript; available in PMC 2016 May 18.
Author M
anuscriptA
uthor Manuscript
Author M
anuscriptA
uthor Manuscript
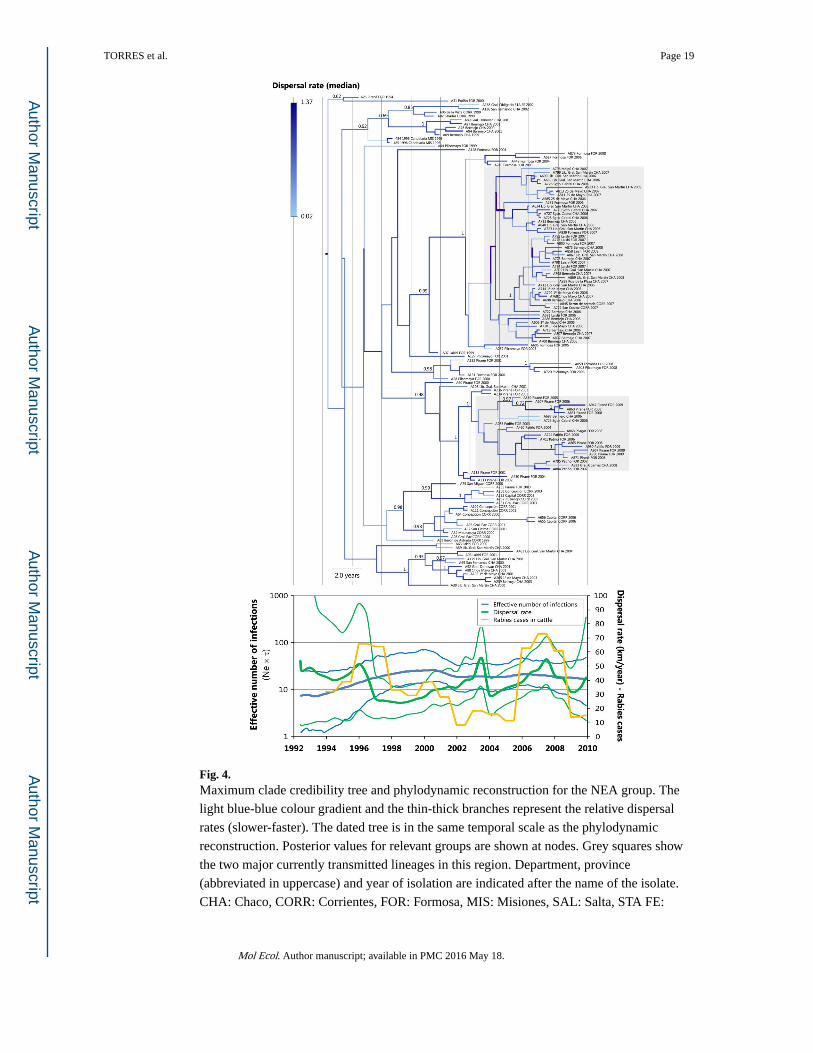
Fig. 4. Maximum clade credibility tree and phylodynamic reconstruction for the NEA group. The
light blue-blue colour gradient and the thin-thick branches represent the relative dispersal
rates (slower-faster). The dated tree is in the same temporal scale as the phylodynamic
reconstruction. Posterior values for relevant groups are shown at nodes. Grey squares show
the two major currently transmitted lineages in this region. Department, province
(abbreviated in uppercase) and year of isolation are indicated after the name of the isolate.
CHA: Chaco, CORR: Corrientes, FOR: Formosa, MIS: Misiones, SAL: Salta, STA FE:
TORRES et al. Page 19
Mol Ecol. Author manuscript; available in PMC 2016 May 18.
Author M
anuscriptA
uthor Manuscript
Author M
anuscriptA
uthor Manuscript
Santa Fe. Note that samples from the same department may be originated in different cities
(information available in Table S1, Supporting information). For the phylodynamic
reconstruction, the RABV dispersal rate (mean and HPD80%) was superimposed on the
viral demography (median and HPD95%).
TORRES et al. Page 20
Mol Ecol. Author manuscript; available in PMC 2016 May 18.
Author M
anuscriptA
uthor Manuscript
Author M
anuscriptA
uthor Manuscript
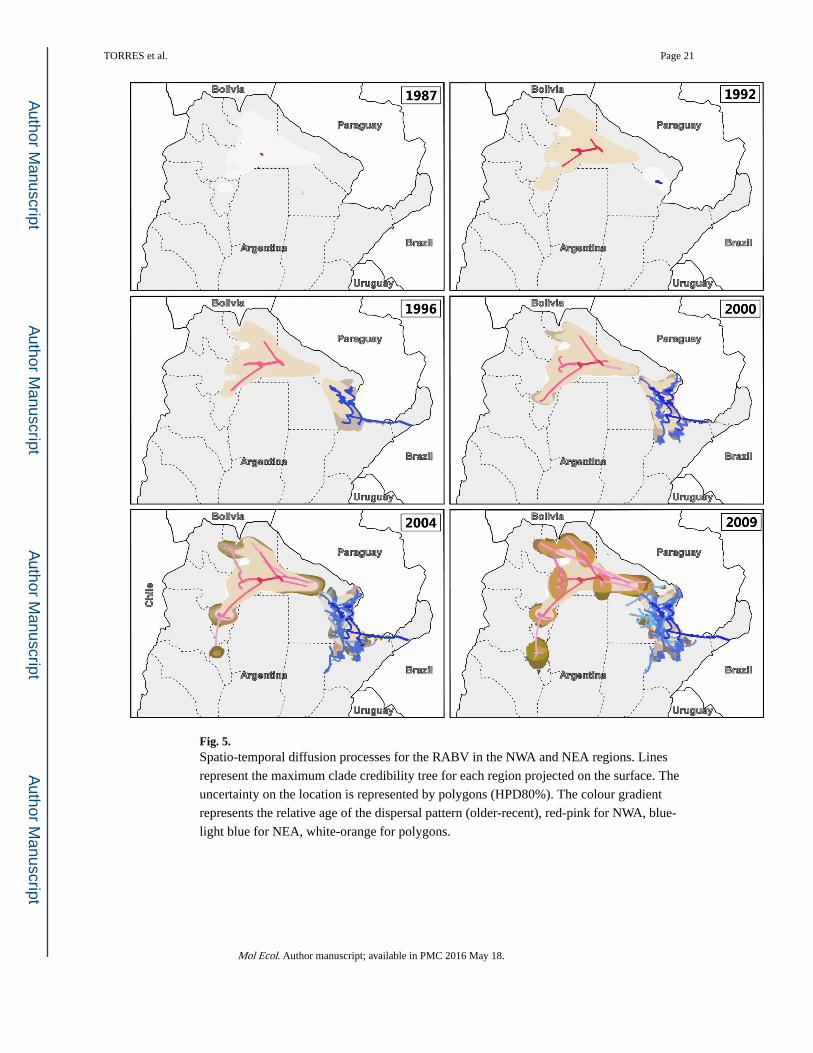
Fig. 5. Spatio-temporal diffusion processes for the RABV in the NWA and NEA regions. Lines
represent the maximum clade credibility tree for each region projected on the surface. The
uncertainty on the location is represented by polygons (HPD80%). The colour gradient
represents the relative age of the dispersal pattern (older-recent), red-pink for NWA, blue-
light blue for NEA, white-orange for polygons.
TORRES et al. Page 21
Mol Ecol. Author manuscript; available in PMC 2016 May 18.
Author M
anuscriptA
uthor Manuscript
Author M
anuscriptA
uthor Manuscript