Embed Size (px)
Citation preview

C H A P T E R 2
SIGNALS AND SIGNAL SPACE
EENG 3810/CSCE 3020
Instructor: Oluwayomi Adamo

Signals and Systems
• What is a signal?– A set of data or information e.g telephone or TV signal
• What is a System?– An entity that processes a set of signals (inputs) to yield
another set of signals (outputs)– Example: a system that estimates the position of a target
based on information from a radar– A system could be hardware (electrical, mechanical or
hydraulic) or software (algorithm)
• How do we quantify a signal that varies with time?• How do you device a measure V for the size of
human?– Assuming Cylinder with radius r: dhhrV
H)(
0
2
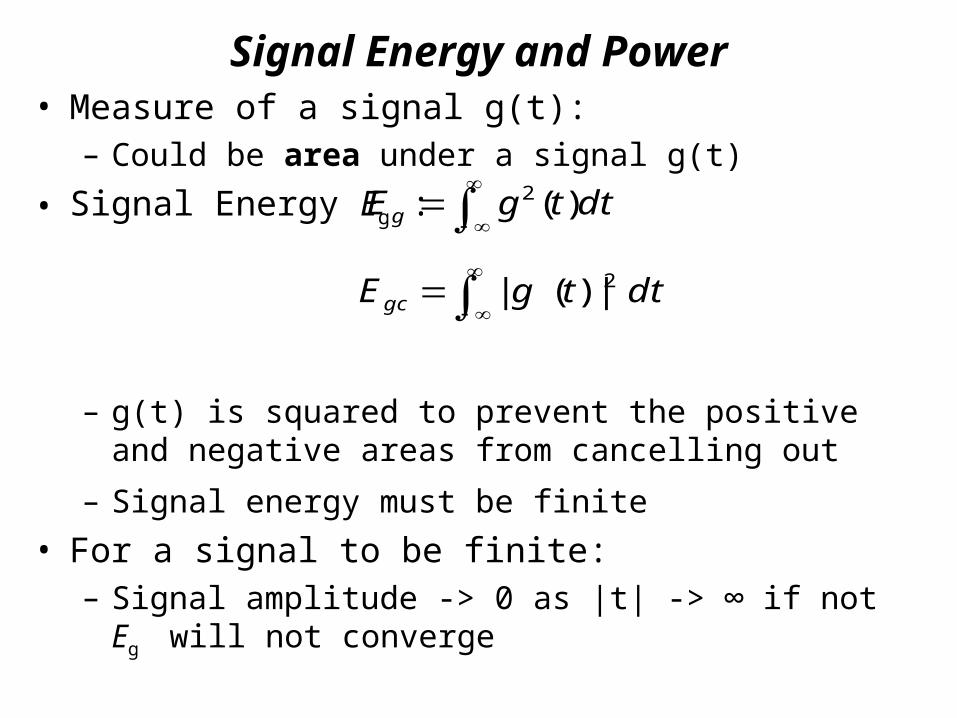
Signal Energy and Power• Measure of a signal g(t):
– Could be area under a signal g(t)
• Signal Energy Eg :
– g(t) is squared to prevent the positive and negative areas from cancelling out
– Signal energy must be finite
• For a signal to be finite: – Signal amplitude -> 0 as |t| -> ∞ if not Eg will not
converge
dttgEg )(2
dttgEgc2|)(|

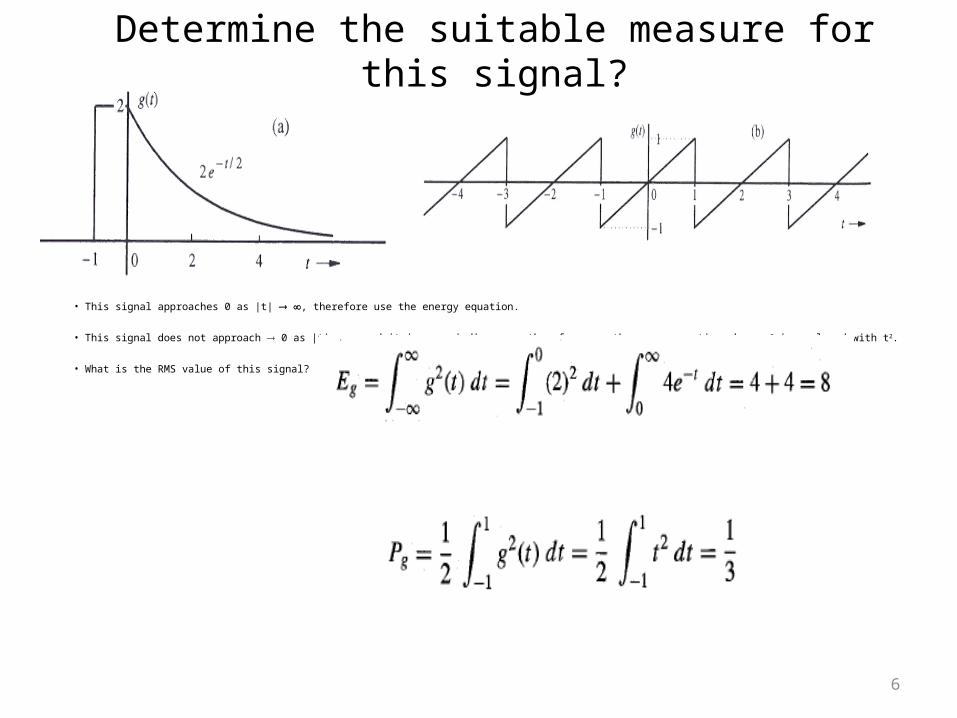
Figure 2.1 Examples of signals: (a) signal with finite energy;(b) signal with finite power.
•If Eg is not finite (infinite)-Average power Pg (mean squared) : Time average of energy (if it exists)
-RMS (root mean square) value of g(t) = -Pg exists if g(t) is periodic or has statistical regularities
dttgT
PT
Tt
g )(1
2
2
2lim
Signal Energy and Power
gP
Signal Energy and Power– Average may not exist if the above condition is not
satisfied e.g a ramp g(t) = t, energy or power does not exist
• Measure of signal strength and size– Signal energy and power - inherent characteristic
• Good indicator of signal quality– The signal to noise ratio (SNR) or ratio of the message
signal and noise signal power
• Standard unit of signal energy and power– Joule (J) and watt (W) respectively, – Logarithmic scales used to avoid zeros and decimal
points
– Signal with average power of P watts (10 log10P) dBw or (30+10.log10P) dbM
6
Determine the suitable measure for this signal?
• This signal approaches 0 as |t| , therefore use the energy equation.
• This signal does not approach 0 as |t| and it is a periodic wave, therefore use the power equation where g2 is replaced with t2.
• What is the RMS value of this signal?
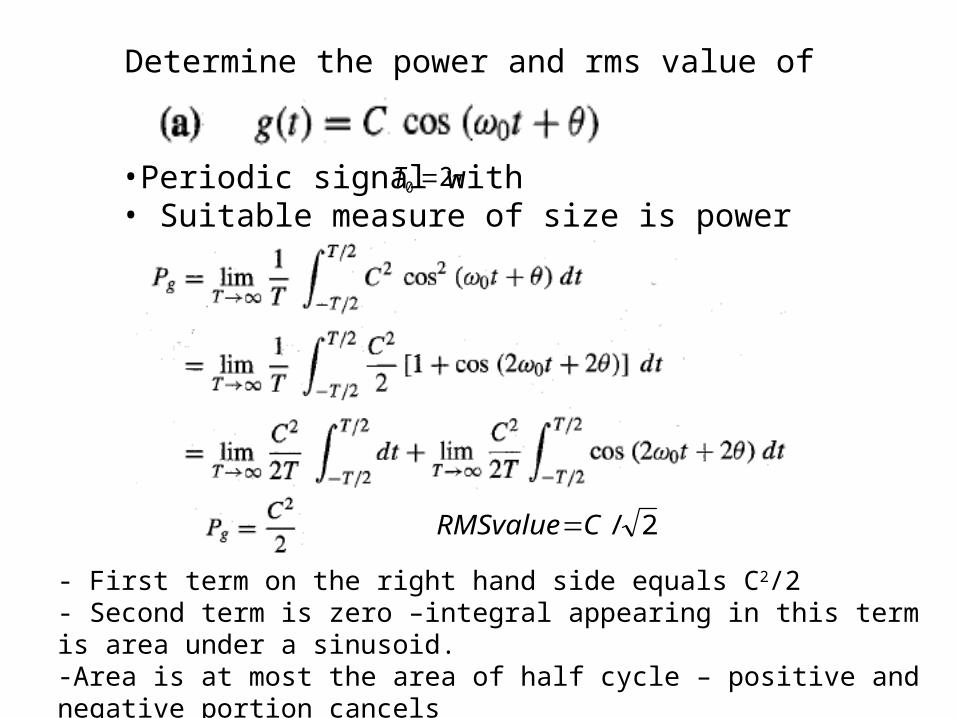
Determine the power and rms value of
•Periodic signal with• Suitable measure of size is power
20 T
- First term on the right hand side equals C2/2
- Second term is zero –integral appearing in this term is area under a sinusoid.-Area is at most the area of half cycle – positive and negative portion cancels-A sinusoid of amplitude C has a power of C2/2 regardless of angular frequency
2/CRMSvalue

Determine the power and rms value b) g (t) = C1 cos (1t + 1) + C2 cos (2t + 2) 1 ≠ 2
• This signal is the sum of two sinusoid signals.
• Therefore, use the power equation.
• Therefore, Pg = (C12 / 2) + (C2
2 / 2) This Can be generalized
9
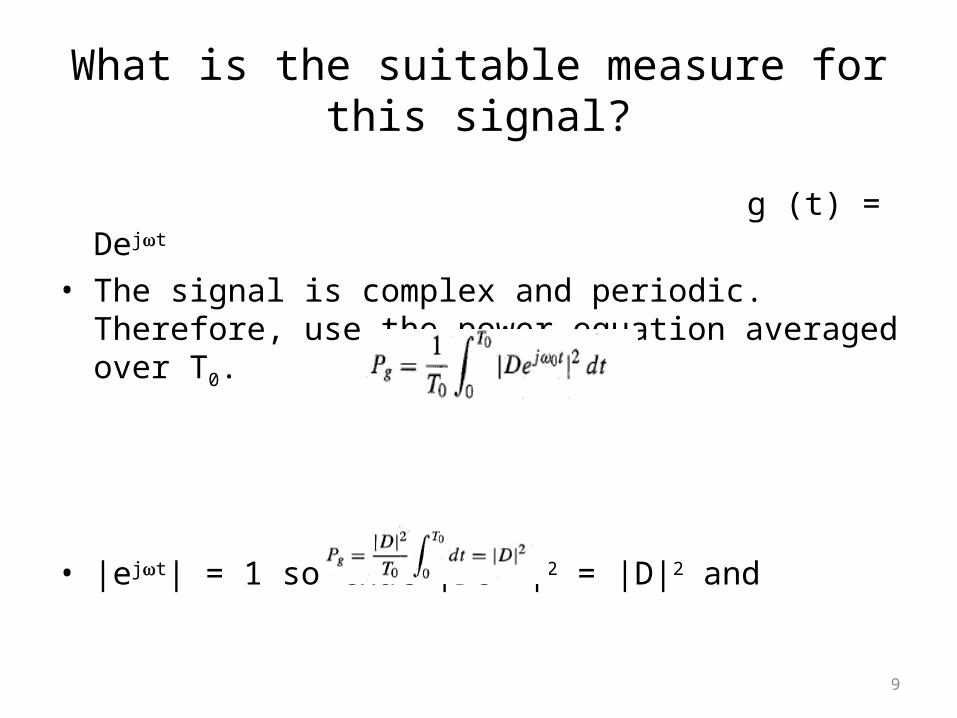
What is the suitable measure for this signal?
g (t) = Dejt
• The signal is complex and periodic. Therefore, use the power equation averaged over T0.
• |ejt| = 1 so that |Dejt|2 = |D|2 and

Classification of Signals – Continuous and Discrete time Signal
• Continuous time and discrete time signals• Analog and digital signals• Periodic and aperiodic signals• Deterministic and probabilistic signalsContinuous Time Signal: A signal that is specified for every
value of time t .eg audio and video recordings
Discrete Time Signal: A signal that is specified only at discrete points of t=nT e,g quarterly gross domestic product (GDP) or
stock market daily averages

Figure 2.3 (a) Continuous time and (b) discrete time signals.

Analog and Digital Signals• Is analog signal and continuous time signal the same? What of
discrete time signal and digital signal?
• What is Analog Signal?– A signal whose amplitude can have values in continuous range
(values can take on infinite (uncountable) values
• What is Digital Signal?– A signal whose amplitude can take only finite number of
values.
– For a signal to qualify for digital, the values don’t have to be restricted to two values.
– A digital signal whose values can take on M values is an M-ary signal
• Continuous and discrete time signal qualify a signal along the x-axis while Analog and digital signal qualify the signal in terms of the amplitude (y-axis)
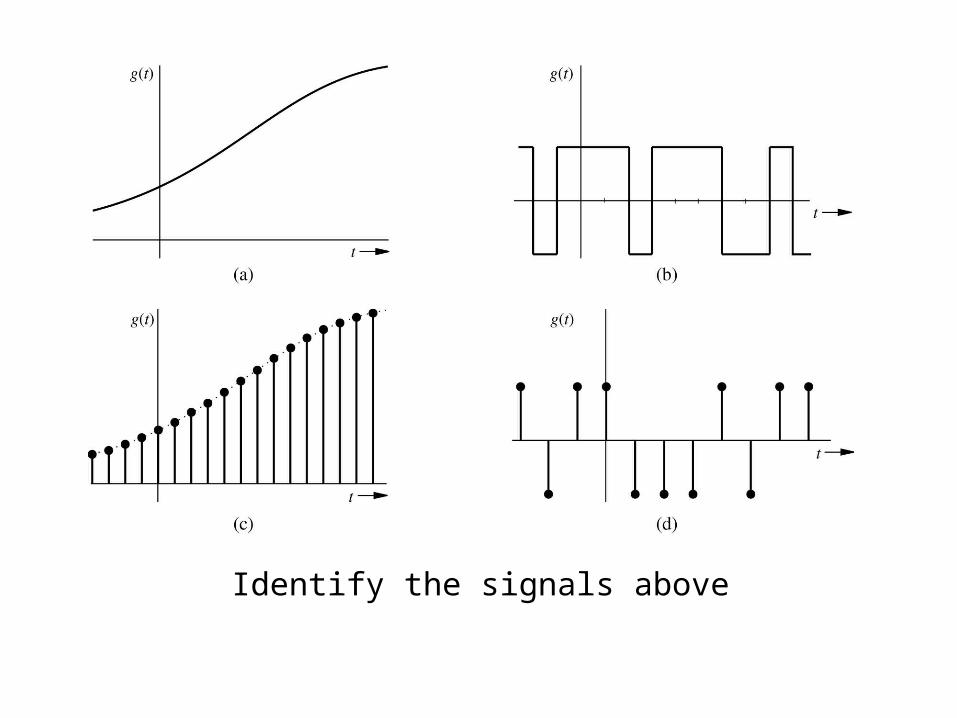
Identify the signals above
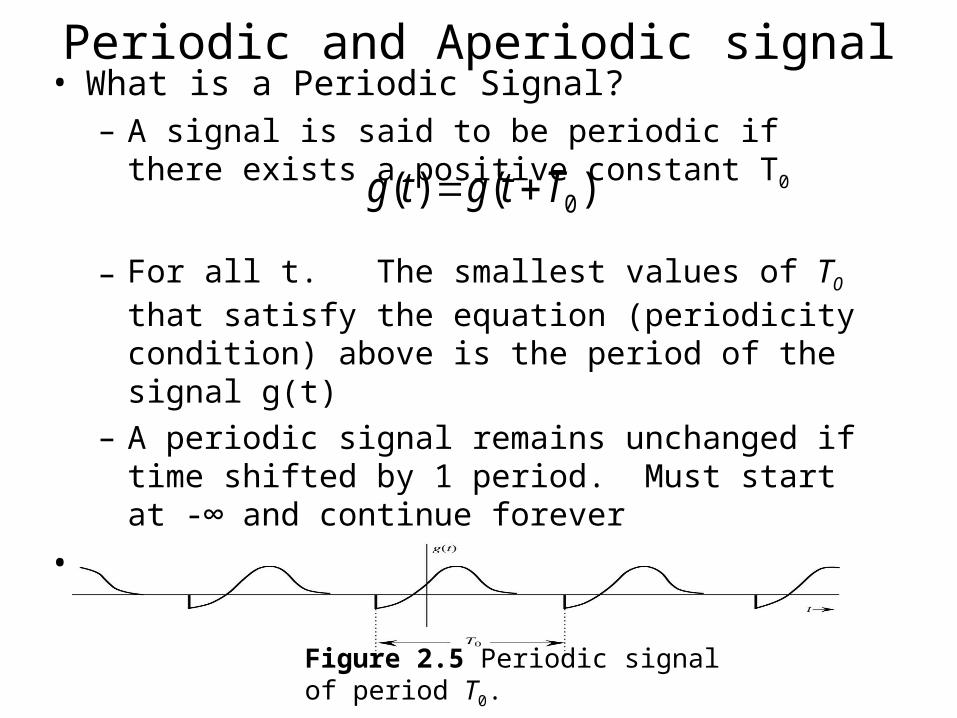
Periodic and Aperiodic signal• What is a Periodic Signal?
– A signal is said to be periodic if there exists a positive constant T0
– For all t. The smallest values of T0 that satisfy the equation (periodicity condition) above is the period of the signal g(t)
– A periodic signal remains unchanged if time shifted by 1 period. Must start at -∞ and continue forever
• What is an Aperiodic Signal?– A signal that is not periodic
)()( 0Ttgtg
Figure 2.5 Periodic signal of period T0.
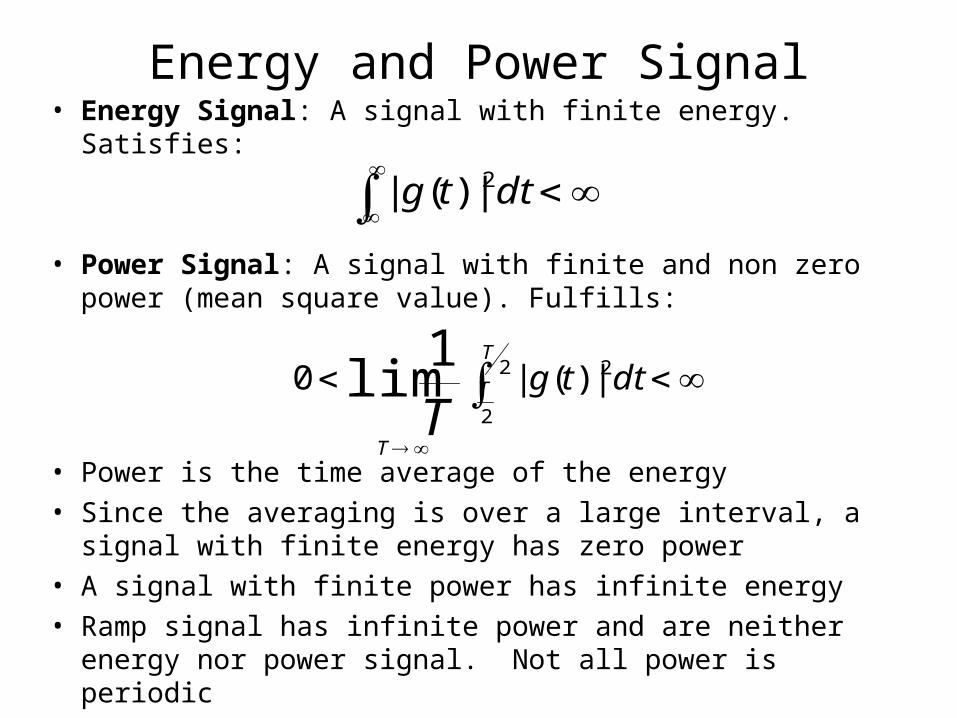
Energy and Power Signal• Energy Signal: A signal with finite energy. Satisfies:
• Power Signal: A signal with finite and non zero power (mean square value). Fulfills:
• Power is the time average of the energy
• Since the averaging is over a large interval, a signal with finite energy has zero power
• A signal with finite power has infinite energy
• Ramp signal has infinite power and are neither energy nor power signal. Not all power is periodic
dttg 2|)(|
dttgT
T
TT
2
2
2|)(|01
lim

Deterministic and Random Signal
• Deterministic Signal: A signal whose physical description (mathematical or graphical) is known.
• Random Signal: Signal known by only its probabilistic description such as mean value, mean squared value and distributions.
• All message signals are random signals for it to convey any information.

Useful Signal Operators• Time Shifting, Time Scaling, and Time inversion
• If T is positive, the shift is to the right (delayed)• If T is negative, the shift is to the left (advanced)
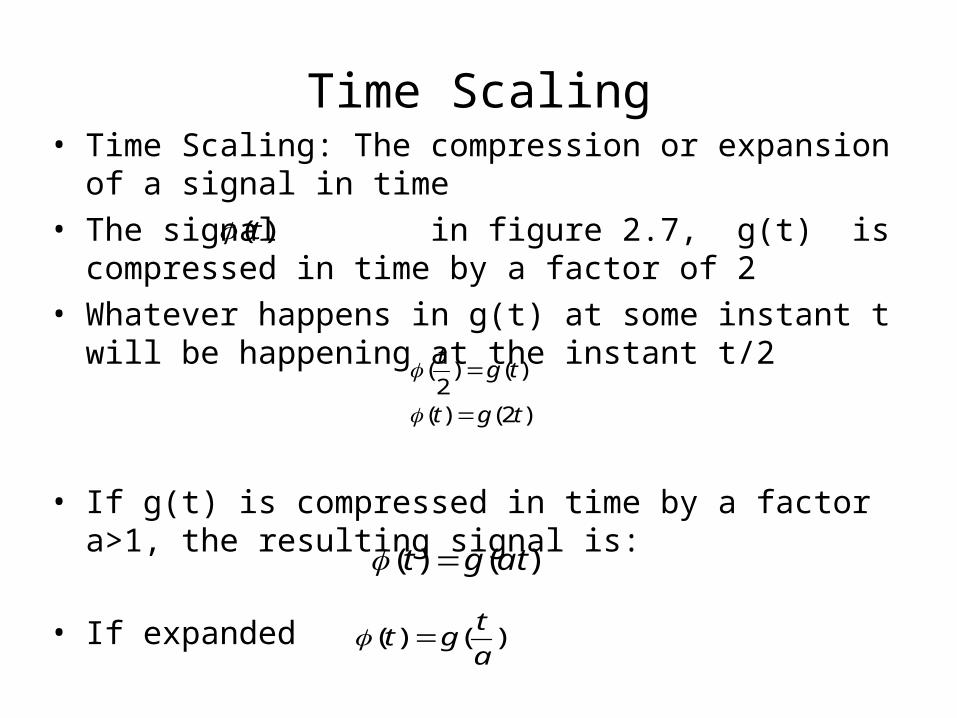
Time Scaling• Time Scaling: The compression or expansion of a signal in
time
• The signal in figure 2.7, g(t) is compressed in time by a factor of 2
• Whatever happens in g(t) at some instant t will be happening at the instant t/2
• If g(t) is compressed in time by a factor a>1, the resulting signal is:
• If expanded
)(t
)2()(
)()2
(
tgt
tgt
)()( atgt
)()(a
tgt

Figure 2.7 Time scaling a signal.
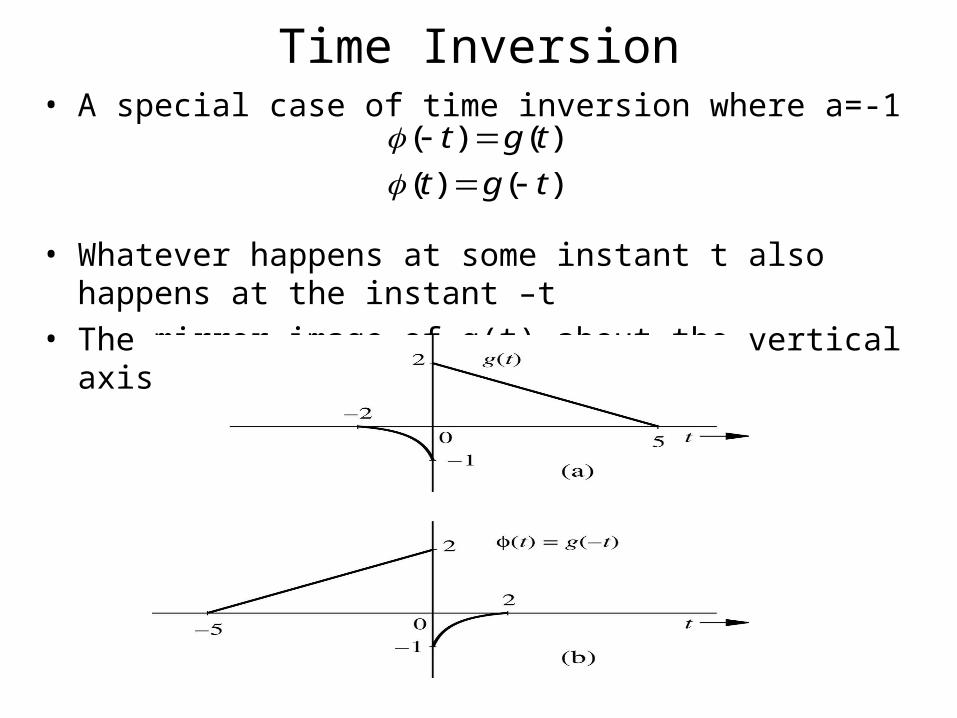
Time Inversion• A special case of time inversion where a=-1
• Whatever happens at some instant t also happens at the instant –t
• The mirror image of g(t) about the vertical axis is g(-t).
)()(
)()(
tgt
tgt

Time Inversion Example
• For the signal g(t) in (a) below, the sketch of g(-t) is shown in (b)

Unit Impulse Signal
• Unit impulse function (Dirac delta)
• A unit Impulse– Visualized as a tall, narrow rectangular pulse of unit area– Width ε is very small, height is a large value 1/ε – Unit impulse is represented with a spike.
0)( t 0t1)(
t

Unit Impulse Signal• Multiplication of unit impulse by a function that is
continuous at t = 0
• Multiplication of a function with an impulse (an impulse located at t=T) ( must is defined at t=T)
• Area under the product of a function with an impulse is equal to the value of that function at the instant where the unit impulse is located (Sampling or sifting property)
)(t
)()0()()( ttt
)(t)( Tt
)()()()( TtTTtt
)(t
)()()()()( TdtTtTdtTtt
)(t

Unit Step Function u(t)
A signal that starts after t=0 is called a causal signal. A signal g(t) is causal if:
g(t) = 0 t<0
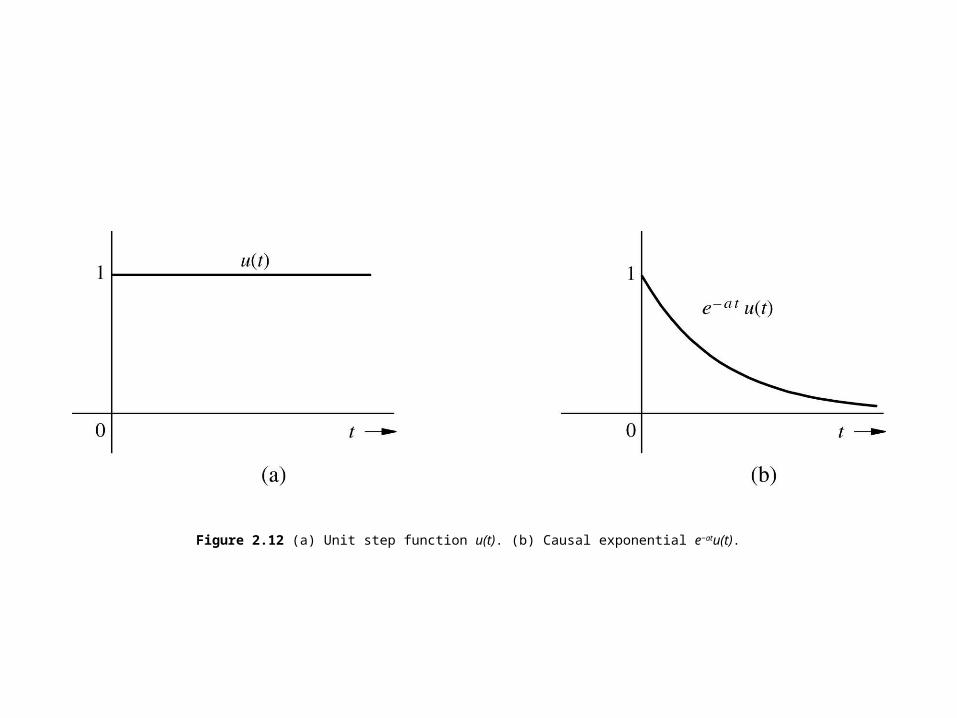
Figure 2.12 (a) Unit step function u(t). (b) Causal exponential e−atu(t).
Signals and Vectors
• Signal Representation– As series of orthogonal functions (Fourier
series)– Fourier series allows signal to be represented
as points in a generalized vector space (signal space)
– Information can therefore be viewed in geometrical context

Signal and Vectors
• Any vector A in 3 dimensional space can be expressed as
A = A1a + A2b + A3c
– a, b, c are vectors that do not lie in the same plane and are not collinear
– A1, A2, and A3 are linearly independent
– No one of the vectors can be expressed as a linear combination of the other 2
– a, b, c is said to form a basis for a 3 dimensional vector space
– To represent a time signal or function X(t) on a T interval (t0 to t0+T) consider a set of time function independent of x(t) )(...).........(),(),( 321 tttt N
Signal and Vectors
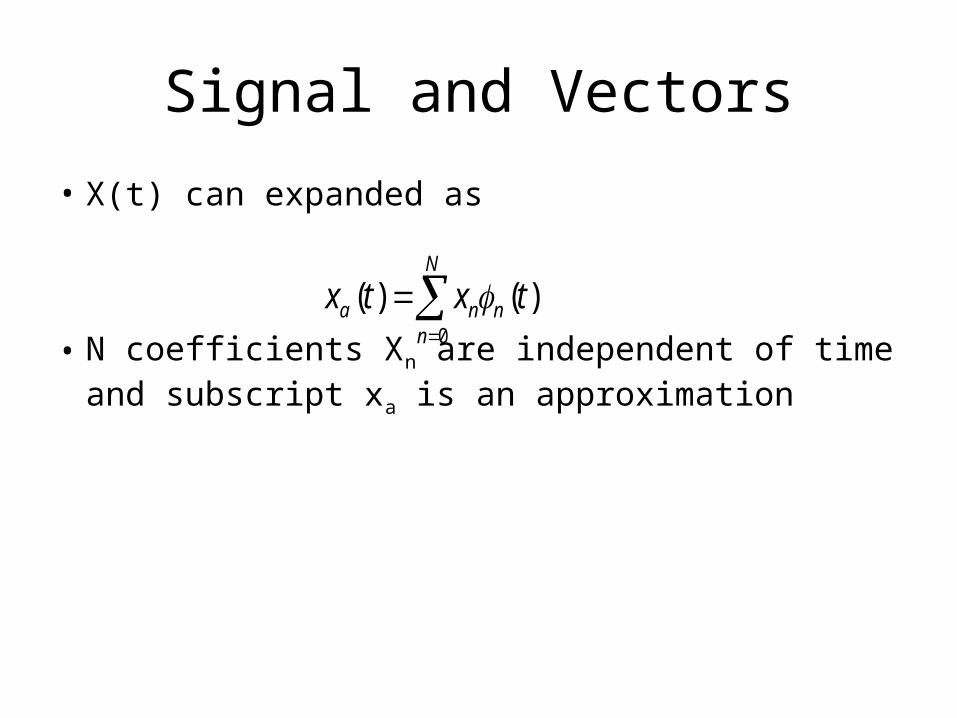
• X(t) can expanded as
• N coefficients Xn are independent of time and subscript xa is an approximation
N
nnna txtx
0
)()(

29
Signals and Vectors
• Signal g can be written as N dimensional vectorg = [g(t1) g(t2) ………… g(tN)]
• Continuous time signals are straightforward generalization of finite dimension vectors
• In vector (dot or scalar), inner product of two real-valued vector g and x:– <g,x> = ||g||.||x||cosθ θ – angle between vector g and x– Length of a vector x:
||x||2 = <x.x>
],[
)(lim
bat
tggN
30
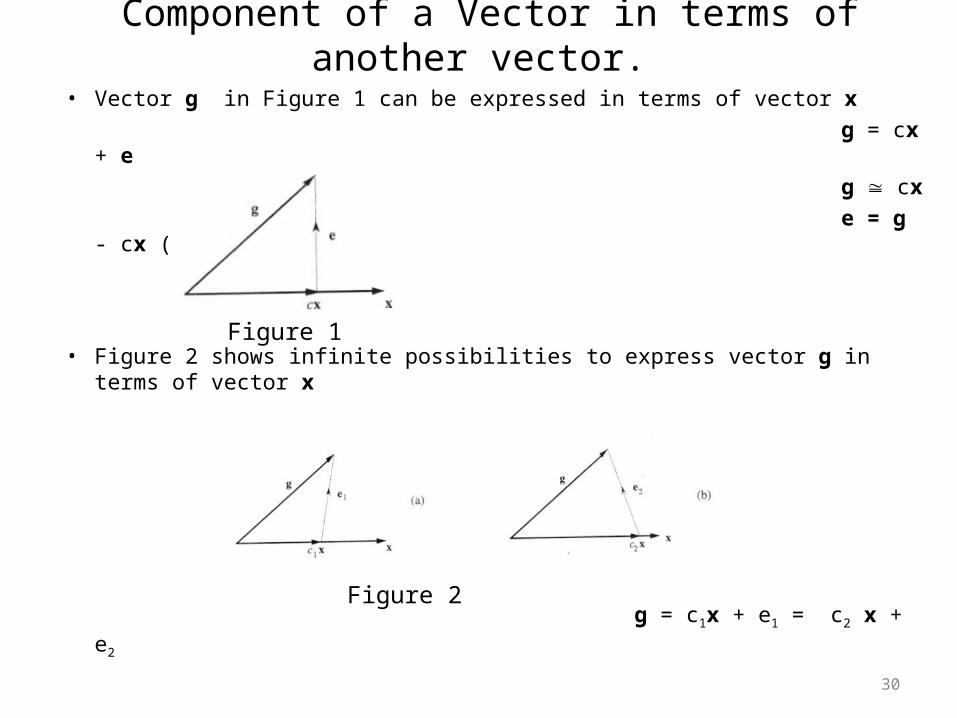
Component of a Vector in terms of another vector.
• Vector g in Figure 1 can be expressed in terms of vector x
g = cx + e
g cx
e = g - cx (error vector)
• Figure 2 shows infinite possibilities to express vector g in terms of vector x
g = c1x + e1 = c2 x + e2
Figure 1
Figure 2
31
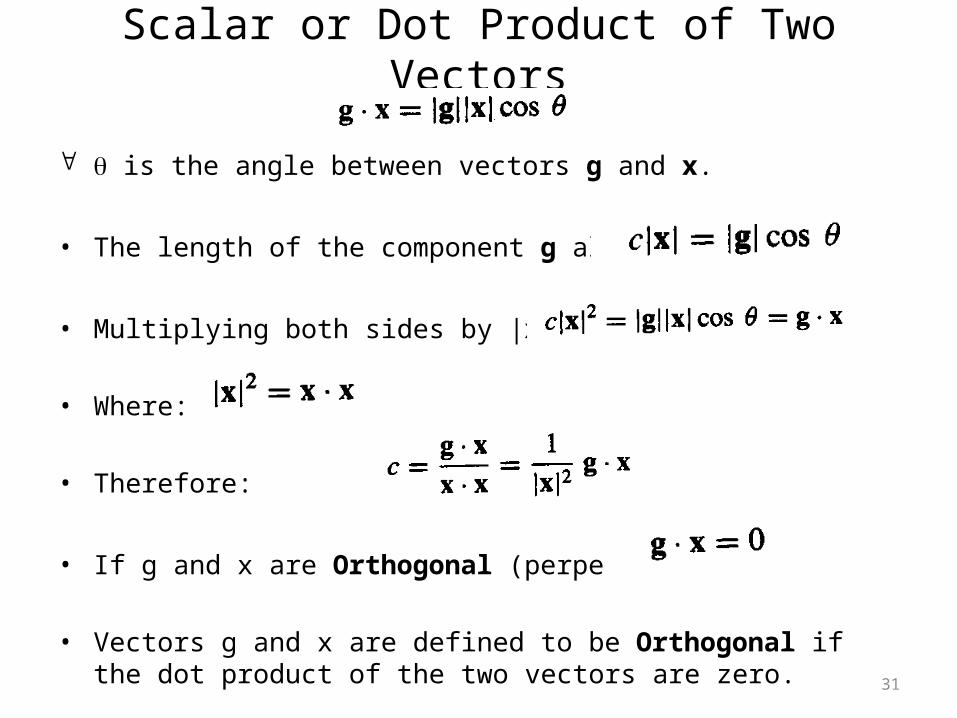
Scalar or Dot Product of Two Vectors
is the angle between vectors g and x.
• The length of the component g along x is:
• Multiplying both sides by |x| yields:
• Where:
• Therefore:
• If g and x are Orthogonal (perpendicular):
• Vectors g and x are defined to be Orthogonal if the dot product of
the two vectors are zero.

32
Components and Orthogonality of Signals• Concepts of vector component and orthogonality can be extended
to CTS• If signal g(t) is approximated by another signal x(t) as :
• The optimum value of c that minimizes the energy of the error signal is:
• We define real signals g(t) and x(t) to be orthogonal over the
interval [t1, t2], if:
• We define complex signals* x1(t) and x2(t) to be orthogonal over the interval [t1, t2]:
c
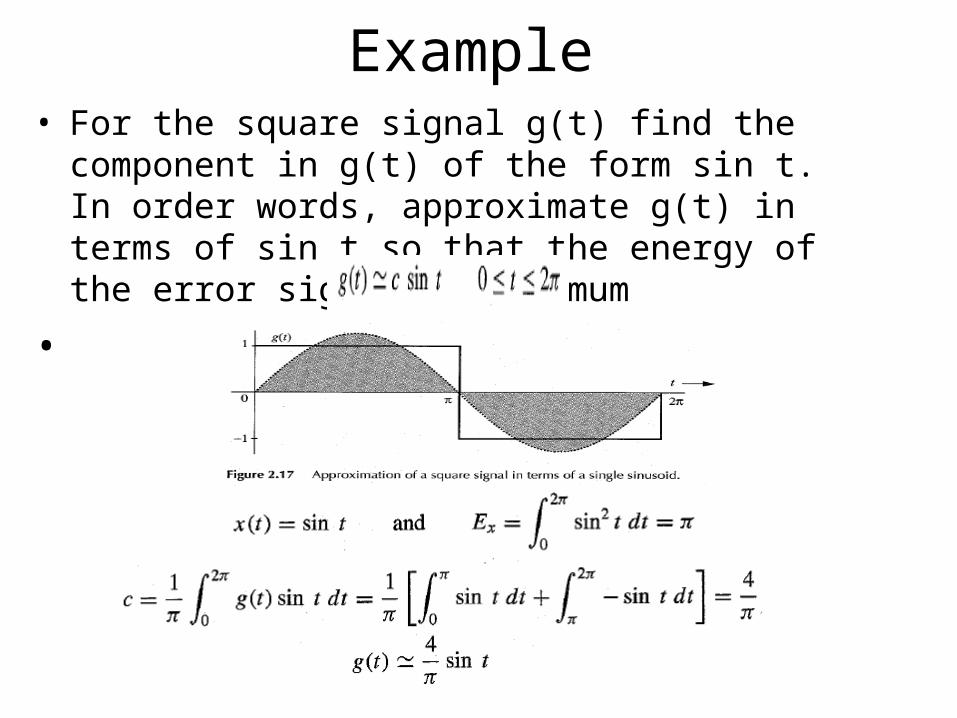
Example• For the square signal g(t) find the component in g(t)
of the form sin t. In order words, approximate g(t) in terms of sin t so that the energy of the error signal is minimum
•
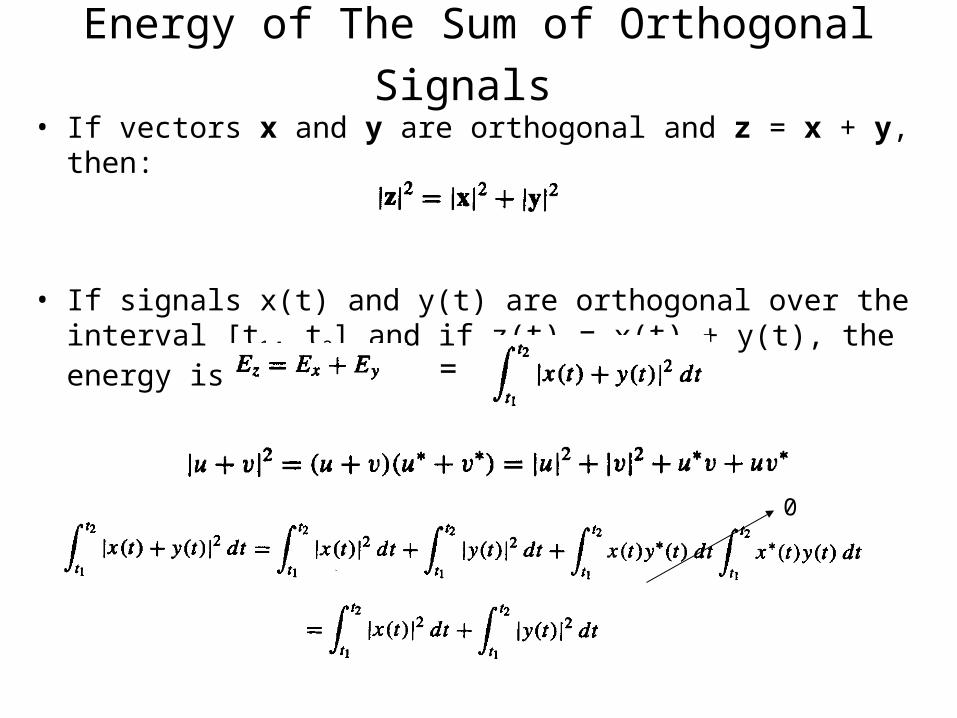
Energy of The Sum of Orthogonal Signals • If vectors x and y are orthogonal and z = x + y, then:
• If signals x(t) and y(t) are orthogonal over the interval [t1, t2] and if z(t) = x(t) + y(t), the energy is:
=
0

35
Signal Comparison: Correlation Coefficient
• Two vectors g and x are similar if g has a large component along x
• Correlation Coefficient for real signals:
• Correlation Coefficient for complex signals:
• The magnitude of the Correlation Coefficient is never greater than unity (-1 Cn 1). If the two vectors are equal then Cn = 1. If the two vectors are equal but in opposite directions then Cn = -1. If the two vectors are orthogonal then Cn = 0.

Signal Comparison: Correlation Coefficient
• Use Eq. (2.48) to compute Cn.
Cn =

Example

Application of Correlation• Signal processing in radar, sonar, digital
communication, electronic warfare etc
• In radar, if transmitted pulse is g(t), received radar return signal is :
• Detection is possible if:
)(
)()()( 0
tw
twttgtz
201
0)(*)(2
1 0
ttt
dtttgtwt
t
Target absent
Target present
α is target reflection and attenuation loss,t0 – round trip propagation delay,w(t) –noises and interferences
00
|)(|)(*)(
2
1
20
0p
t
tEdtttg
dtttgtz Target present
Target absent

Application of Correlation• Digital Communication
– Detection of the presence of one or two known waveform in the presence of noise
– Antipodal Scheme: Selecting one pulse to be the negative of the other pulse where cn will be -1
– If noise is present in the received signal. Threshold detector is used to detect signal.
– Large margins should be used to prevent detection error.
– Antipodal has the highest performance in terms of guarding against channel noise and pulse distortion
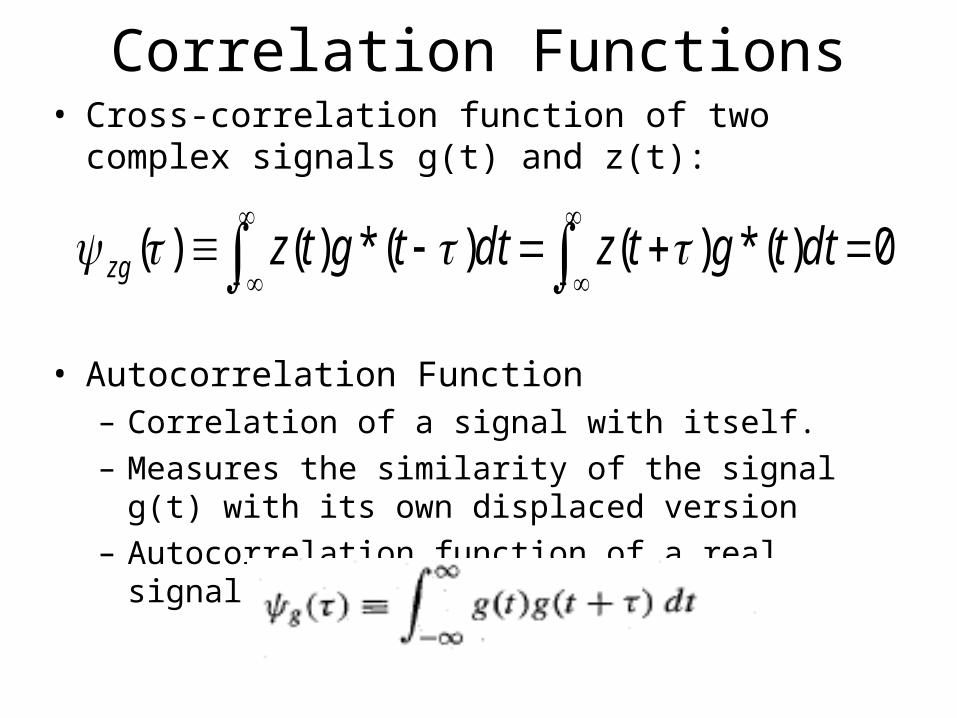
Correlation Functions• Cross-correlation function of two complex signals
g(t) and z(t):
• Autocorrelation Function– Correlation of a signal with itself. – Measures the similarity of the signal g(t) with its own
displaced version– Autocorrelation function of a real signal is:
0)(*)()(*)()( dttgtzdttgtzzg

Orthogonal Signal Set
• Vector can be represented as a sum of orthogonal vectors
• Orthogonality of a signal x1(t) x2(t) x3(t)…..xN(t) over time domain [t1, t2]:
• If all signal energies En = 1, then the set is normalized and called orthonormal set
• An orthogonal set can be normalized by dividing xn(t) by
• If orthogonality is complete:
nE
N
nnnNNN txctgtxctxctxctge
12211 )()()]()......()([)(
2
1
2 0|)(|limt
t NN
dtte

Orthogonal Signal Set• A signal g(t) can be represented by
• This is called generalized Fourier series of g(t) with respect to xn(t)
• Energy of the sum of orthogonal signals is equal to the sum of their energies (sum of individual components)
• This is called Parseval’s theorem
1
)()(n
nn txctg

Exponential Fourier Series• Examples of orthogonal sets are trigonometric
(sinusoid) functions, exponential (sinusoid) functions
• The set of exponentials is orthogonal over any interval of duration
• A signal g(t) can be expressed over an interval of T0
seconds as an exponential Fourier series:
,.....)2,1,0(0 ne tjn
/20 T

Exponential Fourier Series• The compact trigonometric Fourier series of a
periodic signal g(t) is given by
• In exponential Fourier series where C0 = D0:
• Exponential Fourier series will be used in this course because it is more compact, expression for derivation is also compact
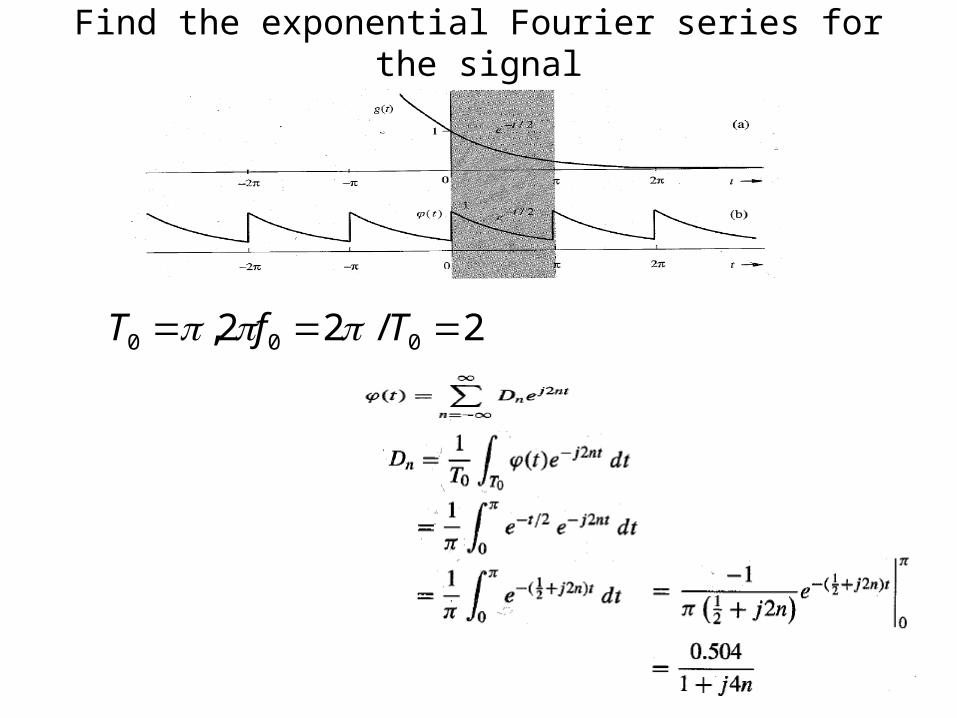
Find the exponential Fourier series for the signal
2/22, 000 TfT


Exponential Fourier Spectra• Coefficients Dn is plotted as a function of ω
• If Dn is complex, two plots are required: real and imaginary parts of Dn or
• Plot of amplitude (magnitude) and angle of Dn
• To plot |Dn| versus ω and versus ω and Dn must be expressed in polar form
•
nDnDj
n eD ||