Embed Size (px)
Citation preview

C H A P T E R
3
MATERIALS AND METHODS
All experiments were performed in accordance with the guidelines of
the Animal Ethics Committee of Hamdard University.
3/1 CHEiilCALS
Reduced glutathione, oxidized glutathione, glutathione reductase,
reduced nicotinamide adenine dinucleotide phosphate (NADPH), 1-chloro-2,4-
dinitrobenzene (CDNB), 1,2-dithio-bis-nitrobenzoic acid (DTNB), thiobarbituric
acid (TBA), xanthine, amionoguanidine (hemisulphate), glucose-6 -phosphate,
nicotinamide adenine dinucleotide phosphate (NADP), 2,3-diaminonapthalene
(DAN), sulphanilamide (Sigma Chemicals Co, St Louis, M.O., USA),
naphthylene diamine dihydrochloride (NEDD) (Merck, India),
nitrobluetetrazolium (NBT), nutrient broth, nutrient agar, triple sugar iron agar
(T8 I) (HiMedia, India) and radioactive thymidine (H^) (from Amersham ), L-
arginine and L-citrulline (SRL, India) and other chemicals of high purity/HPLC
grade were used.
3.2 ANIMALS
Swiss albino mice (25-30g) of 6 - 8 weeks old were obtained from the
Central Animal House of Hamdard University, New Delhi, India. The animals
were kept in polypropylene cages in an air-conditioned room 22/25°C and
maintained on a standard laboratory feed (Amrut Laboratory, rat and mice
feed, Navmaharashtra Chakan Oil Mills Ltd, Pune) and water ad libitum.
Animals were allowed to acclimatize for one week before the experiments
under controlled lights/dark cycle (14/10 h). The studies were conducted
according to ethical guidelines of the "Committee for the Purpose of Control
MATERIALS AN D METHODS
and Supervision of Experiments on Animals" (CPCSEA) on the use of animals
for scientific research.
3.3 BACTLRIA
Standard strain of S. typhimurium (wild), obtained from National
Salmonella Phage Typing Centre, Lady Harding Medical College, New Delhi,
India, were used for these studies. The bacterial strain was further
characterized at the Microbiology Department of Majeedia Hospital to confirm
their identity. Briefly, S. typhimurium were grown at 37°C as stationary
overnight cultures in nutrient broth. The innoculum was diluted in PBS and
injected into peritoneum of mice. Dilution and pour plating onto nutrient agar
plate checked the number of viable bacteria in each innoculum.
3.4 DETERMINATION OF LDgo AND SELECTION OF DOSE OF NO DONORS
Fourteen groups of four mice each were used for this study. Twelve
groups of animals were pretreated with L-arg orally (in the form of aqueous
solution, 0.2 ml) with different doses viz. 0.2, 0.5, 1.0, 2.0, 3.0 and 4.0 g kg"''
body weight (two groups for each dose) and two groups of animals served as
the control (received saline orally). After 7 days of pretreatment, the animals
were exposed to two different challenge doses (1 x LD5 0 and 2 x LD5 0 ) of S.
typhimurium (wild).
Similarly, for L-cit study, eight groups of four mice each were used. All
eight groups of animals were pretreated with L-cit orally (in the form of
aqueous solution, 0.2 ml) with different doses viz. 0.2, 0.5, 0.7 and 1.0 g kg'
body weight (two groups for each dose). After 7 days of pretreatment, the
animals were challenged with two different doses (1 x LD5 0 and 2 x LD5 0 ) of S.
typhimurium (wild). The animals were observed for 14 days of post-bacterial
challenge and the results were expressed as per cent survival of animals in
52
MATERIALS AND METHODS
each group. The LD50 of the bacterium was determined by the methods of
Reid & Munch (1938) (Table 1 & 2).
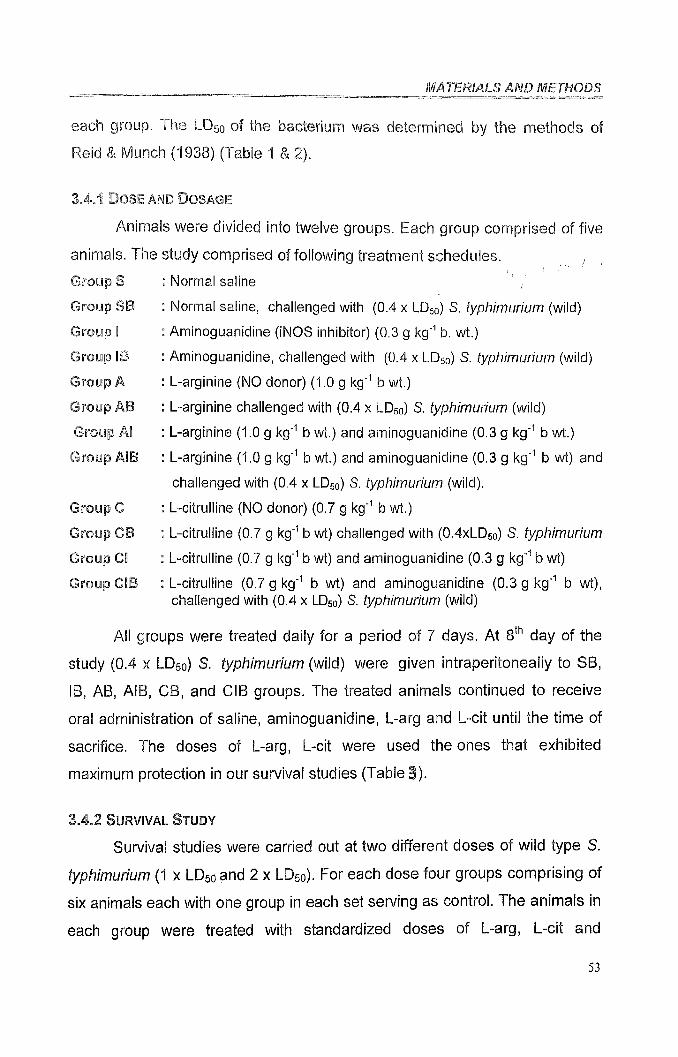
3.4.1 Dose and D osag e
Animals were divided into twelve groups. Each group comprised of five
animals. The study comprised of following treatment schedules.
Group S : Normal saline ' /
Group SB : Normal saline, challenged with (0.4 x LDso) S. typhimurium (wild)
Group I : Am inoguanidine (iNOS inhibitor) (0.3 g kg'^ b. wt.)
Group IB : Aminoguanidine, challenged with (0.4 x LDgo) S. typhimurium (wild)
Group A : L-arginine (NO donor) (1.0 g kg"’’ b wt.)
Group AB : L~arginine challenged with (0.4 x LD50) S. typhimurium (wild)
Group Al : L-arginine (1.0 g kg'^ b wt.) and am inoguanidine (0.3 g kg''’ b wt.)
Group AIB : L-arginine (1.0 g kg"'’ b wt.) and am inoguanidine (0.3 g kg"'' b wt) and
challenged with (0.4 x LD50) S. typhimuhum (wild).
Group C : L-citrulline (NO donor) (0.7 g kg’’’ b wt.)
Group CB : L-citrulline (0.7 g kg’’' b wt) challenged with (O.4XLD50) S. typhimurium
Group C! : L-citrulline (0.7 g kg'^ b wt) and am inoguanidine (0.3 g kg’’' b wt)
Group CIB : L-citruliine (0.7 g kg’ ’' b wt) and am inoguanidine (0.3 g kg'^ b wt), challenged with (0.4 x LD50) S. typhimurium (wild)
All groups were treated daily for a period of 7 days. At 8 *' day of the
study (0.4 X LD5 0 ) S. typhimurium (wild) were given intraperitoneally to SB,
IB, AB, AIB, CB, and CIB groups. The treated animals continued to receive
oral administration of saline, aminoguanidine, L-arg and L-cit until the time of
sacrifice. The doses of L-arg, L-cit were used the ones that exhibited
maximum protection in our survival studies (Table 3).
3.4.2 S u r v iv a l S t u d y
Survival studies were carried out at two different doses of wild type S.
typhimurium ( 1 x LD5 0 and 2 x LDso). For each dose four groups comprising of
six animals each with one group in each set serving as control. The animals in
each group were treated with standardized doses of L-arg, L-cit and
53
M ATERIALS AND METHODS
aminoguanidine for 7 days. At 8 ' day one set of animal groups were
challenged with (1 x LD5 0 ) S. typhimurium (wild) intraperitoneally and other
set of animal groups were challenged with(1 x LD50) S.
typhimurium intraperitoneally. The animal groups were observed for 14 days
after challenge and the degree of protection conferred by the above
compounds was calculated as percent survival at the end of the observation.
3.4.3 B a c t e r i a l C le a ra n c e S t u d y
As the mice were exposed to S. typhimurium, the bacterium gains
entrance to its reticulo-endothelial system, especially liver and spleen. The
number of bacteria (as seen by CPUs) increases slowly upto 1 week and then
attains a constant value. To analyze the effect of L-arg, L-cit, and
aminoguanidine mice were pretreated with above-mentioned procedure.
Groups SB, IB, AB, and CB were taken, each group comprised of six animals.
The mice were sacrificed by cervical dislocation at day 7 post infection (PI).
The liver and spleen of the animals were aseptically removed and washed
with PBS. Both livers and spleens were weighed and an equal amount of
them by weight from each group was homogenized separately in PBS
containing 1.15-% KCI at room temperature. A small aliquot from each
homogenate was cultured on nutrient agar plates. Bacterial colonies were
obtained after overnight incubation of the culture plates at 37°C, which were
screened for S. typhimurium by standard dabbing method on triple-sugar-iron-
agar (TSI-agar) plates and counted. The Salmonellae bacteria impart a
blackish hue to pink colored plates. The results of the experiment were
expressed as number of viable bacteria (logic CPU gm" tissue).
3.5 SERUM PREPARATION
Serum was prepared according to the routine method. Briefly, blood as
taken out from retro-orbital sinus using non-heparanised capillary tubes.
Blood was collected in dried in dried/'centrifuge tubes and clot formation was
M ATERIALS AND METHODS
allowed. Serum was separated from the clot by centrifugation for five minutes
at 800x g in a fixed rotor centrifuge at room temperature. After centrifugation,
serum was carefully collected from the clot using a pasteur pipette. It was kept
at 4°C till the enzyme analysis.
3J PROCESSING OF THE TISSUE AND PREPARATION OF LYSATE (HOMOGENATE)
The routine method standardized in our laboratory was used for
preparation of tissue and subsequent subcellular fractionation. Both the
control and treated group of animals were sacrificed by cervical dislocation
under light ether anesthesia in an ethically proper way. The animals were
immediately dissected to remove the liver and spleen tissue, which were
washed in ice cold saline (0.85% NaCI) in a petridish and the extraneous
material was removed from the tissue. The tissues were blotted gently
between the folds of a filter paper and portion was cut and weighed. Cut
pieces were minced before homogenization. A 10 % homogenate was
prepared in nine volumes of phosphate buffer (0,1 M, pH 7.4) containing
1.15% KCI giving 5-6 stroke using a polytron homogenizer. All subsequent
operations were carried out at a temperature between 0-4°C for biochemical
analysis.
3 .6 . 1 S u b - C e l l u l a r F r a c t i o n a t i o n
Before subcellular fractionation the homogenate (10%) was passed
through the muslin cloth. It was centrifuged for 5 minute in a cooling centrifuge
to remove the nuclei and other debris. Aliquot so obtained was decanted into
a fresh centrifuge tube and subjected to centrifugation at 10,500 x g for 20
minute to get post mitochondrial supernatant (PMS) which was used as
source of analyses for the biochemical estimations. All enzymatic estimations
were completed on same day when animals were sacrificed.
55
M ATERIALS AND METHODS
3.7 BIOCHEMICAL ESTiilATiONS
Biochemical analyses from the tissue obtained from the control as well
as treated group of animals were performed according to methods described
below.
3.7.1 Serum Enzymes
Alanine aminotransferase (ALT) and aspartate aminotransferase (AST)
activity was estimated by using the kit supplied by Span diagnostics Ltd, New
Delhi. The procedure of estimation was based on the method described by
Reitman and Frankel (1956). The enzyme activity was expressed in U/ml.
Here one unit is defined as one pmole of the pyruvate formed under defined
conditions per ml of serum. The assay consisted of 0.1 ml of serum diluted to
1.0 ml with a-ketoglutarate-alanine buffer substrate (pH 7,4) for ALT and with
a-ketoglutarate-aspartate substrate (pH 7.4) for AST determination.
3.7.2 N itr ic O x i d e (NO)
This was done by the fluorometric method of Misko et al. (1993) with
slight modification. This assay is based on the acid catalyzed ring closure of
2,3-diaminonaphyhslene (nonfluorescent) with nitrite to form the highly
fluorescent product 2,3-diaminonaphthotriazole or 1-(H)-naphthotrazole.
Briefly the PMS was further subjected to centrifugation at 1,00,000 g for 1 h in
order to get the cytosol which was then used for NO estimations. To 0.850 ml
of phosphate buffer (25 mM, pH-7.4), 50 lal of cytosol, 100 |.il of freshly
prepared DAN (0.05 mg/ml in 0.62 M MCI) was added and mixed immediately.
After 10 min incubation at 20°C, the reaction was terminated with 100 |al
NaOH (2.8 N). The intensity of the fluorescent signal produced by the product
is maximized by the addition of base. Formation of 2,3-
diaminonaphthotriazole was measured after 5 min at excitation wavelength
365 nm and emission wave length 450 nm with slit width of 25% against the
standard curve. Luminescence Spectrophotometer (LS 50 B, Perkin Elmer,
56
MA TERIALS AND METHODS
UK) was used to analyze the formation of fluorescent 2,3-
diaminonaphthotriazole. The standard curve of nitrite was constructed using
different concentrations and was routinely made fresh. NO was expressed in
nmol nitrite ml’ of cytosol.
3.7.3 X anth ine Oxidase (XO) fE C i.1.3.22)
Xanthine oxidase (XO) catalyses the conversion of xanthine to uric
acid, which has a characteristic absorption peak around 290 nm. The
following spectrophotometric method for XO estimation is based on the
procedure of Stripe & Corta (1969) as modified by Ali et al. (2000). Briefly, 0.2
ml of post mitochondrial supernatant was diluted to 1 ml with tris-buffer (0.5
M, pH 8.1) and incubated for 5 min at 37°C. Reaction was started by adding
0.1 ml of 1 mM xanthine. The reaction was kept at 37°C for 20 min. The
reaction was terminated by the addition of 0.5 ml ice cold perchloric acid
(10%, v/v in distilled water). After 10 min, 2.5 ml of distilled water were added
to the precipitated mixture, which was then centrifuged at 1 ,2 0 0 xg for 1 0 min.
The clear supernatant was decanted and the OD was read at 290 nm. The
results are expressed as mg uric acid formed mg'^ protein. The activity of
xanthine oxidase was calculated by using a 2 mM stock solution of uric acid to
prepare standard curve.
3.7.4 Lipid P e r o x id a t io n
The method of Utley et al. (1967) was modified for the estimation of lipid
peroxidation. Liver and spleen homogenate (1.0 ml) was pipetted in a glass
vial of 20 ml and incubated at 37 ± 1°C in a water bath shaker for 60 min at
120 strokes up and down. Another 1.0 ml was pipetted in a centrifuge tube
and placed at 0°C and marked as zero hour incubation. After 1 h of
incubation, 1.0 ml of 5% TCA and 1.0 ml of 0.67% TBA were added in both
samples. The reaction mixture from the vial was transferred to the tube and
centrifuged at 3,500 rpm for 15 min. The supernatant was transferred to
another tube and placed in a boiling water bath for 10 min. Thereafter, the test
57
M ATERIALS AND METHODS
tubes were cooled and the absorbance of the color was read at 535 nm. The
rate of lipid peroxidation was expressed as nmol malondialdehyde (MDA)
formed/hr/mg protein.
3.7 J Ca talase (CAT| (EC 1.
Catalase activity was assayed by the method of Claiborne (1985), The
assay mixture consisted of 1.95 ml phosphate buffer (0.05 M, pH 7.0), 1.0 ml
hydrogen peroxide (0.019 M), and 0.05 ml PMS (10% w/v) in a total volume of
3.0 ml. Changes in absorbance were recorded at 240 nm. Catalase activity
was calculated in terms of nmol H2 O2 consumed/rnin/mg protein by using
molar extinction coefficient of 0,081 xIO^ M’’' cm'’’ .
3.7.6 Reduced G lu ta th io n e (GSH)
Reduced glutathione in the liver and spleen was determined by the
method of Jollow et al. (1974). 1.0 ml of PMS (10% w/v) was precipitated with
1.0 ml of sulfosalicylic acid (4%). The samples were kept at 4°C for at least
one hour and then subjected to centrifugation at 1200 x g for 15 minutes at
4°C. The assay mixture contained 0.1 ml of PMS (10% w/v), 2.7 ml phosphate
buffer (0.1 M, pH 7.4) and 0.2 ml DTNB (40 mg/10 ml of phosphate buffer, 0.1
M, pH 7.4) in a total volume of 3.0 ml. The yellow colour developed was read
immediately at 412 nm.
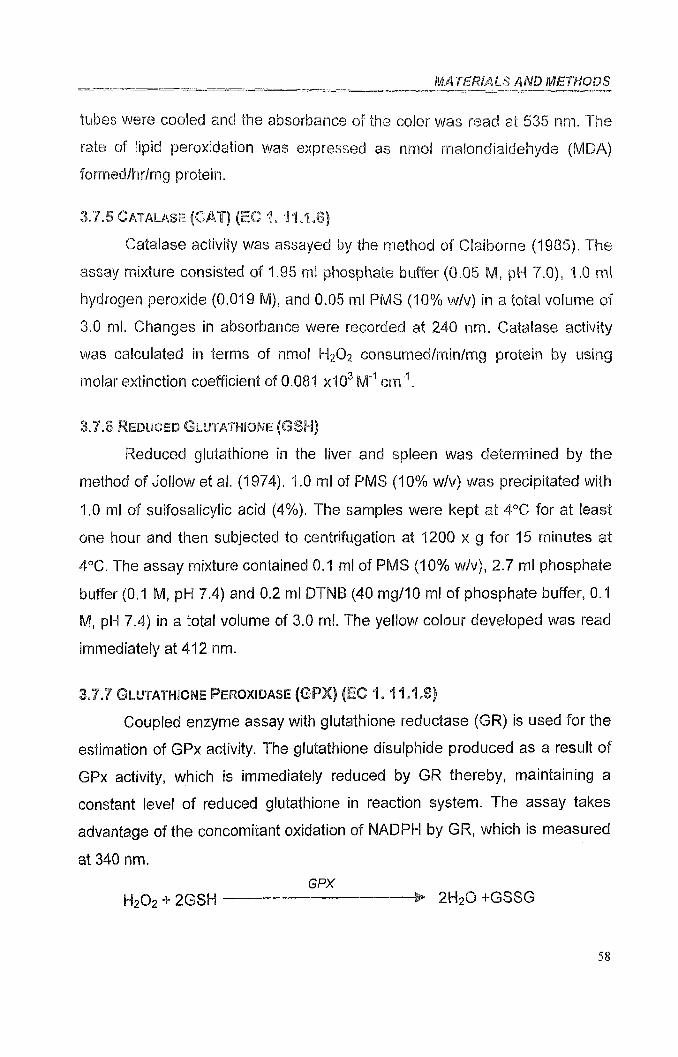
3.7.7 G l u t a t h i o n e P e r o x i d a s e (GPX) (EC 1.11.1.9)
Coupled enzyme assay with glutathione reductase (GR) is used for the
estimation of GPx activity. The glutathione disulphide produced as a result of
GPx activity, which is immediately reduced by GR thereby, maintaining a
constant level of reduced glutathione in reaction system. The assay takes
advantage of the concomitant oxidation of NADPH by GR. which is measured
at 340 nm.
G P XH2 O2 + 2G SH---------------------------------------> 2 H2 O +GS8 G
58
M ATERIALS AND METHODS
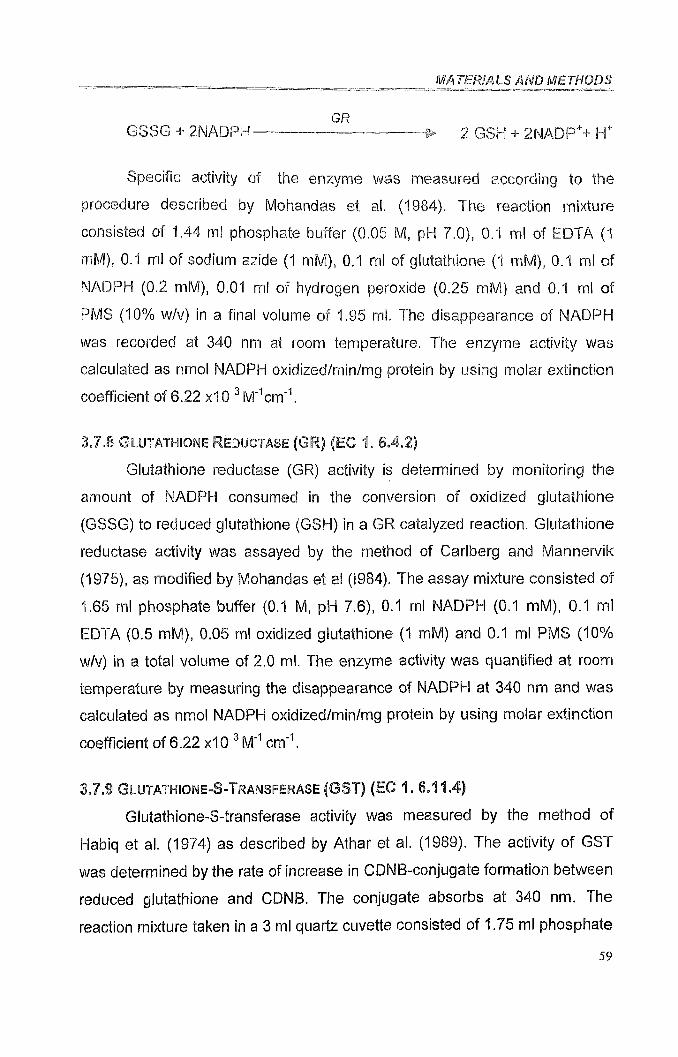
GRGSSG + 2NADPH---------------------- ------------- ► 2 GSH + 2NADPV H"'
Specific activity of the enzyme was measured according to the
procedure described by IViohandas et al. (1984). The reaction mixture
consisted of 1.44 ml phosphate buffer (0.05 M, pH 7,0), 0.1 ml of EDTA (1
mM), 0.1 ml of sodium azide (1 mM), 0.1 ml of glutathione (1 mM), 0.1 ml of
NADPH (0.2 mM), 0.01 ml of hydrogen peroxide (0.25 mM) and 0.1 ml of
PMS (10% w/v) in a final volume of 1.95 ml. The disappearance of NADPH
was recorded at 340 nm at room temperature. The enzyme activity was
calculated as nmol NADPH oxidized/min/mg protein by using molar extinction
coefficient of 6 . 2 2 x 1 0 M'''cm'^.
37.8 G lu ta th io n e R e d u c t a s e (GR) (EC 1. 6.4,2)
Glutathione reductase (GR) activity is determined by monitoring the
amount of NADPH consumed in the conversion of oxidized glutathione
(GSSG) to reduced glutathione (GSH) in a GR catalyzed reaction. Glutathione
reductase activity was assayed by the method of Carlberg and Mannervik
(1975), as modified by Mohandas et al (1984). The assay mixture consisted of
1.65 ml phosphate buffer (0.1 M, pH 7.6), 0.1 ml NADPH (0.1 mM), 0.1 ml
EDTA (0.5 mM), 0.05 ml oxidized glutathione (1 mM) and 0.1 ml PMS (10%
w/v) in a total volume of 2.0 ml. The enzyme activity was quantified at room
temperature by measuring the disappearance of NADPH at 340 nm and was
calculated as nmol NADPH oxidized/min/mg protein by using molar extinction
coefficient of 6.22 xIO cm’\
3.7,9 G l u t a th io n e -S -T ran sfer ase (GST) (EC 1, 6,11,4)
Glutathione-S-transferase activity was measured by the method of
Habiq et al. (1974) as described by Athar et al. (1989). The activity of GST
was determined by the rate of increase in CDNB-conjugate formation between
reduced glutathione and CDNB. The conjugate absorbs at 340 nm. The
reaction mixture taken in a 3 ml quartz cuvette consisted of 1.75 ml phosphate
5 9
MA TERIALS AN D METHODS
buffer (0.1 M, pH 6.5), 0.2 ml reduced glutathione (1 mM), 0.025 ml CDNB (1
mM) and 0.025 ml PMS (10% w/v) in a total volume of 2.0 mi. The changes in
absorbance were recorded at 340 nm and the enzyme activity was calculated
as nmol CDNB conjugate formed/min/mg protein using a molar extinction
coefficient of 9.6x 10 M"'’ cm '\
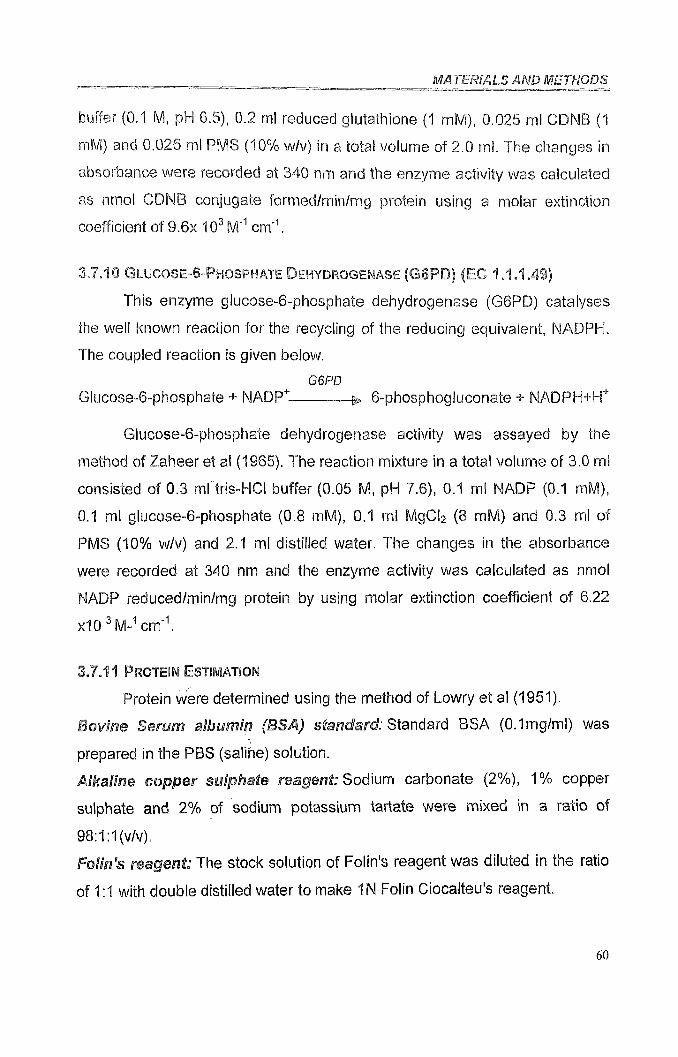
3.7.10 GLUC0SE=-S~PH0SPHATE DEHVrjROGENASE (G6PD) (EC 1.11.49)
This enzyme glucose-6 -phosphate dehydrogenase (G6 PD) catalyses
the well known reaction for the recycling of the reducing equivalent, NADPH.
The coupled reaction is given below.
G 6PDGlucose-6 -phosphate + NADP""------------ ► 6 -phosphogluconate + NADPH+H'*'
Glucose-6 'phosphate dehydrogenase activity was assayed by the
method of Zaheer et a! (1965). The reaction mixture in a total volume of 3.0 ml
consisted of 0.3 ml tris-HCI buffer (0.05 M, pH 7.6), 0.1 ml NADP (0.1 mM),
0.1 ml glucose-6 -phosphate (0.8 mM), 0.1 ml MgCk ( 8 mM) and 0.3 ml of
PMS (10% w/v) and 2.1 ml distilled water. The changes in the absorbance
were recorded at 340 nm and the enzyme activity was calculated as nmol
NADP reduced/min/mg protein by using molar extinction coefficient of 6 . 2 2
x I O ^M-'' cm'"'.
3.7.11 Protein Estimation
Protein were determined using the method of Lowry et al (1951).
Bovine Serum albumin (BSA) standard: Standard BSA (0.1 mg/ml) was
prepared in the PBS (saline) solution.
Alkaline copper sulphate reagent: Sodium carbonate (2%), 1% copper
sulphate and 2 % of sodium potassium tartate were mixed in a ratio of
98;1:1(v/v).
Folin's reagent: The stock solution of Folin's reagent was diluted in the ratio
of 1;1 with double distilled water to make IN Folin Ciocalteu's reagent.
6 0
MATERIALS AND METHODS
Analysis: The peptide bonds form a complex with alkaline copper sulphate
reagents, which give a blue color with Folin's reagent. Briefly, in 0.1 ml of
sample tissue, 0.1 ml chilled TCA (10%) was added. Samples were kept for
30 minutes for the protein precipitation and centrifuged at 3000 rpm for 10
minutes. The supernatant was decanted and discarded. The pellet was
dissolved in 2 ml of IN NaOH and kept at 37“C in water bath for 20 min.
Aliquot 0.2 ml n duplicate was taken in test tube and 0.8 ml water and 5 ml of
alkaline copper sulphate reagent was added. Following 10 min after addition
of alkaline copper sulphate reagent to allow complex formation, 0.5 ml of
Folin's reagent was added. After 30 min, OD of the final product was
measured at 660 nm.
3J iftfiiiUNOLOGICAL ASSESSMENT
3.8.1 Isolation of Peritoneal Macrophages
A convenient source of primary macrophages is the peritoneal cavity of
the mouse. This site provides a high yield of cells out of which 90% are
macrophages. In broad terms, peritoneal macrophages can be divided
phenotypically into resident, elicited and activated cells according to stimulus./
These macrophages are collected following peritoneal lavage as out lined
below:
The use of intraperitoneal injection of sterile inflammatory reagents
provides a useful method of isolating large number of macrophages for
functional assays. Thioglycolate-elicited peritoneal macrophages (TPMs) can
be recruited by peritoneal cavity by intraperitoneal injection of 2.5 ml of
Brewer's complete thioglycolate broth. After 4 days following injection mice
were killed by cervical dislocation and then down their ventral surface upper
most. The skin is wetted with 70% ethanol in water. Using fine scissors a
small lateral cut is made in the skin over the abdomen. Care must be taken
not to cut into the body wall at this stage. The skin is pulled back from incision
to reveal the shiny surface of the body wall. This area must remains sterile
6 !
M ATERIALS AND METHODS
during the entire procedure. Then, using a 21-gauge needle, 9 ml of sterile
Hank's balanced salt solution (HBSS) is injected slowly into the peritoneal
cavity. The needle should not be inserted into deep and care taken not to
penetrate any organs. After removing the needle, the entire body is shaked
gently for 15s. Using a 18-gauge needle attached to a 10 ml syringe, the
HBSS is slowly removed from peritoneal cavity. The needle should be
inserted bevel down into the cranial half of the cavity to avoid fat blocking the
needle during aspiration. Following removal of HBSS from the cavity the
needle is with drawn, and the cell suspension can then be stored in a
siliconized tube placed on ice until required. The cells viability were checked
by trypton blue exclusion method and cell number determined under the light
microscope. The cultures were adjusted to the desire cellular concentration.
Cells were used for the determination of nitrite.
3.8.2 Is o la tio n o f S p le n o cy te s
All groups were treated according to the procedure as mentioned in the
section 4. The mice were sacrificed by cervical dislocation. Their spleens
were aseptically removed and teased into single cell suspensions with help of
suspensions in petridishes. The cells viability were checked by trypton blue
exclusion method and cell number determined under the light microscope.
The cultures were adjusted to the desire'cellular concentration. Cells were
used for the determination of nitrite.
3.8.3 N i t r i t e E s t im a t io n in M a c ro p h a g e s a n d S p le e n
Macrophages and splenocytes were suspended in RPMI-1640
containing 10% heat inactivated calf serum (Sigma), 50 U of penicillin
streptomycin solution per ml (Sigma) and 2 mM L-glutamate (HiMedia) and
0.5 ml of cells (6 million cells/ml) incubated in different sterile tubes. The cells
were cultured for 24 hour at 37°C in 5% CO2 (Forma Scientific Inc., Ohio,
USA). Then 0.5 ml of cell free supernatant was mixed with 0.5 mi of Griess
reagent (1% sulphanilamide, 0.1% naphthylene diamine dihydrchloride
62
M ATERIALS AND METHODS
(NEDD), 5% H3 PO4 ) was added, and incubated for 10 min at room
temperature. The absorbance at 550 nm was determined using A-20
spectrophotometer (Perkin Elmer, UK), and nitrite was quantified with using
NaN0 2 as a standard.
3.8.4 E v a lu a tio n o f P h a g o c y t ic A c t iv it y
Phagocytic activity was evaluated by using the suspension assay as
described by Fujiki & Yano (1997) with some modifications. Peritoneal
macrophages were isolated as described in section 3.8.1. The 0.1 mi aliquots
of 10 X 10® cells/ml in RPMI-1640 were mixed with 0.1 ml of medium
containing 20% PCS and 10 x 10® cells/ml of heat treated (100°C for 1 h)
yeast {Saccoromyces cerviceae) cells (courtesy. Dr. S. Raisuddin,
Department of Medical Elementology and Toxicology, Jamia Hamdard) and
the mixture was incubated at 35°C for 1 h with occasional shaking. After
incubation, 50|_il of this mixture was smeared on glass slides, air-dried and
stained with Wright-Giemsa stain. The slides were observed under a light
microscope (Olympus BX50) using oil emersion. At least 100 cells were
counted. Phagocytic activity was expressed as phagocytic index (PI) and
phagocytic capacity (PC). The percentage of yeast ingested phagocytes (A)
and the amount of yeast ingested per phagocyte (B) was calculated by
enumerating 100 phagocytes under the microscope and the phagocytic index
was expressed as PI = A x B, whereas phagocytic capacity was expressed as
the percentage of phagocytes engulfing > four heat-treated yeast cells.
3.8.5 D e l a y e d -t y p e H y p e r s e n s it iv it y (DTH) S tu d ie s
3.8.5.1 Sonicated antigen of S. typhimurium
The sonicated antigen was made as described by Tiwari and Kamat
(1986). Briefly, S. typhimurium were grown at 37°C as stationary overnight
cultures on nutrient agar were suspended in phosphate buffered saline (PBS),
pH 7.2. Bacteria were washed in PBS and disrupted by sonication (Ultrasonic
63
M ATERIALS AND METHODS
Processor, Heat system Ultrasonic, Inc., USA). The resultant material was
centrifuged at 10,000 rpm for 1 h. The supernatant was lyophilized and the
protein content of the lyophilized materia! was assayed by the method of
Lowry et al (1951).
3.8.5.2 Immunisation
DTH studies were carried out by standard footpad swelling method as
described by Collins and Mackaness (1968). The animals were divided into
four groups comprised of five animals each with one group serving as a
control. Prior to immunization the experimental groups were pretreated with L-
arg, L-cit, and aminoguanidine respectively. These groups were challenged
with 40,000 CPU of S. typhimurium (wild), and observed the animals for 7
days. At 8* day after PI, the bacterial sonicate of 0.03 ml (30 f l) volume
containing 50 j g of protein was injected into the right hind footpad in all
experimental groups of animals including saline treated group. The left hind
footpad received an equal volume of saline and served as control. The
footpad swelling was measured at different time intervals (6, 12,24,48 and 72
hrs) after injection by using a digital vernier caliper (Guanglu, China). The
values obtained for the swelling induced by saline in the left footpad were
subtracted from the values obtained for the swelling induced by sonicated S.
typhimurium. Finally the effect of various compounds on DTH were carried
out.
3,8.6 P e r ip h e r a l b l o o d M o n o n u c le a r C e l l (PBMC) P r o l if e r a t io n S t u d ie s
To assess the role of cell-mediated immune (CMI) responses,
proliferation responses of PBMC were carried by the following procedure.
3.8.6.1 Materials required
Phosphate buffered saline (0.01 M, pH 7.2)
Histopaque-1077 (Sigma, USA)
Concanavalin A (Sigma, USA)
Heparin (HiMedia, India, Ltd.)
64
M ATERIALS AND METHODS
Trypan Blue (HiMedia, India, Ltd.)
5% Trichloracetic acid (TCA) (E-Merck, India, Ltd.)
Absolute ethanol (E-Mreck, India, Ltd.)
96 well tissue culture plate (Corning, USA)
3.8 .6 .2 Growth media
10% RPMI-1640 (Sigma, USA)
10mM N-2-hidroxyethllipiperazin0 N'-2-ethane sulfonic acid (HEPES) (Sigma,
USA)
1mM Sodium pyruvate (E-Merck, India, Ltd.)
2mM L-glutamine (Sigma, USA)
100 U/ml Penicillin (HiMedia, India, Ltd.)
100(j,g/ml Streptomycin (HiMedia, India, Ltd.)
10% Fetal calf serum (PCS) (Sigma, USA)
3.8.6.3 Procedure
Briefly, 5-ml heparanised (5-10 lU/rril) blood was withdrawn from each
group comprised of five mice by retro-orbital sinus using heparanised capillary
tubes. PBMC were obtained from the blood by density gradient centrifugation
on Histopaque-1077. To summarize 5 ml of the blood was diluted with an
equal volume of PBS and was carefully layered on 3 ml of Histopaque-1077
solution in a sterile conical centrifuge tube (Corning, USA) and centrifuged at
600 X g for 30 min at room temperature. The mononuclear cells separated as
white ring at the interface were carefully pipetted out with a sterile pasteur
pipitte. These cells were pelleted at 400 x g for 10 min and the cell pellet was
suspended in 1 ml of the growth media. The cellular viability was checked by
the trypan blue dye exclusion method and the cells were plated in 96-well
microculture plates at a cell density of 1 x 10®cells/well.
The, positive control (Concanavalin A, 50|ig), and negative control
(PBMC cells) were added to each well in triplicate at the initiation of the/
cultures. The PBMC of groups S, SB, IB, AB, AIB, CB, and CIB as mentioned
65
MATERIALS AND METHODS
in the section (3,5.1) were added to each well. The plates were incubated at
37°C in CO2 (5%) incubator (Forma Scientific Inc., Ohio, USA), with water
saturated air for 6 days. After 6 days the cultures were pulsed with 1(.iCi of
pH] methyl thymidine (Amersham Chemicals, USA; specific activity 82Ci/mM)
for 18 hours.
3.S.6.4 Ceil harvesting and quantification o f incorporated radioactivity
3.8.6.4.1 Reagent required for cell lysis
150 mM NaCL
lOmMTris-HCL, pH7.4
lOmM EDTA,
1% SDS
3.8.6A.2 Scintillation fluid
6 gm 2,5-diphenyloxazole (PPO) (Serva Feinbiochemiaca, Heidelgarg, New York, USA),
0.2 gms 1,4 Bis[2-(5-Phenyl)-oxazole)benzene (POPOP) (Serva Feinbiochemiaca, Heidelgarg, New York, USA),
Toluene to 1 litre.
After 18 hours the media in the wells was thrown off and the cells were
incubated with cell lysis solution for 10 min at room temperature. 10^1 of this
cell lysate was layered onto glass-fiber filters (Millipore) and the filters were
allowed to dry. These filters were washed twice with 5% TCA followed by
washing in ethanol. After the last ethanol wash the filters were allowed to air
dry. The amount of thymidine incorporated into the DMA was assessed by
liquid scintillation counting (LKB, Wallace) by placing the dried filters in
scintillation vials containing 10 ml of scintillation fluid. The results were
expressed as incorporation of thymidine (H^) mean counts per minute (CPM)
obtained in cultures.
66
MATERIALS AMD METHODS
3iJ HlS'fOP/vrHOLOGICAL STUDIES
Animals were sacrificed by cervical dislocation. The liver and spleen
tissues were immediately removed and fixed for the histopathological studies.
The steps involved are as follows:
3 . 9 . 1 F ixa tio m AMD P ro c e s s in g
The tissues were fixed immediately after dissection in 10% phosphate
buffered formaldehyde solution, pH 7. The tissues were cut into 2-4 mm thick
sections so that fixative readily penetrates throughout the tissues in short
time. Processing involved dehydration, clearing and infiltration of the tissues
with paraffin. The tissue block was passed through a series of following
solvents as per schedule for dehydration, clearing and paraffin infiltration,
allowing 1 h at each stage.
a) Alcohol 80%
b) Alcohol 90%
c) Alcohol 95%
d) Absolute alcohol/acetone
e) Xylene (2 changes)
f) Paraffin (2 changes)
During the process of embedding, the tissue blocks were oriented so
that sections are cut in the desired plane of tissues. Two L shaped metal
moulds were laid on metal plate so as to encloses a square or rectangular
space. It was then partly filled with melted paraffin and allowed to cool until
reasonably firm. The set block of paraffin with tissue was removed from
moulds and then trimmed to suitable sizes and fixed on a metal object holder.
The block was further trimmed and kept for cooling at 0°C.
3 . 9 . 2 S e c t i o n C u t t i n g
The sections of 4-6 )j.m thickness were cut on albuminized slides. The
sections were drained with water and dried on a hot plate at about 50°C for 30
min before staining.
67
MATERIALS AND METHODS
3 J .3 Staining (Hematoxylin and Eosin)
3.9.3.1 Reagents
3.9 J . 1.1 Harris’ Hematoxyrm Stain
Hematoxylin crystal ; 5 g
Ammonium/potassium alum ; 1 0 0 g
Alcohol (100%) ; 50 ml
Distilled water ; 1000 ml
Mercuric oxide red ; 2.5 g
The hematoxylin crystals were dissolved in alcohol and alum in water by
the aid of heat. The two solutions were removed from heat to it mercuric oxide
was added as possible. It was then heated to simmer until it became dark
purple. The solution was removed from heat immediately and was plunged
into basin of cold water until cool. Finally 2-4 ml of glacial acetic acid was
added (which increases the precision of nuclear stain). The stain was filtered
before each use.
3.9.3J.2 Eosin Phloxme Stain
Eosin (1.0 g) was dissolved of in 100 ml of distilled water and 10 ml 1%
phloxine solution was added. Finally 780 ml of 95% alcohol and 4 ml of glacial
acetic acid were added to it. It was filtered before use.
3.9.3. t 3 Procedure
a) Deparaffinization and hydration of water.
b) Acetone for 2 min.
c) Alcohol for 2 min.
d) Running tap water for 2 min.
e) Harris’ hematoxylin stain for 2 min.
f) Rinsed in tap water for 2 min.
g) Differentiated in 1% acid alcohol, 3-10 dips.
h) Washed In tap water.
68
MATERIALS AND METHODS
i) Dipped in ammonia or lithium carbonate until the sections became blue,
j) Finally washed in running tap water for 10-20 min. (if washing is
inadequate, eosin will not stain evenly)
k) Stained with eosin for 2 min.
I) Dehydrated in 95% and absolute alcohol until excess eosin is removed.
Two changes of 2 min each,
m) Acetone for 1 min.
n) Xylene two changes of 2 min each,
o) Mounted with permount (DPX).
Finally slides were observed for histopathological changes.
jfl o Y A l ISTiCAL ANALYSIS
The results have been expressed as mean ± SE. The level of
significance between the two groups were based on Student-f-test followed by
analysis of variance. The levels of statistical significance were chosen at
p<0 .5 , p<0 .0 1 and p<0.001.
69