Embed Size (px)
Citation preview
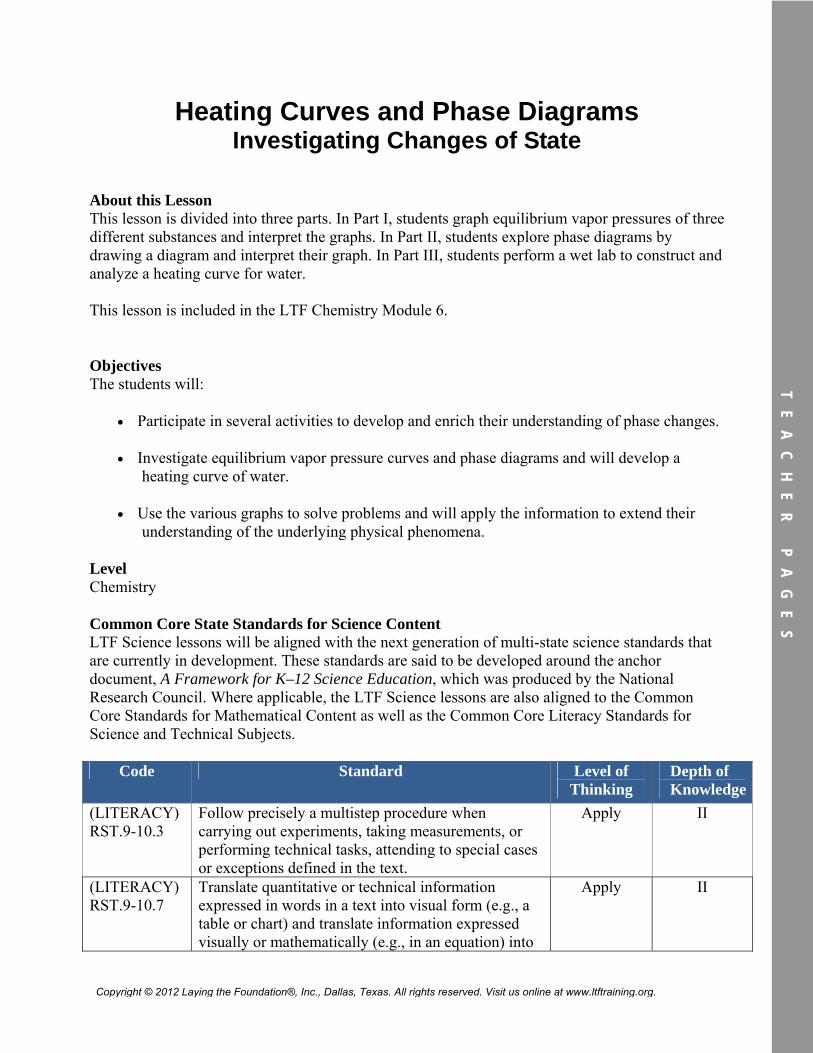
Heating Curves and Phase Diagrams Investigating Changes of State
About this Lesson This lesson is divided into three parts. In Part I, students graph equilibrium vapor pressures of three different substances and interpret the graphs. In Part II, students explore phase diagrams by drawing a diagram and interpret their graph. In Part III, students perform a wet lab to construct and analyze a heating curve for water. This lesson is included in the LTF Chemistry Module 6.
Objectives The students will:
Participate in several activities to develop and enrich their understanding of phase changes.
Investigate equilibrium vapor pressure curves and phase diagrams and will develop a heating curve of water.
Use the various graphs to solve problems and will apply the information to extend their understanding of the underlying physical phenomena.
Level Chemistry
Common Core State Standards for Science Content LTF Science lessons will be aligned with the next generation of multi-state science standards that are currently in development. These standards are said to be developed around the anchor document, A Framework for K–12 Science Education, which was produced by the National Research Council. Where applicable, the LTF Science lessons are also aligned to the Common Core Standards for Mathematical Content as well as the Common Core Literacy Standards for Science and Technical Subjects.
Code Standard Level of Thinking
Depth of Knowledge
(LITERACY) RST.9-10.3
Follow precisely a multistep procedure when carrying out experiments, taking measurements, or performing technical tasks, attending to special cases or exceptions defined in the text.
Apply II
(LITERACY) RST.9-10.7
Translate quantitative or technical information expressed in words in a text into visual form (e.g., a table or chart) and translate information expressed visually or mathematically (e.g., in an equation) into
Apply II
TE
AC
HE
R
PA
GE
S
Copyright © 2012 Laying the Foundation®, Inc., Dallas, Texas. All rights reserved. Visit us online at www.ltftraining.org.
Code Standard Level of Thinking
Depth of Knowledge
words.
(MATH) S-ID.6a
Represent data on two quantitative variables on a scatter plot, and describe how the variables are related. Fit a function to the data; use functions fitted to data to solve problems in the context of the data. Use given functions or choose a function suggested by the context. Emphasize linear, quadratic, and exponential models.
Apply II
(MATH) S-ID.6b
Represent data on two quantitative variables on a scatter plot, and describe how the variables are related. Informally assess the fit of a function by plotting and analyzing residuals.
Apply II
(LITERACY) W.1
Write arguments to support claims in an analysis of substantive topics or texts, using valid reasoning and relevant and sufficient evidence.
Apply II
(MATH) N-Q.1
Use units as a way to understand problems and to guide the solution of multi-step problems; choose and interpret units consistently in formulas; choose and interpret the scale and the origin in graphs and data displays.
Apply II
Connections to AP* AP Chemistry:
II. States of Matter B. Liquids and solids 2. Phase diagrams of one-component systems 3. Changes of state, including critical points and triple points III. Reactions E. Thermodynamics 2. First law: change in enthalpy; heat of formation; heat of reaction; Hess’s law; heats of vaporization and fusion; calorimetry
*Advanced Placement and AP are registered trademarks of the College Entrance Examination Board. The College Board was not involved in the production of this product.
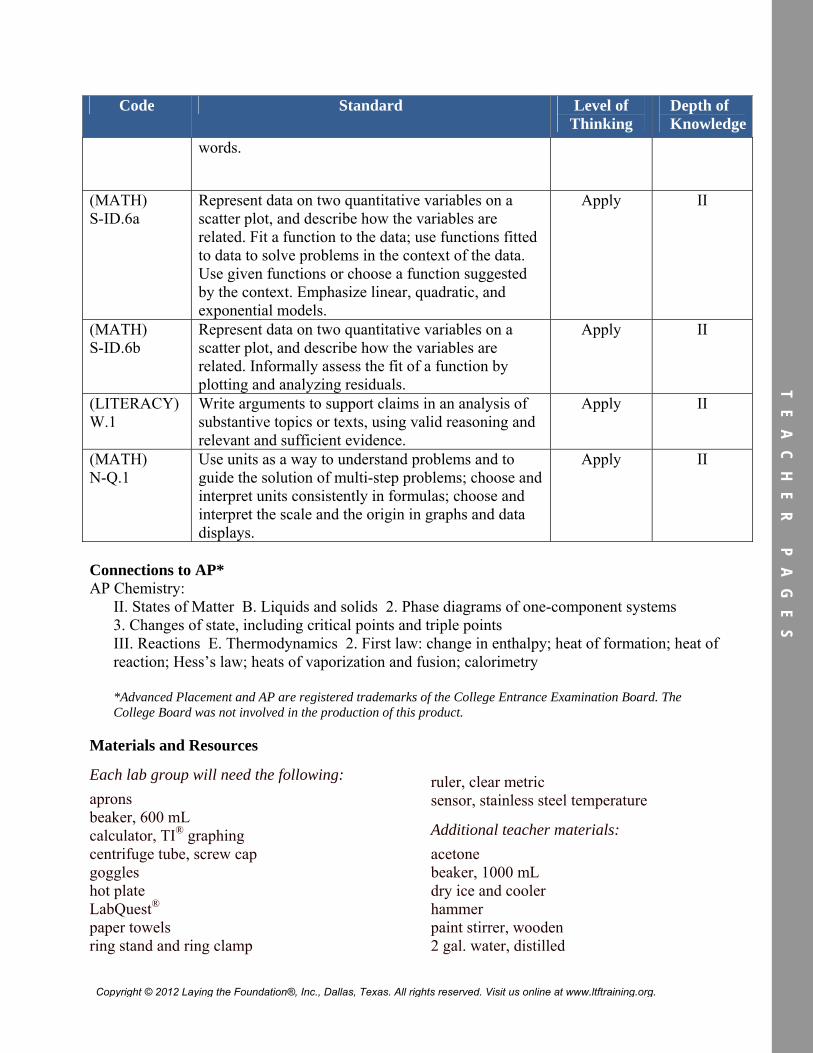
Materials and Resources
Each lab group will need the following: aprons beaker, 600 mL calculator, TI® graphing centrifuge tube, screw cap goggles hot plate LabQuest® paper towels ring stand and ring clamp
ruler, clear metric sensor, stainless steel temperature
Additional teacher materials: acetone beaker, 1000 mL dry ice and cooler hammer paint stirrer, wooden 2 gal. water, distilled
TE
AC
HE
R
PA
GE
S
Copyright © 2012 Laying the Foundation®, Inc., Dallas, Texas. All rights reserved. Visit us online at www.ltftraining.org.
Assessments The following types of formative assessments are embedded in this lesson:
Assessment of prior knowledge and graphing calculator skills. Guided questions via Pre-Lab activities. Visual assessment during the activities. Assessment of conclusions drawn from laboratory data.
The following additional assessments are located on the LTF website: Chemistry Assessment: States of Matter 2005 Chemistry Posttest, Free Response Question 2; 2009 Chemistry Posttest, Free
Response Question 2 Short Lesson Assessment: Heating Curves and Phase Diagrams
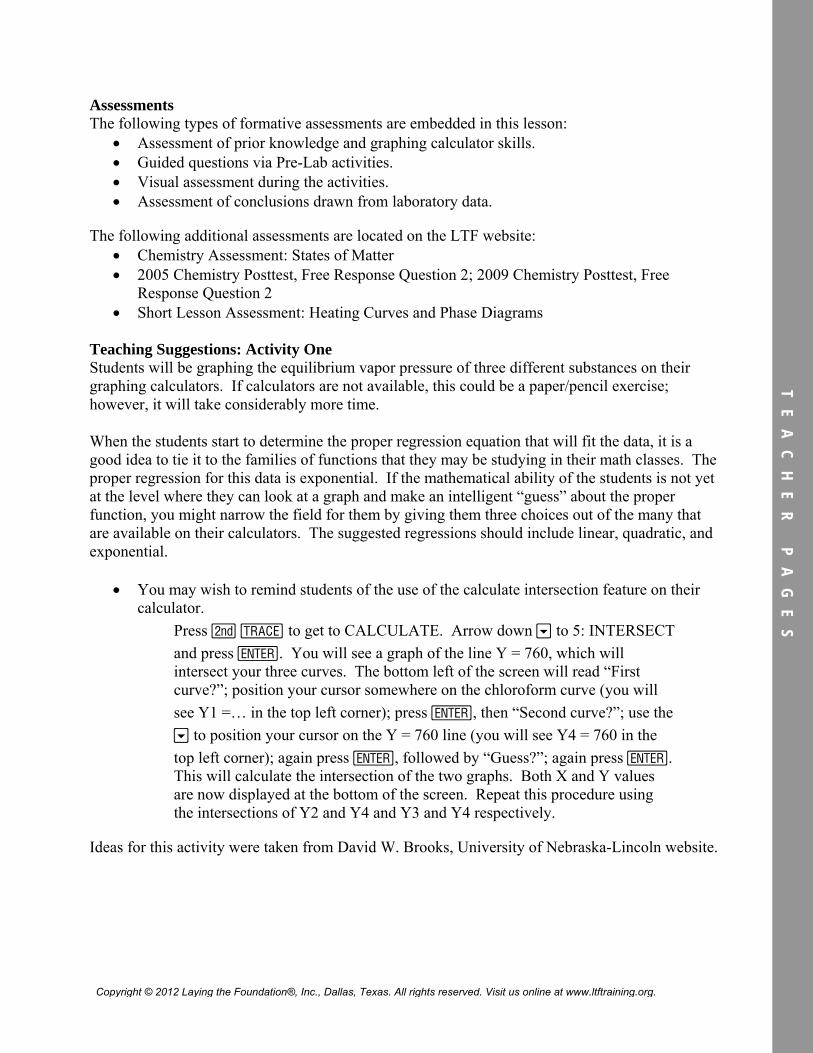
Teaching Suggestions: Activity One Students will be graphing the equilibrium vapor pressure of three different substances on their graphing calculators. If calculators are not available, this could be a paper/pencil exercise; however, it will take considerably more time.
When the students start to determine the proper regression equation that will fit the data, it is a good idea to tie it to the families of functions that they may be studying in their math classes. The proper regression for this data is exponential. If the mathematical ability of the students is not yet at the level where they can look at a graph and make an intelligent “guess” about the proper function, you might narrow the field for them by giving them three choices out of the many that are available on their calculators. The suggested regressions should include linear, quadratic, and exponential.
You may wish to remind students of the use of the calculate intersection feature on their calculator.
Press y r to get to CALCULATE. Arrow down † to 5: INTERSECT
and press Í. You will see a graph of the line Y = 760, which will intersect your three curves. The bottom left of the screen will read “First curve?”; position your cursor somewhere on the chloroform curve (you will
see Y1 =… in the top left corner); press Í, then “Second curve?”; use the
† to position your cursor on the Y = 760 line (you will see Y4 = 760 in the
top left corner); again press Í, followed by “Guess?”; again press Í. This will calculate the intersection of the two graphs. Both X and Y values are now displayed at the bottom of the screen. Repeat this procedure using the intersections of Y2 and Y4 and Y3 and Y4 respectively.
Ideas for this activity were taken from David W. Brooks, University of Nebraska-Lincoln website.
TE
AC
HE
R
PA
GE
S
Copyright © 2012 Laying the Foundation®, Inc., Dallas, Texas. All rights reserved. Visit us online at www.ltftraining.org.
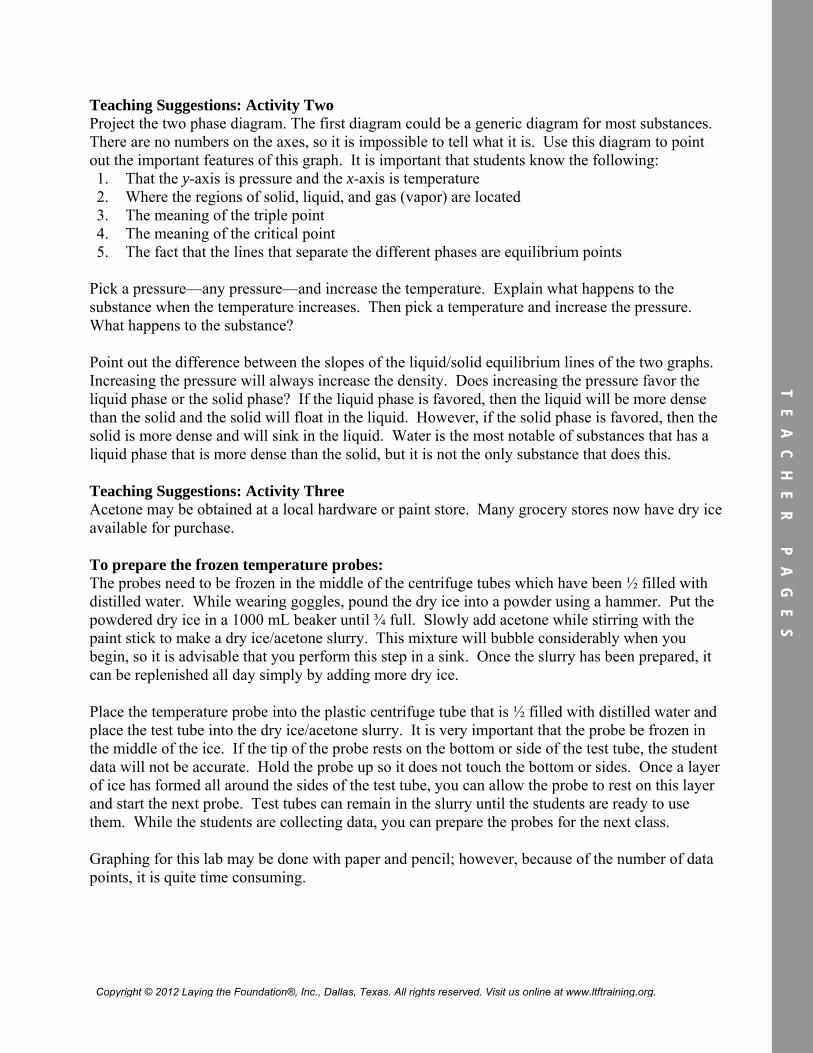
Teaching Suggestions: Activity Two Project the two phase diagram. The first diagram could be a generic diagram for most substances. There are no numbers on the axes, so it is impossible to tell what it is. Use this diagram to point out the important features of this graph. It is important that students know the following: 1. That the y-axis is pressure and the x-axis is temperature 2. Where the regions of solid, liquid, and gas (vapor) are located 3. The meaning of the triple point 4. The meaning of the critical point 5. The fact that the lines that separate the different phases are equilibrium points
Pick a pressure—any pressure—and increase the temperature. Explain what happens to the substance when the temperature increases. Then pick a temperature and increase the pressure. What happens to the substance?
Point out the difference between the slopes of the liquid/solid equilibrium lines of the two graphs. Increasing the pressure will always increase the density. Does increasing the pressure favor the liquid phase or the solid phase? If the liquid phase is favored, then the liquid will be more dense than the solid and the solid will float in the liquid. However, if the solid phase is favored, then the solid is more dense and will sink in the liquid. Water is the most notable of substances that has a liquid phase that is more dense than the solid, but it is not the only substance that does this.
Teaching Suggestions: Activity Three Acetone may be obtained at a local hardware or paint store. Many grocery stores now have dry ice available for purchase.
To prepare the frozen temperature probes: The probes need to be frozen in the middle of the centrifuge tubes which have been ½ filled with distilled water. While wearing goggles, pound the dry ice into a powder using a hammer. Put the powdered dry ice in a 1000 mL beaker until ¾ full. Slowly add acetone while stirring with the paint stick to make a dry ice/acetone slurry. This mixture will bubble considerably when you begin, so it is advisable that you perform this step in a sink. Once the slurry has been prepared, it can be replenished all day simply by adding more dry ice.
Place the temperature probe into the plastic centrifuge tube that is ½ filled with distilled water and place the test tube into the dry ice/acetone slurry. It is very important that the probe be frozen in the middle of the ice. If the tip of the probe rests on the bottom or side of the test tube, the student data will not be accurate. Hold the probe up so it does not touch the bottom or sides. Once a layer of ice has formed all around the sides of the test tube, you can allow the probe to rest on this layer and start the next probe. Test tubes can remain in the slurry until the students are ready to use them. While the students are collecting data, you can prepare the probes for the next class.
Graphing for this lab may be done with paper and pencil; however, because of the number of data points, it is quite time consuming.
TE
AC
HE
R
PA
GE
S
TE
AC
HE
R
PA
GE
S
Copyright © 2012 Laying the Foundation®, Inc., Dallas, Texas. All rights reserved. Visit us online at www.ltftraining.org.
PRE-LAB
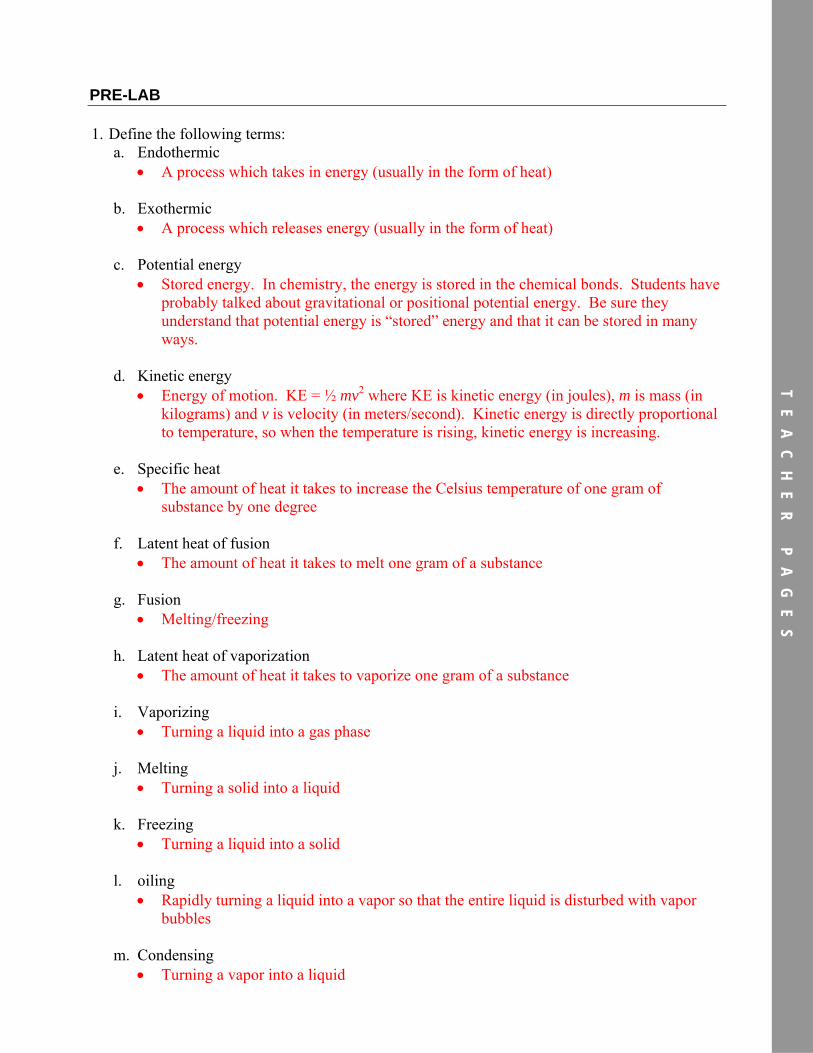
1. Define the following terms: a. Endothermic
A process which takes in energy (usually in the form of heat)
b. Exothermic A process which releases energy (usually in the form of heat)
c. Potential energy
Stored energy. In chemistry, the energy is stored in the chemical bonds. Students have probably talked about gravitational or positional potential energy. Be sure they understand that potential energy is “stored” energy and that it can be stored in many ways.
d. Kinetic energy Energy of motion. KE = ½ mv2 where KE is kinetic energy (in joules), m is mass (in
kilograms) and v is velocity (in meters/second). Kinetic energy is directly proportional to temperature, so when the temperature is rising, kinetic energy is increasing.
e. Specific heat The amount of heat it takes to increase the Celsius temperature of one gram of
substance by one degree
f. Latent heat of fusion The amount of heat it takes to melt one gram of a substance
g. Fusion
Melting/freezing
h. Latent heat of vaporization The amount of heat it takes to vaporize one gram of a substance
i. Vaporizing
Turning a liquid into a gas phase
j. Melting Turning a solid into a liquid
k. Freezing
Turning a liquid into a solid
l. oiling Rapidly turning a liquid into a vapor so that the entire liquid is disturbed with vapor
bubbles
m. Condensing Turning a vapor into a liquid
TE
AC
HE
R
PA
GE
S
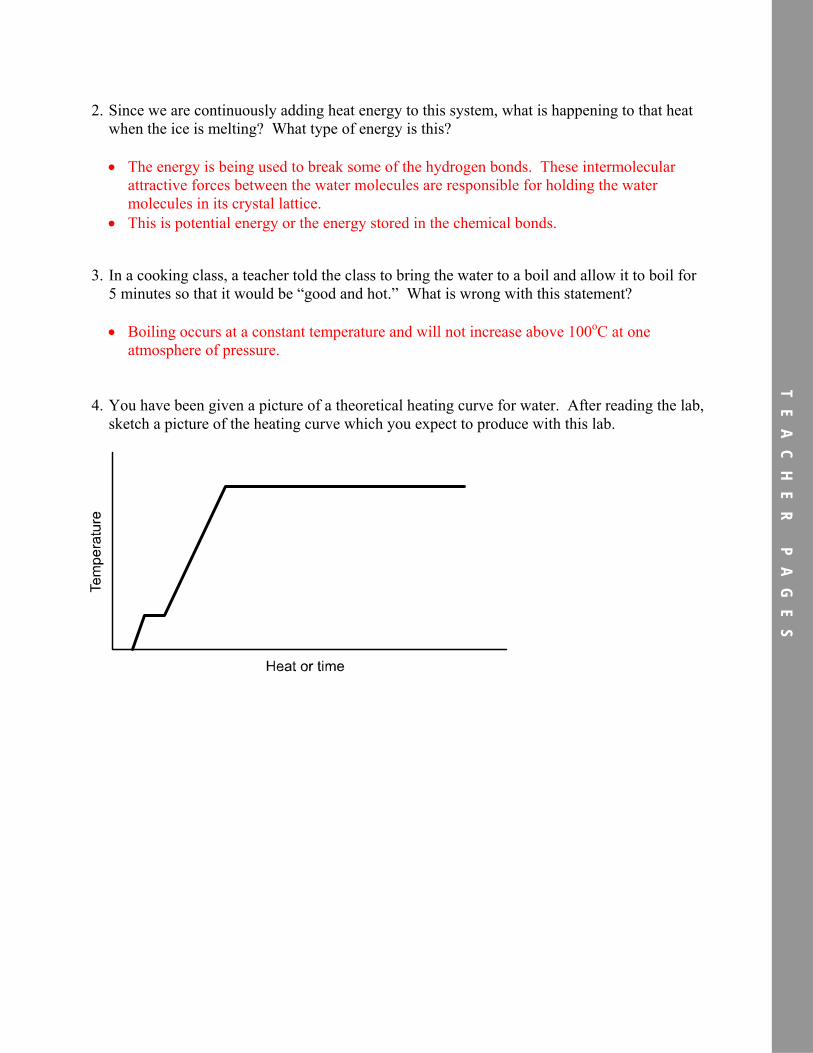
2. Since we are continuously adding heat energy to this system, what is happening to that heat when the ice is melting? What type of energy is this?
The energy is being used to break some of the hydrogen bonds. These intermolecular attractive forces between the water molecules are responsible for holding the water molecules in its crystal lattice.
This is potential energy or the energy stored in the chemical bonds.
3. In a cooking class, a teacher told the class to bring the water to a boil and allow it to boil for 5 minutes so that it would be “good and hot.” What is wrong with this statement?
Boiling occurs at a constant temperature and will not increase above 100oC at one atmosphere of pressure.
4. You have been given a picture of a theoretical heating curve for water. After reading the lab, sketch a picture of the heating curve which you expect to produce with this lab.
TE
AC
HE
R
PA
GE
S
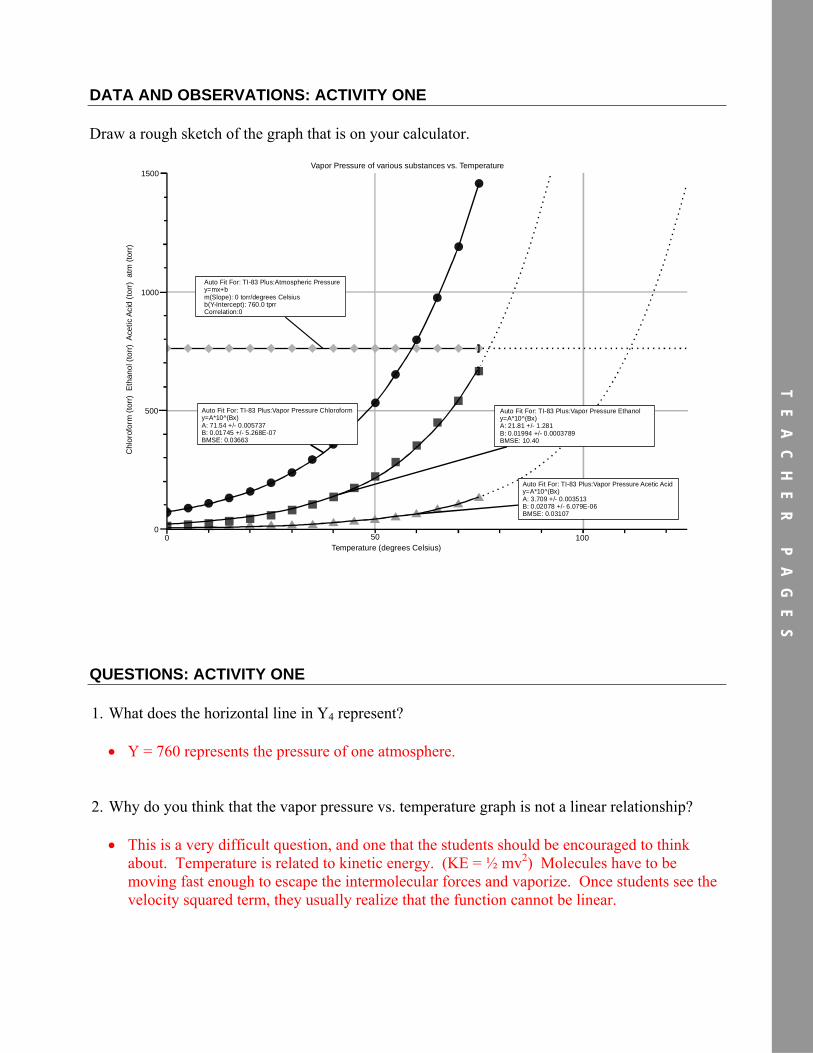
DATA AND OBSERVATIONS: ACTIVITY ONE Draw a rough sketch of the graph that is on your calculator.
00 50 100
500
1000
1500Vapor Pressure of various substances vs. Temperature
Ch
loro
form
(to
rr)
Eth
an
ol (
torr
) A
cetic
Aci
d (
torr
) a
tm (
torr
)
Auto Fit For: TI-83 Plus:Vapor Pressure Chloroformy=A*10^(Bx)A: 71.54 +/- 0.005737B: 0.01745 +/- 5.268E-07BMSE: 0.03663
Auto Fit For: TI-83 Plus:Vapor Pressure Ethanoly=A*10^(Bx)A: 21.81 +/- 1.281B: 0.01994 +/- 0.0003789BMSE: 10.40
Auto Fit For: TI-83 Plus:Vapor Pressure Acetic Acidy=A*10^(Bx)A: 3.709 +/- 0.003513B: 0.02078 +/- 6.079E-06BMSE: 0.03107
Temperature (degrees Celsius)
Auto Fit For: TI-83 Plus:Atmospheric Pressure y=mx+bm(Slope): 0 torr/degrees Celsiusb(Y-Intercept): 760.0 tprrCorrelation:0
QUESTIONS: ACTIVITY ONE
1. What does the horizontal line in Y4 represent?
Y = 760 represents the pressure of one atmosphere.
2. Why do you think that the vapor pressure vs. temperature graph is not a linear relationship?
This is a very difficult question, and one that the students should be encouraged to think about. Temperature is related to kinetic energy. (KE = ½ mv2) Molecules have to be moving fast enough to escape the intermolecular forces and vaporize. Once students see the velocity squared term, they usually realize that the function cannot be linear.
TE
AC
HE
R
PA
GE
S
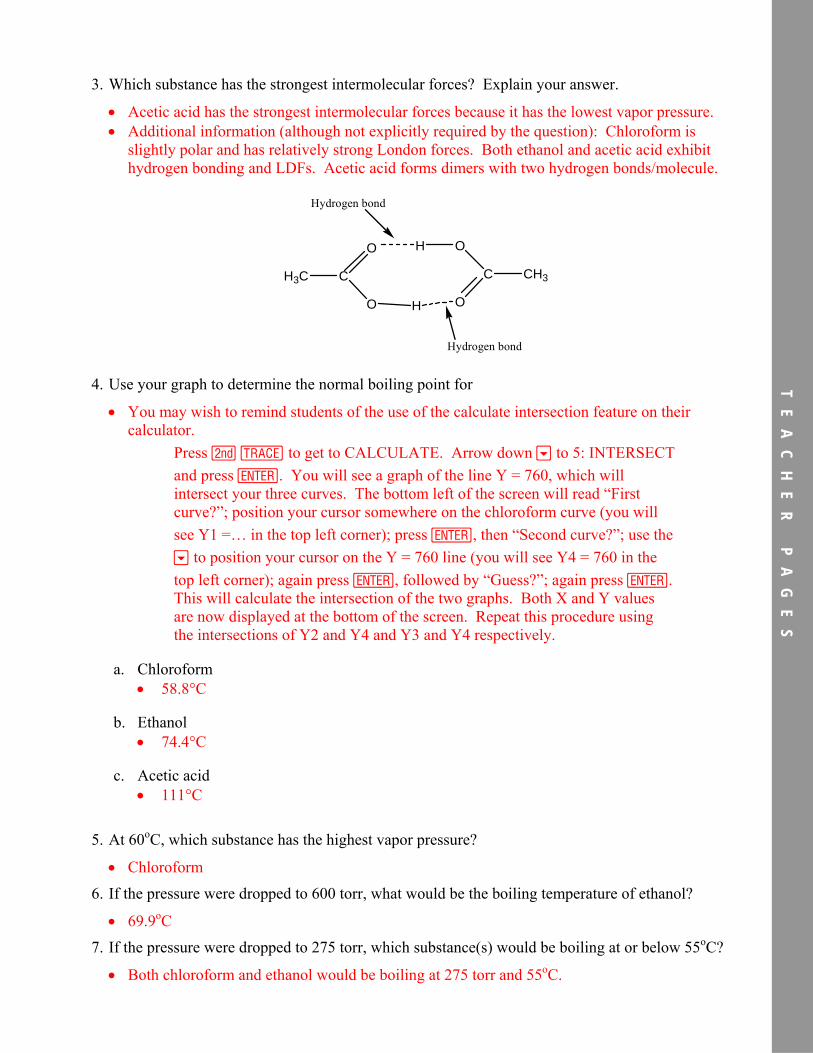
3. Which substance has the strongest intermolecular forces? Explain your answer.
Acetic acid has the strongest intermolecular forces because it has the lowest vapor pressure. Additional information (although not explicitly required by the question): Chloroform is
slightly polar and has relatively strong London forces. Both ethanol and acetic acid exhibit hydrogen bonding and LDFs. Acetic acid forms dimers with two hydrogen bonds/molecule.
H3C C
O
O H
CH3C
O
OH
Hydrogen bond
Hydrogen bond
4. Use your graph to determine the normal boiling point for
You may wish to remind students of the use of the calculate intersection feature on their calculator.
Press y r to get to CALCULATE. Arrow down † to 5: INTERSECT
and press Í. You will see a graph of the line Y = 760, which will intersect your three curves. The bottom left of the screen will read “First curve?”; position your cursor somewhere on the chloroform curve (you will
see Y1 =… in the top left corner); press Í, then “Second curve?”; use the
† to position your cursor on the Y = 760 line (you will see Y4 = 760 in the
top left corner); again press Í, followed by “Guess?”; again press Í. This will calculate the intersection of the two graphs. Both X and Y values are now displayed at the bottom of the screen. Repeat this procedure using the intersections of Y2 and Y4 and Y3 and Y4 respectively.
a. Chloroform 58.8°C
b. Ethanol
74.4°C
c. Acetic acid 111°C
5. At 60oC, which substance has the highest vapor pressure?
Chloroform
6. If the pressure were dropped to 600 torr, what would be the boiling temperature of ethanol?
69.9oC
7. If the pressure were dropped to 275 torr, which substance(s) would be boiling at or below 55oC?
Both chloroform and ethanol would be boiling at 275 torr and 55oC.
TE
AC
HE
R
PA
GE
S
POSSIBLE ANSWERS TO QUESTIONS: ACTIVITY TWO
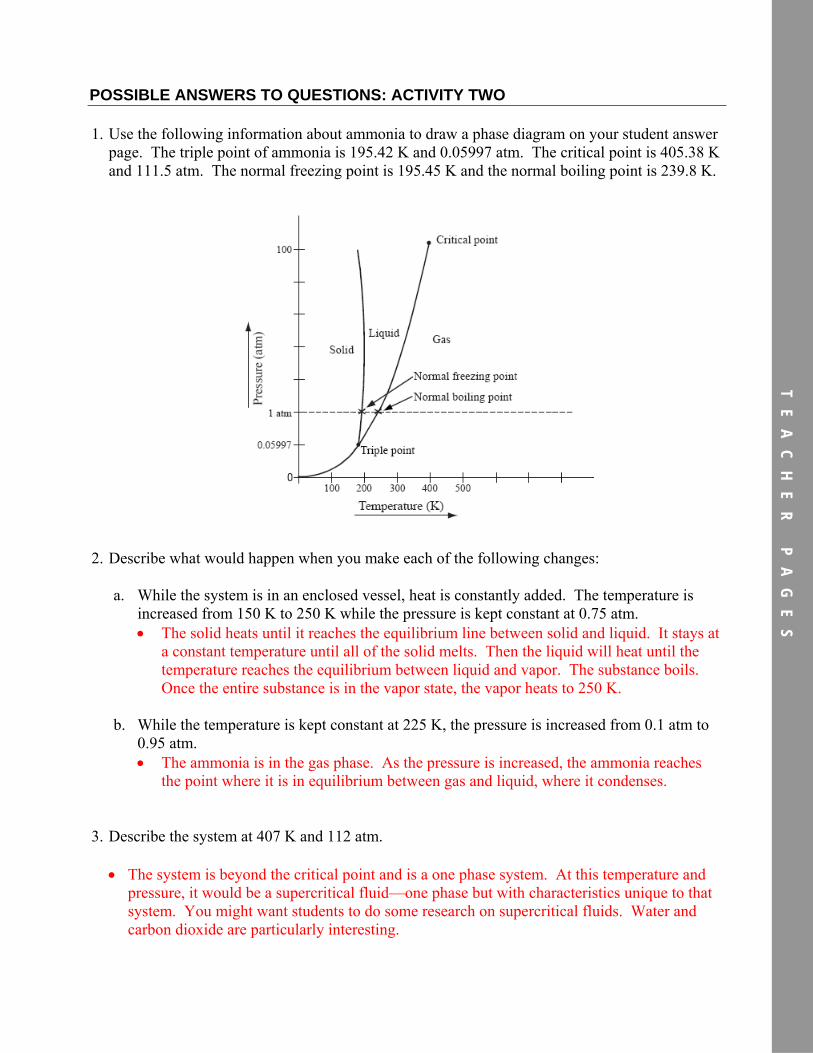
1. Use the following information about ammonia to draw a phase diagram on your student answer page. The triple point of ammonia is 195.42 K and 0.05997 atm. The critical point is 405.38 K and 111.5 atm. The normal freezing point is 195.45 K and the normal boiling point is 239.8 K.
2. Describe what would happen when you make each of the following changes:
a. While the system is in an enclosed vessel, heat is constantly added. The temperature is increased from 150 K to 250 K while the pressure is kept constant at 0.75 atm. The solid heats until it reaches the equilibrium line between solid and liquid. It stays at
a constant temperature until all of the solid melts. Then the liquid will heat until the temperature reaches the equilibrium between liquid and vapor. The substance boils. Once the entire substance is in the vapor state, the vapor heats to 250 K.
b. While the temperature is kept constant at 225 K, the pressure is increased from 0.1 atm to 0.95 atm. The ammonia is in the gas phase. As the pressure is increased, the ammonia reaches
the point where it is in equilibrium between gas and liquid, where it condenses.
3. Describe the system at 407 K and 112 atm.
The system is beyond the critical point and is a one phase system. At this temperature and pressure, it would be a supercritical fluid—one phase but with characteristics unique to that system. You might want students to do some research on supercritical fluids. Water and carbon dioxide are particularly interesting.
TE
AC
HE
R
PA
GE
S
DATA AND OBSERVATIONS: ACTIVITY THREE
1. Download your data from the LabQuest or calculator. Print a copy of the data table and turn it in with the lab. Be sure to print a copy for everyone in your group.
2. Graph temperature vs. time. Title your graph and label the axes. Be sure to include units. Print the graph and turn it in with the lab. Be sure to print a copy for everyone in your group.
TE
AC
HE
R
PA
GE
S
ANALYSIS: ACTIVITY THREE
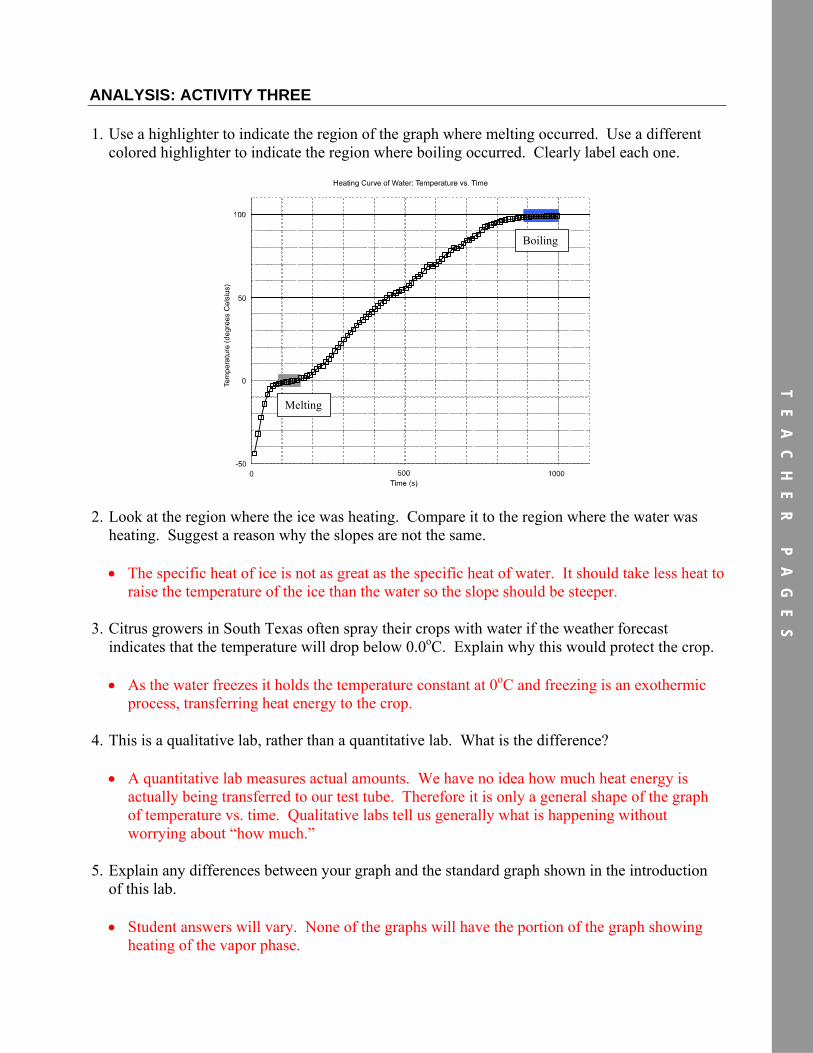
1. Use a highlighter to indicate the region of the graph where melting occurred. Use a different colored highlighter to indicate the region where boiling occurred. Clearly label each one.
Boiling
Melting
2. Look at the region where the ice was heating. Compare it to the region where the water was heating. Suggest a reason why the slopes are not the same.
The specific heat of ice is not as great as the specific heat of water. It should take less heat to raise the temperature of the ice than the water so the slope should be steeper.
3. Citrus growers in South Texas often spray their crops with water if the weather forecast indicates that the temperature will drop below 0.0oC. Explain why this would protect the crop.
As the water freezes it holds the temperature constant at 0oC and freezing is an exothermic process, transferring heat energy to the crop.
4. This is a qualitative lab, rather than a quantitative lab. What is the difference?
A quantitative lab measures actual amounts. We have no idea how much heat energy is actually being transferred to our test tube. Therefore it is only a general shape of the graph of temperature vs. time. Qualitative labs tell us generally what is happening without worrying about “how much.”
5. Explain any differences between your graph and the standard graph shown in the introduction of this lab.
Student answers will vary. None of the graphs will have the portion of the graph showing heating of the vapor phase.
TE
AC
HE
R
PA
GE
S
CONCLUSION QUESTIONS: ACTIVITY THREE
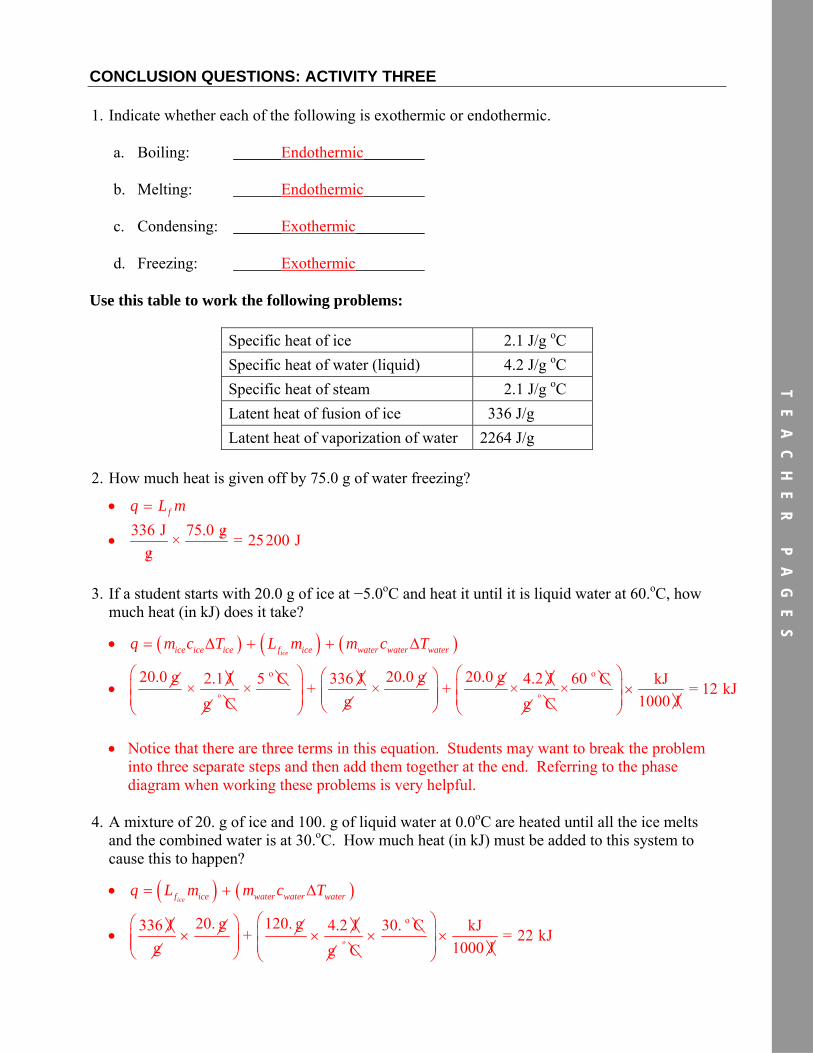
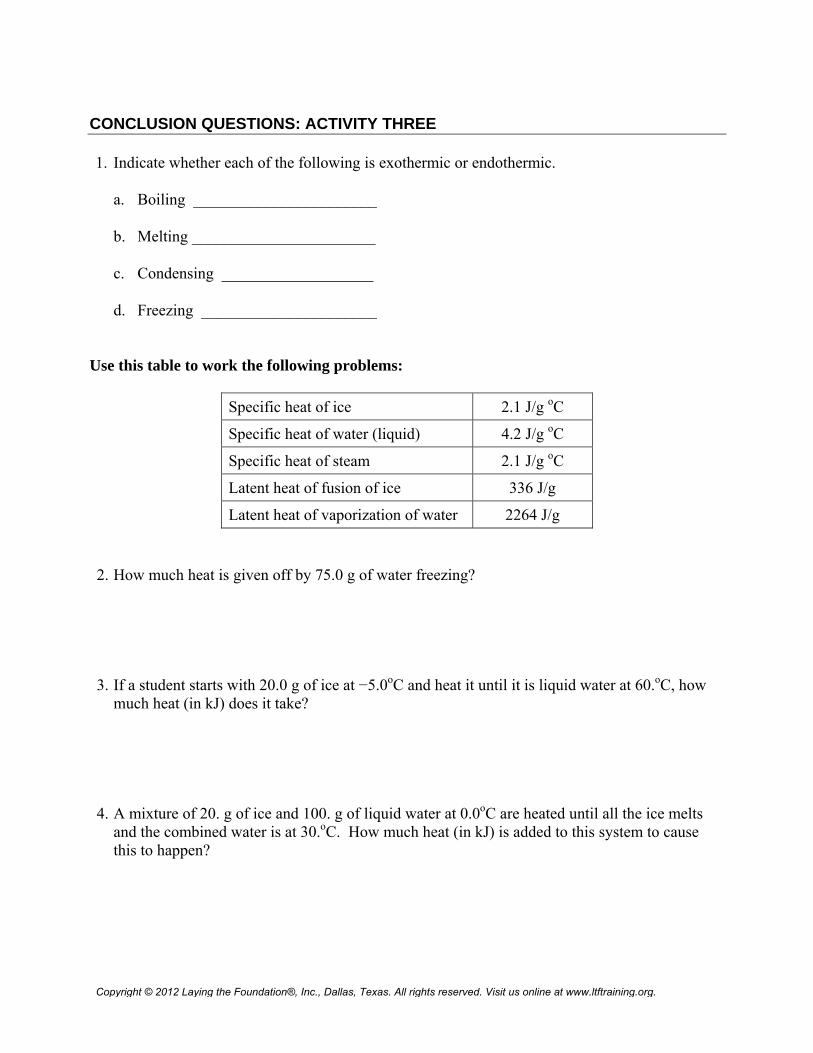
1. Indicate whether each of the following is exothermic or endothermic.
a. Boiling: Endothermic
b. Melting: Endothermic
c. Condensing: Exothermic
d. Freezing: Exothermic
Use this table to work the following problems:
Specific heat of ice 2.1 J/g oC
Specific heat of water (liquid) 4.2 J/g oC
Specific heat of steam 2.1 J/g oC
Latent heat of fusion of ice 336 J/g
Latent heat of vaporization of water 2264 J/g
2. How much heat is given off by 75.0 g of water freezing?
fq L m
336 J 75.0 g
× = 25200 Jg
3. If a student starts with 20.0 g of ice at −5.0oC and heat it until it is liquid water at 60.oC, how much heat (in kJ) does it take?
iceice ice ice f ice water water waterq m c T L m m c T
o o
o o20.0 g 20.0 g 20.0 g2.1 J 5 C 336 J 4.2 J 60 C kJ× × + × + × × = 12 kJ
g 1000 Jg C g C
Notice that there are three terms in this equation. Students may want to break the problem into three separate steps and then add them together at the end. Referring to the phase diagram when working these problems is very helpful.
4. A mixture of 20. g of ice and 100. g of liquid water at 0.0oC are heated until all the ice melts and the combined water is at 30.oC. How much heat (in kJ) must be added to this system to cause this to happen?
icef ice water water waterq L m m c T
o
o20. g 120. g336 J 4.2 J 30. C kJ+ = 22 kJ
g 1000 Jg C
TE
AC
HE
R
PA
GE
S
Heating Curves and Phase Diagrams Investigating Changes of State
ACTIVITY ONE: EQUILIBRIUM VAPOR PRESSURES Everyone knows that if you leave an open beaker of water out in the room for a period of time, the water will evaporate. However, if you place a tight cover on the beaker, the water will still be there several weeks later. Is there anything happening in the covered beaker? Actually, some of the water will evaporate and some will condense. After putting the lid on the system, the system will reach equilibrium between the number of water molecules that are in the liquid state, and the number of water molecules that are in the vapor state. Chemists would express what is occurring like this:
water(l) water(g)
The double arrow indicates that the reaction is going forward and backward at the same rate. It does not indicate that there is the same number of molecules in the liquid state as there are in the vapor state. This is called equilibrium and it is referred to as dynamic equilibrium because the molecules are constantly changing places even though there is no net change in the number of molecules in each phase.
Because some of the molecules are in the gas phase, they exert a vapor pressure. This is called the equilibrium vapor pressure and it is temperature dependent. That is to say that, if we increase the temperature, more of the molecules will go into the vapor phase and a new equilibrium will be established at a new temperature. All liquids (and some solids) have a vapor pressure. During this first activity, you will use your calculator to graph the equilibrium vapor pressures of some substances other than water and then use your graph to answer questions about the liquids.
PURPOSE: ACTIVITY ONE In this activity you will graph equilibrium vapor pressure versus temperature and interpret the graph.
MATERIALS
graphing calculator paper/pencil
Copyright © 2012 Laying the Foundation®, Inc., Dallas, Texas. All rights reserved. Visit us online at www.ltftraining.org.
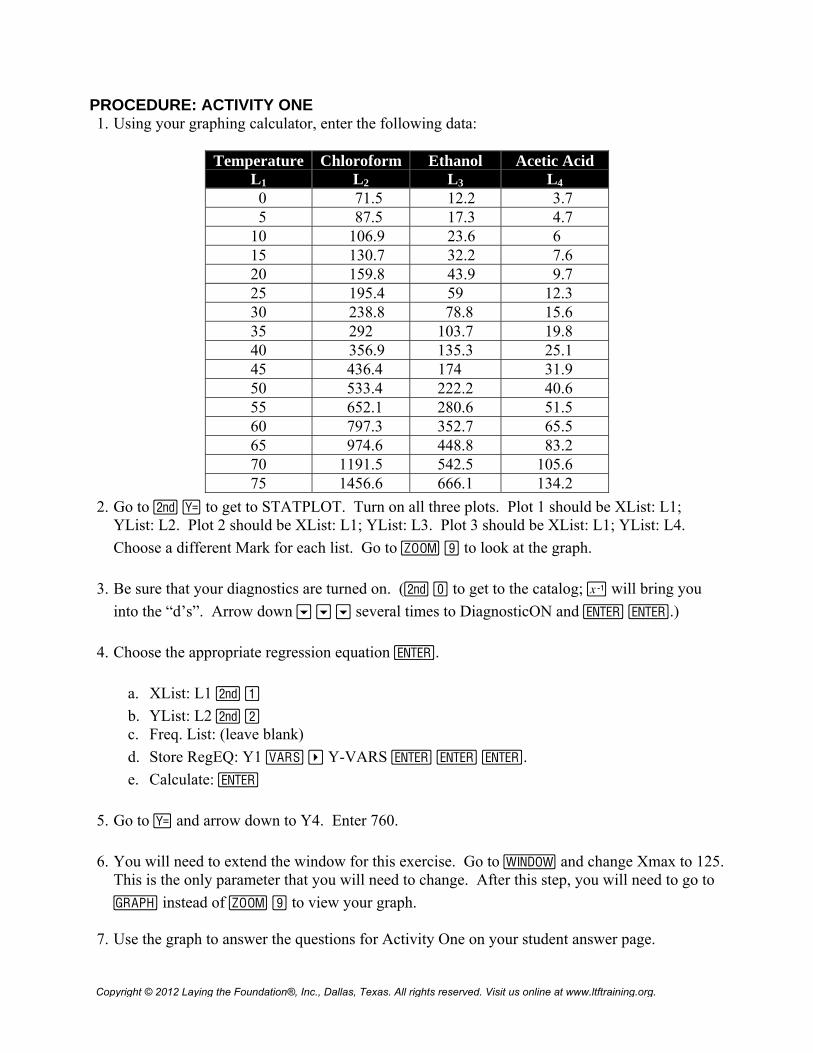
PROCEDURE: ACTIVITY ONE 1. Using your graphing calculator, enter the following data:
Temperature
L1 Chloroform
L2 Ethanol
L3 Acetic Acid
L4 0 71.5 12.2 3.7 5 87.5 17.3 4.7 10 106.9 23.6 6 15 130.7 32.2 7.6 20 159.8 43.9 9.7 25 195.4 59 12.3 30 238.8 78.8 15.6 35 292 103.7 19.8 40 356.9 135.3 25.1 45 436.4 174 31.9 50 533.4 222.2 40.6 55 652.1 280.6 51.5 60 797.3 352.7 65.5 65 974.6 448.8 83.2 70 1191.5 542.5 105.6 75 1456.6 666.1 134.2
2. Go to y o to get to STATPLOT. Turn on all three plots. Plot 1 should be XList: L1; YList: L2. Plot 2 should be XList: L1; YList: L3. Plot 3 should be XList: L1; YList: L4.
Choose a different Mark for each list. Go to q ® to look at the graph.
3. Be sure that your diagnostics are turned on. (y Ê to get to the catalog; — will bring you
into the “d’s”. Arrow down † † † several times to DiagnosticON and Í Í.)
4. Choose the appropriate regression equation Í.
a. XList: L1 y À
b. YList: L2 y Á c. Freq. List: (leave blank)
d. Store RegEQ: Y1 ~ Y-VARS Í Í Í.
e. Calculate: Í
5. Go to o and arrow down to Y4. Enter 760.
6. You will need to extend the window for this exercise. Go to p and change Xmax to 125. This is the only parameter that you will need to change. After this step, you will need to go to
s instead of q ® to view your graph. 7. Use the graph to answer the questions for Activity One on your student answer page.
Copyright © 2012 Laying the Foundation®, Inc., Dallas, Texas. All rights reserved. Visit us online at www.ltftraining.org.
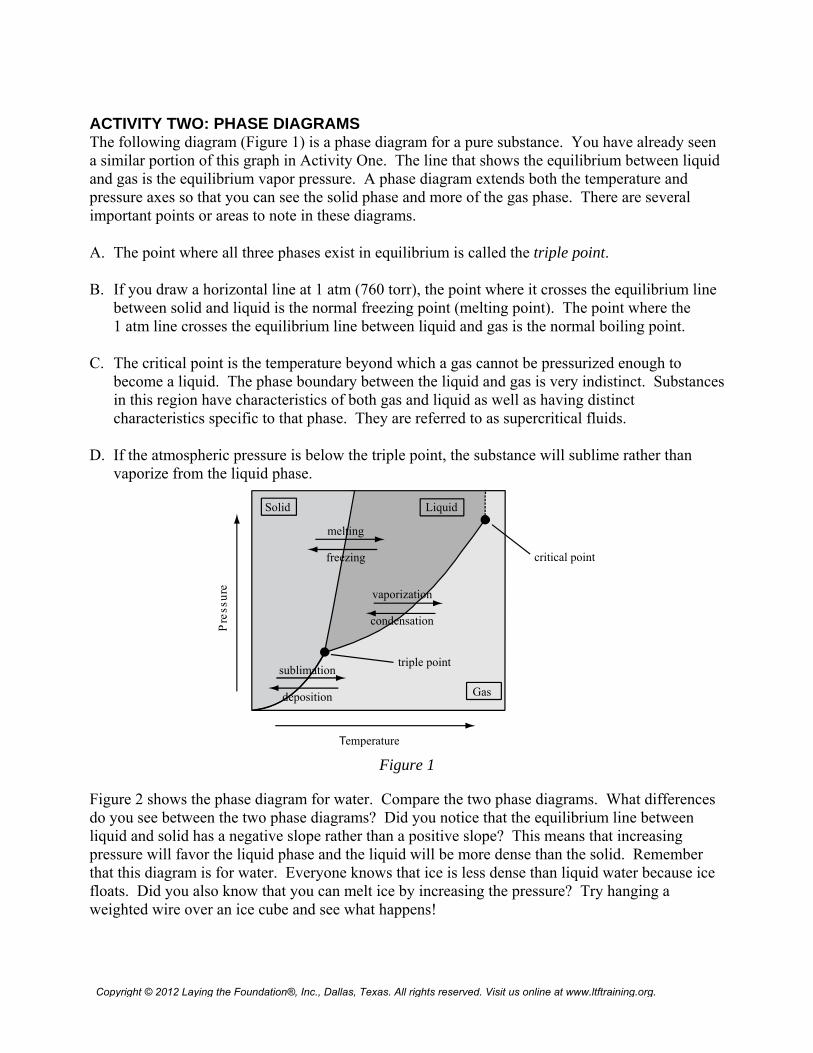
ACTIVITY TWO: PHASE DIAGRAMS The following diagram (Figure 1) is a phase diagram for a pure substance. You have already seen a similar portion of this graph in Activity One. The line that shows the equilibrium between liquid and gas is the equilibrium vapor pressure. A phase diagram extends both the temperature and pressure axes so that you can see the solid phase and more of the gas phase. There are several important points or areas to note in these diagrams.
A. The point where all three phases exist in equilibrium is called the triple point.
B. If you draw a horizontal line at 1 atm (760 torr), the point where it crosses the equilibrium line between solid and liquid is the normal freezing point (melting point). The point where the 1 atm line crosses the equilibrium line between liquid and gas is the normal boiling point.
C. The critical point is the temperature beyond which a gas cannot be pressurized enough to become a liquid. The phase boundary between the liquid and gas is very indistinct. Substances in this region have characteristics of both gas and liquid as well as having distinct characteristics specific to that phase. They are referred to as supercritical fluids.
D. If the atmospheric pressure is below the triple point, the substance will sublime rather than vaporize from the liquid phase.
Solid Liquid
Gas
triple point
melting
freezing
vaporization
condensation
sublimation
deposition
critical point
Temperature
Pre
ssur
e
Figure 1
Figure 2 shows the phase diagram for water. Compare the two phase diagrams. What differences do you see between the two phase diagrams? Did you notice that the equilibrium line between liquid and solid has a negative slope rather than a positive slope? This means that increasing pressure will favor the liquid phase and the liquid will be more dense than the solid. Remember that this diagram is for water. Everyone knows that ice is less dense than liquid water because ice floats. Did you also know that you can melt ice by increasing the pressure? Try hanging a weighted wire over an ice cube and see what happens!
Copyright © 2012 Laying the Foundation®, Inc., Dallas, Texas. All rights reserved. Visit us online at www.ltftraining.org.
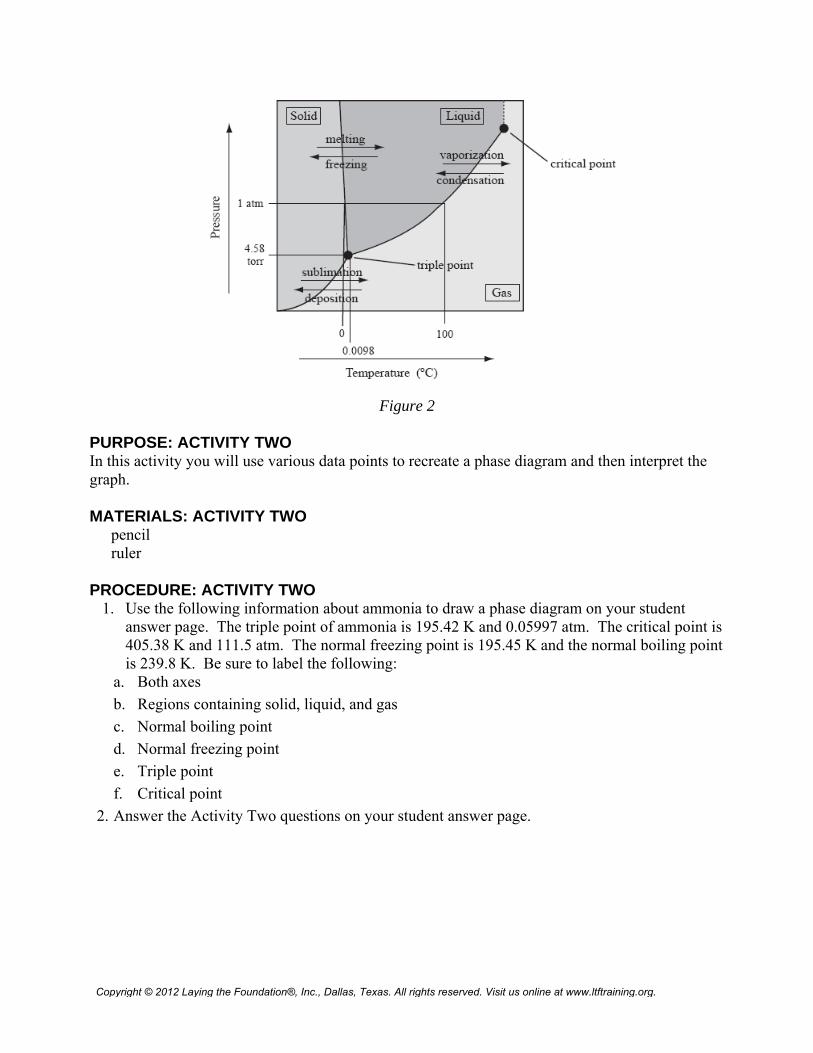
Figure 2
PURPOSE: ACTIVITY TWO In this activity you will use various data points to recreate a phase diagram and then interpret the graph.
MATERIALS: ACTIVITY TWO
PROCEDURE: ACTIVITY TWO 1. Use the following information about ammonia to draw a phase diagram on your student
answer page. The triple point of ammonia is 195.42 K and 0.05997 atm. The critical point is 405.38 K and 111.5 atm. The normal freezing point is 195.45 K and the normal boiling point is 239.8 K. Be sure to label the following:
a. Both axes
b. Regions containing solid, liquid, and gas
c. Normal boiling point
d. Normal freezing point
e. Triple point
f. Critical point
2. Answer the Activity Two questions on your student answer page.
pencil ruler
Copyright © 2012 Laying the Foundation®, Inc., Dallas, Texas. All rights reserved. Visit us online at www.ltftraining.org.
ACTIVITY THREE: HEATING CURVES Most pure substances exist in three phases: solid, liquid, and gas. However, the temperature ranges necessary to view all three phases is often very great. Water exists in all three states at temperature ranges that are common to our everyday experience.
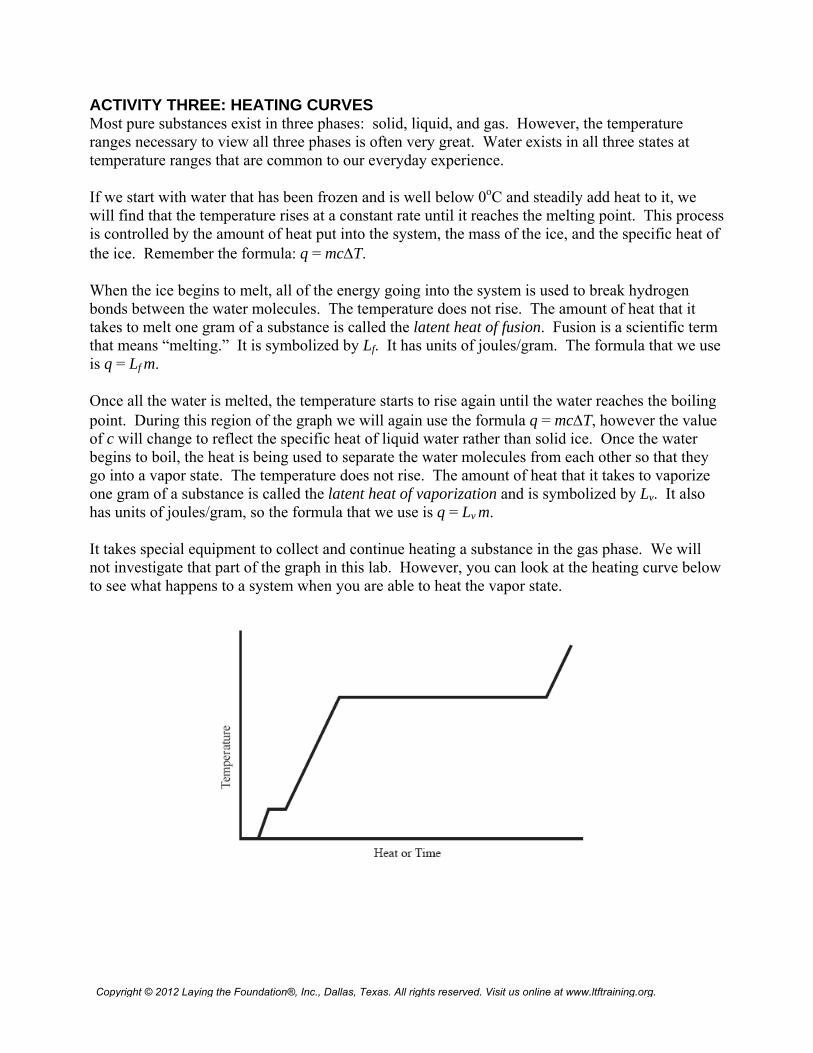
If we start with water that has been frozen and is well below 0oC and steadily add heat to it, we will find that the temperature rises at a constant rate until it reaches the melting point. This process is controlled by the amount of heat put into the system, the mass of the ice, and the specific heat of the ice. Remember the formula: q = mcT.
When the ice begins to melt, all of the energy going into the system is used to break hydrogen bonds between the water molecules. The temperature does not rise. The amount of heat that it takes to melt one gram of a substance is called the latent heat of fusion. Fusion is a scientific term that means “melting.” It is symbolized by Lf. It has units of joules/gram. The formula that we use is q = Lf m.
Once all the water is melted, the temperature starts to rise again until the water reaches the boiling point. During this region of the graph we will again use the formula q = mcT, however the value of c will change to reflect the specific heat of liquid water rather than solid ice. Once the water begins to boil, the heat is being used to separate the water molecules from each other so that they go into a vapor state. The temperature does not rise. The amount of heat that it takes to vaporize one gram of a substance is called the latent heat of vaporization and is symbolized by Lv. It also has units of joules/gram, so the formula that we use is q = Lv m.
It takes special equipment to collect and continue heating a substance in the gas phase. We will not investigate that part of the graph in this lab. However, you can look at the heating curve below to see what happens to a system when you are able to heat the vapor state.
Copyright © 2012 Laying the Foundation®, Inc., Dallas, Texas. All rights reserved. Visit us online at www.ltftraining.org.
PURPOSE: ACTIVITY THREE In this activity you will start with ice that is well below the freezing point and continuously add heat to the system while collecting data with a temperature probe. The resulting heating curve will be downloaded to a computer to be analyzed and printed.
MATERIALS
PRE-LAB: ACTIVITY THREE 1. Define the terms found on your student answer page.
2. Carefully read the lab procedure. Examine the heating curve included.
3. Answer the pre-lab questions.
PROCEDURE: ACTIVITY THREE 4. Set up a hot plate with a ring stand and ring. Fill the 600 mL beaker ¾ full of water. Use the
ring to steady the beaker so that it cannot tip over. Using a LabQuest :
1. Obtain the temperature probe that has been frozen in a test tube of water from your teacher. Do not touch the test tube with your bare hands. It has been sitting in a slurry of dry ice and acetone and will begin at a temperature near −78oC. This temperature is cold enough to give you frostbite. Set the temperature probe on the counter while you set up the LabQuest.
2. Connect the stainless steel temperature probe to Channel 1 of the LabQuest. Turn on the LabQuest.
3. To set up the LabQuest: a. Choose (tap on) the Mode: Time Based box from the initial screen. b. Change the ‘Timing’ to 0.1 samples/s for 1000 s. To do so:
ring stand TI-83+ or TI-84+ calculator and 600-mL beaker ¾ filled with distilled water LabPro® with link cord, or LabQuest ring large enough to support the beaker computer with TI Connect and GraphLink hot plate computer graphing software highlighters or markers of various colors printer for computer 1 frozen temperature probe, from teacher
Safety Alert 1. Wear your goggles. 2. The test tubes containing the probes are very cold. Do not handle with your bare hands. 3. Be very careful that the temperature probe cords do not touch the hot plates.
Copyright © 2012 Laying the Foundation®, Inc., Dallas, Texas. All rights reserved. Visit us online at www.ltftraining.org.
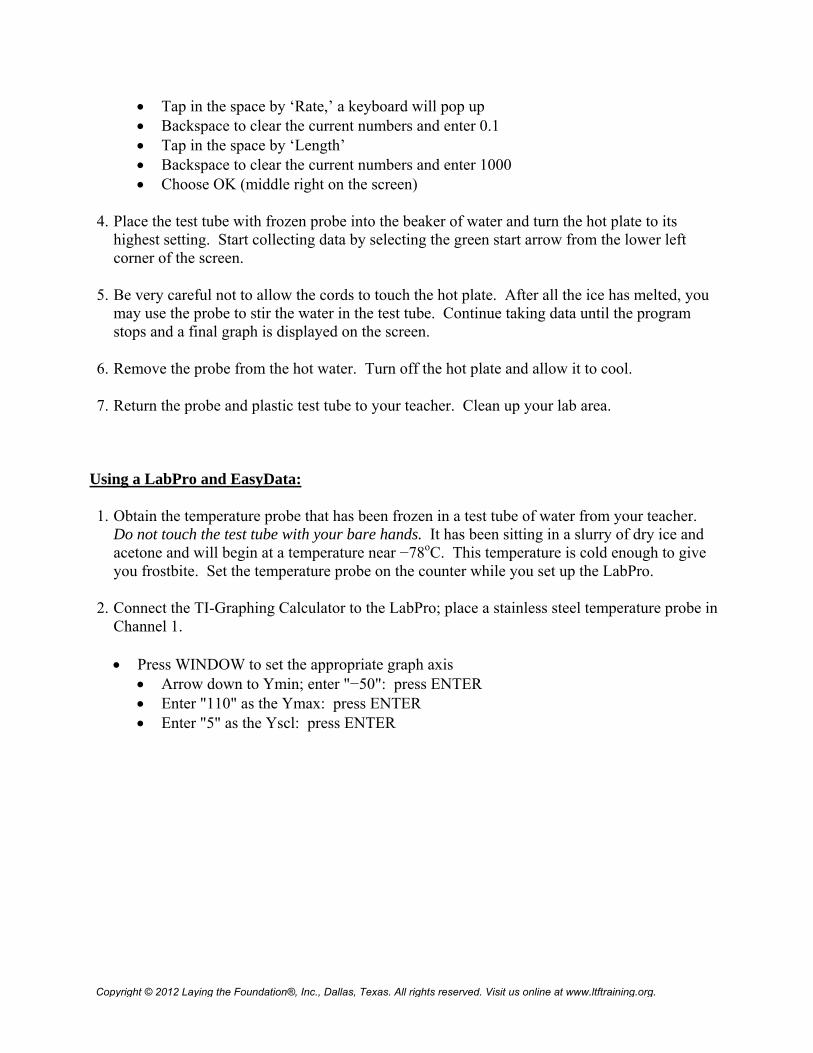
Tap in the space by ‘Rate,’ a keyboard will pop up Backspace to clear the current numbers and enter 0.1 Tap in the space by ‘Length’ Backspace to clear the current numbers and enter 1000 Choose OK (middle right on the screen)
4. Place the test tube with frozen probe into the beaker of water and turn the hot plate to its highest setting. Start collecting data by selecting the green start arrow from the lower left corner of the screen.
5. Be very careful not to allow the cords to touch the hot plate. After all the ice has melted, you may use the probe to stir the water in the test tube. Continue taking data until the program stops and a final graph is displayed on the screen.
6. Remove the probe from the hot water. Turn off the hot plate and allow it to cool.
7. Return the probe and plastic test tube to your teacher. Clean up your lab area. Using a LabPro and EasyData:
1. Obtain the temperature probe that has been frozen in a test tube of water from your teacher. Do not touch the test tube with your bare hands. It has been sitting in a slurry of dry ice and acetone and will begin at a temperature near −78oC. This temperature is cold enough to give you frostbite. Set the temperature probe on the counter while you set up the LabPro.
2. Connect the TI-Graphing Calculator to the LabPro; place a stainless steel temperature probe in Channel 1.
Press WINDOW to set the appropriate graph axis Arrow down to Ymin; enter "−50": press ENTER Enter "110" as the Ymax: press ENTER Enter "5" as the Yscl: press ENTER
Copyright © 2012 Laying the Foundation®, Inc., Dallas, Texas. All rights reserved. Visit us online at www.ltftraining.org.
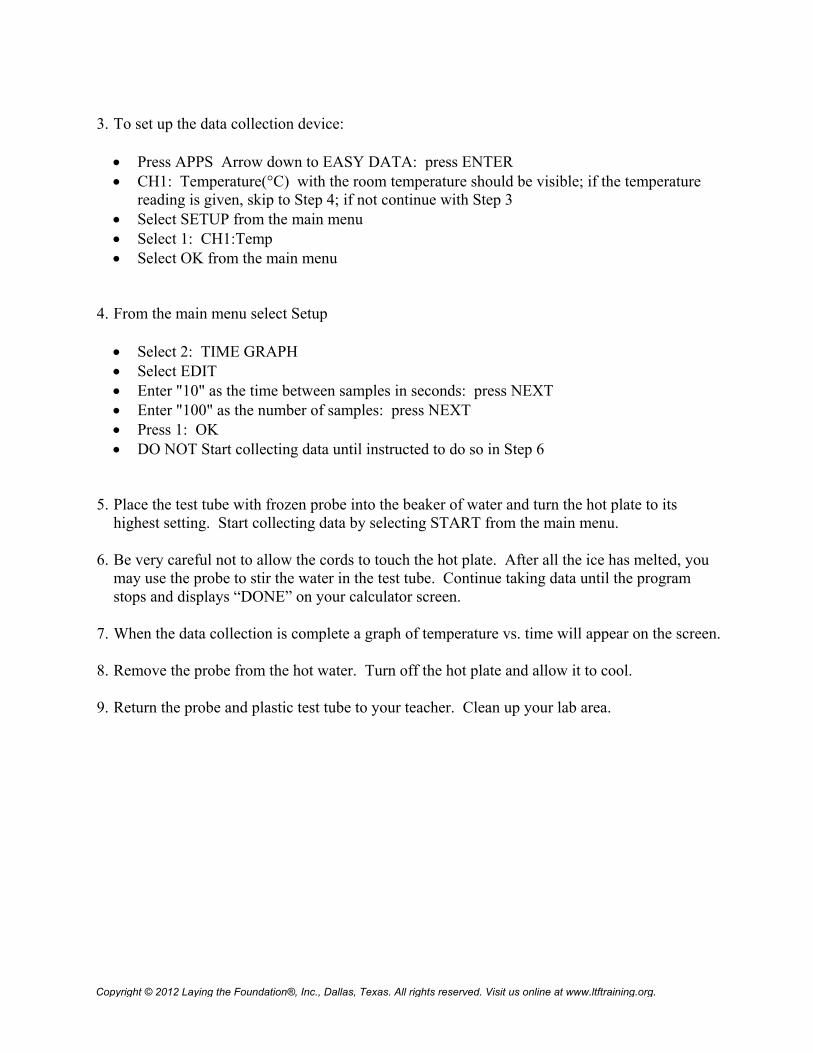
3. To set up the data collection device:
Press APPS Arrow down to EASY DATA: press ENTER CH1: Temperature(°C) with the room temperature should be visible; if the temperature
reading is given, skip to Step 4; if not continue with Step 3 Select SETUP from the main menu Select 1: CH1:Temp Select OK from the main menu
4. From the main menu select Setup
Select 2: TIME GRAPH Select EDIT Enter "10" as the time between samples in seconds: press NEXT Enter "100" as the number of samples: press NEXT Press 1: OK DO NOT Start collecting data until instructed to do so in Step 6
5. Place the test tube with frozen probe into the beaker of water and turn the hot plate to its highest setting. Start collecting data by selecting START from the main menu.
6. Be very careful not to allow the cords to touch the hot plate. After all the ice has melted, you may use the probe to stir the water in the test tube. Continue taking data until the program stops and displays “DONE” on your calculator screen.
7. When the data collection is complete a graph of temperature vs. time will appear on the screen.
8. Remove the probe from the hot water. Turn off the hot plate and allow it to cool.
9. Return the probe and plastic test tube to your teacher. Clean up your lab area.
Copyright © 2012 Laying the Foundation®, Inc., Dallas, Texas. All rights reserved. Visit us online at www.ltftraining.org.
PRE-LAB
1. Define the following terms:
a. Endothermic
b. Exothermic
c. Potential energy
d. Kinetic energy
e. Specific heat
f. Latent heat of fusion
g. Fusion
h. Latent heat of vaporization
i. Vaporizing
j. Melting
k. Freezing
l. Boiling
m. Condensing
Copyright © 2012 Laying the Foundation®, Inc., Dallas, Texas. All rights reserved. Visit us online at www.ltftraining.org.
2. Since we are continuously adding heat energy to this system, what is happening to that heat when the ice is melting? What type of energy is this?
3. In a cooking class, a teacher told the class to bring the water to a boil and allow it to boil for
5 minutes so that it would be “good and hot.” What is wrong with this statement? 4. You have been given a picture of a theoretical heating curve for water. After reading the lab,
sketch a picture of the heating curve which you expect to get with this lab.
Copyright © 2012 Laying the Foundation®, Inc., Dallas, Texas. All rights reserved. Visit us online at www.ltftraining.org.
DATA AND OBSERVATIONS: ACTIVITY ONE Draw a rough sketch of the graph that is on your calculator.
QUESTIONS: ACTIVITY ONE
1. What does the horizontal line in Y4 represent? 2. Why do you think that the vapor pressure vs. temperature graph is not a linear relationship?
Copyright © 2012 Laying the Foundation®, Inc., Dallas, Texas. All rights reserved. Visit us online at www.ltftraining.org.
3. Which substance has the strongest intermolecular forces? Explain your answer.
4. Use your graph to determine the normal boiling point for
a. Chloroform
b. Ethanol
c. Acetic acid
5. At 60oC, which substance has the highest vapor pressure? 6. If the pressure were dropped to 600 torr, what would be the boiling temperature of ethanol?
7. If the pressure were dropped to 275 torr, which substance(s) would be boiling at or below
55oC?
Copyright © 2012 Laying the Foundation®, Inc., Dallas, Texas. All rights reserved. Visit us online at www.ltftraining.org.
QUESTIONS: ACTIVITY TWO
1. Phase diagram
2. Describe what would happen when you make each of the following changes: a. While the system is in an enclosed vessel, heat is constantly added. The temperature is
increased from 150 K to 250 K while the pressure is kept constant at 0.75 atm.
b. While the temperature is kept constant at 225 K, the pressure is increased from 0.1 atm to 0.95 atm.
3. Describe the system at 407 K and 112 atm.
Copyright © 2012 Laying the Foundation®, Inc., Dallas, Texas. All rights reserved. Visit us online at www.ltftraining.org.
DATA AND OBSERVATIONS: ACTIVITY THREE
1. Download your data from the LabQuest or calculator. Print a copy of the data table and turn it in with the lab. Be sure to print a copy for everyone in your group.
2. Graph temperature vs. time. Title your graph and label the axes. Be sure to include units.
Print the graph and turn it in with the lab. Be sure to print a copy for everyone in your group.
Copyright © 2012 Laying the Foundation®, Inc., Dallas, Texas. All rights reserved. Visit us online at www.ltftraining.org.
ANALYSIS: ACTIVITY THREE
1. Use a highlighter to indicate the region of the graph where melting occurred. Use a different colored highlighter to indicate the region where boiling occurred. Clearly label each one.
2. Look at the region where the ice was heating. Compare it to the region where the water was
heating. Suggest a reason why the slopes are not the same. 3. Citrus growers in South Texas often spray their crops with water if the weather forecast
indicates that the temperature will drop below 0.0oC. Explain why this would protect the crop. 4. This is a qualitative lab, rather than a quantitative lab. What is the difference?
5. Explain any differences between your graph and the standard graph shown in the introduction
of this lab.
Copyright © 2012 Laying the Foundation®, Inc., Dallas, Texas. All rights reserved. Visit us online at www.ltftraining.org.
CONCLUSION QUESTIONS: ACTIVITY THREE
1. Indicate whether each of the following is exothermic or endothermic.
a. Boiling _______________________
b. Melting _______________________
c. Condensing ___________________
d. Freezing ______________________ Use this table to work the following problems:
Specific heat of ice 2.1 J/g oC
Specific heat of water (liquid) 4.2 J/g oC
Specific heat of steam 2.1 J/g oC
Latent heat of fusion of ice 336 J/g
Latent heat of vaporization of water 2264 J/g
2. How much heat is given off by 75.0 g of water freezing? 3. If a student starts with 20.0 g of ice at −5.0oC and heat it until it is liquid water at 60.oC, how
much heat (in kJ) does it take? 4. A mixture of 20. g of ice and 100. g of liquid water at 0.0oC are heated until all the ice melts
and the combined water is at 30.oC. How much heat (in kJ) is added to this system to cause this to happen?
Copyright © 2012 Laying the Foundation®, Inc., Dallas, Texas. All rights reserved. Visit us online at www.ltftraining.org.