Embed Size (px)
Citation preview
C S E
USC
Quality Management – Lessons of
COQUALMO
(COnstructive QUALity MOdel)A Software Defect Density Prediction Model
Copyright 1999-2007 USC-CSSE 1
AWBrown and Sunita Chulani, Ph.D.
{AWBrown, sdevnani}@CSSE.usc.edu}
USC-Center for Systems & Software Engineering (USC-CSSE)
C S E
USC
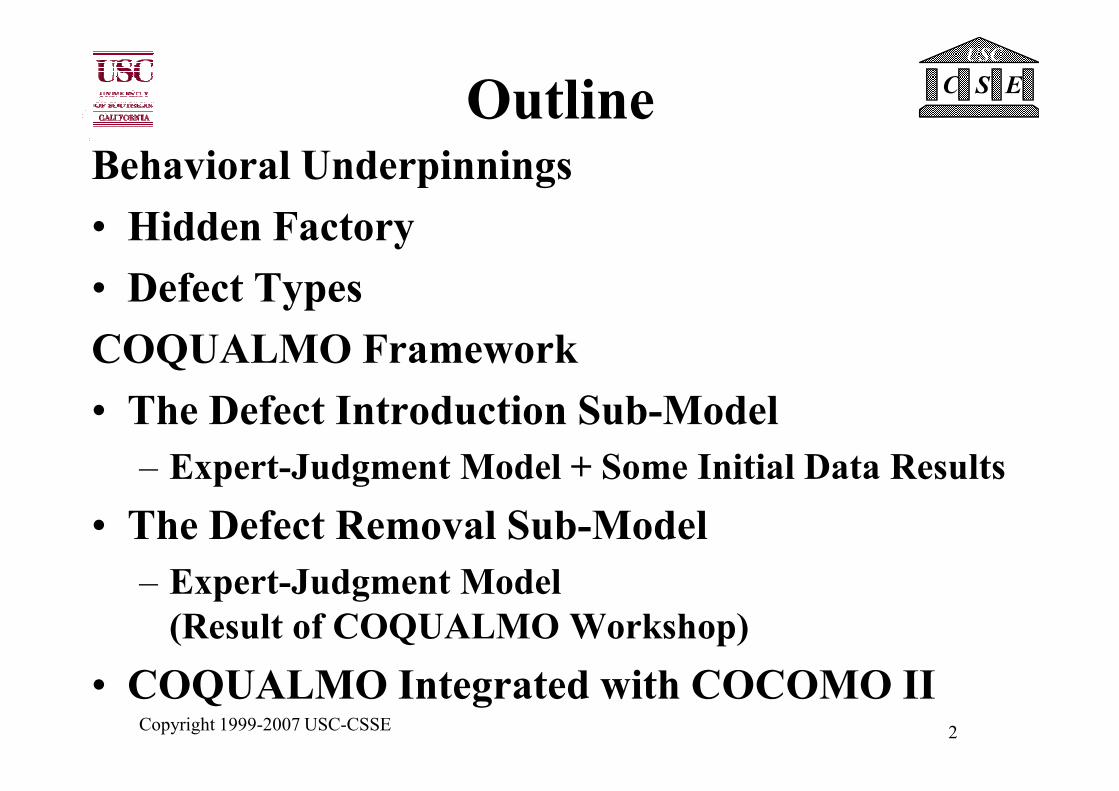
OutlineBehavioral Underpinnings
• Hidden Factory
• Defect Types
COQUALMO Framework
• The Defect Introduction Sub-Model
Copyright 1999-2007 USC-CSSE 2
• The Defect Introduction Sub-Model
– Expert-Judgment Model + Some Initial Data Results
• The Defect Removal Sub-Model
– Expert-Judgment Model
(Result of COQUALMO Workshop)
• COQUALMO Integrated with COCOMO II
C S E
USC
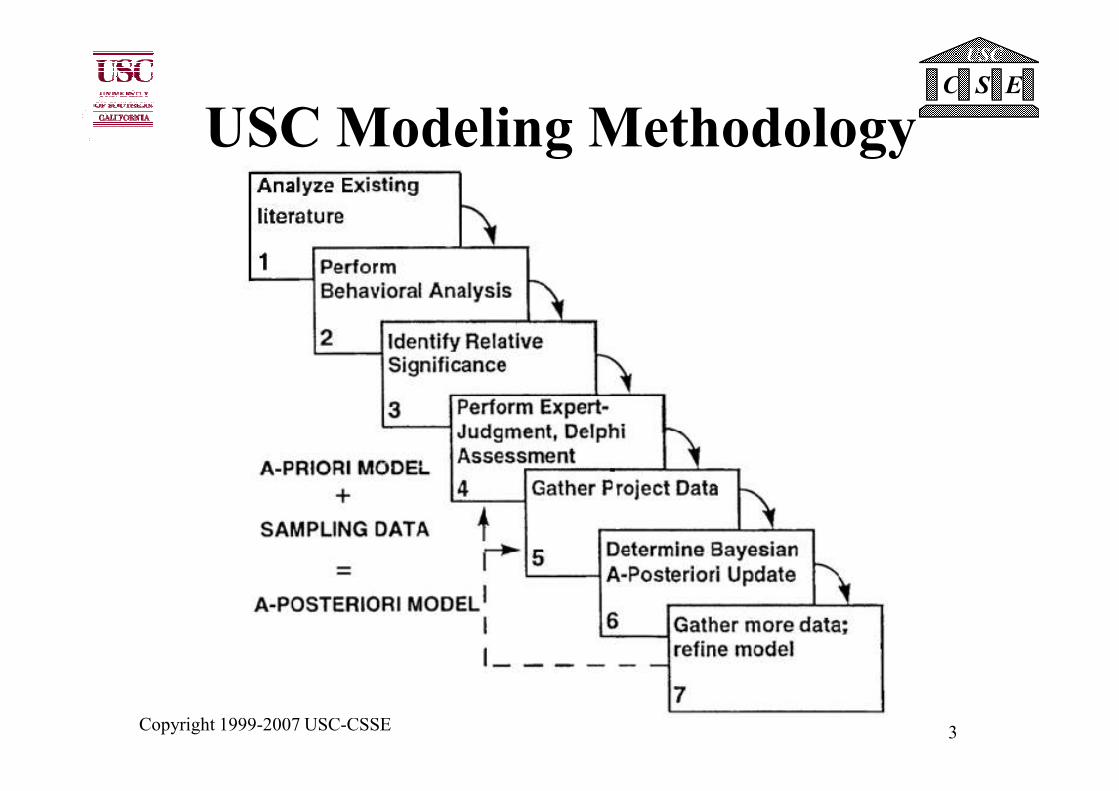
USC Modeling Methodology
Copyright 1999-2007 USC-CSSE 3
C S E
USC
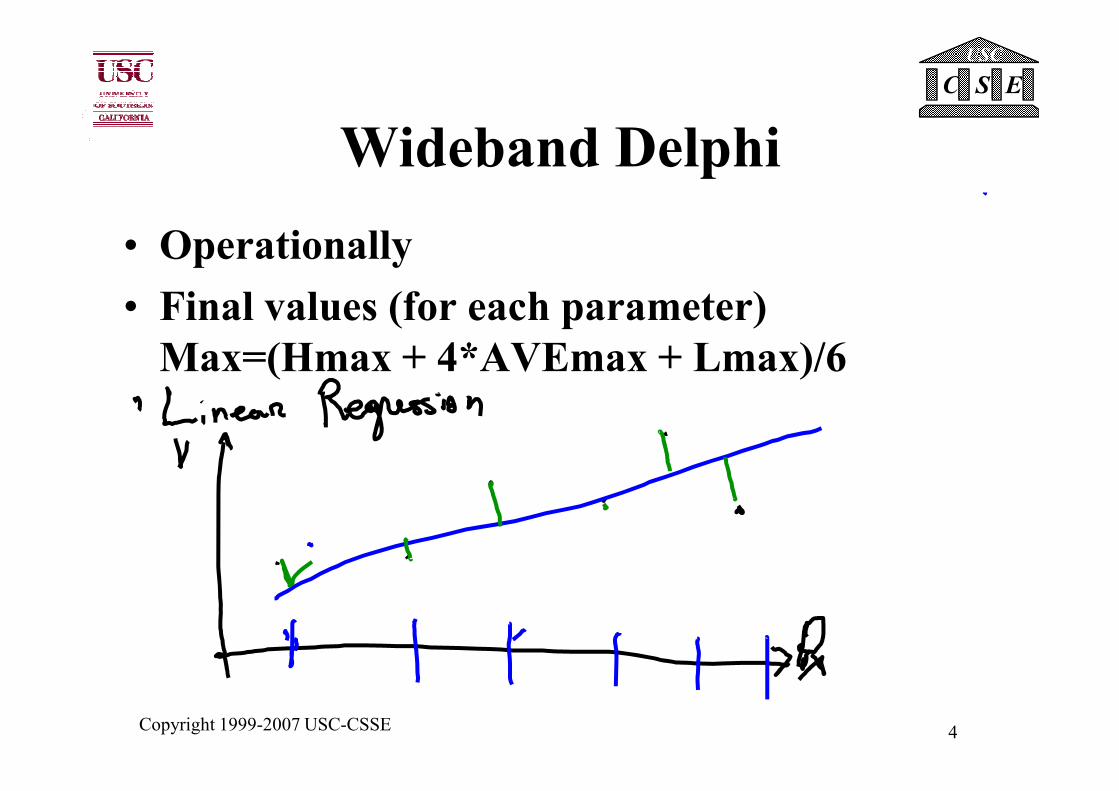
Wideband Delphi
• Operationally
• Final values (for each parameter)
Max=(Hmax + 4*AVEmax + Lmax)/6
Copyright 1999-2007 USC-CSSE 4
C S E
USC
Fig 11., Pg 170 SwCEwCII
Copyright 1999-2007 USC-CSSE 5
C S E
USC
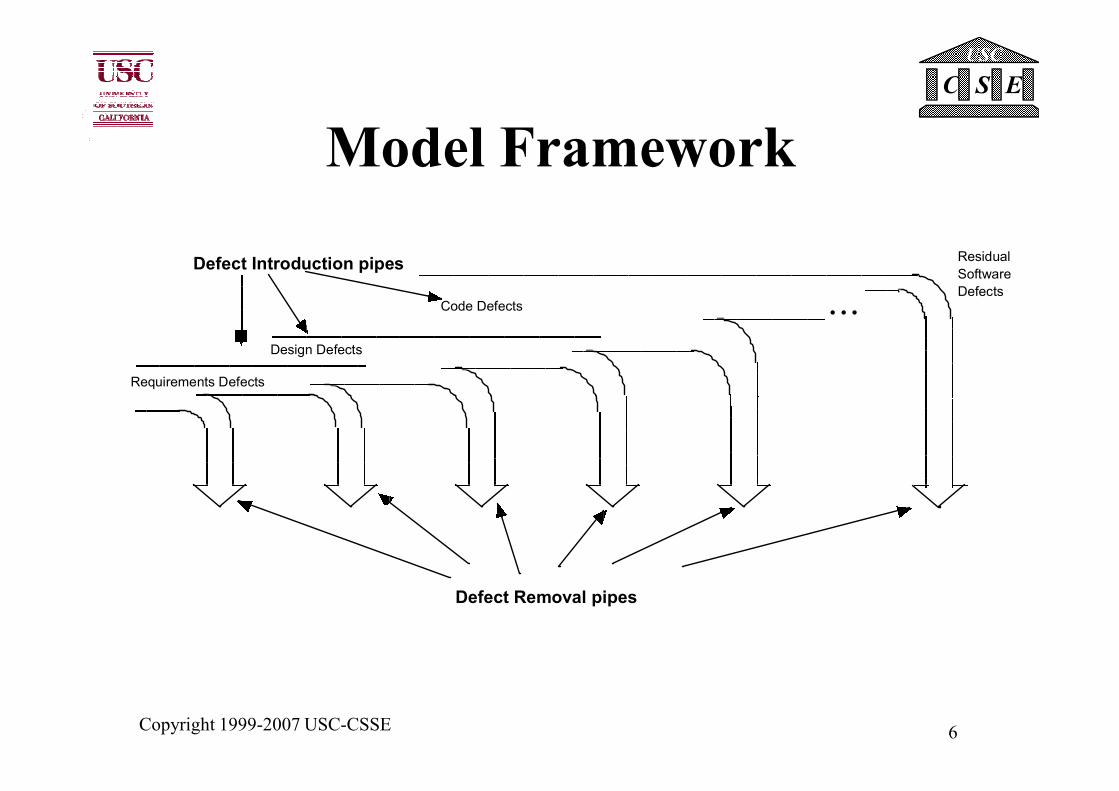
Model Framework
• • •
Residual
Software
DefectsCode Defects
Requirements Defects
Design Defects
Defect Introduction pipes
Copyright 1999-2007 USC-CSSE 6
Defect Removal pipes
C S E
USC
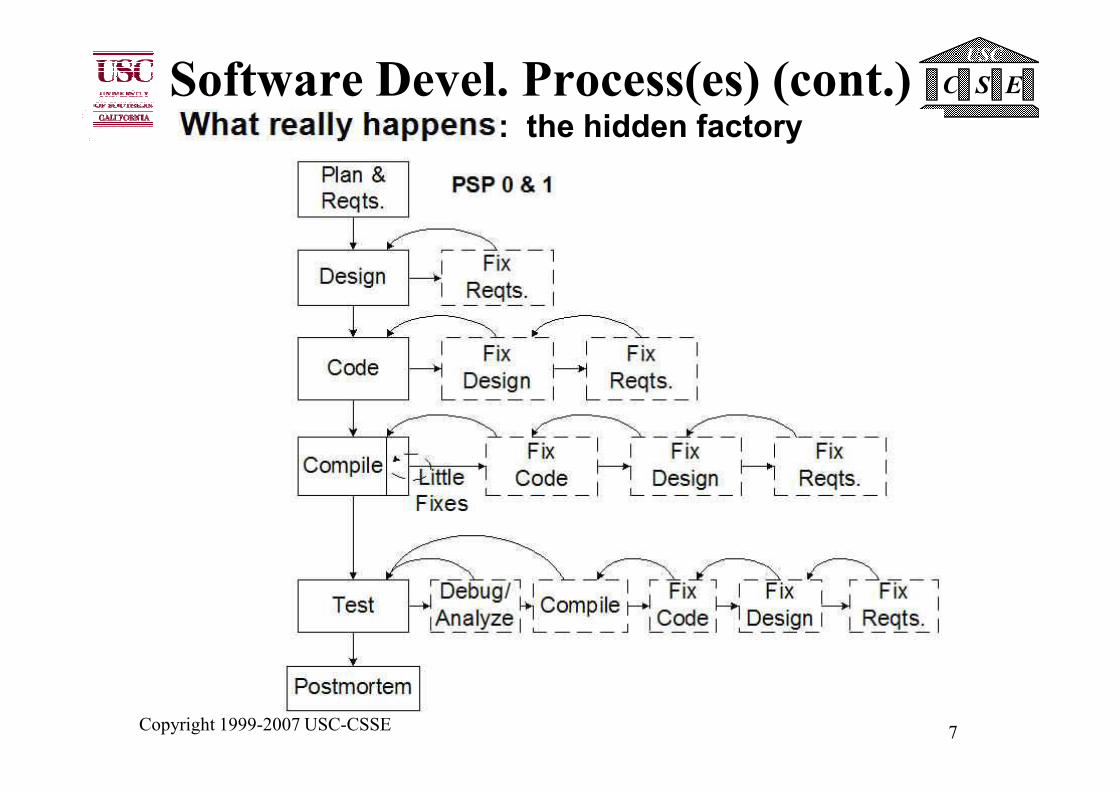
Software Devel. Process(es) (cont.): the hidden factory
Copyright 1999-2007 USC-CSSE 7
C S E
USC
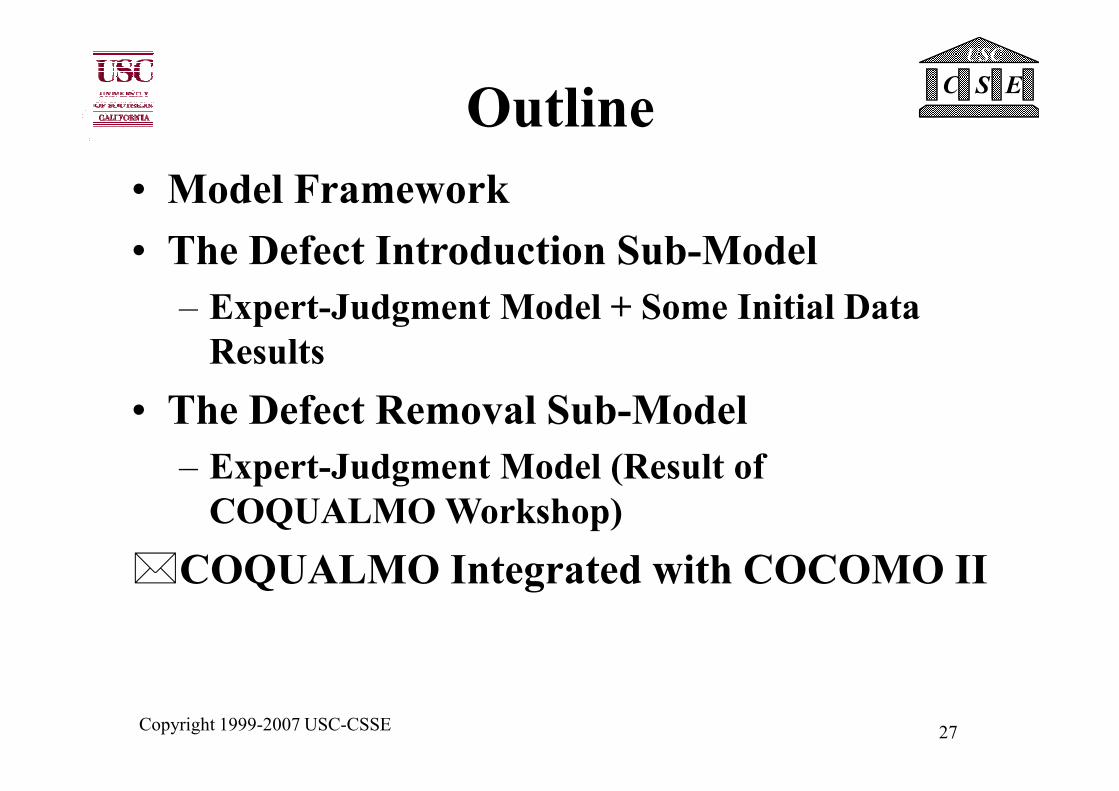
Outline
• Model Framework
�The Defect Introduction Sub-Model
– Expert-Judgment Model + Some Initial Data
Results
• The Defect Removal Sub-Model
Copyright 1999-2007 USC-CSSE 8
• The Defect Removal Sub-Model
– Expert-Judgment Model (Result of
COQUALMO Workshop)
• COQUALMO Integrated with COCOMO II
• Future Plans
– Call for Data
C S E
USC
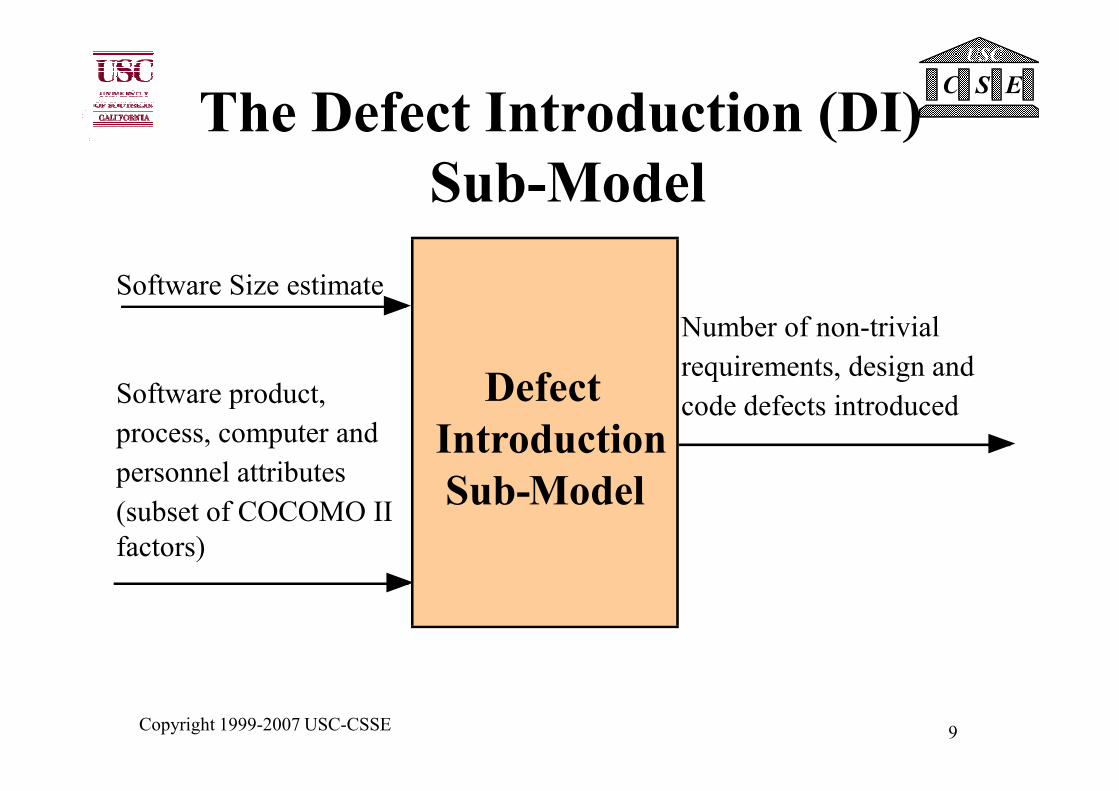
The Defect Introduction (DI)
Sub-Model
Software Size estimate
Software product, Defect
Number of non-trivial
requirements, design and
code defects introduced
Copyright 1999-2007 USC-CSSE 9
Software product,
process, computer and
personnel attributes
(subset of COCOMO II
factors)
Defect
Introduction
Sub-Model
code defects introduced
C S E
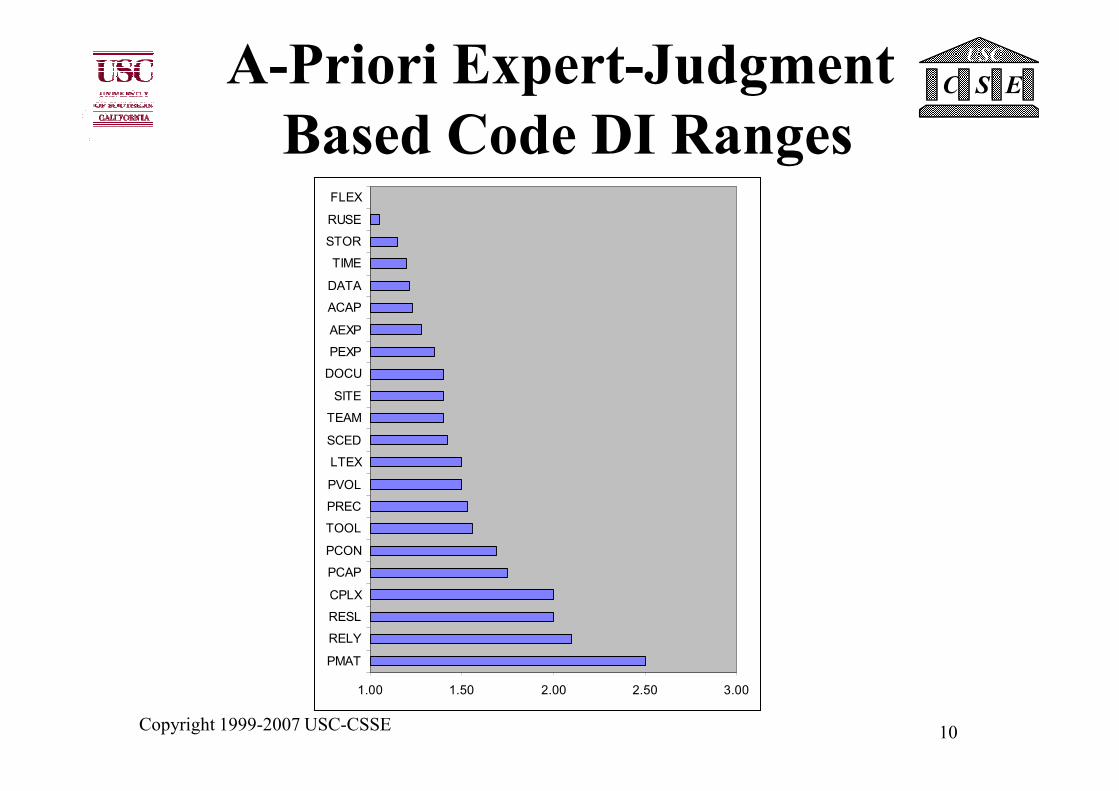
USCA-Priori Expert-Judgment
Based Code DI Ranges
SITE
DOCU
PEXP
AEXP
ACAP
DATA
TIME
STOR
RUSE
FLEX
Copyright 1999-2007 USC-CSSE 10
1.00 1.50 2.00 2.50 3.00
PMAT
RELY
RESL
CPLX
PCAP
PCON
TOOL
PREC
PVOL
LTEX
SCED
TEAM
SITE
C S E
USC
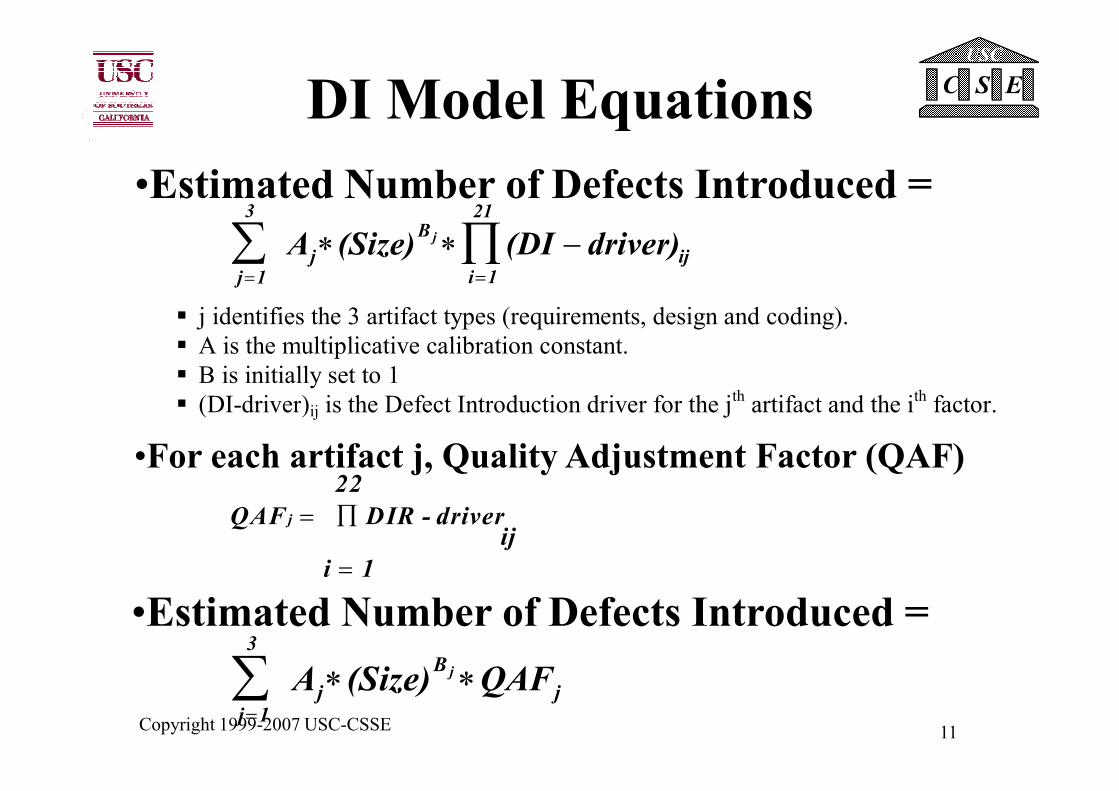
DI Model Equations
j 1
3
j
B
iji 1
21
A (Size) (DI driver)j
= =
∑ ∏∗ ∗ −
•Estimated Number of Defects Introduced =
� j identifies the 3 artifact types (requirements, design and coding).
� A is the multiplicative calibration constant.
� B is initially set to 1
� (DI-driver) is the Defect Introduction driver for the jth artifact and the i
th factor.
Copyright 1999-2007 USC-CSSE 11
•For each artifact j, Quality Adjustment Factor (QAF)
QAF DIR - driverij
i 1
22
j =
=
∏
� (DI-driver)ij is the Defect Introduction driver for the jth artifact and the i
th factor.
j 1
3
j
B
jA (Size) QAFj
=
∑ ∗ ∗
•Estimated Number of Defects Introduced =
C S E
USC
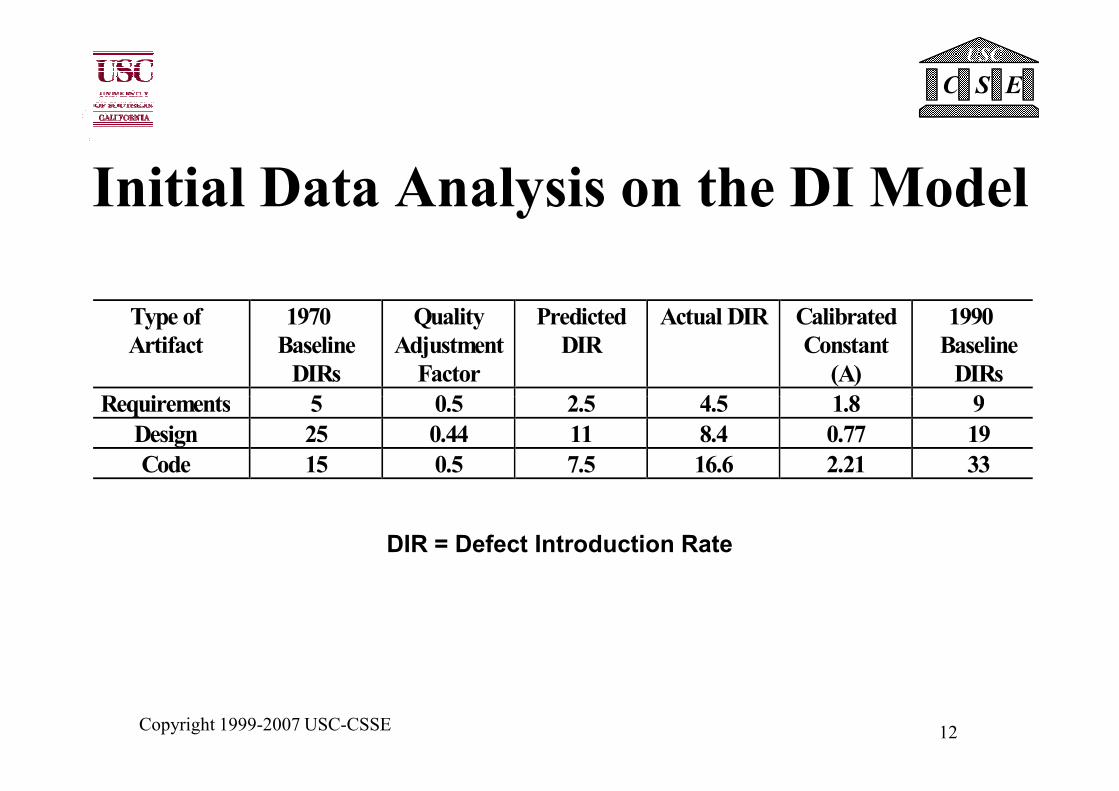
Initial Data Analysis on the DI Model
Type of
Artifact
1970Baseline
DIRs
Quality
Adjustment
Factor
Predicted
DIR
Actual DIR Calibrated
Constant
(A)
1990Baseline
DIRs
Requirements 5 0.5 2.5 4.5 1.8 9
Copyright 1999-2007 USC-CSSE 12
Requirements 5 0.5 2.5 4.5 1.8 9
Design 25 0.44 11 8.4 0.77 19
Code 15 0.5 7.5 16.6 2.21 33
DIR = Defect Introduction Rate
C S E
USC
Outline
• Model Framework
• The Defect Introduction Sub-Model
– Expert-Judgment Model + Some Initial Data
Results
�The Defect Removal Sub-Model
Copyright 1999-2007 USC-CSSE 13
�The Defect Removal Sub-Model
– Expert-Judgment Model (Result of
COQUALMO Workshop)
• COQUALMO Integrated with COCOMO II
• Future Plans
– Call for Data

C S E
USC
Defect
Number of non-trivial
requirements, design and
coding defects introduced
Number of residual
The Defect Removal (DR) Sub-Model
Copyright 1999-2007 USC-CSSE 14
Defect Removal
Sub-Model
Defect removal activity
levels
Number of residual
defects/ unit of size
Software Size Estimate
C S E
USC
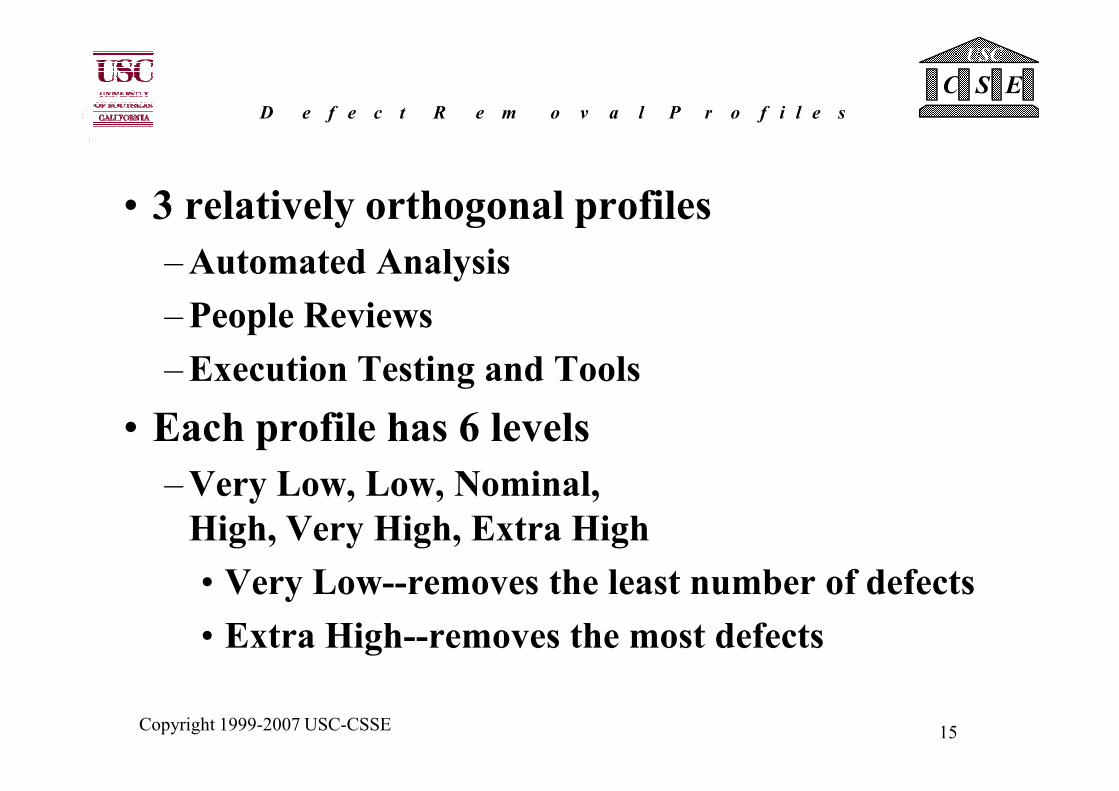
D e f e c t R e m o v a l P r o f i l e s
• 3 relatively orthogonal profiles
–Automated Analysis
–People Reviews
–Execution Testing and Tools
Copyright 1999-2007 USC-CSSE 15
• Each profile has 6 levels
–Very Low, Low, Nominal,
High, Very High, Extra High
• Very Low--removes the least number of defects
• Extra High--removes the most defects
C S E
USC
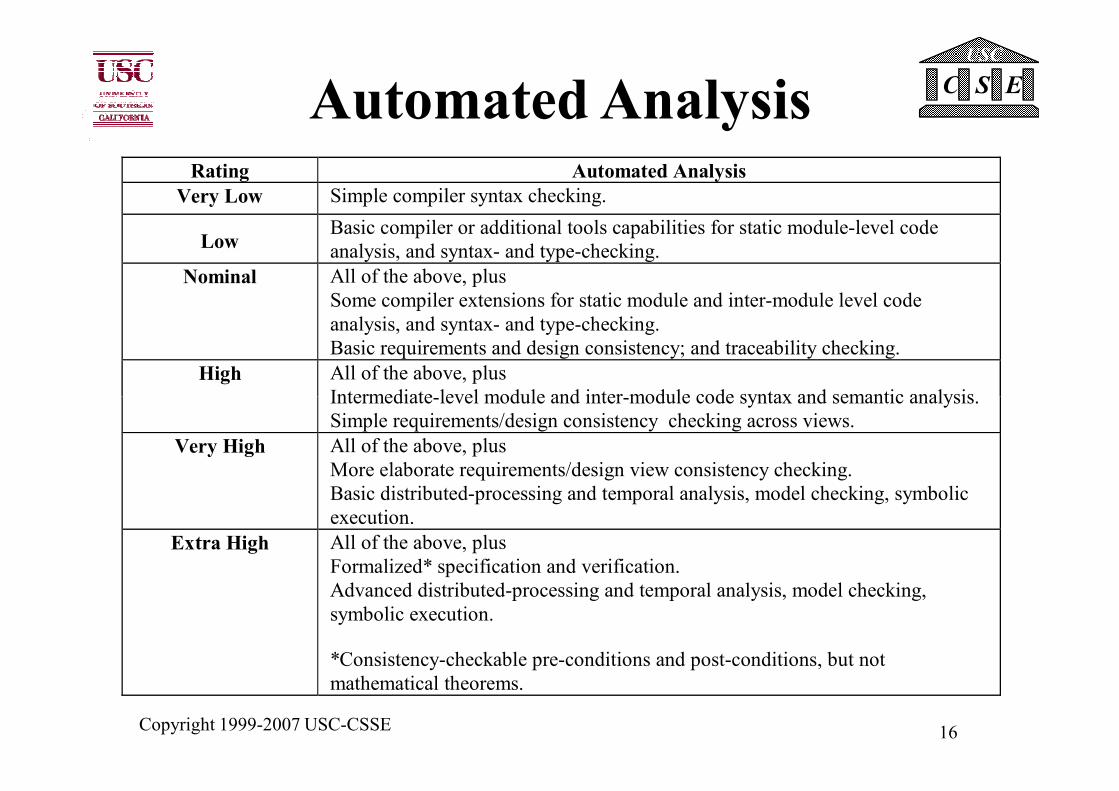
Automated AnalysisRating Automated Analysis
Very Low Simple compiler syntax checking.
LowBasic compiler or additional tools capabilities for static module-level code
analysis, and syntax- and type-checking.
Nominal All of the above, plus
Some compiler extensions for static module and inter-module level code
analysis, and syntax- and type-checking.
Basic requirements and design consistency; and traceability checking.
High All of the above, plus
Intermediate-level module and inter-module code syntax and semantic analysis.
Copyright 1999-2007 USC-CSSE 16
Intermediate-level module and inter-module code syntax and semantic analysis.
Simple requirements/design consistency checking across views.
Very High All of the above, plus
More elaborate requirements/design view consistency checking.
Basic distributed-processing and temporal analysis, model checking, symbolic
execution.
Extra High All of the above, plus
Formalized* specification and verification.
Advanced distributed-processing and temporal analysis, model checking,
symbolic execution.
*Consistency-checkable pre-conditions and post-conditions, but not
mathematical theorems.
C S E
USC
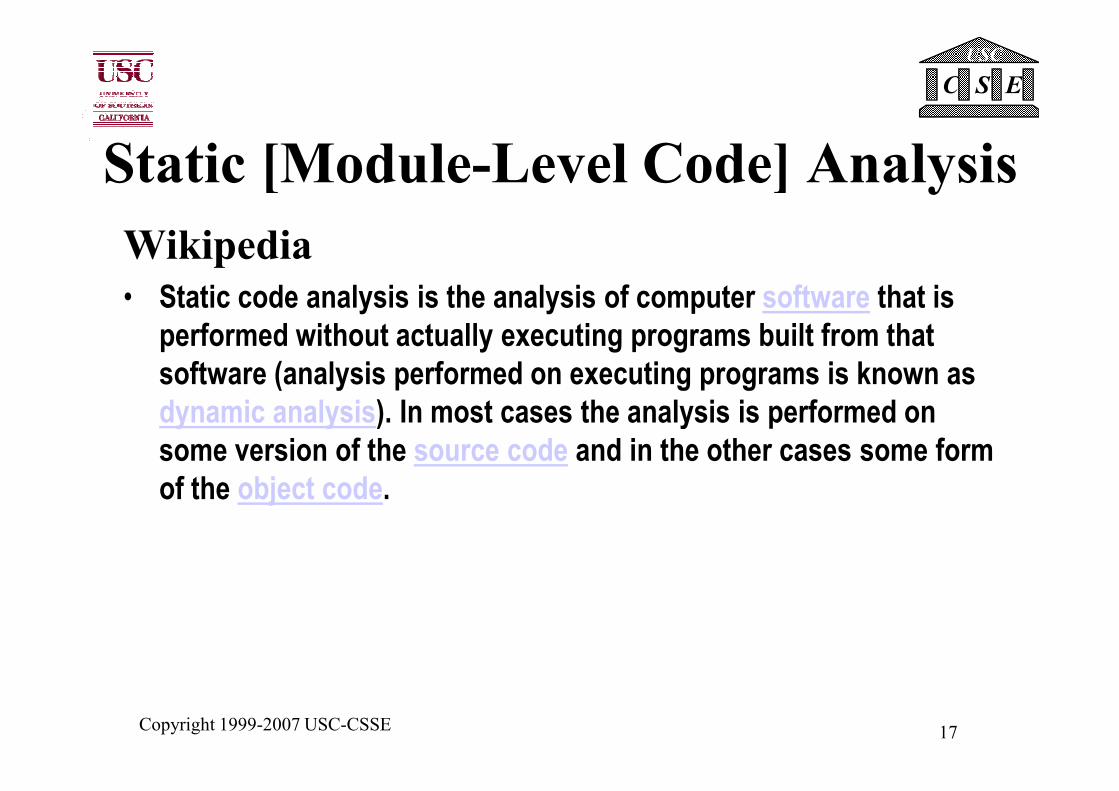
Static [Module-Level Code] Analysis
Wikipedia
• Static code analysis is the analysis of computer software that is
performed without actually executing programs built from that
software (analysis performed on executing programs is known as
dynamic analysis). In most cases the analysis is performed on
Copyright 1999-2007 USC-CSSE 17
dynamic analysis). In most cases the analysis is performed on
some version of the source code and in the other cases some form
of the object code.
C S E
USC
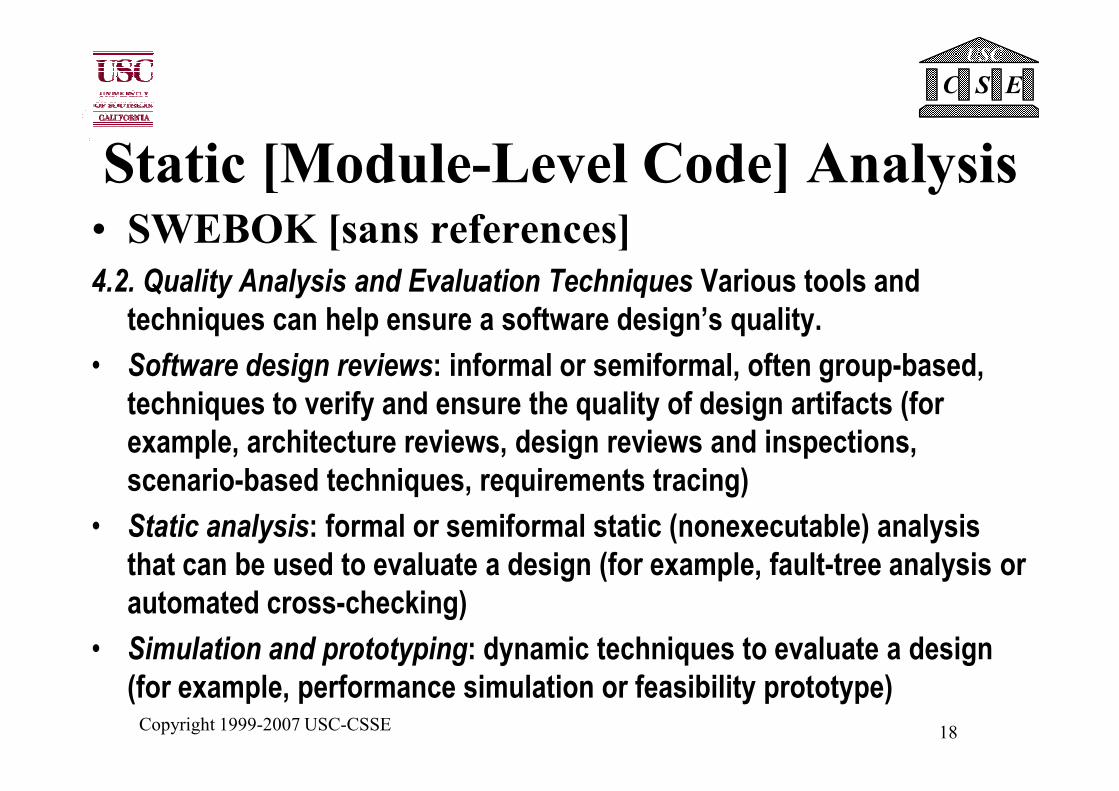
Static [Module-Level Code] Analysis• SWEBOK [sans references]
4.2. Quality Analysis and Evaluation Techniques Various tools and
techniques can help ensure a software design’s quality.
• Software design reviews: informal or semiformal, often group-based,
techniques to verify and ensure the quality of design artifacts (for
Copyright 1999-2007 USC-CSSE 18
techniques to verify and ensure the quality of design artifacts (for
example, architecture reviews, design reviews and inspections,
scenario-based techniques, requirements tracing)
• Static analysis: formal or semiformal static (nonexecutable) analysis
that can be used to evaluate a design (for example, fault-tree analysis or
automated cross-checking)
• Simulation and prototyping: dynamic techniques to evaluate a design
(for example, performance simulation or feasibility prototype)
C S E
USC
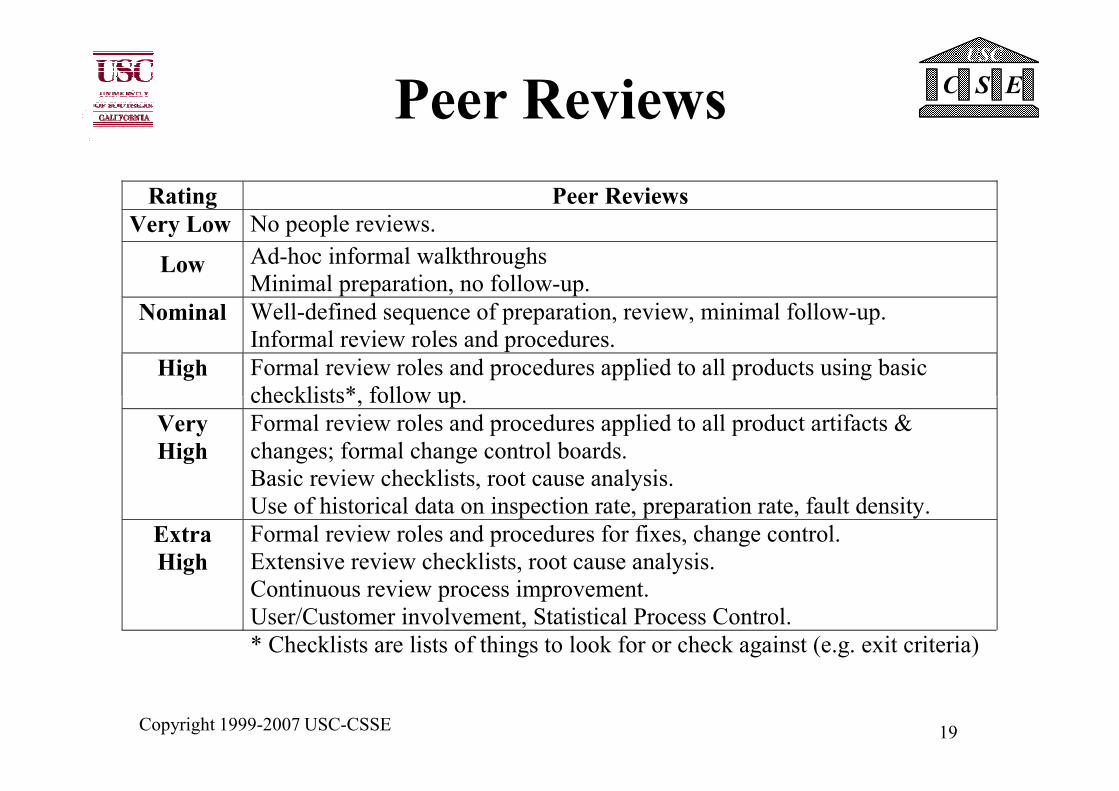
Peer Reviews
Rating Peer Reviews
Very Low No people reviews.
Low Ad-hoc informal walkthroughs
Minimal preparation, no follow-up.
Nominal Well-defined sequence of preparation, review, minimal follow-up.
Informal review roles and procedures.
High Formal review roles and procedures applied to all products using basic
checklists*, follow up.
Copyright 1999-2007 USC-CSSE 19
checklists*, follow up.
Very
High
Formal review roles and procedures applied to all product artifacts &
changes; formal change control boards.
Basic review checklists, root cause analysis.
Use of historical data on inspection rate, preparation rate, fault density.
Extra
High
Formal review roles and procedures for fixes, change control.
Extensive review checklists, root cause analysis.
Continuous review process improvement.
User/Customer involvement, Statistical Process Control.
* Checklists are lists of things to look for or check against (e.g. exit criteria)
C S E
USC
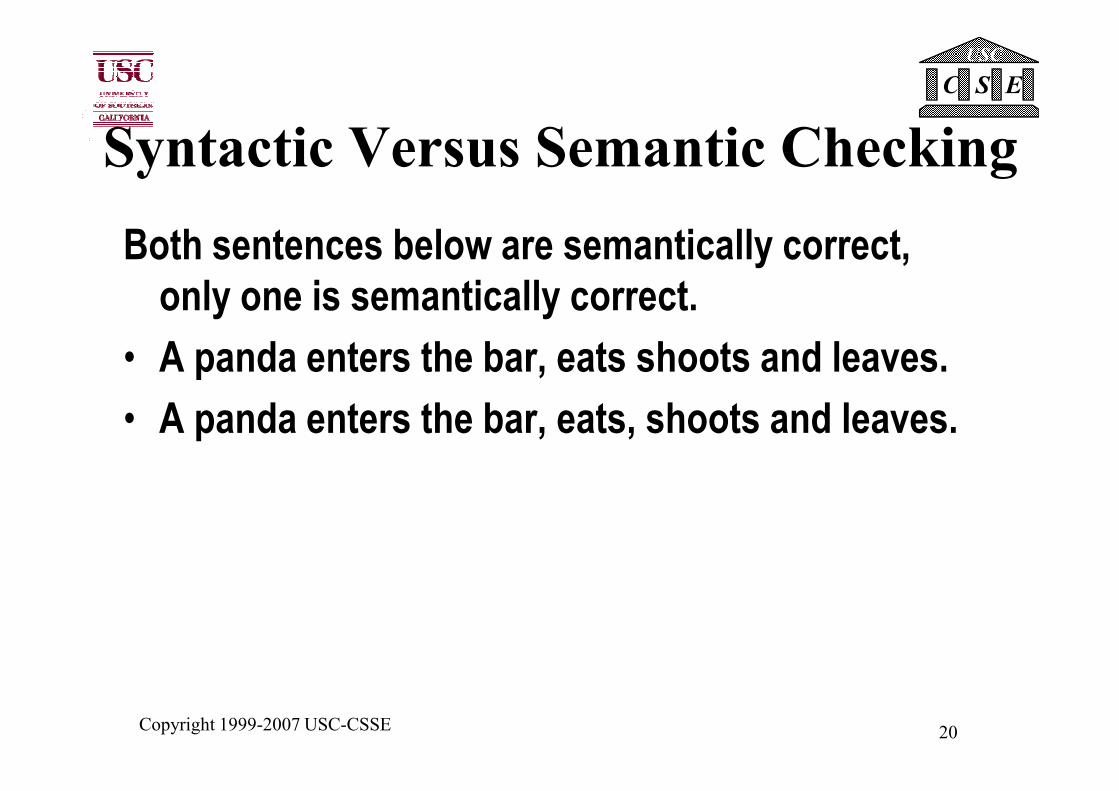
Syntactic Versus Semantic Checking
Both sentences below are semantically correct,
only one is semantically correct.
• A panda enters the bar, eats shoots and leaves.
• A panda enters the bar, eats, shoots and leaves.
Copyright 1999-2007 USC-CSSE 20
• A panda enters the bar, eats, shoots and leaves.
C S E
USC
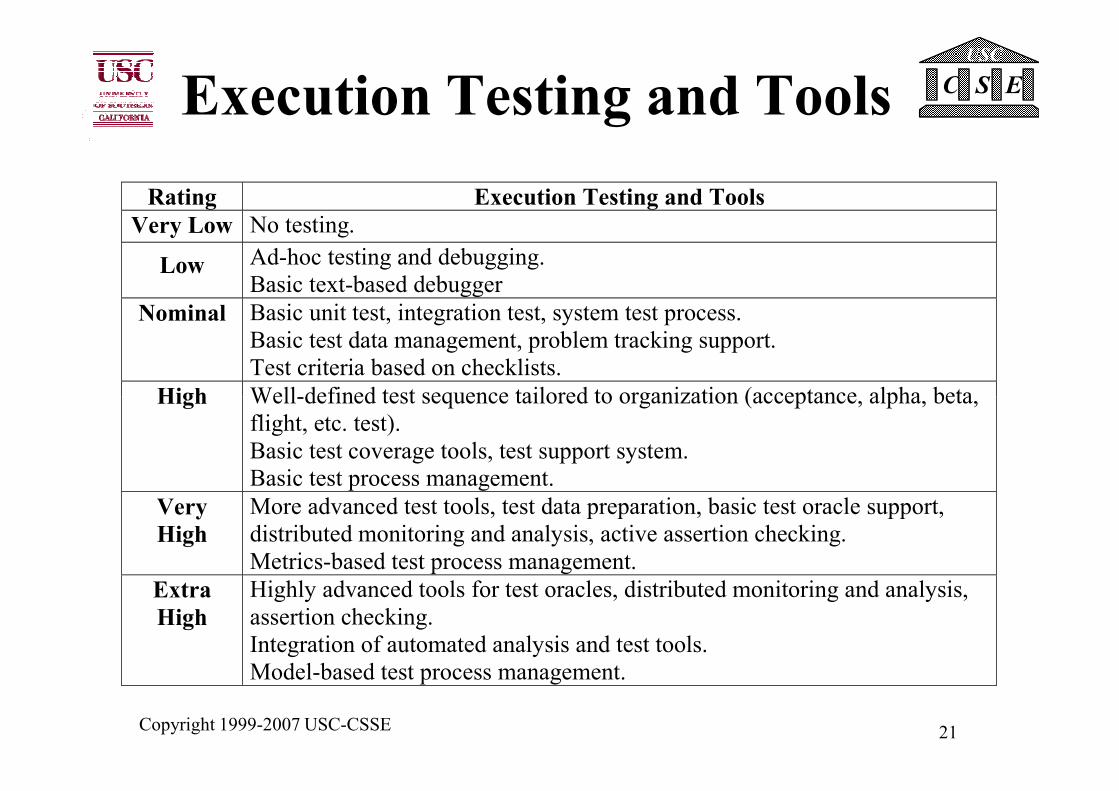
Execution Testing and Tools
Rating Execution Testing and Tools
Very Low No testing.
Low Ad-hoc testing and debugging.
Basic text-based debugger
Nominal Basic unit test, integration test, system test process.
Basic test data management, problem tracking support.
Test criteria based on checklists.
High Well-defined test sequence tailored to organization (acceptance, alpha, beta,
Copyright 1999-2007 USC-CSSE 21
High Well-defined test sequence tailored to organization (acceptance, alpha, beta,
flight, etc. test).
Basic test coverage tools, test support system.
Basic test process management.
Very
High
More advanced test tools, test data preparation, basic test oracle support,
distributed monitoring and analysis, active assertion checking.
Metrics-based test process management.
Extra
High
Highly advanced tools for test oracles, distributed monitoring and analysis,
assertion checking.
Integration of automated analysis and test tools.
Model-based test process management.
C S E
USC
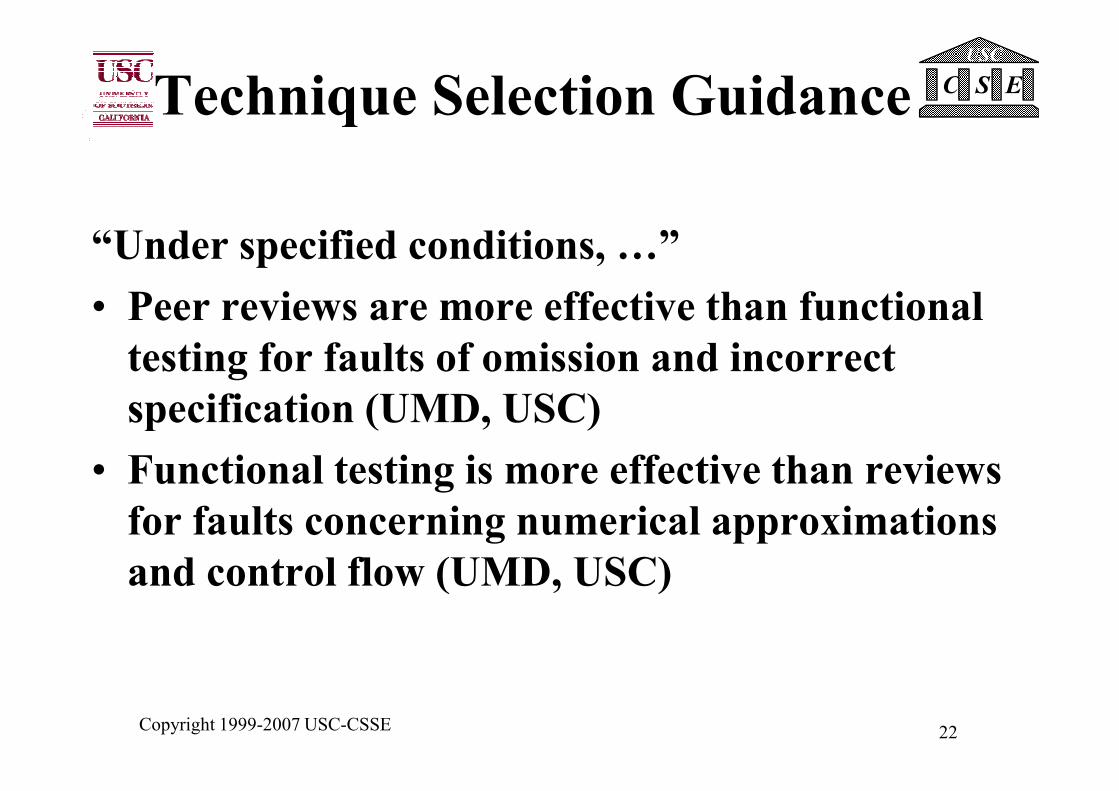
Technique Selection Guidance
“Under specified conditions, …”
• Peer reviews are more effective than functional
testing for faults of omission and incorrect
specification (UMD, USC)
Copyright 1999-2007 USC-CSSE 22
specification (UMD, USC)
• Functional testing is more effective than reviews
for faults concerning numerical approximations
and control flow (UMD, USC)
C S E
USC
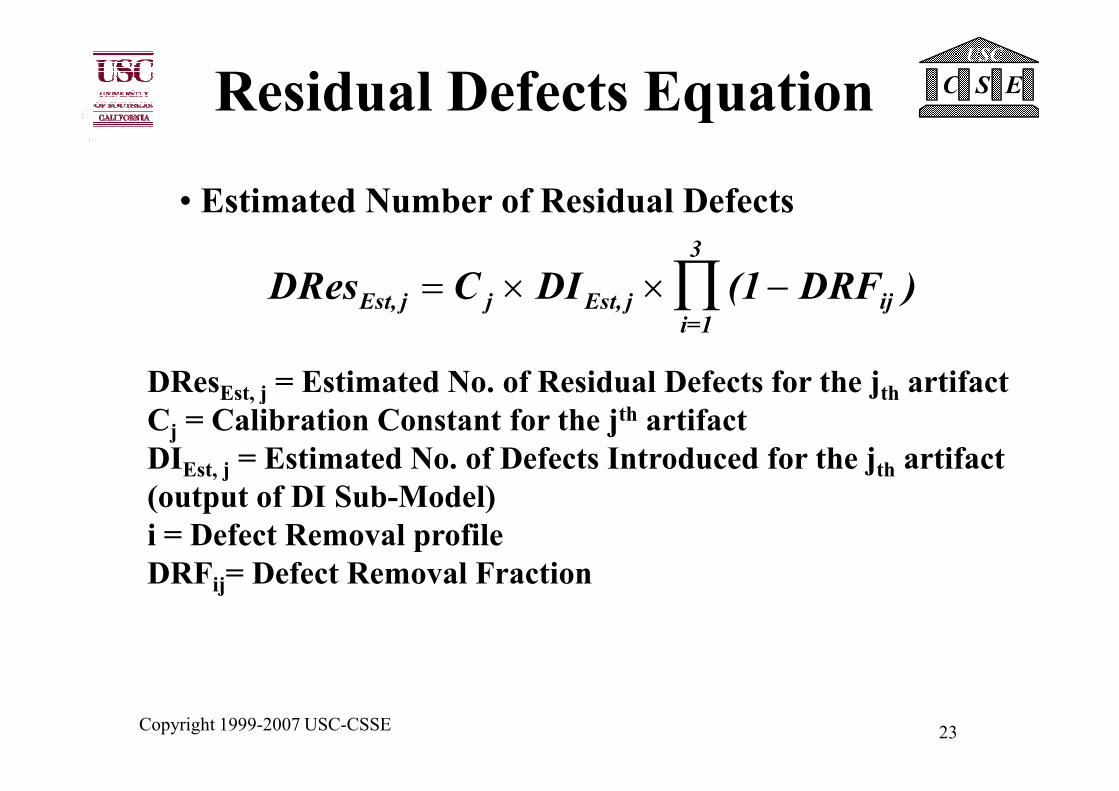
Residual Defects Equation
• Estimated Number of Residual Defects
DResEst, j = Estimated No. of Residual Defects for the jth artifact
DRes C DI (1 DRF )Est, j j Est, j iji
= × × −∏3
i=1
Copyright 1999-2007 USC-CSSE 23
DResEst, j = Estimated No. of Residual Defects for the jth artifact
Cj = Calibration Constant for the jth artifact
DIEst, j = Estimated No. of Defects Introduced for the jth artifact
(output of DI Sub-Model)
i = Defect Removal profile
DRFij= Defect Removal Fraction
C S E
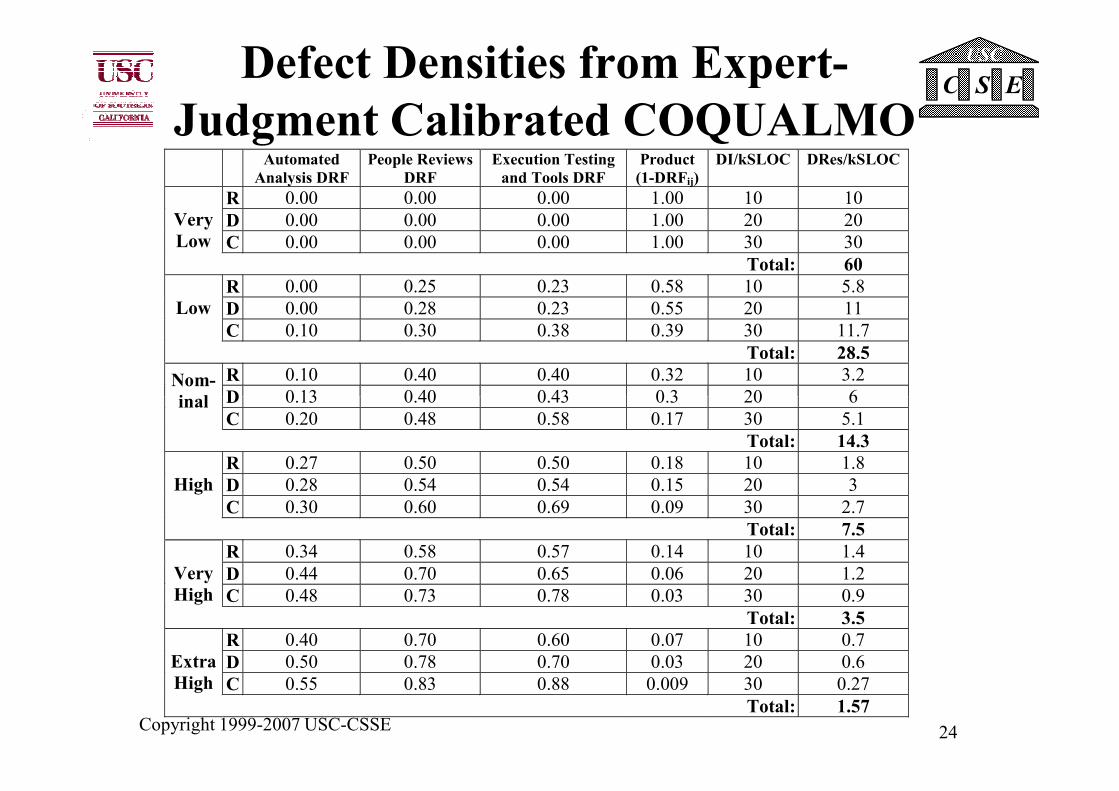
USCDefect Densities from Expert-
Judgment Calibrated COQUALMOAutomated
Analysis DRF
People Reviews
DRF
Execution Testing
and Tools DRF
Product
(1-DRFij)
DI/kSLOC DRes/kSLOC
R 0.00 0.00 0.00 1.00 10 10
D 0.00 0.00 0.00 1.00 20 20
C 0.00 0.00 0.00 1.00 30 30
Very
Low
Total: 60
R 0.00 0.25 0.23 0.58 10 5.8
D 0.00 0.28 0.23 0.55 20 11
C 0.10 0.30 0.38 0.39 30 11.7
Low
Total: 28.5
R 0.10 0.40 0.40 0.32 10 3.2
D 0.13 0.40 0.43 0.3 20 6Nom-
inal
Copyright 1999-2007 USC-CSSE 24
D 0.13 0.40 0.43 0.3 20 6
C 0.20 0.48 0.58 0.17 30 5.1inal
Total: 14.3
R 0.27 0.50 0.50 0.18 10 1.8
D 0.28 0.54 0.54 0.15 20 3
C 0.30 0.60 0.69 0.09 30 2.7
High
Total: 7.5
R 0.34 0.58 0.57 0.14 10 1.4
D 0.44 0.70 0.65 0.06 20 1.2
C 0.48 0.73 0.78 0.03 30 0.9
Very
High
Total: 3.5
R 0.40 0.70 0.60 0.07 10 0.7
D 0.50 0.78 0.70 0.03 20 0.6
C 0.55 0.83 0.88 0.009 30 0.27
Extra
High
Total: 1.57
C S E
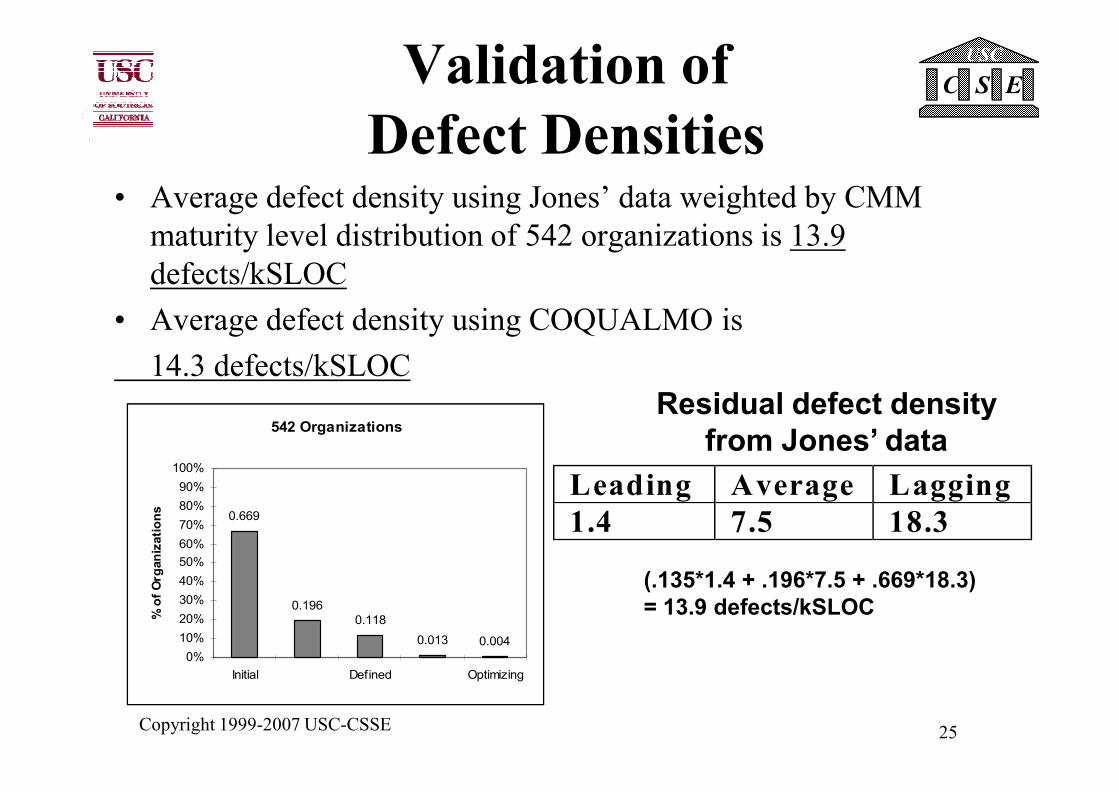
USCValidation of
Defect Densities• Average defect density using Jones’ data weighted by CMM
maturity level distribution of 542 organizations is 13.9
defects/kSLOC
• Average defect density using COQUALMO is
14.3 defects/kSLOC
Residual defect density
Copyright 1999-2007 USC-CSSE 25
542 Organizations
0.669
0.196
0.118
0.013 0.004
0%
10%
20%
30%
40%
50%
60%
70%
80%
90%
100%
Initial Defined Optimizing
% of Organizations
Leading Average Lagging
1.4 7.5 18.3
Residual defect density
from Jones’ data
(.135*1.4 + .196*7.5 + .669*18.3)
= 13.9 defects/kSLOC
C S E
USC
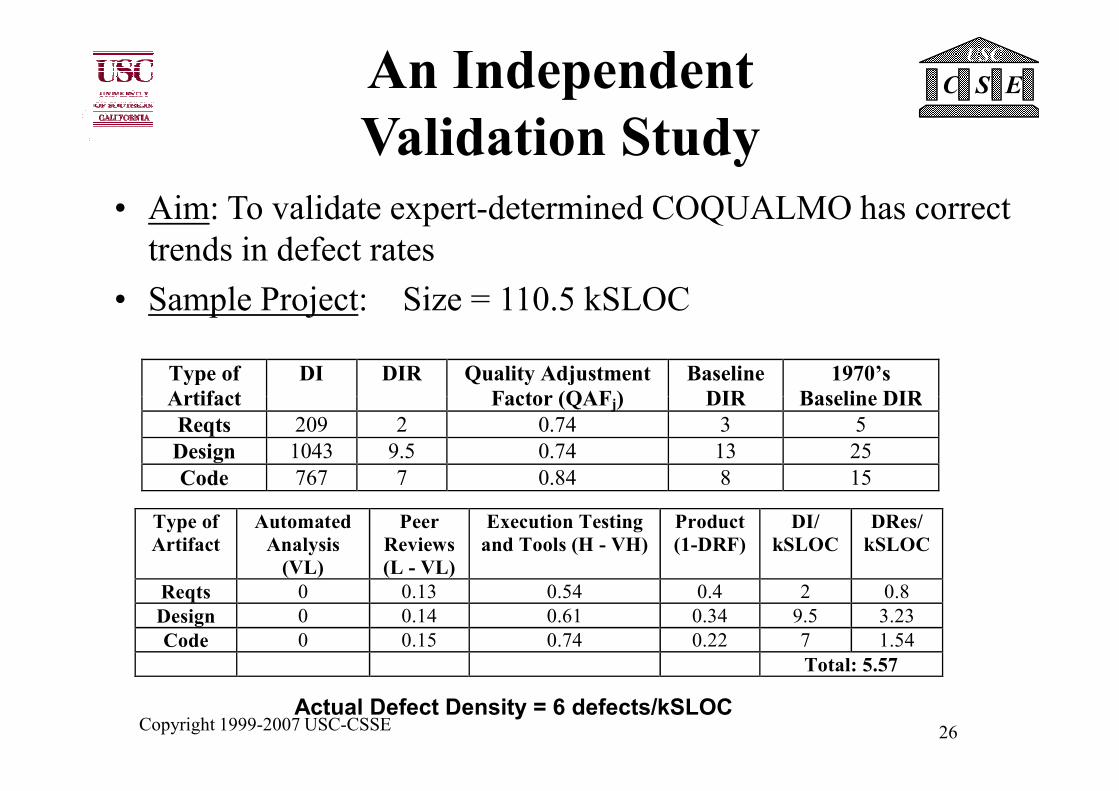
An Independent
Validation Study
• Aim: To validate expert-determined COQUALMO has correct
trends in defect rates
• Sample Project: Size = 110.5 kSLOC
Type of
Artifact
DI DIR Quality Adjustment
Factor (QAFj)
Baseline
DIR
1970’s
Baseline DIR
Copyright 1999-2007 USC-CSSE 26
Artifact Factor (QAFj) DIR Baseline DIR
Reqts 209 2 0.74 3 5
Design 1043 9.5 0.74 13 25
Code 767 7 0.84 8 15
Type of
Artifact
Automated
Analysis
(VL)
Peer
Reviews
(L - VL)
Execution Testing
and Tools (H - VH)
Product
(1-DRF)
DI/
kSLOC
DRes/
kSLOC
Reqts 0 0.13 0.54 0.4 2 0.8
Design 0 0.14 0.61 0.34 9.5 3.23
Code 0 0.15 0.74 0.22 7 1.54
Total: 5.57
Actual Defect Density = 6 defects/kSLOC
C S E
USC
Outline
• Model Framework
• The Defect Introduction Sub-Model
– Expert-Judgment Model + Some Initial Data
Results
• The Defect Removal Sub-Model
Copyright 1999-2007 USC-CSSE 27
• The Defect Removal Sub-Model
– Expert-Judgment Model (Result of
COQUALMO Workshop)
�COQUALMO Integrated with COCOMO II
C S E
USC
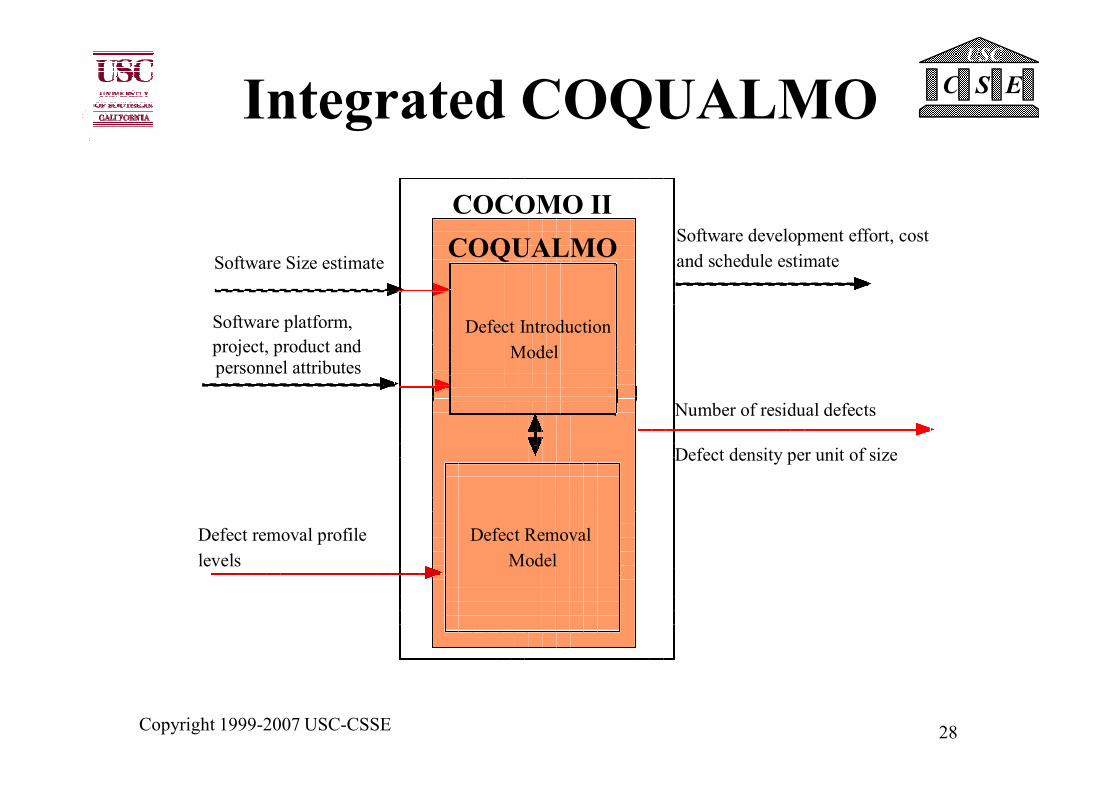
Integrated COQUALMO
COCOMO II
COQUALMOSoftware Size estimate
Software platform,
project, product and
personnel attributes
Software development effort, cost
and schedule estimate
Defect Introduction
Model
Copyright 1999-2007 USC-CSSE 28
Defect Removal
Model
Defect removal profile
levels
Number of residual defects
Defect density per unit of size