Embed Size (px)
Citation preview

SUSTAIN:Urban Modeling Systems Integrating
Optimization and Economics
September 25, 2012
Joong Gwang Lee, Ph.D.
U.S. Environmental Protection Agency
John Riverson, P.E.
Tetra Tech
5/9/2014 1U.S. Environmental Protection Agency

What is SUSTAIN?
System for Urban Stormwater Treatment and Analysis INtegration
� A decision support system (DSS) to select/locate/size stormwater BMP/LID/GIs in urban watersheds
� Extends the capabilities and functionality of traditionally available models by providing integrated analysis of water quantity, quality, and cost factors.
5/9/2014U.S. Environmental Protection Agency
2
SWMMSWMM
HSPFHSPF
OthersOthers
GISGIS
CostsCosts
OptimizationOptimization
Cost-benefit analysis for decision supportCost-benefit analysis for decision support

Modeling Components of SUSTAIN
U.S. Environmental Protection Agency35/9/2014
8. Case Study
Presentation
Outline:
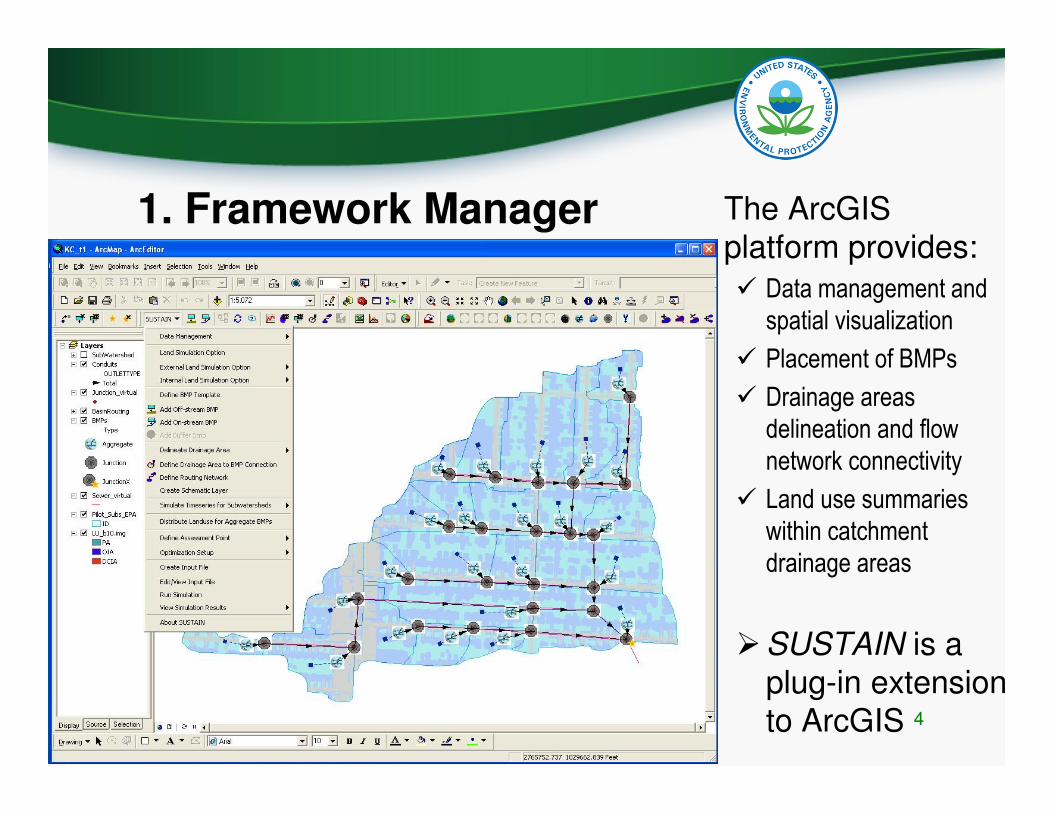
1. Framework Manager The ArcGIS platform provides:
� Data management and
spatial visualization
� Placement of BMPs
� Drainage areas
delineation and flow
network connectivity
� Land use summaries
within catchment
drainage areas
�SUSTAIN is a plug-in extension to ArcGIS5/9/2014
U.S. Environmental Protection Agency4

2. BMP Siting Tool
Identifies potential suitable locations/areas for implementing different types of BMPs or LID techniques
� Results derived from spatial analysis using relevant criteria
5/9/2014U.S. Environmental Protection Agency
5

3. Watershed Module
• Consists of a land simulation module and a conveyance module
– Land simulation module:• Internally simulates land runoff/pollutant loads OR
• Imports externally derived runoff/pollutant time series
– Conveyance module performs routing of flow and water quality through a conduit
5/9/2014U.S. Environmental Protection Agency
6

Land Simulation
5/9/2014U.S. Environmental Protection Agency
7

Conveyance Module
• Simulates one-dimensional open channel flow with pollutant and sediment routing
– Flow and pollutant routing are simulated using algorithms from the EPA SWMM5 transport compartment
– Sediment routing is simulated using reach sediment transport algorithms from HSPF
5/9/2014U.S. Environmental Protection Agency
8

4. BMP Simulation ModuleProvides a process-based simulation of flow and pollutant transport routing for structural BMPs
5/9/2014U.S. Environmental Protection Agency
9

BMP Options: Spatial Scale
5/9/2014U.S. Environmental Protection Agency
10
Site Regional

Why Continuous Simulation?
5/9/2014U.S. Environmental Protection Agency
11
Comprehensive Analysis in Stormwater BMP/LID/GI Dynamics

5. Cost Module
• Estimates the overall costs of implementing BMPs based on fundamental construction components:
where a, b, c, d, e, f, and g are cost parameters based on initiation, length,
area, or volume of a BMP component
• Supports a built-in cost database organized by general BMP construction components
5/9/2014U.S. Environmental Protection Agency
12

6. Optimization Module
• BMP Configuration
– Map all potential locations
– Typical routing configuration
– Unit cost (scalable)
• Decision Variables
– BMP Size (0 to maximum)
– BMP Location (on or off)
• Objectives
– Minimize Cost
– Maximize Volume Reduction
BMP Types &
Locations
BMP Sizes
The Watershed
∆, $
∆, $
∆, $
Reduction
Opportunity
Matrix

%
$
NSGAII (Non-dominated Sorting Genetic Algorithm II)
Scatter Search
%
$
Genera
tions
Iterations
Evolutionary Optimization Techniques
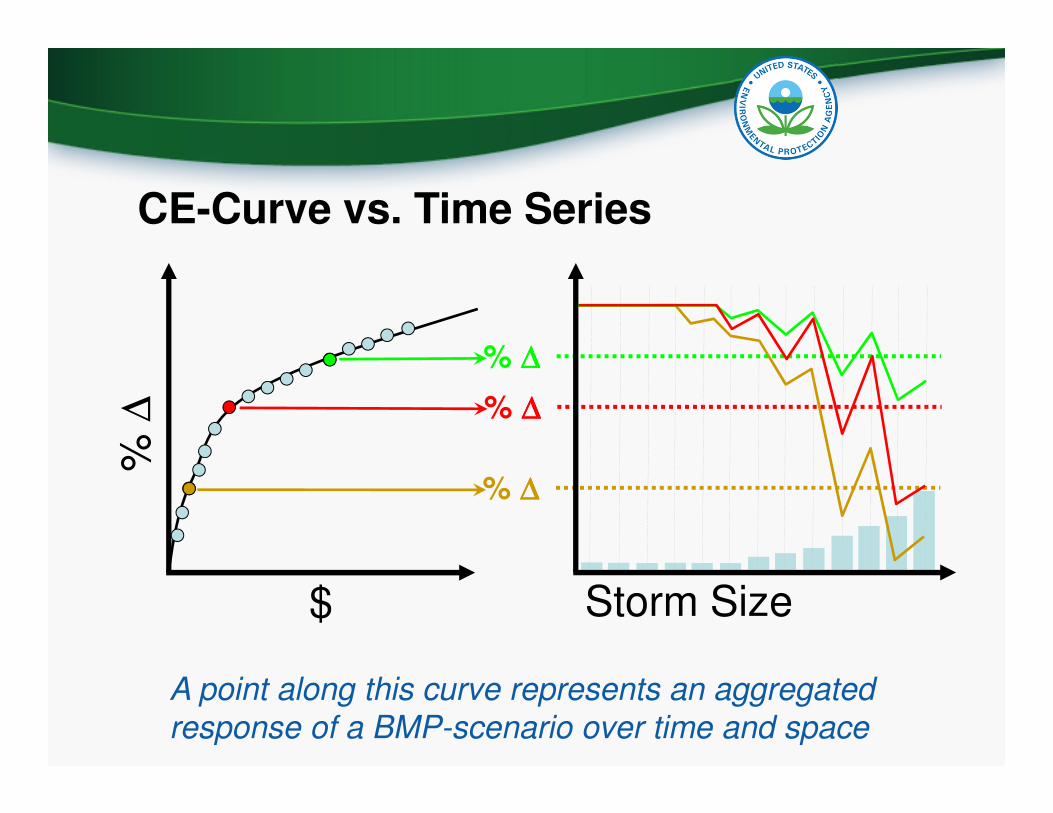
% ∆
$
% ∆∆∆∆
% ∆∆∆∆
% ∆∆∆∆
Storm Size
A point along this curve represents an aggregated
response of a BMP-scenario over time and space
CE-Curve vs. Time Series

7. Post Processor
• Analyzes and interprets simulation outputs
• Compares simulation scenarios:– Pre-development condition
– Existing condition (no BMPs)
– Existing condition with BMPs
• Specific graphical and tabular reports:– Storm event classification
– Storm event viewer
– Storm performance summary
– Cost-effectiveness curve
5/9/2014U.S. Environmental Protection Agency
16

Cost Effectiveness Curve
5/9/2014U.S. Environmental Protection Agency
17
0%
5%
10%
15%
20%
25%
30%
35%
$0.0 $0.5 $1.0 $1.5 $2.0 $2.5 $3.0 $3.5 $4.0 $4.5
Cost ($ Million)
Eff
ective
ne
ss (
% R
ed
uctio
n)
All Solutions
Cost-Effectiveness Curve
Selected Simulation
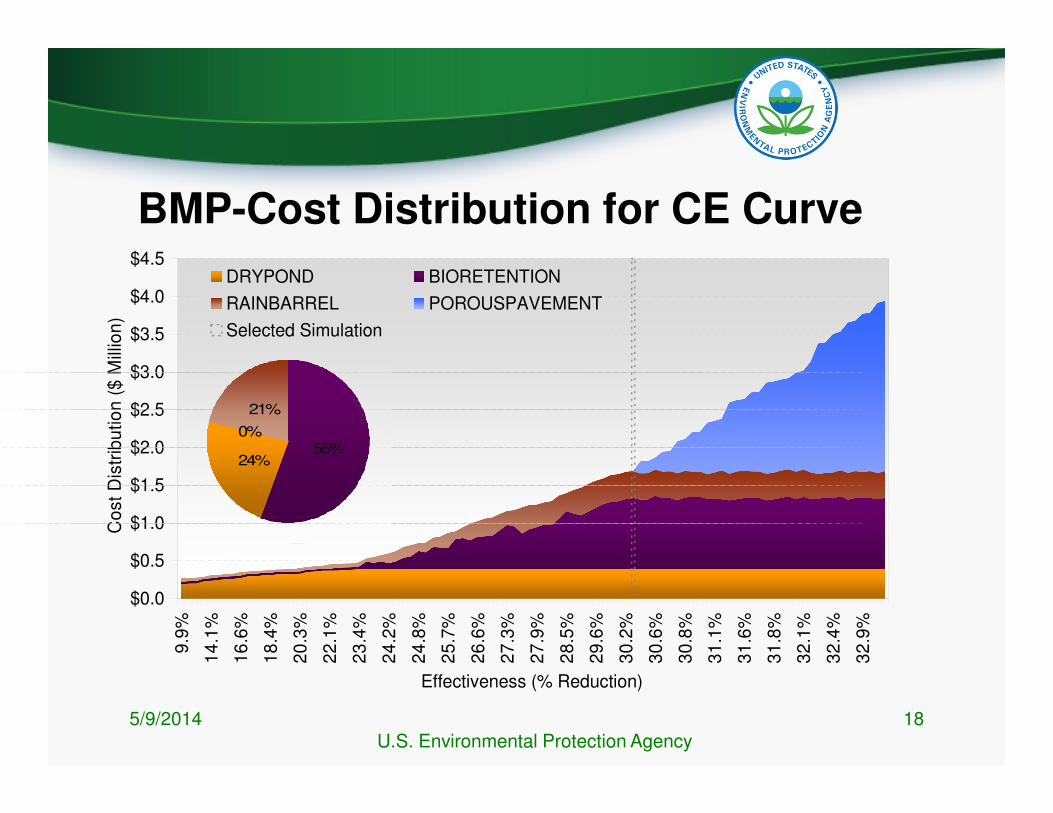
BMP-Cost Distribution for CE Curve
5/9/2014U.S. Environmental Protection Agency
18
$0.0
$0.5
$1.0
$1.5
$2.0
$2.5
$3.0
$3.5
$4.0
$4.5
9.9
%
14
.1%
16
.6%
18
.4%
20
.3%
22
.1%
23
.4%
24
.2%
24
.8%
25
.7%
26
.6%
27
.3%
27
.9%
28
.5%
29
.6%
30
.2%
30
.6%
30
.8%
31
.1%
31
.6%
31
.8%
32
.1%
32
.4%
32
.9%
Effectiveness (% Reduction)
Co
st
Dis
trib
utio
n (
$ M
illio
n)
DRYPOND BIORETENTION
RAINBARREL POROUSPAVEMENT
Selected Simulation
55%24%
0%
21%
55%24%
0%
21%

SUSTAIN Case Studies: Lessons Learned
Three case study applications:
• GI Applications for CSO Mitigation
– Kansas City, MO
– Louisville, KY
• Stormwater Management for TMDLs in an Arid Climate (poster presentation)
– Albuquerque, NM
5/9/2014 U.S. Environmental Protection Agency 19
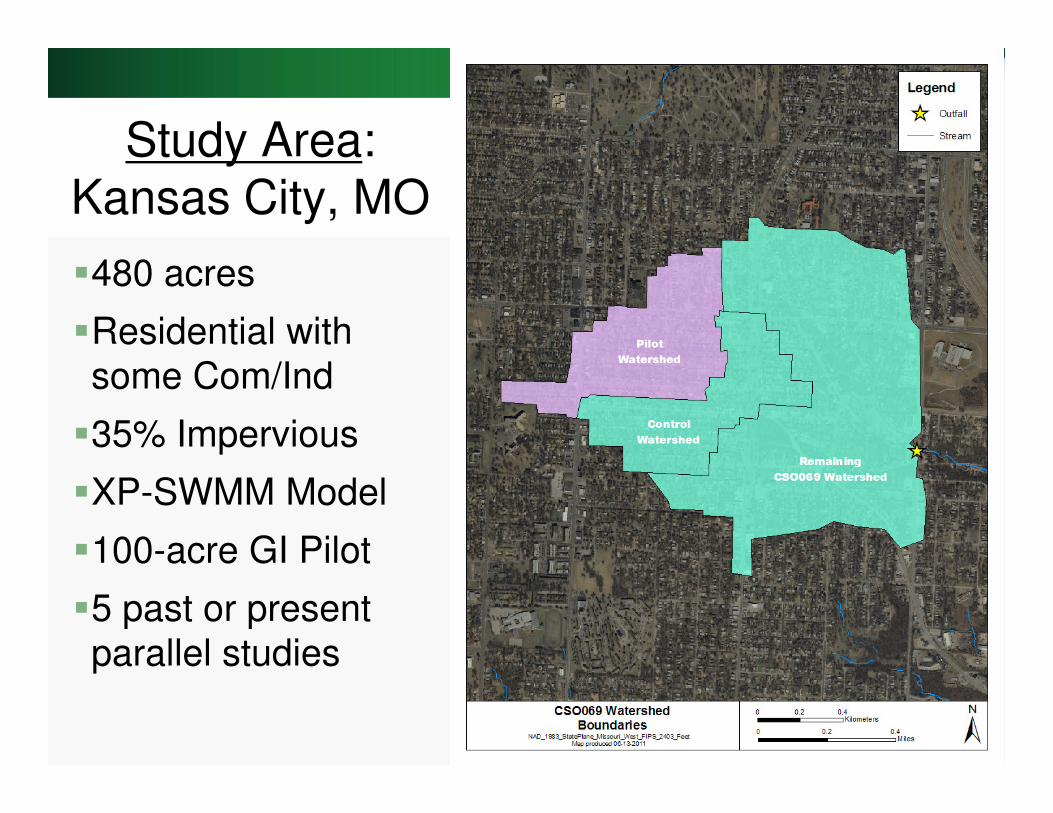
Study Area:Kansas City, MO
�480 acres
�Residential with some Com/Ind
�35% Impervious
�XP-SWMM Model
�100-acre GI Pilot
�5 past or present parallel studies

Gray
+
Gray
+
Green
Infrastructure
Green
Infrastructure
Existing or
Planned Mgmt
Existing or
Planned Mgmt
Gray
Infrastructure
Only
Gray
Infrastructure
Only
Existing or
Planned Mgmt
Existing or
Planned Mgmt
Optimization
Scenario 1
Optimization
Scenario N
Optimization
Baseline
Existing or
Planned Mgmt
Existing or
Planned Mgmt
CSO
Calibration
Baseline
CSO
Nu
mb
er
of
CS
O E
ven
ts
Problem Formulation…
Exp
lora
tory
Allowable Exceedances Max ∆ / Min $
Co
mm
itte
d
c1

Design Plans…
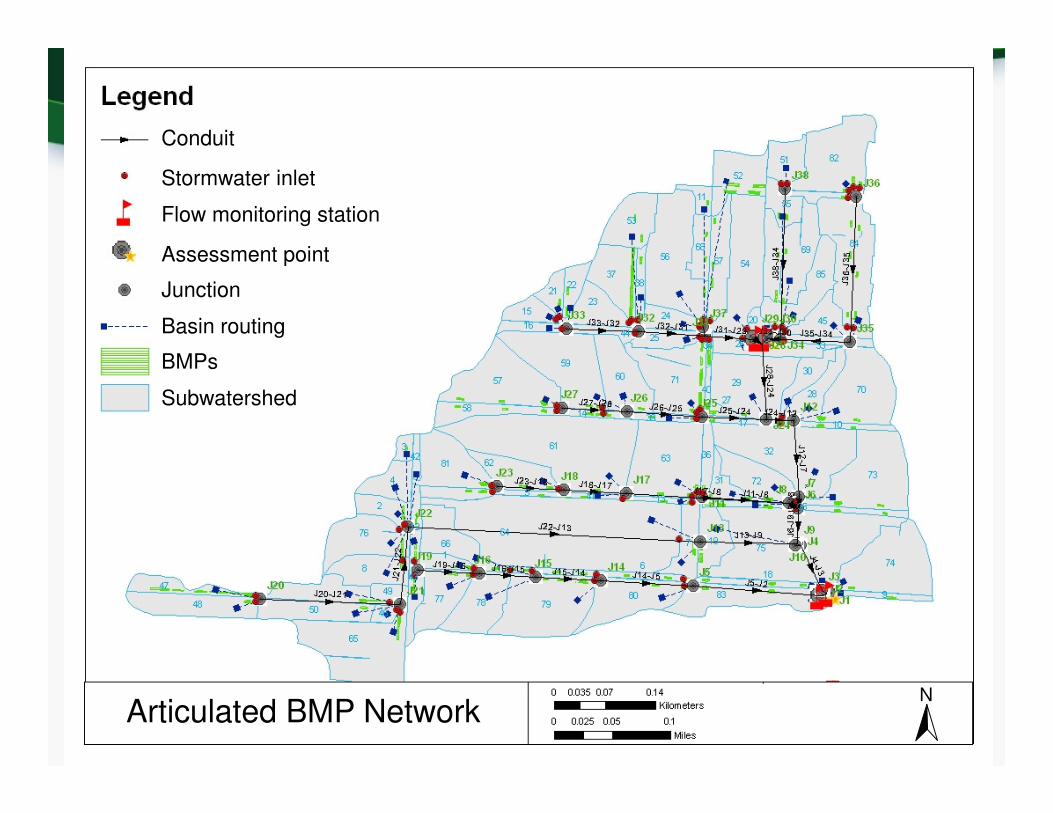
Articulated BMP NetworkN
Conduit
Stormwater inlet
Flow monitoring station
Assessment point
Junction
Basin routing
BMPs
Subwatershed

Aggregate BMP Network
Shallow Bioretention
BioretentionRain
GardenPorous
Sidewalk
Porous Pavement on Storage Cube
outletoutlet
Cascade
Bioswale
N
Drainage Area Land Distribution(Proportional to articulated network contributing areas)
Storage
Untreated Land

EL 418.83’
EL 438.66’
38th Street
Pump HouseManhole
Access
2’-9”
Weir
Pump
11’-6”
CSO 019 Regulator and Pump Station
(160’ Long)
EL 418.83’
EL 438.66’
38th Street
Pump HouseManhole
Access
2’-9”
Weir
Pump
11’-6”
CSO 019 Regulator and Pump Station
(160’ Long)
Supplemental Gray Storage
Overflow
To WWTPSupplemental
Gray
Infrastructure
Assessment
Point
CSO Regulator and Pump Station
Pump House
c2
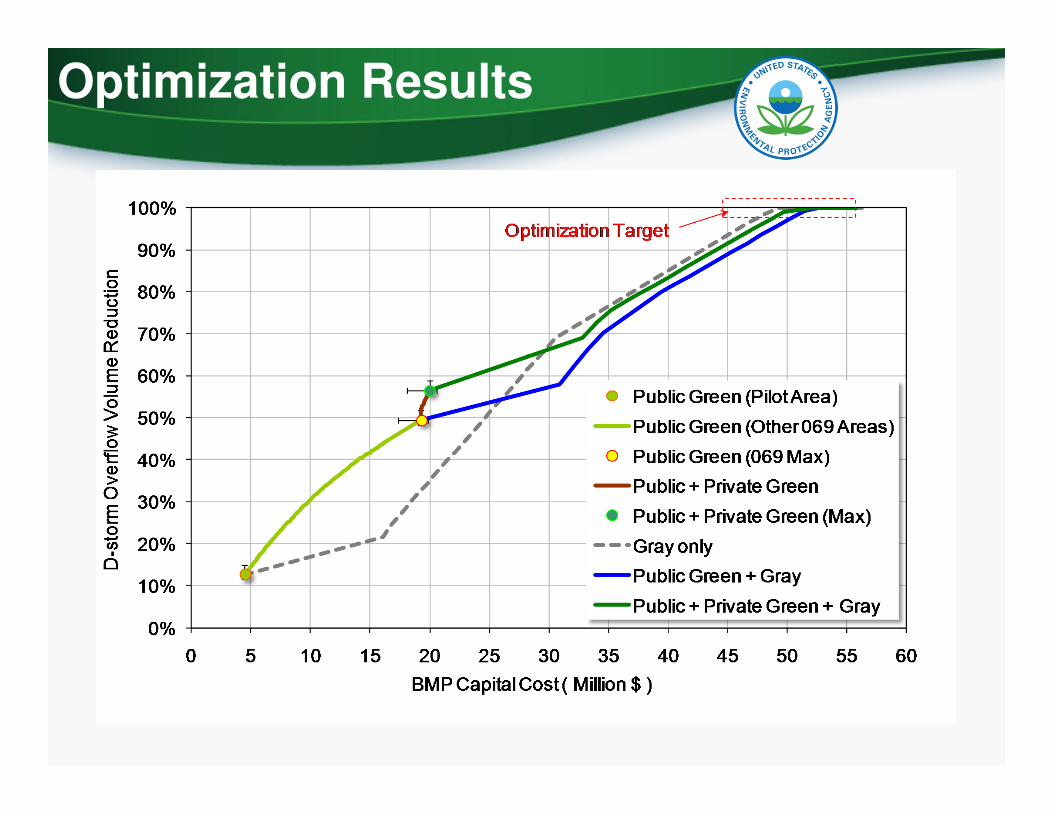
Optimization Results

Optimization Target: Costs

Typical Year*: Overflow Volumes
* Continuous simulation for typical year 2001

Green vs. Gray
�Not all storage is created equal (Gray ≠ Green)
�Dewatering » Infiltration/ET, but it’s not free
GI
Gray
Infiltration/ET
Dewatering
Overflow Target
Overflow Target
Overflow Target
Overflow Target
GI
Compare

5/9/2014 U.S. Environmental Protection Agency 30

Data Collection
and Analysis
Data Collection
and Analysis
Modeling Objectives &
Problem Formulation
Modeling Objectives &
Problem Formulation
Results Interpretation
Results Interpretation
Management Objectives
Numeric Control Targets
Management Objectives
Numeric Control Targets
Project Setup
Project Setup
Applying SUSTAINApplying SUSTAIN
OptimizationOptimization
Baseline Calibration
Exploratory
Insufficient Data

Where SUSTAIN Applies?
• Evaluate and select BMP/LID/GI options to achieve loading targets set by a TMDL
• Identify protective management practices and evaluate pollutant loadings for Source Water Protection
• Develop cost-effective management options for a municipal MS4 program
• Determine a cost-effective mix of control measures to help achieve management objectives for CSO control
5/9/2014U.S. Environmental Protection Agency
32