Embed Size (px)
Citation preview

8/2/2019 C28 Spectrometry
http://slidepdf.com/reader/full/c28-spectrometry 1/71
SPECTROMETRICMETHODS OF ANALYSIS:
UV-VIS AND FTIRSPECTROSCOPYCHEM 28
Prof. Kurt W. E. Sy Piecco
8/2/2019 C28 Spectrometry
http://slidepdf.com/reader/full/c28-spectrometry 2/71
The Rise of Spectroscopy
Before the beginning of the twentieth century most quantitative chemical
analyses used gravimetry or titrimetry as the analytical method. With these
methods, analysts achieved highly accurate results, but were usually limited to
the analysis of major and minor analytes.
Other methods developed during this period (1856) extended quantitativeanalysis to include trace level analytes.
One such method was colorimetry – where the sample’s color is compared
against the colors of a range of standards to determine the analyte’s
concentration.
Colorimetry, in which a sample absorbs visible light, is one example of aspectroscopic method of analysis.
During the twentieth century, spectroscopy has been extended to include other
forms of electromagnetic radiation; X-rays, microwaves, radio waves, and
energetic particles (e.g. electrons and ions).
8/2/2019 C28 Spectrometry
http://slidepdf.com/reader/full/c28-spectrometry 3/71
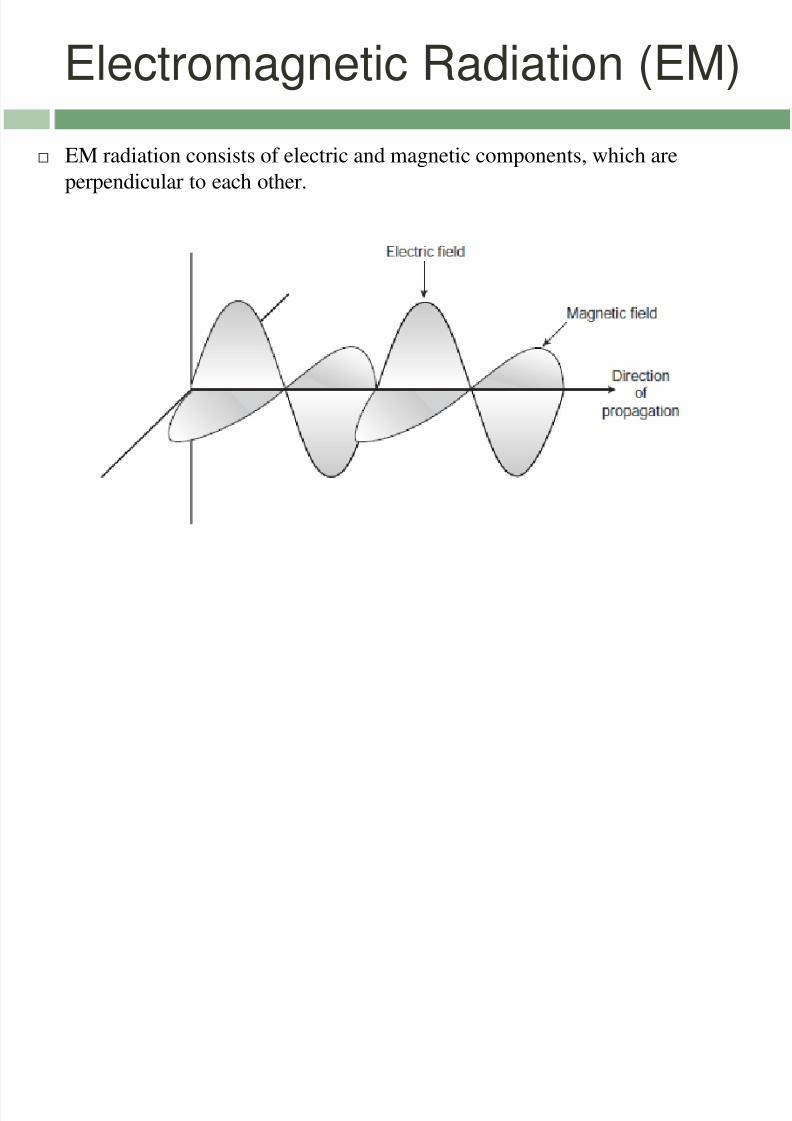
Electromagnetic Radiation (EM)
EM radiation consists of electric and magnetic components, which are
perpendicular to each other.
8/2/2019 C28 Spectrometry
http://slidepdf.com/reader/full/c28-spectrometry 4/71
EM radiation is a form of energy.
Energy has both wave-like and particle-like properties.
Wavelike properties:
Propagates (moves) through space in a straight line at constant speed
(the speed of light). Oscillations in the electric and magnetic fields are
perpendicular to each other, and to the direction of the wave’s
propagation.
Can be refracted, reflected, or diffracted
Can be described by these parameters; frequency, wavelength,
amplitude, etc.
8/2/2019 C28 Spectrometry
http://slidepdf.com/reader/full/c28-spectrometry 5/71
Particle-like properties:
EM radiation can also be pictured as being made up of energetic
particles, called photons.
Photons have momentum ( p = mv)
p is momentum, m is mass, v is velocity The energy of a photon is related to its frequency (E = hγ)
E is energy, h is Plank’s constant, γ is frequency
h = 6.626 x 10 – 34 J · s
De Broglie’s equation
Relates the wave and particle properties of EM radiation
8/2/2019 C28 Spectrometry
http://slidepdf.com/reader/full/c28-spectrometry 6/71
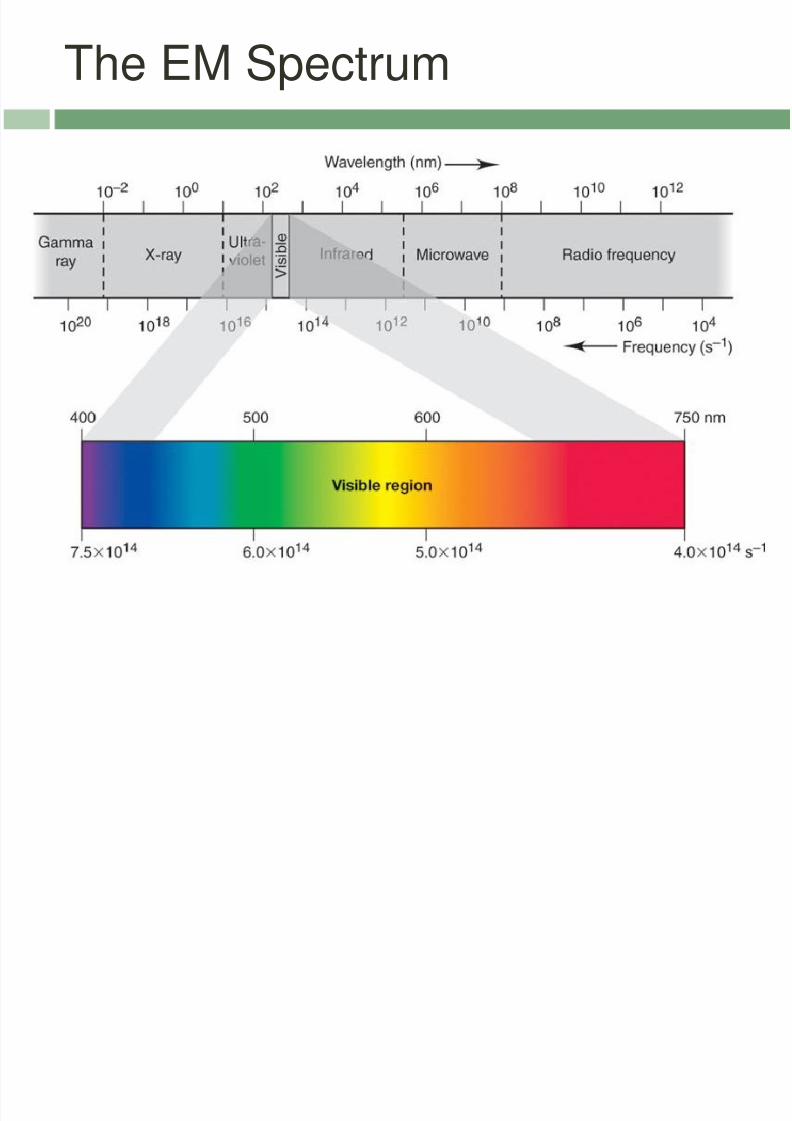
The EM Spectrum
8/2/2019 C28 Spectrometry
http://slidepdf.com/reader/full/c28-spectrometry 7/71
Interactions of EM Radiation with Matter
When a sample absorbs electromagnetic radiation it undergoes a change in
energy.
When a photon is absorbed by a sample, the photon is “destroyed,” and the
photon’s energy acquired by the sample.
Substances can only absorb discrete amounts of energy. The amount differs
from one substance to another.
After absorption of energy, the sample’s atoms, molecules, ions or radicals
become excited. When these excited particles return to their ground states, the
absorbed energy is released (as heat or light, or both).
8/2/2019 C28 Spectrometry
http://slidepdf.com/reader/full/c28-spectrometry 8/71
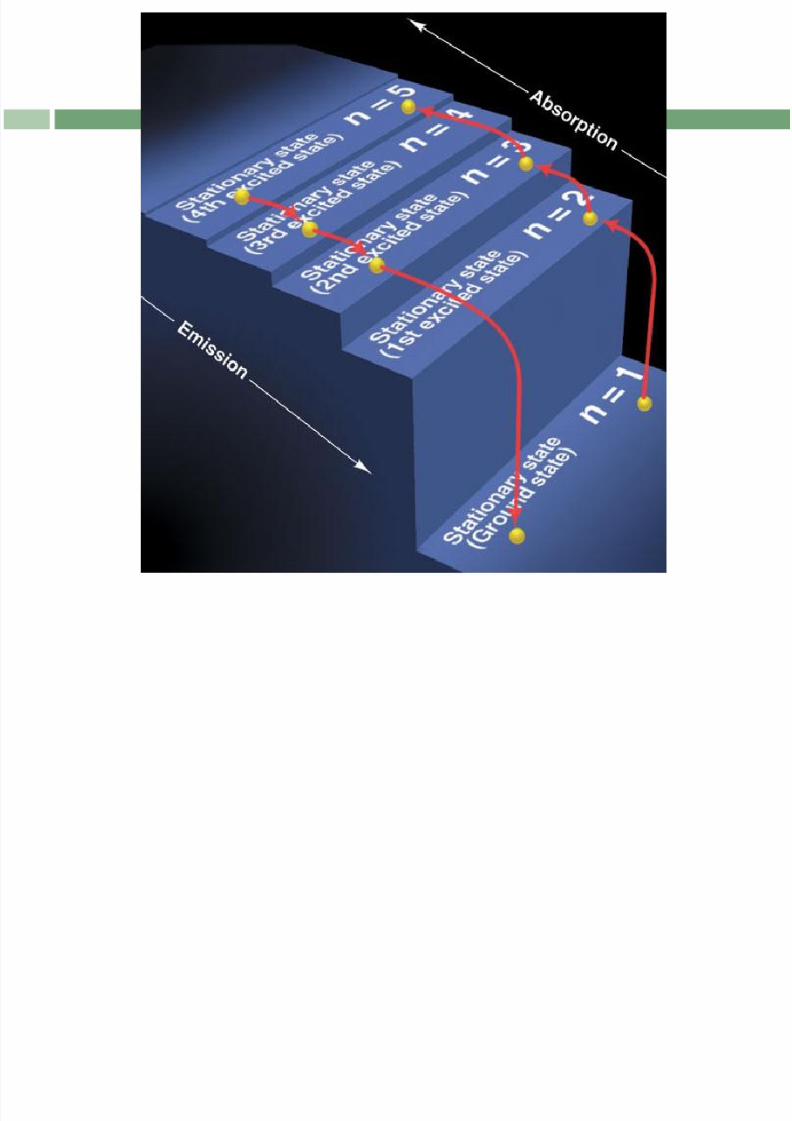
8/2/2019 C28 Spectrometry
http://slidepdf.com/reader/full/c28-spectrometry 9/71
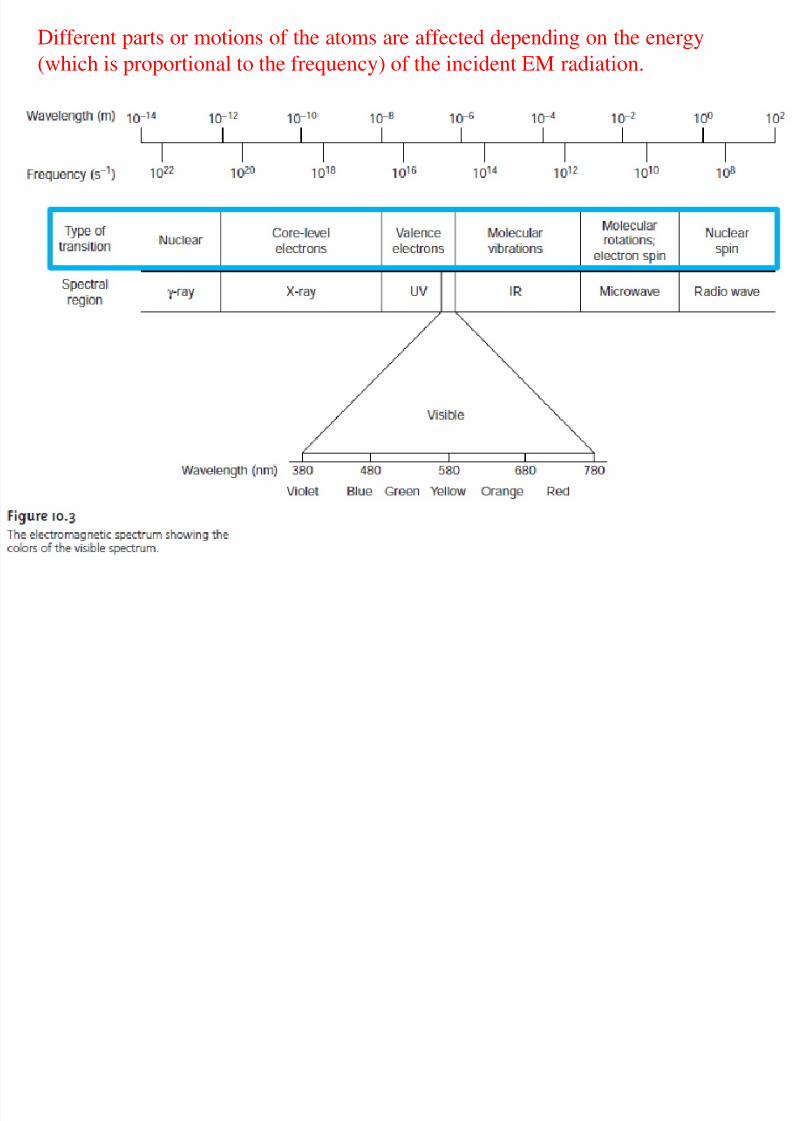
Different parts or motions of the atoms are affected depending on the energy
(which is proportional to the frequency) of the incident EM radiation.
8/2/2019 C28 Spectrometry
http://slidepdf.com/reader/full/c28-spectrometry 10/71
Two Broad Classes of Spectroscopy
1. Involves transfer of energy between photons and the sample: absorption and
emission of radiation.
In absorption spectroscopy the energy carried by a photon is absorbed by
the analyte, promoting the analyte from a lower-energy state to a higher-
energy, or excited , state. The source of the energetic state depends on the photon’s energy.
The intensity of photons passing through a sample containing the analyte is
attenuated because of absorption.
The measurement of this attenuation, which we call absorbance, serves
as our signal. Absorption only occurs when the photon’s energy matches the difference
in energy, Δ E , between two energy levels.
A plot of absorbance as a function of the photon’s energy (proportional to
its frequency or wavelength) is called an absorbance spectrum

8/2/2019 C28 Spectrometry
http://slidepdf.com/reader/full/c28-spectrometry 11/71
Emission of a photon occurs when an analyte in a higher-energy state
returns to a lower-energy state.
The higher-energy state is produced after the analyte has absorbed of
photon, or after the analyte has undergone a chemiluminescent reaction.
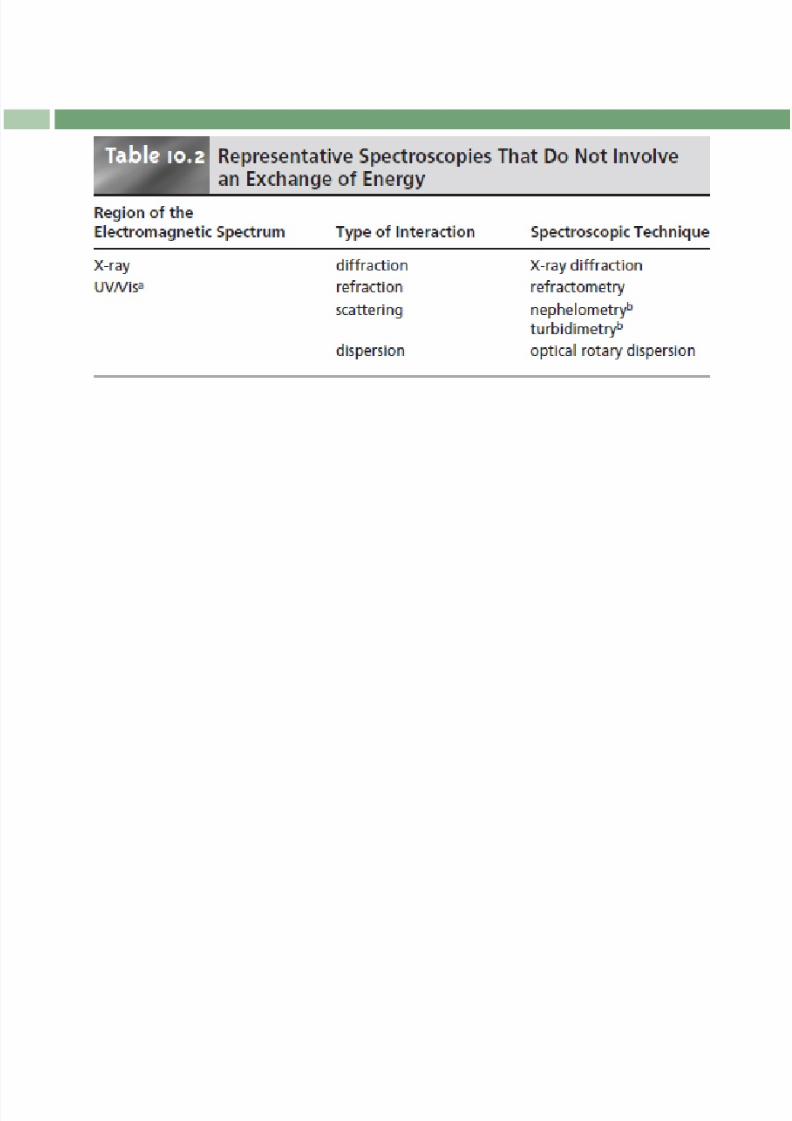
2. Involves changes in amplitude, polarization, phase angle or direction of
propagation of the incident radiation due to refraction, reflection,
scattering, diffraction, or dispersion by the sample.

8/2/2019 C28 Spectrometry
http://slidepdf.com/reader/full/c28-spectrometry 12/71
8/2/2019 C28 Spectrometry
http://slidepdf.com/reader/full/c28-spectrometry 13/71

8/2/2019 C28 Spectrometry
http://slidepdf.com/reader/full/c28-spectrometry 14/71
Measuring EM Radiation
Absorbance
Attenuation (lessening) of
radiation due to absorption by
the analyte.
Absorbance only at the λmax
(quantitative analysis)
Full absorption spectrum
(qualitative analysis)
8/2/2019 C28 Spectrometry
http://slidepdf.com/reader/full/c28-spectrometry 15/71
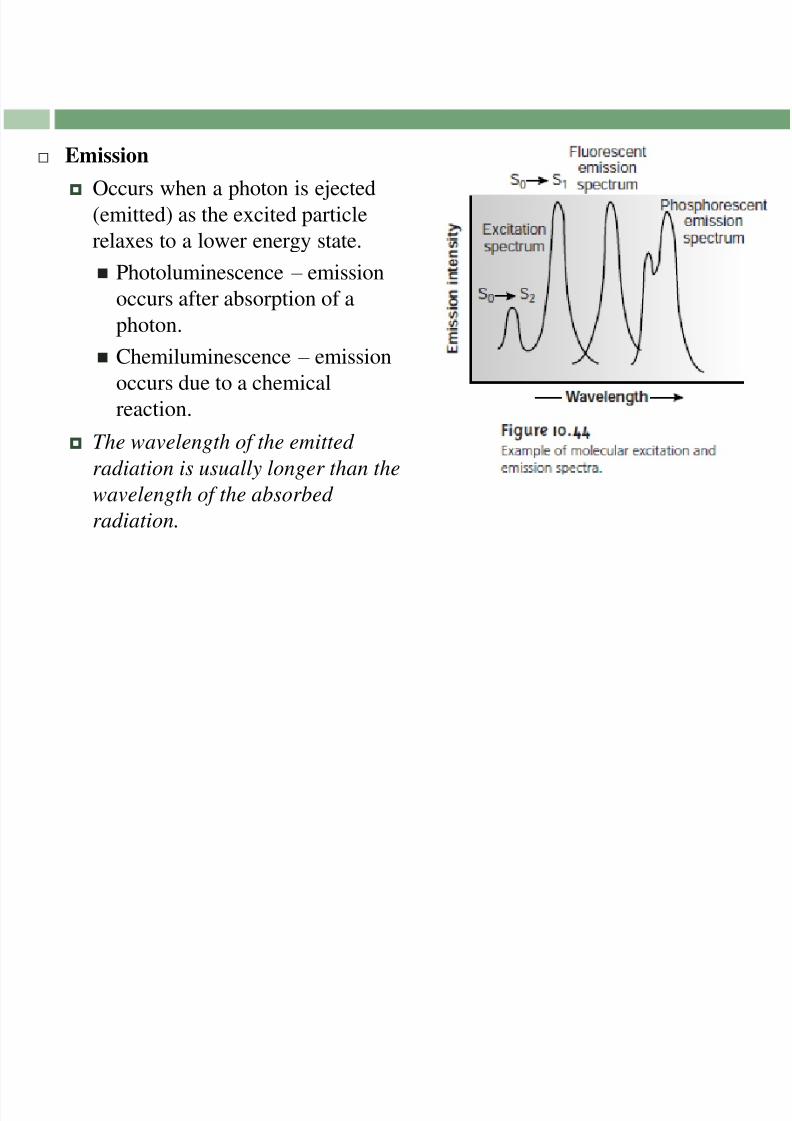
Emission
Occurs when a photon is ejected
(emitted) as the excited particle
relaxes to a lower energy state.
Photoluminescence – emissionoccurs after absorption of a
photon.
Chemiluminescence – emission
occurs due to a chemical
reaction. The wavelength of the emitted
radiation is usually longer than the
wavelength of the absorbed
radiation.
8/2/2019 C28 Spectrometry
http://slidepdf.com/reader/full/c28-spectrometry 16/71
Basic Components of Spectrometers
1. Energy source
Source of EM radiation or thermal energy
2. Wavelength/frequency selector
Selects a very narrow band from the continuum radiation spectrum to
interact with the sample.
3. Detector
Senses changes in the intensity, polarization, phase angle or direction of
propagation of the incident radiation.
4. Signal processor Electronic component that calculates and converts the electric signals to
numerical or graphical data.
8/2/2019 C28 Spectrometry
http://slidepdf.com/reader/full/c28-spectrometry 17/71
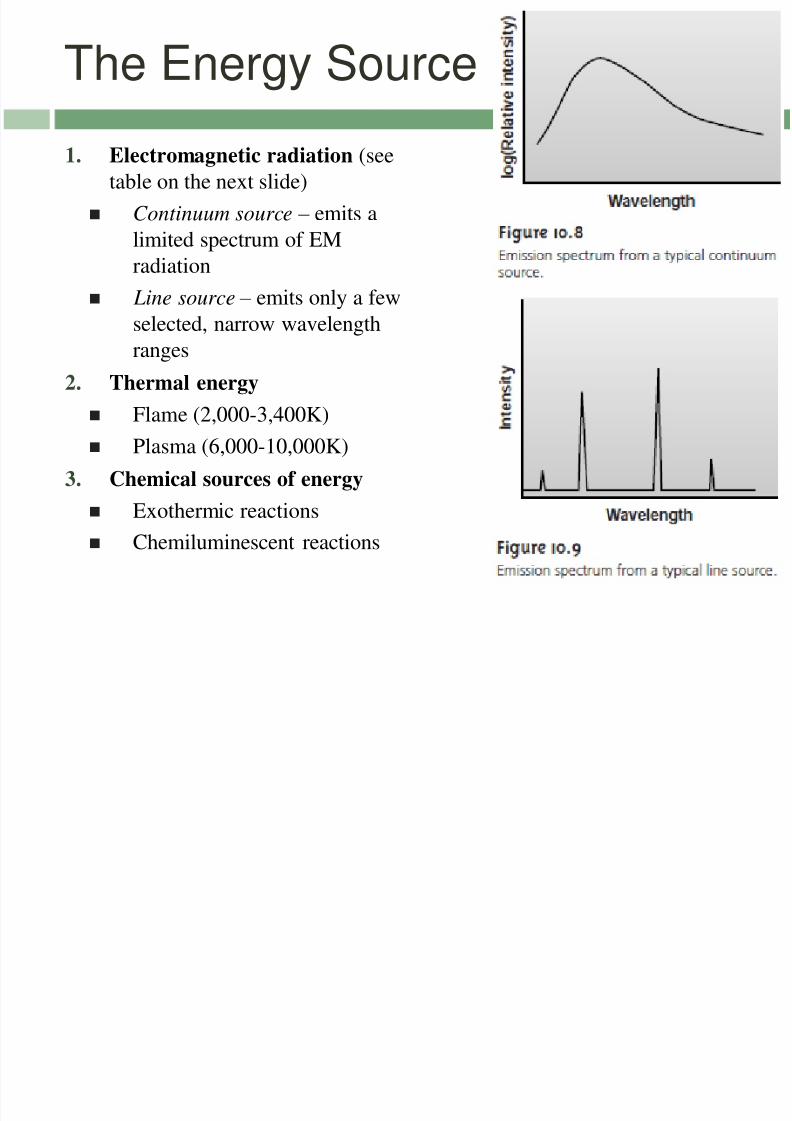
The Energy Source
1. Electromagnetic radiation (see
table on the next slide)
Continuum source – emits a
limited spectrum of EM
radiation
Line source – emits only a few
selected, narrow wavelength
ranges
2. Thermal energy
Flame (2,000-3,400K) Plasma (6,000-10,000K)
3. Chemical sources of energy
Exothermic reactions
Chemiluminescent reactions
8/2/2019 C28 Spectrometry
http://slidepdf.com/reader/full/c28-spectrometry 18/71
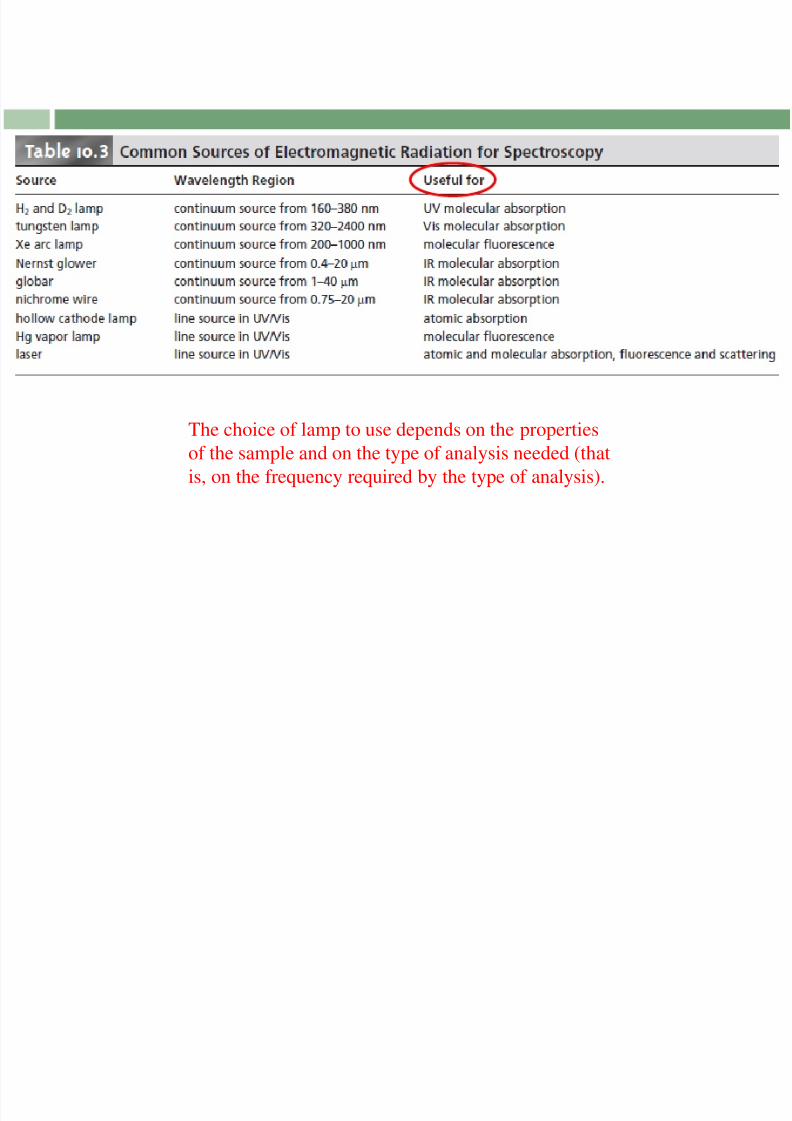
The choice of lamp to use depends on the properties
of the sample and on the type of analysis needed (that
is, on the frequency required by the type of analysis).

8/2/2019 C28 Spectrometry
http://slidepdf.com/reader/full/c28-spectrometry 19/71
Each kind of lamp listed in the table in the
previous slide has its own emission (continuum or
line) spectrum.
Observe that the intensity at each wavelength
(figures on the right) is different. When the lamp
is new, the intensities are high and the
spectrometer is accurate even at high sample
concentrations.
However, as the lamp wears out, the
intensities get weaker. This is one reason why spectrometers have
to be calibrated often.
Some spectrometer models are equipped with
a feature that tests the lamp’s performance.
8/2/2019 C28 Spectrometry
http://slidepdf.com/reader/full/c28-spectrometry 20/71
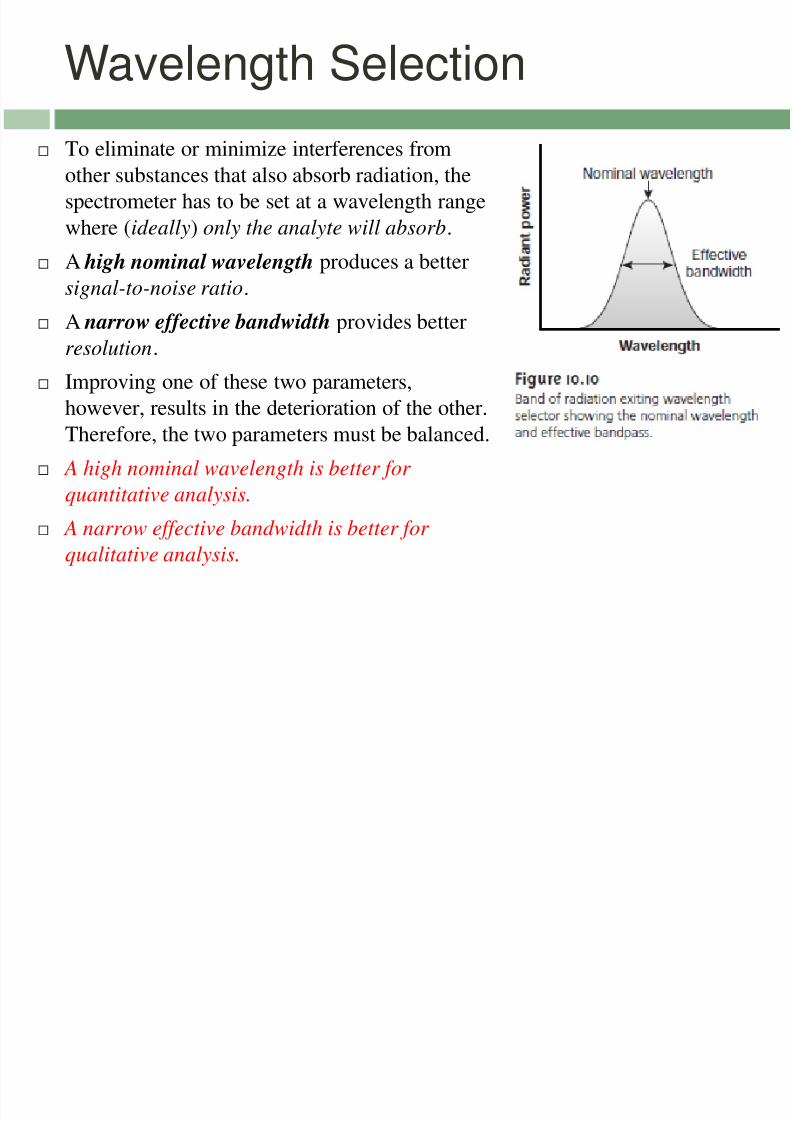
Wavelength Selection
To eliminate or minimize interferences from
other substances that also absorb radiation, the
spectrometer has to be set at a wavelength range
where (ideally) only the analyte will absorb.
A high nominal wavelength produces a better
signal-to-noise ratio.
A narrow effective bandwidth provides better
resolution.
Improving one of these two parameters,
however, results in the deterioration of the other.Therefore, the two parameters must be balanced.
A high nominal wavelength is better for
quantitative analysis.
A narrow effective bandwidth is better for
qualitative analysis.
8/2/2019 C28 Spectrometry
http://slidepdf.com/reader/full/c28-spectrometry 21/71
Wavelength Selectors
Monochromators
Unlike filters in which the selected band is fixed, monochromators can be adjusted to any band needed .
Two types: fixed wavelength (for quantitative analyses only) and scanning.
Interferometers
Instead of filtering or dispersing the electromagnetic radiation, an interferometer
simultaneously allows source radiation of ALL wavelengths to reach the detector.
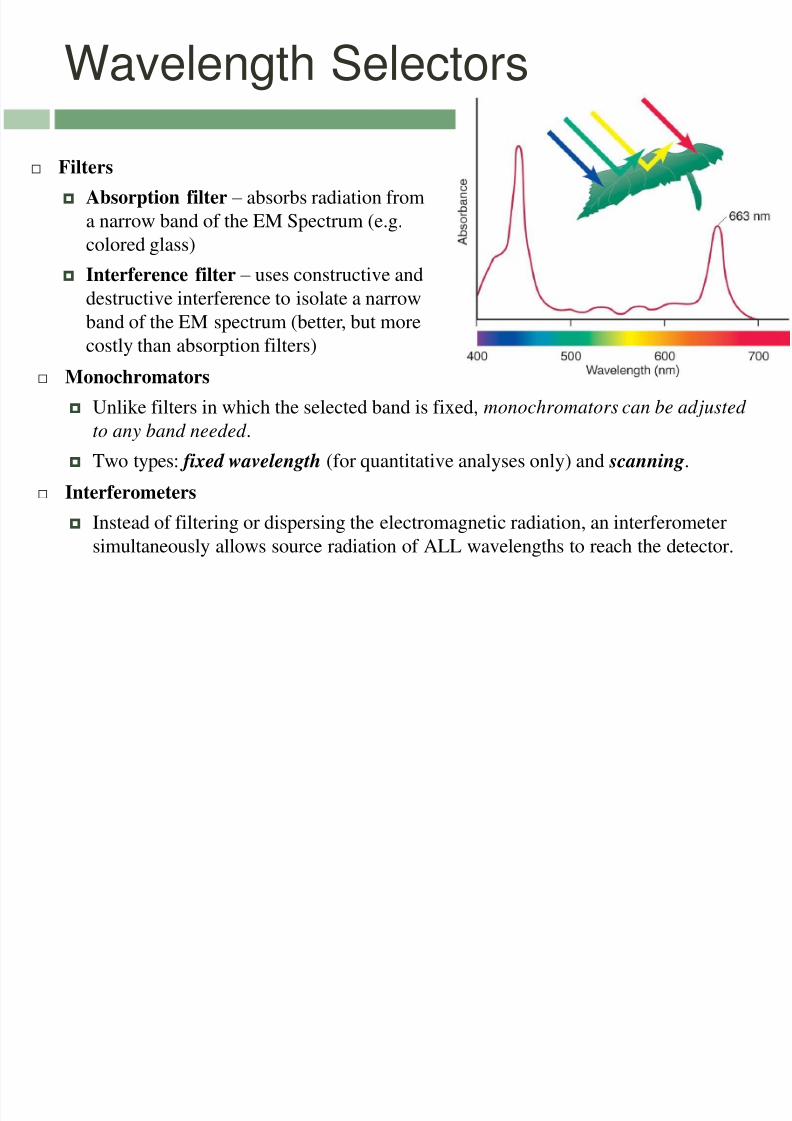
Filters
Absorption filter – absorbs radiation from
a narrow band of the EM Spectrum (e.g.
colored glass)
Interference filter – uses constructive anddestructive interference to isolate a narrow
band of the EM spectrum (better, but more
costly than absorption filters)
8/2/2019 C28 Spectrometry
http://slidepdf.com/reader/full/c28-spectrometry 22/71

8/2/2019 C28 Spectrometry
http://slidepdf.com/reader/full/c28-spectrometry 23/71
The Monochromator
Functions of each part
Collimating mirror – reflects a
parallel beam of radiation
Diffraction grating – optically
reflecting surface with a large
number of parallel grooves.
Diffraction by the grating disperses
the radiation in space.
Wavelength selection is done by
rotating the diffraction grating.
In some, a prism is used instead.
Focusing mirror – combines
radiation of the same wavelength.
Exit slit – improves the resolution
by narrowing the bandwidth.
Polychromatic
EM radiation
source
8/2/2019 C28 Spectrometry
http://slidepdf.com/reader/full/c28-spectrometry 24/71
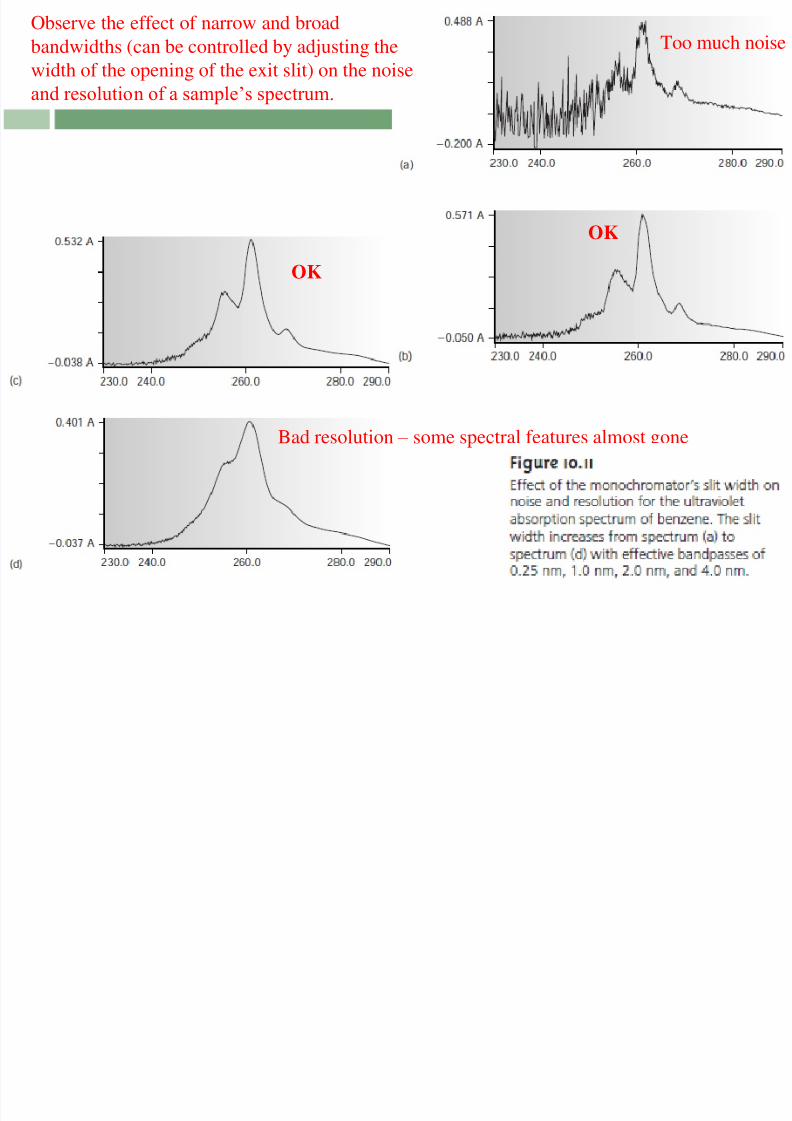
Observe the effect of narrow and broad
bandwidths (can be controlled by adjusting the
width of the opening of the exit slit) on the noise
and resolution of a sample’s spectrum.
Too much noise
Bad resolution – some spectral features almost gone
OK
OK

8/2/2019 C28 Spectrometry
http://slidepdf.com/reader/full/c28-spectrometry 25/71
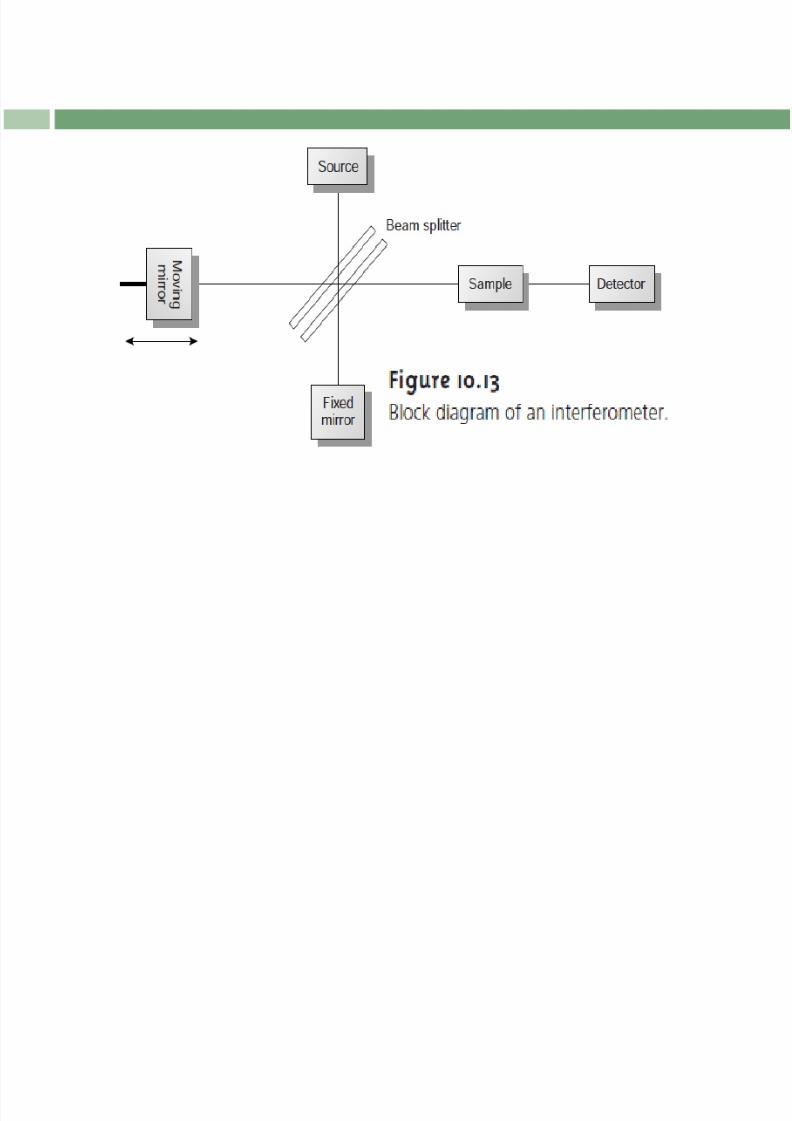
The Interferometer
The beam splitter splits the radiation beam in two. Each beam is reflected on either of
the two mirrors. Then both beams are recombined on the sample/detector.
The recombination of the two beams creates an interference pattern (an
interferogram) for ALL WAVELENGTHS SIMULTANEOUSLY.
The amount of radiation absorbed by the sample, at every wavelength, is calculated
(Fourier Transformations) with the aid of a modern computer.
Advantages over monochromators:
Jacquinot’s advantage: higher throughput of source radiation because of
interferometers have fewer parts (no slits, and other components from radiation is
scattered or lost).
Resulting to a very high nominal wavelength (that is, better signal-to-noise
ratio)
Fellgett’s advantage: much faster because all wavelengths are analyzed
simultaneously
8/2/2019 C28 Spectrometry
http://slidepdf.com/reader/full/c28-spectrometry 26/71
8/2/2019 C28 Spectrometry
http://slidepdf.com/reader/full/c28-spectrometry 27/71
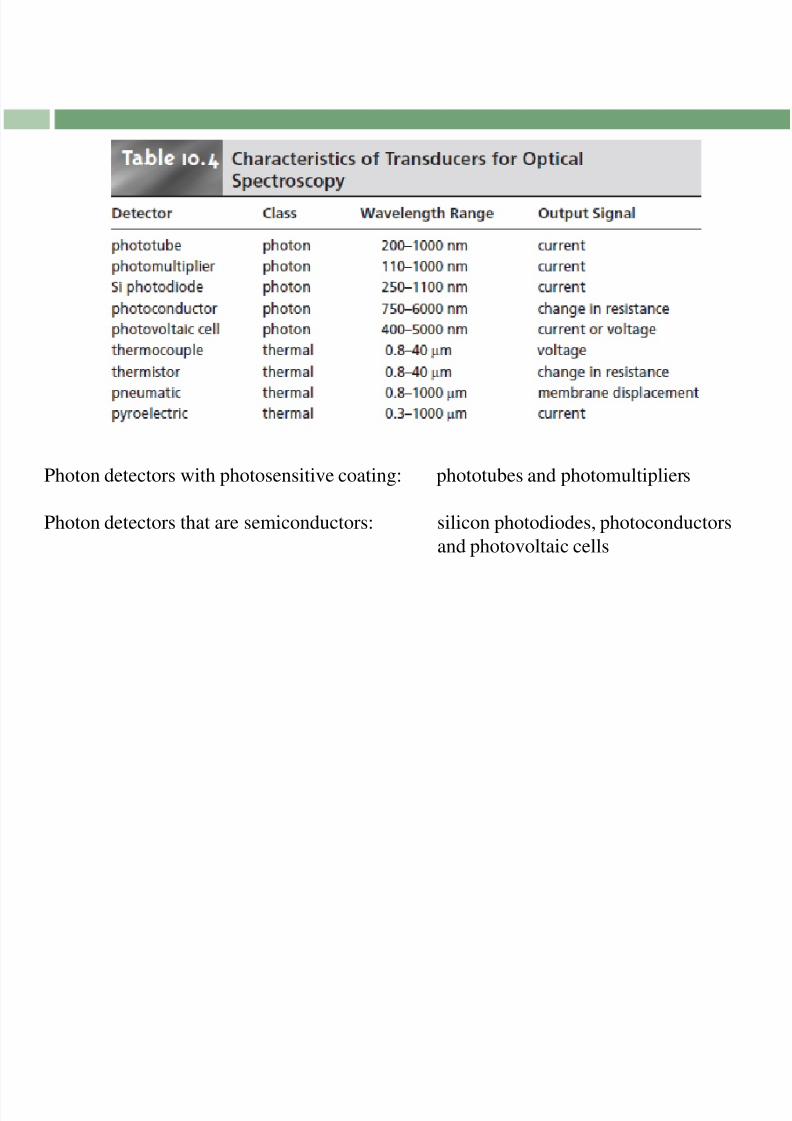
Detectors
Modern detectors use sensitive transducers that convert light or heat into
electrical signals.
Ideally the detector’s signal should be a linear function of the electromagnetic
radiation’s power.
Photon transducers Silicon photodiodes can be miniaturized and arranged in an array
Thermal transducers
Frequently used for IR spectrometers (because IR radiation has
insufficient energy to activate photon transducers)
8/2/2019 C28 Spectrometry
http://slidepdf.com/reader/full/c28-spectrometry 28/71
Photon detectors with photosensitive coating: phototubes and photomultipliers
Photon detectors that are semiconductors: silicon photodiodes, photoconductors
and photovoltaic cells
8/2/2019 C28 Spectrometry
http://slidepdf.com/reader/full/c28-spectrometry 29/71
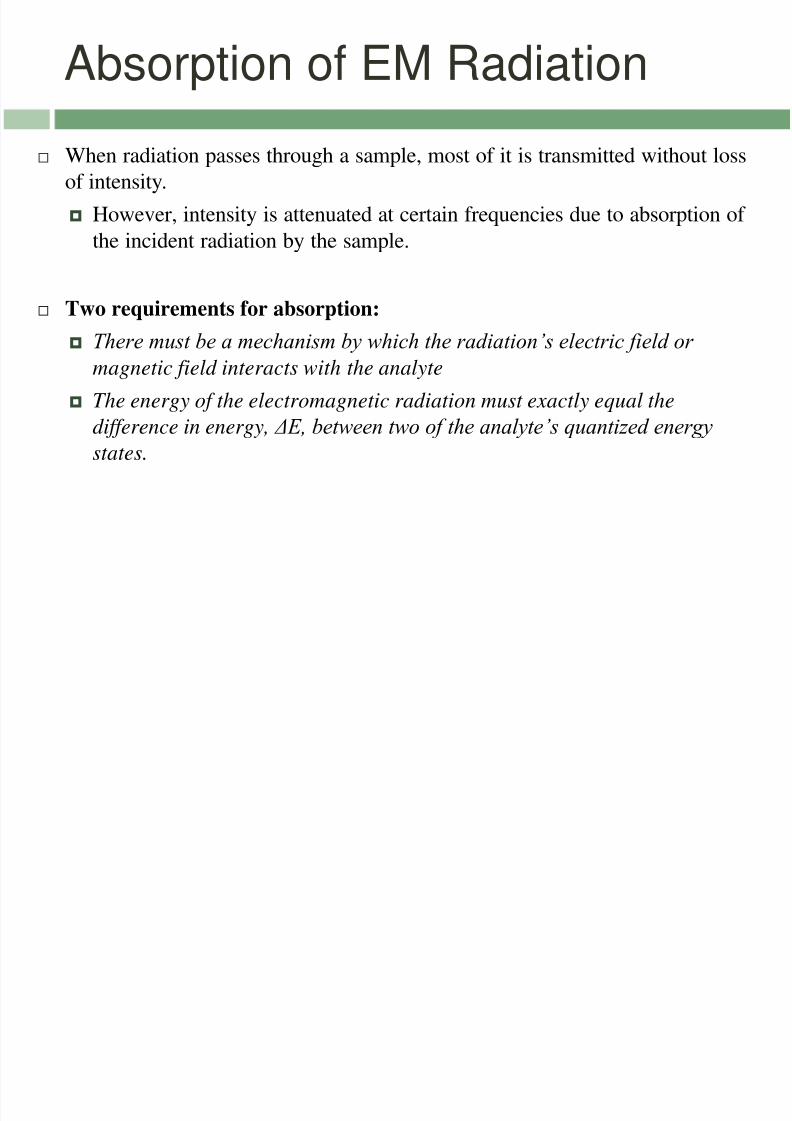
Absorption of EM Radiation
When radiation passes through a sample, most of it is transmitted without loss
of intensity.
However, intensity is attenuated at certain frequencies due to absorption of
the incident radiation by the sample.
Two requirements for absorption:
There must be a mechanism by which the radiation’s electric field or
magnetic field interacts with the analyte
The energy of the electromagnetic radiation must exactly equal the
difference in energy, ΔE, between two of the analyte’s quantized energy
states.

8/2/2019 C28 Spectrometry
http://slidepdf.com/reader/full/c28-spectrometry 30/71
Vibrational
states
Electronic states
8/2/2019 C28 Spectrometry
http://slidepdf.com/reader/full/c28-spectrometry 31/71
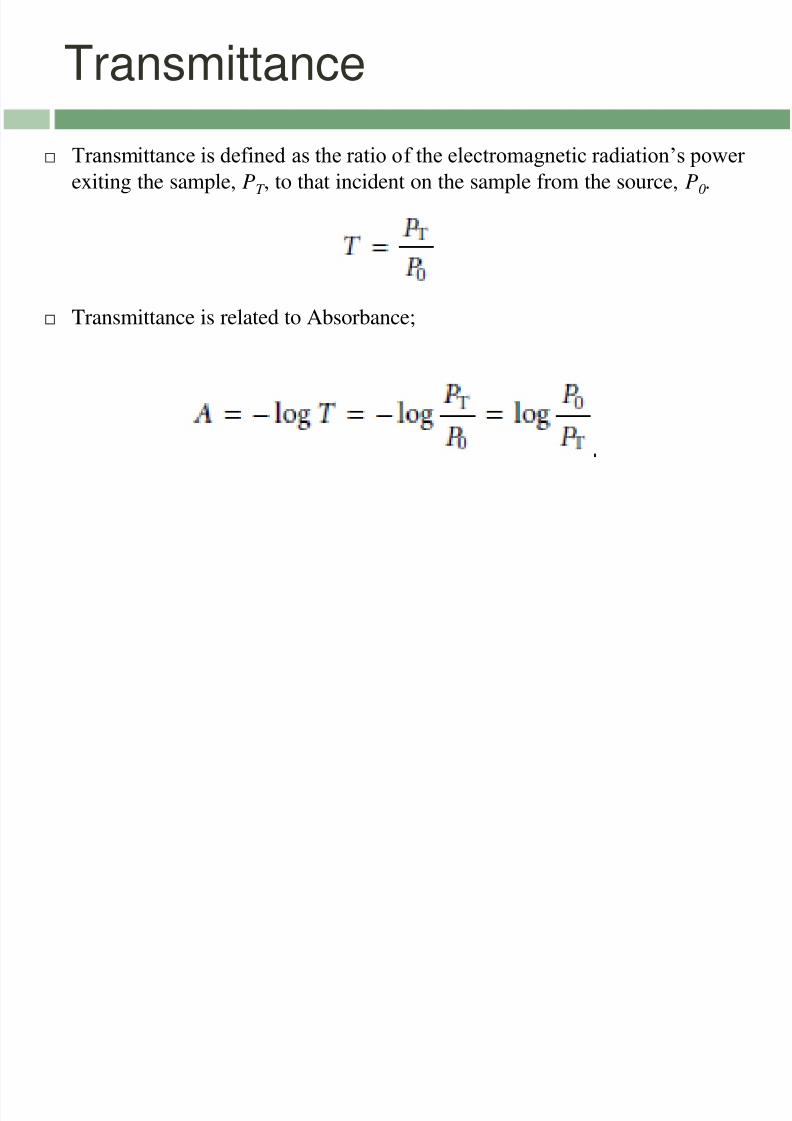
Transmittance
Transmittance is defined as the ratio of the electromagnetic radiation’s power
exiting the sample, PT , to that incident on the sample from the source, P0.
Transmittance is related to Absorbance;
8/2/2019 C28 Spectrometry
http://slidepdf.com/reader/full/c28-spectrometry 32/71
8/2/2019 C28 Spectrometry
http://slidepdf.com/reader/full/c28-spectrometry 33/71
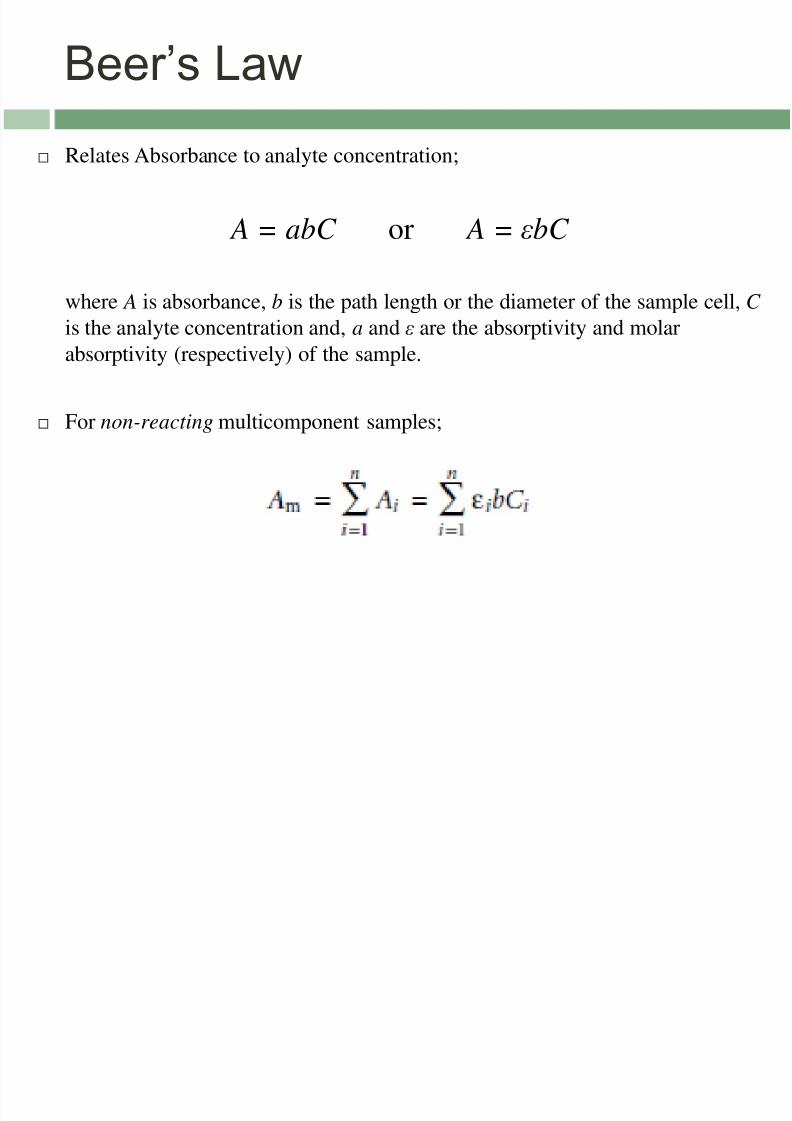
Beer’s Law
Relates Absorbance to analyte concentration;
A = abC or A = εbC
where A is absorbance, b is the path length or the diameter of the sample cell, C
is the analyte concentration and, a and ε are the absorptivity and molar
absorptivity (respectively) of the sample.
For non-reacting multicomponent samples;
8/2/2019 C28 Spectrometry
http://slidepdf.com/reader/full/c28-spectrometry 34/71
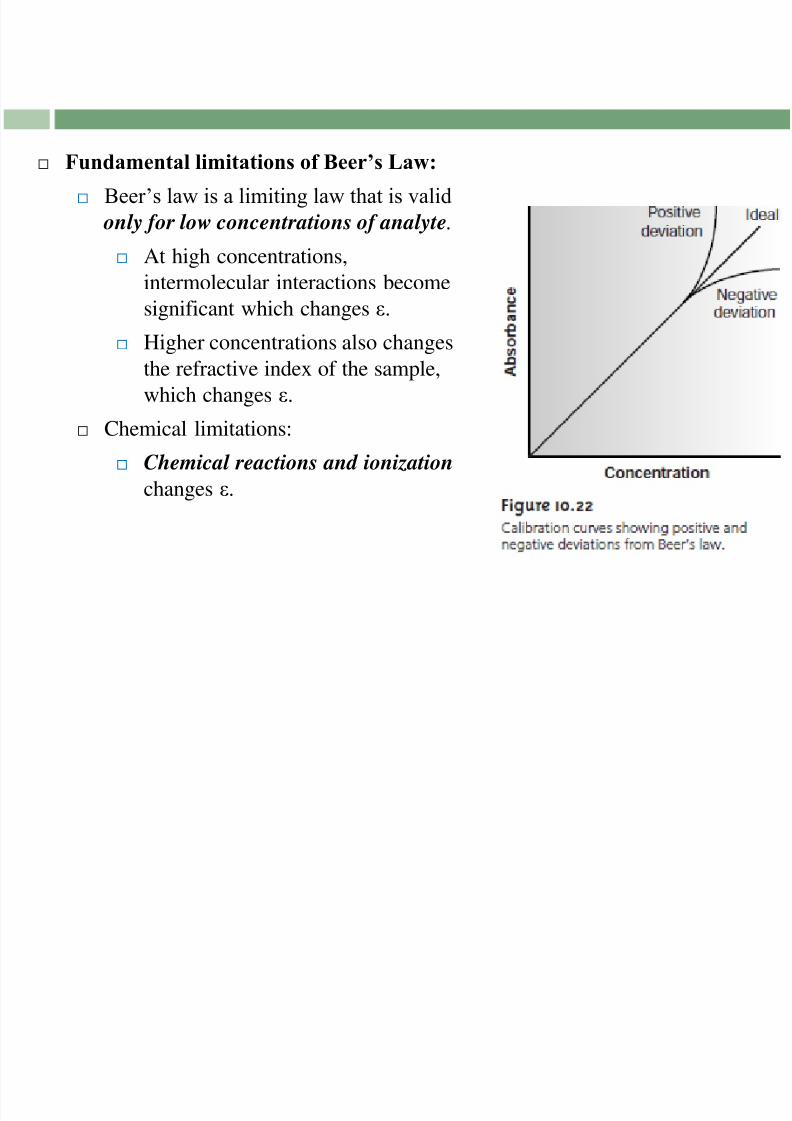
Fundamental limitations of Beer’s Law:
Beer’s law is a limiting law that is valid
only for low concentrations of analyte.
At high concentrations,
intermolecular interactions becomesignificant which changes ε.
Higher concentrations also changes
the refractive index of the sample,
which changes ε.
Chemical limitations:
Chemical reactions and ionization
changes ε.
8/2/2019 C28 Spectrometry
http://slidepdf.com/reader/full/c28-spectrometry 35/71
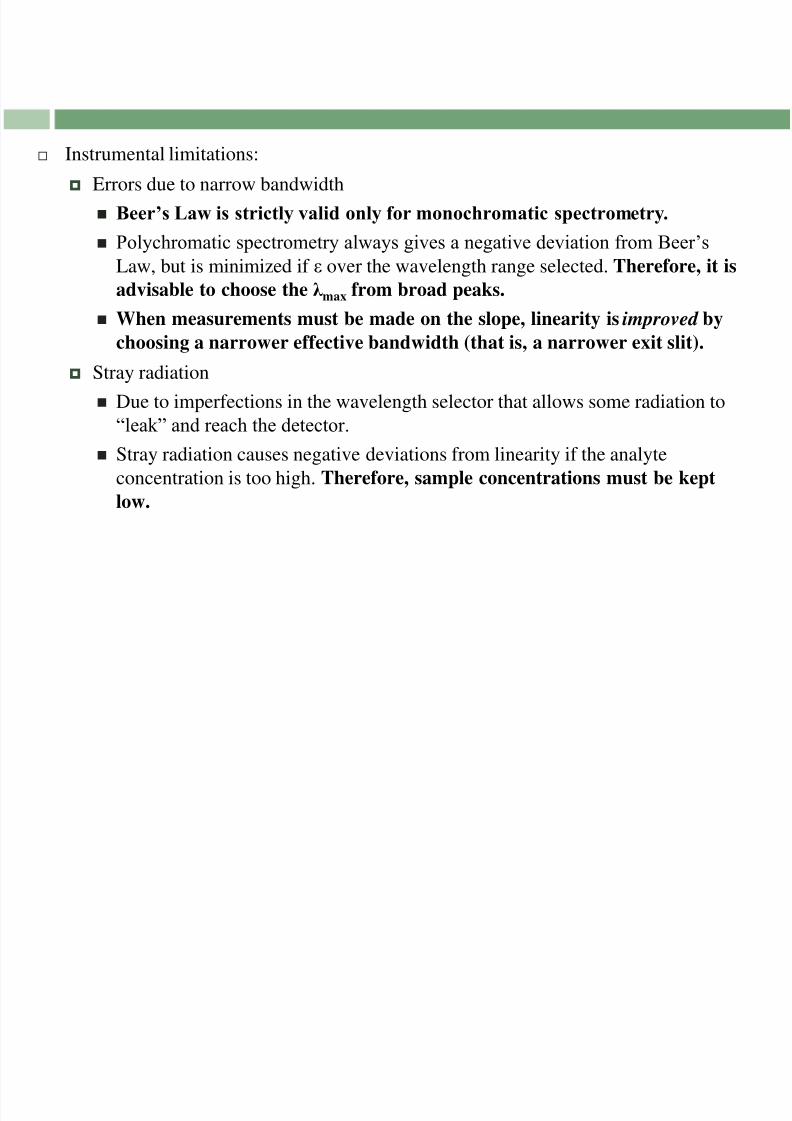
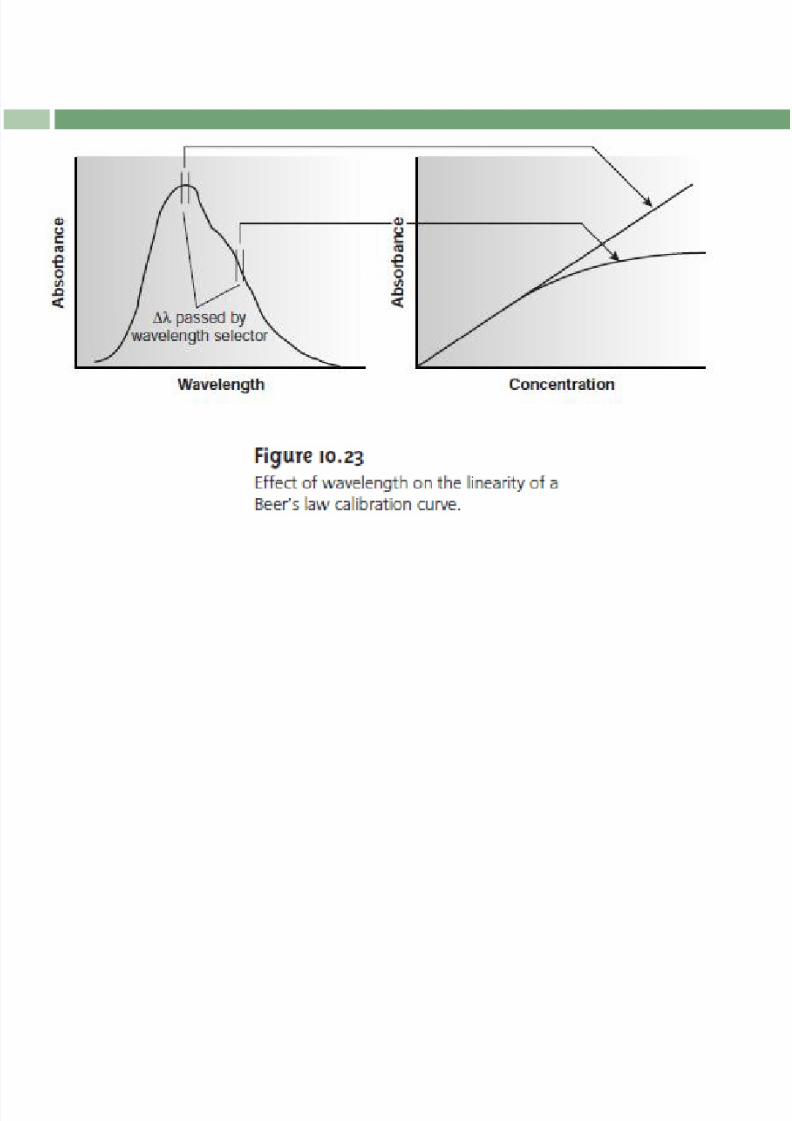
Instrumental limitations:
Errors due to narrow bandwidth
Beer’s Law is strictly valid only for monochromatic spectrometry.
Polychromatic spectrometry always gives a negative deviation from Beer’s
Law, but is minimized if ε over the wavelength range selected. Therefore, it is
advisable to choose the λ max from broad peaks.
When measurements must be made on the slope, linearity is improved by
choosing a narrower effective bandwidth (that is, a narrower exit slit).
Stray radiation
Due to imperfections in the wavelength selector that allows some radiation to
“leak” and reach the detector.
Stray radiation causes negative deviations from linearity if the analyte
concentration is too high. Therefore, sample concentrations must be kept
low.
8/2/2019 C28 Spectrometry
http://slidepdf.com/reader/full/c28-spectrometry 36/71
8/2/2019 C28 Spectrometry
http://slidepdf.com/reader/full/c28-spectrometry 37/71
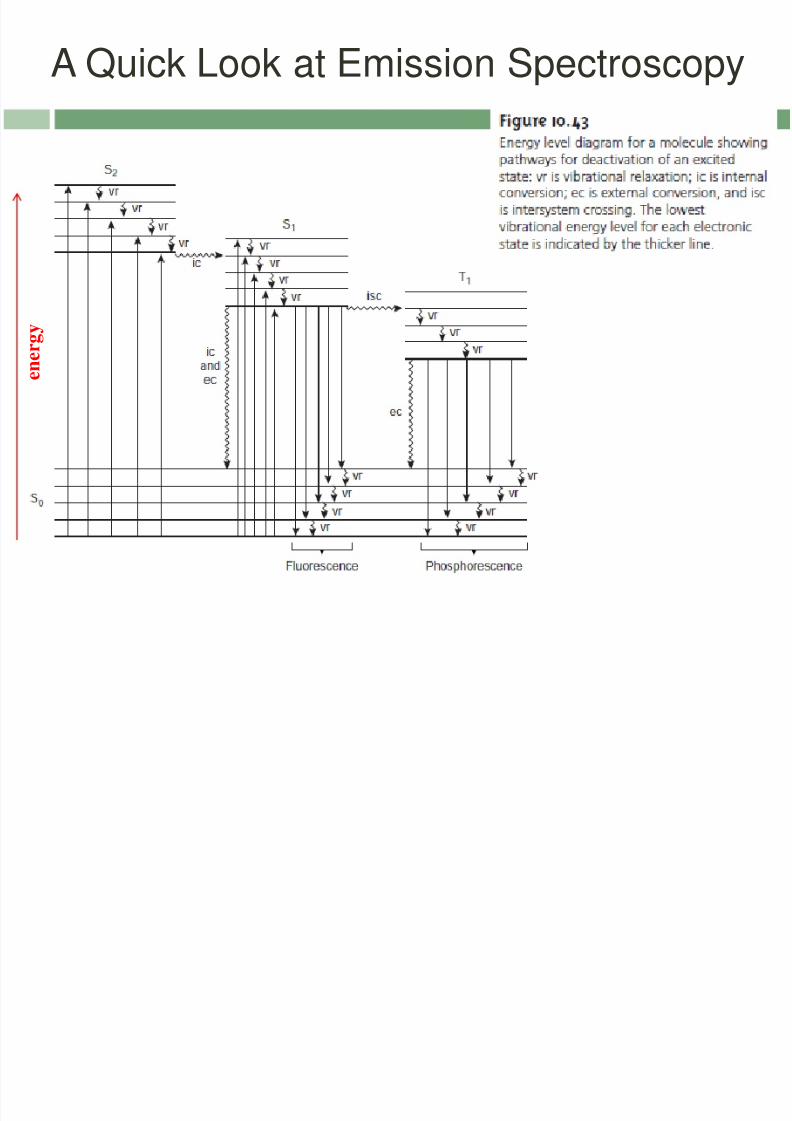
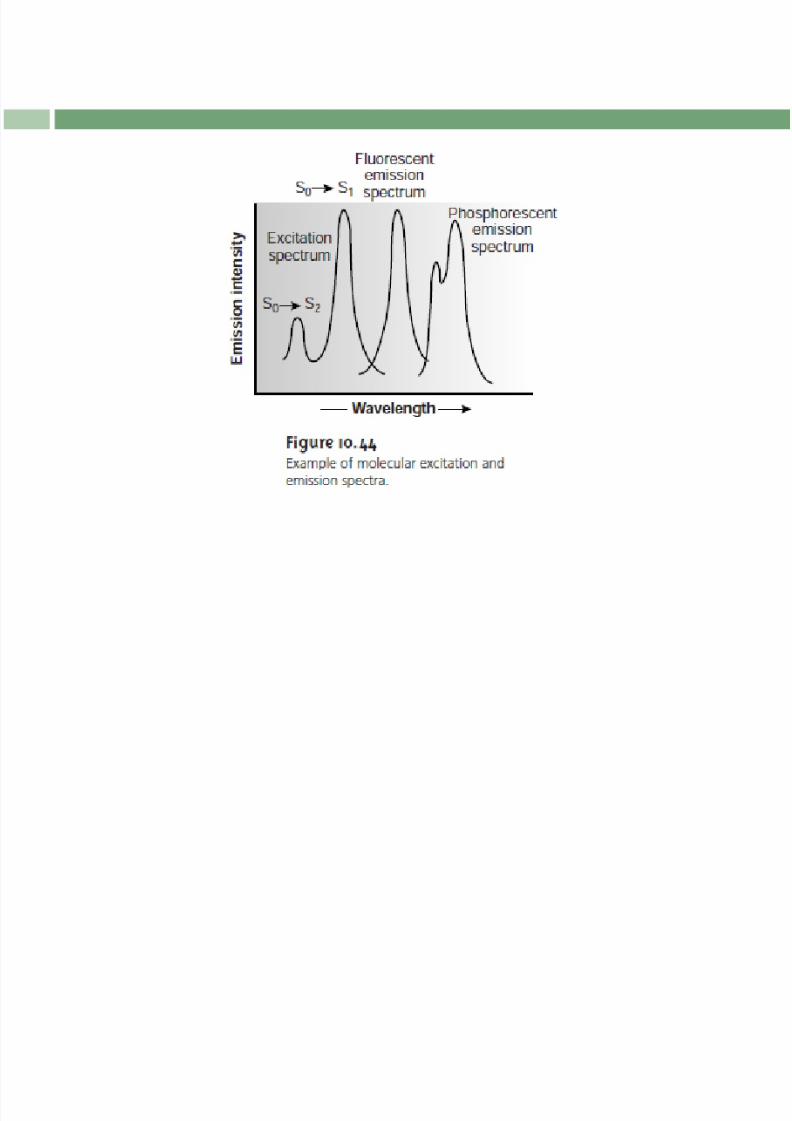
A Quick Look at Emission Spectroscopy
e n e r g y
8/2/2019 C28 Spectrometry
http://slidepdf.com/reader/full/c28-spectrometry 38/71
8/2/2019 C28 Spectrometry
http://slidepdf.com/reader/full/c28-spectrometry 39/71
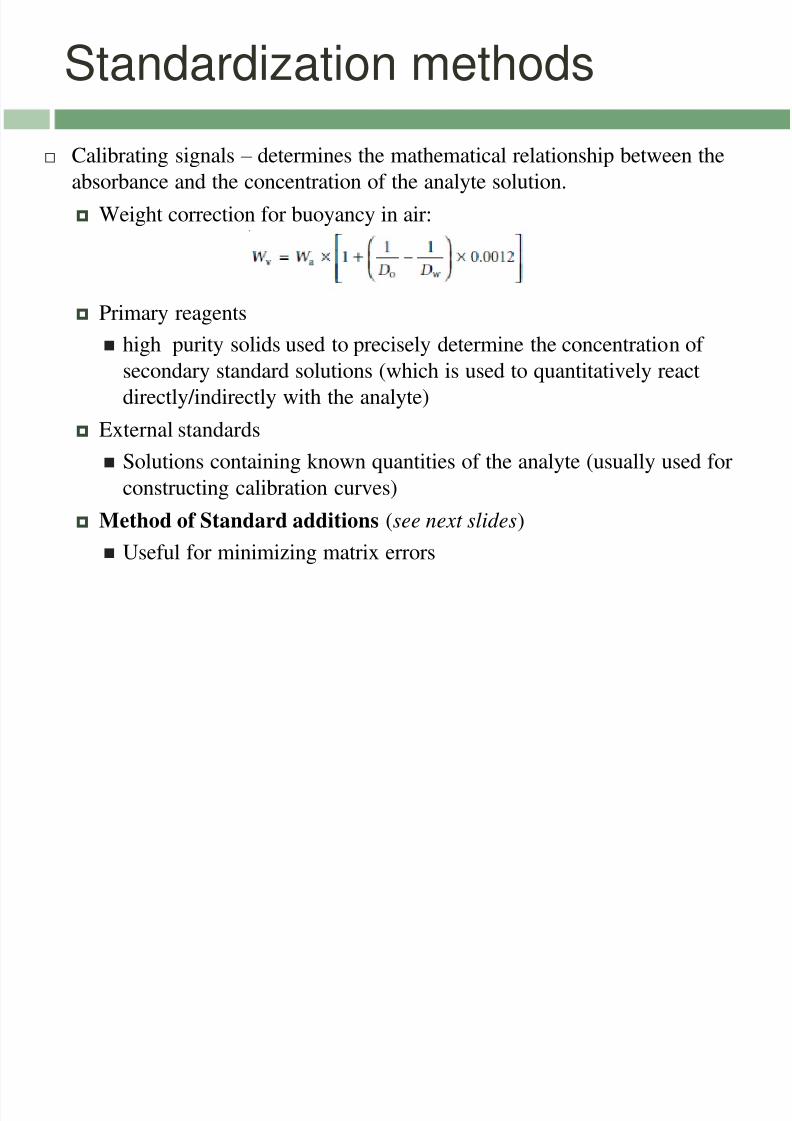
Standardization methods
Calibrating signals – determines the mathematical relationship between the
absorbance and the concentration of the analyte solution.
Weight correction for buoyancy in air:
Primary reagents
high purity solids used to precisely determine the concentration of
secondary standard solutions (which is used to quantitatively react
directly/indirectly with the analyte)
External standards
Solutions containing known quantities of the analyte (usually used for
constructing calibration curves)
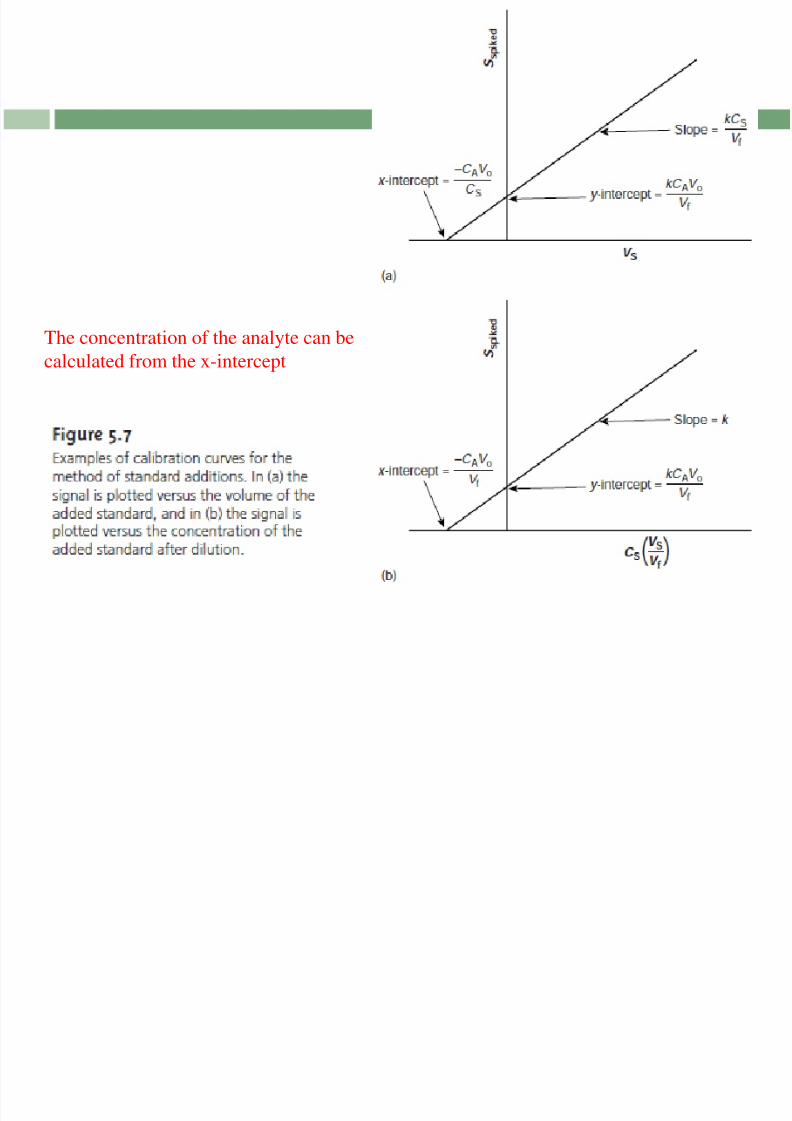
Method of Standard additions (see next slides)
Useful for minimizing matrix errors
8/2/2019 C28 Spectrometry
http://slidepdf.com/reader/full/c28-spectrometry 40/71

8/2/2019 C28 Spectrometry
http://slidepdf.com/reader/full/c28-spectrometry 41/71
8/2/2019 C28 Spectrometry
http://slidepdf.com/reader/full/c28-spectrometry 42/71
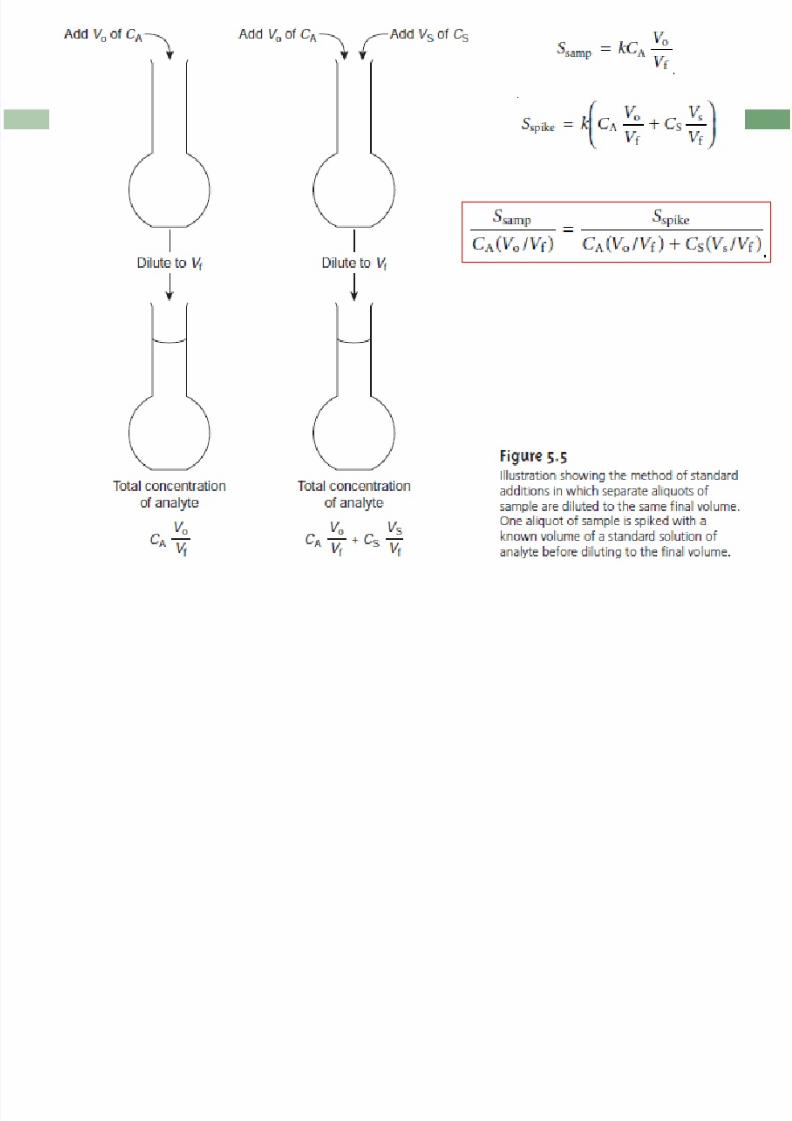
The concentration of the analyte can be
calculated from the x-intercept
8/2/2019 C28 Spectrometry
http://slidepdf.com/reader/full/c28-spectrometry 43/71
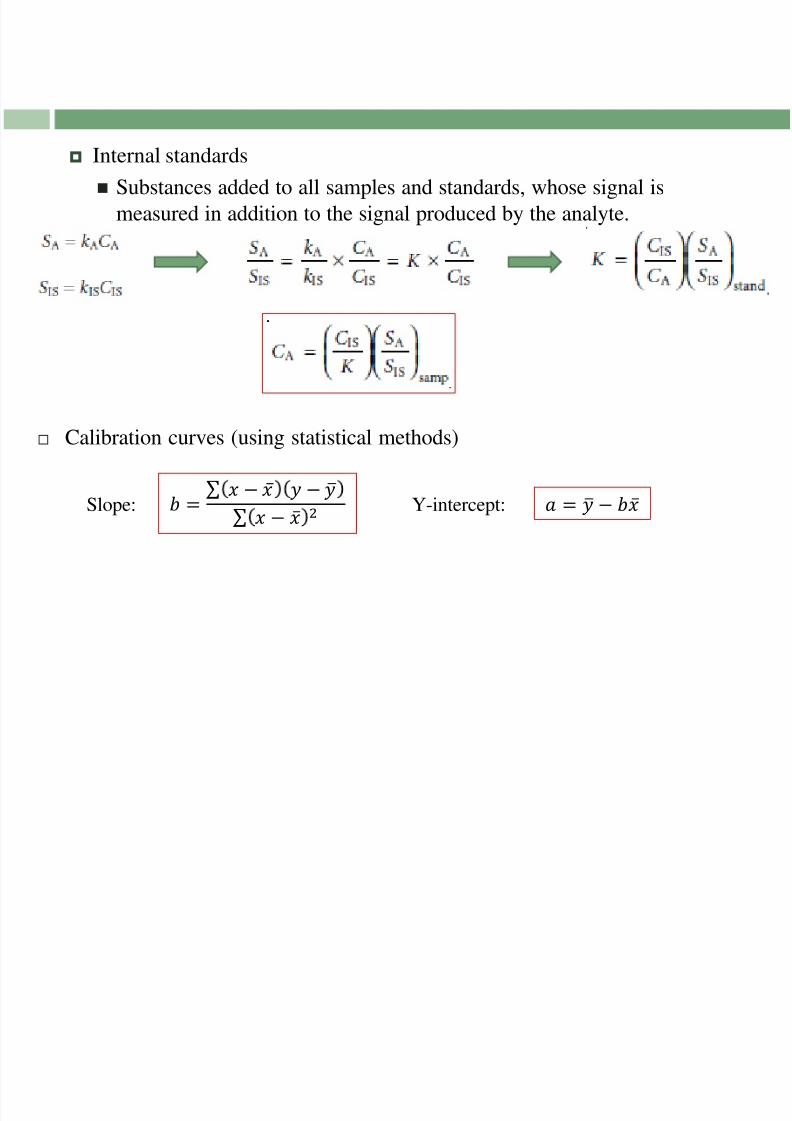
Internal standards
Substances added to all samples and standards, whose signal is
measured in addition to the signal produced by the analyte.
Calibration curves (using statistical methods)
Slope: Y-intercept: = − −
− 2 = −
8/2/2019 C28 Spectrometry
http://slidepdf.com/reader/full/c28-spectrometry 44/71
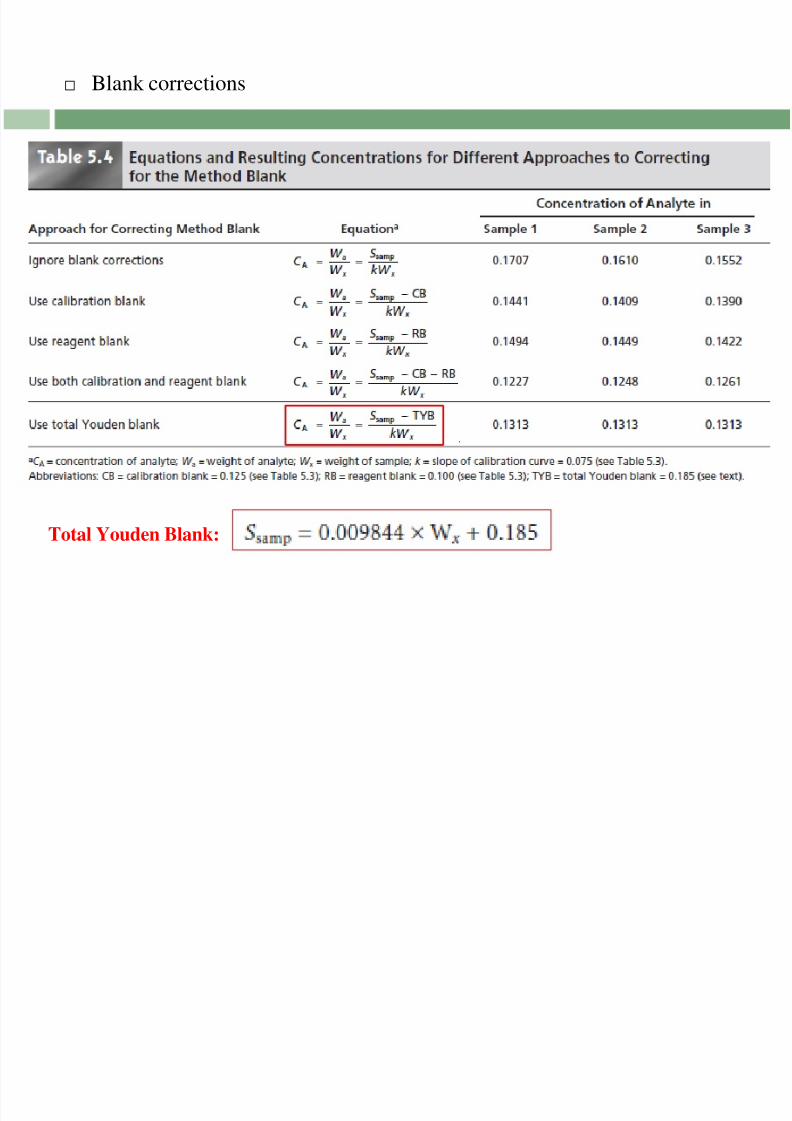
Blank corrections
Total Youden Blank:
8/2/2019 C28 Spectrometry
http://slidepdf.com/reader/full/c28-spectrometry 45/71
UV-Vis Spectroscopy
When a molecule or ion absorbs ultraviolet or visible radiation it undergoes achange in its valence electron configuration.
Instrument Designs
Filter Photometer
Single-Beam Fixed-Wavelength Spectrophotometer
Double-Beam In-Time Scanning Spectrophotometer
Diode Array Spectrophotometer
Instruments using monochromators for wavelength selection are calledspectrometers.
In absorbance spectroscopy, where the transmittance is a ratio of two radiantpowers, the instrument is called a spectrophotometer.

8/2/2019 C28 Spectrometry
http://slidepdf.com/reader/full/c28-spectrometry 46/71
The Filter Photometer
A single-beam instrument.
Portable, rugged, easy to maintain and
inexpensive. Calibrated to 0%T with the shutter closed, then
to 100%T with the “blank sample”.
Must be recalibrated every time the filter is
changed.
Either an absorption or
interference filter
The Single Beam Fixed Wavelength

8/2/2019 C28 Spectrometry
http://slidepdf.com/reader/full/c28-spectrometry 47/71
The Single-Beam Fixed-WavelengthSpectrophotometer
Calibrated and used in the same way as photometers.
More appropriate for a quantitative analysis than for a
qualitative analysis.
Fixed-wavelength single-beam spectrophotometers are not
practical for recording spectra since manually adjusting the
wavelength and recalibrating the spectrophotometer is
awkward and time-consuming.
The accuracy of a single-beam spectrophotometer is
limited by the stability of its source and detector over time.
The Double Beam In Time Scanning
8/2/2019 C28 Spectrometry
http://slidepdf.com/reader/full/c28-spectrometry 48/71
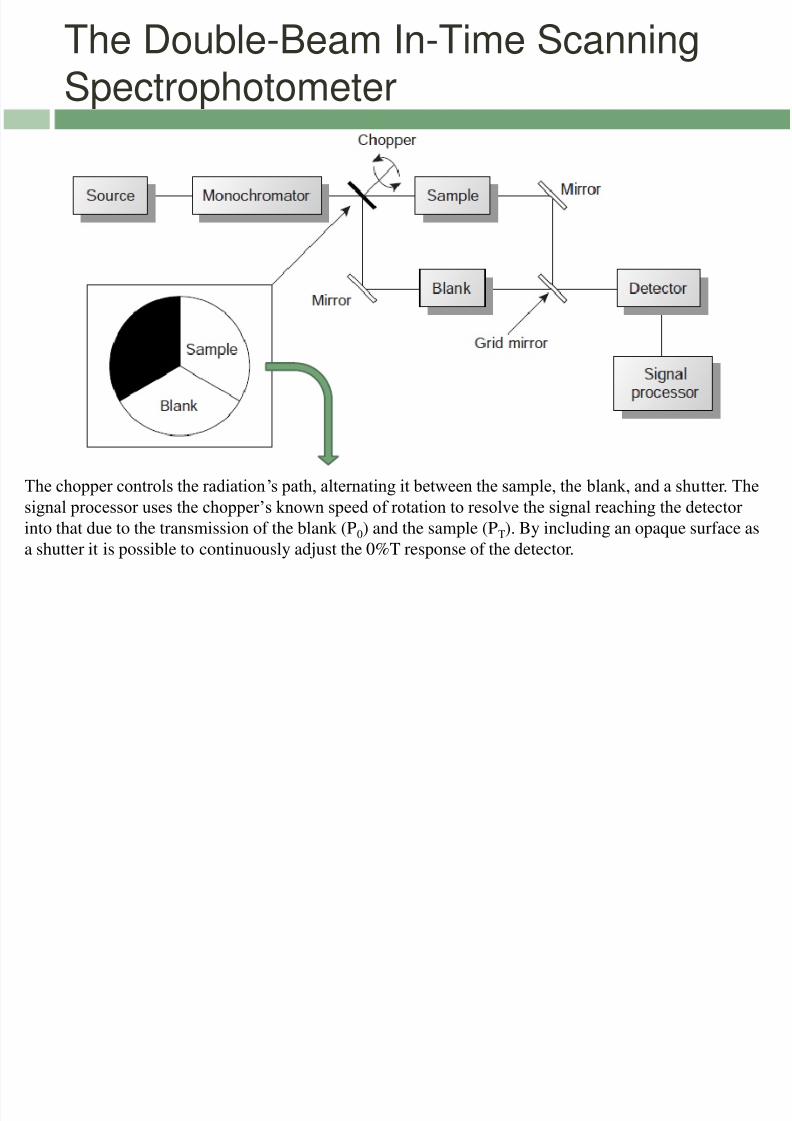
The Double-Beam In-Time ScanningSpectrophotometer
The chopper controls the radiation’s path, alternating it between the sample, the blank, and a shutter. The
signal processor uses the chopper’s known speed of rotation to resolve the signal reaching the detector
into that due to the transmission of the blank (P0) and the sample (PT). By including an opaque surface as
a shutter it is possible to continuously adjust the 0%T response of the detector.
8/2/2019 C28 Spectrometry
http://slidepdf.com/reader/full/c28-spectrometry 49/71
The limitations of fixed-wavelength,single-beam spectrophotometers are
minimized by using the double-beam in-
time spectrophotometer.
The effective bandwidth of a double-beam
spectrophotometer is controlled by means
of adjustable slits at the entrance and exit
of the monochromator.
A scanning monochromator allows for the
automated recording of spectra.
Double-beam instruments are more
versatile than single-beam instruments,
being useful for both quantitative and
qualitative analyses; they are, however,
more expensive.
8/2/2019 C28 Spectrometry
http://slidepdf.com/reader/full/c28-spectrometry 50/71
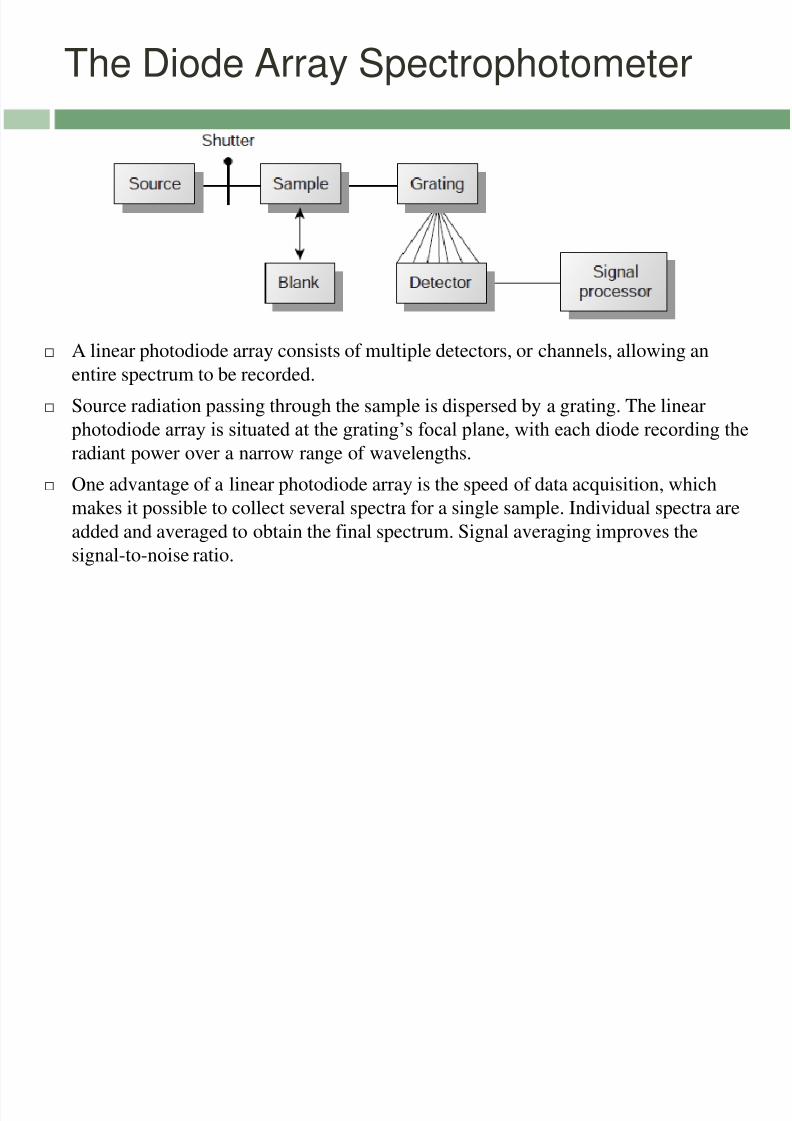
The Diode Array Spectrophotometer
A linear photodiode array consists of multiple detectors, or channels, allowing an
entire spectrum to be recorded.
Source radiation passing through the sample is dispersed by a grating. The linear
photodiode array is situated at the grating’s focal plane, with each diode recording the
radiant power over a narrow range of wavelengths.
One advantage of a linear photodiode array is the speed of data acquisition, which
makes it possible to collect several spectra for a single sample. Individual spectra are
added and averaged to obtain the final spectrum. Signal averaging improves the
signal-to-noise ratio.
8/2/2019 C28 Spectrometry
http://slidepdf.com/reader/full/c28-spectrometry 51/71
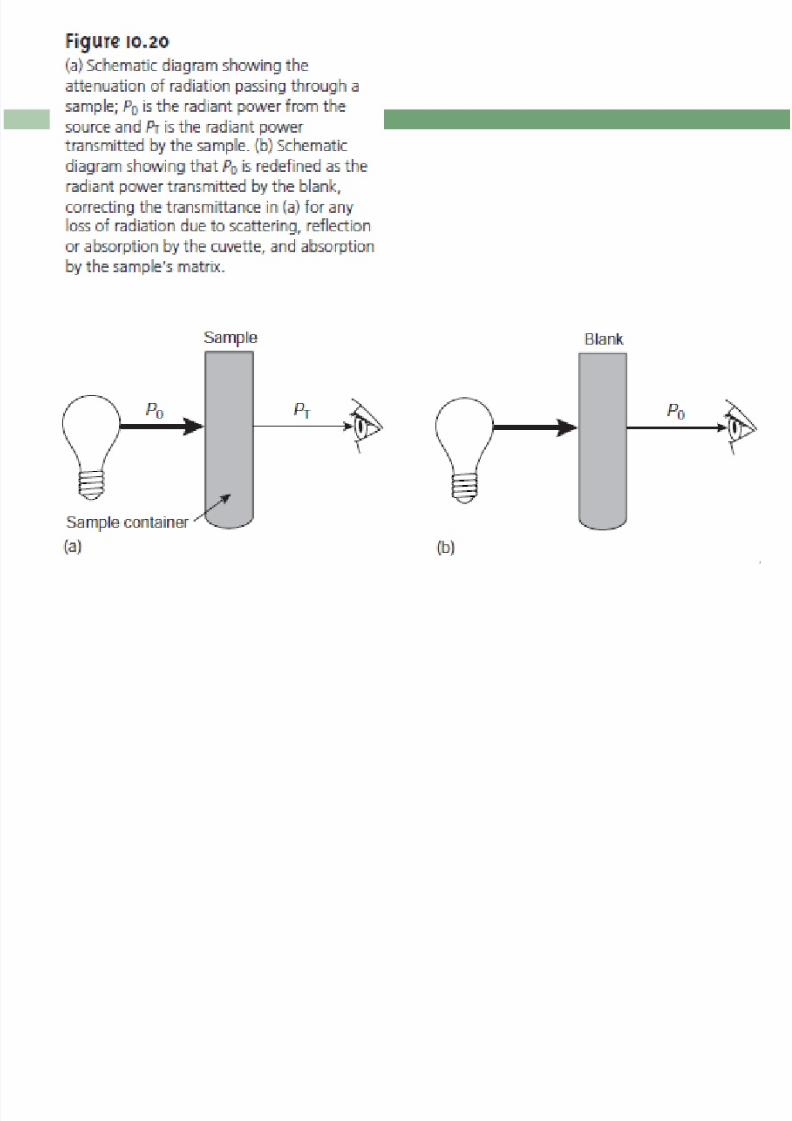
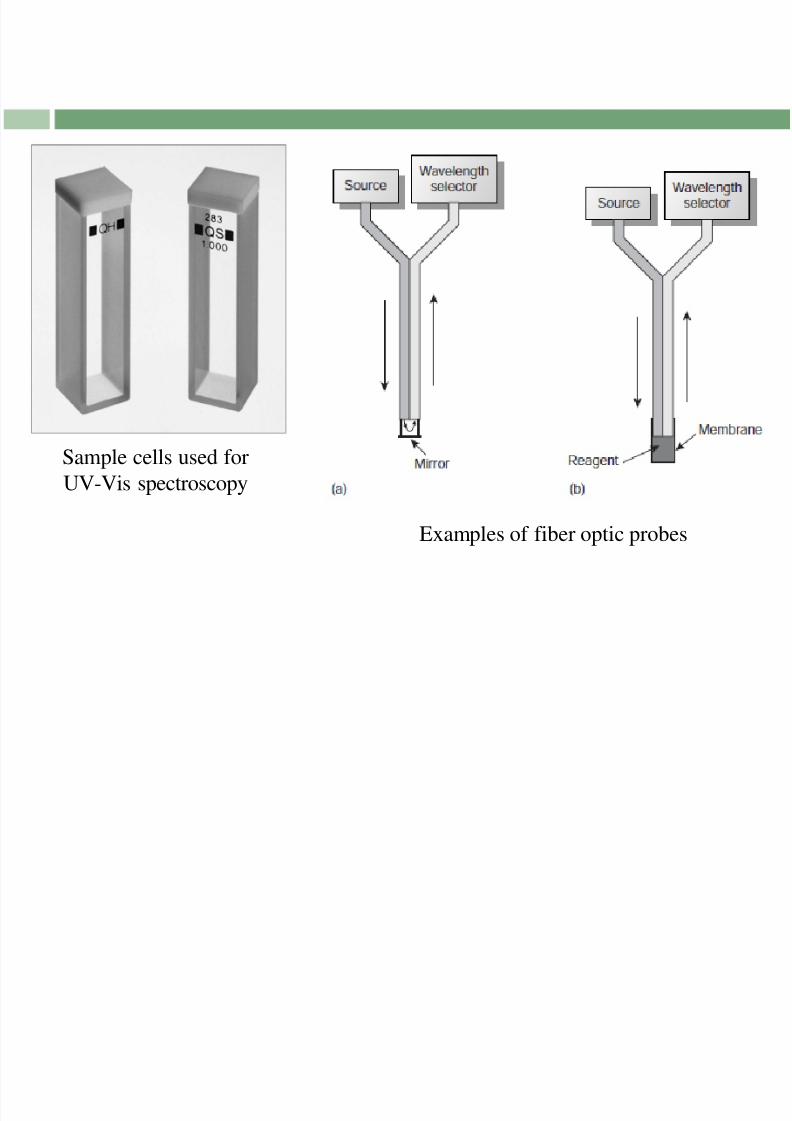
The Sample Compartment
Sample compartments of modern spectrophotometers prevent loss of radiation
due to scattering and reflection. The addition of stray radiation is likewise
prevented.
Liquid or dissolved samples are placed in UV-Vis transparent cells made of
fused-silica, quartz, glass or plastic. For analyses performed below 300nm
wavelengths, quartz or fused-silica cells must be used.
Commonly, cells have 1cm internal diameters (path-lengths). Cells with longer
path-lengths are used for very dilute solutions and gaseous samples.
High quality cells have rectangular shapes to reduce radiation losses to
reflection. These cells are also usually “matched” (having identical opticalproperties). Cylindrical cells are of lower quality and are usually used for
single-beam instruments.
Fiber optic probes are used for real time monitoring or for remote
measurements of a sample’s spectrum.
8/2/2019 C28 Spectrometry
http://slidepdf.com/reader/full/c28-spectrometry 52/71
Sample cells used for
UV-Vis spectroscopy
Examples of fiber optic probes
Sample Preparation for UV Vis
8/2/2019 C28 Spectrometry
http://slidepdf.com/reader/full/c28-spectrometry 53/71
Sample Preparation for UV-VisSpectrophotometry
The solvent must not absorb in the same region as the analyte. The most
common solvents used are listed in the table on the next slide.
The way the solvent influences the shifts in the wavelength of absorbed
radiation must also be noted.
In choosing the right solvent, one must also consider its possible interactionswith the analyte (such as, H-bonding).
The figure on the next slide shows the absorption spectra of phenol in two
different solvents: ethanol and isooctane. There is a loss of resolution
when ethanol is the solvent due to H-bonding with the analyte, phenol.
Other interactions that must be considered include complex formation,ionization and possible chemical reactions.

8/2/2019 C28 Spectrometry
http://slidepdf.com/reader/full/c28-spectrometry 54/71
8/2/2019 C28 Spectrometry
http://slidepdf.com/reader/full/c28-spectrometry 55/71
Chromophores
Chromophores are groups of atoms that absorb in the UV-Vis region of the
EM spectrum.
Auxochromes are groups that increase the absorption intensity or that shift the
absorption wavelength. Bathochromic (red) shift – shift to longer (lower energy) wavelengths
Hypsochromic (blue) shift – shift to shorter (higher energy) wavelengths
Hypochromic effect – decrease in absorption intensity
Hyperchromic effect – increase in absorption intensity
The greater the conjugation of π -bonds, the greater the shift of spectra to
longer (lower energy) wavelengths
Lone pairs shift spectra to shorter (higher energy) wavelengths
8/2/2019 C28 Spectrometry
http://slidepdf.com/reader/full/c28-spectrometry 56/71
8/2/2019 C28 Spectrometry
http://slidepdf.com/reader/full/c28-spectrometry 57/71
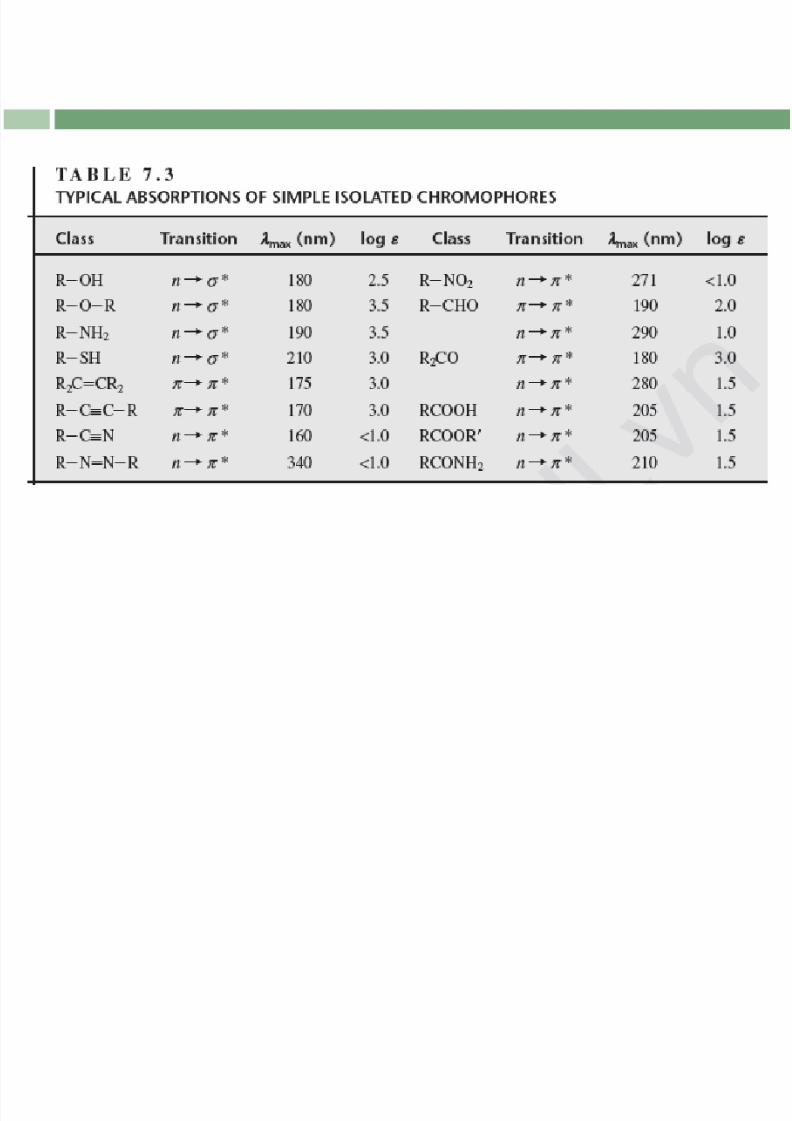
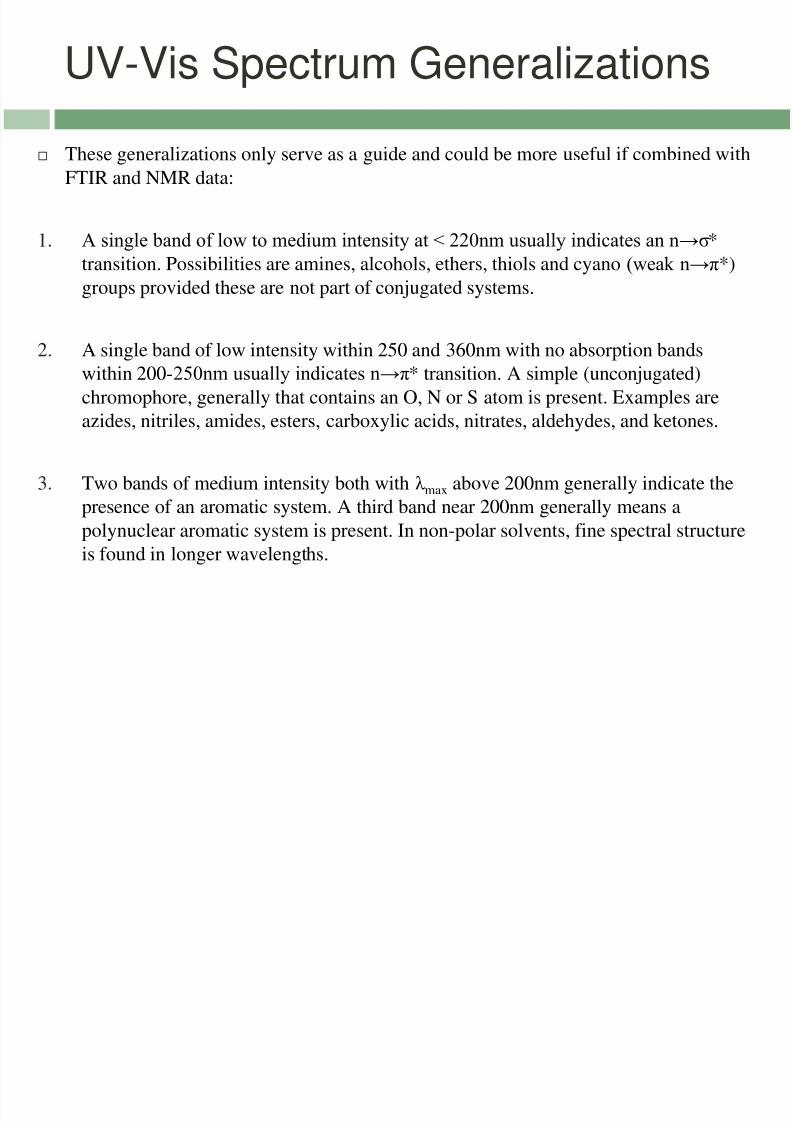
UV-Vis Spectrum Generalizations
These generalizations only serve as a guide and could be more useful if combined with
FTIR and NMR data:
1. A single band of low to medium intensity at < 220nm usually indicates an n→σ*
transition. Possibilities are amines, alcohols, ethers, thiols and cyano (weak n→π*)
groups provided these are not part of conjugated systems.
2. A single band of low intensity within 250 and 360nm with no absorption bands
within 200-250nm usually indicates n→π* transition. A simple (unconjugated)
chromophore, generally that contains an O, N or S atom is present. Examples are
azides, nitriles, amides, esters, carboxylic acids, nitrates, aldehydes, and ketones.
3. Two bands of medium intensity both with λmax above 200nm generally indicate the
presence of an aromatic system. A third band near 200nm generally means a
polynuclear aromatic system is present. In non-polar solvents, fine spectral structure
is found in longer wavelengths.

8/2/2019 C28 Spectrometry
http://slidepdf.com/reader/full/c28-spectrometry 58/71
4. High intensity bands above 210nm generally represent an α,β-unsaturated ketone, a
diene or a polyene. The longer the conjugated system, the longer the observed
wavelength.
5. Simple ketones, acids, esters, amides, and other compounds containing both π
systems and unshared electron pairs show two absorptions: an n→π* transition atlonger wavelengths (>300 nm, low intensity) and a π→π* transition at shorter
wavelengths (<250 nm, high intensity).
6. Compounds that are highly colored (have absorption in the visible region) are likely
to contain a long-chain conjugated system or a polycyclic aromatic chromophore.However, some simple nitro, azo, nitroso, α-diketo, polybromo, and polyiodo
compounds may also exhibit color, as may many compounds with quinoid structures.
8/2/2019 C28 Spectrometry
http://slidepdf.com/reader/full/c28-spectrometry 59/71
8/2/2019 C28 Spectrometry
http://slidepdf.com/reader/full/c28-spectrometry 60/71
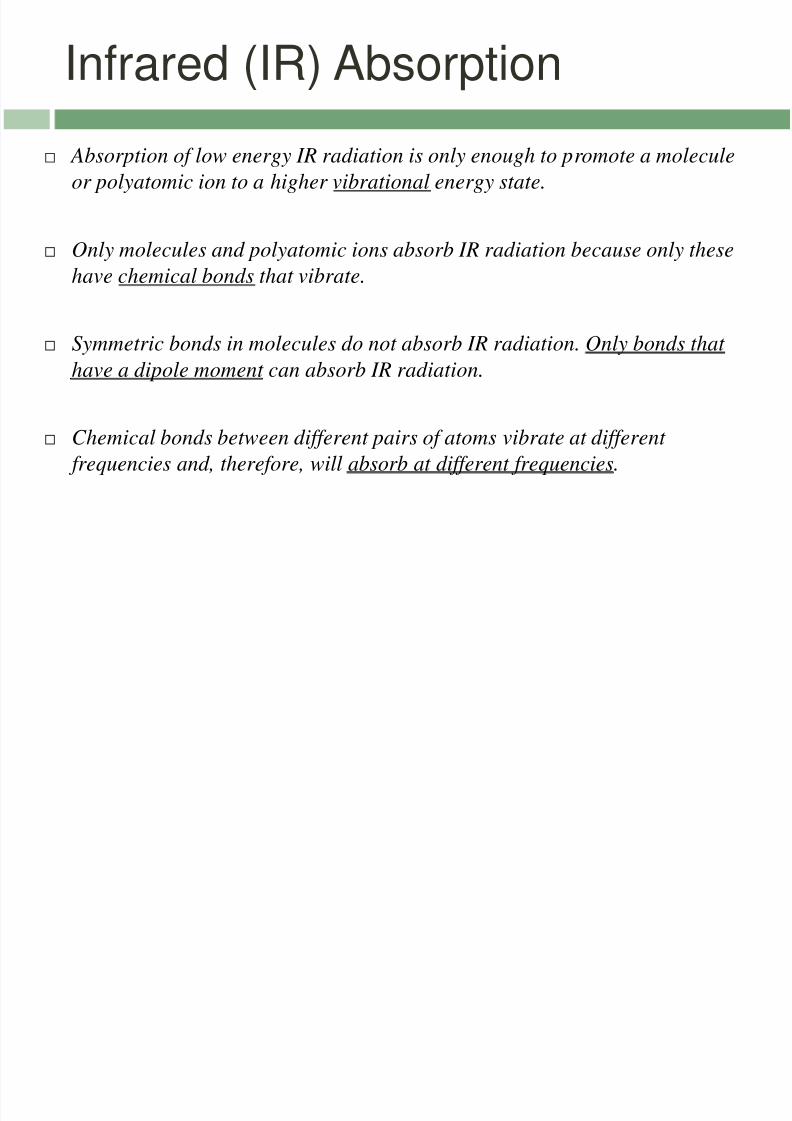
Infrared Spectroscopyand Chemical Bonding
8/2/2019 C28 Spectrometry
http://slidepdf.com/reader/full/c28-spectrometry 61/71
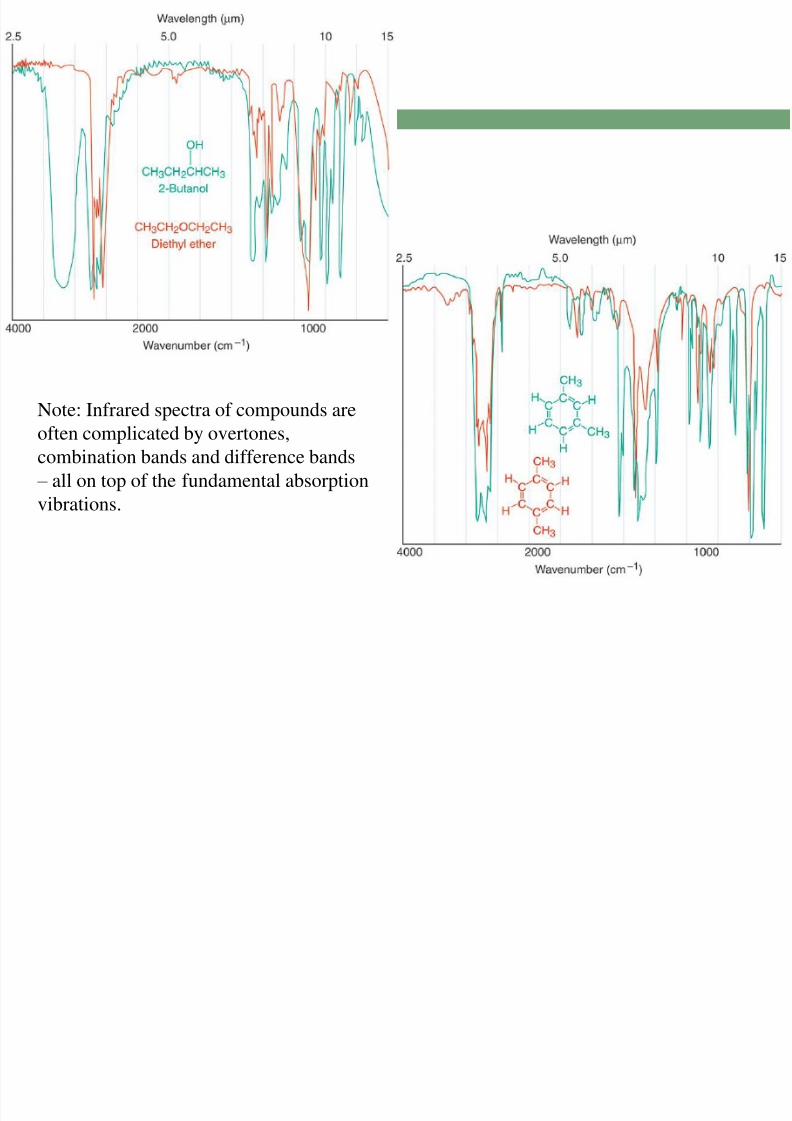
Note: Infrared spectra of compounds are
often complicated by overtones,
combination bands and difference bands
– all on top of the fundamental absorption
vibrations.
8/2/2019 C28 Spectrometry
http://slidepdf.com/reader/full/c28-spectrometry 62/71
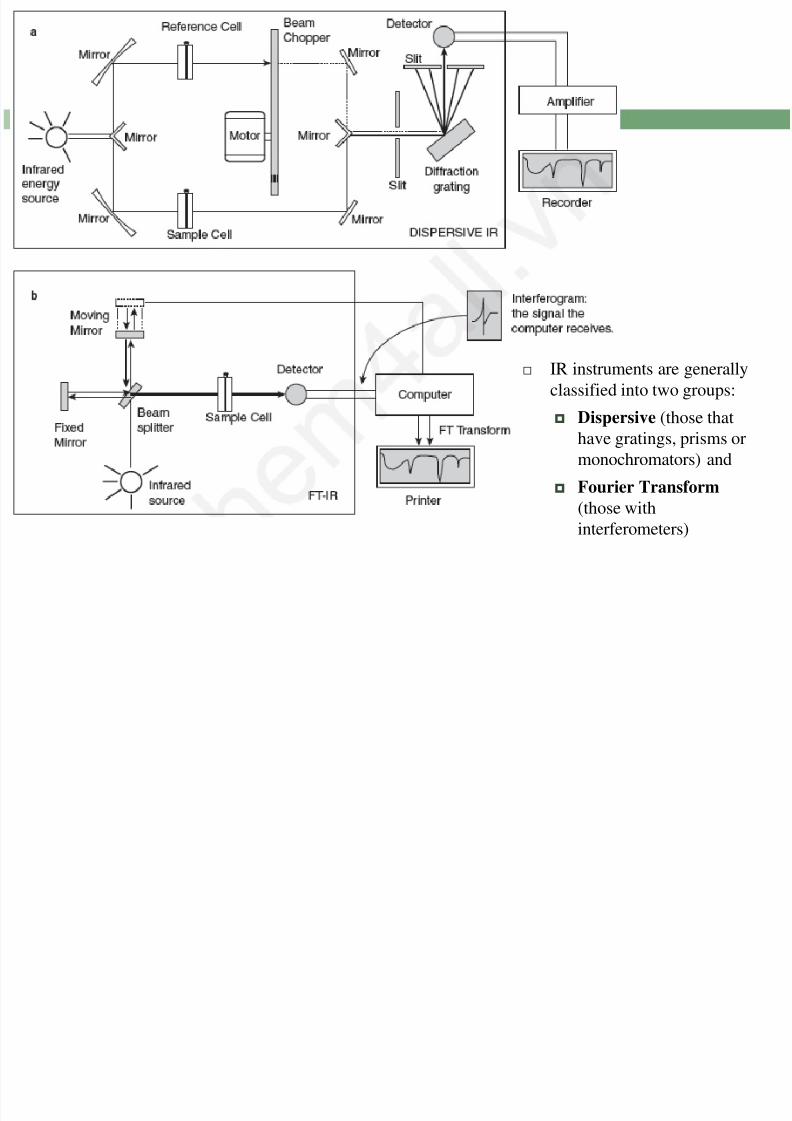
IR Spectrophotometers
IR spectrophotometers have similar block diagrams as UV-Vis spectrophotometers
Filter photometers
portable, dedicated analyzers for gaseous samples.
Single-beam
Double-beam
preferred over single-beam optics because IR sources and detectors are less
stable than those for UV-Vis. Also, error corrections for IR absorption by CO2
and H2O are easier for double-beam optics.
Fourier-transform (with interferometer)
Single-beam instrument, therefore, a background spectrum has to be taken and
subtracted from the sample spectrum to correct for atmospheric CO2 and H2O
absorbance.
Rapid data acquisition, which allows improvement of the signal-to-noise ratio
through signal averaging.
8/2/2019 C28 Spectrometry
http://slidepdf.com/reader/full/c28-spectrometry 63/71
IR instruments are generally
classified into two groups:
Dispersive (those thathave gratings, prisms or
monochromators) and
Fourier Transform
(those with
interferometers)
FTIR A l i M h d
8/2/2019 C28 Spectrometry
http://slidepdf.com/reader/full/c28-spectrometry 64/71
FTIR Analysis Methods
Transmission
Gaseous samples
Placed in a small chamber with NaCl or KBr windows
Path-length is usually 10cm (longer, if mirrors are used)
Liquid samples
A thin film of a non-aqueous non-volatile sample is prepared by placing a drop
between two NaCl plates.
Volatile samples and sample solutions (both non-aqueous) must be placed in
sealed cells; two NaCl plates separated by a teflon tube. The tube length is equal
to the pathlength.
Solid samples
Transparent samples can be placed directly in the path of the IR beam using the
appropriate sample holder.
Opaque samples can be dissolved in a suitable solvent (e.g. Nujol or CCl4) and
analyzed as described above. Alternatively, the sample can be mixed with KBr
and pressed into a transparent pellet.
8/2/2019 C28 Spectrometry
http://slidepdf.com/reader/full/c28-spectrometry 65/71
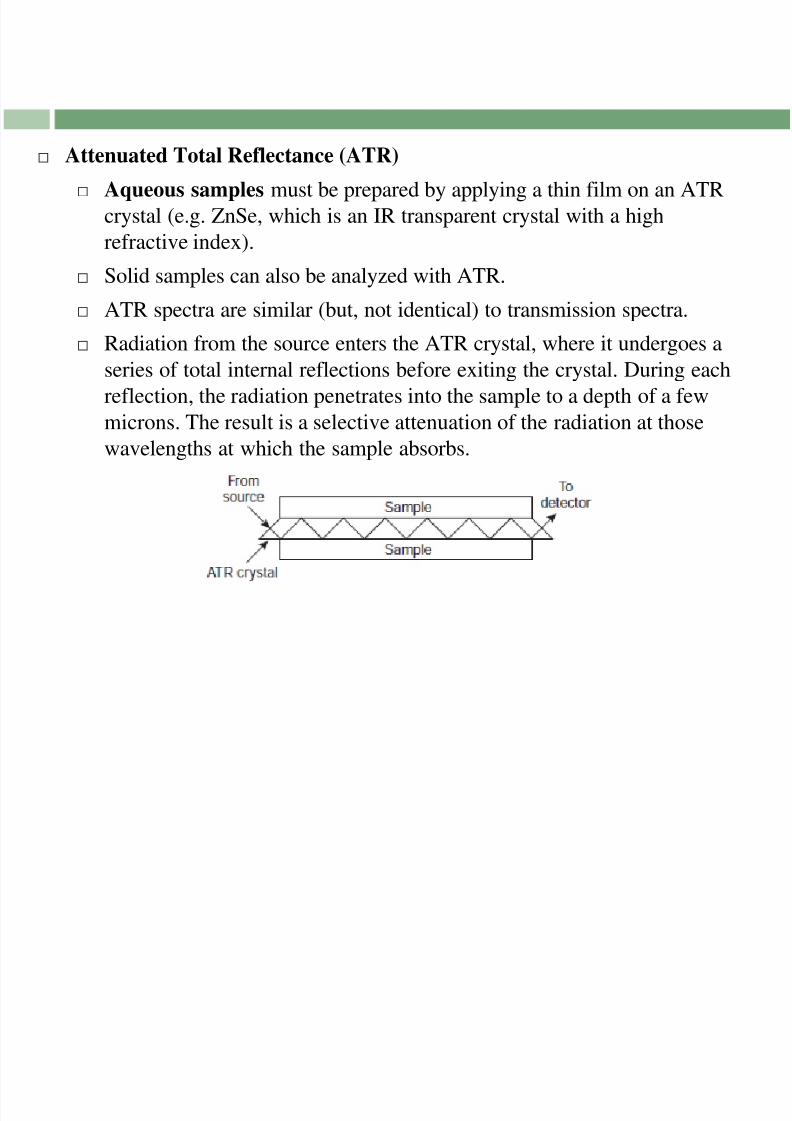
Attenuated Total Reflectance (ATR)
Aqueous samples must be prepared by applying a thin film on an ATR
crystal (e.g. ZnSe, which is an IR transparent crystal with a high
refractive index).
Solid samples can also be analyzed with ATR. ATR spectra are similar (but, not identical) to transmission spectra.
Radiation from the source enters the ATR crystal, where it undergoes a
series of total internal reflections before exiting the crystal. During each
reflection, the radiation penetrates into the sample to a depth of a few
microns. The result is a selective attenuation of the radiation at thosewavelengths at which the sample absorbs.
8/2/2019 C28 Spectrometry
http://slidepdf.com/reader/full/c28-spectrometry 66/71
Diffuse Reflectance
Powdered samples are mixed with KBr. Diffuse reflection occurs when
light penetrates the solid and is scattered by refraction and reflection
towards neighboring crystals or towards the detector, where it is analyzed.
The spectra are similar (but, not identical) to transmission spectra.
The disadvantage of using KBr is the possibility of moisture
contamination. (Also likely in pelletization).
Th IR B k d S

8/2/2019 C28 Spectrometry
http://slidepdf.com/reader/full/c28-spectrometry 67/71
The IR Background Spectrum
CO2
H2O

8/2/2019 C28 Spectrometry
http://slidepdf.com/reader/full/c28-spectrometry 68/71
The two absorptions at 2350 cm−1 are due to the asymmetric stretching modesof carbon dioxide.
The groups of peaks centered at 3750 cm−1 and 1600 cm−1 are due to the
stretching and bending modes of atmospheric (gaseous) water molecules (that
is, water vapor).
The bell-shaped curve is due to differences in the output of the IR source -
corrected by a feature called, autobaseline.
I f d S t
8/2/2019 C28 Spectrometry
http://slidepdf.com/reader/full/c28-spectrometry 69/71
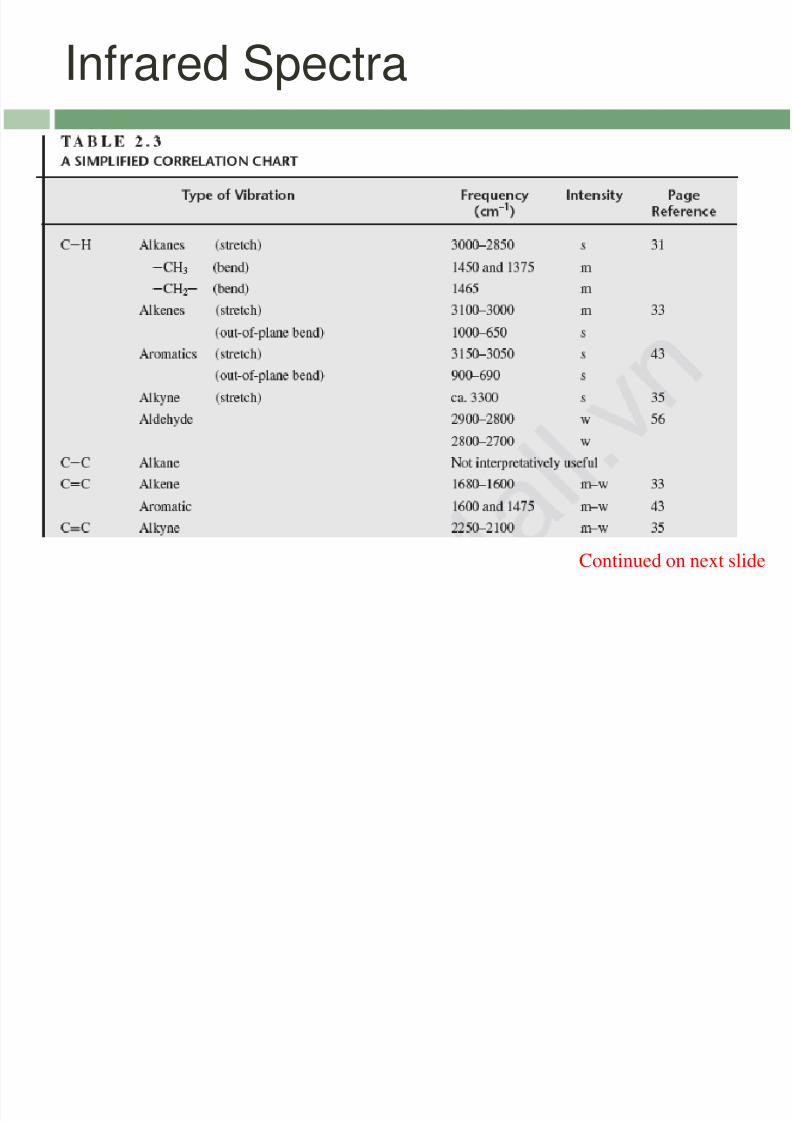
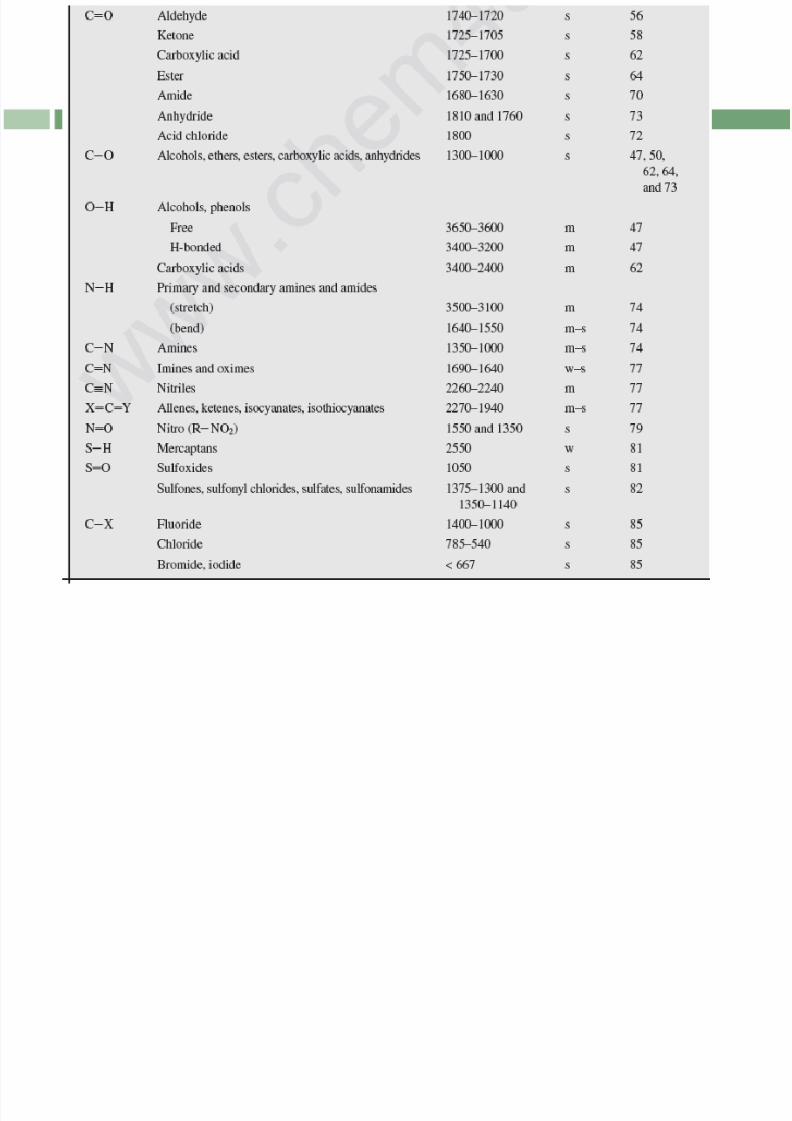
Infrared Spectra
Continued on next slide
8/2/2019 C28 Spectrometry
http://slidepdf.com/reader/full/c28-spectrometry 70/71
8/2/2019 C28 Spectrometry
http://slidepdf.com/reader/full/c28-spectrometry 71/71
Main References:
Harvey, D. Modern Analytical Chemistry. McGraw-Hill, 2000.
Pavia, D. et al. Introduction to Spectroscopy, 4 th ed. Brooks/Cole,
Cengage Learning 2009. Skoog, D. et al. Fundamentals of Analytical Chemistry, 8th edition.
Thomson-Brooks/Cole, 2004.
Silberberg. Chemistry: The Molecular Nature of Matter and Change, 4th
ed