Embed Size (px)
Citation preview
IOWA DOT ~ OFFICE OF BRIDGES AND STRUCTURES ~ LRFD BRIDGE DESIGN MANUAL COMMENTARY~ C6.2: 1
July 2018
C6.2 Piles
This commentary has been revised for the 2012 LRFD calibration.
C6.2.1.3 Definitions
Natural ground elevation The Blue Book friction bearing chart has two values for some of the cohesive soil classifications. The value in ( ) is
for “pile depths more than 30’ below the natural ground elevation”. Although natural ground elevation seems self-
explanatory there is a question of interpretation for piles for bridge replacements that penetrate embankments placed
for the original bridge many years earlier. The most conservative interpretation is to use the ground elevation before
the embankment was placed, but the office has no definitive policy at this time.
The Blue Book does not give an interpretation, but does indicate that the concept arose from work by Tomlinson
published in 1979 for piles with two different lengths. The adhesion (an indication of friction bearing) was larger per
square foot for the longer embedded piles. The Blue Book authors evidently developed the larger values in ( ) using
30 feet as a limit rather than pile length. Using this information, the designer could make a judgment depending on
the type of embankment soil and the time elapsed since its placement. With construction control the pile resistance
will be tested and, if the designer has made too liberal an interpretation, piles will need to be retapped or extended.
C6.2.1.4 Abbreviations and notation
Corrected N-values There are two corrections that may be made to N-values: (1) a correction for hammer efficiency and (2) a correction
for overburden pressure in sands. At this time the Iowa DOT is intending in the future to make the hammer
efficiency correction in all cases but to make the overburden correction only in non-typical cases as advised by the
Soils Design Section.
Concerns regarding the efficiencies of different soil drilling rigs for the standard penetration test did not arise during
the time period when most of the Iowa DOT pile static load tests were conducted. Based on industry estimates, the
hammer efficiencies at that time averaged about 60%, but there is no way to determine the actual efficiencies of the
soil borings associated with the pile tests.
In the calibrations for contract length and driving target, ISU researchers used uncorrected N-values in all cases,
even with recent tests for which hammers are likely to have higher than 60% efficiencies. Most likely the range of
hammer efficiencies introduced more variation in the calibration, and the resulting resistance (φ) factors are
conservative.
Because hammer efficiencies most likely were about 60% for the majority of the tests used in calibration, and
because the industry is moving toward N60 as a standard, the Iowa DOT is intending to require that N60 values be
reported by Iowa DOT personnel and consultants. Until the time that N60 results are reported the designer may use
uncorrected values. With modern automatic trip hammers reported N-values will be lower, which is likely to
increase contract lengths slightly and decrease driving targets slightly.
Although N-values also can be corrected for overburden pressure in granular soils, at this time the office does not
intend to make the additional overburden correction, N160 [AASHTO LRFD 10.4.6.2.4], for typical projects.
However, when the designer is considering liquefaction of granular soils for seismic design or other appropriate
special cases, the designer should make the correction.
C6.2.4.2 Pile length
22 January 2013 ~ Pile Group Resistance Historically there have been many efforts to develop viable efficiency reduction factors for pile groups.
Unfortunately, there have been few field tests [7] and limited model tests that at least one expert considers
IOWA DOT ~ OFFICE OF BRIDGES AND STRUCTURES ~ LRFD BRIDGE DESIGN MANUAL COMMENTARY~ C6.2: 2
July 2018
problematic [5]. Generally, the AASHTO LRFD Specifications use efficiency reductions for certain conditions in
cohesive soils proposed in NCHRP Report 343 [2]. The Canadian Highway Bridge Design Code [3], however, does
not use efficiency reductions.
In Article 10.7.3.9 the AASHTO LRFD Specifications modify in two ways the nominal pile group resistance
determined from the sum of the individual pile resistances in clay. The first modification is to require reduction of
pile resistances by an efficiency factor in a limited case when piles are closely spaced and the cap is not in contact
with the ground, and the second is to require an equivalent pier analysis that considers an overall block failure for
the group.
According to the AASHTO LRFD Specifications the efficiency factors apply to a very limited case in soft cohesive
soil (undrained shear strength < 2 ksf [4], which approximately correlates with N < 16 [6]) where the cap (or
footing) is not in contact with the soil.
Under the notation article [AASHTO LRFD 10.3] the specifications define the efficiency factor as “shaft efficiency
reduction factor for axial resistance…”. In the engineering literature “shaft” generally refers to friction resistance
rather than end bearing resistance and, therefore, the office requires the reduction, when it applies, only to the
friction resistance.
The AASHTO LRFD Specifications do not define group, but the intent appears to be vertical piles in multiple rows
[AASHTO LRFD C10.7.3.9] such as for frame pier and T-pier foundations without battered piles. The specifications
do not give information for the typical Iowa pier foundations with perimeter battered piles that rapidly increase pile
spacing with depth, and there is no indication at which depth a variable pile spacing should be measured. A 12-inch
pile at the usual Iowa-specified 1:4 batter will go from a spacing of 2.5D adjacent to a vertical pile at its head to a
spacing of 6D at a depth of 14 feet.
With the usual Iowa-required pile spacing and batter it seems unlikely that an equivalent pier failure could occur due
to the large shear area surrounding the pile group, and tests reported in the engineering literature generally indicate
that the equivalent pier failure only occurs when vertical piles are closely spaced at about 2D or less [5]. Because the
office specifies a minimum pile spacing of 2.5D and typically uses battered piles, the office does not require
efficiency reductions or an equivalent pier analysis for typical frame pier and T-pier foundations. However, for pier
foundations with all-vertical piles that meet the conditions in the AASHTO LRFD Specifications, the designer is
expected to use the appropriate AASHTO efficiency factors.
The AASHTO LRFD Specifications also do not give information for pile bents with a single row of piles. With a
single row of piles there is no reasonable possibility of an equivalent pier failure and, in reported model tests,
efficiencies generally were larger for a single row of piles than for multiple rows of piles [1]. For these reasons and
the minimum 2.5D spacing discussed above, the office does not require efficiency reductions or an equivalent pier
analysis for typical, single row pile bents.
Integral abutments have a single row of piles and a cap in contact with the ground, and therefore the efficiency
reductions do not apply. Stub abutments have battered piles and a cap in contact with the ground, and therefore the
efficiency reductions also do not apply.
References
[1] Al-Mhaidib, Abdullah I. (2007) “Efficiency of Pile Groups in Clay under Different Loading Rates.”
Proceedings of the Seventeenth (2007) International Offshore and Polar Engineering Conference, Lisbon,
Portugal, pp 1458-1463. (single and multiple row model tests without a footing)
[2] Barker, R.M, J.M. Duncan, K.B. Rojiani, P.S.K. Ooi, C.K. Tan, and S.G. Kim. (1991) Manuals for the
Design of Bridge Foundations, NCHRP Report 343. Transportation Research Board, Washington, DC.
(source of rules in present AASHTO LRFD Specifications with minor modifications)
[3] Canadian Standards Association. (2000) Canadian Highway Bridge Design Code, CAN/CSA-S6-00 and
Commentary. CSA International, Toronto, Canada.
IOWA DOT ~ OFFICE OF BRIDGES AND STRUCTURES ~ LRFD BRIDGE DESIGN MANUAL COMMENTARY~ C6.2: 3
July 2018
[4] Hannigan, P.J., G.G. Goble, G.E. Likins, and F. Rausche (2005) Design and Construction of Driven Pile
Foundations—Volume I. Ryan R. Berg & Associates, Inc., Woodbury, MN. (This is the reference manual
for NHI Courses No. 132021 and 132022.)
[5] O’Neill, Michael W. (1983) “Group Action in Offshore Piles.” Proceedings of the Conference on
Geotechnical Practice in Offshore Engineering, Austin, TX, pp 25-64. (considered to be a state-of-the-art
summary for the early 1980s)
[6] Teng, Wayne C. (1964) Foundation Design. Prentice-Hall, Inc., Englewood Cliffs, NJ.
[7] Vesic, Aleksandar S. (1977) Design of Pile Foundations, NCHRP Report 42. Transportation Research
Board, Washington, DC.
C6.2.4.3 Contract Length
2007 LRFD interim pile design practice superseded by the ISU calibration in 2012 As a temporary measure, in view of the October 2007 deadline for conversion of bridge design to LRFD, the Office
of Bridges and Structures calibrated pile design practice to LRFD by fitting with the 1994 soils information charts
(Blue Book). In 2007, research at Iowa State University was initiated through the Iowa Highway Research Board
(TR-573, TR-583, and TR-584) to examine pile design calibration with respect to reliability theory, as well as to
examine present design and construction procedures. The research has been completed and is the basis for present
pile design policy written into the manual.
The interim policy was based on the following:
• An average load factor, γ bar , of 1.45, for a dead to live load ratio of 3:2.
• A minimum factor of safety of 2.0 in the 1994 soils information charts (Blue Book).
• An H-pile structural phi factor, φc, of 0.6 for axial compression in the lower part of the pile.
• An H-pile geotechnical phi factor, φ, of 0.725 obtained by fitting to the present soils charts with a formula
commonly cited (Barker and Puckett 2007, Allen 2005).
References
Allen, T.M. (2005). Development of Geotechnical Resistance Factors and Downdrag Load Factors for LRFD
Foundation Strength Limit State Design, FHWA-NHI-05052. National Highway Institute, Federal Highway
Administration. Washington, DC.
Barker, R.M. and J.A. Puckett. (2007). Design of Highway Bridges, an LRFD Approach, Second Edition. John
Wiley & Sons, Inc. New York, NY.
Dirks, K.L. and P. Kam. (1994). Foundation Soils Information Chart, Pile Foundation. Soils Survey Section,
Highway Division, Iowa DOT. Ames, IA.
Origin of the LRFD downdrag load factor of 1.0 The major issue when designing for downdrag is computation of the downward load. In the third edition of the
AASHTO LRFD Specifications two cases are identified: (1) piles driven to end bearing and (2) friction piles that
experience settlement at the pile tip [AASHTO-LRFD 10.7.1.6.2]. In the first case, the specifications require that
downdrag be considered at the strength and extreme event limit states. Because the extreme event limit state
involves seismic design generally not required in Iowa, piles need only be designed at the strength limit state.
In the second case, the AASHTO LRFD Specifications add the service limit state because of the potential for
settlement. In the past the Office of Bridges and Structures has depended on the Soils Design Section for settlement
analysis and intends to continue doing so.
In both the AASHTO LRFD Specifications and office practice the computation of the downdrag load has been made
less conservative in recent years. In the second edition of the AASHTO LRFD Specifications, the downdrag load
factor at the strength limit state was to be taken at 1.8. In the third edition, 2006 Interim, the downdrag load factor
has been lowered to 1.05 and 1.40 depending on the method used to determine the force [AASHTO-LRFD Table
IOWA DOT ~ OFFICE OF BRIDGES AND STRUCTURES ~ LRFD BRIDGE DESIGN MANUAL COMMENTARY~ C6.2: 4
July 2018
3.4.1-2]. In the calibration of these load factors, analysis for specific conditions gave factors in the 1.00 to 1.65
range [Allen 2005].
In 2001 the office indicated that the downdrag load should be computed by removing the safety factor of two from
the pile chart. With that procedure, one foot of pile downdrag would be supported by two feet of friction bearing (in
the same soil) or an equivalent amount of bearing. Evidently the procedure was too conservative and resulted in
difficulty in designing for downdrag. Subsequently in 2004 the office made the design procedure less conservative
by eliminating the need to remove the safety factor from the load. Thus one foot of pile downdrag could be
supported by one foot of friction bearing (in the same soil) or equivalent bearing. The rationale for the change was
that uncertainty in the load would be balanced by uncertainty in the capacity, and the safety factor for downdrag
could be reduced to 1.0.
To follow the latest office practice in LRFD would require that the strength limit state load factor for downdrag in
LRFD be reduced below 1.0 to about 0.75. The exact calibration depends on the percentage of the total load
attributable to downdrag and other factors. To provide a minimum margin of safety the load factor will be taken as
1.0, which will result in numbers of piles closer to those resulting from the 2004 procedure than the 2001 procedure.
The fact that the load factor is 1.0 does not mean that there is no margin of safety; the margin of safety is provided
by the phi factor on pile resistance.
For a pile subject to downdrag, driving conditions will be more severe than usual. The pile will need to be driven
initially through soil layers above the layer causing downdrag, as well as the layer itself, and then driven for bearing.
In cases in which steel H-piles are designed at Structural Resistance Level 3 or 4 (SRL-3 or SRL-4), a pile
drivability analysis should be completed by the Office of Construction before the bridge substructure design is
finalized.
Reference
Allen, T.M. (2005). Development of Geotechnical Resistance Factors and Downdrag Load Factors for LRFD
Foundation Strength Limit State Design, FHWA-NHI-05-052. Federal Highway Administration, Washington, DC.
C6.2.4.4 Uplift
For pier piles, uplift often occurs under lateral loading at the top of the pier, and the pile tension caused by uplift
needs to be transferred by friction to the soil and transferred by friction or anchorage devices to the pile footing.
Under allowable stress design (ASD) it was permissible in the Office of Bridges and Structures (OBS) to use the full
compression friction bearing values from the Blue Book in tension for a pile subjected to uplift. At least one source,
however, indicates that in practice at that time the allowable compression friction bearing value was commonly
reduced by a factor of 0.75 for tension bearing [McVay et al. 1998]. The reduction for uplift is implemented in the
AASHTO LRFD Specifications with a reduction in resistance factor, and ISU researchers followed that approach to
determine specific, reduced resistance factors for use with nominal geotechnical resistances depending on
construction control method [BDM Table 6.2.9-2].
In late 2016, at the request of OBS, ISU began conducting pile pullout tests. HP10 and HP14 piles were embedded
into concrete blocks which were intended to represent typical footings used at the time. The blocks were reinforced
in a manner consistent with Iowa’s typical footing reinforcement practices. Piles with 12-inch and 24-inch
embedment into the blocks were tested without any other anchorage. Additionally, piles with 12-inch embedment
into the blocks were tested with various types of anchorages. The results for all pullout tests may be found in the
research report [Iekel 2017].
The failure mode exhibited in tests for piles embedded 12 inches into the blocks without any other anchorage did not
display a simple bond failure at the interface between the surface of the pile and the concrete. In general, the failure
was brittle and sudden and due to concrete cracking leading to a loss of bond between the pile and concrete. HP10
and HP14 piles failed at approximately the same ultimate capacities which indicates failure is independent of surface
area contact between the pile and the concrete.
IOWA DOT ~ OFFICE OF BRIDGES AND STRUCTURES ~ LRFD BRIDGE DESIGN MANUAL COMMENTARY~ C6.2: 5
July 2018
Testing of piles with 24 inches of embedment into the blocks without any other anchorage displayed different failure
modes for HP10 and HP14 piles. Even so, the ultimate capacity of the HP10 and HP14 piles had similar lower
bound results. The results of the testing did indicate some ductility in the connection after the ultimate capacity was
reached, but not consistently at or near the ultimate capacity. An important aspect of these tests was keeping the
lower mat of reinforcing at 12 to 13 inches clear from the bottom of the footing (as is normally done in Iowa) with
12 inches of the 24-inch pile embedment extending above the bottom mat.
Testing of piles with 12 inches of embedment into the block and V-bars or U-bars as positive anchorage indicate that
ultimate capacity is reached just before one leg of a bar fractures near the hole for the bar in the pile web. The length
of the bar legs was long enough to fully develop the bar’s yield strength. Ultimate capacity of these anchorages was
generally a little higher than the theoretical bar yield capacity for the area of all the bar legs in the connection. The
results of the testing did indicate some ductility in the connection after the ultimate capacity was reached, but not
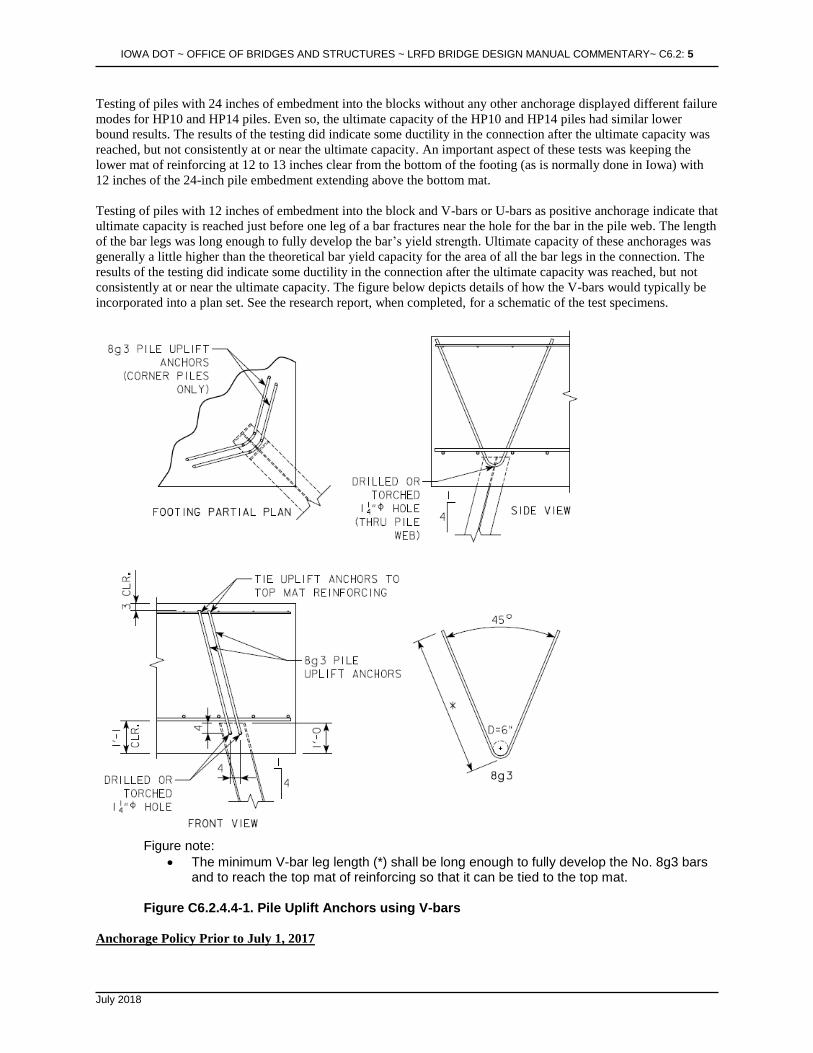
consistently at or near the ultimate capacity. The figure below depicts details of how the V-bars would typically be
incorporated into a plan set. See the research report, when completed, for a schematic of the test specimens.
Figure note:
• The minimum V-bar leg length (*) shall be long enough to fully develop the No. 8g3 bars and to reach the top mat of reinforcing so that it can be tied to the top mat.
Figure C6.2.4.4-1. Pile Uplift Anchors using V-bars
Anchorage Policy Prior to July 1, 2017

IOWA DOT ~ OFFICE OF BRIDGES AND STRUCTURES ~ LRFD BRIDGE DESIGN MANUAL COMMENTARY~ C6.2: 6
July 2018
For transfer of pile tension to a footing very limited data is available on the bond strength between an H-pile and a
concrete footing [GAI 1982]. There is, however, related data on bond strength for encased steel columns [Griffis
1992], filled steel columns [AISC 2005], and embedded beam flanges [Watson et al. 1974]. The lowest of these
bond strength values is 60 psi with an associated resistance factor of φ = 0.45 [AISC 2005]. With this bond strength
and φ factor and an average AASHTO LRFD load factor of 1.45, an equivalent allowable stress would be 18.6 psi,
very close to the 15 psi under ASD formerly used in the office. Thus the 0.060 ksi bond resistance and φ = 0.45 have
been adopted as office policy [BDM 6.2.6.1].
References and Brief Summaries of Selected References
American Institute of Steel Construction (AISC). (2005). Steel Construction Manual, 13th Edition. AISC, Chicago,
IL.
Commentary to the specification suggests a reasonable lower bound for bond strength of 60 psi for
concrete-filled hollow structural section (HSS) steel columns. For LRFD the recommended resistance
factor is 0.45. (Because AASHTO LRFD generally uses higher load and resistance factors than AISC
LRFD, the AISC φ = 0.45 will be conservative if used with AASHTO factored loads.) The commentary
also suggests that bond stress for an encased column be ignored, but acknowledges the reference below by
Griffis, in which bond stress is considered.
GAI Consultants, Inc. (1982). The Steel Pile, Pile Cap Connection. American Iron and Steel Institute (AISI).
Washington, DC.
The consulting firm, GAI Consultants, Inc. conducted 16 steel pile pull-out tests, most of which were
designed to test tension anchors. One bare HP 10x42 test with the pile embedded 9 inches in concrete with
a strength of at least 4300 psi indicated a bond failure at an average bond stress of 74 psi. A similar 10¾-
inch diameter pipe pile test with 6-inch embedment indicated a bond failure at 143 psi. The authors
recommended that bond stress not be considered in design.
Griffis, L.G. (1992). Steel Design Guide No. 6, Load and Resistance Factor Design of W-Shapes Encased in
Concrete. American Institute of Steel Construction, Chicago, IL.
For shear connection, the author first considers bond based on a paper written by Roeder. The author
considers only the flange area of an embedded wide flange shape and applies a safety factor of 5 to obtain
the following:
average ultimate bond stress = u = 0.9(0.09f’c – 95)
(The result from this formula for typical Iowa DOT 4.0 ksi concrete is 0.239 ksi.)
McVay, M.C., C.L. Kuo, and W.A. Singletary. (1998). Calibrating Resistance Factors in the Load and Resistance
Factor Design for Florida Foundations, Final Report. Department of Civil Engineering, University of Florida,
Gainesville, FL.
Watson, J., R. O’Neil, R. Barnoff, and E. Mead. (1974). “Composite Action without Shear Connectors.”
Engineering Journal, 2nd Quarter, 1974. pp 29-33.
The authors conducted working-load flexural tests of two castellated beams with top flanges embedded in
4000 psi concrete slabs. At working loads, maximum bond stress was 82.8 and 88.0 psi. The authors also
tested one beam for 750,000 cycles at a maximum bond stress of 25.4 psi and found no adhesion failure.
For comparison, the 1963 ACI Code allowed a bond stress of 160 psi for plain bars.
C6.2.4.5 Lateral load
9 April 2001 ~ Battered Pile Capacity and Lateral Load Capacity for Pier Design For allowable stress design (ASD) of abutment and pier piles the Office of Bridges and Structures (OBS) in the past
used simple guidelines for lateral load capacities. Without special analysis, for fully embedded steel H-piles the
IOWA DOT ~ OFFICE OF BRIDGES AND STRUCTURES ~ LRFD BRIDGE DESIGN MANUAL COMMENTARY~ C6.2: 7
July 2018
allowable lateral load at the head was 6 kips [BDM 6.2.6.1]. For timber piles the allowable lateral load under the
same conditions was 4 kips [BDM 6.2.6.3]. In each case, for a battered pile the designer was allowed to add the
allowable horizontal component.
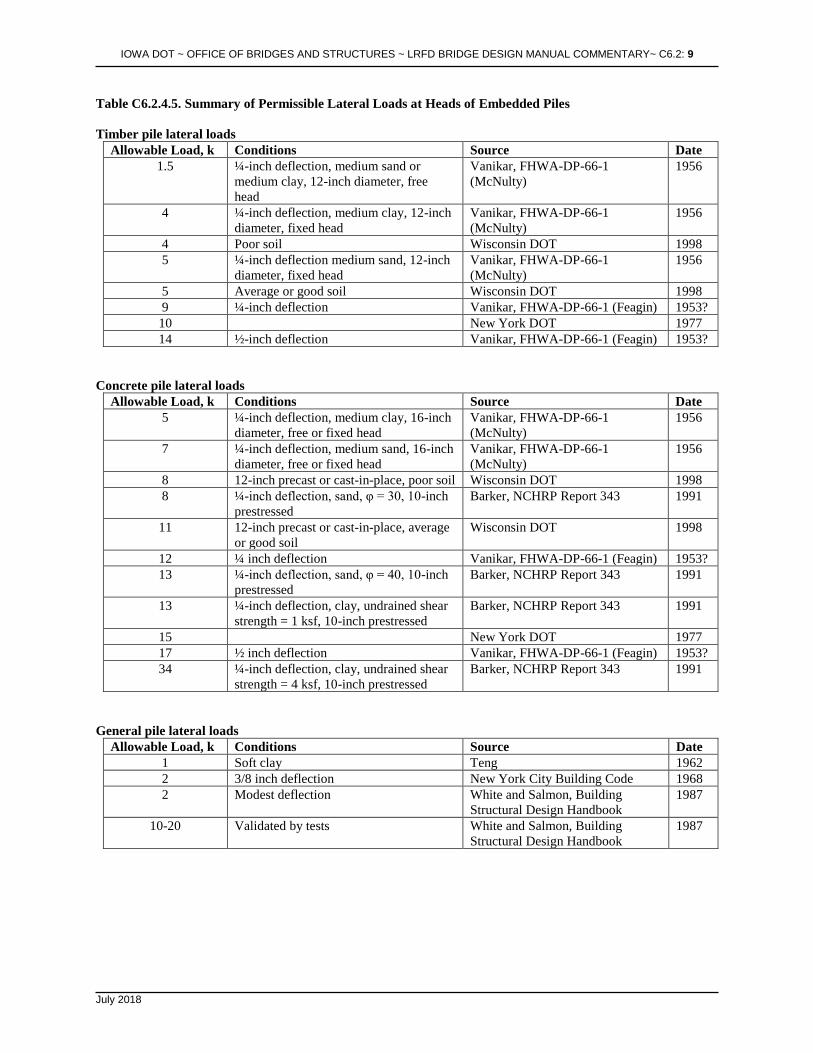
The nominal values used by the office generally are conservative when compared with nominal values used by
others and values associated with specific soil conditions, as the tables in Table C6.2.4.5 indicate and as examples
for an H-pile in soft clay suggest [BDM C6.2.6.1].
In most cases, lateral loads for piles are governed by horizontal deflections at the service limit state. The ultimate
load for a pile typically is in the range of 3 to 14 times the load that causes a 0.25-inch deflection [AISC 1973].
The allowable horizontal deflection often has been limited to 0.25 inch at the ground line for buildings, with more
liberal limits for other structures [Teng 1962]. The second edition of the AASHTO LRFD Specifications had a limit
of 1.5 inches for bridge piles [AASHTO LRFD-2 10.7.2.2], but that limit has been removed from the third and
subsequent editions. Unless set conservatively, the allowable deflection should be set based on the type and
configuration of the structure. For example, for the typical stub abutment, the pile head deflection represents the
horizontal movement of the abutment, but at the top of a pier the deflection may be amplified by differential
settlement and rotation, and that amplification should be considered.
The actual horizontal deflection at the head of a pile is governed by various factors: soil density or stiffness near the
ground surface, water table in granular soils, fixity of pile head, pile size and stiffness, depth of pile penetration,
group effects, and type of loading. Methods for estimating horizontal deflection generally take into account the soil
properties and location of water table. The pile head condition is governed by details and pile material. Standard
office details provide a considerable amount of pile head fixity, and in most cases a steel or concrete pile head may
be assumed to be fixed. A timber pile head, however, should be considered pinned.
Pile size is a factor, but the orientation of an H-pile is more significant because of the difference in stiffness and
ultimate moment resistance from major to minor axis. Depth of pile penetration needs to be sufficient to meet
assumptions for the method. Group effects are significant if piles will move in the shadows of other piles, and group
effects can double or triple the horizontal deflection of a single pile. Generally long-term loading will have more
effect than short-term loading.
For load and resistance factor design (LRFD) the design checks should include lateral deflection at the service limit
state and moment at the strength limit state. The design could be accomplished by three methods: (a) conservative
assumed nominal capacity at the service and strength limit states, (b) hand computation methods, or (c) software
such as LPILE. Because the simple guidelines used by the office in the past have worked well for typical bridges
their use can be continued and supplemented with strength limit state guidelines.
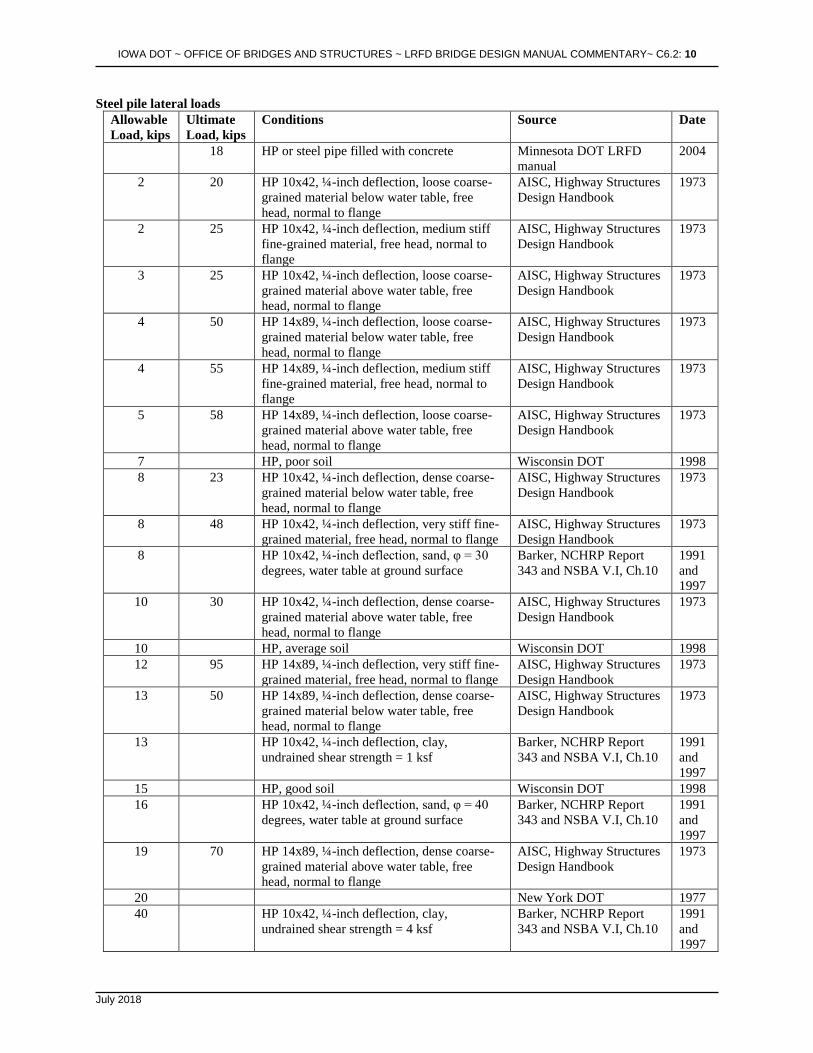
For steel piles the minimum nominal lateral resistance of a pile at the strength limit state shown in Table C6.2.4.5 is
18 kips, which is three times the service limit state capacity used by the office in the past. The simple guideline of 6
kips would be approximately equivalent to a nominal resistance of γ*6/φ = (1.70)(6)/(1.0) = 10.2 kips, assuming a
relatively high average load factor. Thus it would seem reasonable to set the nominal resistance at the strength limit
state at 10 kips or more. For steel piles the ultimate load generally is at least three times the load that causes a 0.25-
inch deflection, and that observation can be used to set the strength limit at 18 kips. The LPILE example, Example
(3), in the H-pile commentary [BDM C6.2.6.1] supports the observation.
No comparable information is available for timber piles. Conservatively, for a 4-kip service limit, the strength limit
could be set at γ*4/φ = (1.70)(4)/(1.0) = 6.8, rounded to 7 kips.
Two hand computation methods are readily available in the office: (a) a method based on work by Broms [Hannigan
et al. 2005] and (b) a method based on work by Evans and Duncan [Brockenbrough 1997]. The Broms method will
give working lateral loads based on deflection, pile structural and geotechnical capacity, pile length, and group
effects. In some cases, however, the user may need to extrapolate beyond the limits of the charts provided for the
method. The method covers steel and concrete piles. Results for steel piles seem not to compare well with results
from LPILE software, as shown in Examples (2) and (3) given in the H-pile commentary [BDM C6.2.6.1].
IOWA DOT ~ OFFICE OF BRIDGES AND STRUCTURES ~ LRFD BRIDGE DESIGN MANUAL COMMENTARY~ C6.2: 8
July 2018
The Evans and Duncan method seems easier to use and will give individual pile and group deflections and
individual pile and group maximum moments. The charts provided for the method are limited to prestressed
concrete piles and steel H-piles loaded with respect to the strong axis. Results seem to compare well with LPILE.
LPILE software available in the office will give the deflection, moment, and shear with depth for a single pile. Input
is relatively simple, and the program will handle a variety of pile types, soil types, and soil layers. Step by step
instructions for use of the program for individual piles and general instructions for use of the results for pile groups
are available to engineers in the office who have attended the recent National Highway Institute (NHI) courses
[Hannigan 2005 and Wilson et al. 2005].
The LPILE software supplier, Ensoft, Inc., also has a program, GROUP, that will analyze pile groups. At this time
GROUP is not available to the office.
Generally it appears that the most efficient design process is to use simple guidelines updated for LRFD for typical
bridges and recommend that the designer use LPILE software for conditions requiring additional capacity or more
rigorous analysis. The hand computation methods can provide checks on the software.
References
American Institute of Steel Construction (AISC) Marketing, Inc. (1973). Highway Structures Design Handbook.
AISC Marketing, Inc., Pittsburgh, PA.
Barker, R.M., S.G. Kim, J.M. Duncan, and K.B. Rojiani. (1991). Manuals for the Design of Bridge Foundations,
NCHRP Report 343. Transportation Research Board, Washington, DC.
Bridge Office. (2004). LRFD Bridge Design Manual. Minnesota Department of Transportation, Oakdale, MN.
Brockenbrough, R.L. (1997) “Steel Piling, Vol. I, Chap. 10.” Highway Structures Design Handbook. National Steel
Bridge Alliance, Chicago, IL.
Design Office. (1998). Bridge Manual. Wisconsin Department of Transportation, Madison, WI.
Hannigan, P.J., G.G. Goble, G.E. Likins, and F. Rausche. (2005). Design and Construction of Driven Pile
Foundations – Volumes I and II. (Reference for NHI Courses 132021 and 132022). National Highway Institute,
Federal Highway Administration, Washington, DC.
Teng, W.C. (1962). Foundation Design. Prentice-Hall, Inc., Englewood Cliffs, NJ.
U.S. Army Corps of Engineers (USACE). (1993). Design of Pile Foundations. American Society of Civil Engineers
(ASCE), New York, NY.
Vanikar, S. N. (1986). Manual on Design and Construction of Driven Pile Foundations, Report No. FHWA-DP-66-
1. Federal Highway Administration, Washington, DC.
White, R.N. and C.G. Salmon, Editors. (1987). Building Structural Design Handbook. John Wiley & Sons, Inc.,
New York, NY.
Wilson, K.E., R.E. Kimmerling, G.C. Goble, P.J. Sabatini, S.D. Zang, J.Y. Zhou, W.A. Amrhein, J.W. Bouscher,
and L.J. Danaovich. (2005). LRFD for Highway Bridge Substructures and Earth Retaining Structures. (Reference
for NHI Course 130082A). Michael Baker Jr., Inc., Moon Township, PA.
IOWA DOT ~ OFFICE OF BRIDGES AND STRUCTURES ~ LRFD BRIDGE DESIGN MANUAL COMMENTARY~ C6.2: 9
July 2018
Table C6.2.4.5. Summary of Permissible Lateral Loads at Heads of Embedded Piles
Timber pile lateral loads
Allowable Load, k Conditions Source Date
1.5 ¼-inch deflection, medium sand or
medium clay, 12-inch diameter, free
head
Vanikar, FHWA-DP-66-1
(McNulty)
1956
4 ¼-inch deflection, medium clay, 12-inch
diameter, fixed head
Vanikar, FHWA-DP-66-1
(McNulty)
1956
4 Poor soil Wisconsin DOT 1998
5 ¼-inch deflection medium sand, 12-inch
diameter, fixed head
Vanikar, FHWA-DP-66-1
(McNulty)
1956
5 Average or good soil Wisconsin DOT 1998
9 ¼-inch deflection Vanikar, FHWA-DP-66-1 (Feagin) 1953?
10 New York DOT 1977
14 ½-inch deflection Vanikar, FHWA-DP-66-1 (Feagin) 1953?
Concrete pile lateral loads
Allowable Load, k Conditions Source Date
5 ¼-inch deflection, medium clay, 16-inch
diameter, free or fixed head
Vanikar, FHWA-DP-66-1
(McNulty)
1956
7 ¼-inch deflection, medium sand, 16-inch
diameter, free or fixed head
Vanikar, FHWA-DP-66-1
(McNulty)
1956
8 12-inch precast or cast-in-place, poor soil Wisconsin DOT 1998
8 ¼-inch deflection, sand, φ = 30, 10-inch
prestressed
Barker, NCHRP Report 343 1991
11 12-inch precast or cast-in-place, average
or good soil
Wisconsin DOT 1998
12 ¼ inch deflection Vanikar, FHWA-DP-66-1 (Feagin) 1953?
13 ¼-inch deflection, sand, φ = 40, 10-inch
prestressed
Barker, NCHRP Report 343 1991
13 ¼-inch deflection, clay, undrained shear
strength = 1 ksf, 10-inch prestressed
Barker, NCHRP Report 343 1991
15 New York DOT 1977
17 ½ inch deflection Vanikar, FHWA-DP-66-1 (Feagin) 1953?
34 ¼-inch deflection, clay, undrained shear
strength = 4 ksf, 10-inch prestressed
Barker, NCHRP Report 343 1991
General pile lateral loads
Allowable Load, k Conditions Source Date
1 Soft clay Teng 1962
2 3/8 inch deflection New York City Building Code 1968
2 Modest deflection White and Salmon, Building
Structural Design Handbook
1987
10-20 Validated by tests White and Salmon, Building
Structural Design Handbook
1987
IOWA DOT ~ OFFICE OF BRIDGES AND STRUCTURES ~ LRFD BRIDGE DESIGN MANUAL COMMENTARY~ C6.2: 10
July 2018
Steel pile lateral loads
Allowable
Load, kips
Ultimate
Load, kips
Conditions Source Date
18 HP or steel pipe filled with concrete Minnesota DOT LRFD
manual
2004
2 20 HP 10x42, ¼-inch deflection, loose coarse-
grained material below water table, free
head, normal to flange
AISC, Highway Structures
Design Handbook
1973
2 25 HP 10x42, ¼-inch deflection, medium stiff
fine-grained material, free head, normal to
flange
AISC, Highway Structures
Design Handbook
1973
3 25 HP 10x42, ¼-inch deflection, loose coarse-
grained material above water table, free
head, normal to flange
AISC, Highway Structures
Design Handbook
1973
4 50 HP 14x89, ¼-inch deflection, loose coarse-
grained material below water table, free
head, normal to flange
AISC, Highway Structures
Design Handbook
1973
4 55 HP 14x89, ¼-inch deflection, medium stiff
fine-grained material, free head, normal to
flange
AISC, Highway Structures
Design Handbook
1973
5 58 HP 14x89, ¼-inch deflection, loose coarse-
grained material above water table, free
head, normal to flange
AISC, Highway Structures
Design Handbook
1973
7 HP, poor soil Wisconsin DOT 1998
8 23 HP 10x42, ¼-inch deflection, dense coarse-
grained material below water table, free
head, normal to flange
AISC, Highway Structures
Design Handbook
1973
8 48 HP 10x42, ¼-inch deflection, very stiff fine-
grained material, free head, normal to flange
AISC, Highway Structures
Design Handbook
1973
8 HP 10x42, ¼-inch deflection, sand, φ = 30
degrees, water table at ground surface
Barker, NCHRP Report
343 and NSBA V.I, Ch.10
1991
and
1997
10 30 HP 10x42, ¼-inch deflection, dense coarse-
grained material above water table, free
head, normal to flange
AISC, Highway Structures
Design Handbook
1973
10 HP, average soil Wisconsin DOT 1998
12 95 HP 14x89, ¼-inch deflection, very stiff fine-
grained material, free head, normal to flange
AISC, Highway Structures
Design Handbook
1973
13 50 HP 14x89, ¼-inch deflection, dense coarse-
grained material below water table, free
head, normal to flange
AISC, Highway Structures
Design Handbook
1973
13 HP 10x42, ¼-inch deflection, clay,
undrained shear strength = 1 ksf
Barker, NCHRP Report
343 and NSBA V.I, Ch.10
1991
and
1997
15 HP, good soil Wisconsin DOT 1998
16 HP 10x42, ¼-inch deflection, sand, φ = 40
degrees, water table at ground surface
Barker, NCHRP Report
343 and NSBA V.I, Ch.10
1991
and
1997
19 70 HP 14x89, ¼-inch deflection, dense coarse-
grained material above water table, free
head, normal to flange
AISC, Highway Structures
Design Handbook
1973
20 New York DOT 1977
40 HP 10x42, ¼-inch deflection, clay,
undrained shear strength = 4 ksf
Barker, NCHRP Report
343 and NSBA V.I, Ch.10
1991
and
1997
IOWA DOT ~ OFFICE OF BRIDGES AND STRUCTURES ~ LRFD BRIDGE DESIGN MANUAL COMMENTARY~ C6.2: 11
July 2018
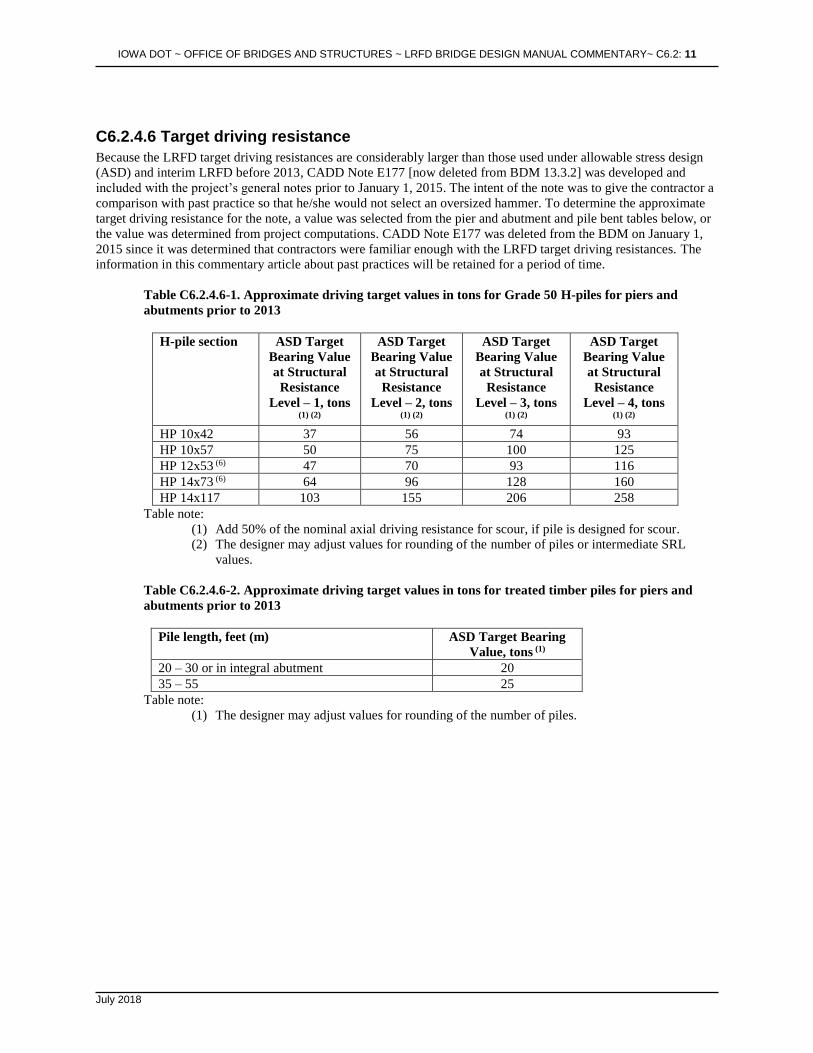
C6.2.4.6 Target driving resistance
Because the LRFD target driving resistances are considerably larger than those used under allowable stress design
(ASD) and interim LRFD before 2013, CADD Note E177 [now deleted from BDM 13.3.2] was developed and
included with the project’s general notes prior to January 1, 2015. The intent of the note was to give the contractor a
comparison with past practice so that he/she would not select an oversized hammer. To determine the approximate
target driving resistance for the note, a value was selected from the pier and abutment and pile bent tables below, or
the value was determined from project computations. CADD Note E177 was deleted from the BDM on January 1,
2015 since it was determined that contractors were familiar enough with the LRFD target driving resistances. The
information in this commentary article about past practices will be retained for a period of time.
Table C6.2.4.6-1. Approximate driving target values in tons for Grade 50 H-piles for piers and
abutments prior to 2013
H-pile section ASD Target
Bearing Value
at Structural
Resistance
Level – 1, tons
(1) (2)
ASD Target
Bearing Value
at Structural
Resistance
Level – 2, tons
(1) (2)
ASD Target
Bearing Value
at Structural
Resistance
Level – 3, tons
(1) (2)
ASD Target
Bearing Value
at Structural
Resistance
Level – 4, tons
(1) (2)
HP 10x42 37 56 74 93
HP 10x57 50 75 100 125
HP 12x53 (6) 47 70 93 116
HP 14x73 (6) 64 96 128 160
HP 14x117 103 155 206 258
Table note:
(1) Add 50% of the nominal axial driving resistance for scour, if pile is designed for scour.
(2) The designer may adjust values for rounding of the number of piles or intermediate SRL
values.
Table C6.2.4.6-2. Approximate driving target values in tons for treated timber piles for piers and
abutments prior to 2013
Pile length, feet (m) ASD Target Bearing
Value, tons (1)
20 – 30 or in integral abutment 20
35 – 55 25
Table note:
(1) The designer may adjust values for rounding of the number of piles.
IOWA DOT ~ OFFICE OF BRIDGES AND STRUCTURES ~ LRFD BRIDGE DESIGN MANUAL COMMENTARY~ C6.2: 12
July 2018
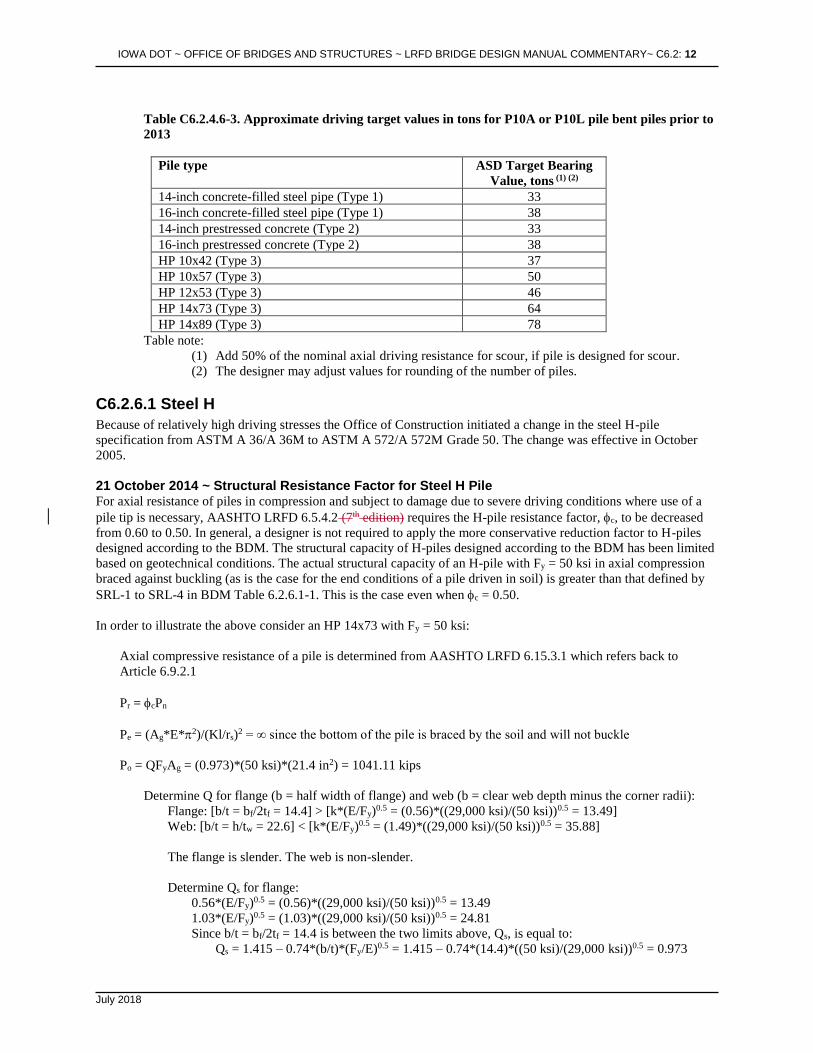
Table C6.2.4.6-3. Approximate driving target values in tons for P10A or P10L pile bent piles prior to
2013
Pile type ASD Target Bearing
Value, tons (1) (2)
14-inch concrete-filled steel pipe (Type 1) 33
16-inch concrete-filled steel pipe (Type 1) 38
14-inch prestressed concrete (Type 2) 33
16-inch prestressed concrete (Type 2) 38
HP 10x42 (Type 3) 37
HP 10x57 (Type 3) 50
HP 12x53 (Type 3) 46
HP 14x73 (Type 3) 64
HP 14x89 (Type 3) 78
Table note:
(1) Add 50% of the nominal axial driving resistance for scour, if pile is designed for scour.
(2) The designer may adjust values for rounding of the number of piles.
C6.2.6.1 Steel H
Because of relatively high driving stresses the Office of Construction initiated a change in the steel H-pile
specification from ASTM A 36/A 36M to ASTM A 572/A 572M Grade 50. The change was effective in October
2005.
21 October 2014 ~ Structural Resistance Factor for Steel H Pile For axial resistance of piles in compression and subject to damage due to severe driving conditions where use of a
pile tip is necessary, AASHTO LRFD 6.5.4.2 (7th edition) requires the H-pile resistance factor, c, to be decreased
from 0.60 to 0.50. In general, a designer is not required to apply the more conservative reduction factor to H-piles
designed according to the BDM. The structural capacity of H-piles designed according to the BDM has been limited
based on geotechnical conditions. The actual structural capacity of an H-pile with Fy = 50 ksi in axial compression
braced against buckling (as is the case for the end conditions of a pile driven in soil) is greater than that defined by
SRL-1 to SRL-4 in BDM Table 6.2.6.1-1. This is the case even when c = 0.50.
In order to illustrate the above consider an HP 14x73 with Fy = 50 ksi:
Axial compressive resistance of a pile is determined from AASHTO LRFD 6.15.3.1 which refers back to
Article 6.9.2.1
Pr = cPn
Pe = (Ag*E*2)/(Kl/rs)2 = ∞ since the bottom of the pile is braced by the soil and will not buckle
Po = QFyAg = (0.973)*(50 ksi)*(21.4 in2) = 1041.11 kips
Determine Q for flange (b = half width of flange) and web (b = clear web depth minus the corner radii):
Flange: [b/t = bf/2tf = 14.4] > [k*(E/Fy)0.5 = (0.56)*((29,000 ksi)/(50 ksi))0.5 = 13.49]
Web: [b/t = h/tw = 22.6] < [k*(E/Fy)0.5 = (1.49)*((29,000 ksi)/(50 ksi))0.5 = 35.88]
The flange is slender. The web is non-slender.
Determine Qs for flange:
0.56*(E/Fy)0.5 = (0.56)*((29,000 ksi)/(50 ksi))0.5 = 13.49
1.03*(E/Fy)0.5 = (1.03)*((29,000 ksi)/(50 ksi))0.5 = 24.81
Since b/t = bf/2tf = 14.4 is between the two limits above, Qs, is equal to:
Qs = 1.415 – 0.74*(b/t)*(Fy/E)0.5 = 1.415 – 0.74*(14.4)*((50 ksi)/(29,000 ksi))0.5 = 0.973
IOWA DOT ~ OFFICE OF BRIDGES AND STRUCTURES ~ LRFD BRIDGE DESIGN MANUAL COMMENTARY~ C6.2: 13
July 2018
Let Q = Qs = 0.973
Pe/Po = (∞)/(1041.11 kips) = ∞ > 0.44
Pn = [0.658(Po/Pe)]*(Po) = [0.6580]*(1041.11 kips) = [1]*(1041.11 kips) = 1041.11 kips
Note that Pr = cPn = (0.50)*(1041.11 kips) = 520 kips
From BDM Table 6.2.6.1-1:
Pn = 775 kips for SRL-4 is less than Pn =1041 kips calculated according to AASHTO-LRFD above.
Maximum Pr = cPn = (0.60)*(775 kips) = 465 kips for SRL-4 is also less than minimum Pr = 520 kips
calculated according to AASHTO-LRFD above.
Since the factored structural capacities of SRL-1 to SRL-4 are below the minimum factored structural capacity
of the pile calculated according to AASHTO-LRFD there is no need to reduce the nominal structural capacities
of the piles in BDM Table 6.2.6.1-1 by a resistance factor, c, of 0.50 for severe driving. However, it may be
necessary to do so if the pile yield strength is less than 50 ksi or if there are other circumstances present which
require a reduction.
5 November 2001 ~ Use of Higher Pile Capacities
Piles driven to rock
End bearing of 9 ksi at the service limit state is the same as 648 tsf. (The 9 ksi is extrapolated to Structural
Resistance Level – 2 at the strength limit state.) Generally, this strength would be midrange for uniaxial compressive
strength of limestone, mudstone, and sandstone and bottom range for granite [NAVFAC 1986].
In a recent paper [Serrano and Olalla 2002] the researchers surveyed the ultimate strengths of rock at pile tips
proposed by several authors, developed a model, and compared it with tests. Ultimate strengths proposed by others
ranged from 2.7 to 11 times the unconfined compression strength of the rock. (Generally these proposals parallel the
principle that locally, when confined, concrete can withstand higher stresses than indicated by cylinder compression
tests.) The researchers considered various factors in their model and comparisons, including unconfined compressive
strength, overburden pressure, length of pile embedment in rock, and fracturing and weathering of the rock.
Generally, the researchers’ model worked well for soft rocks (to 4.35 ksi) but overestimated ultimate bearing
capacities for hard rocks.
The second edition of the AASHTO LRFD Specifications, 2000 Interim includes a 1985 method from the Canadian
Geotechnical Society for determining the nominal end bearing resistance [AASHTO-LRFD-2nd 10.7.3.5]. However,
the commentary states: “When this method is applicable, the rocks are usually so sound that the structural capacity
will govern the design.” In the third edition, 2006 Interim, the AASHTO LRFD Specifications state: “The nominal
resistance of piles driven to point bearing on hard rock where pile penetration into the rock formation is minimal is
controlled by the structural limit state” [AASHTO-LRFD-3rd 10.7.3.2.3]. Also: “Soft rock that can be penetrated by
pile driving shall be treated in the same manner as soil for the purpose of design for axial resistance” [AASHTO-
LRFD-3rd 10.7.3.2.2]. The commentary relies on local experience for definition of hard rock.
“Except for soft weathered rock, the structural capacity of the pile will generally be lower than the capacity of the
rock to support loads for toe bearing piles on rock of fair to excellent quality as described in Table 9-7 [Hannigan et
al. 2005].” (Table 9-7 indicates “fair” is a Rock Quality Designation (RQD) of 50% or more.) “The structural
capacity, which is based on the allowable stress for the pile material, will therefore govern the pile capacity in many
cases…. Piles supported on soft weathered rock, such as shale or other types of very poor or poor quality, should be
designed on the results of pile load tests” [Hannigan et al. 2005].
“AASHTO limits the maximum allowable design stress to 0.25fy (which refers to the AASHTO Standard
Specifications). In conditions where pile damage is unlikely, AASHTO allows the design stress to be increased to a
maximum of 0.33fy provided static and/or dynamic load tests confirming satisfactory results are performed”
IOWA DOT ~ OFFICE OF BRIDGES AND STRUCTURES ~ LRFD BRIDGE DESIGN MANUAL COMMENTARY~ C6.2: 14
July 2018
[Hannigan et al. 2005]. For Grade 36 piles these stresses are 9 ksi and 12 ksi, and for Grade 50 piles these stresses
are 12.5 ksi and 16.5 ksi.
References
Hannigan, P.J., G.G. Goble, G.E. Likins, and F. Rausche. 2005. Design and Construction of Driven Pile
Foundations—Volume I. National Highway Institute (NHI), Washington, DC.
Naval Facilities Engineering Command (NAVFAC). 1986. Soil Mechanics Design Manual 7.01. Alexandria, VA.
Serrano, A. and C. Olalla. 2002. “Ultimate bearing capacity at the tip of a pile in rock—part 2: application.”
International Journal of Rock Mechanics and Mining Sciences, Volume 39, Issue 7, 847-866.
9 April 2001 ~ Battered Pile Capacity and Lateral Load Capacity for Pier Design
Steel H-pile lateral load examples:
(1) Lateral load, assumed resistance, LRFD, strength and service limit states, for comparison with (2)
and (3)
(2) Lateral load, Broms hand computation method, for comparison with (1) and (3)
(3) Lateral load, LPILE software, LRFD, strength and service limit states, for comparison with (1) and
(2)
(1) Lateral load, assumed resistance, LRFD, service and strength limit states, for comparison with (2)
and (3)
Examples (1), (2), and (3) make use of the following given information; however, not all of the information
is needed for each example.
Given: Vertical pile, HP 10x57 embedded 12 inches into pier footing (fixed head)
Service limit state loads 6 kips lateral, not sustained; 100 kips vertical
Factored strength limit state loads 10 kips lateral; 145 kips vertical
Lateral load resisted by weak axis bending
Pile designed for end bearing on rock 28 feet below footing
Soft clay soil with average N = 3, single layer, no scour
Soil properties γ = 110 pcf, qu = 0.75 ksf [Hannigan et al. 2005, C6.2.4.5]
Check vertical load at strength limit state: {145 k} < {φcPn = 0.6*243 = 145.8 k}, OK
The nominal pile resistance is taken from BDM Table 6.2.6.1-1.
Check lateral load at service limit state: {6 k} = {6 k}, OK
The lateral load limit is taken from BDM Table 6.2.6.1-2.
Check lateral load at strength limit state: {10 k} < {φPn = 1.0*18 = 18 k}, OK
The lateral load limit is taken from BDM Table 6.2.6.1-2.
All checks are satisfactory.
(2) Lateral load, Broms hand computation method, for comparison with (1) and (3)
The Broms method is given in the NHI Reference for Course 132021 and 132022 [Hannigan et al. 2005,
C6.2.4.5] (Note that the Evans and Duncan method [Brockenbrough 1997, C6.2.4.5] does not consider
loads with respect to the weak axis and thus is not applicable for this example.)
Given: See Example (1).
IOWA DOT ~ OFFICE OF BRIDGES AND STRUCTURES ~ LRFD BRIDGE DESIGN MANUAL COMMENTARY~ C6.2: 15
July 2018
Step 1: Soil type is cohesive (clay).
Step 2: Coefficient of horizontal subgrade reaction. Refer to Table 9-13 [Hannigan et al. 2005, C6.2.4.5].
Kh = n1n280qu/b = (0.32)(1.00)(80)(750)/(0.833)(1728) = 13.34 pci
Step 3: No Kh adjustments are necessary.
Step 4: Pile parameters
E = 29,000,000 psi, I = 101 in4, S = 19.7 in3, fy = 50,000 psi
D = 336 in, Cs = 1.5, My = 1,477,500 in-lb
Step 5: Embedment factor
βh = (Khb/4EI)0.25 = (13.34*9.99/4*29000000*101)0.25 = 0.0103
Step 6: Dimensionless length factor
βhD = (0.0103)(336) = 3.47
Step 7: Long or short pile?
{βhD = 3.47} > 2.25, therefore pile is long.
Step 8: Other soil parameters
cu = qu/2 = 750/2 = 375 psf
Step 9: Ultimate lateral load for a single pile
My/cub3 = 1477500/(375/144)(9.993) = 568
Figure 9.38 [Hannigan et al. 2005, C6.2.4.5] extrapolated: Qu/cub3 = 150
Qu = (150)(375/144)(9.993) = 39031 lb
Assuming Qu is the same as Pn,
{φPn = (1.00)(39.03) = 39.03 kips} > {10 kips}, OK
Step 10: Maximum working load for a single pile
Qm = Qu/2.5 = 39031/2.5 = 15,612 lb, {15.61 k} > {6 k}, OK
Step 11: Working load for a single pile based on deflection
Figure 9.42 [Hannigan et al. 2005, C6.2.4.5]: yKhbD/Qa = 3.5
If y = 0.25 in, Qa = (0.25)(13.34)(9.99)(336)/3.5 = 3200 lb,
Or if Qa = 6 k, {y = (3.5)(6000)/(13.34)(9.99)(336) = 0.47 in} > {0.25 in}, NG
The Broms method predates LRFD and uses a factor of safety of 2.5, but the method obviously permits use
of the pile under service or strength limit state lateral loads. It does not, however, give a deflection less than
0.25 inches, which would cause the pile to be rejected.
(3) Lateral load, LPILE software, LRFD, service and strength limit states, for comparison with Example
(1) and (2)
Given: See Example (1).
IOWA DOT ~ OFFICE OF BRIDGES AND STRUCTURES ~ LRFD BRIDGE DESIGN MANUAL COMMENTARY~ C6.2: 16
July 2018
Determine input quantities in lb and inch units
Unit weight = 110/1728 = 0.0637 lb/in3
Undrained cohesion = (750/2)/144 = 2.60 lb/in2
Soil strain = ε50 = 0.02 [Hannigan et al. 2005, C6.2.4.5]
Input title: HP 10x57 weak axis in soft silty clay, 28 feet to end bearing
Input pile properties: 336, 100, 0, 0
Input pile sectional properties: 1: 0, 9.99, 101, 16.8, 29000000
2: 336, 9.99, 101, 16.8, 29000000
Input loading type: static
Input boundary conditions and loading: 1, shear and slope, 6000, 0, 100000
2, shear and slope, 10000, 0, 145000
Input soil layers: soft clay, 0, 336
Input soft clay: 1: 0.0637, 2.60, 0.02
2: 0.0637, 2.60, 0.02
Output: 0.249 inches lateral deflection at 6-kip service limit state load
564106 in-lb moment at 10-kip factored strength limit state load
Check lateral deflection at service limit state: {0.249 in} < {0.25 in}, OK
Check pile head at strength limit state:
Pu = 145 k, Muy = 564 in-k, Vu = 10 k
Pr = φcPn = (0.7)(0.660)(16.8)(50) = 588 k [AASHTO-LRFD 10.7.3.13.1, 6.9.4.1]
Mry = φfMny = (1.0)(30.3)(50) = 1515 in-k
Pu/Pr = 145/588 = 0.247, therefore
Pu/Pr + (8/9)(Mux/Mrx + Muy/Mry) < 1.0 [AASHTO-LRFD 6.9.2.2]
145/588 + (8/9)(564/1515) = 0.591 < 1.0, OK
φvVn = φvCVp = φvC(0.58FywDtw Note that this assumes web will be in shear,
which is not true in this example for load causing y-axis bending. Actual resistance will
be about twice this value, but AASHTO LRFD Specifications do not cover shear applied
to flanges. This shear check is not likely to control even with the lower, incorrect
resistance used above.
Check D/tw < 1.12(Ek/Fyw)0.5 [AASHTO-LRFD 6.10.9.3.1]
9.99/0.565 < 1.12(29000*5.0/50)0.5, 17.68 < 60.31, therefore C = 1.0
φvC(0.58FywDtw = (1.0)(1.0)(0.58)(50)(9.99)(0.565) = 163.69 k > 10 k, OK
See note above regarding actual resistance.
The pile meets the applicable criteria at the service and strength limit states. If the lateral load were
increased to the maximum that would meet the combined compression and flexure check, the load would
be 22.79 k, more than three times the service load that causes a 0.25-inch deflection.
C6.2.6.2 Concrete-filled steel pipe
In 2009 the Soils Design Section recommended that steel pipe piles generally not be used in soils with consistent N-
values greater than 40.
C6.2.6.3 Timber
Carpet padding and plan note For timber piles in integral abutment bridges 150 to 200 feet (45.700 to 61.000 m) in length, pile heads are to be
wrapped in carpet padding. The basic detail and note regarding the padding probably were developed in 1965 at the
IOWA DOT ~ OFFICE OF BRIDGES AND STRUCTURES ~ LRFD BRIDGE DESIGN MANUAL COMMENTARY~ C6.2: 17
July 2018
time the bridge on Stange Road just north of 13th Street in Ames was designed, but the detail and note were modified
in later years (prior to 1979).
The 1979-detail showed the timber pile embedded 2’-0 (600 mm) in the abutment and 3’-0 (1000 mm) rug padding
starting at 3 inches (75 mm) from the top of the pile. The top 3 inches (75 mm) of the pile was embedded in the
abutment concrete, but below the pile was padded. The pile head was encircled with a spiral with a note: “Spiral at
top of each pile 7 turns of #2 bar, 21” diameter, 3” pitch with 2-7/8” C0.69 spacers punched to hold spiral” (“Spiral
at top of each pile 7 turns of W5 wire, 535 mm φ, 75 mm pitch with 2-L22 x 22 x 3.2 spacers punched to hold
spiral”. This metric note is more recent and has a change in spacer.).
The separate 1979-note for the padding is as follows:
AFTER PILES ARE CUT OFF, THE UPPER 3’, EXCEPT AS SHOWN, IS TO BE WRAPPED WITH A
DOUBLE THICKNESS OF RUG PADDING HELD IN PLACE BY TACKING WITH GALVANIZED
ROOFING NAILS AND WRAPPED WITH #14 GAGE GALVANIZED WIRE AT 4” PITCH. CARE IS
TO BE TAKEN NOT TO DAMAGE PADDING WHEN PLACING CONCRETE. RUG PADDING MAY
BE EITHER OF THE FOLLOWING:
(1) HAIR AND JUTE RUG PADDING, RUBBERIZED ON BOTH SIDES, AND WEIGHING NOT
LESS THAN 47 OZ. PER SQ. YD.
(2) BONDED URETHANE OR BONDED POLYFOAM WITH A MINIMUM DENSITY OF 5 LBS.
PER CU. FT. AND SHALL BE AT LEAST ½ IN. THICK. (MATERIAL LESS THAN ½ IN. IN
THICKNESS MAY BE USED, BUT WILL REQUIRE ADDITIONAL WRAPS FOR A TOTAL OF
AT LEAST ONE INCH.)
Driving limit of 160 tons Prior to the conversion to LRFD the Iowa DOT had a service driving limit of 40 tons (which scales up to an LRFD
target driving resistance of 160 tons) to avoid overdriving [IDOT SS, Series of 2012 and earlier, 2501.03, O, 2, c].
For one 1970s era western Iowa bridge, timber piles were driven to 40 tons or more, which was considered hard
driving and, from the pile logs, seemed to be causing pile damage. At 40 tons formula-driven capacity, the
penetration was about 0.22 inches per blow (or 55 blows/foot) for the last 10 blows. The number of blows per foot
will vary based on several factors so 55 blows/foot is not necessarily an appropriate limit in all cases, and therefore
the office has retained a driving limit in tons.
The Pile Driving Contractors Association (PDCA) has developed Specification 102-07, “Installation Specification
for Driven Piles”. C4.3.4 Practical Refusal states “In cases where the driving is easy until near the end of driving, a
higher blow count may sometimes be satisfactory, but if a high blow count is required over a large percentage of the
depth, even 10 blows per inch may be too large. Blow counts greater than 10 blows per inch should be used with
care, particularly with concrete or timber piles.”
Prior to 2007 ~ Service load design for timber piles in piers and stub abutments [AASHTO …] refers to the AASHTO Standard Specifications.
The Iowa DOT Standard Specifications [IDOT SS 4165.03, H] give dimension specifications for timber piles
ranging from less than 20 feet to over 60 feet. However, office practice for bridge foundations has limited timber
piles to lengths of 20 to 55 feet.
Past office practice has implied that timber piles only need to be checked for geotechnical capacity by limiting the
capacity for pier and stub abutment piles to 20 tons for piles 20 to 30 feet long and to 25 tons for piles 35 to 55 feet
long. These capacities run counter to the axial structural capacity for an end bearing pile, which is based on the tip
area of the pile and which decreases with pile length as the following computations show.
• 20- to 35-foot pile, minimum tip diameter = 8 inches [IDOT SS 4165.03, H], resulting tip area = 50.27 in2,
allowable working stress for douglas fir or southern pine = 1200 psi [AASHTO Table 4.5.7.3A], load
duration factor for vehicle live load = 1.15 [AASHTO Table 13.5.5A], and capacity = 69.37 kips or 34.69
tons
• 40- to 55-foot pile, minimum tip diameter = 7 inches [IDOT SS 4165.03, H], resulting tip area = 38.48 in2,
allowable working stress for douglas fir or southern pine = 1200 psi [AASHTO Table 4.5.7.3A], load
IOWA DOT ~ OFFICE OF BRIDGES AND STRUCTURES ~ LRFD BRIDGE DESIGN MANUAL COMMENTARY~ C6.2: 18
July 2018
duration factor for vehicle live load = 1.15 [AASHTO Table 13.5.5A], and capacity = 53.10 kips or 26.55
tons
Within the design rules and specifications, the structural capacity for pier and stub abutment piles should not control.
(The piles also should be checked for dead load alone with a load duration factor of 0.90. Because of the relative
magnitudes of live and dead load this dead-load case typically does not control.)
It is interesting to note that Foundation Soils Information Chart, Pile Foundation (Blue Book) assumes a relatively
large end area of 72 in2, which correlates with a tip diameter of 9.57 inches, more than required by the standard
specifications [IDOT SS 4165.03, H]. A note requires that geotechnical bearing be adjusted for a different tip
dimension, which generally would require reduction of the tabulated values. In Appendix B, Table 5 of the Blue
Book the average wood pile diameter is given as 10 inches, and after Table 9 the timber pile design bearing is given
as 900 psi. Even though the average timber pile diameter is about 10 inches it would appear that the Blue Book is
not consistent with the present Iowa DOT Standard Specifications.
Based on the example for downdrag in Appendix A of the Blue Book it appears that downdrag could easily cause
overstress of a timber pile during driving. To avoid overstress the office in the past had a 40-ton driving limit [IDOT
SS 2501.03, O, 2, c]. Generally, it would seem inadvisable to use timber piles when they will be subjected to
downdrag.
Prior to 2007 ~ Service load design for piles for integral abutments in prebored holes Past office practice limited timber piles for integral abutments to 20 tons. The reason stated for this limit was
indeterminate bending stresses (which are likely to occur for bridges less than 150 feet long for which the pile heads
are not wrapped in carpet padding).
Another possible reason for the limit is reduction in capacity due to lack of lateral support in a prebored hole.
Prebored holes are required for bridges longer than 130 feet. At the time the 20-ton rule was instituted the typical
prebore was 8 feet. If one makes a few assumptions, the column stability factor reduction can be estimated for a pile
in an 8-foot prebored hole.
• Assume pile is fixed 4 feet below bottom of prebore. This distance will vary depending on stiffness of soil
but generally is in the range of 2.5 to 4 feet. The equations for preliminary design in the AASHTO LRFD
Specifications indicate that the distance would exceed 4 feet only for very loose submerged sand
[AASHTO-LRFD C10.7.3.13.4].
• Assume K-factor for slenderness is 0.8. This assumption is more liberal than a flagpole assumption
(K=2.1), but reasonable considering the overall superstructure, fixity at one pier, and embankment
restraints due to pavement and wing walls. This assumption also is consistent with the ISU research report
on which design for integral abutment piles is based [Greimann et al 1987].
• Assume average pile diameter for the top 12 feet of pile is 8.7 inches (interpolated from Southern Pine
Foundation Piling—Specified Tip Circumferences with Corresponding Minimum Butt Circumferences,
ASTM D25). The equivalent square area of the pile then would have a side dimension of 7.71 inches.
• Assume Service Load Group I, and therefore load duration factor = 1.15 for vehicle live load [AASHTO
Table 13.5.5A].
• Assume Fc = 1200 psi for Douglas fir or southern pine under wet or dry conditions [AASHTO 4.5.7.3].
• Assume KcE = 0.418 as for glulam timber [AASHTO 13.7.3.3]. The AASHTO Standard Specifications do
not specifically cover timber piles, but the AASHTO LRFD Specifications list the same value of KcE for
glulam and round piles [AASHTO-LRFD 8.8.2].
With the assumptions above, the column stability reduction is about 0.89, which would reduce the pile minimum
structural capacity to 23.63 tons but not less than 20 tons. The additional capacity provides some margin for bending
stresses that occur as the bridge expands or contracts. Additionally, the AASHTO Service Load Groups that include
temperature loads have a stress increase of 125% or 140%.
A separate check with the assumptions above but with a 10-foot prebored hole, a 200-foot long bridge, and a
moment due to thermal expansion under Load Group IV gave a performance ratio of 0.542, indicating that a timber
pile would be acceptable considering column stability and bending.
IOWA DOT ~ OFFICE OF BRIDGES AND STRUCTURES ~ LRFD BRIDGE DESIGN MANUAL COMMENTARY~ C6.2: 19
July 2018
2007 and later ~ LRFD geotechnical design The traditional maximum limits for geotechnical capacity of timber foundation piles have served well, and there
appeared to be no reason to alter the limits in 2007 for the interim pile design method. Therefore, to fit the service
load design limits to LRFD, the office adjusted service limits with an average load factor, γ, of 1.45 divided by a
resistance factor, φ, of 0.725 [BDM C6.2.4.3]. The adjustment computes to 2.00. For stub abutments and piers the
maximum LRFD nominal resistance then was 80 kips for piles 20 to 30 feet long and 100 kips for piles 35 to 55 feet
long. Also, the maximum LRFD nominal resistance for timber piles in integral abutments was 80 kips. As a general
check on these limits, the Blue Book states that the majority of the timber pile load tests experienced yield at no
more than 75 tons (150 kips) and that the ultimate load (used in design) should not exceed 60 tons (120 kips), both
of which are greater than the interim LRFD policy limits.
With the ISU 2012 calibration the geotechnical φ-values vary with soil type and construction control and usually are
less than 0.725. Thus the same nominal geotechnical resistances no longer will give consistent design results. To use
the traditional resistances it was necessary to consider the structural rather than geotechnical resistance. For a
nominal geotechnical resistance of 80 kips and φ of 0.725, the factored geotechnical resistance is 58 kips. If the
factored structural resistance also were 58 kips, the nominal structural resistance using a parallel-with-grain φ of 0.9
would be 58/0.9 = 64 kips, and that nominal resistance has been written into the manual for integral abutment piles
and 20-30-foot piles. For 35-55-foot piles the comparable nominal structural resistance is about 80 kips.
To determine the contract length and target driving resistance the designer should follow the latest guidelines in the
manual.
2007 and later ~ LRFD structural design For fully embedded, end-bearing piles the usual design procedure is to check axial compression at the pile tip. The
various factors necessary for the check are given in the AASHTO LRFD Specifications [AASHTO-LRFD 8.4 and
8.5.2.2]. For friction-bearing or friction- and end-bearing piles a cross section at the butt or elsewhere along the pile
may control.
In cases where a timber pile is unsupported over some length, the pile should be checked structurally using the
information in Chapter 8 of the AASHTO LRFD Specifications.
If the 64-kip limit for maximum nominal structural resistance for an integral abutment pile is followed, the designer
need not check an integral abutment timber pile in a prebored hole 10 feet deep or less.
Driving limits
Damage due to hard driving has been a concern for timber piles. When the office often used treated timber piles in
the1970s (and earlier) timber piles were not to be used in glacial clays with N greater than or equal to 30. In 1982
the guideline was revised downward so that timber piles were not to be used in any soils in which N exceeded 25.
Since 1964 the Standard Specifications have required that timber piles not be driven in excess of 40 tons. That
guideline exceeded the maximum allowable design load and thus was a limit used in the field to prevent overdriving.
At this time, for LRFD no comparable maximum driving limit has been set. However, the Pile Driving Contractors
Association (PDCA) recommends that blow counts above 10 blows/inch (120 blows/foot) be used with care,
especially for concrete or timber piles.
References
American Forest and paper Association (AF&PA) (2001). National Design Specification, ANSI/AF&PA NDS-2001.
AF&PA, American Wood Council. Washington, DC.
ASTM International (2005). “Standard Specification for Round Timber Piles, D 25.” ASTM International. West
Conshohocken, PA.
Collin, J.G. (2002). Timber Pile Design and Construction Manual. Timber Piling Council, American Wood
Preservers Institute. Fairfax, VA.
Dirks, K.L. and P. Kam. (1994). Foundation Soils Information Chart, Pile Foundation. Soils Survey Section,
Highway Division, Iowa DOT. Ames, IA. (Blue Book)
IOWA DOT ~ OFFICE OF BRIDGES AND STRUCTURES ~ LRFD BRIDGE DESIGN MANUAL COMMENTARY~ C6.2: 20
July 2018
Greimann, L.F., R.E. Abendroth, D.E. Johnson., and P.B. Ebner. (1987). Pile Design and Tests for Integral
Abutments, Final Report. Department of Civil Engineering, Iowa State University. Ames, IA.
Pile Driving Contractors Association (2007). “Installation Specification for Driven Piles, PDCA Specification 102-
07.” PDCA, Orange Park, FL.
C6.2.6.4 Prestressed concrete
The office has relaxed limitations for use of prestressed concrete piles since the 1970s. In 1975 a memo
recommended that concrete piles not be used in very firm glacial clay or very firm sandy glacial clay when N values
exceed 20. The limit was set due to driving experience. Since the late 1980s the rule has been revised to not drive
prestressed piles more than 10 feet through soils with N values greater than 40. In 1995 a memo advised that
prestressed piles should tip out in soils with N values from 25 to 40 and which do not contain boulders. In 2009 the
Soils Design Section recommended that prestressed concrete piles generally not be used in soils with consistent N-
values greater than 30 to 35.
In 1995 the office set a service load design bearing capacity of 50 tons (which a few years earlier had been 40 tons)
for a 12-inch square prestressed concrete pile. It was unclear as to whether the limit was structural or geotechnical; it
has been assumed to be structural. The limit has been fitted to a LRFD nominal structural resistance using an
average load factor of 1.45 and a resistance factor of 0.75 for a compression controlled section [AASHTO-LRFD
5.5.4.2.1] as follows:
(50)(2)(1.45)/0.75 = 193 kips, round to 200 kips.