Embed Size (px)
Citation preview
User Guide Release 9.64.01
CA ERwin® Data Modeler
Navigator Edition

This Documentation, which includes embedded help systems and electronically distributed materials (hereinafter referred to as the “Documentation”), is for your informational purposes only and is subject to change or withdrawal by CA at any time. This Documentation is proprietary information of CA and may not be copied, transferred, reproduced, disclosed, modified or duplicated, in whole or in part, without the prior wri tten consent of CA.
If you are a licensed user of the software product(s) addressed in the Documentation, you may print or otherwise make available a reasonable number of copies of the Documentation for internal use by you and your employees in connection with that software, provided that all CA copyright notices and legends are affixed to each reproduced copy.
The right to print or otherwise make available copies of the Documentation is limited to the period during which the applicable l i cense for such software remains in full force and effect. Should the license terminate for any reason, i t is your responsibility to certi fy in writing to CA that all copies and partial copies of the Documentation have been returned to CA or destroyed.
TO THE EXTENT PERMITTED BY APPLICABLE LAW, CA PROVIDES THIS DOCUMENTATION “AS IS” WITHOUT WARRANTY OF ANY KIND, INCLUDING WITHOUT LIMITATION, ANY IMPLIED WARRANTIES OF MERCHANTABILITY, FITNESS FOR A PARTICULAR PURPOSE, OR NONINFRINGEMENT. IN NO EVENT WILL CA BE LIABLE TO YOU OR ANY THIRD PARTY FOR AN Y LOSS OR DAMAGE,
DIRECT OR INDIRECT, FROM THE USE OF THIS DOCUMENTATION, INCLUDING WITHOUT LIMITATION, LOST PROFITS, LOST INVESTMENT, BUSINESS INTERRUPTION, GOODWILL, OR LOST DATA, EVEN IF CA IS EXPRESSLY ADVISED IN ADVANCE OF THE POSSIBILITY OF SUCH LOSS OR DAMAGE.
The use of any software product referenced in the Documentation is governed by the applicable license agreement and such
l icense agreement is not modified in any way by the terms of this notice.
The manufacturer of this Documentation is CA.
Provided with “Restricted Rights.” Use, duplication or disclosure by the United States Government is subject to the restricti ons set forth in FAR Sections 12.212, 52.227-14, and 52.227-19(c)(1) - (2) and DFARS Section 252.227-7014(b)(3), as applicable, or their successors.
Copyright © 2016 CA. Al l rights reserved. All trademarks, trade names, service marks, and logos referenced herein belong to their respective companies.

CA Technologies Product References
This document references the following CA Technologies products:
■ CA ERwin® Data Modeler Navigator Edition
■ CA ERwin® Data Modeler Standard Edition
■ CA ERwin® Data Modeler Workgroup Edition

Contact CA Technologies
Understanding your Support
Review support maintenance programs and offerings .
Registering for Support
Access the CA Support online registration site to register for product support.
Accessing Technical Support
For your convenience, CA Technologies provides easy access to "One Stop" support for all editions of CA ERwin Data Modeler, and includes the following:
■ Online and telephone contact information for technical assistance and customer
services
■ Information about user communities and forums
■ Product and documentation downloads
■ CA Support policies and guidelines
■ Other helpful resources appropriate for your product
For information about other Home Office, Small Business, and Enterprise CA Technologies products, visit http://ca.com/support.
Provide Feedback
If you have comments or questions about CA Technologies product documentation, you can send a message to [email protected].
If you would like to provide feedback about CA Technologies product documentation, complete our short customer survey, which is also available on the CA Support website, found at http://ca.com/docs.
CA ERwin Data Modeler News and Events
Visit www.erwin.com to get up-to-date news, announcements, and events. View video demos and read up on customer success stories and articles by industry experts.
Contents 5
Contents
Chapter 1: Working with CA ERwin Data Modeler Navigator Edition 7
Intended Audience......................................................................................................................................................................... 7
CA ERwin Data Modeler Navigator Edition................................................................................................................................ 8
Modeling Overview........................................................................................................................................................................ 8
The Application Development Cycle........................................................................................................................................... 9
Chapter 2: Installation 11
Install CA ERwin Data Modeler Navigator Edition.................................................................................................................. 11
Uninstall the Navigator Edition.......................................................................................................................................... 12
Post-Installation............................................................................................................................................................................ 12
Install the SSL Certificate ............................................................................................................................................................ 13
Chapter 3: Navigating Data Models 15
Data Models .................................................................................................................................................................................. 15
Basic Data Modeling Concepts .................................................................................................................................................. 15
Model Types .......................................................................................................................................................................... 16
Entities.................................................................................................................................................................................... 17
Tables ..................................................................................................................................................................................... 18
Attributes and Columns ...................................................................................................................................................... 19
Primary Key and Non-Keys ................................................................................................................................................. 20
Relationships ......................................................................................................................................................................... 21
Foreign Key ............................................................................................................................................................................ 23
Workplace Panes.......................................................................................................................................................................... 24
Overview of Model Explorer .............................................................................................................................................. 26
Action Log .............................................................................................................................................................................. 31
Advisories Pane .................................................................................................................................................................... 39
Overview Pane ...................................................................................................................................................................... 39
Bulk Editor Pane ................................................................................................................................................................... 40
Open an Existing Model .............................................................................................................................................................. 41
Open a Model Saved in XML Format (XML Import) ............................................................................................................... 41
Connect to Mart ........................................................................................................................................................................... 42 Open a Model or Submodel from the Mart ............................................................................................................................ 43
Customizing the Appearance of Data Models......................................................................................................................... 45
Display Levels ........................................................................................................................................................................ 45
Font and Color Change for Individual Objects ................................................................................................................ 49
Changing the Diagram Window Magnification Level ..................................................................................................... 51
6 User Guide
Print a Data Model ....................................................................................................................................................................... 52
Print Only What You Want ................................................................................................................................................. 53
Set Printer Options............................................................................................................................................................... 53
Specify an Exact Print Scale Value ..................................................................................................................................... 54
Add a Page Header or Footer ............................................................................................................................................. 54
Page Margins......................................................................................................................................................................... 55
Page Boundaries ................................................................................................................................................................... 56
Set Print Margins .................................................................................................................................................................. 56
Chapter 4: Reporting 57
Data Model Reporting ................................................................................................................................................................. 57
The Query Tool ..................................................................................................................................................................... 57
Appendix A: Product Differences 63
CA ERwin Data Modeler Navigator Edition Differences ........................................................................................................ 63
Data Model Disabled Menu Items and Toolbar Icons ........................................................................................................... 64
Index 65
Chapter 1: Working with CA ERwin Data Modeler Navigator Edition 7
Chapter 1: Working with CA ERwin Data Modeler Navigator Edition
This section contains the following topics:
Intended Audience (see page 7) CA ERwin Data Modeler Navigator Edition (see page 8)
Modeling Overview (see page 8) The Application Development Cycle (see page 9)
Intended Audience
This guide is intended for use by individuals such as business or system analysts, database designers, and programmers who require read-only access to models created
in CA ERwin Data Modeler. You can use CA ERwin Data Modeler Navigator Edition to view, print, and manipulate models. The only l imitation is that you cannot save any type of model change, including any made to models accessed in a mart database.
You can use this product on data models that are on a local drive, network drive, or in a mart database to:
■ View the work of others while it is in progress.
■ Provide input without inadvertently changing work.
■ Read the information in a model in order to create queries, reports, or applications.
If you are already familiar with CA ERwin Data Modeler, CA ERwin Data Modeler Navigator Edition offers most of the features currently available in the full -feature
version of these products.
Note: For more information about product differences, see CA ERwin Data Modeler Navigator Edition Differences (see page 63).
To use this product with data models, you should have a working knowledge of database management, entity-relationship diagrams, and IDEF1X and IE data modeling
terms. If you are using a data warehousing environment, you should also have a working knowledge of dimensional modeling terms.
CA ERwin Data Modeler Navigator Edition
8 User Guide
CA ERwin Data Modeler Navigator Edition
CA ERwin Data Modeler Navigator Edition is one of the editions of CA ERwin Data Modeler. These editions provide a foundation for building, deploying, and managing applications. These editions consist of project management, change and configuration management, modeling and design, and knowledge publication and visualization. They
strengthen your ability to automate critical application life cycle processes and to thrive in the increasing complexity and rate of change in today's business climate. They help you simplify the complex aspects of analyzing, designing, and implementing applications by providing a visualization of the relationships between business and technology. The
key editions that provide the integration of design and data models are:
■ CA ERwin Data Modeler Standard Edition--The essential tool for data modeling.
■ CA ERwin Data Modeler Workgroup Edition--Supports concurrent team modeling
for large client/server development projects.
Modeling Overview
Modeling is one of the most effective techniques for understanding and communicating business rules and processes. Just as an architect creates a blue print before building a structure, a database designer creates a data model before building a database. A data
model is a graphical representation of a database that is used to capture an organization's business rules, which can then be used to define a system's requirements.
Typically, throughout the design process, a model is presented to business users and other members of the enterprise for review and input. As a reviewer of a data model,
you may be required to provide input to the design team.
This product is a read-only version of the CA ERwin Data Modeler database modeling tool when you are working with data models. You can use it to create, open, manipulate, print, and report on any data model. This product maintains most of the
functionality of the full -feature version, but you cannot use it to save a data model or to forward or reverse engineer a database.
You can also use CA ERwin Data Modeler Navigator Edition to open models saved in a shared database that was created using CA ERwin Data Modeler Workgroup Edition. If
you want to be able to access a mart database, contact your mart administrator. The administrator must create a mart database on a supported DBMS and a security profile for each user. Your PC must have the appropriate DBMS cl ient connection software
before you can access models in a mart database, and you must have the appropriate security permissions. See the CA ERwin Data Modeler Workgroup Edition Administration Guide for more information.

The Application Development Cycle
Chapter 1: Working with CA ERwin Data Modeler Navigator Edition 9
The Application Development Cycle
To create a data model, first the business rules are gathered and the logical constructs are created. Next, the physical design is created, and then a database is implemented. CA ERwin DM supports this iterative process by supporting multiple platforms, reuse of objects, and synchronization of changes between data models.

Chapter 2: Installation 11
Chapter 2: Installation
This section contains the following topics:
Install CA ERwin Data Modeler Navigator Edition (see page 11) Post-Installation (see page 12) Install the SSL Certificate (see page 13)
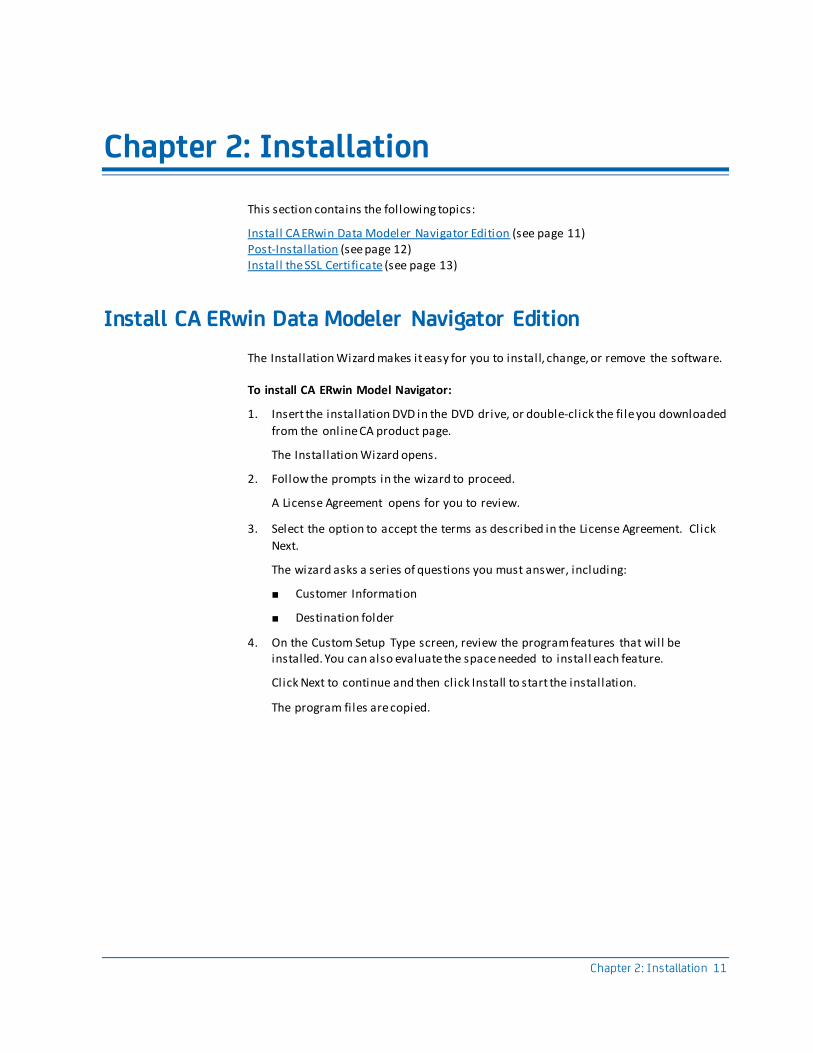
Install CA ERwin Data Modeler Navigator Edition
The Installation Wizard makes it easy for you to install, change, or remove the software.
To install CA ERwin Model Navigator:
1. Insert the installation DVD in the DVD drive, or double-click the fi le you downloaded
from the online CA product page.
The Installation Wizard opens.
2. Follow the prompts in the wizard to proceed.
A License Agreement opens for you to review.
3. Select the option to accept the terms as described in the License Agreement. Click
Next.
The wizard asks a series of questions you must answer, including:
■ Customer Information
■ Destination folder
4. On the Custom Setup Type screen, review the program features that will be installed. You can also evaluate the space needed to install each feature.
Click Next to continue and then click Install to start the installation.
The program files are copied.
Post-Installation
12 User Guide
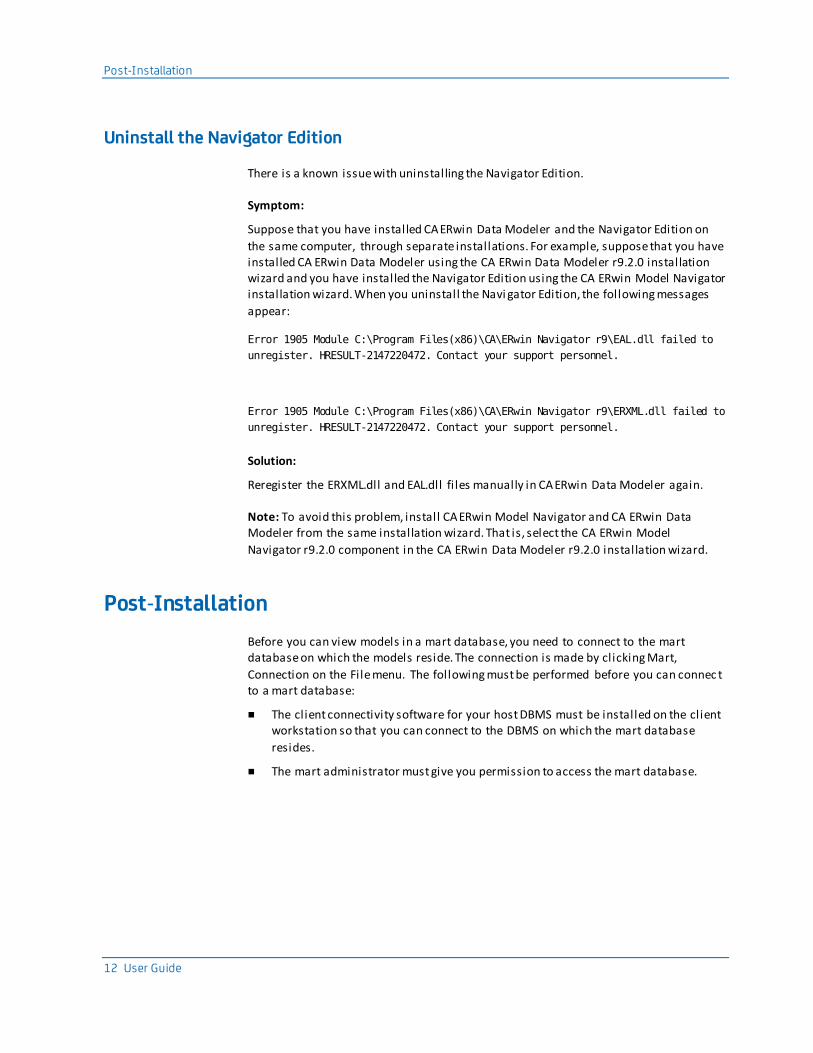
Uninstall the Navigator Edition
There is a known issue with uninstalling the Navigator Edition.
Symptom:
Suppose that you have installed CA ERwin Data Modeler and the Navigator Edition on
the same computer, through separate installations. For example, suppose that you have installed CA ERwin Data Modeler using the CA ERwin Data Modeler r9.2.0 installation wizard and you have installed the Navigator Edition using the CA ERwin Model Navigator installation wizard. When you uninstall the Navi gator Edition, the following messages
appear:
Error 1905 Module C:\Program Files(x86)\CA\ERwin Navigator r9\EAL.dll failed to
unregister. HRESULT-2147220472. Contact your support personnel.
Error 1905 Module C:\Program Files(x86)\CA\ERwin Navigator r9\ERXML.dll failed to
unregister. HRESULT-2147220472. Contact your support personnel.
Solution:
Reregister the ERXML.dll and EAL.dll fi les manually in CA ERwin Data Modeler again.
Note: To avoid this problem, install CA ERwin Model Navigator and CA ERwin Data Modeler from the same installation wizard. That is, select the CA ERwin Model
Navigator r9.2.0 component in the CA ERwin Data Modeler r9.2.0 installation wizard.
Post-Installation
Before you can view models in a mart database, you need to connect to the mart database on which the models reside. The connection is made by clicking Mart,
Connection on the File menu. The following must be performed before you can connec t to a mart database:
■ The client connectivity software for your host DBMS must be installed on the client workstation so that you can connect to the DBMS on which the mart database
resides.
■ The mart administrator must give you permission to access the mart database.

Install the SSL Certificate
Chapter 2: Installation 13
Install the SSL Certificate
If you have enabled SSL for the Mart, install the SSL certificate. Install the certificate on the computer from which you plan to us e the Navigator Edition with CA ERwin Data Modeler.
Follow these steps:
1. Open a web browser and go to https://servername:18170:MartAdmin.
The server name is the hostname of the server where the Mart is SSL enabled.
2. Click Certificate Error in the Address bar and then click View Certificate.
3. Click Install Certificate in the Certificate window.
4. Install the certificate under the Trusted Root Certification Authorities certificate store.
You can now connect to an SSL-enabled Mart from the CA ERwin Data Modeler
Navigator Edition.

Chapter 3: Navigating Data Models 15
Chapter 3: Navigating Data Models
This section contains the following topics:
Data Models (see page 15) Basic Data Modeling Concepts (see page 15) Workplace Panes (see page 24)
Open an Existing Model (see page 41) Open a Model Saved in XML Format (XML Import) (see page 41) Connect to Mart (see page 42)
Open a Model or Submodel from the Mart (see page 43) Customizing the Appearance of Data Models (see page 45) Print a Data Model (see page 52)
Data Models
The CA ERwin Data Modeler Navigator Edition contains the tools you need to open,
view, manipulate, print, and report on CA ERwin Data Modeler (CA ERwin DM) data models.
Although the Toolbox and other features are enabled, you cannot save the changes you
make to a data model. This product only maintains the changes that you make to a data model until you close the model. If you need to save your changes, you can upgrade to the full-feature edition.
Basic Data Modeling Concepts
Before creating or working with data models, there are some basic data modeling
concepts that you must be familiar with. These concepts include:
■ Model Types
■ Entities
■ Tables
■ Attributes and Columns
■ Primary Key
■ Relationships
■ Foreign Key
Basic Data Modeling Concepts
16 User Guide
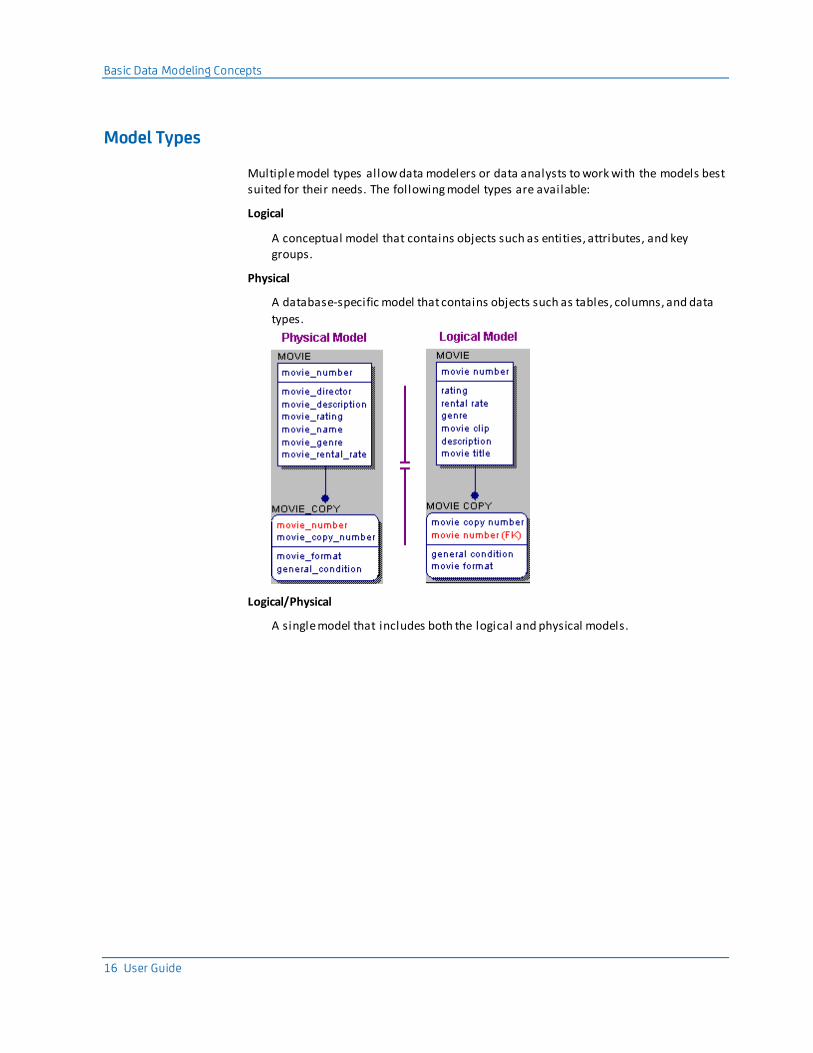
Model Types
Multiple model types allow data modelers or data analysts to work with the models best suited for their needs. The following model types are available:
Logical
A conceptual model that contains objects such as entities, attributes, and key groups.
Physical
A database-specific model that contains objects such as tables, columns, and data
types.
Logical/Physical
A single model that includes both the logical and physical models.
Basic Data Modeling Concepts
Chapter 3: Navigating Data Models 17
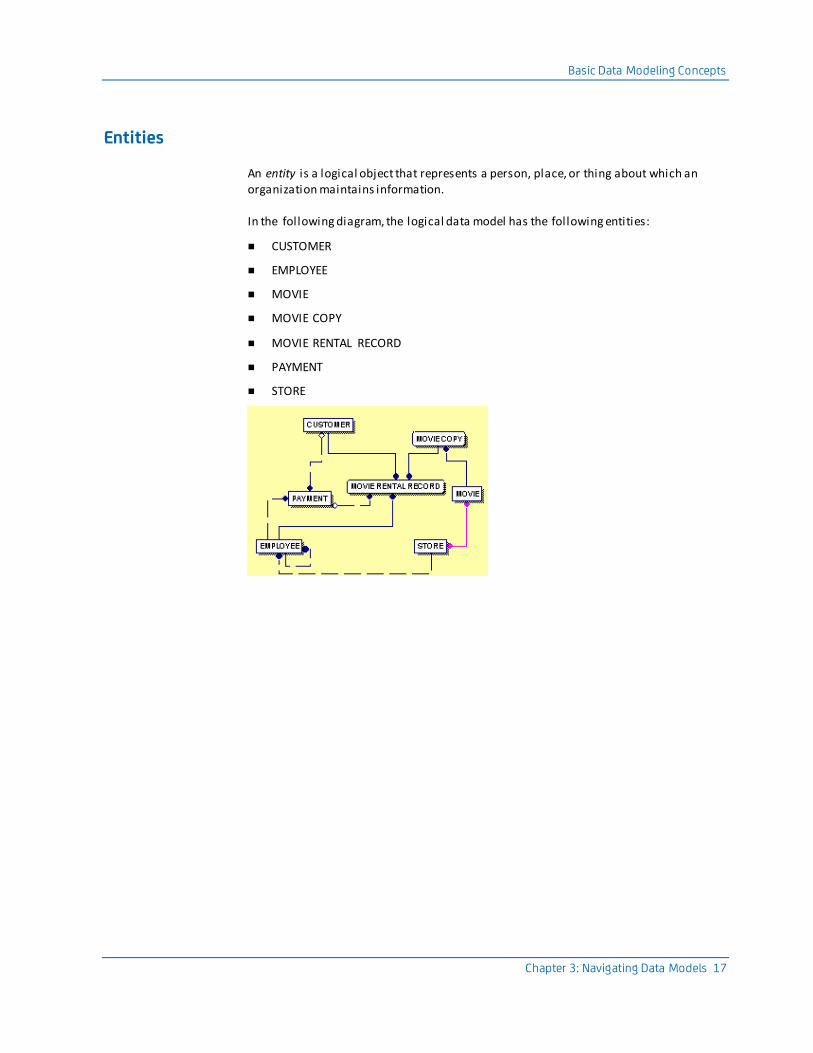
Entities
An entity is a logical object that represents a person, place, or thing about which an organization maintains information.
In the following diagram, the logical data model has the following entities:
■ CUSTOMER
■ EMPLOYEE
■ MOVIE
■ MOVIE COPY
■ MOVIE RENTAL RECORD
■ PAYMENT
■ STORE
Basic Data Modeling Concepts
18 User Guide
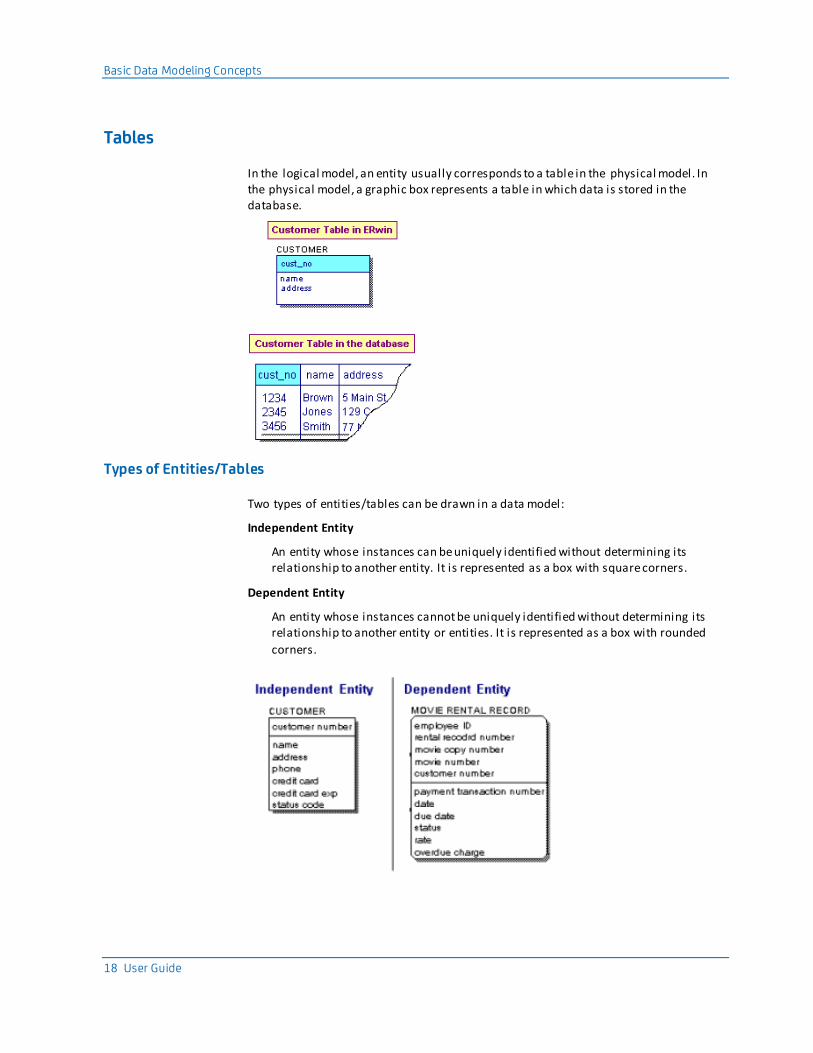
Tables
In the logical model, an entity usually corresponds to a table in the physical model. In the physical model, a graphic box represents a table in which data is stored in the database.
Types of Entities/Tables
Two types of entities/tables can be drawn in a data model:
Independent Entity
An entity whose instances can be uniquely identified without determining its relationship to another entity. It is represented as a box with square corners.
Dependent Entity
An entity whose instances cannot be uniquely identified without determining its relationship to another entity or entities. It is represented as a box with rounded
corners.
Basic Data Modeling Concepts
Chapter 3: Navigating Data Models 19
When you add an entity, the entity type is determined based on the relationship in which it is involved. For example, when you initially place an entity in a model, it is
represented as an independent entity. When you connect the entity to another entity using a relationship, it is determined if the entity is independent or dependent based on the relationship type.
Attributes and Columns
After you have discovered the people, places, and events that define the entities in your model, you can begin to define the attributes for each entity.
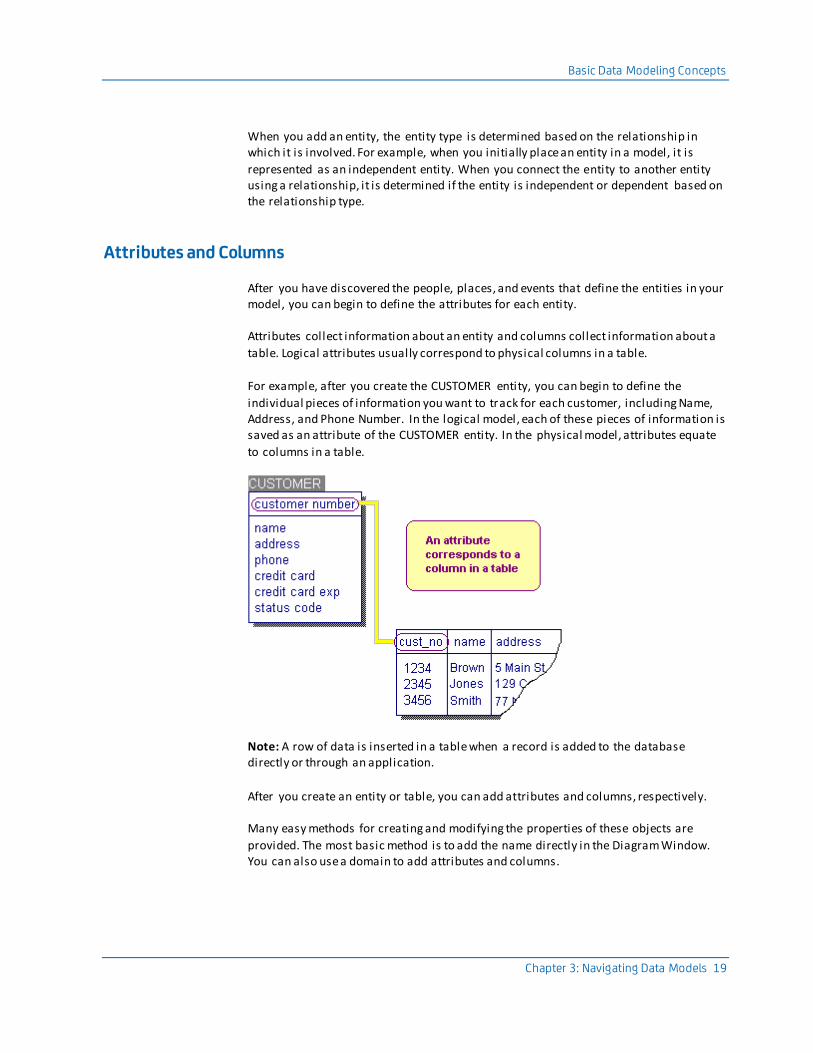
Attributes collect information about an entity and columns collect information about a
table. Logical attributes usually correspond to physical columns in a table.
For example, after you create the CUSTOMER entity, you can begin to define the
individual pieces of information you want to track for each customer, including Name, Address, and Phone Number. In the logical model, each of these pieces of information is saved as an attribute of the CUSTOMER entity. In the physical model, attributes equate
to columns in a table.
Note: A row of data is inserted in a table when a record is added to the database directly or through an application.
After you create an entity or table, you can add attributes and columns, respectively.
Many easy methods for creating and modifying the properties of these objects are
provided. The most basic method is to add the name directly in the Diagram Window. You can also use a domain to add attributes and columns.
Basic Data Modeling Concepts
20 User Guide
Primary Key and Non-Keys
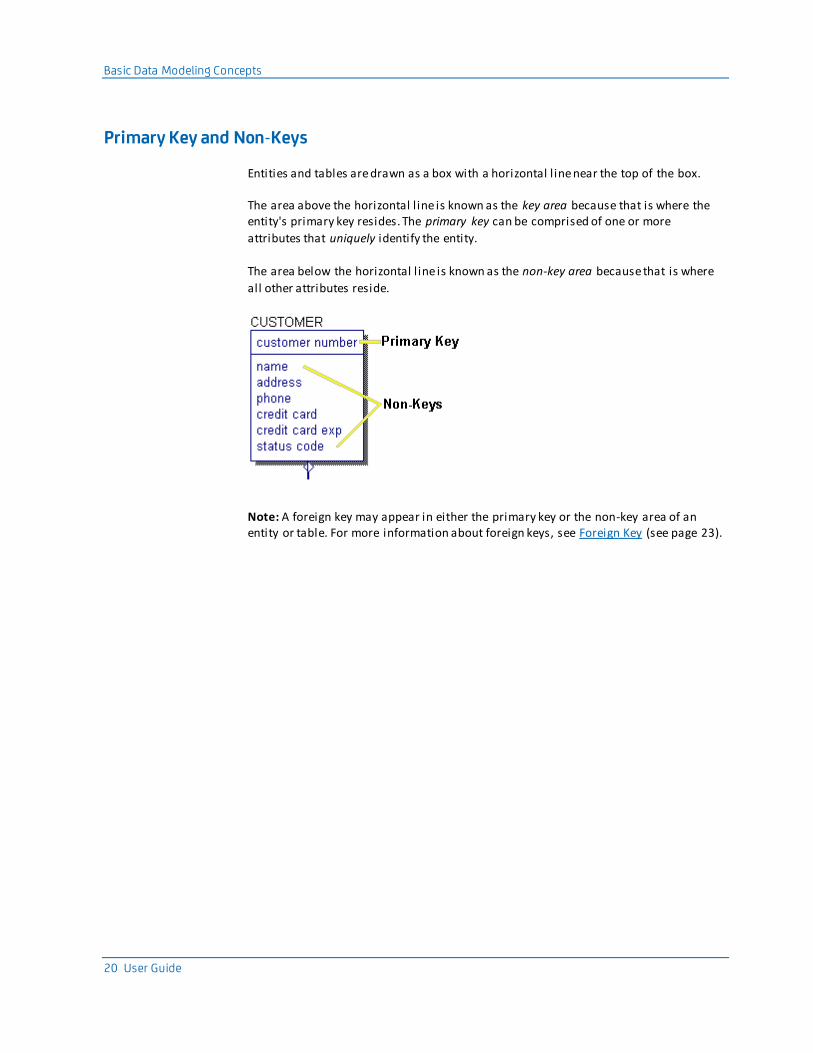
Entities and tables are drawn as a box with a horizontal l ine near the top of the box.
The area above the horizontal l ine is known as the key area because that is where the entity's primary key resides. The primary key can be comprised of one or more
attributes that uniquely identify the entity.
The area below the horizontal l ine is known as the non-key area because that is where
all other attributes reside.
Note: A foreign key may appear in either the primary key or the non-key area of an entity or table. For more information about foreign keys, see Foreign Key (see page 23).
Basic Data Modeling Concepts
Chapter 3: Navigating Data Models 21
Relationships
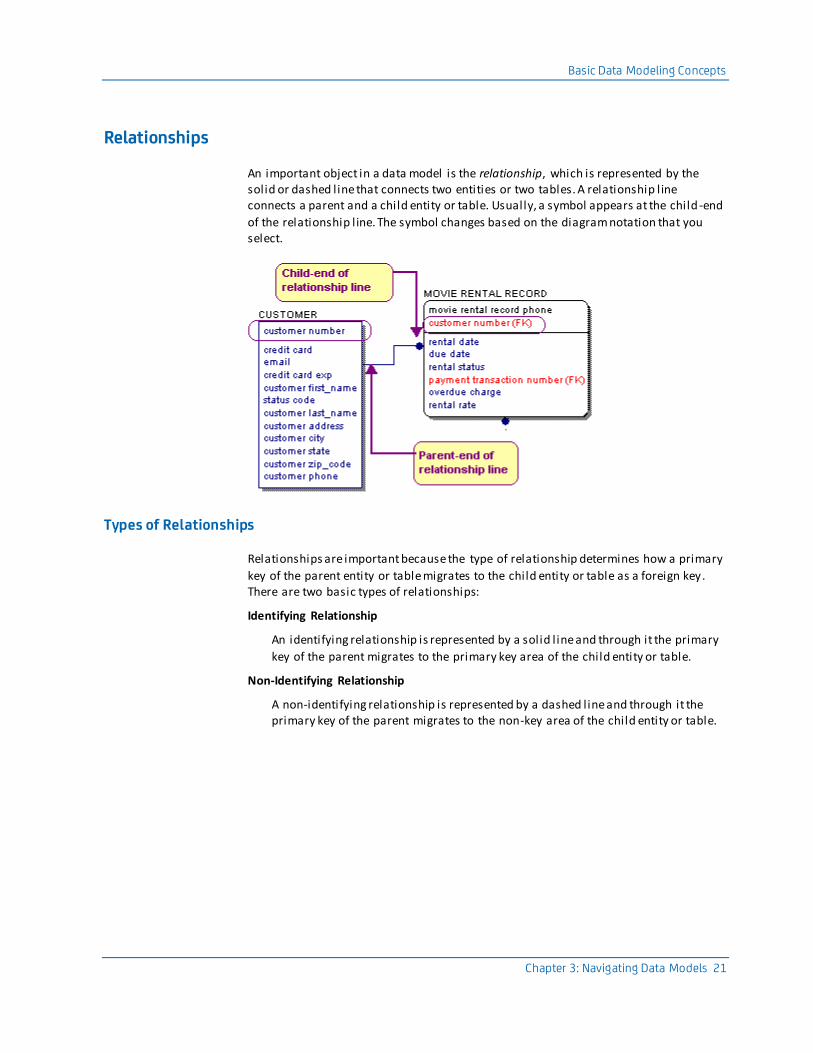
An important object in a data model is the relationship, which is represented by the solid or dashed line that connects two entities or two tables. A relationship l ine connects a parent and a child entity or table. Usually, a symbol appears at the child -end
of the relationship l ine. The symbol changes based on the diagram notation that you select.
Types of Relationships
Relationships are important because the type of relationship determines how a primary
key of the parent entity or table migrates to the child entity or table as a foreign key. There are two basic types of relationships:
Identifying Relationship
An identifying relationship is represented by a solid l ine and through it the primary
key of the parent migrates to the primary key area of the child entity or table.
Non-Identifying Relationship
A non-identifying relationship is represented by a dashed line and through it the primary key of the parent migrates to the non-key area of the child entity or table.
Basic Data Modeling Concepts
22 User Guide
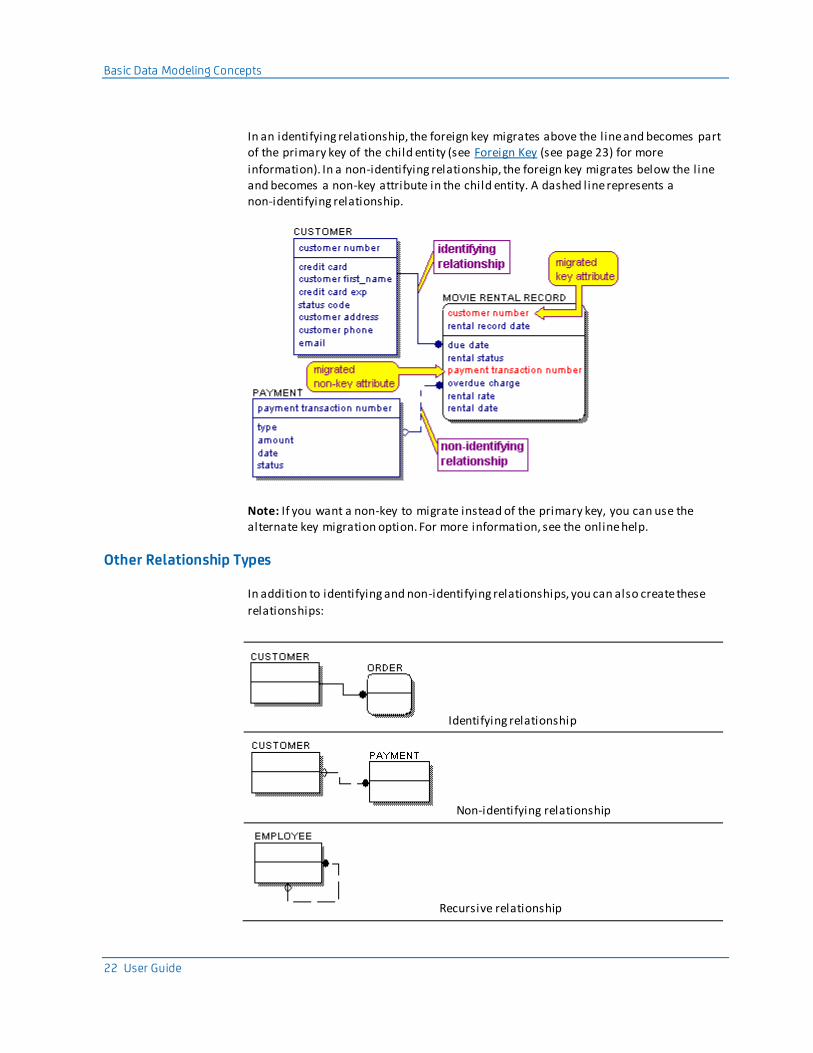
In an identifying relationship, the foreign key migrates above the line and becomes part of the primary key of the child entity (see Foreign Key (see page 23) for more
information). In a non-identifying relationship, the foreign key migrates below the line and becomes a non-key attribute in the child entity. A dashed line represents a non-identifying relationship.
Note: If you want a non-key to migrate instead of the primary key, you can use the alternate key migration option. For more information, see the online help.
Other Relationship Types
In addition to identifying and non-identifying relationships, you can also create these
relationships:
Identifying relationship
Non-identifying relationship
Recursive relationship
Basic Data Modeling Concepts
Chapter 3: Navigating Data Models 23
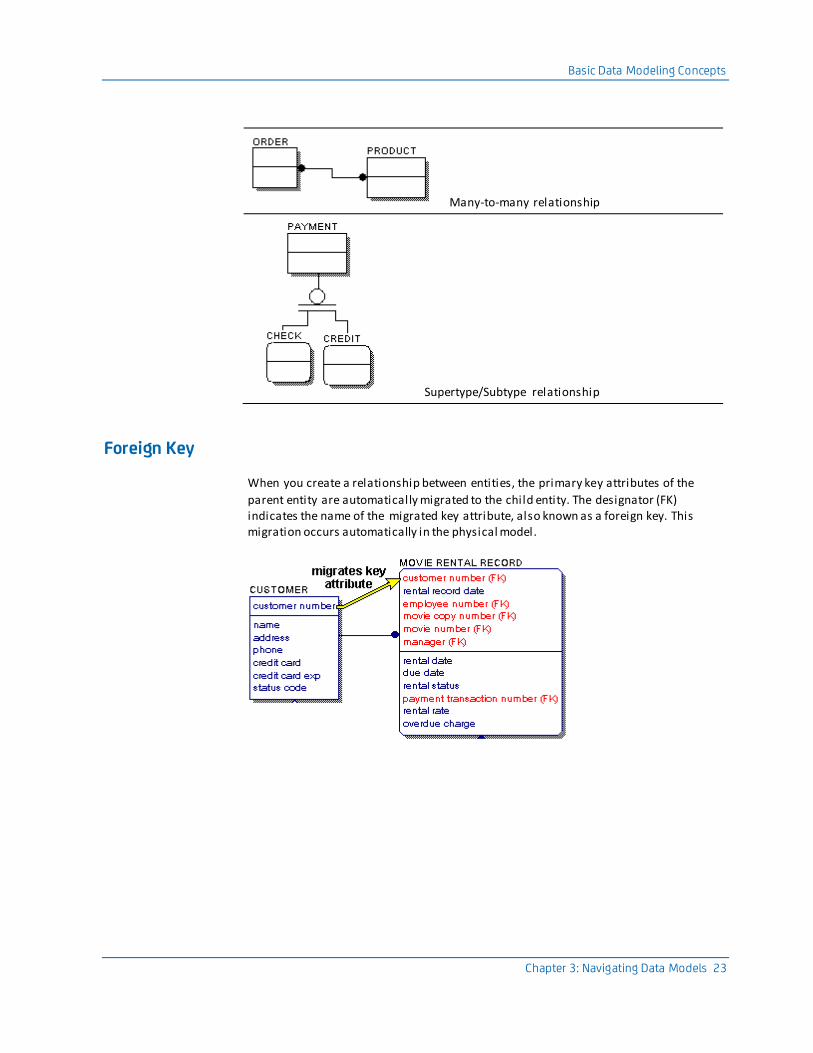
Many-to-many relationship
Supertype/Subtype relationship
Foreign Key
When you create a relationship between entities, the primary key attributes of the
parent entity are automatically migrated to the child entity. The designator (FK) indicates the name of the migrated key attribute, also known as a foreign key. This migration occurs automatically in the physical model.
Workplace Panes
24 User Guide
If the foreign key attribute has the same name as an owned attribute in the child entity, the two instances are automatically unified into one attribute because it assumes that
they are the same attribute. The process of combining or unifying identical attributes in an entity is called unification.
Note: The foreign keys display in the model by default, designated by (FK). If you do not
see this designation, open the Diagram Editor (click Diagrams in the Diagram menu), and do the following depending on whether you are working in a logical or physical model:
Logical model
Click the Entity tab, and ensure the options Display Logical Foreign Key (FK) Designator
and Display Migrated Attributes are selected.
Physical model
Click the Table tab, and ensure the option Display Physical Foreign Key (FK) Designator is selected.
Workplace Panes
Each of the following panes within the workplace is dockable and floatable, and where applicable, contains its own toolbar:
■ Explorer Pane (Model Explorer)
■ Action Log Pane
■ Advisories Pane
■ Overview Pane
■ Bulk Editor Pane
Workplace Panes
Chapter 3: Navigating Data Models 25
Each pane provides two options for how it displays:
Auto Hide
Activates auto hide. The pane becomes a tab in the application. When auto hide is activated, the pane is not visible in the workplace unless you hover your mouse over the tab of the hidden pane. When you do this, the pane is temporarily restored
to allow you to work in the pane. When your mouse leaves the pane, it becomes auto-hidden once again. To turn off auto hide, mouse over the tab to restore the pane, and then click the pushpin .
Close
Closes the pane. To open the pane again, select the appropriate pane on the View, Windows menu.
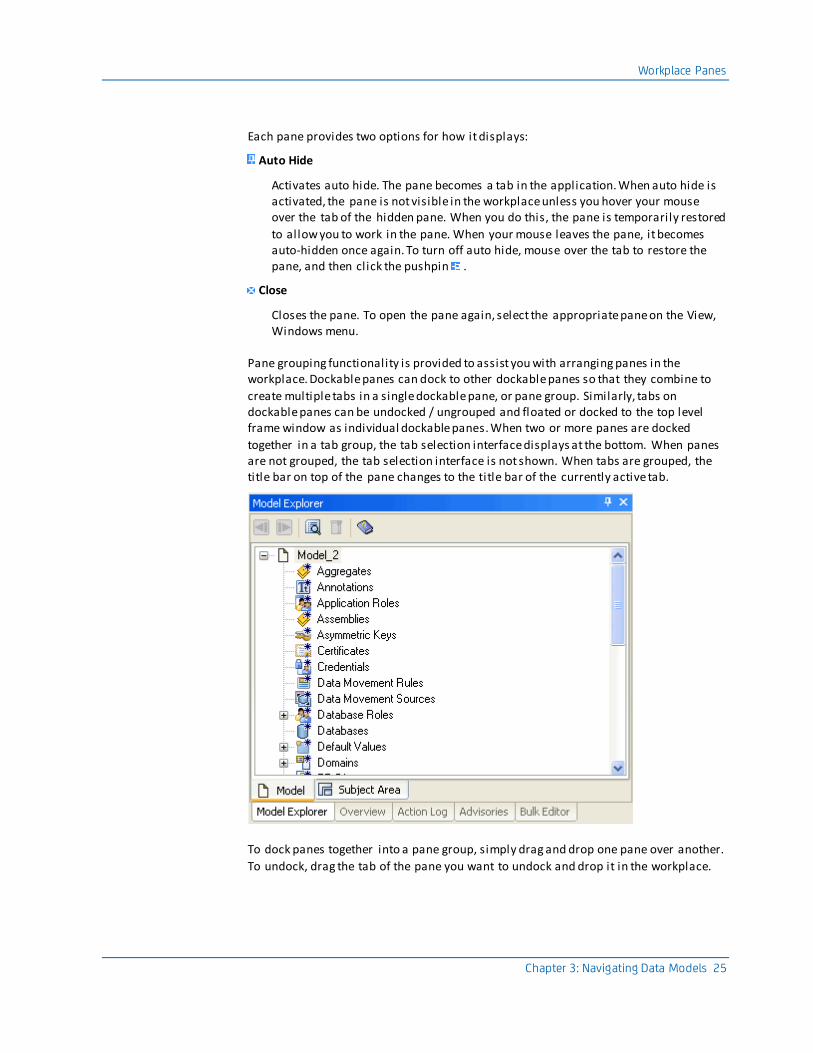
Pane grouping functionality is provided to assist you with arranging panes in the workplace. Dockable panes can dock to other dockable panes so that they combine to
create multiple tabs in a single dockable pane, or pane group. Similarly, tabs on dockable panes can be undocked / ungrouped and floated or docked to the top level frame window as individual dockable panes. When two or more panes are docked
together in a tab group, the tab selection interface displays at the bottom. When panes are not grouped, the tab selection interface is not shown. When tabs are grouped, the title bar on top of the pane changes to the title bar of the currently active tab.
To dock panes together into a pane group, simply drag and drop one pane over another.
To undock, drag the tab of the pane you want to undock and drop it in the workplace.
Workplace Panes
26 User Guide
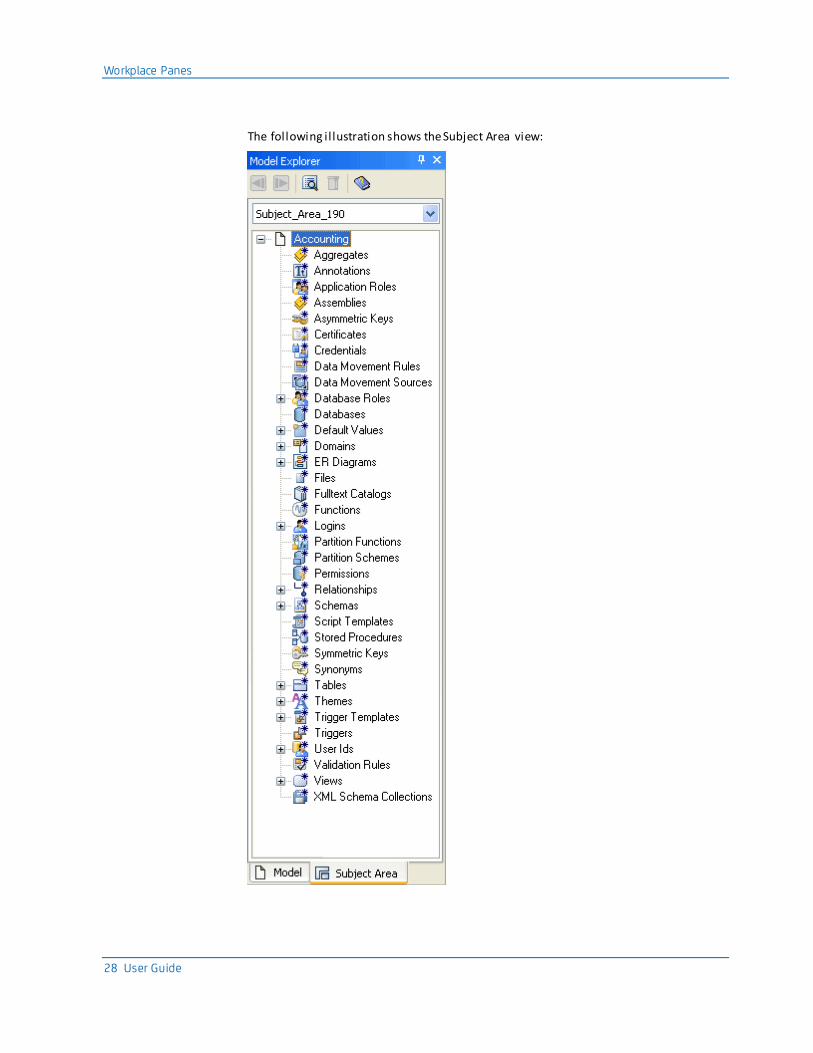
Overview of Model Explorer
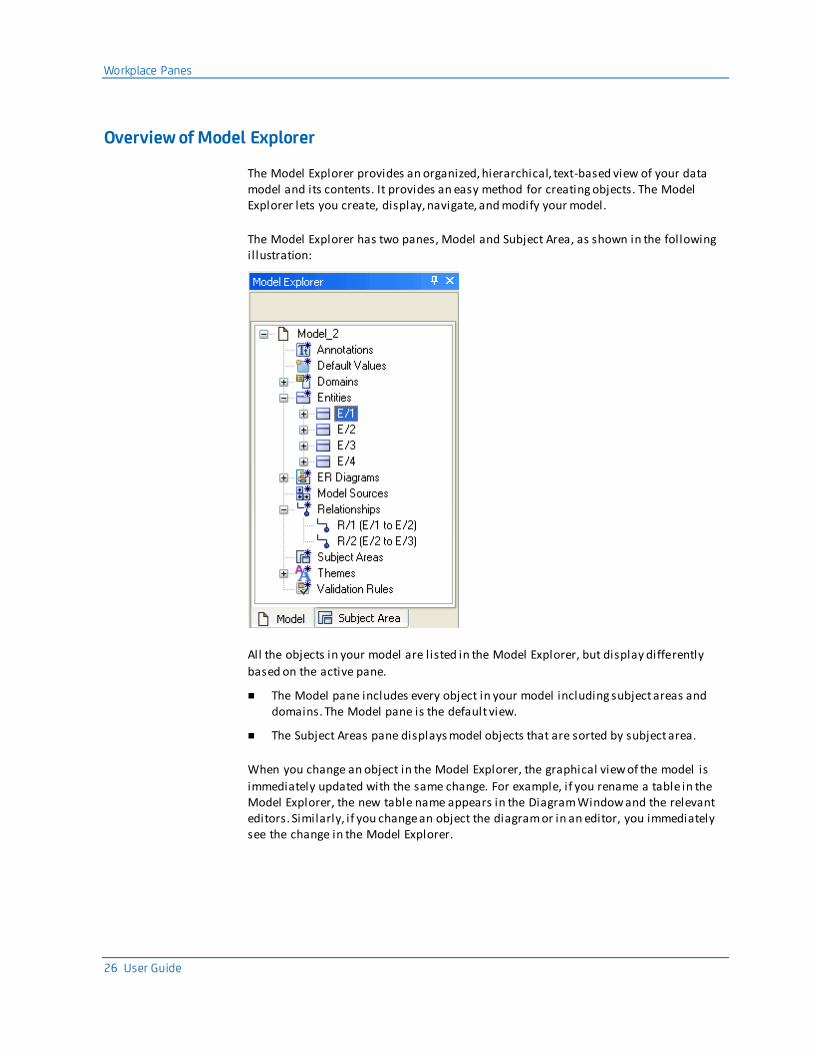
The Model Explorer provides an organized, hierarchical, text-based view of your data model and its contents. It provides an easy method for creating objects. The Model Explorer lets you create, display, navigate, and modify your model.
The Model Explorer has two panes, Model and Subject Area, as shown in the following il lustration:
All the objects in your model are l isted in the Model Explorer, but display differently
based on the active pane.
■ The Model pane includes every object in your model including subject areas and domains. The Model pane is the default view.
■ The Subject Areas pane displays model objects that are sorted by subject area.
When you change an object in the Model Explorer, the graphical view of the model is
immediately updated with the same change. For example, if you rename a table in the Model Explorer, the new table name appears in the Diagram Window and the relevant editors. Similarly, if you change an object the diagram or in an editor, you immediately see the change in the Model Explorer.
Workplace Panes
Chapter 3: Navigating Data Models 27
Just as you can create an entity, a table, or a relationship using the Toolbox, you can create an object in the Model Explorer. To create an object, right-click on any object and
click New. You can drag some objects from the Model Explorer onto the Diagram Window to create an object. For example, you can drag a domain onto an attribute or a column.
Using the Model Explorer, you can open the property editor for an object in two ways:
■ Right-click the object and click Properties.
■ Select the object and click the Property Editor icon in the Model Explorer toolbar.
Note: For bulk editing of object properties, you can use the Bulk Editor.
The Model Explorer and the data model are always in sync, regardless of the method
you choose to add or edit an object.
You can also move, copy, and delete most objects in the Model Explorer, same as you
do in a Diagram window.
After you move, copy, or delete an object, all the instances in the model that reference the object are automatically updated.
Model View
The primary purpose of the Model view is model exploration and to function as an alternative launching point for object and property editors. The Model view lists all the object types that appear in the current data model. The object types that are displayed
here are based on the model type and the target server.
For example, if the model type is Logical, the Model Explorer does not include physical objects such as a view. Similarly, if the model type is Physical, the Model Explorer does not include logical objects. If the target server is Oracle, then objects specific to Oracle such as Clusters are displayed.
The following types of objects are not displayed in the Model Explorer:
■ Minor objects that are included in the parent object editor. For example, a Valid Value object is created, deleted, and edited by the Validation Rule Editor.
■ An object that represents configuration information, created for an internal process, and is not actual model data. For example, as a Complete Compare Option
Set.
Subject Area View
The Subject Area view provides a fi ltered view of the model and minimizes unnecessary tree information. This view displays the model objects that are sorted by Subject Area.
You can create Subject Areas to divide the model into smaller manageable parts, which is helpful when you work with large models.
Workplace Panes
28 User Guide
The following il lustration shows the Subject Area view:
Workplace Panes
Chapter 3: Navigating Data Models 29
Select a Subject Area to view the objects that are included in it. For example, in the previous i l lustration you see that the tables are categorized as tables, and views are
categorized as views. This view is different from the display of the Subject Area objects in the Model view. Only those relationships are included here that are visible on the diagram and have both the endpoints present in the Subject Area.
Note: The global objects that do not relate to the selected Subject Area, such as Subject Area objects or model source objects are not displayed.
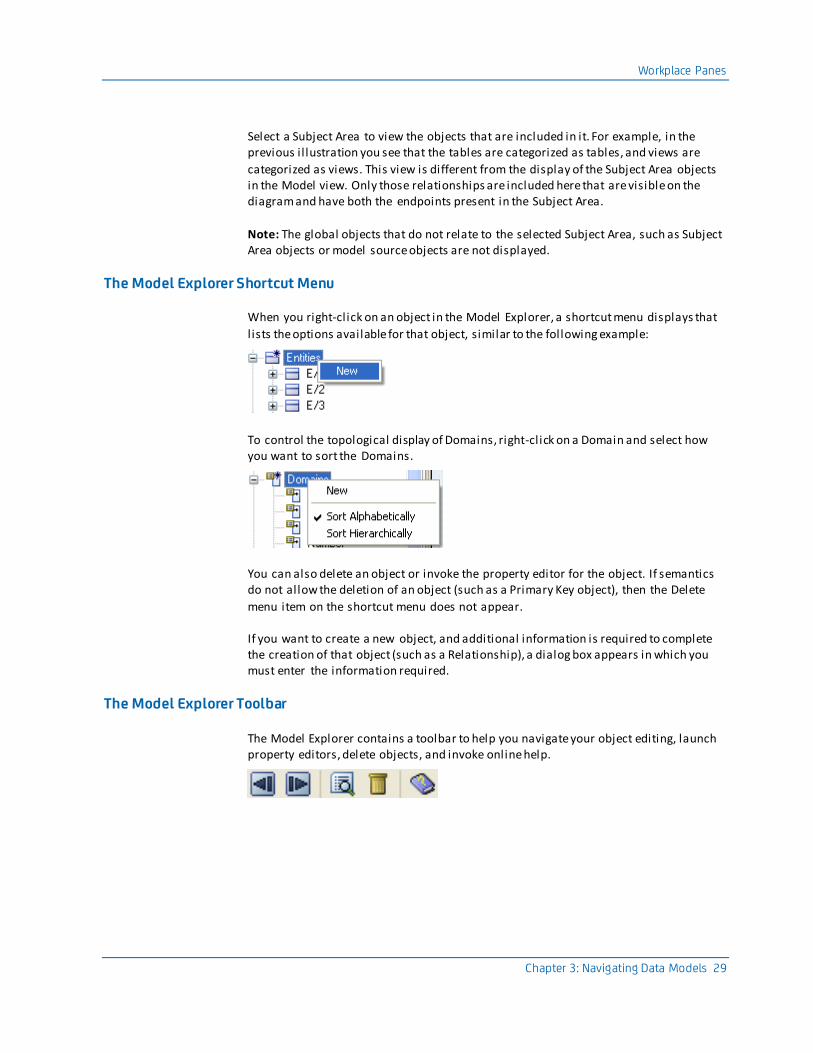
The Model Explorer Shortcut Menu
When you right-click on an object in the Model Explorer, a shortcut menu displays that
l ists the options available for that object, similar to the following example:
To control the topological display of Domains, right-click on a Domain and select how you want to sort the Domains.
You can also delete an object or invoke the property editor for the object. If semantics do not allow the deletion of an object (such as a Primary Key object), then the Delete
menu item on the shortcut menu does not appear.
If you want to create a new object, and additional information is required to complete the creation of that object (such as a Relationship), a dialog box appears in which you must enter the information required.
The Model Explorer Toolbar
The Model Explorer contains a toolbar to help you navigate your object editing, launch property editors, delete objects, and invoke online help.
Workplace Panes
30 User Guide
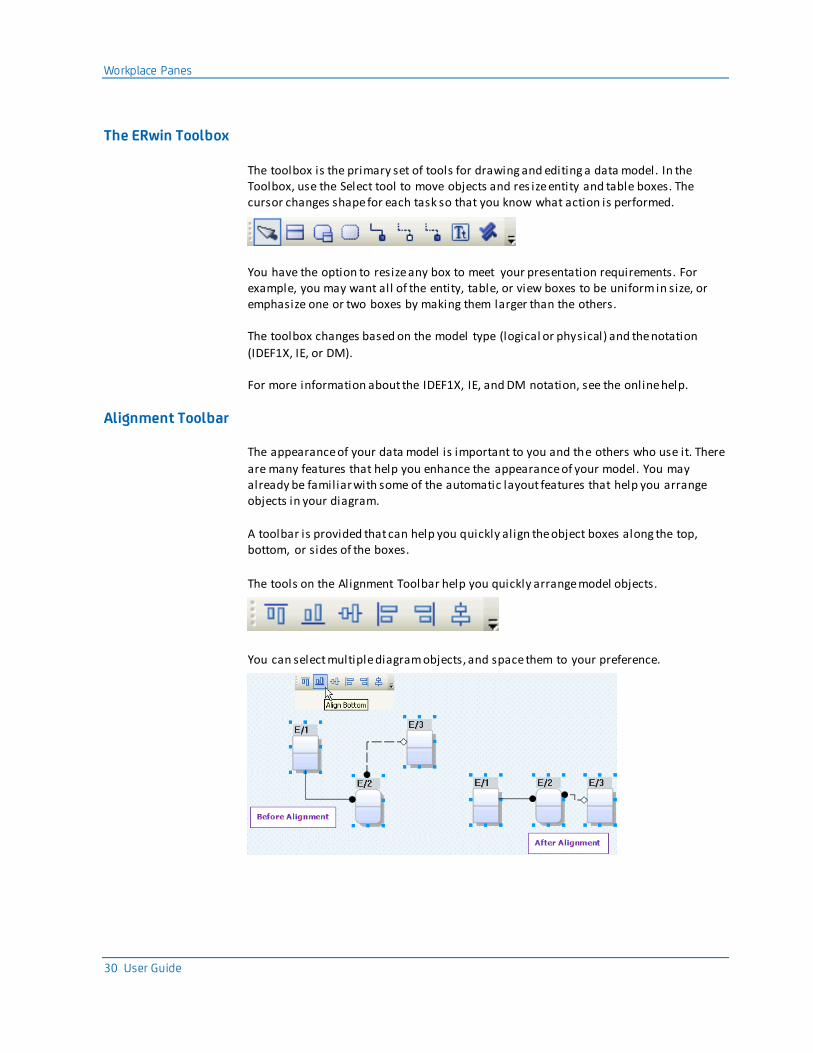
The ERwin Toolbox
The toolbox is the primary set of tools for drawing and editing a data model. In the Toolbox, use the Select tool to move objects and res ize entity and table boxes. The cursor changes shape for each task so that you know what action is performed.
You have the option to resize any box to meet your presentation requirements. For example, you may want all of the entity, table, or view boxes to be uniform in size, or emphasize one or two boxes by making them larger than the others.
The toolbox changes based on the model type (logical or physical) and the notation
(IDEF1X, IE, or DM).
For more information about the IDEF1X, IE, and DM notation, see the online help.
Alignment Toolbar
The appearance of your data model is important to you and the others who use it. There
are many features that help you enhance the appearance of your model. You may already be familiar with some of the automatic layout features that help you arrange objects in your diagram.
A toolbar is provided that can help you quickly align the object boxes along the top, bottom, or sides of the boxes.
The tools on the Alignment Toolbar help you quickly arrange model objects.
You can select multiple diagram objects, and space them to your preference.
Workplace Panes
Chapter 3: Navigating Data Models 31
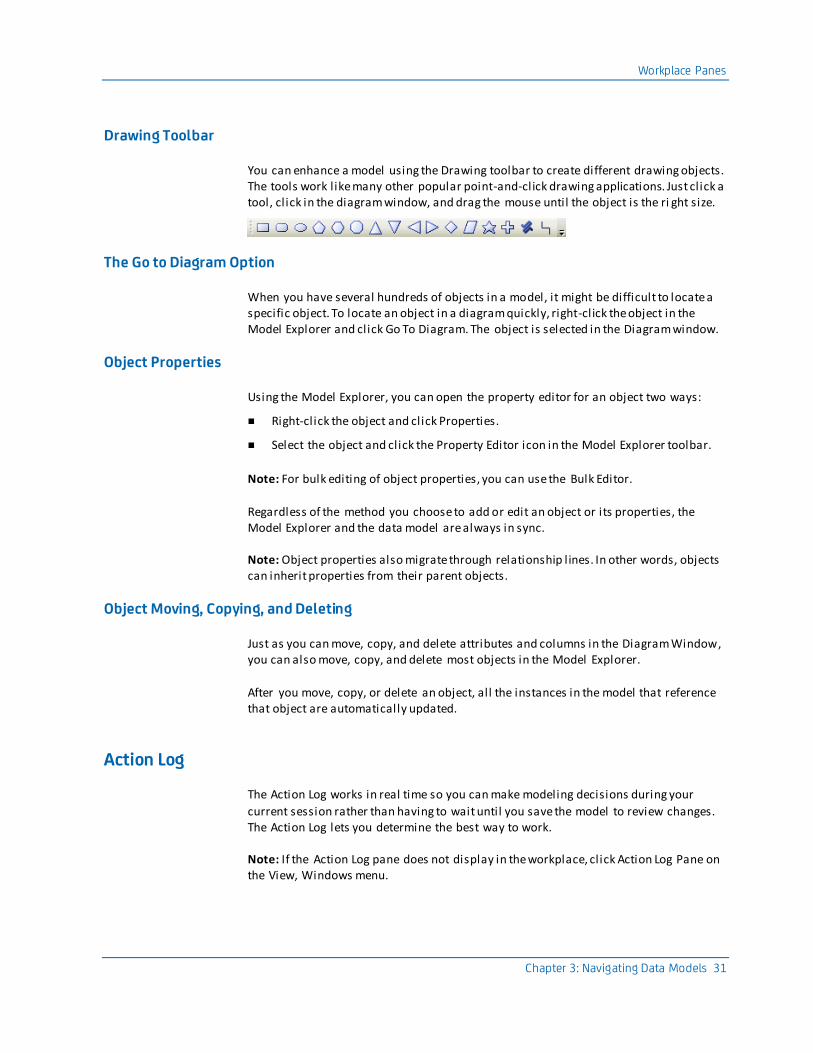
Drawing Toolbar
You can enhance a model using the Drawing toolbar to create different drawing objects. The tools work l ike many other popular point-and-click drawing applications. Just click a tool, click in the diagram window, and drag the mouse until the object is the ri ght size.
The Go to Diagram Option
When you have several hundreds of objects in a model, it might be difficult to locate a specific object. To locate an object in a diagram quickly, right-click the object in the Model Explorer and click Go To Diagram. The object is selected in the Diagram window.
Object Properties
Using the Model Explorer, you can open the property editor for an object two ways:
■ Right-click the object and click Properties.
■ Select the object and click the Property Editor icon in the Model Explorer toolbar.
Note: For bulk editing of object properties, you can use the Bulk Editor.
Regardless of the method you choose to add or edit an object or its properties, the Model Explorer and the data model are always in sync.
Note: Object properties also migrate through relationship l ines. In other words, objects can inherit properties from their parent objects.
Object Moving, Copying, and Deleting
Just as you can move, copy, and delete attributes and columns in the Diagram Window, you can also move, copy, and delete most objects in the Model Explorer.
After you move, copy, or delete an object, all the instances in the model that reference that object are automatically updated.
Action Log
The Action Log works in real time so you can make modeling decisions during your
current session rather than having to wait until you save the model to review changes. The Action Log lets you determine the best way to work.
Note: If the Action Log pane does not display in the workplace, click Action Log Pane on the View, Windows menu.

Workplace Panes
32 User Guide
As you work on the graphical view of a model in the Diagram Window, you can view the transaction information in the Action Log. As you make changes to your model, the
Action Log is updated in real time. For example, if you create an entity in your model, the Action Log reflects this change.
Changes are only viewable in the Action Log during your current modeling session. Each
new session begins with an empty Action Log. When you close the model, the Action Log clears. Before closing your model, you can generate a report that lets you view all the changes made during the current session.
The type of objects that appear in the Action Log is based on the display mode you are using. If you are working with a logical model, then only logical objects appear. If you
are working with a physical model, then only physical objects appear.
The Action Log lets you search for every transaction and fi lter by type of change so that you can easily find a specific transaction or a set of transactions. This feature is particularly helpful when working with large models.
Action Log Panes
The Action Log has two panes, Details and Summary, with corresponding tabs. Selec t the Details tab to see every change (transaction) made to a model, or select the Summary tab to see the net result of changes made to a model.
Note: A transaction is a single unit of work that is not divisible into smaller components. The Action Log lets you navigate through the transaction tree using the Details pane or the Summary pane.
Details Pane
The Details pane shows all the changes you make to a model during the current session. The Details pane is the default view when you launch the program. Changes appear in the Details pane with the most recent transaction at the top of the tree, and the first
transaction at the bottom of the tree. You can either expand or collapse each transaction.
Workplace Panes
Chapter 3: Navigating Data Models 33
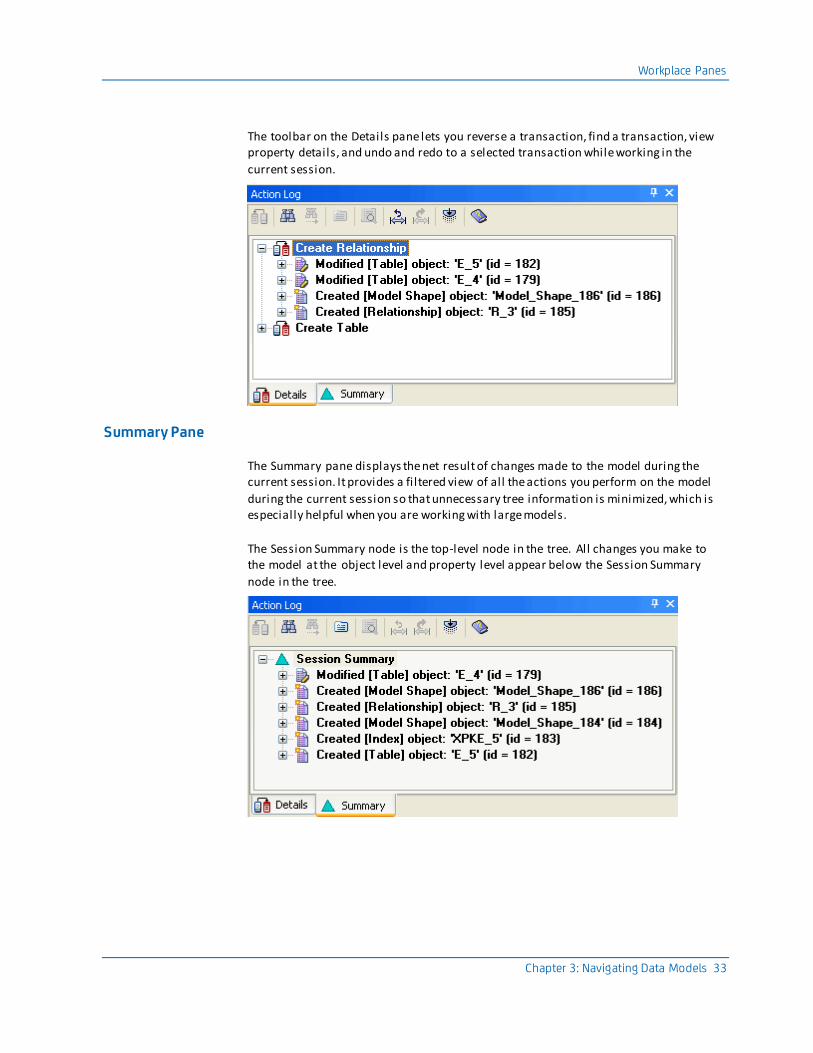
The toolbar on the Details pane lets you reverse a transaction, find a transaction, view property details, and undo and redo to a selected transaction while working in the
current session.
Summary Pane
The Summary pane displays the net result of changes made to the model during the current session. It provides a fi ltered view of all the actions you perform on the model
during the current session so that unnecessary tree information is minimized, which is especially helpful when you are working with large models.
The Session Summary node is the top-level node in the tree. All changes you make to the model at the object level and property level appear below the Session Summary
node in the tree.
Workplace Panes
34 User Guide
The Summary pane is similar to the Details pane except for the following differences:
■ While the top-level nodes in the Details pane are transactions, the Summary pane
has only one top-level node with changes appearing below it.
■ The Extended Find and Filter feature is only available in the Summary pane.
■ The Reverse, Undo to Selected Transaction, and Redo to Selected Transaction
options are not available in the Summary pane.
Action Log Shortcut Menu
When you right-click an object in the Details pane the Action Log shortcut menu opens. This shortcut menu lists the options available based on the actions you performed prior
to opening the shortcut menu. These options include:
■ Undo to this point (or Redo to this point)
■ Reverse
■ Collapse (or Expand)
■ Expand Transaction
■ Collapse Transaction
Note: A shortcut menu is not available on the Summary pane.
Action Log Tasks
In addition to viewing the detail and summary transactions, the Action Log provides a range of useful features that help you easily perform the following actions:
■ Locate text within a transaction, object, or property using the Fi nd feature.
■ Use the Extended Find and Filter feature to locate, fi lter, and report on the results of your search. This feature is available only in the Summary pane.
■ View old and new details relating to a property transaction using the Property Details feature.
■ Reverse a transaction. This feature is available only in the Details pane.
■ Undo a group of sequential transactions. This feature is available only in the Details pane.
■ Redo a group of sequential transactions. This feature is available only in the Details pane.
Workplace Panes
Chapter 3: Navigating Data Models 35
Locate Text Using the Find Feature
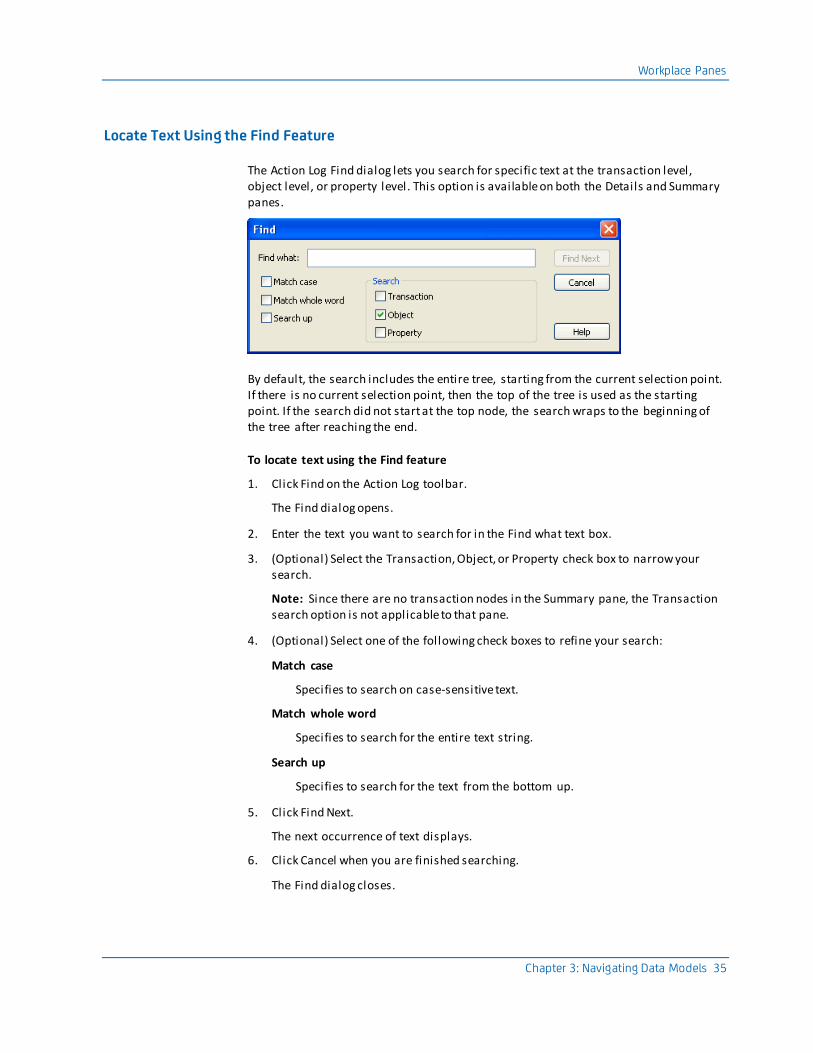
The Action Log Find dialog lets you search for specific text at the transaction level, object level, or property level. This option is available on both the Details and Summary panes.
By default, the search includes the entire tree, starting from the current selection point. If there is no current selection point, then the top of the tree is used as the starting point. If the search did not start at the top node, the search wraps to the beginning of the tree after reaching the end.
To locate text using the Find feature
1. Click Find on the Action Log toolbar.
The Find dialog opens.
2. Enter the text you want to search for in the Find what text box.
3. (Optional) Select the Transaction, Object, or Property check box to narrow your search.
Note: Since there are no transaction nodes in the Summary pane, the Transaction search option is not applicable to that pane.
4. (Optional) Select one of the following check boxes to refine your search:
Match case
Specifies to search on case-sensitive text.
Match whole word
Specifies to search for the entire text string.
Search up
Specifies to search for the text from the bottom up.
5. Click Find Next.
The next occurrence of text displays.
6. Click Cancel when you are finished searching.
The Find dialog closes.
Workplace Panes
36 User Guide
Use Extended Find and Filter
The Extended Find and Filter feature lets you set find and fi lter criteria and view property changes. This feature is available only on the Summary pane of the Action Log. To open the Extended Find and Filter dialog, click the Extended Find/Filter button on
Action Log toolbar.
When the Extended Find and Filter dialog opens, it provides a snapshot of the Summary
pane and lets you fi lter the information that displays so you can easily find the information you want.
To use the Extended Find and Filter option
1. Click Extended Find and Filter on the Action Log toolbar in the Summary pane.
The Extended Find and Filter dialog opens.
2. Click Find on the toolbar.
The Find Criteria dialog opens.
3. Select the Properties, Categories, and Classes that you want to find. These options
let you fi lter the information that displays.
4. Click Find to start the search.
The Find Criteria dialog closes.
5. Click the Find Next button on the Extended Find and Filter toolbar to find the next occurrence of the search item.
6. Click Close.
The Extended Find and Filter dialog closes.
Undo a Transaction
To undo the last change that you made to your model, use the Undo button on the
Toolbar or click Undo on the Edit menu. This feature undoes one change at a time, and is reflected in the Action Log by a dimmed transaction.
Redo a Transaction
To redo a transaction that you made to your model, use the Redo button on the Toolbar or click Redo on the Edit menu. This feature restores one change at a time.
Reverse a Transaction
The Reverse feature in the Action Log lets you perform an opposite action on most
entries that appear during the current modeling session. When you reverse a transaction, the model reflects the changes made to the Action Log. This feature is only available on the Details pane, and does not sequentially reverse actions.
Workplace Panes
Chapter 3: Navigating Data Models 37
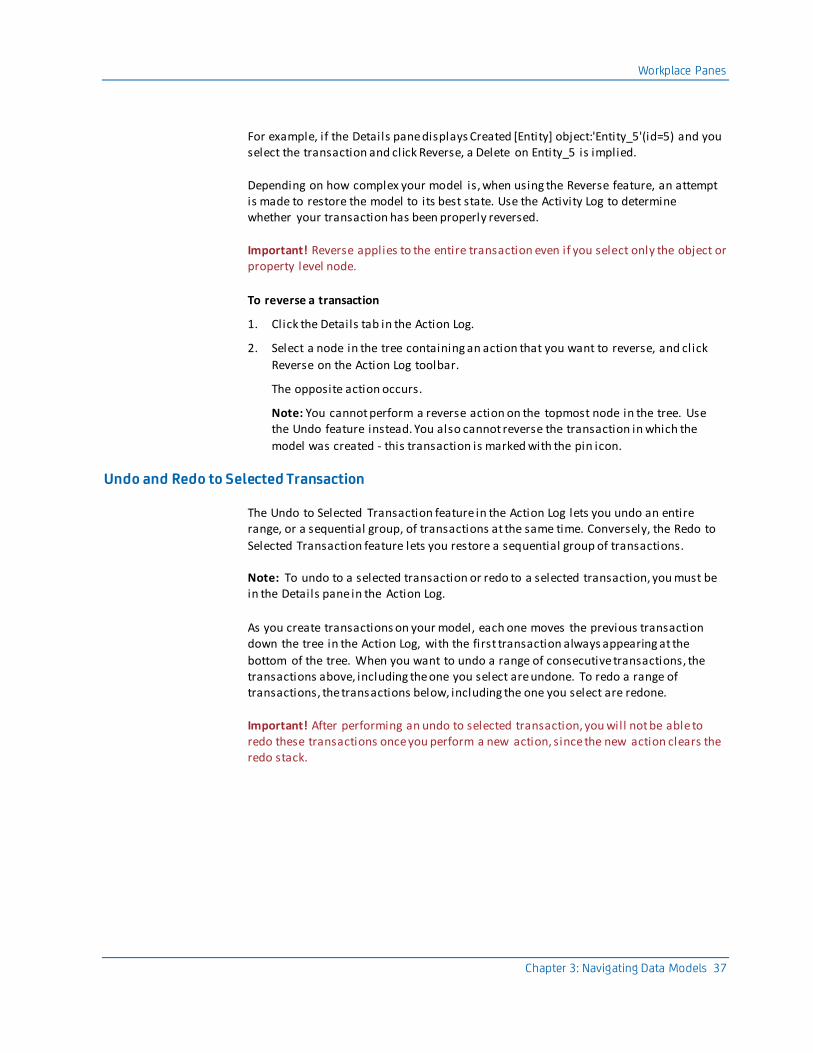
For example, if the Details pane displays Created [Entity] object:'Entity_5'(id=5) and you select the transaction and click Reverse, a Delete on Entity_5 is implied.
Depending on how complex your model is, when using the Reverse feature, an attempt is made to restore the model to its best state. Use the Activity Log to determine whether your transaction has been properly reversed.
Important! Reverse applies to the entire transaction even if you select only the object or property level node.
To reverse a transaction
1. Click the Details tab in the Action Log.
2. Select a node in the tree containing an action that you want to reverse, and click
Reverse on the Action Log toolbar.
The opposite action occurs.
Note: You cannot perform a reverse action on the topmost node in the tree. Use the Undo feature instead. You also cannot reverse the transaction in which the
model was created - this transaction is marked with the pin icon.
Undo and Redo to Selected Transaction
The Undo to Selected Transaction feature in the Action Log lets you undo an entire range, or a sequential group, of transactions at the same time. Conversely, the Redo to
Selected Transaction feature lets you restore a sequential group of transactions.
Note: To undo to a selected transaction or redo to a selected transaction, you must be in the Details pane in the Action Log.
As you create transactions on your model, each one moves the previous transaction down the tree in the Action Log, with the first transaction always appearing at the
bottom of the tree. When you want to undo a range of consecutive transactions, the transactions above, including the one you select are undone. To redo a range of transactions, the transactions below, including the one you select are redone.
Important! After performing an undo to selected transaction, you will not be able to redo these transactions once you perform a new action, since the new action clears the redo stack.
Workplace Panes
38 User Guide
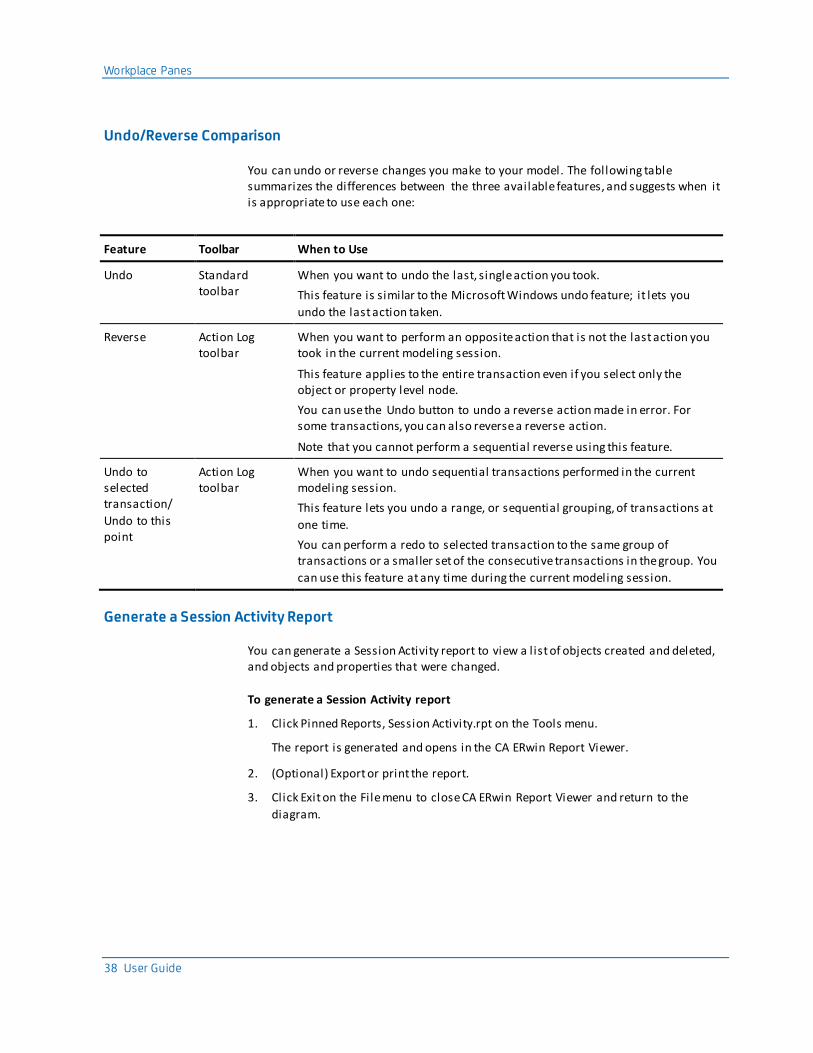
Undo/Reverse Comparison
You can undo or reverse changes you make to your model. The following table summarizes the differences between the three available features, and suggests when it is appropriate to use each one:
Feature Toolbar When to Use
Undo Standard toolbar
When you want to undo the last, single action you took.
This feature is similar to the Microsoft Windows undo feature; it lets you
undo the last action taken.
Reverse Action Log toolbar
When you want to perform an opposite action that is not the last action you took in the current modeling session.
This feature applies to the entire transaction even if you select only the object or property level node.
You can use the Undo button to undo a reverse action made in error. For some transactions, you can also reverse a reverse action.
Note that you cannot perform a sequential reverse using this feature.
Undo to selected transaction/
Undo to this point
Action Log toolbar
When you want to undo sequential transactions performed in the current modeling session.
This feature lets you undo a range, or sequential grouping, of transactions at
one time.
You can perform a redo to selected transaction to the same group of transactions or a smaller set of the consecutive transactions in the group. You
can use this feature at any time during the current modeling session.
Generate a Session Activity Report
You can generate a Session Activity report to view a l ist of objects created and deleted, and objects and properties that were changed.
To generate a Session Activity report
1. Click Pinned Reports, Session Activity.rpt on the Tools menu.
The report is generated and opens in the CA ERwin Report Viewer.
2. (Optional) Export or print the report.
3. Click Exit on the File menu to close CA ERwin Report Viewer and return to the
diagram.
Workplace Panes
Chapter 3: Navigating Data Models 39
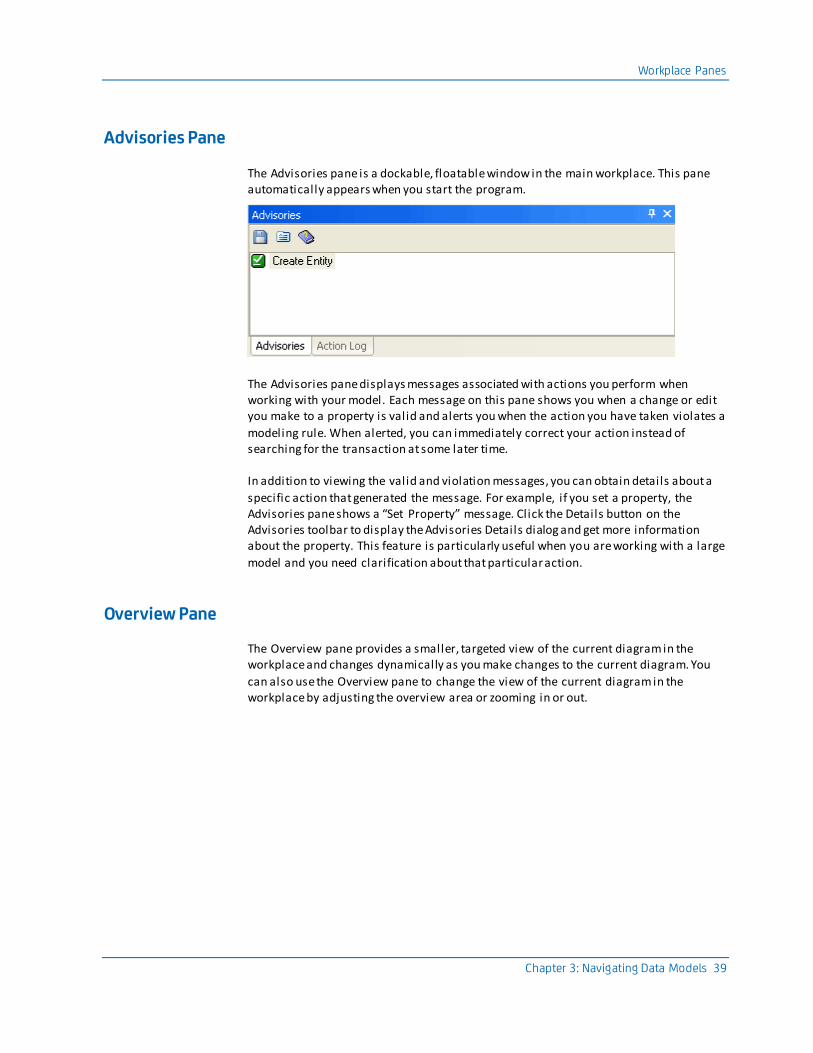
Advisories Pane
The Advisories pane is a dockable, floatable window in the main workplace. This pane automatically appears when you start the program.
The Advisories pane displays messages associated with actions you perform when working with your model. Each message on this pane shows you when a change or edit you make to a property is valid and alerts you when the action you have taken violates a
modeling rule. When alerted, you can immediately correct your action instead of searching for the transaction at some later time.
In addition to viewing the valid and violation messages, you can obtain details about a
specific action that generated the message. For example, if you set a property, the Advisories pane shows a “Set Property” message. Click the Details button on the Advisories toolbar to display the Advisories Details dialog and get more information about the property. This feature is particularly useful when you are working with a large
model and you need clarification about that particular action.
Overview Pane
The Overview pane provides a smaller, targeted view of the current diagram in the workplace and changes dynamically as you make changes to the current diagram. You
can also use the Overview pane to change the view of the current diagram in the workplace by adjusting the overview area or zooming in or out.
Workplace Panes
40 User Guide
Bulk Editor Pane
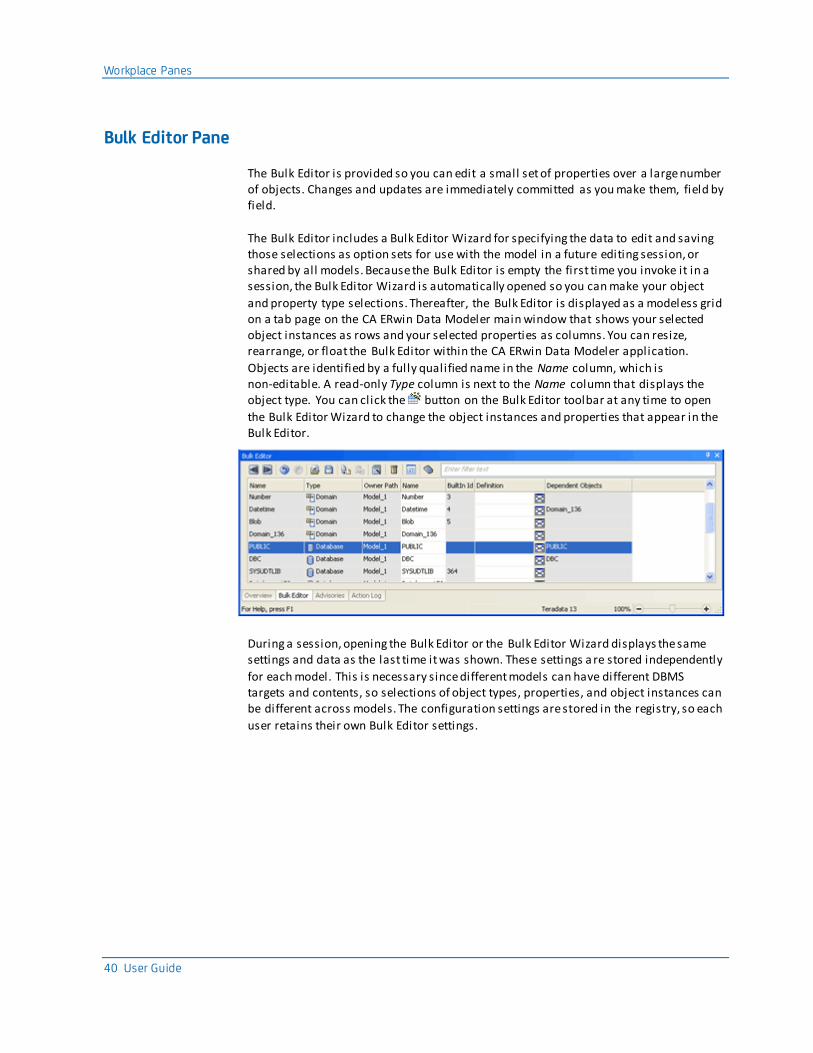
The Bulk Editor is provided so you can edit a small set of properties over a large number of objects. Changes and updates are immediately committed as you make them, field by field.
The Bulk Editor includes a Bulk Editor Wizard for specifying the data to edit and saving those selections as option sets for use with the model in a future editing session, or shared by all models. Because the Bulk Editor is empty the first time you invoke it in a session, the Bulk Editor Wizard is automatically opened so you can make your object
and property type selections. Thereafter, the Bulk Editor is displayed as a modeless grid on a tab page on the CA ERwin Data Modeler main window that shows your selected object instances as rows and your selected properties as columns. You can resize, rearrange, or float the Bulk Editor within the CA ERwin Data Modeler application.
Objects are identified by a fully qualified name in the Name column, which is non-editable. A read-only Type column is next to the Name column that displays the object type. You can click the button on the Bulk Editor toolbar at any time to open
the Bulk Editor Wizard to change the object instances and properties that appear in the Bulk Editor.
During a session, opening the Bulk Editor or the Bulk Editor Wizard displays the same settings and data as the last time it was shown. These settings a re stored independently
for each model. This is necessary since different models can have different DBMS targets and contents, so selections of object types, properties, and object instances can be different across models. The configuration settings are stored in the registry, so each
user retains their own Bulk Editor settings.
Open an Existing Model
Chapter 3: Navigating Data Models 41
Open an Existing Model
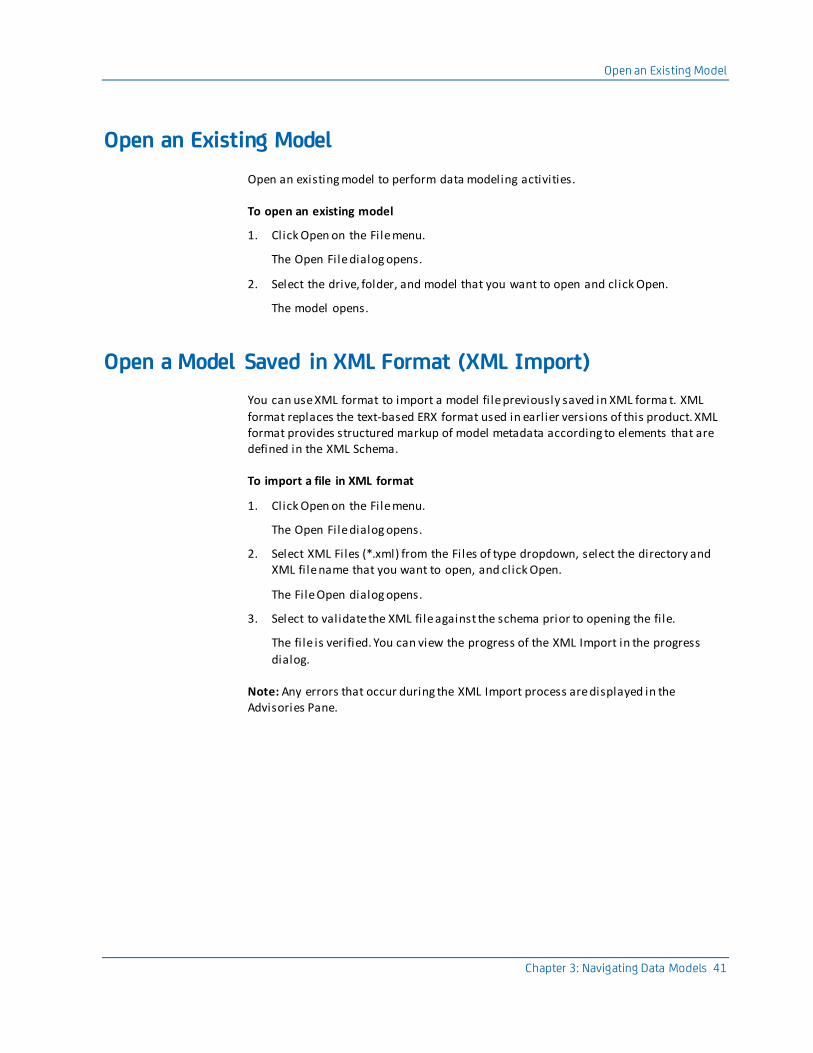
Open an existing model to perform data modeling activities.
To open an existing model
1. Click Open on the File menu.
The Open File dialog opens.
2. Select the drive, folder, and model that you want to open and click Open.
The model opens.
Open a Model Saved in XML Format (XML Import)
You can use XML format to import a model fi le previously saved in XML forma t. XML
format replaces the text-based ERX format used in earlier versions of this product. XML format provides structured markup of model metadata according to elements that are defined in the XML Schema.
To import a file in XML format
1. Click Open on the File menu.
The Open File dialog opens.
2. Select XML Files (*.xml) from the Files of type dropdown, select the directory and XML fi le name that you want to open, and click Open.
The File Open dialog opens.
3. Select to validate the XML fi le against the schema prior to opening the fi le.
The fi le is verified. You can view the progress of the XML Import in the progress
dialog.
Note: Any errors that occur during the XML Import process are displayed in the Advisories Pane.
Connect to Mart
42 User Guide
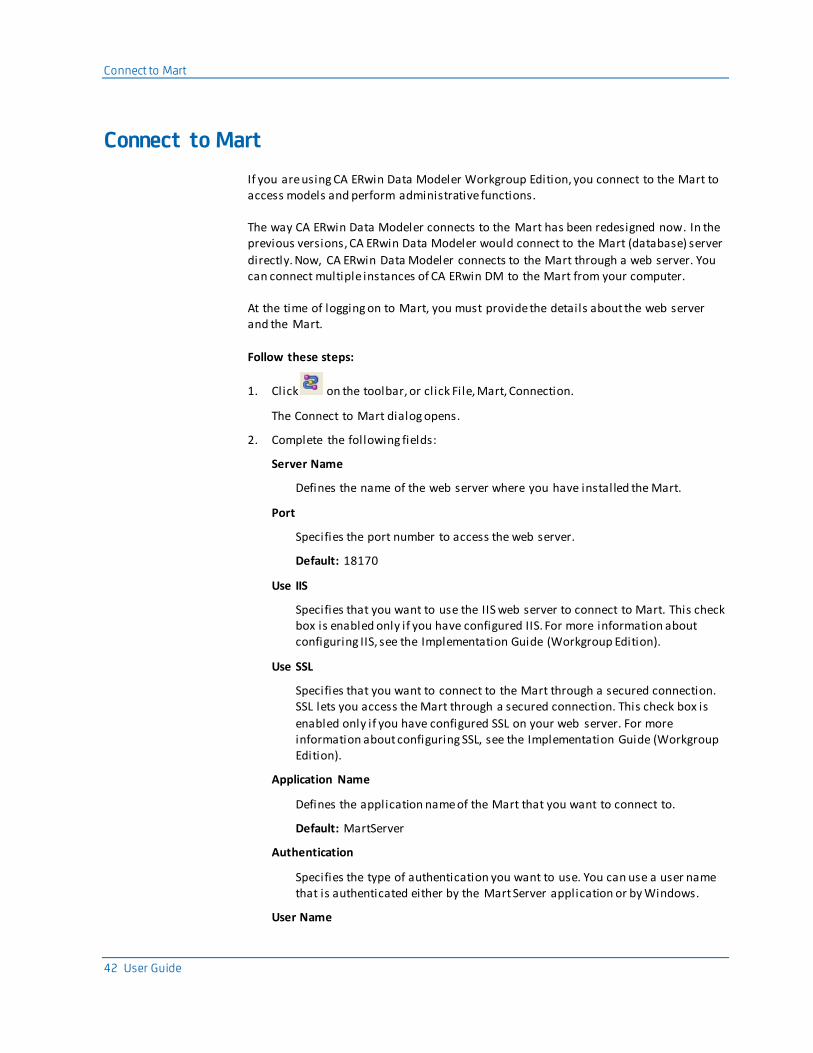
Connect to Mart
If you are using CA ERwin Data Modeler Workgroup Edition, you connect to the Mart to access models and perform administrative functions.
The way CA ERwin Data Modeler connects to the Mart has been redesigned now. In the previous versions, CA ERwin Data Modeler would connect to the Mart (database) server
directly. Now, CA ERwin Data Modeler connects to the Mart through a web server. You can connect multiple instances of CA ERwin DM to the Mart from your computer.
At the time of logging on to Mart, you must provide the details about the web server and the Mart.
Follow these steps:
1. Click on the toolbar, or click File, Mart, Connection.
The Connect to Mart dialog opens.
2. Complete the following fields:
Server Name
Defines the name of the web server where you have installed the Mart.
Port
Specifies the port number to access the web server.
Default: 18170
Use IIS
Specifies that you want to use the IIS web server to connect to Mart. This check box is enabled only if you have configured IIS. For more information about configuring IIS, see the Implementation Guide (Workgroup Edition).
Use SSL
Specifies that you want to connect to the Mart through a secured connection. SSL lets you access the Mart through a secured connection. This check box is
enabled only if you have configured SSL on your web server. For more information about configuring SSL, see the Implementation Guide (Workgroup Edition).
Application Name
Defines the application name of the Mart that you want to connect to.
Default: MartServer
Authentication
Specifies the type of authentication you want to use. You can use a user name that is authenticated either by the Mart Server application or by Windows.
User Name
Open a Model or Submodel from the Mart
Chapter 3: Navigating Data Models 43
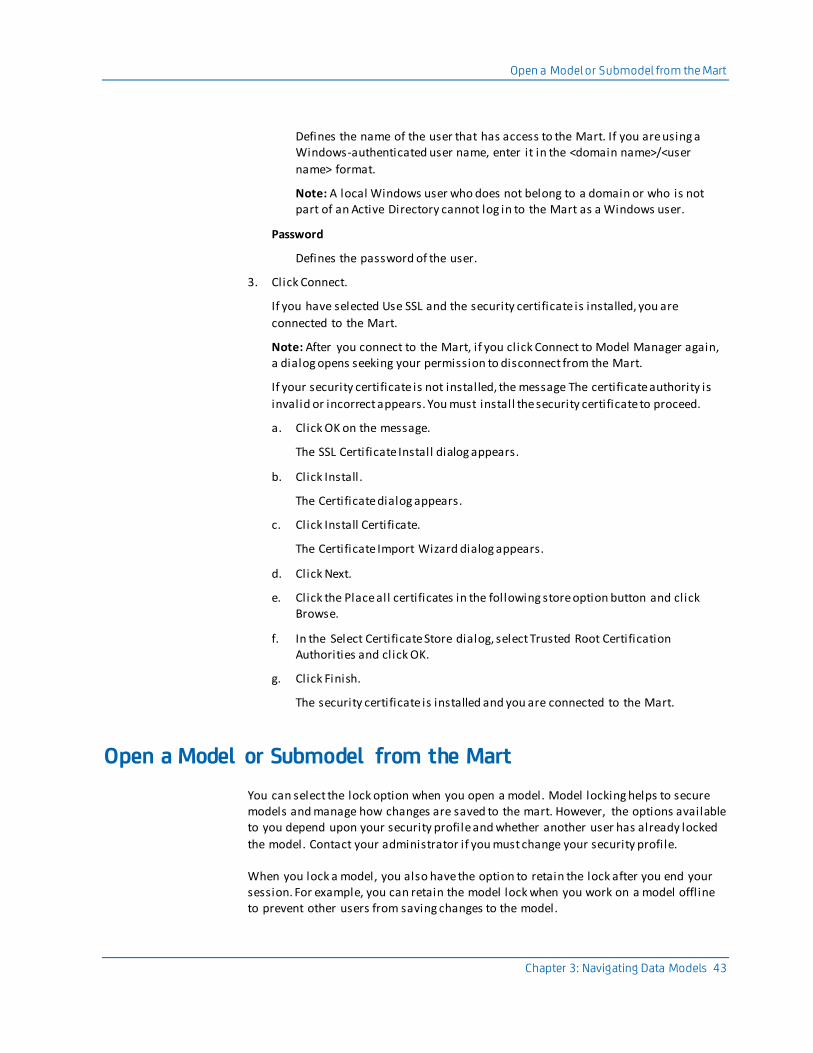
Defines the name of the user that has access to the Mart. If you are using a Windows-authenticated user name, enter it in the <domain name>/<user
name> format.
Note: A local Windows user who does not belong to a domain or who is not part of an Active Directory cannot log in to the Mart as a Windows user.
Password
Defines the password of the user.
3. Click Connect.
If you have selected Use SSL and the security certificate is installed, you are
connected to the Mart.
Note: After you connect to the Mart, if you click Connect to Model Manager again, a dialog opens seeking your permission to disconnect from the Mart.
If your security certificate is not installed, the message The certificate authority is
invalid or incorrect appears. You must install the security certificate to proceed.
a. Click OK on the message.
The SSL Certificate Install dialog appears.
b. Click Install.
The Certificate dialog appears.
c. Click Install Certificate.
The Certificate Import Wizard dialog appears.
d. Click Next.
e. Click the Place all certificates in the following store option button and click Browse.
f. In the Select Certificate Store dialog, select Trusted Root Certification Authorities and click OK.
g. Click Finish.
The security certificate is installed and you are connected to the Mart.
Open a Model or Submodel from the Mart
You can select the lock option when you open a model. Model locking helps to secure models and manage how changes are saved to the mart. However, the options available to you depend upon your security profile and whether another user has already locked
the model. Contact your administrator if you must change your security profile.
When you lock a model, you also have the option to retain the lock after you end your session. For example, you can retain the model lock when you work on a model offl ine to prevent other users from saving changes to the model.
Open a Model or Submodel from the Mart
44 User Guide
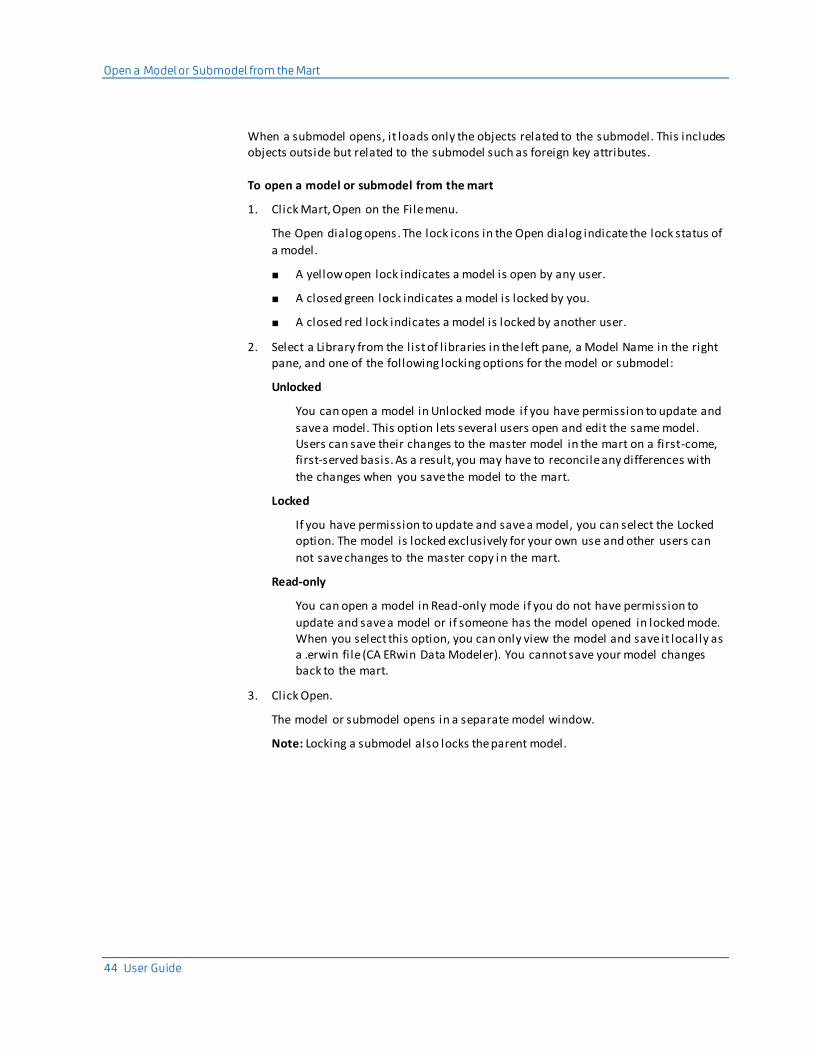
When a submodel opens, it loads only the objects related to the submodel. This includes objects outside but related to the submodel such as foreign key attributes.
To open a model or submodel from the mart
1. Click Mart, Open on the File menu.
The Open dialog opens. The lock icons in the Open dialog indicate the lock status of
a model.
■ A yellow open lock indicates a model is open by any user.
■ A closed green lock indicates a model is locked by you.
■ A closed red lock indicates a model is locked by another user.
2. Select a Library from the list of l ibraries in the left pane, a Model Name in the right pane, and one of the following locking options for the model or submodel:
Unlocked
You can open a model in Unlocked mode if you have permission to update and
save a model. This option lets several users open and edit the same model. Users can save their changes to the master model in the mart on a first-come, first-served basis. As a result, you may have to reconcile any differences with
the changes when you save the model to the mart.
Locked
If you have permission to update and save a model, you can select the Locked option. The model is locked exclusively for your own use and other users can
not save changes to the master copy i n the mart.
Read-only
You can open a model in Read-only mode if you do not have permission to
update and save a model or if someone has the model opened in locked mode. When you select this option, you can only view the model and save it locally as a .erwin fi le (CA ERwin Data Modeler). You cannot save your model changes back to the mart.
3. Click Open.
The model or submodel opens in a separate model window.
Note: Locking a submodel also locks the parent model.
Customizing the Appearance of Data Models
Chapter 3: Navigating Data Models 45
Customizing the Appearance of Data Models
There are many features that you can use to change the way a model displays on the screen and how it appears when you print it. For example, three different notations are supported: ICAM Definition Method 1 Extended (IDEF1X), Information Engineering (IE), and DImensional notation (DM). To change the notation, choose Model, Model
Properties, Notation on the toolbar.
You can also change the level of information that di splays. For example, in the logical model, you can choose to display entity names only or the entity names, attribute names, and the key group designators. Similarly, in the physical model, you can display
or hide properties such as column or datatype.
Display Levels
Two sets of display levels are provided, one for the logical model and one for the physical model.
These display levels are useful for showing different types of information in a data model, particularly when different people and groups use the data model for their specific job in the development process.
Logical Display Levels
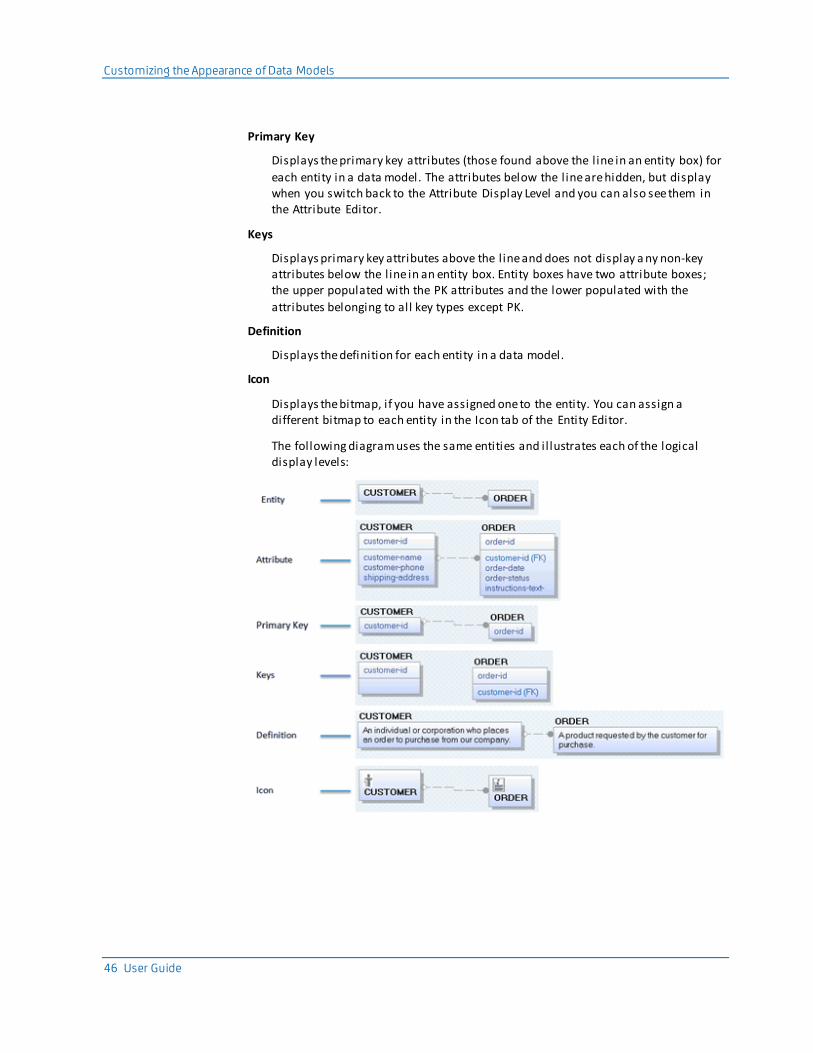
The Logical Display levels are as follows:
Entity
Displays the name of each entity in a data model inside an entity box. No other
information displays for the entity.
Attribute
Displays the attributes for each entity in a data model, with the primary key
attributes above the line and the non-key attributes below the line in an entity box.
Customizing the Appearance of Data Models
46 User Guide
Primary Key
Displays the primary key attributes (those found above the line in an entity box) for
each entity in a data model. The attributes below the line are hidden, but display when you switch back to the Attribute Display Level and you can also see them in the Attribute Editor.
Keys
Displays primary key attributes above the line and does not display a ny non-key attributes below the line in an entity box. Entity boxes have two attribute boxes; the upper populated with the PK attributes and the lower populated with the
attributes belonging to all key types except PK.
Definition
Displays the definition for each entity in a data model.
Icon
Displays the bitmap, if you have assigned one to the entity. You can assign a different bitmap to each entity in the Icon tab of the Entity Editor.
The following diagram uses the same entities and il lustrates each of the logical display levels:
Customizing the Appearance of Data Models
Chapter 3: Navigating Data Models 47
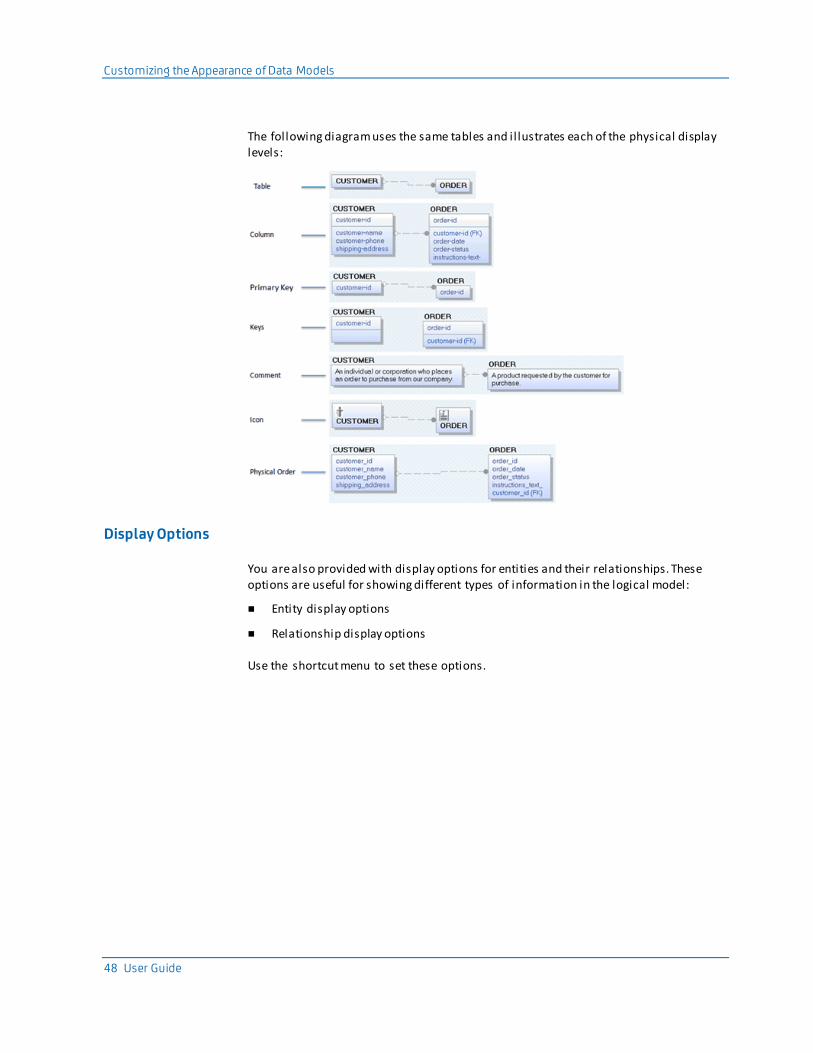
Physical Display Levels
The Physical Display levels are as follows:
Table
Displays the name of each table in a data model inside a box. No other information
displays for the table.
Column
Displays the columns for each table in a data model, with the primary key columns above the line and the non-key columns below the line in a box.
Primary Key
Displays the primary key columns (those found above the line in a table box) for each table in a data model. The columns below the line are hidden, but display when you switch back to the Column Display Level and you can also see them in the Table Column Editor.
Keys
Displays primary key columns above the line and does not display any non-key columns below the line in a table box. Table boxes have two column boxes; the
upper populated with the PK columns and the lower populated with the columns belonging to all key types except PK.
Comment
Displays the comment for each table in a data model.
Icon
Displays the bitmap, if you have assigned one to the table. You can assign a different bitmap to each entity in the Icon tab of the Table Editor.
Physical Order
Displays the order in which each column appears in the corresponding table.
Customizing the Appearance of Data Models
48 User Guide
The following diagram uses the same tables and il lustrates each of the physical display levels:
Display Options
You are also provided with display options for entities and their relationships. These options are useful for showing different types of information in the logical model:
■ Entity display options
■ Relationship display options
Use the shortcut menu to set these options.
Customizing the Appearance of Data Models
Chapter 3: Navigating Data Models 49
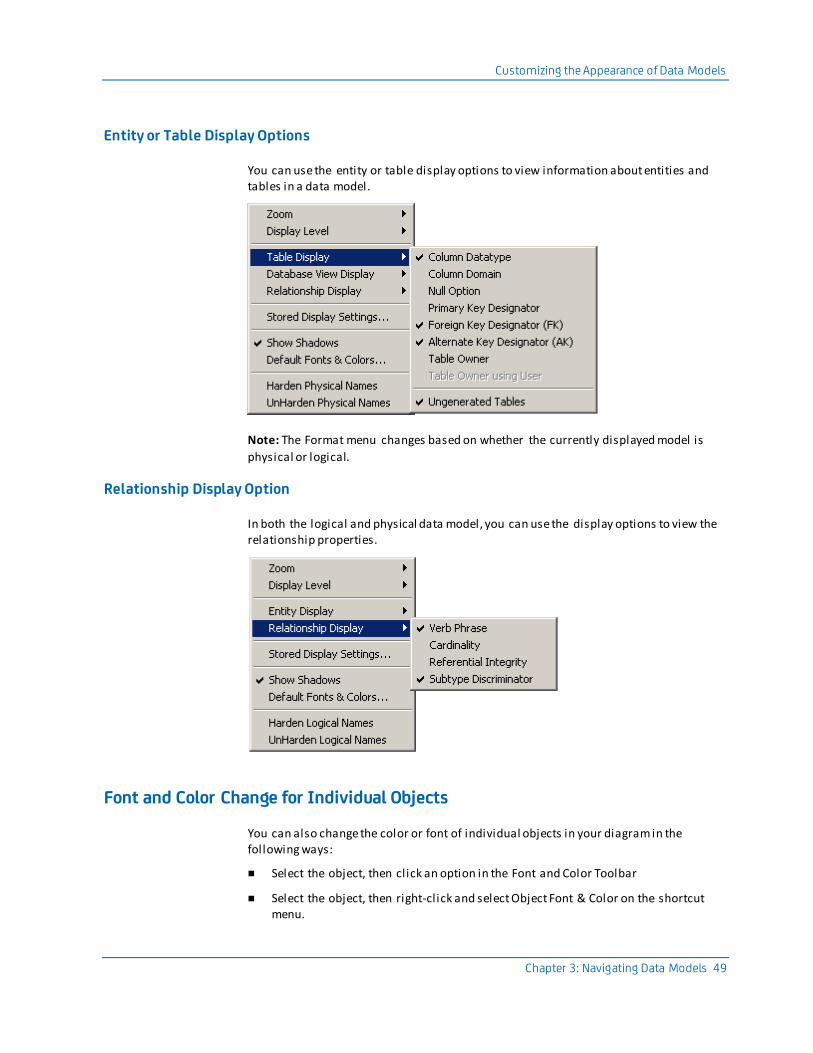
Entity or Table Display Options
You can use the entity or table display options to view information about entities and tables in a data model.
Note: The Format menu changes based on whether the currently displayed model is
physical or logical.
Relationship Display Option
In both the logical and physical data model, you can use the display options to view the relationship properties.
Font and Color Change for Individual Objects
You can also change the color or font of individual objects in your diagram in the following ways:
■ Select the object, then click an option in the Font and Color Toolbar
■ Select the object, then right-click and select Object Font & Color on the shortcut menu.
Customizing the Appearance of Data Models
50 User Guide
Customize Object Fonts and Colors
When you add an object to a diagram, the default font, color, fi l l , a nd line options for that object type is automatically assigned. Use the Theme Editor to assign the default display theme to objects, or create your own theme. Use the following procedure to
customize the settings for the objects you create.
To customize object fonts and colors
1. Click Themes on the View menu.
The Theme Editor opens.
2. Navigate the tabs on the dialog to set default color and font information. You can
also specify font and color properties for all model objects, new objects you create, or current objects in the model.
Note: The tabs that appear vary depending on whether you are working with a logical, physical, or logical/physical model.
Click OK.
The new default settings are saved and the dialog closes.
Customizing the Appearance of Data Models
Chapter 3: Navigating Data Models 51
Changing the Diagram Window Magnification Level
You can use the following Zoom options, which are available on the CA ERwin Data Modeler Toolbar and on the View Menu, to view a model at different magnification levels.
Zoom Out
Decreases the magnification of your model in the diagram window by an offset of 10.
Zoom In
Increases the magnification of your model in the diagram window by an offset of 10.
Zoom Normal
Resets the magnification level to 100 percent.
Fit Model
Reduces the magnification level to fit the entire model in the diagram window.
Fit Selection
Magnifies a specific area of the model to fit within the diagram window. Drag the magnifying glass cursor around the portion of the diagram window that you want to view and the appropriate Zoom level is applied to the model and fi l ls the diagram window with the selected portion.
Notes:
■ Display magnification is managed independently from print magnification. When you print the diagram window, the zoom display settings a re ignored and allows
you to change the scale to show more or less of the diagram window on each page.
■ The minimum screen resolution supported is 1024 x 768. If your screen resolution is less than the minimum supported, some portions of the screen will not be visible. If you are working in an editor and you cannot see the Close or Cancel buttons, you
can hit the Enter key to close and the Esc key to cancel.
Print a Data Model
52 User Guide
Print a Data Model
You can print your model to your default printer. Before you print, you can customize options for the printed output.
To print a model
1. Click Print on the File menu.
The Print dialog opens.
2. Select from the following options on the Print dialog:
Printer
Specifies the destination printer. Select a printer name from the drop-down
menu. Select Print to fi le to save the print output to a fi le instead of a printer.
Print range
Print all pages of the model, or a range of pages.
Copies
Prints one or more copies of each selected page. You can also select to collate the copies.
Print what
Print the current diagram (the open diagram from which you opened the print dialog), or current selection or all diagrams currently open.
Print order
Specifies the direction taken for the print output. For example, if you have a large model that prints on multiple pages, you can select "Over, then down" to create a printout with a horizontal orientation. Or, select "Down, then over" to create a printout with a vertical orientation.
Fit to page
Specifies to scale the entire diagram so that it fits on a single page for the selected printer and paper size. Select the check box to enable this option.
Note: If you select this option and have selected more than one diagram to print, each diagram prints on a separate page.
3. Click Preview to view your output page by page, before starting the print job.
Note: The page preview that is displayed takes into account the page margins that
you set in the Page Setup Editor. This means that what you see in the Preview page is what will be printed.
Click Zoom In to zoom the diagram to the size of the paper. Click Zoom Out to zoom the diagram to a size that can be fit in the Preview window.
To print immediately, click Print; otherwise click Close to go back to the diagram window.
Print a Data Model
Chapter 3: Navigating Data Models 53
4. Click Page Setup to customize print options such as page size, orientation, zoom, border, color, header, footer, and margin.
Click Pr int t o pr int t he model t o t he specif ied pr inter.
Print Only What You Want
You can use the mouse in the embedded Diagram Window in the Print dialog to perform
the following tasks:
Change the print scale
Drag a page grid l ine until your model fits in the grid pages exactly how you want
the model pages to print. You can also enter a value in the Print Scaling box.
Select specific pages for printing
Hold the CTRL key and click each page you want to print.
Set Printer Options
You can set your printer options before you print the model.
To set printer options
1. Select Print Setup from the File menu.
The Print Setup dialog opens.
2. Accept the default printer, page orientation, paper size, and source settings or select another option:
■ Select a printer from the printer Name list to select a different printer.
■ Click Portrait or Landscape to select a different page orientation.
■ Select a different paper size from the Size l ist to change the paper size.
■ Select a different paper source from the Source list to change the paper source.
■ Click the Properties button to open the Windows Document Properties dialog
to change graphic and print quality options.
Note: Changing to landscape page orientation affects both the page grid and the printer fonts. If you change the orientation for a model, you should adjust the objects and
relationships in your model for the new layout.
Print a Data Model
54 User Guide
Specify an Exact Print Scale Value
You can specify an exact print scale value in percentage.
To specify an exact print scale value
1. Select Print from the File menu.
The Print dialog opens.
2. Enter the print scale value that you want to apply to the objects in the model in the Print Scaling (%) box, and click the TAB key.
■ Enter a value greater than 100 to enlarge the size of model objects.
■ Enter a value less than 100 to reduce the size of model objects.
The size of the model immediately changes to reflect the print scale value that you specify.
3. Click the Print button.
The model prints.
Note: To reset the model to 100% print scale, click the Reset Scale button.
Add a Page Header or Footer
You can add a customized header or footer (or both) to all the pages when you print a
model. For example, you can print the Model Name, Subject Area Name, and Diagram Name at the top of every page, and the page number, date, and time at the bottom of every page.
Note: If you manually enter incremental information in the Header or Footer text box (for example, page number, date, and so on), you cannot automatically update the text.
A toolbar is provided to make it easy for you to quickly add the following elements:
■ Current Page
■ Page Count
■ File Name
■ Subject Area Name
■ Diagram Name
■ Time
■ Date
Print a Data Model
Chapter 3: Navigating Data Models 55
To add a page header or footer
1. Click Page Setup on the File menu.
The Page Setup Editor opens.
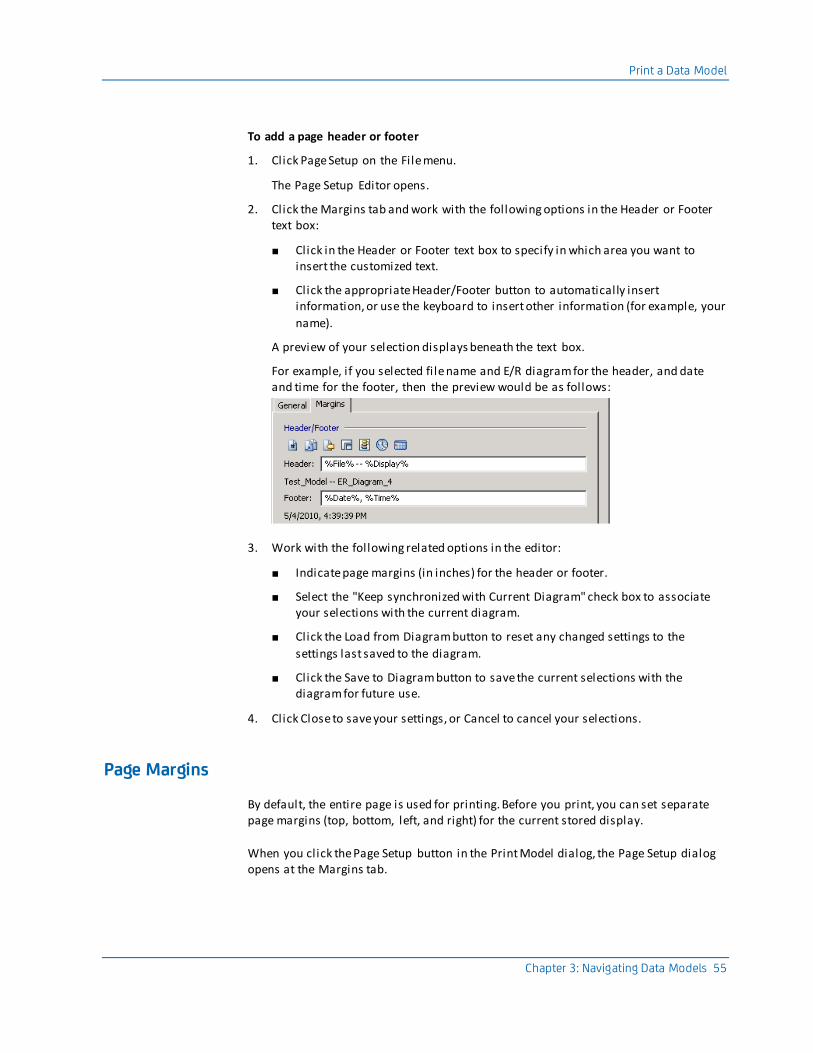
2. Click the Margins tab and work with the following options in the Header or Footer text box:
■ Click in the Header or Footer text box to specify in which area you want to insert the customized text.
■ Click the appropriate Header/Footer button to automatically insert information, or use the keyboard to insert other information (for example, your
name).
A preview of your selection displays beneath the text box.
For example, if you selected fi le name and E/R diagram for the header, and date and time for the footer, then the preview would be as follows:
3. Work with the following related options in the editor:
■ Indicate page margins (in inches) for the header or footer.
■ Select the "Keep synchronized with Current Diagram" check box to associate your selections with the current diagram.
■ Click the Load from Diagram button to reset any changed settings to the
settings last saved to the diagram.
■ Click the Save to Diagram button to save the current selections with the diagram for future use.
4. Click Close to save your settings, or Cancel to cancel your selections.
Page Margins
By default, the entire page is used for printing. Before you print, you can set separate page margins (top, bottom, left, and right) for the current stored display.
When you click the Page Setup button in the Print Model dialog, the Page Setup dialog opens at the Margins tab.
Print a Data Model
56 User Guide
Page Boundaries
By adjusting the page grid boundary l ines, you can control how much information prints on each page. The page grid boundary l ines define the individual pages on which the model objects will print. Using your mouse, you can drag the page grid l ines in the Print
Model dialog (within the thumbnail view) or in the diagram window, so more or fewer objects are printed on a particular page. To adjust the page grids from the diagram window, you must first turn them on by choosing the Show Page Grid option from the Format menu. You can turn off the page grids in the same way.
When you adjust the page boundary l ines, the size of the page grid also determines the print scale (the size of model objects and fonts). To enlarge the print scale, reduce the size of the grid. To reduce the print scale, enlarge the size of the grid.
Note: The paper size you select determines the dimens ions of the page grid. To change
the paper size, click Print Setup from the File menu and then select a different paper size option.
Set Print Margins
You can specify margins for all pages of your printed model.
To set print margins
1. Click Page Setup in the Print dialog.
The Page Setup dialog opens.
2. Click the Margins tab.
3. Enter a value between 0 and 1.5 inches for the left, right, top, and bottom of the
page.
4. Click OK.
The Page Setup dialog closes.
Note: Margin measurements are considered when displaying the embedded Diagram Window in the Print dialog.
Chapter 4: Reporting 57
Chapter 4: Reporting
This section contains the following topics:
Data Model Reporting (see page 57)
Data Model Reporting
CA ERwin Data Modeler Navigator Edition supports reporting with ODBC connectivity using the Query Tool. You can also use the ODBC connectivity in CA ERwin Data Modeler
to create reports using any tool that supports an ODBC connection, such as Microsoft Excel.
The Query Tool
The Query Tool provides an easy way to execute SQL SELECT queries against a model in
CA ERwin Data Modeler, a model in a mart, or against a database catalog. You can execute a query against the objects and properties in the model, the metadata defining those objects and properties, and the action log that records the changes that are made
to your model during the modeling session.
You can create new queries or paste text from another source (such as a *.sql fi le) into a query.
You can save a query to a .*qry fi le for later execution. Query results can be saved to a
*.csv (comma-separated values) fi le.
Although the Query Tool provides a built-in query interface in CA ERwin Data Modeler, you can also use any third-party reporting tool that has ODBC capability to query CA
ERwin Data Modeler modeling data.
Note: For more information about using the ODBC data sources in CA ERwin Data Modeler with a third party tool, see the ODBC Reporting Guide.
Data Model Reporting
58 User Guide
Create a Query
You can create a query (SELECT statement) by entering text directly in the Query box, or by pasting text from another source.
To create a query
1. Click Query Tool on the Tools menu.
The Query Tool opens.
2. Enter your query in the Query box, or click the paste button on the toolbar to paste a query from another source.
Your query is ready for execution. Use other features in the Query Tool to execute and save the query.
Note: Before you can execute a query you must be connected to ERwin ODBC or to a
database. For sample queries and the details of schemas and tables, see the ODBC Reporting Guide.
Open a Query
You can work with queries you saved to a *.qry fi le in a previous session, or you can
optionally use a *.sql, or Microsoft SQL Server Query fi le.
To open a query
1. Click Query Tool on the Tools menu.
The Query Tool opens.
2. Click the Open Query icon on the toolbar.
The Open dialog opens.
3. Select a *.qry or *.sql fi le and click open.
The query text opens the Query box and is ready for execution.
Note: Before you can execute a query you must be connected to ERwin ODBC or to a database.
Data Model Reporting
Chapter 4: Reporting 59
Save a Query
After you have created a new query or made changes to an existing query in the Query Tool, you can save your query to a *.qry fi le for future use.
To save a query
1. Click the Save Query icon on the toolbar in the Query Tool.
The Save As dialog opens.
2. Select a fi le name and location for your query, then click Save.
Your query is saved and the Save As dialog closes.
3. Click Close.
The Query Tool closes.
Execute a Query
You can execute a new or saved query against the model or against a database catalog.
Use the following process to execute a query:
■ Open the Query Tool from the Tools menu.
■ Create a new query or open an existing query (*.qry) fi le.
■ Connect to ERwin ODBC or to a database.
■ (Optional) Select the option to restrict row count and enter a number to indicate the number of rows by which to restrict results.
■ Click the Execute icon on the toolbar.
After your query executes, the results display in the Results box. Use other features in the Query Tool to save the query or save your result set.
Note: For sample queries and the details of schemas and tables, see the ODBC Reporting Guide.
Data Model Reporting
60 User Guide
Execute a Query Against a Database
You can run your query against a database catalog. To do this, you connect to the database from the Query Tool and then execute your query.
Follow this process to run a query against a database:
■ Open the Query Tool from the Tools menu.
■ Create a new query or open an existing query (*.qry or *.sql) fi le.
■ Click the Connect icon on the toolbar.
■ Enter the database-specific connection criteria in the Connect dialog.
■ (Optional) Select the Restrict row count to check box and enter a number to l imit the number of rows returned.
■ Click the Execute icon on the toolbar.
After your query executes, the results display in the Results box. Use other features in the Query Tool to save the query or save your result set.
Note: You cannot be connected to ERwin ODBC and a database at the same time in the Query Tool. If you are connected to ERwin ODBC, the (database) Connect icon is
dimmed. Click the Disconnect icon on the toolbar to disconnect your ERwin ODBC
connection before you attempt to connect to a database. Also, before you can make a database connection, the appropriate database client software must be installed. See Database Connection Overview for more information.
Execute a Query Against ERwin ODBC
To run a query against the current CA ERwin Data Modeler model, you must first activate the ODBC connection. The connection may already be active, if you selected the option to start the ODBC driver on the Reporting tab in the Options dialog.
To connect to ERwin ODBC
1. Click Query Tool on the Tools menu.
The Query Tool opens.
2. Open a query (*.qry or *.sql) fi le or create a query.
Query text displays in the Query box and is ready for execution.
3. Click the Connect to ERwin ODBC icon on the toolbar.
The ODBC connection is established. The Disconnect icon becomes active. Use other features in the Query Tool to execute and save the query and result set.
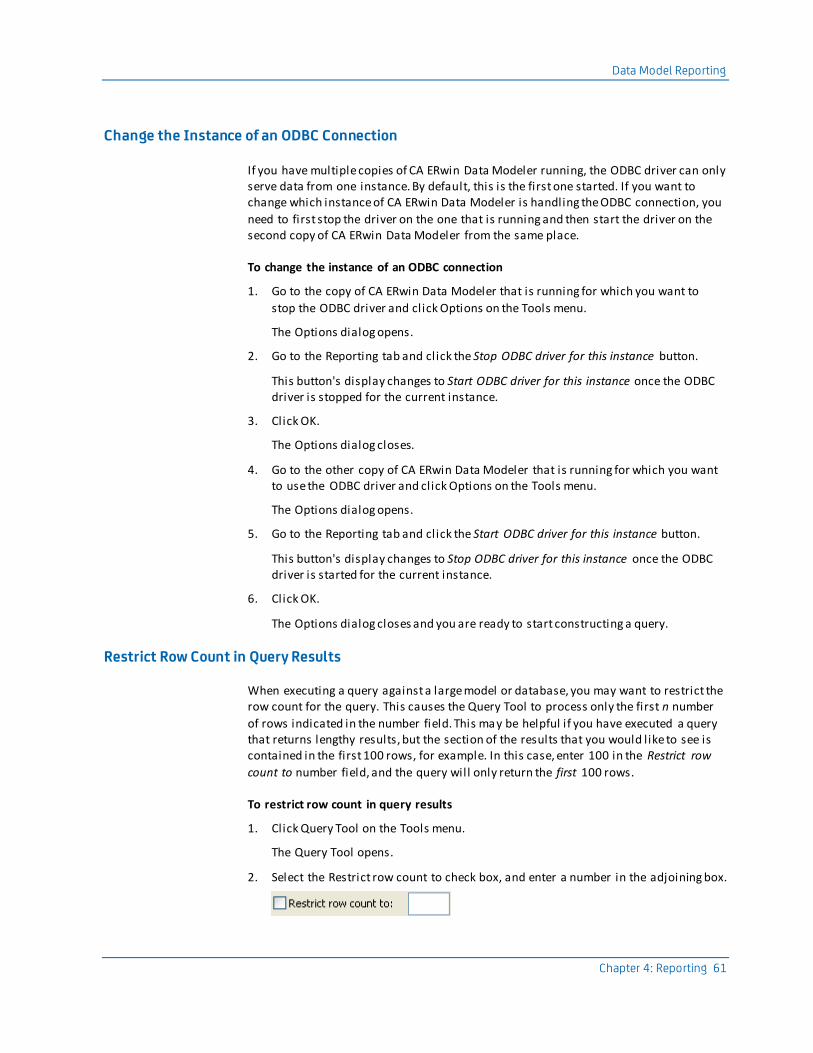
Data Model Reporting
Chapter 4: Reporting 61
Change the Instance of an ODBC Connection
If you have multiple copies of CA ERwin Data Modeler running, the ODBC driver can only serve data from one instance. By default, this is the first one started. If you want to change which instance of CA ERwin Data Modeler is handling the ODBC connection, you
need to first stop the driver on the one that is running and then start the driver on the second copy of CA ERwin Data Modeler from the same place.
To change the instance of an ODBC connection
1. Go to the copy of CA ERwin Data Modeler that is running for which you want to
stop the ODBC driver and click Options on the Tools menu.
The Options dialog opens.
2. Go to the Reporting tab and click the Stop ODBC driver for this instance button.
This button's display changes to Start ODBC driver for this instance once the ODBC driver is stopped for the current instance.
3. Click OK.
The Options dialog closes.
4. Go to the other copy of CA ERwin Data Modeler that is running for which you want to use the ODBC driver and click Options on the Tools menu.
The Options dialog opens.
5. Go to the Reporting tab and click the Start ODBC driver for this instance button.
This button's display changes to Stop ODBC driver for this instance once the ODBC driver is started for the current instance.
6. Click OK.
The Options dialog closes and you are ready to start constructing a query.
Restrict Row Count in Query Results
When executing a query against a large model or database, you may want to restrict the row count for the query. This causes the Query Tool to process only the first n number
of rows indicated in the number field. This may be helpful if you have executed a query that returns lengthy results, but the section of the results that you would like to see is contained in the first 100 rows, for example. In this case, enter 100 in the Restrict row
count to number field, and the query will only return the first 100 rows.
To restrict row count in query results
1. Click Query Tool on the Tools menu.
The Query Tool opens.
2. Select the Restrict row count to check box, and enter a number in the adjoining box.
Data Model Reporting
62 User Guide
When your query runs, the results that display are restricted to the first n number of rows you indicate.
Save a Result Set to a CSV File
After you have executed a query and the results display in the Results box, you can save the results to a *.csv (comma-separated values) fi le to work with it in other reporting tools, or to share with your modeling team.
To save a result set to a *.csv file
1. Click Query Tool on the Tools menu.
The Query Tool opens.
2. Open a query fi le or create a new query and click the Execute icon on the toolbar.
Your query results display in the Results box.
3. Click the Save Result Set as CSV icon displayed next to the Restrict row count to box.
The Save As dialog opens.
4. Enter a fi le name and location for your fi le and click Save.
The fi le is saved, the Save As dialog closes, and you are returned to the Query Tool.
Appendix A: Product Differences 63
Appendix A: Product Differences
This section contains the following topics:
CA ERwin Data Modeler Navigator Edition Differences (see page 63) Data Model Disabled Menu Items and Toolbar Icons (see page 64)
CA ERwin Data Modeler Navigator Edition Differences
You can use this product to view, manipulate, print, and report on models on a local
drive, network, or on a mart database.
The toolbar, menu and dialog options that are unusable in the components of thi s product are either absent or grayed out to show that they are disabled. For experienced
users who are already familiar with CA ERwin Data Modeler, the options that are not available in this product are specified in the following sections.
Data Model Disabled Menu Items and Toolbar Icons
64 User Guide
Data Model Disabled Menu Items and Toolbar Icons
The following menu items and their corresponding toolbar icons are unavailable when you are working with data models using CA ERwin Data Modeler Navigator Edition:
File
Save
Save As
Mart, Save
Mart, Save As
Mart, Lock
Mart, Version Manager
Mart, Library Manager
Mart, Session Manager
Mart, Security Manager
Mart, Submodel Manager
Export to External Format
Actions
Database Connection
Reverse Engineer
Forward Engineer (all rollover menu items)
Design Layers (all rollver menu items)
Tools
Standards (all rollover menu items)
Add-Ins (all rollover menu items)
Options
Report Designer
Export to PDF
Index 65
Index
A
action log action summary reports • 38
details pane • 32 find text • 35 overview • 31
redo a transaction • 36 redo to a selected transaction • 37 reverse a transaction • 36 shortcut menu • 34
summary pane • 33 tasks • 34 undo a transaction • 36 undo to a selected transaction • 37
use extended find and fi lter • 36 action summary reports
action log • 38
advisories pane • 39 attributes
defined • 19
C
CA ERwin Data Modeler report, generating in the Query Tool • 57
columns, defined • 19
D
default fonts & colors dialog • 50
dependent entities • 18 details pane
action log • 32 display levels
logical display • 45 overview • 45 physical display • 47
display options overview • 48
E
entities defined • 17 dependent • 18
independent • 18 extended find and fi lter
action log • 36
F
fi le
opening • 41 fi le format
XML • 41
find, extended and fi lter • 36 footer
printing on a diagram • 54 footers and headers, customize • 54
foreign key • 20, 23
H
header
printing on a diagram • 54 headers and footers, customize • 54
I
independent entities • 18
K
key foreign • 20, 23 non-key • 20 primary • 20
L
logical model • 16
logical/physical model • 16
M
magnification, changing for a diagram • 51
model changing magnification level • 51 opening • 41
opening a model saved in XML format • 41 model explorer
copy objects • 31 delete objects • 31
go to an object • 31 model view • 27 move objects • 31 overview • 26
66 User Guide
property editor • 31 shortcut menu • 29
subject view • 27 toolbar • 29
model types
logical • 16 logical/physical • 16 physical • 16
model view
model explorer • 27
N
non-key • 20
O
ODBC
reporting tool • 57 opening a model • 41
P
page margins, setting • 55 physical model • 16 primary key • 20 print
customize headers and footers • 54 set margins • 56
printing
headers and footers • 54 scaling options • 54
property editor • 31
Q
Query Tool create a query • 58
execute a query • 59, 60 ODBC connections • 60, 61 open a query • 58 overview • 57
save a query • 59 save results to a CSV fi le • 62
R
redo a transaction action log • 36
redo to a selected transaction
action log • 37 relationship types
identifying • 21 non-identifying • 21
other • 22 relationships • 21 report
action summary • 38 reports
using the Query Tool • 57 reverse a transaction
action log • 36
S
SELECT statements, in the Query Tool • 58
shortcut menu action log • 34 model explorer • 29
SQL queries using the Query Tool • 57
subject view model explorer • 27
summary pane action log • 33
T
tables • 18 toolbar
alignment • 30
drawing • 31 model explorer • 29
toolbox • 30
U
undo a transaction action log • 36
undo to a selected transaction action log • 37
undo/reverse comparison table • 38 unification • 23
W
workplace panes • 24
X
XML format opening a model • 41

Index 67
Z
zoom, changing on the diagram window • 51