Embed Size (px)
DESCRIPTION
lab
Citation preview
NATIONAL UNIVERSITY of SINGAPORE
FACULTY OF ENGINEERING
EG1108 – ELECTRICAL ENGINEERING
EXPERIMENT E1
AC CIRCUITS
LABORATORY MANUAL
1
1. Objectives
1.1 To gain familiarity with a Digital Storage Oscilloscope (DSO) and a function generator.
1.2 To measure the amplitude and relative phase of ac voltages in circuits that have an inductor and a capacitor.
1.3 To study the transient response of a series RC circuit.
2. Equipment
2.1 Breadboard
2.2 Digital Multimeter
2.3 2-Channel Digital Storage Oscilloscope
2.4 Function Generator
2.5 Resistors, Capacitor and Inductor
2
Important General Instructions:
You are not allowed to come to the lab with slippers and sandals. You MUST put on covered shoes for safety purposes.
Read the experiment manual before you come for the experiment.
Enter the laboratory on time in order to finish the experiment on time.
Note down all important experimental data, including waveforms. It is alright to cross these out later if mistakes are made.
When a waveform or graph is plotted, make sure that you put down the appropriate title, axes, labels, ticks, and units.
Try to finish the experiment in 2.5 hours so that there is time to reflect on the results and to re-confirm certain parts of the experiment.
3. Introduction
In this experiment, you will patch up a simple electrical circuit, and learn to make use of a few basic electrical engineering instruments to generate some test signals, and then measure the resulting voltage waveforms in the circuit.
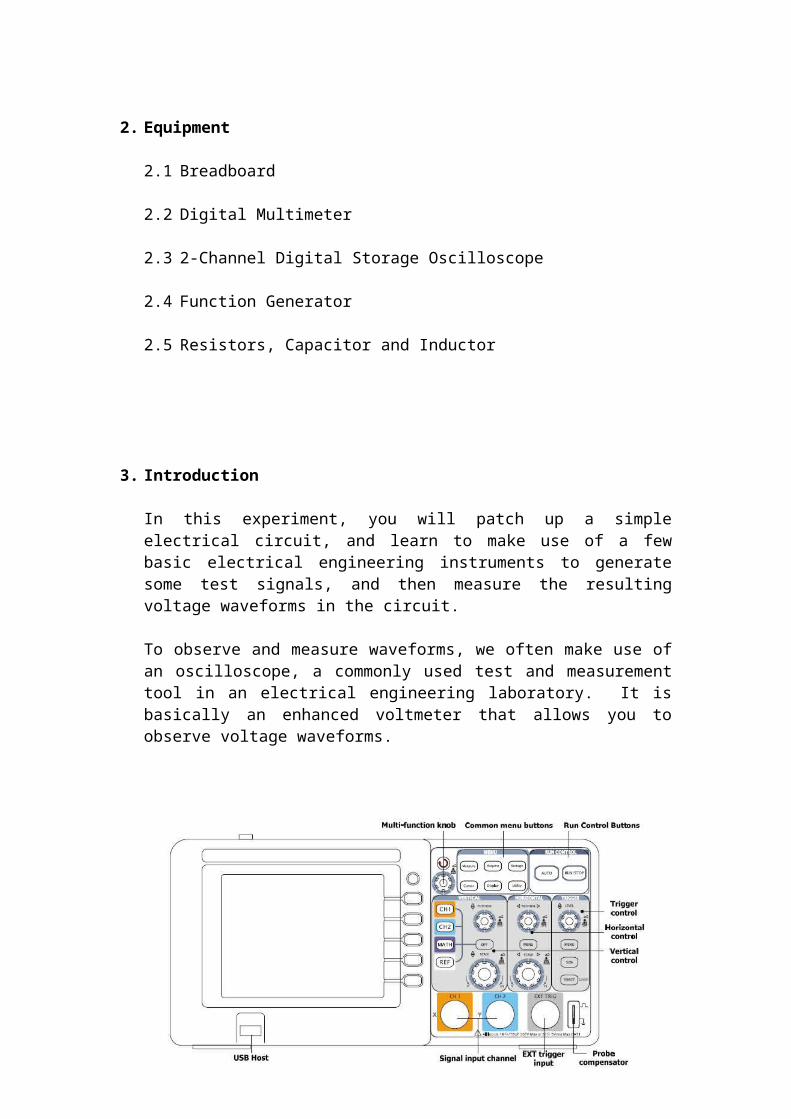
To observe and measure waveforms, we often make use of an oscilloscope, a commonly used test and measurement tool in an electrical engineering laboratory. It is basically an enhanced voltmeter that allows you to observe voltage waveforms.
Fig. 1. Front panel view of a scope (RIGOL model DS1102CA).
There are, however, some limitations and precautions that you need to take note of when an oscilloscope is used. An important note is that, the scope, short for oscilloscope, measures voltages with respect to a zero reference point, often called the ground terminal. Thus, even though the scope you will be using has two inputs and so allow you to observe two voltages, both voltages are measured with respect to the same ground point or terminal. Specifically, while it may not be obvious, the ground clips (often black in color) of the two input leads are actually connected together inside the scope.
Fig. 1 shows the front panel view of a scope, while Fig. 2 shows that for a function generator.
3
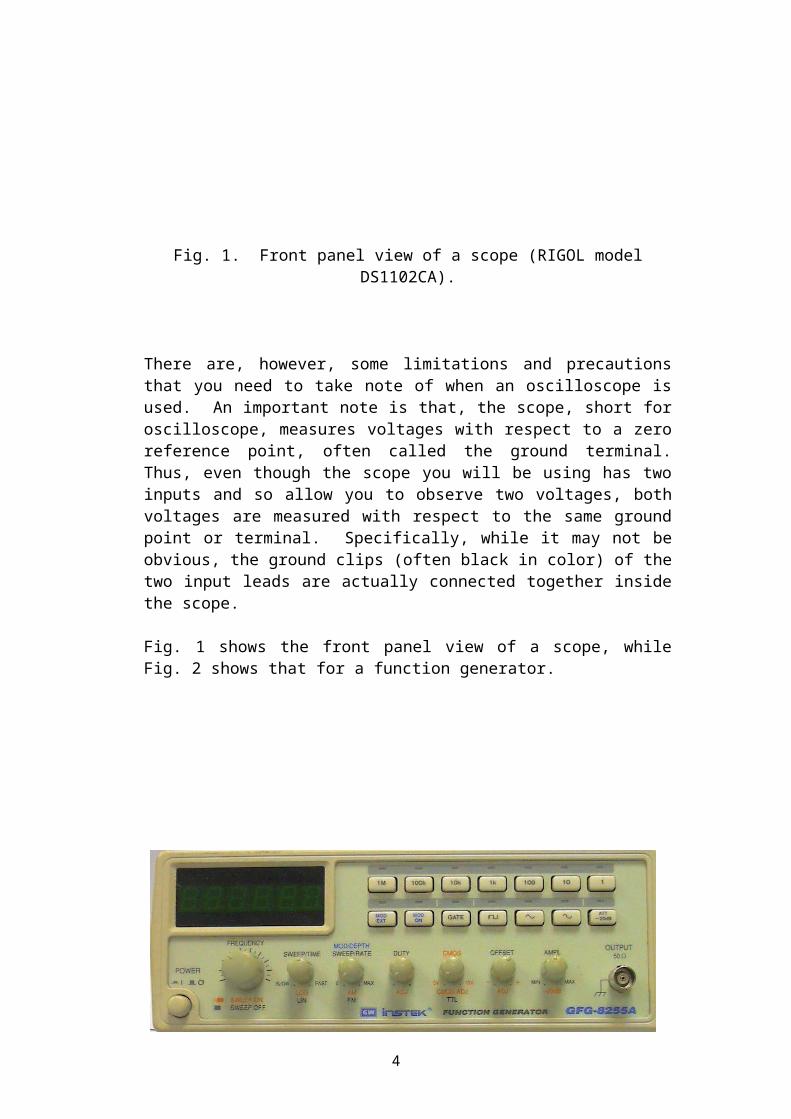
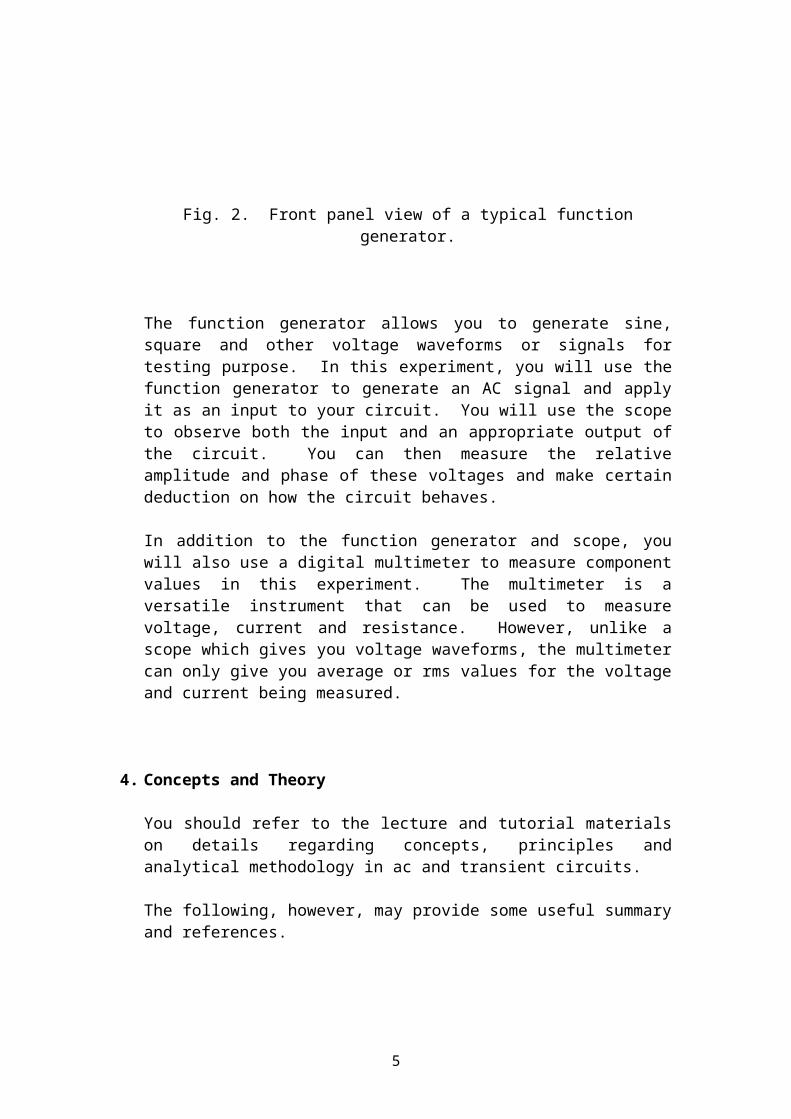
Fig. 2. Front panel view of a typical function generator.
The function generator allows you to generate sine, square and other voltage waveforms or signals for testing purpose. In this experiment, you will use the function generator to generate an AC signal and apply it as an input to your circuit. You will use the scope to observe both the input and an appropriate output of the circuit. You can then measure the relative amplitude and phase of these voltages and make certain deduction on how the circuit behaves.
In addition to the function generator and scope, you will also use a digital multimeter to measure component values in this experiment. The multimeter is a versatile instrument that can be used to measure voltage, current and resistance. However, unlike a scope which gives you voltage waveforms, the multimeter can only give you average or rms values for the voltage and current being measured.
4. Concepts and Theory
You should refer to the lecture and tutorial materials on details regarding concepts, principles and analytical methodology in ac and transient circuits.
The following, however, may provide some useful summary and references.
4
4.1 Amplitude, Phase and Frequency of Real and Complex Sinusoids
The following gives a summary of the important parameters of ac signals, or real and complex sinusoids.
Note that for both the real sinusoid and the complex sinusoid , the complex number gives the amplitude and phase, and is
often referred to as the phasor of the sinusoids. Also, for the convenience of calculating power, is sometimes taken to be the phasor of the real sinusoid . However, for this experiment where you will be measuring peak values, it is simply to use .
4.2 Impedance
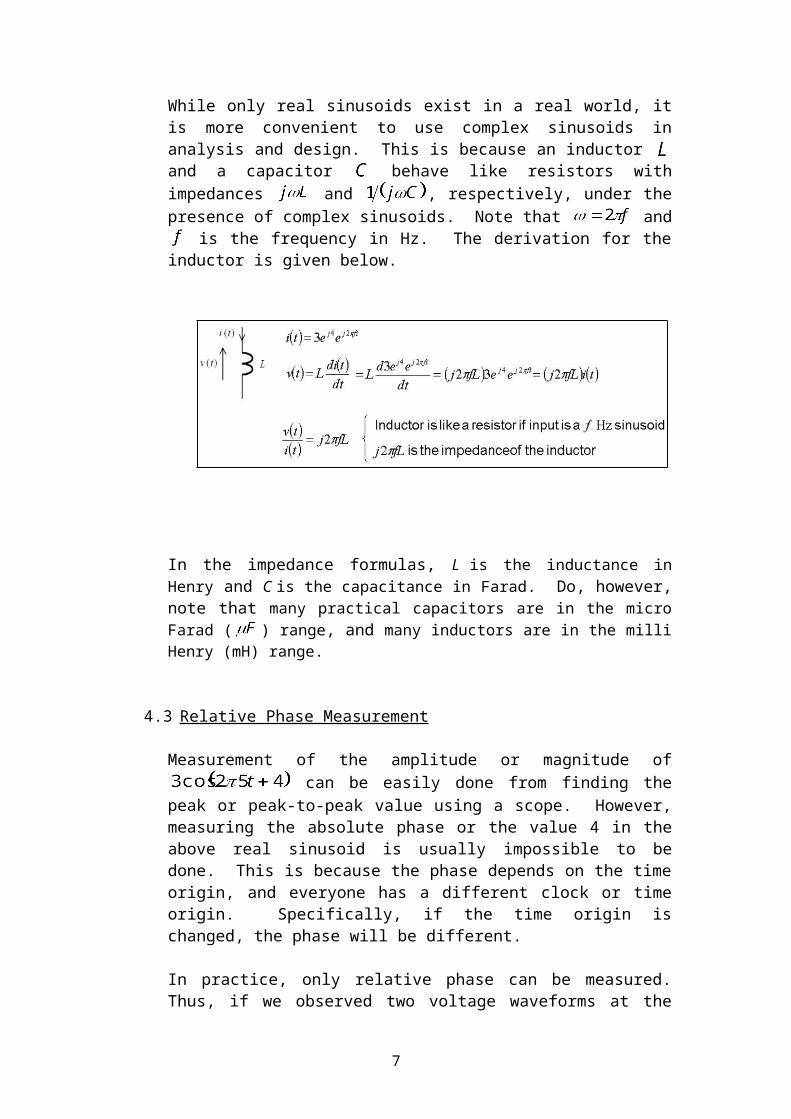
While only real sinusoids exist in a real world, it is more convenient to use complex sinusoids in analysis and design. This is because an inductor and a capacitor behave like resistors with impedances and , respectively, under the presence of complex sinusoids. Note that and
is the frequency in Hz. The derivation for the inductor is given below.
In the impedance formulas, L is the inductance in Henry and C is the capacitance in Farad. Do, however, note that many practical
5

capacitors are in the micro Farad ( ) range, and many inductors are in the milli Henry (mH) range.
4.3 Relative Phase Measurement
Measurement of the amplitude or magnitude of can be easily done from finding the peak or peak-to-peak value using a scope. However, measuring the absolute phase or the value 4 in the above real sinusoid is usually impossible to be done. This is because the phase depends on the time origin, and everyone has a different clock or time origin. Specifically, if the time origin is changed, the phase will be different.
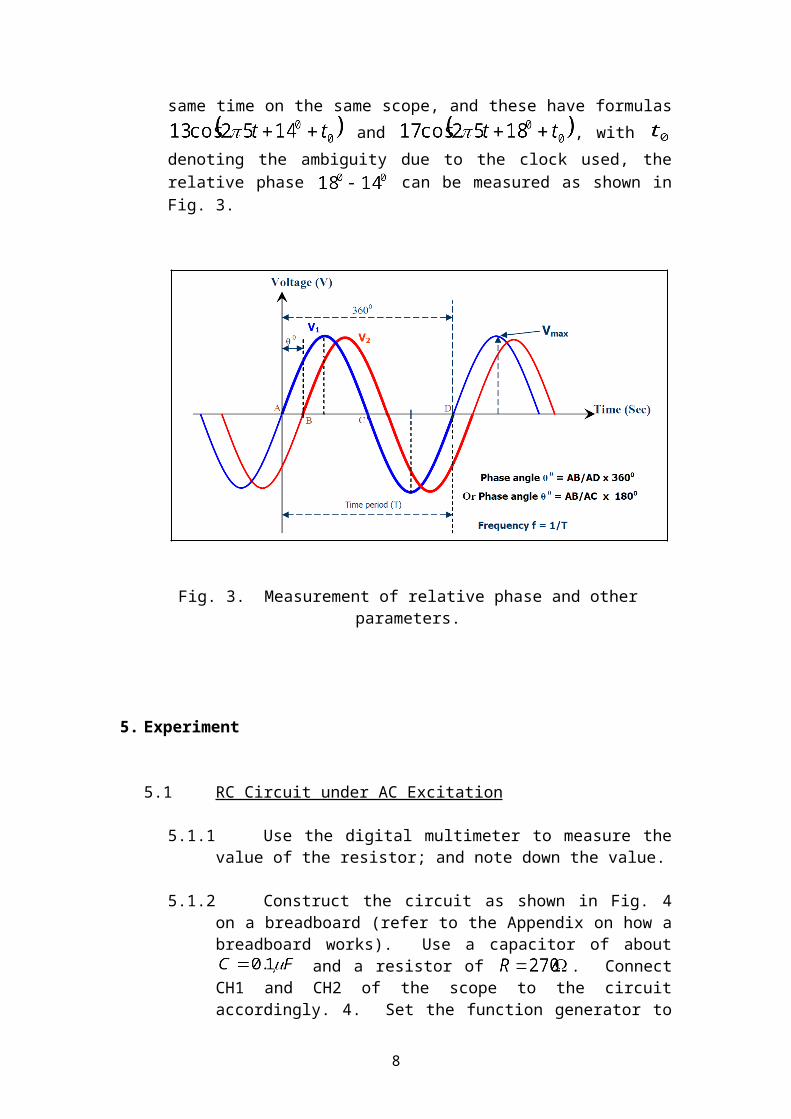
In practice, only relative phase can be measured. Thus, if we observed two voltage waveforms at the same time on the same scope, and these have
formulas and , with denoting
the ambiguity due to the clock used, the relative phase can be measured as shown in Fig. 3.
Fig. 3. Measurement of relative phase and other parameters.
5. Experiment
5.1 RC Circuit under AC Excitation
5.1.1 Use the digital multimeter to measure the value of the resistor; and note down the value.
6
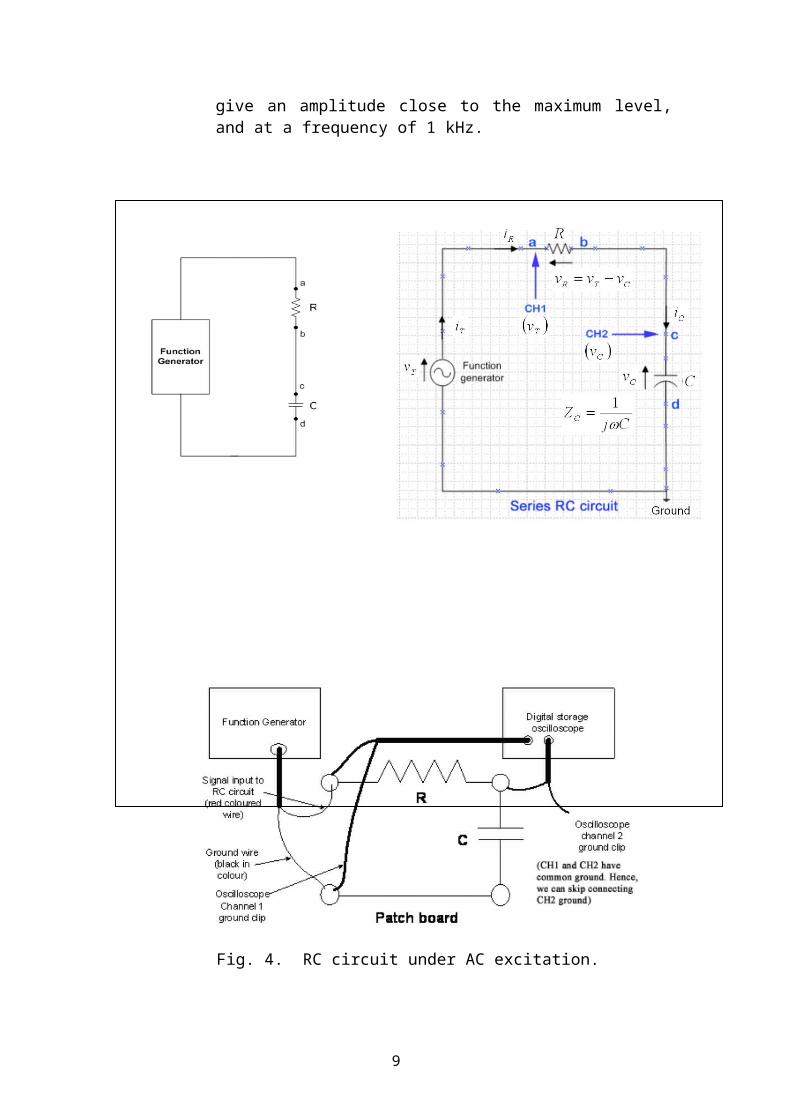
5.1.2 Construct the circuit as shown in Fig. 4 on a breadboard (refer to the Appendix on how a breadboard works). Use a capacitor of about and a resistor of . Connect CH1 and CH2 of the scope to the circuit accordingly. 4. Set the function generator to give an amplitude close to the maximum level, and at a frequency of 1 kHz.
Fig. 4. RC circuit under AC excitation.
7
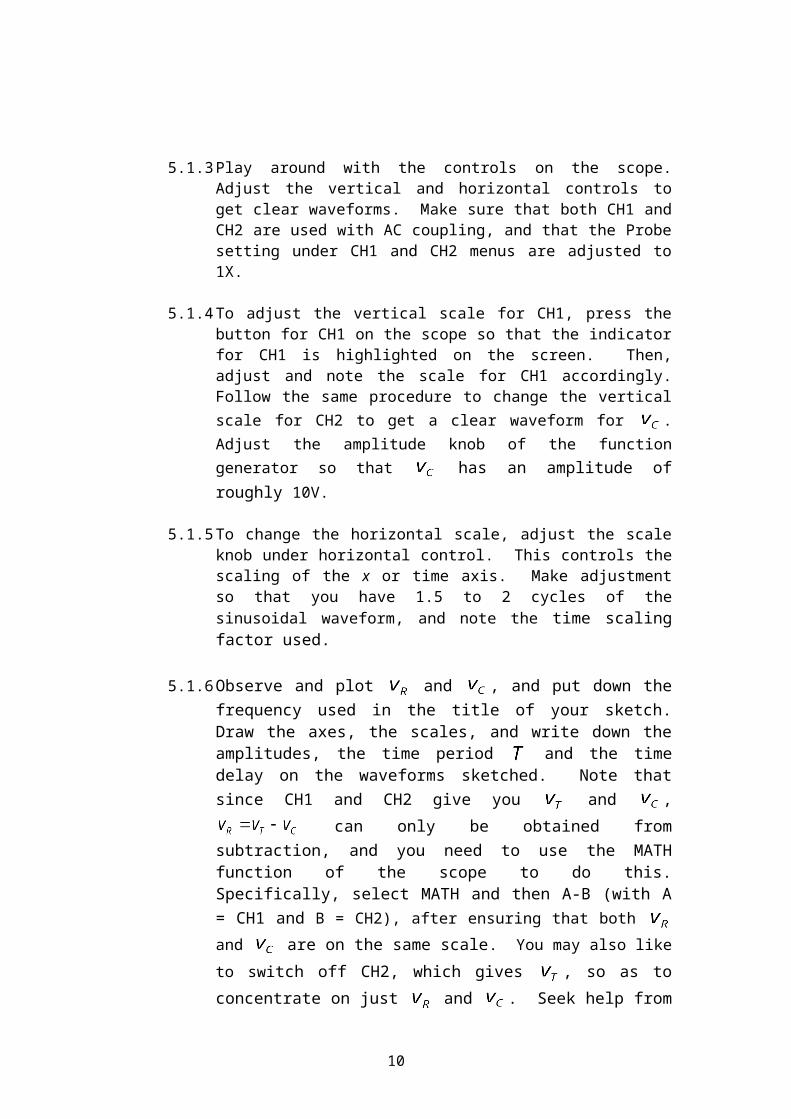
5.1.3 Play around with the controls on the scope. Adjust the vertical and horizontal controls to get clear waveforms. Make sure that both CH1 and CH2 are used with AC coupling, and that the Probe setting under CH1 and CH2 menus are adjusted to 1X.
5.1.4 To adjust the vertical scale for CH1, press the button for CH1 on the scope so that the indicator for CH1 is highlighted on the screen. Then, adjust and note the scale for CH1 accordingly. Follow the same procedure to change the vertical scale for CH2 to get a clear waveform for . Adjust the amplitude knob of the function generator so that has an amplitude of roughly 10V.
5.1.5 To change the horizontal scale, adjust the scale knob under horizontal control. This controls the scaling of the x or time axis. Make adjustment so that you have 1.5 to 2 cycles of the sinusoidal waveform, and note the time scaling factor used.
5.1.6 Observe and plot and , and put down the frequency used in the title of your sketch. Draw the axes, the scales, and write down the amplitudes, the time period and the time delay on the waveforms sketched. Note that since CH1 and CH2 give you and ,
can only be obtained from subtraction, and you need to use the MATH function of the scope to do this. Specifically, select MATH and then A-B (with A = CH1 and B = CH2), after ensuring that both and are on the same scale. You may also like to switch off CH2, which gives , so as to concentrate on just and . Seek help from the demonstrator or laboratory officer if necessary.
5.1.7 Change the frequency of the function generator to about 10 kHz and repeat the above measurement. Adjust the output amplitude of the function generator so that the amplitude of remains the same. This ensures that the amplitude of also remains the same.
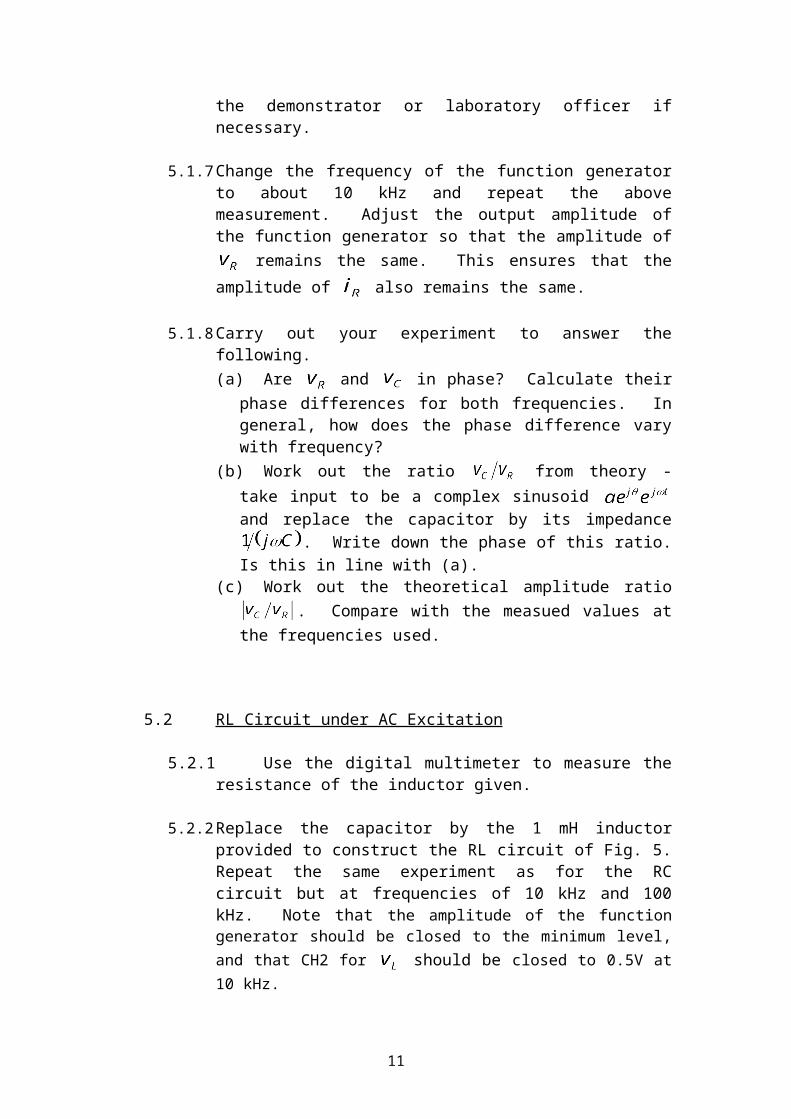
5.1.8 Carry out your experiment to answer the following. (a) Are and in phase? Calculate their phase differences for both
frequencies. In general, how does the phase difference vary with frequency?
(b) Work out the ratio from theory - take input to be a complex sinusoid and replace the capacitor by its impedance
. Write down the phase of this ratio. Is this in line with (a).
8
(c) Work out the theoretical amplitude ratio . Compare with the measued values at the frequencies used.
5.2 RL Circuit under AC Excitation
5.2.1 Use the digital multimeter to measure the resistance of the inductor given.
5.2.2 Replace the capacitor by the 1 mH inductor provided to construct the RL circuit of Fig. 5. Repeat the same experiment as for the RC circuit but at frequencies of 10 kHz and 100 kHz. Note that the amplitude of the function generator should be closed to the minimum level, and that CH2 for should be closed to 0.5V at 10 kHz.
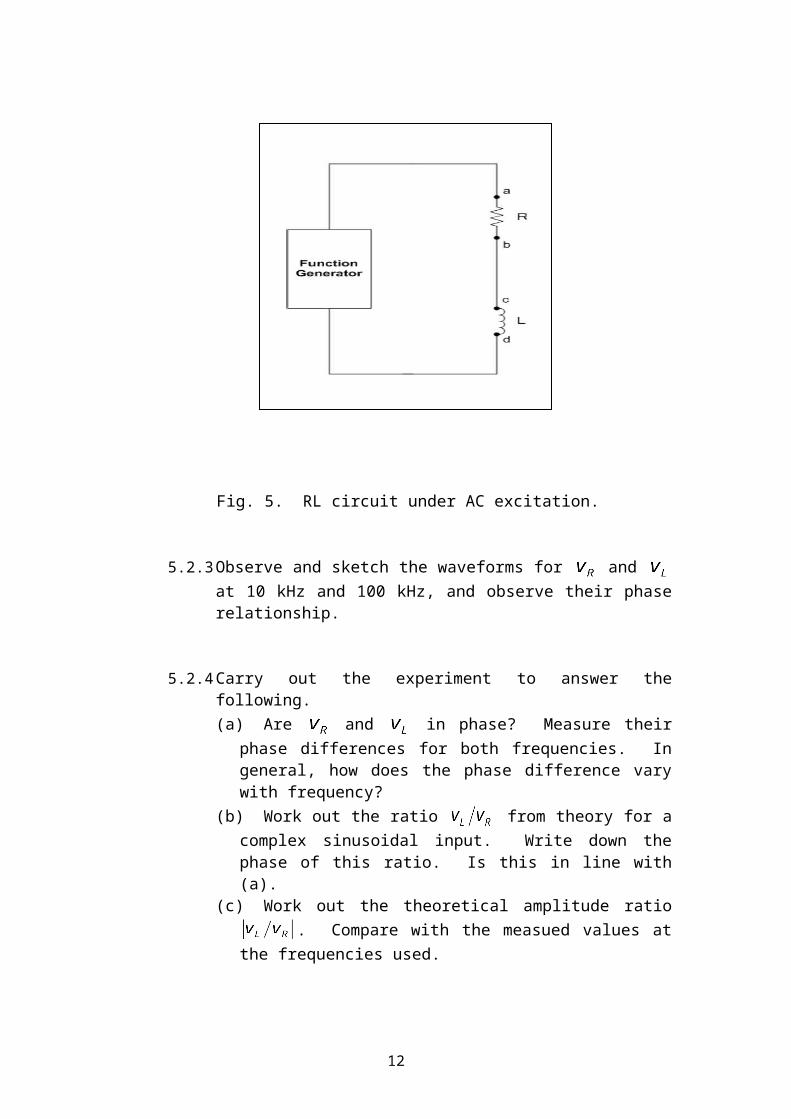
Fig. 5. RL circuit under AC excitation.
5.2.3 Observe and sketch the waveforms for and at 10 kHz and 100 kHz, and observe their phase relationship.
5.2.4 Carry out the experiment to answer the following. (a) Are and in phase? Measure their phase differences for both
frequencies. In general, how does the phase difference vary with frequency?
(b) Work out the ratio from theory for a complex sinusoidal input. Write down the phase of this ratio. Is this in line with (a).
9
(c) Work out the theoretical amplitude ratio . Compare with the measued values at the frequencies used.
5.3 RC Circuit under Periodic Square Wave Excitation
In this experiment, we try to study the transient behaviour of the RC circuit of Fig. 4 by using a periodic square wave input.
It is as if we have two dc voltage sources of different values, and these are switched into and out of the RC circuit periodically as dictated by the rising and falling edges of the periodic square waveform.
Show from Fig. 4 that the voltage across the capacitor has to satisfy and , or .
Thus, if was equal to but is suddently changed to at (equivalent to switching in a dc voltage source of to replace the original
), will be given by from solving the differential
equation. You may want to substitute this into the differential equation to see that it is satisfied.
The quantity is sometimes called the time constant of the circuit. Noting that , it is the time required for a 63.2% change in the capacitor voltage from its initially settled value to its final value.
You may use the above information in the following experiment.
5.3.1 Connect the RC circuit as shown in Fig. 4, and set the function generator to SQUARE WAVE mode.
5.3.2 Set the function generator to maximum amplitude at approximately 250 Hz. Adjust the horizontal scale of the scope so that the time constant can be measured easily and accurately. Observe and sketch . Measure the time constant, after noting down the scales used for time and voltage.
5.3.3 Change the resistor to a 1 kΩ. Repeat the experiment for the new RC combination.
5.3.4 Change the frequency to 250 Hz and 2.5 kHz. Observe the waveforms. Describe and comment on the change in waveform shapes. Does changing the frequency of the input square wave change the time constant?
10
APPENDIX Structure of Breadboard and Patching Up of a Simple Circuit
As illustrated below, the breadboard is the base structure on which prototype circuits may be constructed. Note how different points on the breadboard are connected together through connecting strips.
As an example, the contacts linked through a single strip are all connected together, and so they form a single circuit node. Top and bottom horizontal strips are mostly used for power supply connections, whereas vertical strips in the middle are mainly used for internal connections within the circuit.
Breadboard front view.
Breadboard back view showing how the strips connect the various points.
11
Breadboard schematic illustrating how the various points are connected.
12


![Diseno Sistema ion Calculo Costo Estandar Lab Oratorio Sidor CA[1]](https://img.pdfslide.net/doc/110x75/5571fb444979599169946437/diseno-sistema-ion-calculo-costo-estandar-lab-oratorio-sidor-ca1.jpg)
