Embed Size (px)
Citation preview
Convair Aerospace Report CASD-NAS-73-011
CRACK GROWTH BEHAVIOR OF 2219-T87ALUMINUM ALLOY
FROM 20 ° K (-423 ° F) TO 422 ° K (300 ° F)
CA
Prepared forNational Aeronautics and Space Administration
Lyndon B. Johnson Space CenterContract NAS9-12445
GENERAL DVNAMICSConvair Aerospace Division
https://ntrs.nasa.gov/search.jsp?R=19730023697 2018-07-13T02:13:17+00:00Z
Convair Aerospace Report CASD-NAS-73-011
CRACK GROWTH BEHAVIOR OF 2219-T87ALUMINUM ALLOY
FROM 20° K (-423° F) TO 422° K (300° F)
W.E.Witzel l
August 1973
Prepared forNational Aeronautics and Space Administration
Lyndon B. Johnson Space CenterContract IMAS9-12445
Prepared byCONVAIR AEROSPACE DIVISION OF GENERAL DYNAMICS
San Diego, California

Page Intentionally Left Blank
FOREWORD
The aluminum alloy 2219-T87 has great potential for use as a cryogenicmaterial for various manned and unmanned aerospace vehicles. Althoughits properties are generally known, toughness characteristics in variousgrain directions when the material is machined from thick plates and sub-jected to various environments have not been documented. This program,sponsored by the NASA Johnson Space Center, was designed to determinethese properties between 20°K (-423°F) and 423°K (SOOT).
Initially, the program was under the direction of S. V. Glorioso of theNASA-JSC, but the bulk of the study was directed by J. W. Smith of thatagency. Both of these gentlemen contributed generously to this program,as did R. G. Forman, also of NASA-JSC.
A number of personnel at General Dynamics Convair Aerospace partici-pated in the program including Mr. C. J. Kropp, who was involved in test-ing, data reduction, and fractography.
iii

Page Intentionally Left Blank
TABLE OF CONTENTS
Section Page
1 INTRODUCTION
1.11.21.3
FRACTURE MECHANICS .CYCLIC TESTINGSUSTAINED LOAD TESTING
2 TECHNICAL APPROACH
2.1
2.2
2.2.12.2.2
2.2.32.2.42.2.52.32.3.12.3.2
MECHANICAL PROPERTIES AND METALLO-GRAPHIC EVALUATIONFRACTURE TEST SPECIMENS ANDTECHNIQUESEdge Notch Fracture Tests, 2.54 cm (1.0 in.)Edge Notch Fracture Tests 0.318 cm (0.125 in.)MaterialPart-Through Crack TestsStiffened Panel TestsCyclic TestsDATA REDUCTIONTensile TestsFracture Tests
1-1
1-21-41-4
2-1
2-3
2-42-5
2-62-82-9
2-112-132-132-13
TEST RESULTS 3-1
3.1 MECHANICAL AND METALLOGRAPHICTESTS 3-1
3.2 FRACTURE TESTS 3-43.2.1 Cyclic Flow Growth 3-43.2.2 Plane Stress Critical Crack Intensity Factor 3-63.2.3 Double Cantilever Beam (DCB) Cyclic Tests 3-83.2.4 Double Cantilever Beam (DCB) Sustained
Load Tests 3-143.2.5 Threshold Values 3-223.2.6 Plane Strain Fracture Toughness After
Exposure 3-223.2.7 Effect of No Precracking 3-263.3 PART THROUGH CRACK (PTC) TESTS 3-283.3.1 PTC Cyclic Tests, 0.318 cm (0.125 in.)
Specimens 3-28
TABLE OF CONTENTS, Contd
Section Page
3.3.2 PTC Cyclic Tests, 2.54 cm (1.0 in.)Specimens 3-29
3.4 STIFFENED PANEL TESTS 3-31
4 CONCLUSIONS 4-1
5 REFERENCES 5-1
vi
LIST OF ILLUSTRATIONS
Figure Page
1 Specimen Location, Plate A ., 2-22 Specimen Location, Plate B , 2-23 Orientation of DCB and Compact Specimens in Rolled
Plate 2-34 Fracture Test Specimen (0.318 cm) 2-45 Double Cantilever Beam Specimen (2.54 cm) 2-46 Sustained Load Test of 0.318 cm Fracture Specimen in
Environmental Chamber 2-67 Methods of Installing Crack Opening Displacement Gages 2-78 Specimen Configuration for Surface Crack Plane Strain
Fracture Toughness and Cyclic Flaw Enlargement Tests 2-89 Stiffened Panels 2-910 Simulated Test Panel 2-1111 Graphical Representation of Cyclic Loading Sequence 2-1112 Microstructure of 2219-T87 Plate 3-313 Crack Growth Variation with AK for 2219-T87 Aluminum
in Air at 50 Percent Relative Humidity, 0.318 cm(0.125 in.) . 3-5
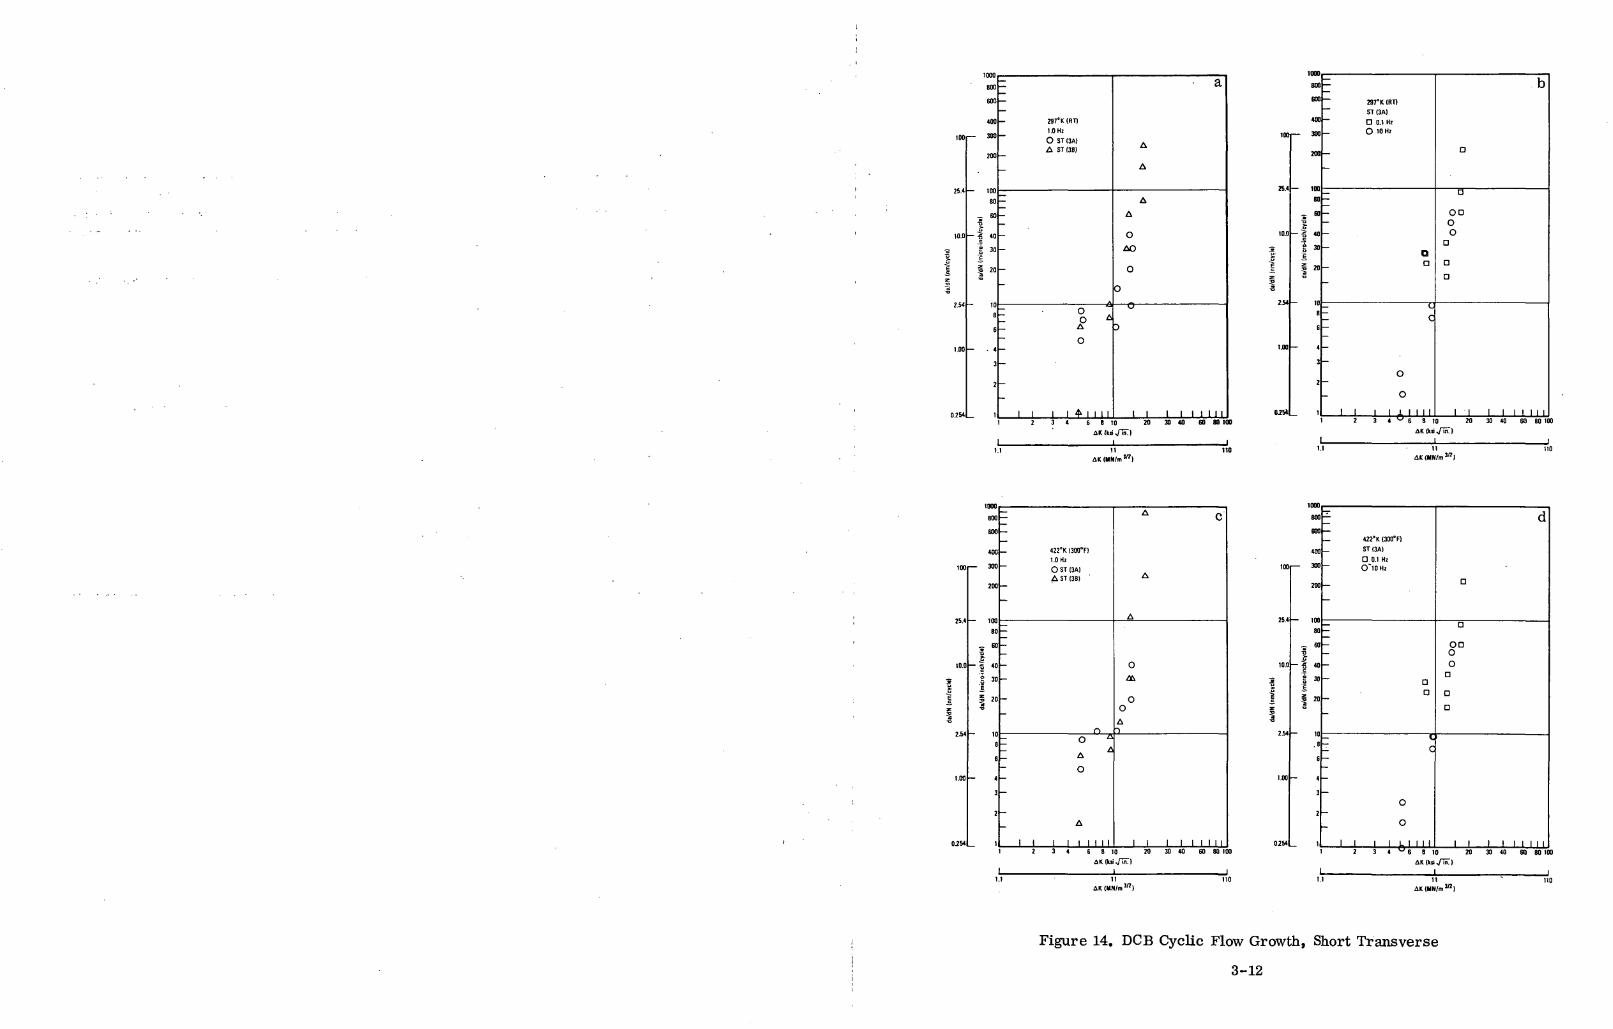
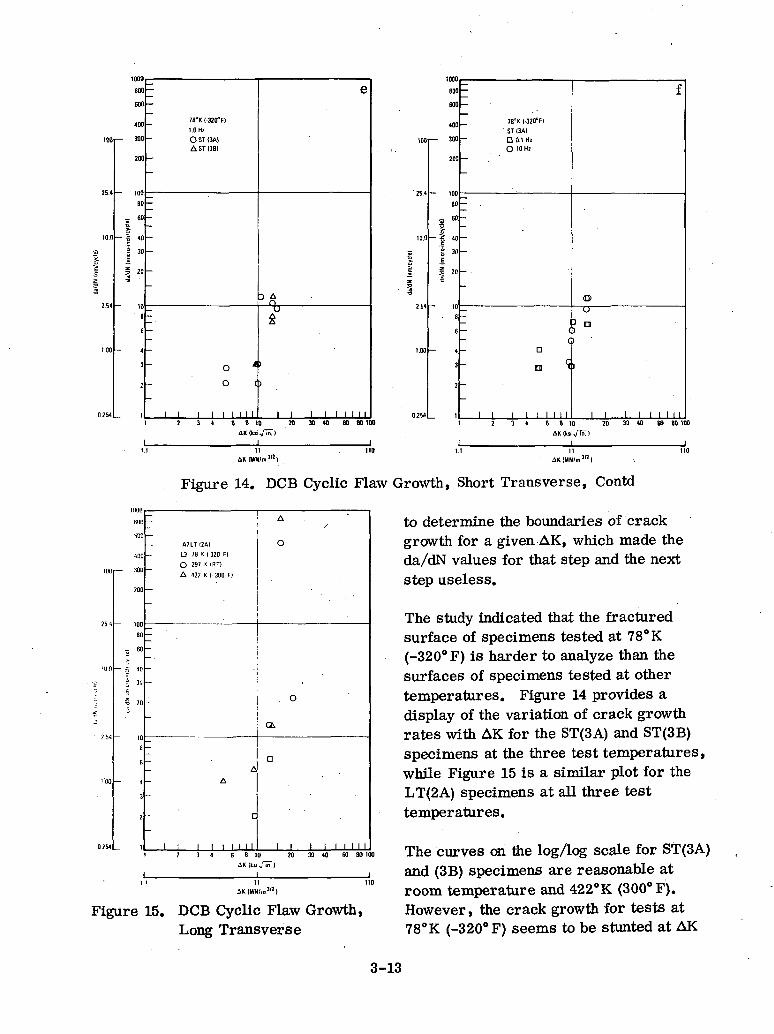
14 DCB Cyclic Flow Growth, Short Transverse 3-1215 DCB Cyclic Flaw Growth, Long Transverse 3-1316 Cracks Emanating from a Loaded Hole 3-32
LIST OF TABLES
Table Page
1 Simulated Stiffened Panel Tests 2-102 Strength of 2219-T87 Aluminum Alloy at Various
Temperatures 3-23 Plane Stress Critical Crack Intensity Factor for 2219-
T87 in Liquid Nitrogen, 0.318 cm (0.125 in.) FractureSpecimens 3-7
4 Static Kj^ Values After Cyclic or Sustained Load Expo-sure, 0.318 cm (0.125 in.) Fracture Specimens 3-7
5 Cyclic Crack Growth for 2219 Aluminum at 297°K (RoomTemperature), 2.54 cm (1.0 in.) DCB 3-9
vii
LIST OF TABLES, Contd
Page
Cyclic Crack Growth for 2219 Aluminum at 78°K (-320°F),2.54 cm (1.0 in.) DCS 3-10
7 Cyclic Crack Growth for 2219 Aluminum at 422°K (300°F),2.54 cm (1.0 in.) DCB 3-11
8 Sustained Load Tests of 2.54 cm (1.0 in.) DCB at Room' Temperature (50 Percent Relative Humidity 3-16
9 Sustained Load Tests of 2.54 cm (1.0 in.) DCB at422°K(300°F), in Air 3-17
10 Sustained Load Tests of 2.54 cm (1.0 in.) DCB in 3.5Percent Na Cl 3-18
11 Sustained Load Tests of 2.54 cm (1.0 in.) DCB at RoomTemperature in Gaseous Hydrogen 3-19
12 Sustained Load Tests of 2. 54 cm (1.0 in.) DCB at 422°K(300°F) in Gaseous Hydrogen 3-20
13 Sustained Load Test of 2.54 cm (1.0 in.) DCB at LiquidHydrogen Temperature 3-21
14 Sustained Load Thresholds for 2219-T87 Aluminum(6 hour limit) 3-23
15 Sustained Load Thresholds for 2219-T87 Aluminum(20 hour limit) 3-23
16 Apparent Plane-Strain Fracture Toughness After CyclicExposure, 2.54 cm (1.0 in.) DCB 3-24
17 Apparent Plane-Strain Fracture Toughness After Sus-tained Load Exposure, 2.54 (1.0 in.) DCB 3-25
18 Plane-Strain Fracture Toughness for 2219-T87Aluminum Using PTC Specimens 3-29
19 Cyclic Flaw Growth in 2219 Aluminum, 0.318 cm (0.125in.) PTC Specimens, R = 0.1 3-30
20 Flaw Growth for 2.54 cm (1.0 in.) PTC Tests 3-3121 Simulated Stiffened Panel Tests, 0.635 cm (0.250 in.)
Diameter Hole in 0.318 cm (0.125 in.) Thick Leg 3-3322 Simulated Stiffened Panel Tests, 0.635 cm (0.25 in.)
Diameter Hole in 1.27 cm (0.50 in.) Thick Leg 3^3423 Simulated Stiffened Panel Test, 1.27 cm (0.50 in.)
Diameter Hole in 1.27 cm (0.50 in.) Thick Leg 3-35
viii
SECTION 1
INTRODUCTION
The use of 2219-T87 aluminum alloy has been proposed as a tank material candidatefor virtually every version of the space shuttle. Characteristics of the material thatmake it an attractive candidate include good strength-to-weight ratio, good weldability,and adequate cryogenic properties. Some data indicates that the material has goodtoughness and resistance to stress corrosion cracking. However, data is not avail-able over the full range of thicknesses expected in service. Since toughness is depend-ent on thickness, this becomes of great importance.
In addition, various versions of aerospace vehicles use some sort of integrally stiff-ened structure in the biaxially loaded tank walls. Such configurations must be machinedfrom rather thick plate to account for the stiffener height, but must also be used asthe relatively thin tank wall. There has been much discussion but little substantiatingdata as to whether the toughness of a 1/8-inch-thick material, for instance, is equiv-alent to that of the same material thickness machined from a rather thick plate; e.g.,3 inches (7.6 cm). Also in dispute is the variation of toughness through the thicknessof the plate. Because of machining costs, it is assumed that the tank wall itself willbe located at the outer portion of the thick plate. However, it is prudent to determineif that location has adequate toughness or whether it is more advantageous to removethe outer skin.
Also important is the possibility that differences in grain direction may influencetoughness or flaw growth characteristics of the alloy when a rather, thick plate isused as a base material. When there is a short transverse property problem, how-ever, it is generally the result of rolling and consequently is more likely to occur inthinner materials. Unfortunately, the effect is much more difficult to measure inthinner materials by tensile and toughness specimen tests!
Advanced aerospace programs require rather long lifetimes for the vehicles involvinga variety of environments, temperatures, and exposure times. A hydrogen tank, forexample, must perform with liquid hydrogen inside even though cryogenic insulationmay keep the tank wall to temperatures well above 20°K (-423T), be exposed to ex-terior temperatures up to 422°K (300°F), and remain at rest in a sea coast atmospherefor a relatively long time. Any or all of these conditions could have an effect on thefracture characteristics of the 2219-T87 alloy.
Even if all types of fracture characteristics in different environments were known,many of the details of crack behavior in complicated stress fields would not be pre-dictable. Flaw growth characteristics of materials in the form of structural shapes
1-1
commonly used in aerospace vehicles are quite complicated. Some attempts to exam-ine flaw growth from holes and weld land areas have been made, but prediction methodshave not been verified. Despite this paucity of data, the problem of cracks growingfrom loaded holes does exist, as evidenced by some well publicized fractures of mili-tary airplane components.
During 1971, NASA MSC became interested in the behavior of 2219-T87 aluminumfor use in space shuttle tankage. One problem area with this material was noted,however: the low yield strength and lower toughness common in the weldments. Toexamine this problem, NASA proposed a program to test this material in variouswelded conditions. Convair Aerospace consequently joined a NASA/industry coopera-tive program to determine properties of weldments of 2219 as well as several otheralloys. Under the Space Shuttle Phase B program, Convair welded a number of thickplates using electron beam, TIG-MIG, and pulsed TIG methods. Initial tests by theNASA showed that improved properties could be obtained from the more sophisticatedweld techniques. (Report Number NASA TND-7377.)
Subsequently, NASA MSC awarded the current R&D contract to Convair Aerospace todetermine the toughness and flaw growth rates of the same material in the parentmetal condition at various temperatures from 20 to 422°K (-423 to 300°F).
1.1 FRACTURE MECHANICS
Eventually, the problem of brittle fracture became refined to a general basic theory.If a crack occurs in a material, and the specimen is subjected to loading causing anincrease in stress level, the crack may propagate. If the amount of energy releasedby cracking exceeds the energy required to crack the material, the crack will beself-propagating at a rapid rate until complete failure occurs.
A brittle material generally has a low threshold of energy release, causing rapid orcatastrophic propagation. Many attempts have been made to measure this energylevel by such means as the Charpy-V notch impact test or by tensile tests of edge-notched specimens. Although both methods have some utility, the most useful test isthe fracture mechanics test. This test required two measurements: 1) maximumgross stress (obtained by observation of the maximum load) and 2) critical cracklength.
The stress level around the tip of an advancing crack is governed by the stress intensityfactor (K), which is a function of the gross stress in the material and the existingcrack length. Under a loading situation when the stress intensity factor reaches thepoint that it drives the crack to rapid propagation, the resultant K factor is called"critical" and is known as fracture toughness or critical crack intensity factor (K.J.c
In fracture toughness testing of engineering materials, it is important to character-ize the elastic behavior of the material and to understand the nature of stress and
1-2
strain within the body. From elastic theory, stress at any point can be described bysix quantities. A condition of plane stress is said to exist in a thin plate loaded byforces at the boundary parallel to the plane of the plate if three of the components areequal to zero (that is, if a normal stress component and its associated shear stressesare zero). These components are considered to be zero everywhere through the thick-ness. If the plate described is very thick and axial displacement at the ends is pre-vented, the resulting condition is called plane strain.
If conditions of plane strain exist, a somewhat different approach is used. When thecrack begins to advance, the resultant redistribution of stresses may be a mixedmode of plane stress and plane strain. Since measurements or data must be obtainedbefore the transition is made, plane-strain measurements are usually known as "firstmode" or "opening mode" characteristics. The problem, then, becomes one of deter-mining the stress, stress intensity factors, and crack length associated with openingmode of cracking. The sudden re-initiation of a crack or notch is occasionally accom-panied by an audible noise that has been called "pop-in". Measurement of the stressin a specimen at this point permits determination of a close approximation of the plane-strain fracture toughness. If such a noise is not detected, the critical stress must beobtained by other means.
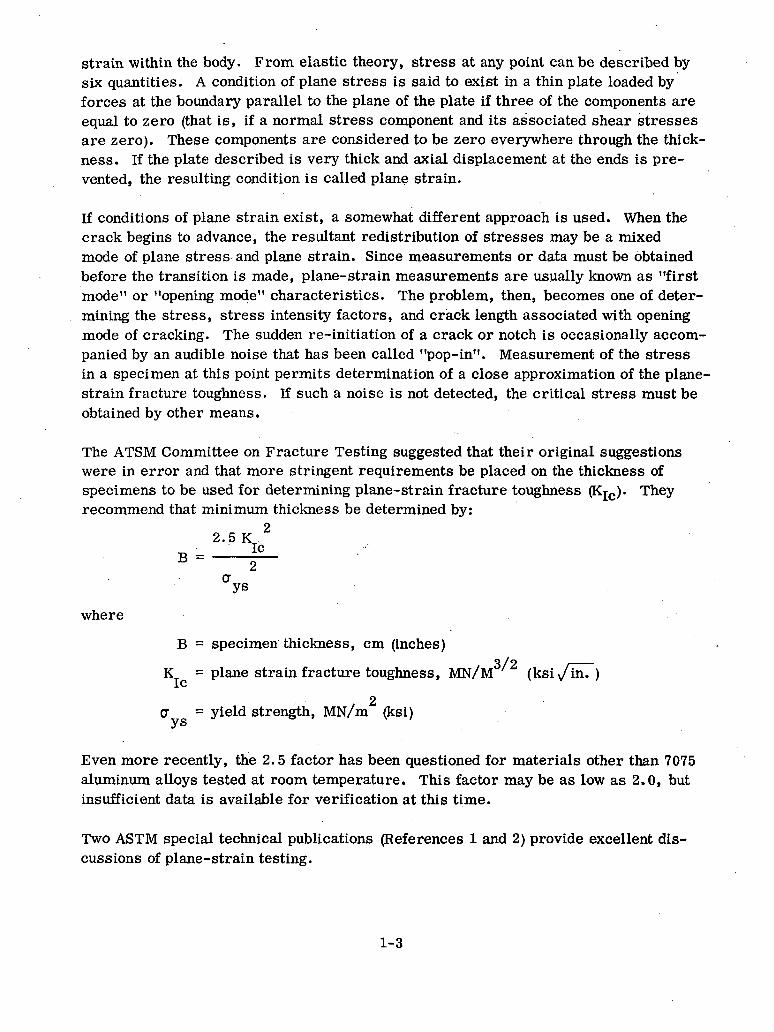
The ATSM Committee on Fracture Testing suggested that their original suggestionswere in error and that more stringent requirements be placed on the thickness ofspecimens to be used for determining plane-strain fracture toughness (Klc). Theyrecommend that minimum thickness be determined by:
2 . 5 K 2
2ffy
where
B = specimen thickness, cm (inches)3/2 iK = plane strain fracture toughness, MN/M (ksi/in. )
1C
2
ys= yield strength, MN/m (ksi)
Even more recently, the 2. 5 factor has been questioned for materials other than 7075aluminum alloys tested at room temperature. This factor may be as low as 2.0, butinsufficient data is available for verification at this time.
Two ASTM special technical publications (References 1 and 2) provide excellent dis-cussions of plane-strain testing.
1-3
Unfortunately, a great deal of the fracture testing performed to date falls in the mixed-mode category and is therefore thickness-dependent. Further, the abundance of testspecimen configurations have frequently made the data impossible to compare.
1.2 CYCLIC TESTING
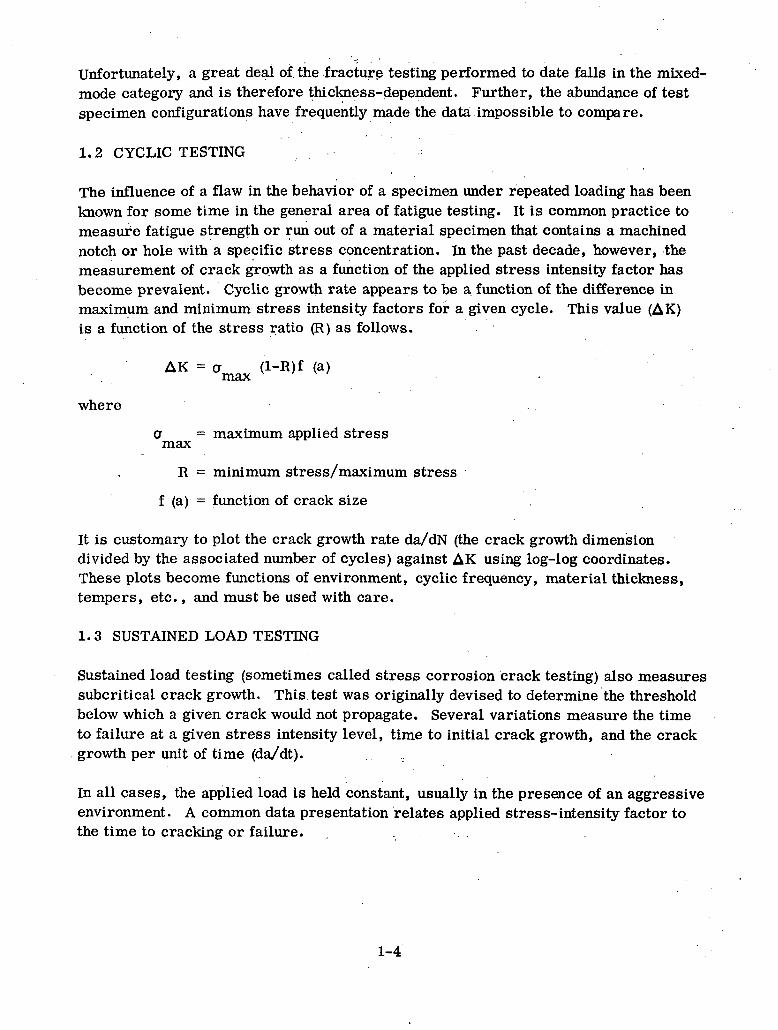
The influence of a flaw in the behavior of a specimen under repeated loading has beenknown for some time in the general area of fatigue testing. It is common practice tomeasure fatigue strength or run out of a material specimen that contains a machinednotch or hole with a specific stress concentration. In the past decade, however, themeasurement of crack growth as a function of the applied stress intensity factor hasbecome prevalent. Cyclic growth rate appears to be a function of the difference inmaximum and minimum stress intensity factors for a given cycle. This value (AK)is a function of the stress ratio (R) as follows.
AK = a (l-R)f (a)max
where
a = maximum applied stressmax
R = minimum stress/maximum stress
f (a) = function of crack size
It is customary to plot the crack growth rate da/dN (the crack growth dimensiondivided by the associated number of cycles) against AK using log-log coordinates.These plots become functions of environment, cyclic frequency, material thickness,tempers, etc., and must be used with care.
1.3 SUSTAINED LOAD TESTING
Sustained load testing (sometimes called stress corrosion crack testing) also measuressubcritical crack growth. This test was originally devised to determine the thresholdbelow which a given crack would not propagate. Several variations measure the timeto failure at a given stress intensity level, time to initial crack growth, and the crackgrowth per unit of time (da/dt). .
In all cases, the applied load is held constant, usually in the presence of an aggressiveenvironment. A common data presentation relates applied stress-intensity factor tothe time to cracking or failure. .
1-4
SECTION 2
TECHNICAL APPROACH
The objectives of this study are to:
a. Evaluate toughness and crack growth characteristics of 2219-T87 aluminumalloy plate under static, cyclic, and sustained load conditions for each principalgrain direction.
b. Determine the effect of thickness on the cyclic and sustained load flaw growthrates of 2219 aluminum tested in various environments.
c. Examine crack growth behavior in the 2219 material when the crack originatesin a loaded bolt hole.
Only one alloy was examined during this program: 2219 aluminum in the T87 temper.However, the material was obtained in 8.26 cm (3.25 in.) thick plate, which causedspecial handling problems and special problems in the location documentation of testspecimens.
The two plates provided by the NASA were about 8. 26 by 228.6 by 254 cm (3. 25 by90 by 100 in.). While property certifications were not available, it was determinedthat the material was ordered from the mill with the requirement that the mechanicalproperties be equivalent to the T87 temper of 2219.
In thick plates of this size, there is always the chance that, the required cold work(5 to 7 percent) was not obtained uniformly and the acceptable minimum propertiesare satisfactory for another temper such as T81 as well as T87.
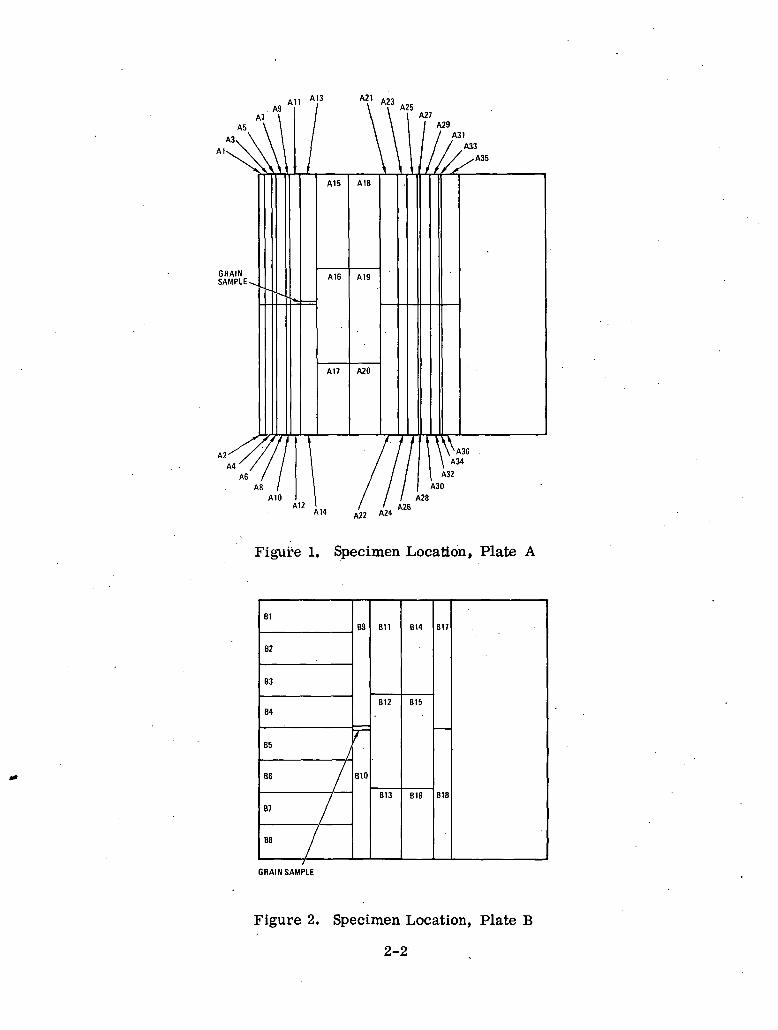
To expedite specimen fabrication, the two plates were sawed into more manageablepieces shortly after initial inspection and specimen layout. The plates were arbitrar-ily designated as Plate A and Plate B.
Two drawings were prepared to locate each type of specimen used in this program(Figures 1 and 2). Each fracture specimen carried the location number as part of itsindividual identification number. For convenience, the face of the plate containingthe layout and identification was known as the top and specimens taken from that facecarried the designation T.
2-1
A9All A13 A2I A23
A5
A3Al
GRAINSAMPLED
A2
A25A27
A4A6
A3AID
A15 AI8
A16
A17
A19
A20
A29A31
A33
A36A34
A32
A30
AI2A28
A14 A22 A24A26
Figure 1. Specimen Location, Plate A
B2
B3
84
BS
B8
B9
BIO
BU
B12
B13
BI4
B15
B16
BU
B18
GRAIN SAMPLE
Figure 2. Specimen Location, Plate B
2-2
Some typical identifications are:
a. A19-B-LT 0.38 cm (1/8 in.) part through crack specimen
1. Located in Plate A at location Al 9.
2. Cut from the bottom of the plate.
3. Direction of loading is parallel to the long-transverse grain direction.
b. All-ST (3A) - 8 2. 54 cm (1. 0 in.) DCS
2.1
1. Located in Plate A at locationAll.
2. Loaded in the short transversedirection.
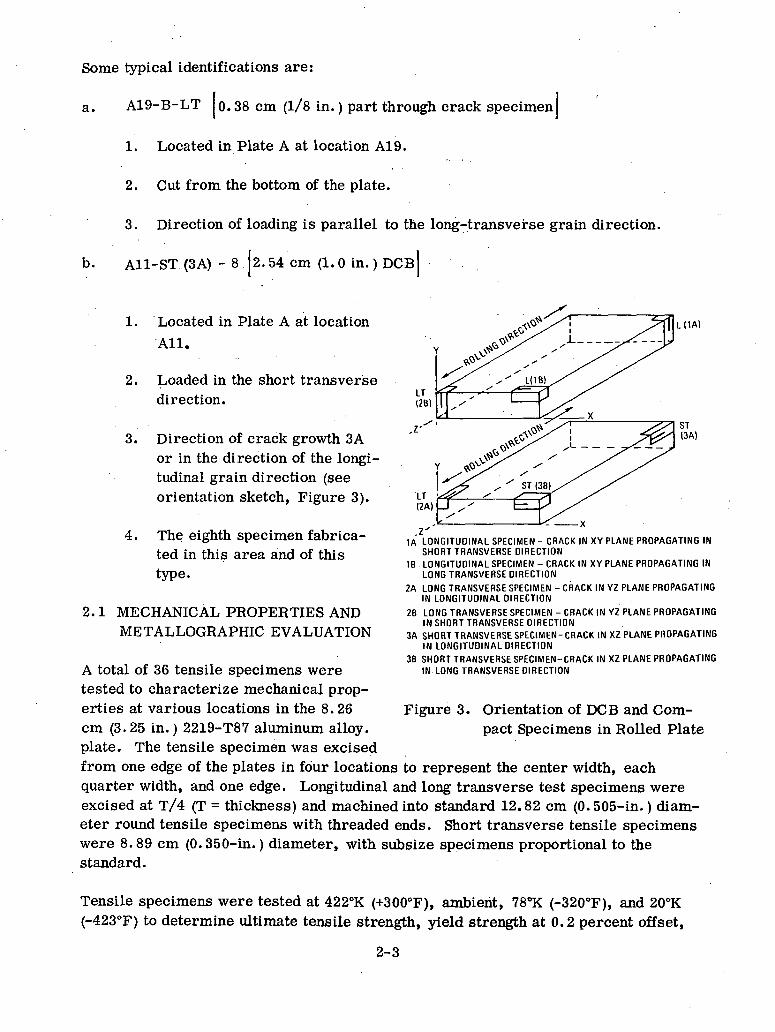
3. Direction of crack growth 3Aor in the direction of the longi-tudinal grain direction (seeorientation sketch, Figure 3).
4. The eighth specimen fabrica-ted in this area and of thistype.
MECHANICAL PROPERTIES ANDMETALLOGRAPHIC EVALUATION
LI1A)
1A LONGITUDINAL SPECIMEN - CRACK IN XY PLANE PROPAGATING INSHORT TRANSVERSE DIRECTION
IB LONGITUDINAL SPECIMEN - CRACK IN XY PLANE PROPAGATING INLONG TRANSVERSE DIRECTION
2A LONG TRANSVERSE SPECIMEN - CRACK IN YZ PLANE PROPAGATINGIN LONGITUDINAL DIRECTION
28 LONG TRANSVERSE SPECIMEN - CRACK IN YZ PLANE PROPAGATINGIN SHORT TRANSVERSE DIRECTION
3A SHORT TRANSVERSE SPECIMEN-CRACK IN XZ PLANE PROPAGATINGIN LONGITUDINAL DIRECTION
38 SHORT TRANSVERSE SPECIMEN-CRACK IN XZ PLANE PROPAGATINGIN LONG TRANSVERSE DIRECTION
Orientation of DCB and Com-pact Specimens in Rolled Plate
A total of 36 tensile specimens weretested to characterize mechanical prop-erties at various locations in the 8.26 Figure 3.cm (3. 25 in.) 2219-T87 aluminum alloy,plate. The tensile specimen was excisedfrom one edge of the plates in four locations to represent the center width, eachquarter width, and one edge. Longitudinal and long transverse test specimens wereexcised at T/4 (T = thickness) and machined into standard 12.82 cm (0.505-in.) diam-eter round tensile specimens with threaded ends. Short transverse tensile specimenswere 8.89 cm (0.350-in.) diameter, with subsize specimens proportional to thestandard.
Tensile specimens were tested at 422°K (+300°F), ambient, 78°K (-320T), and 20°K(-423°F) to determine ultimate tensile strength, yield strength at 0.2 percent offset,
2-3
elongation, and elastic modulus. Specimens were taken at various locations withinthe plate thickness and in the vicinity of the tensile specimens for metallographicmounts. The microstructure was examined, and microhardness readings as well asphotomicrographs were taken at each location.
All tensile specimens were instrumentedwith standard extensometers to deter-mine tensile yield strength and modulusof elasticity. Tests were performed inTinius Olsen test machines. Elevated-temperature tests were performed in aMissimers oven installed in an Instrontest machine. Cryogenic test specimenswere immersed in liquid nitrogen orliquid hydrogen, instrumented with cryo-extensometers, and tested at normalstrain rates in the test machines.
SPECIMEN CODELOCATION
0.125-—
2. 2 FRACTURE TEST SPECIMENSAND TECHNIQUES
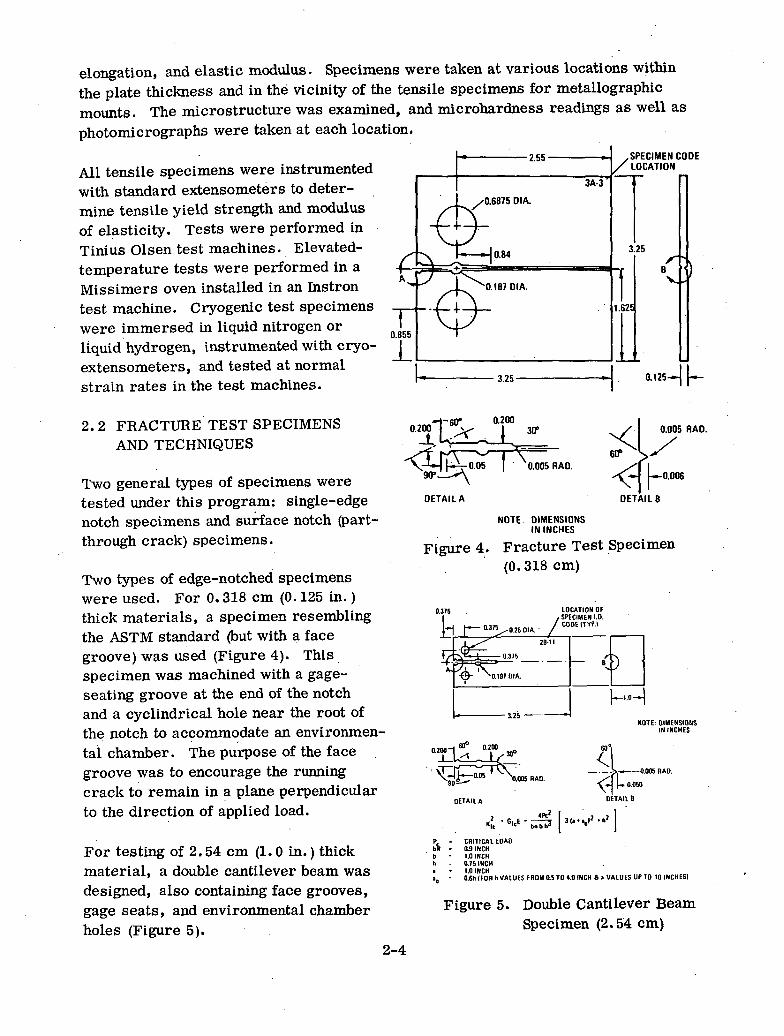
Two general types of specimens weretested under this program: single-edgenotch specimens and surface notch (part-through crack) specimens.
Two types of edge-notched specimenswere used. For 0.318 cm (0.125 in.)thick materials, a specimen resemblingthe ASTM standard (but with a facegroove) was used (Figure 4). Thisspecimen was machined with a gage-seating groove at the end of the notchand a cyclindrical hole near the root ofthe notch to accommodate an environmen-tal chamber. The purpose of the facegroove was to encourage the runningcrack to remain in a plane perpendicularto the direction of applied load.
For testing of 2.54 cm (1.0 in.) thickmaterial, a double cantilever beam wasdesigned, also containing face grooves,gage seats, and environmental chamberholes (Figure 5).
0-200
OETAILA
0.005 RAO.
NOTE DIMENSIONSIN INCHES
0.005 RAD.
0.006
DETAILS
Figure 4. Fracture Test Specimen(0.318cm)
0375
NOTE: DIMENSIONSIN INCHES
• CRITICAL LOADi • 19 INCH
1.0 INCH0.75 INCH1.0 INCH0.6h (FOR h VALUES FROM 0.5 TO 4.0 INCH & a VALUES UP TO 10 INCHES)
Figure 5. Double Cantilever BeamSpecimen (2.54 cm)
2-4
2.2.1 EDGE NOTCH FRACTURE TESTS, 2.54 cm (1.0 in.). The uniform (constantheight) double cantilever beam (DCB) specimen shown in Figure 5 was chosen overthe contoured (tapered) DCB specimens (References 3 and 4) because the uniformtype allows a more economical use of the test material. The DCB specimen selectedwas designed to be tested using external dead loading as opposed to the bolt-loadedconstant-deflection test specimen. This approach was used primarily to obtain boththreshold values and possible flaw growth rates. (The constant-deflection test isuseful in obtaining threshold values, but provides no growth data). Further, thesame type of specimen could be used in tensile, fatigue, and sustained load tests.
The slightly greater amount of material consumed per specimen, 2.54 cm (1.0 in.)by 3.81 cm (1.5 in.) compared to 2.54 by 2.54 cm, is considered negligible comparedto the increased accuracy of the test data. Pioneer programs conducted by Mostovoy,Crosley, and Ripling (Reference 4), Amateu and Steigerwald (Reference 5), Hoagland(Reference 6), and Hoagland, Bennent, and Howe (Reference 7) substantiate the meritsof using uniform DCB specimens loaded by pin grip ends.
The specimen design included side grooves for controlling the direction of crackgrowth. Experience at Convair Aerospace as well as at other locations (References4, 7,9) has shown that side grooves are advantageous not only in controlling crackgrowth direction but also in the reduction of shear lip formation, which aids in obtain-ing plain strain fracture.
The DCB specimen included a 0.475 cm (0.187 in.) diameter hole drilled in the notcharea for the specimens tested in controlled-humidity air at room temperature and inthe aqueous 3.5-percent solution of sodium chloride (Na Cl). Convair Aerospace hadconducted crack growth studies in controlled humidity and in Na Cl solution with modi-fied DCB specimens of D6ac steel, and it was felt that the same approach could beused for specimens fabricated from aluminum. A specially designed liquid containerwas attached to the DCB specimen fabricated from aluminum.
A silicone rubber plug was inserted in the 0.475 cm (0.187 in.) hole. A smaller holewas proyided in the plug for a tight fitting machine screw. The liquid container wasmade of clear plastic to allow observation and crack growth measurements. A rubberO-ring was placed in a groove machined in the plastic container to prevent leakageof the NaCl solution. The plastic containers also contained fill and drain holes sothat fresh NaCl solution was in contact with the advancing crack. A constant relativehumidity of 52 percent at 293°K (68°F) for crack growth studies was obtained with thesame liquid container described above. Glass vials containing a saturated solution ofsodium dichromate (plus excess crystals) were carefully placed in the container asshown in Figure 6, and attached to the specimen. Since the volume of air in the con-tainer was small and the rubber O-rings and plug provided a tight seal, environmentalhumidity in the container for room temperature testing was easily controlled. Smallfluctuations of temperature in the laboratory have negligible changes in the relativehumidity within the attached container.
2-5
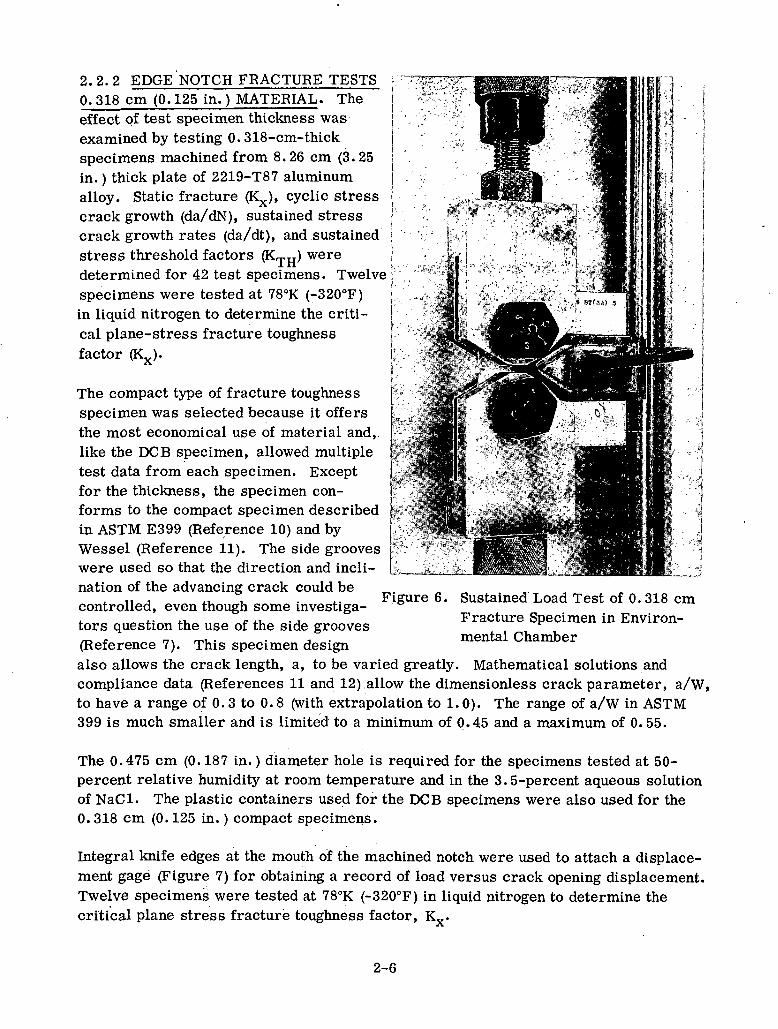
2.2.2 EDGE NOTCH FRACTURE TESTS0. 318 cm (0.125 in.) MATERIAL. Theeffect of test specimen thickness wasexamined by testing 0.318-cm-thickspecimens machined from 8.26 cm (3.25in.) thick plate of 2219-T87 aluminumalloy. Static fracture (Kx), cyclic stresscrack growth (da/dN), sustained stresscrack growth rates (da/dt), and sustainedstress threshold factors (KTH) weredetermined for 42 test specimens. Twelvespecimens were tested at 78°K (-320°F)in liquid nitrogen to determine the criti-cal plane-stress fracture toughnessfactor (Kx).
The compact type of fracture toughnessspecimen was selected because it offersthe most economical use of material and,,like the DCB specimen, allowed multipletest data from each specimen. Exceptfor the thickness, the specimen con-forms to the compact specimen describedin ASTM E399 (Reference 10) and byWessel (Reference 11). The side grooveswere used so that the direction and incli-nation of the advancing crack could becontrolled, even though some investiga-tors question the use of the side grooves(Reference 7). This specimen design
Figure 6. Sustained Load Test of 0. 318 cmFracture Specimen in Environ-mental Chamber
also allows the crack length, a, to be varied greatly. Mathematical solutions andcompliance data (References 11 and 12) allow the dimensionless crack parameter, a/W,to have a range of 0.3 to 0.8 (with extrapolation to 1.0). The range of a/W in ASTM399 is much smaller and is limited to a minimum of 0.45 and a maximum of 0. 55.
The 0.475 cm (0.187 in.) diameter hole is required for the specimens tested at 50-percent relative humidity at room temperature and in the 3.5-percent aqueous solutionof NaCl. The plastic containers used for the DCB specimens were also used for the0.318 cm (0.125 in.) compact specimens.
Integral knife edges at the mouth of the machined notch were used to attach a displace-ment gage (Figure 7) for obtaining a record of load versus crack opening displacement.Twelve specimens were tested at 78°K (-320°F) in liquid nitrogen to determine thecritical plane stress fracture toughness factor, K...
2-6
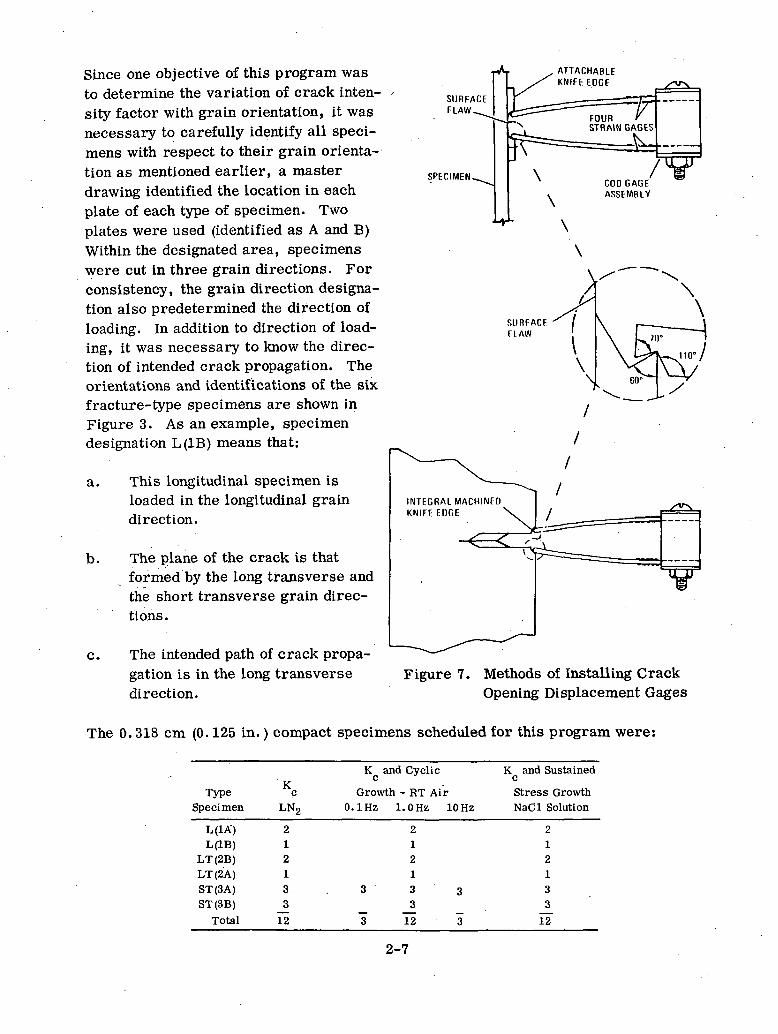
Since one objective of this program wasto determine the variation of crack inten-sity factor with grain orientation, it wasnecessary to carefully identify all speci-mens with respect to their grain orienta-tion as mentioned earlier, a masterdrawing identified the location in eachplate of each type of specimen. Twoplates were used (identified as A and B)Within the designated area, specimenswere cut in three grain directions. Forconsistency, the grain direction designa-tion also predetermined the direction ofloading. In addition to direction of load-ing, it was necessary to know the direc-tion of intended crack propagation. Theorientations and identifications of the sixfracture-type specimens are shown inFigure 3. As an example, specimendesignation L(1B) means that:
a. This longitudinal specimen isloaded in the longitudinal graindirection.
b. The plane of the crack is thatformed by the long transverse andthe short transverse grain direc-tions .
c. The intended path of crack propa-gation is in the long transversedirection.
SURFACEFLAW,^
SPECIMEN,
ATTACHABLEKNIFE EDGE
\
COD GAGEASSEMBLY
\
SURFACEFLAW
INTEGRAL MACHINEDKNIFE EDGE \ I /
Figure 7. Methods of Installing CrackOpening Displacement Gages
The 0.318 cm (0.125 in.) compact specimens scheduled for this program were:
TypeSpecimen
L(1A)L(1B)
LT(2B)LT(2A)ST(3A)ST(3B)
Total
KcLN2
212133
12
K andc
Growth •0.1 Hz 1
3
"3
Cyclic
- RT Air. 0 Hz 10 Hz
21213 33
~L2 ~3
K and SustainedcStress GrowthNaCl Solution
212133
12"
2-7
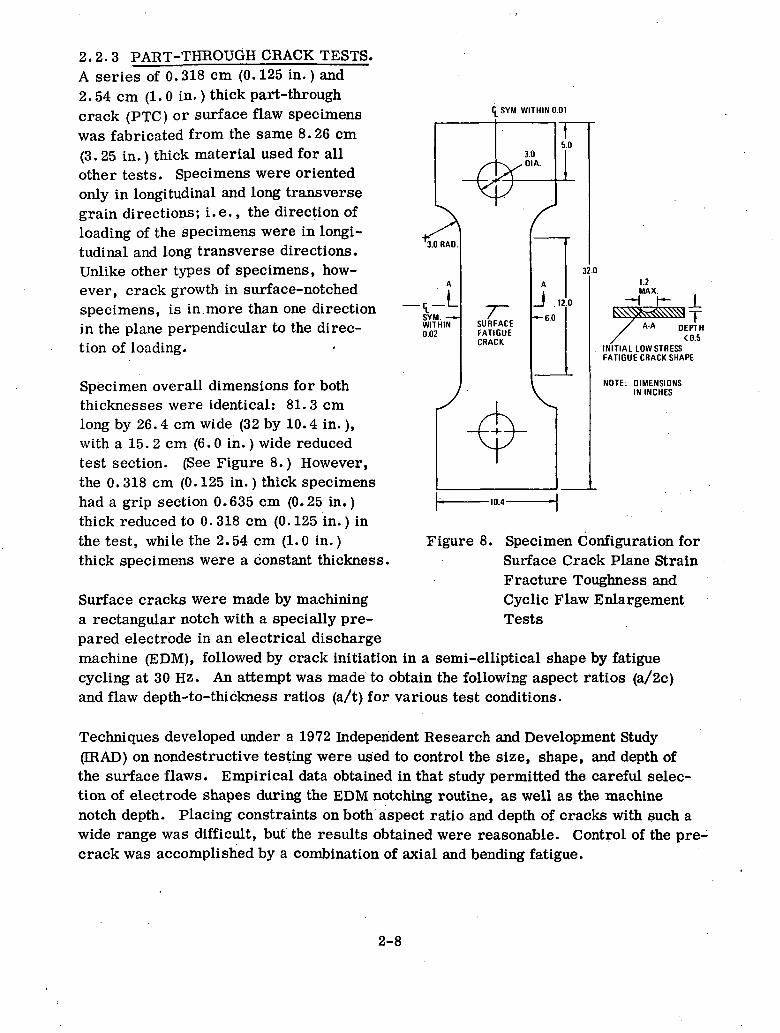
2.2.3 PART-THROUGH CRACK TESTS.A series of 0.318 cm (0.125 in.) and2.54 cm (1.0 in.) thick part-throughcrack (PTC) or surface flaw specimenswas fabricated from the same 8.26 cm(3. 25 in.) thick material used for allother tests. Specimens were orientedonly in longitudinal and long transversegrain directions; i.e., the direction ofloading of the specimens were in longi-tudinal and long transverse directions.Unlike other types of specimens, how-ever, crack growth in surface-notchedspecimens, is in more than one directionin the plane perpendicular to the direc-tion of loading.
Specimen overall dimensions for boththicknesses were identical: 81.3cmlong by 26.4 cm wide (32 by 10.4 in.),with a 15. 2 cm (6. 0 in.) wide reducedtest section. (See Figure 8.) However,the 0. 318 cm (0.125 in.) thick specimenshad a grip section 0.635 cm (0.25 in.)thick reduced to 0. 318 cm (0.125 in.) inthe test, while the 2.54 cm (1.0 in.)thick specimens were a constant thickness.
WITHIN 0.01
3.0 RAD.
SYM. -—WITHIN0.02
SURFACEFATIGUECRACK
J.
— 6.0
120
-10.4-
1.2MAX..
-H h- i
A'A DEPTH<0.5
INITIAL LOW STRESSFATIGUE CRACK SHAPE
NOTE: DIMENSIONSIN INCHES
Figure 8. Specimen Configuration forSurface Crack Plane StrainFracture Toughness andCyclic Flaw EnlargementTests
Surface cracks were made by machininga rectangular notch with a specially pre-pared electrode in an electrical dischargemachine (EDM), followed by crack initiation in a semi-elliptical shape by fatiguecycling at 30 Hz. An attempt was made to obtain the following aspect ratios (a/2c)and flaw depth-to-thickness ratios (a/t) for various test conditions.
Techniques developed under a 1972 Independent Research and Development Study(TRAD) on nondestructive testing were used to control the size, shape, and depth ofthe surface flaws. Empirical data obtained in that study permitted the careful selec-tion of electrode shapes during the EDM notching routine, as well as the machinenotch depth. Placing constraints on both aspect ratio and depth of cracks with such awide range was difficult, but the results obtained were reasonable. Control of the pre-crack was accomplished by a combination of axial and bending fatigue.
2-8
SpecimenThickness
(cm) (in. )
2.542.542.542.542.542.542.542.542.542.542.542.540.3180.3180.3180.3180.3180.3182.542.542.542.542.542.54
1.01.01.01.01.01.01.01.01.01.01.01.00.1250.1250.1250.1250.1250.1251.01.01.01.01.01.0
Orientation
L(1A)L(1A)L(1A)L(1A)L(1A)L(1A)
LT(2B)LT(2B)LT(2B)LT(2B)LT(2B)LT(2B)LT(2B) .LT(2B)LT(2B)LT(2B)LT(2B)LT(2B)LT(2B)LT(2B)LT(2B)LT(2B)LT(2B)LT(2B)
TemperatureTest (°K) . (°F)
Static 297297297
787878
297297297
787878
Cyclic 297297297
7878
.78297297297
787878
757575
-320-320-320
757575
-320-320-320
757575
-320-320-320
757575
-320-320-320
a/2c
0.250.400.500.250.400.500.250.400.500.250.400.500.100.250.400.100.250.400.100.250.400.100.250.40
a/t
0.250.400.500.250.400.500.250.400.500.250.400.500.100.250.400.100.250.400.100.25.0.400.100.250.40
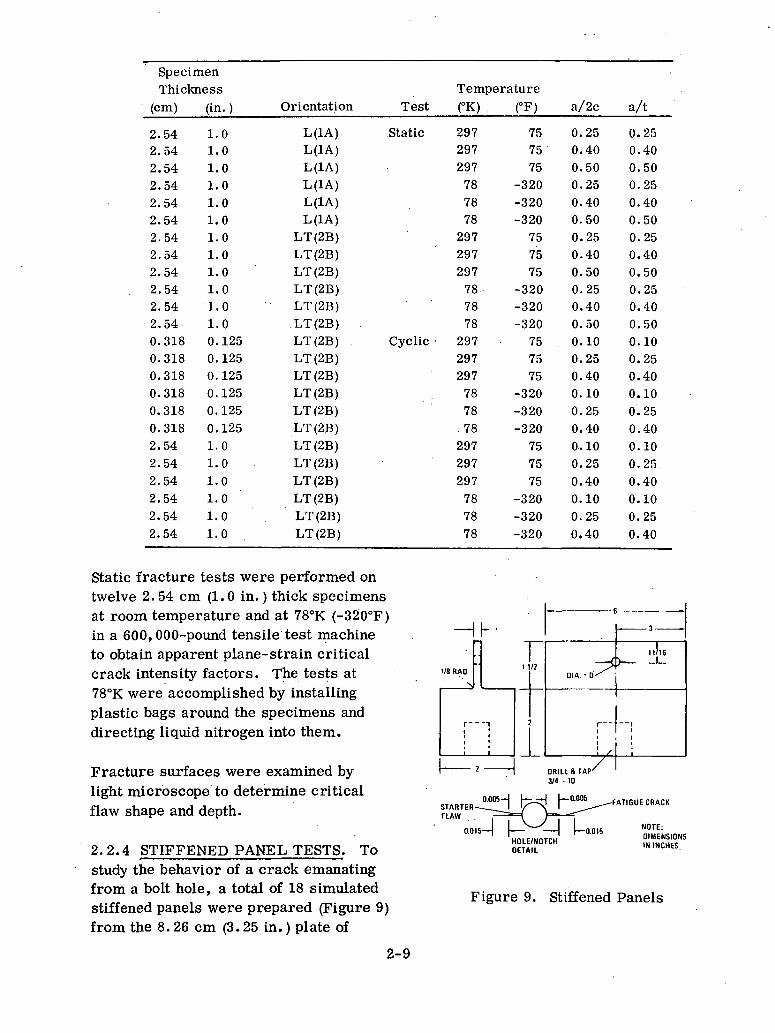
Static fracture tests were performed ontwelve 2. 54 cm (1.0 in.) thick specimensat room temperature and at 78°K (-320T)in a 600,000-pound tensile test machineto obtain apparent plane-strain criticalcrack intensity factors. The tests at78°K were accomplished by installingplastic bags around the specimens anddirecting liquid nitrogen into them.
Fracture surfaces were examined bylight microscope to determine criticalflaw shape and depth.
2.2.4 STIFFENED PANEL TESTS. Tostudy the behavior of a crack emanatingfrom a bolt hole, a total of 18 simulatedstiffened panels were prepared (Figure 9)from the 8.26 cm (3.25 in.) plate of
STARTERFLAW
0.015
Figure 9. Stiffened Panels
2-9
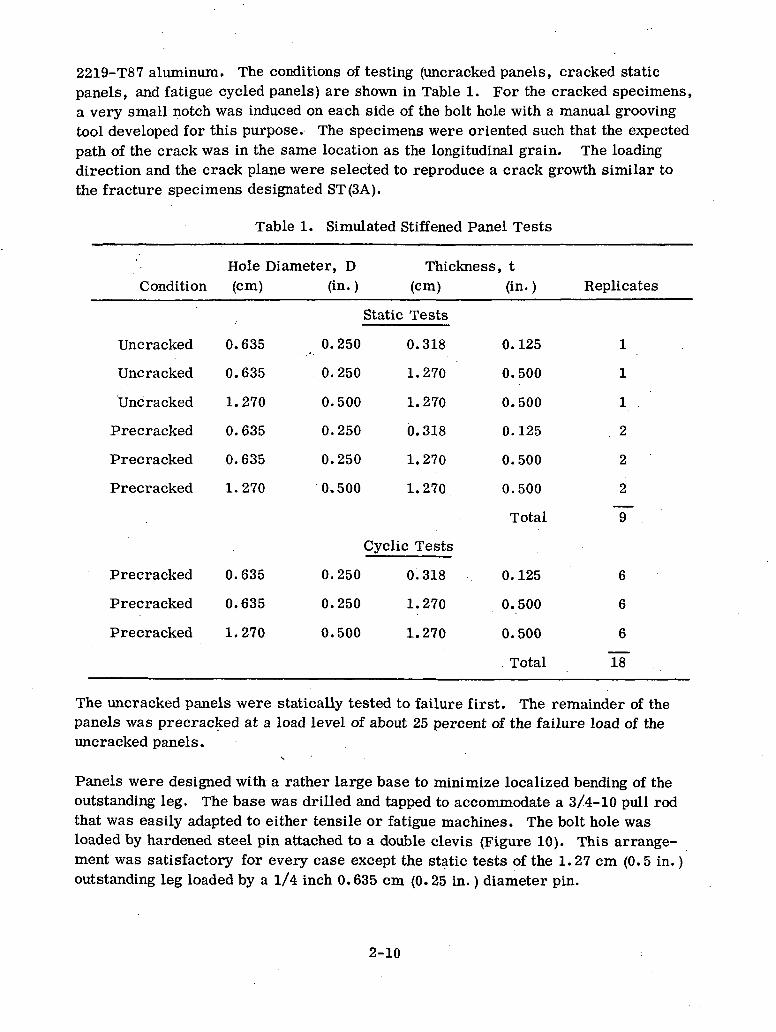
2219-T87 aluminum. The conditions of testing (uncracked panels, cracked staticpanels, and fatigue cycled panels) are shown in Table 1. For the cracked specimens,a very small notch was induced on each side of the bolt hole with a manual groovingtool developed for this purpose. The specimens were oriented such that the expectedpath of the crack was in the same location as the longitudinal grain. The loadingdirection and the crack plane were selected to reproduce a crack growth similar tothe fracture specimens designated ST(3A).
Table 1. Simulated Stiffened Panel Tests
Condition
Uncracked
Uncracked
Uncracked
Precracked
Prec racked
Precracked
Precracked
Precracked
Precracked
Hole Diameter, D(cm) (in. )
0.635
0.635
1.270
0.635
0.635
1.270
0.635
0.635
1.270
0.250
0.250
0.500
0.250
0.250
0.500
0.250
0.250
0.500
Thickness, t(cm) (in. )
Static Tests
0.318
1.270
1.270
0.318
1.270
1.270
Cyclic Tests
0.318
1.270
1.270
0.125
0.500
0.500
0.125
0.500
0.500
Total
0. 125
0.500
0.500
, Total
Replicates
1
1
1
2
2
2
~9~
6
6
6
Is"
The uncracked panels were statically tested to failure first. The remainder of thepanels was precracked at a load level of about 25 percent of the failure load of theuncracked panels.
\
Panels were designed with a rather large base to minimize localized bending of theoutstanding leg. The base was drilled and tapped to accommodate a 3/4-10 pull rodthat was easily adapted to either tensile or fatigue machines. The bolt hole wasloaded by hardened steel pin attached to a double clevis (Figure 10). This arrange-ment was satisfactory for every case except the static tests of the 1.27 cm (0.5 in.)outstanding leg loaded by a 1/4 inch 0.635 cm (Q. 25 in.) diameter pin.
2-10
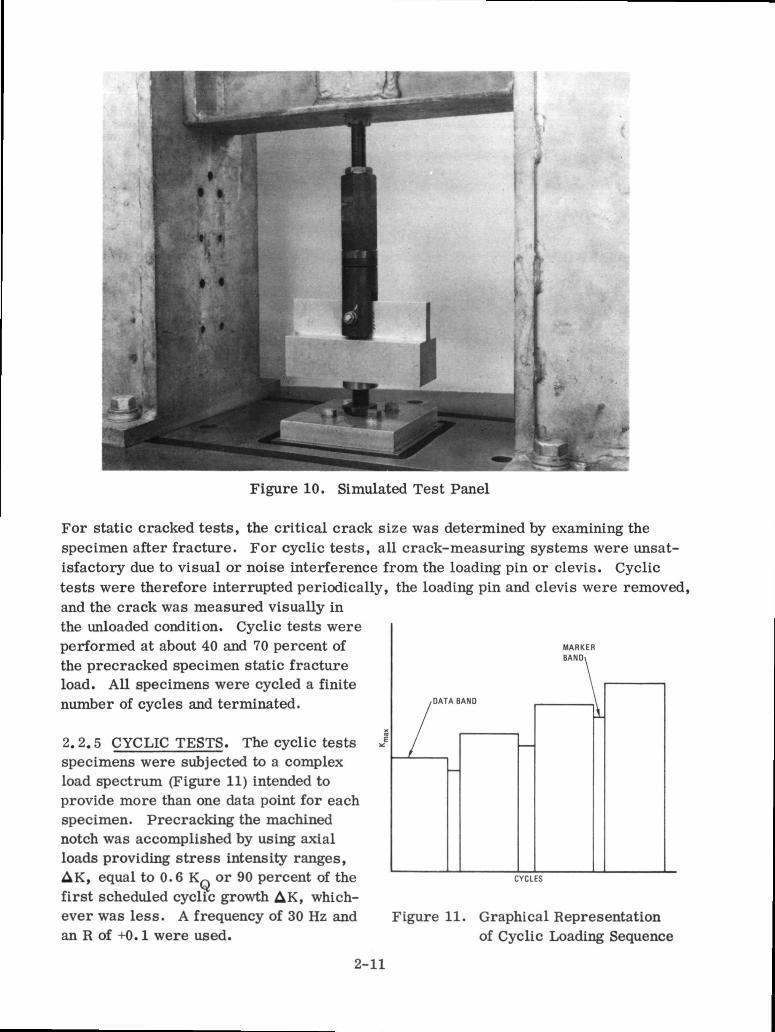
Figure 10. Simulated Test Panel
For static cracked tests, the critical crack size was determined by examining thespecimen after fracture. For cyclic tests, all crack-measuring systems were unsat-isfactory due to visual or noise interference from the loading pin or clevis. Cyclictests were therefore interrupted periodically, the loading pin and clevis were removed,and the crack was measured visually inthe unloaded condition. Cyclic tests wereperformed at about 40 and 70 percent ofthe precracked specimen static fractureload. All specimens were cycled a finitenumber of cycles and terminated.
2.2.5 CYCLIC TESTS. The cyclic testsspecimens were subjected to a complexload spectrum (Figure 11) intended toprovide more than one data point for eachspecimen. Precracking the machinednotch was accomplished by using axialloads providing stress intensity ranges,AK, equal to 0.6 KQ or 90 percent of thefirst scheduled cyclic growth AK, which-ever was less. A frequency of 30 Hz andan R of +0.1 were used.
MARKERBANOv
/DATA BAND
CYCLES
Figure 11. Graphical Representationof Cyclic Loading Sequence
2-11
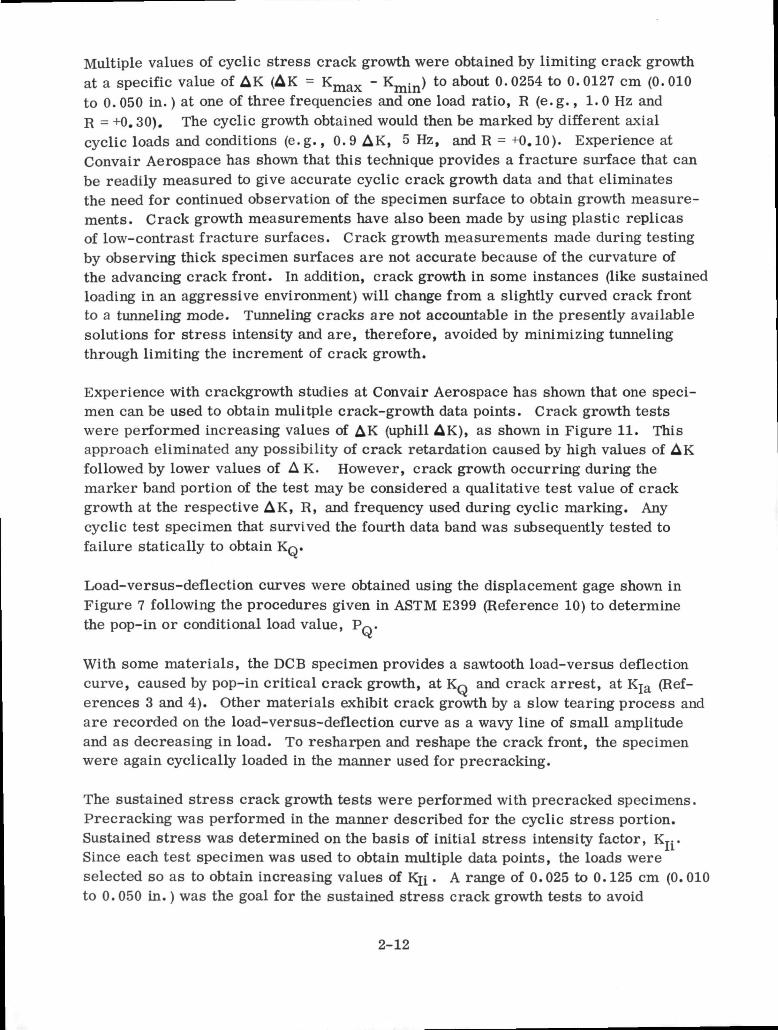
Multiple values of cyclic stress crack growth were obtained by limiting crack growthat a specific value of AK (AK = Kmax - Kmin) to about 0.0254 to 0.0127 cm (0.010to 0. 050 in.) at one of three frequencies and one load ratio, R (e.g., 1. 0 Hz andR = +0.30). The cyclic growth obtained would then be marked by different axialcyclic loads and conditions (e.g., 0.9 AK, 5 Hz, and R = +0.10). Experience atConvair Aerospace has shown that this technique provides a fracture surface that canbe readily measured to give accurate cyclic crack growth data and that eliminatesthe need for continued observation of the specimen surface to obtain growth measure-ments. Crack growth measurements have also been made by using plastic replicasof low-contrast fracture surfaces. Crack growth measurements made during testingby observing thick specimen surfaces are not accurate because of the curvature ofthe advancing crack front. In addition, crack growth in some instances (like sustainedloading in an aggressive environment) will change from a slightly curved crack frontto a tunneling mode. Tunneling cracks are not accountable in the presently availablesolutions for stress intensity and are, therefore, avoided by minimizing tunnelingthrough limiting the increment of crack growth.
Experience with crackgrowth studies at Convair Aerospace has shown that one speci-men can be used to obtain mulitple crack-growth data points. Crack growth testswere performed increasing values of AK (uphill AK), as shown in Figure 11. Thisapproach eliminated any possibility of crack retardation caused by high values of AKfollowed by lower values of A K. However, crack growth occurring during themarker band portion of the test may be considered a qualitative test value of crackgrowth at the respective AK, R, and frequency used during cyclic marking. Anycyclic test specimen that survived the fourth data band was subsequently tested tofailure statically to obtain KQ.
Load-versus-deflection curves were obtained using the displacement gage shown inFigure 7 following the procedures given in ASTM E399 (Reference 10) to determinethe pop-in or conditional load value, PQ.
With some materials, the DCB specimen provides a sawtooth load-versus deflectioncurve, caused by pop-in critical crack growth, at KQ and crack arrest, at KIa (Ref-erences 3 and 4). Other materials exhibit crack growth by a slow tearing process andare recorded on the load-versus-deflection curve as a wavy line of small amplitudeand as decreasing in load. To resharpen and reshape the crack front, the specimenwere again cyclically loaded in the manner used for precracking.
The sustained stress crack growth tests were performed with precracked specimens.Precracking was performed in the manner described for the cyclic stress portion.Sustained stress was determined on the basis of initial stress intensity factor, K^.Since each test specimen was used to obtain multiple data points, the loads wereselected so as to obtain increasing values of KH . A range of 0.025 to 0.125 cm (0. 010to 0.050 in.) was the goal for the sustained stress crack growth tests to avoid
2-12
tunneling of cracks. Studies in sustained load crack growth by Kropp (Reference 13)and others have shown that tunneling cracks can become large in short periods of time.However, additional axial cyclic loading will flatten the advancing crack front.
2.3 DATA REDUCTION
2.3.1 TENSILE TESTS. Data obtained in tensile testing was derived from stress/strain curves and physical measurements of the test specimens. Elongation $>) wasobtained over a 5.1 cm (2.0 in.) gage length for longitudinal and long transversespecimens and over a 3. 8 cm (1.5 in. ) gage length for short transverse specimens.Tensile yield strength was obtained using the 0.2-percent offset method. Strengthand modulus values were obtained by dividing the appropriate load by the pretestspecimen dimensions.
2.3.2 FRACTURE TESTS. Calculations for fracture values were obtained usingexisting formulas with some slight modifications. Compliance gages were attachedto the integral knife edges of the compact and DCB specimens. Plots of load variationwith compliance gage output were recorded either on the drum of the tensile machineor by external X-Y recorders.
Crack growth of 0.318 cm (0.125 in.) thick specimens was measured visually withstainless steel scales and stereomicroscopes. Flaw growth on 2.54 cm (1.0 in.)thick specimens were determined after fracture with stereomicroscopes aided bypolarized light in a manner described by ASTM Standard E399. Critical flaw sizeand shapes for part-through crack specimens were similarly measured after fracture.
2.3.2.1 Compact and Double Cantilever Beam Specimens
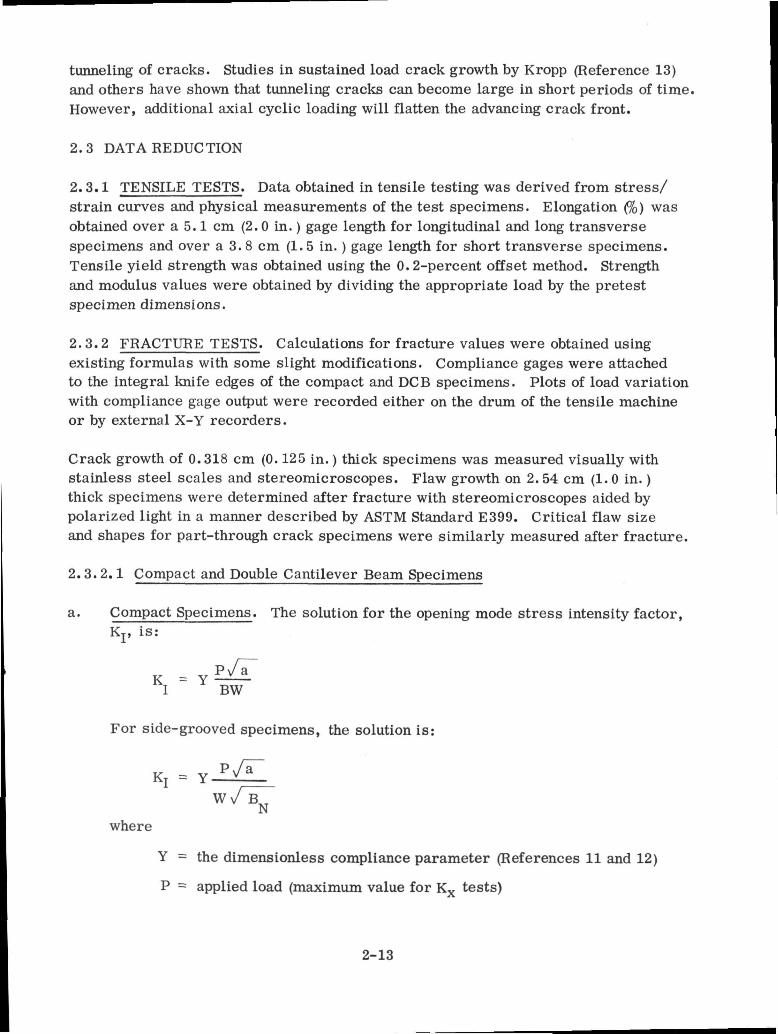
a. Compact Specimens. The solution for the opening mode stress intensity factor,K is:
For side-grooved specimens, the solution is:
where
Y = the dimensionless compliance parameter (References 11 and 12)
P = applied load (maximum value for Kx tests)
2-13
a = crack length measured from centerline of loading pin holes
W = specimen width measured from centerline of loading pin holes toback surface of specimen
B = specimen thickness
B = net or notch thickness equal to 0.9BN
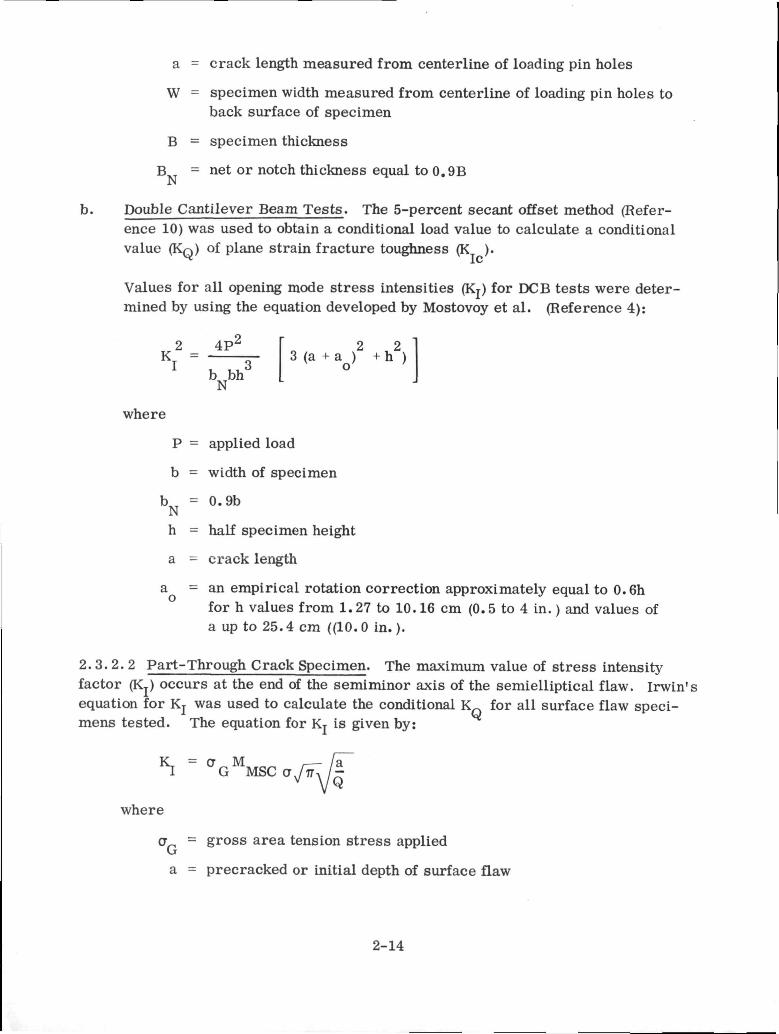
b. Double Cantilever Beam Tests. The 5-percent secant offset method (Refer-ence 10) was used to obtain a conditional load value to calculate a conditionalvalue (KQ) of plane strain fracture toughness (K ).
Values for all opening mode stress intensities (Kj) for DCB tests were deter-mined by using the equation developed by Mostovoy et al. (Reference 4):
2 4P2 2 2Ki = bNbh
where
P = applied load
b = width of specimen
b7 - 0.9bNh = half specimen height
a = crack length
a = an empirical rotation correction approximately equal to 0.6hfor h values from 1. 27 to 10. 16 cm (0. 5 to 4 in. ) and values ofa up to 25.4 cm ((10.0 in. ).
2.3.2.2 Part-Through Crack Specimen. The maximum value of stress intensityfactor (Kj) occurs at the end of the semiminor axis of the semielliptical flaw. Irwin'sequation for Kj was used to calculate the conditional KQ for all surface flaw speci-mens tested. The equation for Kj is given by:
where
a = gross area tension stress applied
a = precracked or initial depth of surface flaw
2-14
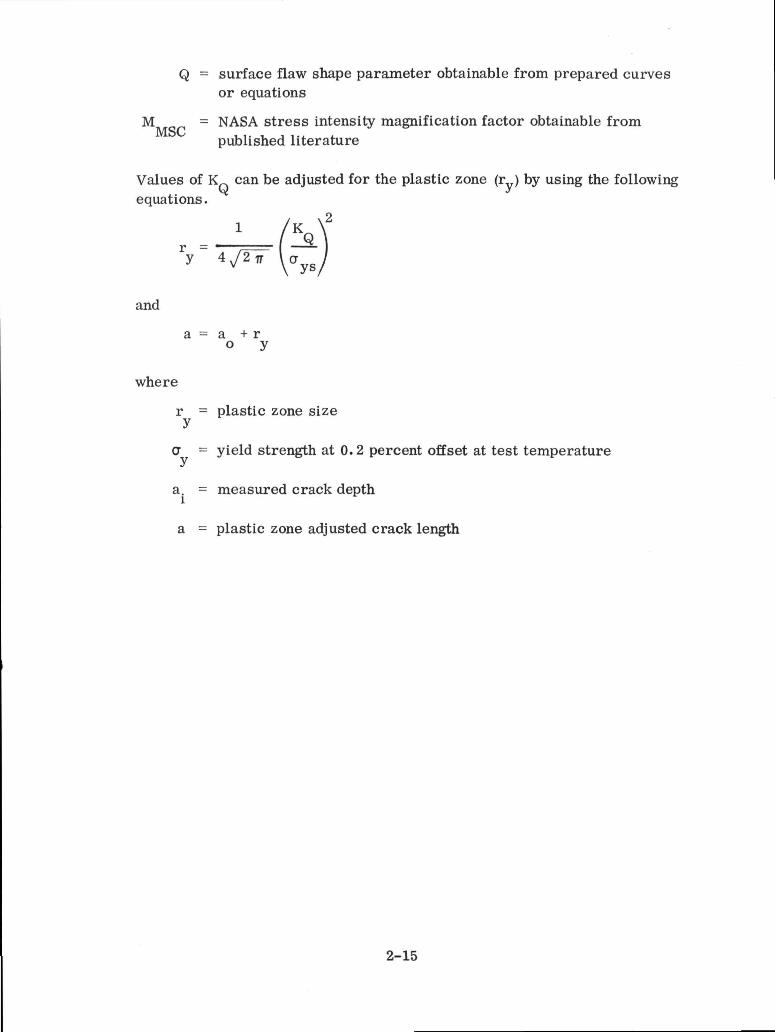
Q - surface flaw shape parameter obtainable from prepared curvesor equations
M = NASA stress intensity magnification factor obtainable frompublished literature
Values of K~ can be adjusted for the plastic zone (r ) by using the followingy yequations.
and
a = a + ro y
where
r = plastic zone sizey
a = yield strength at 0.2 percent offset at test temperature*/
a. = measured crack depth
a - plastic zone adjusted crack length
2-15
SECTION 3
TEST RESULTS
3. 1 MECHANICAL AND METALLOGRAPfflC TESTS
Results of tensile testing are shown in Table 2 for 297°K (75° F), 422°K (300° FO, 78° K(-320° F) and 20° K (-423° F). The location in the two plates (A or B) from which thetensile specimens were machined as shown, along with the location through the thick-ness. In all cases for a single location (for example, location A-14), the tensile speci-mens were excised from a single piece of material sawed from that location in thatplate. In general, the tensile test specimen location was between two areas of fracturetest specimen locations. Strength values of the material at room temperature 214°K(75°F) exceed minimum specification for 2219-T87 aluminum in the 8.26 cm (3.25 in.)thickness.
There is very little difference between grain orientations as far as ultimate tensilestrength is concerned. In fact, the only significant difference in the material at roomtemperature occurs in elongation and reduction in area, where the short transversegrain direction shows considerably lower reduction in area and somewhat lower elonga-tion. Although some of the lower elongation may be attributed to a smaller gage length,these low values hint at the possibility of embrittlement in that grain direction.
As expected, the strength of the alloy at 422°K (300° F) was lower than at room temper-ature, but at lower temperatures the tensile strengths showed a significant increase.In general, elongation did not show a decrease with a decrease in temperature, indicat-ing that this alloy may be tough at those temperatures. On the other hand, the shorttransverse specimens had a tendency to fail in the threaded grip sections, suggestingnotch sensitivity or embrittlement at 78°K (-320°F) and 20°K (-423°F).
Except at room temperature, the modulus of elasticity values were quite erratic. Insome cases, stress/strain curves were so inconsistent that it was impossible to obtainmodulus values using normal graphic techniques.
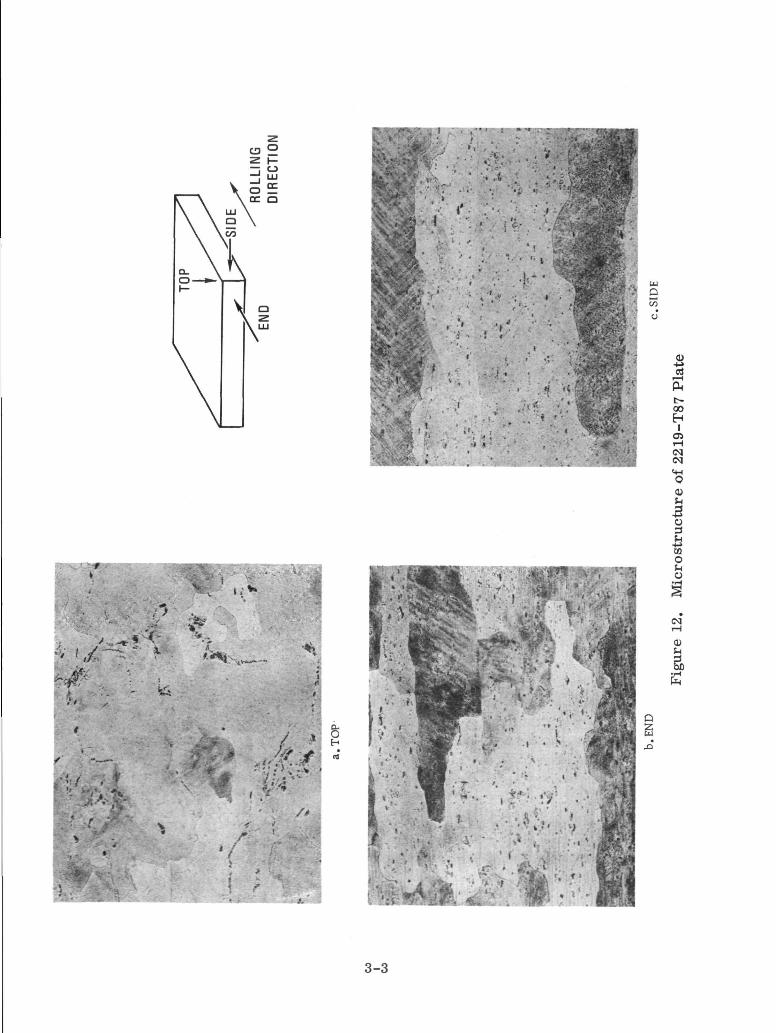
Metallographic samples were taken from each plate and examined. The structure isshown in Figure 12, which indicates that the plate grains are equiaxed on the surfacebut shortened in the thickness direction. The structure resembles a forging where theeffect of the working is to decrease the thickness with no strong planer directionality.
Knoop hardness tests were run on specimens from each of the faces. The equivalentRockwell B hardness values averaged 74.5 to 76.5, with the top surface exibiting thelowest hardness.
3-1
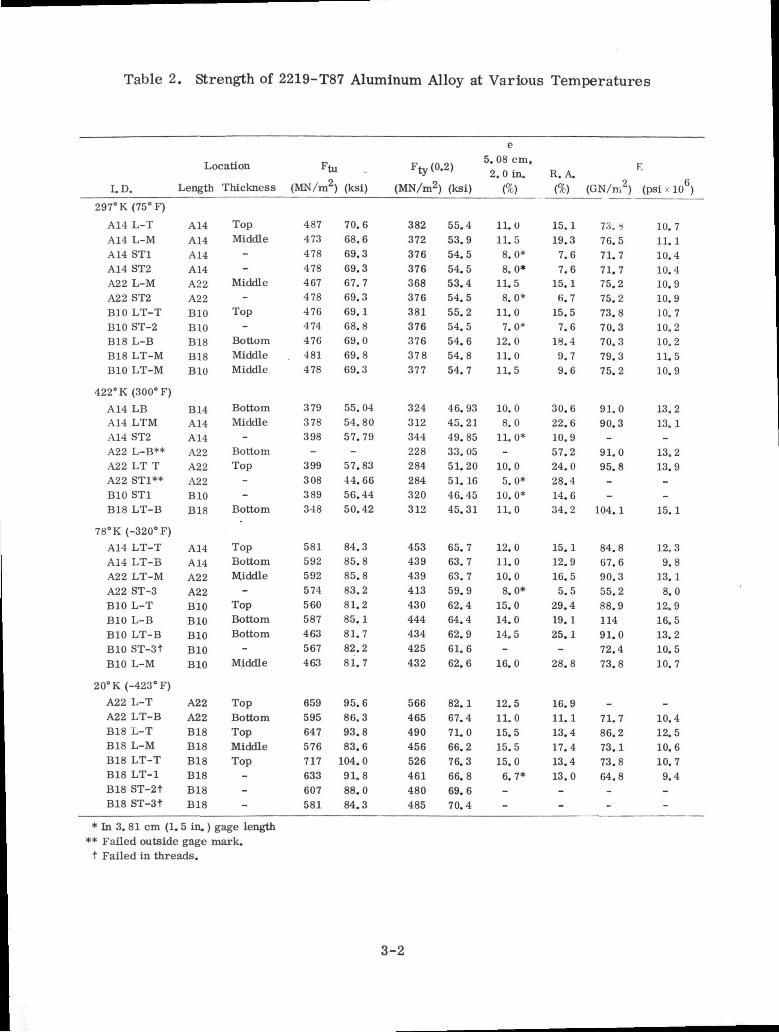
Table 2. Strength of 2219-T87 Aluminum Alloy at Various Temperatures
I. D
297° K
A14
A14A 14A14A22A22BIOBIOB18B18BIO
422° K
A 14A 14A14A22A22A22BIOB18
Location
Length Thickness
(75° F)L-TL-MST1ST2L-MST2LT-TST-2L-BLT-MLT-M
(300° F)
LBLTMST2L-B**LT TST1**ST1LT-B
A 14
A14A14A14A22A22BIOBIOB18B18BIO
B14A14A 14A22A22A22BIOB18
TopMiddle
--
Middle-
Top-
BottomMiddleMiddle
BottomMiddle
-BottomTop--
Bottom
Ftu
(MN/m2) (ksi)
487473478478467478476474476481478
379378398-
399
308389348
70.668.669.369.367.769.369.168.869.069.869.3
55.0454.8057.79-
57.8344.6656.4450.42
eF ff^ 5.08cm,Fty(°'2) 2.0 in.
(MN/m2) (ksi) (%)
382372376376368376381376376378377
324312344228284284320312
55.453.954.554.553.454.555.254.554.654.854.7
46. 9345.2149.8533.0551.2051. 1646.4545.31
11.011.58.0*
8.0*11.58.0*
11.07.0*
12.011.011.5
10.08.0
11.0*-
10.05.0*
10.0*11.0
R. A,(%)
15.119.37.67.6
15.16.7
15.57.6
18.4
9.79.6
30.622.610.957.224.028.4
14.634.2
K
(GN/rr,2) (psi x 106)
73. 476.571.771.775.275.273.870.370.379.375.2
91.090.3-
91.095.8--
104.1
10.7
11.110.410.410.910.910.710.210.211.510.9
13.213.1-
13.213.9--
15.1
78°K (-320° F)
A14A14A22A22BIOBIOBIOBIOBIO
LT-TLT-BLT-MST-3L-TL-BLT-BST-3tL-M
A14A 14A22A22BIOBIOBIOBIOBIO
TopBottomMiddle-
TopBottomBottom
-Middle
581592592574560587463567463
84.385.885.883.281.285.1
81.782.281.7
453439439413430444434425432
65.763.763.759.962.464.462.961.662.6
12.011.010.08.0*
15.014.014.5-
16.0
15. 112.916.55.5
29.419.125.1-
28.8
84.867.690.355.288.911491.072.473.8
12.39.8
13.18.0
12.916.513.210.5
10.7
20°K(-423°F)
A22A22B18B18B18B18B18B18
L-TLT-BL-TL-MLT-TLT-1ST-2tST-3t
A22A22B18B18B18B18B18B18
TopBottomTopMiddleTop
---
659595647576717633607581
95.686.393.883.6
104.091.888.084.3
566465490456526461480485
82.167.471.066.276.366.869.670.4
12.511.015.515.515.06.7*_
-
16.911.113.417.413.413.0_
-
-
71.786.273.173.864.8
_
-
-10.412.510.610.79.4_
-
* In 3. 81 cm (1. 5 in.) gage length** Failed outside gage mark.t Failed in threads.
3-2
LUO
Soo
II100H
05.H<N(Mr-M0CL>
•*
o
Io
(Ni-H
0)
3-3
Crack growth in several longitudinal and long transverse specimens changed directionduring the test. The metallographic structure suggests that this could be associatedwith grain boundaries, but it could be due to a texture developed during working.
3.2 FRACTURE TESTS
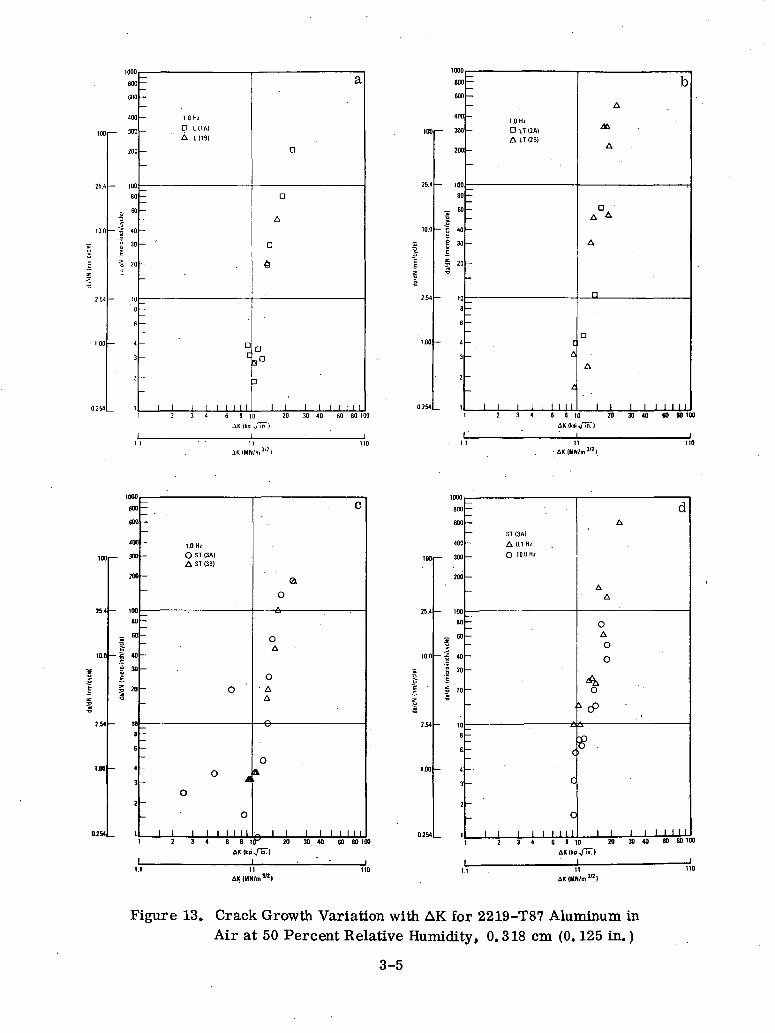
3. 2.1 CYCLIC FLAW GROWTH. Cyclic flaw growth variation with AK was determinedfor the six grain/crack plane combinations in air at 50 percent relative humidity (Fig-ure 13). The bulk of the data was obtained at a constant cyclic frequency of 1.0 Hz, butsome additional information was obtained at 0. 1 and 10. 0 Hz for 2219-T87 aluminumalloy loaded in the short transverse direction (designated as ST(3A) in Figure 1).
The test sequence was similar for each specimen, although AK values had a largerange for the stronger orientations such as the longitudinal L(1A) specimens. In gen-eral, each specimen was subjected to four loading steps, called data bands, separatedby three loading steps, known as marker bands. The marker bands were designed toprovide distinct boundaries for each data band when growth measurements were madeafter fracture. Crack growth was usually readily observed on the surface of the 0.318cm (0.125 in.) specimens, and the marker bands became academic.
To eliminate the potential variable of retardation, the sequence of loading requiredthat no data band load be less than the preceding load. The marker band varied fromthe data band in that 1) AK was lower, 2) stress ratio, R, was lower, 3) cyclic fre-quency was higher, and 4) fewer cycles were applied. For example, the followingloading step was typical for tests at 1. 0 Hz.
Load Frequency(Ib) Stress Ratio (Hz) No. of Cycles
Data Band 1000 R = 0.3 1.0 7600Marker Band 900 R = 0. 1 5.0 1000
The exact AK was initially called out in advance for each band, but because of the diffi-culty of predicting the exact crack growth in a given number of cycles, it was impossibleto determine the exact applied AK for the second and subsequent steps. Consequently,the sequence was prepared based on progressively larger loads, which provided largerAK whether or not crack growth was significant. When specimens survived all cyclicload steps, they were statically loaded to failure to obtain critical stress intensityfactors.
For plotting purposes, initial and final AK values were calculated for each data band(using initial and final crack size), and the average value was determined. To obtainaverage crack growth, da/dN, total growth for each data band was divided by the num-ber of cycles to produce that growth. Average AK was then plotted against averageda/dN on a log/log scale as shown in Figure 13a. Although crack sizes varied between
3-4
IVUU
800
eoo
400
100
25.4
io.n
r£E
i
2 54
• 1.00
0254
r- 300
200
80
•z W
•Ss
-| 40
§ 30§
i ?o
— 10
8
6
— 4
3
2
1
I
— 1.0 Hz
_ D U1AI
A Liiei
-
—
~
—
a
o
D
A
D
_ 1 6
-
-
aC
~
1 ! 1 1 1 1 1 M
D
3°
a
1 1 1 1 1 1 1 1 12 34 6 8 10 20 30 40 60 80 100
llfuu
800
son
400
100
25.4
10.0
i
:i
234
IJ»
0754
,— 300
200
— 100
BO
60
— K 40
{ 30
§ 20
8
6
— 4
2
1
-
-
1.0 HzO ST (3AI
A ST 1381
-
-
-
-
'-
O
—
-
1 o
o—
o1 1 1 1 1 M 1 1
c
a0
oA
oAA
o&
„ i i i i i i i 1 11 2 34 68 t f 20 30 40 60 60 10
11AMMN/OI3")
BOO
600
400
100
10.0
's.
c
s
1.00
0254
— 300
200
80
_ 6021
- f 40
g 30
1 20
8
6
- 4
3
2
\
-.
——
1.0 Hzn n i2AiA LT (2BI
-
-
-
-
-
-
-
C_ A
—
£
1 1 1 1 1 1 1 1 1
b
A
4k
A
DA A
A
n
D
A
1 1 1 1 1 1 1 1 1J 10 20 30 40 60 80 100
IUUU
800
EOO
400
100
25.4
10.0
!
i •:
254
100
0754
— 300
200
— 100
80
_ 60
-f 40
i 30
1 20
8
6
— 4
3
2
1
-
-
— ST (3A)
- A 0.1 Hz
Q10.0 Hi
_
-
_
- •
-
-
C
-.
c
-
o1 1 1 1 1 M 1 1
dA
AA
OA
O
O
^
II 1 12 3 4 680 20 30~40 60 80 10
Figure 13. Crack Growth Variation with AK for 2219-T87 Aluminum inAir at 50 Percent Relative Humidity, 0.318 cm (0, 125 in. )
3-5
specimens, it appeared that the ratio of the log of AK to the log of a da/dN was con-stant for a given direction of loading. In Figure 13a, for example, a single straightline describes the curves for L(1A) and L(1B). The LT(2A) and LT(2B) specimensprovide similar results, as do ST(3A) and ST(3B).
Earlier testing suggested that Specimen ST(3A) would be the orientation with the mini-mum toughness or resistance to crack growth. Consequently, this specimen orienta-tion was used to obtain more detailed data. In this portion of the study, the ST(3A)specimen was used to study the effect of cyclic frequency on the cyclic crack growthrate (da/dN). The two frequencies selected were 0.1 and 10 Hz. While the differenceis small (Figure 13d), it appears that crack growth per cycle is larger at 0.1 than at10. 0 Hz for a given AK. This result is expected in an environment that is aggressiveto the test alloy. That is, at a very slow cyclic rate, the environment has a sufficienttime to cause crack growth at load, as in a sustained load test. Assuming that the re-sult is not an anomaly or statistical inaccuracy, it is assumed that the 2219-T87 alumi-num alloy is vulnerable to increased crack growth in air at 50 percent relative humidity.
3. 2. 2 PLANE STRESS CRITICAL CRACK INTENSITY FACTOR. Static fracture tough-ness values obtained from 0. 318 cm (0.125 in.) fracture specimens are shown in Table3 for tests in liquid nitrogen and in Table 4 for room temperature air after prior ex-posure. As exhibited in other tests, toughness of the longitudinal and long transversespecimens is significantly greater than for short transverse specimens. At liquidnitrogen temperature, the longitudinal L(1A) specimens and the LT(2B) specimensseem to provide the highest toughness. In the short transverse specimens, the differ-ence is small as far as the propagating crack direction is concerned.
As mentioned, those specimens that survived cyclic or sustained load exposures weresubsequently statically loaded to failure. Results of these tests are shown in Table 4.It appears that in virtually all cases, specimens cycled in air tended to exhibit lower"residual" fracture toughness than corresponding specimens loaded in a 3.5-percentNaCl solution. It can be argued that the cyclic specimens were subjected to greatercrack growths than were the sustained load specimens.
Sustained load specimens, however, were subjected to low stress high frequency fatigueloading between load steps to minimize crack blunting. In these cases, cyclic flawgrowth was minimal.
Again, conditional loads (Pq) and maximum loads (Pmax) were higher for the sustainedload test specimens than for the corresponding cyclic loaded specimens. The datastrongly suggests that the exposure in salt water under sustained load has a bluntingeffect that retards crack growth and inhibits susceptibility to the brittle fracturephenomenon.
3-6
Table 3. Plane Stress Critical Crack Intensity Factor for 2219-T87 inLiquid Nitrogen, 0.318 cm (0. 125 in.) Fracture Specimens
SpecimenIdentification
A29 L(1A)1A29 L(1A)4A29 L(1B)1A29 LT(2A)1A27 LT(2B)1^27 LT(2B)4A29 ST(3A)1A29 ST(3A)4A29 ST(3A)7A27 ST(3B)1A27 ST(3B)4A27 ST(3B)7
CriticalCrack Length,
a(cm) (in.)
2.32.42.52.52.32.32.32.32.33.22.32.4
Table 4.
SpecimenIdentification
A29A29A29A29
A29A29
A2A27A27A27A29A29
A27A27A27A27A27A27
A29A29A29A29A29A29
AllAllAllAllAllAll
L(1A)5L(1A)2L(1A)3L(1A)6
L(1B)2L(1B)3
LT(2B)5LT(2B)2LT(2B)3LT(2B)6LT(2A)2LT(2A)3
ST(3B)2ST(3B)5ST(3B)8ST(3B)6ST(3B)9ST(3B)3
ST(3A)8ST(3A)2ST(3A)5ST(3A)3ST(3A)6ST(3A)9
ST(3A)6ST(3A)5ST(3A)4ST(3A)3ST(3A)2ST(3A)1
Cyclic(Hz)
11
1
11
1
11
111
111111
0.910.940.980.970.910.910.900.920.911.250.900.95
Conditional CrackIntensity Factor,
Kx0/9
(MN/m ' ) (ksi/in.)
62.271.444.853.651.165.736.535.932.535.337.236.0
56.665.040.848.846.559.833.232.729.632.133.932.8
Load at5% Secant,
(MM) (Ib)
Maximum Load,prmax
(MN) (Ib)
0.00721 1620 0.011120.00805 1810 0.01019.0.00487 1095 0.006980.00587 1320 0.007210.00592 1330 0.007610.00770 1730 0.008140.00427 960 0.004340. 00414 930 0. 004490.00376 846 0.004050. 00289 650 0. 003090.00436 980 0.004850.00403 907 0.00500
250022901570162017101830975
1010910695
10901125
Static KX Values After Cyclic or Sustained Load Expo-sure, 0. 318 cm (0. 125 in. ) Fracture Specimens
K P Px . Q max
Sustained Environment (MN/m3/2)
X• X
X
XX
X
XXX
XXX.
Air,Air,3.5%3. 5%
Air3.5%
AirAir3.5%3.5%Air3.5%
AirAir3.5%3.5%3.5%
AirAirAir3.5%3.5%3.5%
AirAirAirAirAirAir
50% RH50% RHNaClNaCl
NaCl
NaClNaCl
NaCl
NaClNaClNaCl
NaClNaClNaCl .
63.155.366.471.0
48.874.8
67.856.570.470.444.653.4
45.131.835.647.748.843.0
34.434.836.647.142.654.1
38.734.638.534.443.736.7
(ksi in.)
57.450.360.464.6
44.468.1
61.751.464.164.140.648.6
41.028.932.443.4*44.439.1
31.331.733.342.938.8*49.2*
35.231.535.031.339.833.4
(MN)
0. 006270. 005500. 006540.00685
0. 00405.0. 00578
0. 006670. 005560. 006940. 007300. 003780. 00547
0.003110. 002220. 00302-
0. 00391
0. 002940. 002710. 002710. 00423--
0. 002850. 002940. 002760.003110. 002310.00214
(K>
1.411.251.471.54
0.911.30
1.501.251.561.640.851.23
0.700.500.68-
0.88
0.660.610.610.95--
0.640.660.620.700.520.48
(MN)
0. 008410. 008540. 009470. 00863
0. 005380. 00645
0.008140. 007780.008140.009120. 004800. 00605
0. 003160. 002890. 003690. 004000. 004000. 00449
0. 003470.003160. 002850. 004630. 003780. 00378
0. 003070. 003740. 003020. 003830. 002450. 00240
(K>
1.891.922.131.94
1.211.45
1.831.751.832.051.081.36
0.710.650.830.900.901.01
0.780.710.641.040.850.85
0.690.840.680.860.550.54
* Failed under sustained load. Kx calculated using maximum load and corresponding crack size.
3-7
3.2.3 DOUBLE CANTILEVER BEAM (DCB) CYCLIC TESTS. Initial constraintsof this program included plate thickness, 8.26 cm (3.25 in.), and the thickness require-ment, 2.54 cm (1. 0 in,) for comparative plane strain data. Unfortunately, these re-quirements worked against the program in various grain orientations. Where the crackwas required to traverse the longitudinal grain, fractures were unpredictable and usuallyin a plane parallel to the direction of loading. The most critical of these orientationswas L(1A), where the load was applied in the direction of the longitudinal grain in theplate. During initial tests of L(1A) specimens, pre-cracking proceeded normally andcrack growth was observed during cycling at 1 Hz, although da/dN values were wellbelow that expected. After four AK steps were applied at room temperature (50-percentrelative humidity), the specimen was statically tested to failure. The fracture occurredparallel to the direction of loading (referred to as vertical cracking as opposed to theexpected horizontal crack growth in a test machine). Observation of the fractured sur-face with a light microscope revealed that although the crack had propagated on the sur-face in the vicinity of the face groove, it had changed directions in the center of thespecimen and failed in a plane parallel to load application.
Several attempts were made to use the L(1A) specimens by modifying the geometry(such as deepening the surface groove or making chevron cuts at the leading edge ofthe crack), but none provided sufficient crack growth in the right plane for useful data.
In general, crack growth was most satisfactory in the short transverse ST(3A), ST(3B)specimens, where it was in the plane of longitudinal rolling direction and the long trans-verse direction (Tables 5 through 7).
Cyclic tests were performed at room temperature (50-percent relative humidity), 78°K(-320° F), and 422°K (300° F) at 1.0 Hz for all specimen orientations. In addition, ST(3A)specimens were tested at the three temperatures at 0.1 and 10 Hz.
Most cyclic tests were discontinued after three AK steps to obtain static fracturetoughness values. Some tests failed at lower loads, while others were continued intothe fourth step if it was considered likely that the specimen would survive. All cylicdata for the DCB is shown in Tables 5 through 7, with significant data plotted in Fig-ures 14 and 15. Crack growth was much harder to read for these specimens than forthe 0.318 cm (0.125 in.) specimens.
The first crack length value listed in the tables (aQ) is .that after pre-cracking. The AKvalues are averages obtained from adding the AK at the beginning of a load step to theA K at the end of that load step and dividing by two. Crack growth rates were obtainedby dividing the crack growth for a given load step by the number of cycles required todrive the crack that distance.
Generally, the number of cycles per load step decreased as a specimen test progressedso that crack growth would be similar for each AK. In some cases, it was impossible
3-8
Table 5. Cyclic Crack Growth for 2219 Aluminum at 297°K (Room Temperature), 2. 54 cm (1.0 in.) DCB
AK, ai da/dN N AK2, da/dN ... N AK3 da/dN N da/dN
Specimen Frequency - 3/ 3/ 3/ 3/" I D . . "'(CPS) '"(in) '(cm) ksi ^Tn MN/m 2 (in) (cm) in/cy nm/c (Cycles) ksi ^n MN/m^2 (in) (cm) in/c nhi/c (Cycles) ksi >/In MN/m 2 (in) (cm) in/c nm/c (Cycles) ksi ^In" MN/m^2 (in) (cm) in/c' mn/c (Cycles)
A3 L(1B)2 1.0 1.17 2.97 10.2 11.2 1.26 3.20 12.5 318 7200
A7 LT(2A)1 1.0 1.09 2.77
A9 ST(3B)1 1.0
2 1.0
3 1.0
7200 9.30 10.2 1. 13 2.87
5400 18.3 20.1 1.39 800i1r
5400 12.9 14.2 " 1.14 2.90 1.25 800
1.13 2.87 11.2 12.3
1.11 2.82 5.15 5.66
1.10 2.79 5.03 5.53
1.59 4.04 12.5 318 38000 13.9 15.3
1.19 3.02 6.40 163 12500 9.84 10.8
1.12 2.84 1.60 40.6 ' 12500 9.51 10.4
1.79 4.55 1.05 2670 1900
1.25 3.18 7.23 184 8300 13.7 15.1 1.28.3.25 30.0
1.20 2.59 ; 9.64 245 8300 13.5 14.8 1.23 3.12 30.0
All ST(3A)7 0.1 1.12 2.84 8.20 9.01 1.17 2.97 27.8 706 1800 12.4 13.6 1.20 2.59 16.7 424 1800 16.5 18.1 1.29 3.28 90.0
9 0.1 1.15 2.92 8.32 9.14 1.19 3.02 22.2 564 1800 12.6 13.8 1.23 3.12 22.2 564 1800 17.3 19.0 1.44,3.66 210
12 0.1 1.09 2.77 8.05 8.85 . ,1.14 2.90 27.8 70,6 1800 12.3 13.5 . 1.20 2.59 33.3 846 1800 16.4 18.2 1.26 3.20 60.0
A11ST(3A)13 10.0 1.15 2.92 5.17 5.68 1.16 2.95 .80 20.3 12500 9.73 10.7 1.24 3.15 9.52 242 8400 13.9 15.3 1.28 3.25 40.0
15 "10.0 1.15 2.92 5.18 5.69 1.17 2.97 1.60 40.6 12500 9.73 10.7 1.23 3.12 7.14 181 8400 13.8 15.2 1.28 3.25 50.0
16 10.0 1.14 2.90 5.17 5.68 1.17 2.97 2.40 61.0 12500 9.79 10.8 1.25 3.18 9.52 242 8400 14.0 15.4 1.31 3.33 60.0
20.9 23.0 1.40 3.56 167 4240 60
15.7 17.3 1.17 2.97 500 12700 60
All ST(3A)1 •: 1.0 1.22 3.10 12.1 13.3 1.90 4.83 16.3 414 . 41800
2 1.0 1.19 3.02 5.44 5.98 1.30 3.30 8.80 223 12500 10.4 11.4 1.35 3.43 10.4 264 8300 14.6 16.0 1.37 3.48 20.0 1000
3 1.0 1.16 2.95 5.27 5.79 1.22 3.10 -4.80 122 12500 10.0 11.0 1.28 3.25 7.23 184 8300 14.2 15.6 1.32 3.35 40.0 1000
1000 19.2 21.1 1.31 3.33 240 6100.. 125
10j°° 19.1 21.0 1.34 3.40 880 22400 125
1000
Ilo'oo
1060 .i
1000
1000
looo
3-9
Table 6. Cyclic Crack Growth for 2219 Aluminum at 78°K (-320°F), 2. 54 cm (1. 0 in.) DCB
• a0Specimen Frequency
ID (CPS) (in)
A3 L(1B)8
A7LT(2A)7
All ST(3A)22
23
24
A9 ST(3B)22
23
. : 24
All ST(3A)17
18
14
All ST(3A)6
8
11
1.0
1.0
1.0
1.0
1.0
1.0
1.0
1.0
0.1
0.1
0.1
10.0
10.0
10.0
1.08
1.08
1.12
1.13
1.10
1.09
1.09
1.09
1.10
1.09
1.11
1.08
1.08
1.09
(cm)
2.74
2.74
2.84
2.87
2.79
2.77
2.77
2.. 77
2.79
2.77
2.82
2.74
2.74
2.77
AKj 3j da/dN N
0 /
ksi^m" MN/m 2 (in) (cm) Min/cy (Cycles)
4.97
4.94
5.06
5.15
5.05
4.97
4.97
4.97
5.06
5.03
5.12
4.94
4.94
4.97
5.46
5.43
5.56
5.66
5.55
5.46
5.46
5.46
5.56
5.53
5.63
5.43
5.43
5.46
1.10 :2.
1.08 ;2.
1.12 2.
1.17 :2.
1.13 2.
1.09 :2.
1.09.2.
1.09 2.
1.14 2.
1.13 2.
1.17 ;2.
1.08 -2.
1.08 ,2.
1.09 2.
79 1.39
74
84
97 2.78
87 2.08
77
77
77
90 2.78
87 2.78
97 4. 17
74
74
77
35.3 14400
14400
14400
70.6 14400
52.8 14400
14400
14400
14400
70.6 14400
70.6 14400
106 14400
18440
14400
14400
/
ksi\/in
. 9.82
9.76
10.0
10. 6
10.1
9.84
9.84
9.84
10.1
10.2
9.82
9.88
9.94
3/MN/m 2 (in)
10.8
10.7
11. 0
11.6
11.1
1.12
10.8
10.8
11.1
1.20
10.8
10.9
10.9
1.10
1.15
1.29
1.15
1.12
1.12
1.12
1.17
1.20
1.11
1.13
1.15
a2
(cm)
2.79
2.92
3.28
2.92
2.84
2.84
2.84
2.92
3.05
2.82
2.87
2.92
dA/dN
V-'m/cy nm/c
2.00
3.00
12.0
2.00
3.00
3.00
3.00
3.00
7.00
3.00
5.00
6.00
50.8i
76.2
305
50.8
76.2
76.2
76.2
76.2
178
76.2
123
152
N AK3
(Cycles) (ksi /in) MN/m
10000
10000
10000
10000
10000
10000
10000
10000
10000
10000
10000
10000
10000
13.0
13.0
13.5
14.6
13.5
13.4
13.2
13.2
13.4
13.6
13.2
13.2
13.3
14.3
14.3
14.8
16.0
14.8
14.7
14.5
14.5
14.7
14.9
14.5
14.5
14.6
33
2 (in)
1.17
1.18
1.28
1.41
1.28
1.27
1.21
1.22
1.21
1.24
1.23
1.20
1.22
(cm)
2.97
3.00
3.25
3.58
3.25
3.22
3.07
3.10
3.07
3.15
3.12
3.05
3.10
da/dN
Min/c nm/c
5.56
6.35
10.3
9.5
10.3
11.9
7.14
7.94
6.67
6.67
9.52
11.7
11.7
141
161
262
241
262
302
181
262
169
169
242
297
297
N AK4 a4 da/dN N
(Cycles) (ksi Vin) (MN/m 2 (in) (cm) Min/c hm/c (Cycles)
12600
12600 20.4 22.4 1.41 3.58 21.8 554 10564
12600
12600
12600
12600
12600
12600
6000 .
6000 ;
12600
6000
6000
3-10
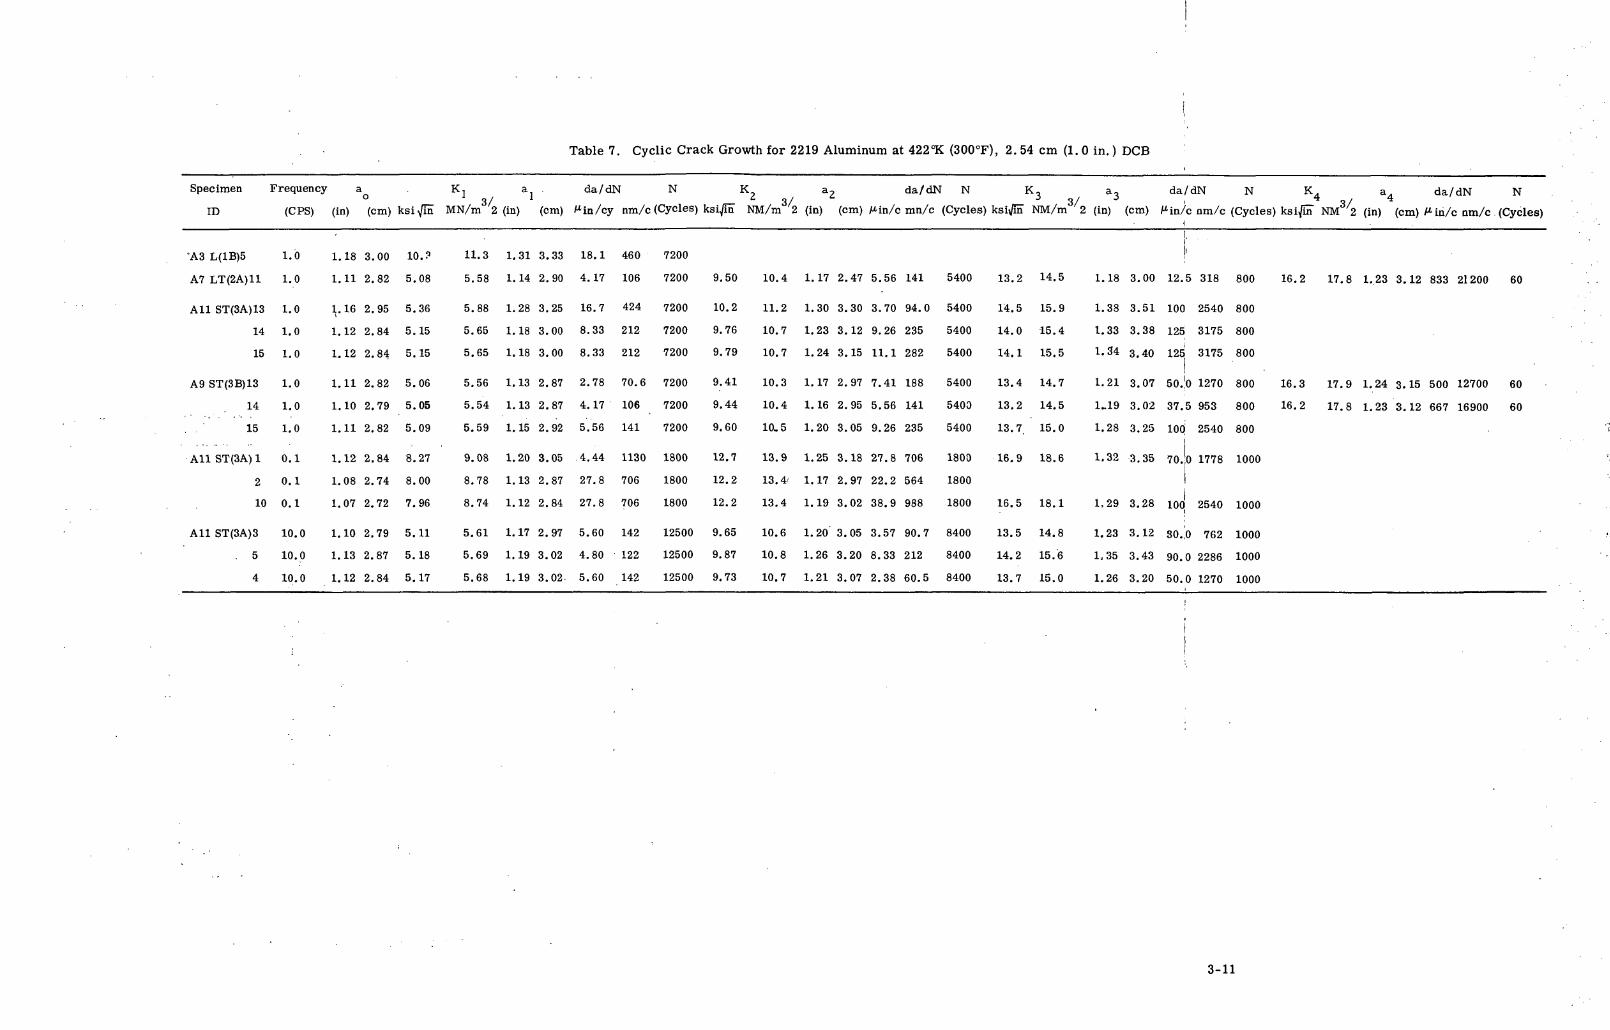
Table 7. Cyclic Crack Growth for 2219 Aluminum at 422°K (300°F), 2. 54 cm (1. 0 in.) DCB
Specimen Frequency aoID (CPS) (in) (cm)
'A3 L(1B)5
A7 LT(2A)11
All ST(3A)13
14
15
A9 ST(3B)13
All
All
14
15
ST(3A) 1
2
10
ST(3A)3
. 5
4
1.0
1.0
1.0
1.0
1.0
1.0
1.0
1.0
0.1
0.1
0.1
10.0
10.0
10.0
1.18
1.11
1.16
1.12
1.12
1.11
1.10
1.11
1.12
1.08
1.07
1.10
1.13
1.12
3.00
2.82
2.95
2.84
2.84
2.82
2.79
2.82
2.84
2.74
2.72
2.79
2.87
2.84
Kl3/
ksiVm" MN/m 2
10.?
5.08
5.36
5.15
5.15
5.06
5.05
5.09
8.27
8.00
7.96
5.11
5.18
5.17
11.3
5.58
5.88
5.65
5.65
5.56
5.54
5.59
9.08
8.78
8.74
5.61
5.69
5.68
ai(in)
1.31
1.14
1.28
1.18
1.18
1.13
1.13
1.15
1.20
1.13
1.12
1.17
1.19
1.19
(cm)
3.33
2.90
3.25
3.00
3.00
2.87
2.87
2.92
3.05
2.87
2.84
2.97
3.02
3.02
da/dN N
Min/cy nm/c (Cycles)
18.1
4.17
16.7
8.33
8.33
2.78
4.17
5.56
.4.44
27.8
27.8
5.60
4.80
5.60
460
106
424
212
212
70.6
106
141
1130
706
706
142
122
142
7200
7200
7200
7200
7200
7200
7200
7200
1800
1800
1800
12500
12500
12500
K2 aZ3/ksi^n NM/m 2 (in) (cm)
9.50
10.2
9.76
9.79
9.41
9.44
9.60
12.7
12.2
12.2
9.65
9.87
9.73
10.4
11.2
10.7
10.7
10.3
10.4
10.5
13.9
13.4-
13.4
10.6
10.8
10.7
1.17
1.30
1.23
1.24
1.17
1.16
1.20
1.25
1.17
1.19
1.20
1.26
1.21
2.47
3.30
3.12
3.15
2.97
2.95
3.05
3.18
2.97
3.02
3.05
3.20
3.07
da/dN N K, a,3/
Min/c mn/c (Cycles) ksi^m NM/m 2 (in)
5.56
3.70
9.26
11.1
7.41
5.56
9.26
27.8
22.2
38.9
3.57
8.33
2.38
141
94.0
235
282
188
141
235
706
564
988
90.7
212
60.5
5400
5400
5400
5400
5400
5400
5400
1800
1800
1800
8400
8400
8400
13.2
14.5
14.0
14.1
13.4
13.2
13.7.
16.9
16.5
13.5
14.2
13.7
14.5
15.9
15.4
15.5
14.7
14.5
15.0
18.6
18.1
14.8
15.6
15.0
1.18
1.38
1.33
1.34
1.21
1..19
1.28
1.32
1,29
1.23
1,35
1.26
(cm)
3.00
3.51
3.38
3.40
3.07
3.02
3.25
3.35
3.28
3.12
3.43
3.20
da/dN
^in/c nm/c
12.
'
5 318
100 2540
125 3175
125
50.
37.
3175
0 1270
5 953
100 2540
70.
100
30.
90.
50.
0 1778
2540
0 762
0 2286
0 1270
N K a da/dN N3/
(Cycles) ksi^In NM 2 (in) (cm) Min/c nm/c (Cycles)
800 16.2
800
800
800
800 16.3
800 16.2
800
1000
1000
1000
1000
1000
17.8 1.23 3.12 833 21200 60
17.9 1.24 3.15 500 12700 60
17.8 1.23 3.12 667 16900 60
3-11
IUUU
800
600
400
100
25.4
10.0
2.54
1.00
0.254
— 300
200
80
_ 60
-1 40
i 30'e
1 2a
g
6
— - 4
3
2
1
-
-
297°MRT)
1.0 Hi
O STI3A)A STI3B)
-
-_
-
OO A
A
o-
-
-
I i i I 4> i i i i
a
A
A
AA
O
AO
O
O
O
D
1 1 1 1 1 1 1 1 16 I 10 20
AK <ku /HT)
30 40 60 80 100
800
600
400
100
10.0
;
i
1.00
1254
— 300
200
80
-= B
-5
-I 40
1 *>E
§ 20
8
G
— 4
3
2
1
—
~ 297°K (RT)
"" ST (3AI
D 0.1 HiO 10 Hi
-
-
-
QD
-
— t.
- C
-
o
o1 1 1 1 1 1 1 1 1
b
D
D
OD
O
OD
aD
ii I i i i i i i8 10 20 30 40
iK (kg ./in?)
11iKIIIN/Ill17) AK (MN/m Ml
800
600
400
100
25.4
10.0
•
1
I2.54
1.00
OJ54
i — 300
200
80
_ 60
— % 40C
i 30i|20
- 10
"
6
— 4
3
2
1
-
422°K (300°F)
1.0 Hi
O ST (3AI
A ST (3BI
~
-
-
I
_
—
O
O °A
A
O-
-
_
A
1 1 1 1 1 1 1 1 1
* C
A
A
O
&
O0
A•)
1 1 1 1 1 1 1 1 11 2 34 68 10 20 30 40 60 80 10
AK (ko /ioTl
800
600
100
25.4
10.0
1
2.54
1.00
0.254
400
— 300
200
80
_ 60
-1..1
1 M
i2°- 10
.8
6
4
3
2
1
-
_ «2°K (300°FI
ST (3AI
D 0.1 Hi~~ O'lOHi
:
—
DD
t
- C
O
o
1 1 1 1 L 1 1 1 1
d
D
D
onoon
nD
i i i i i i i i i1 B 10 30 40 60 80 100
114K(MN/m l n )
Figure 14. DCB Cyclic Flow Growth, Short Transverse
3-12
IUUU
800
600
400
100
25.4
10.0
'
-
i
2.54
1.00
0.2 54
— 300
200
BO
_ 60
£
-f 40
e 30\* 203 •
10
8
e
- 4
3
2
1
-
-
78°K |-320°F>
1.0 Hi
O ST (3A)
A ST 138)
-
-
-
-
-
-
-
_
-
0 *
0 (
1 1 1 1 1 1 1 1 1
e
°0b
»
)
i i i i i i 1 1 130 40 60 80100
0.254 _
S "I
IUUU
BOO
600
400
300
200
IOC
80
60
40
30
20
1C
8
6
4
3
2
1
-
-
78°K I-320°FI
ST (3AI
Q 0.1 Hi
O 10 Hi
-
-
-
i—(
CD
- o x
1 1 1 1 1 1 1 1 1
f
oo
3 0)1
)
1 1 ! 1 1 1 1 1 120 30 40 60 60 10
AKIMN/m1'1!
Figure 14. DCB Cyclic Flaw Growth, Short Transverse, Contd
A7LTI2AI
D IS K (320 F)
O 297 K (RT)
A 422 K l < 3 0 0 F)
A
O
0254|_ ll II I I I I I I I I II I I I I I I I1 P 34 6 B 10 20 30 40 60 80 100
Figure 15. DCB Cyclic Flaw Growth,Long Transverse
to determine the boundaries of crackgrowth for a given AK, which made theda/dN values for that step and the nextstep useless.
The study indicated that the fracturedsurface of specimens tested at 78° K(-320° F) is harder to analyze than thesurfaces of specimens tested at othertemperatures. Figure 14 provides adisplay of the variation of crack growthrates with AK for the ST(3A) and ST(3B)specimens at the three test temperatures,while Figure 15 is a similar plot for theLT(2A) specimens at all three testtemperatures.
The curves on the log/log scale for ST(3A)and (3B) specimens are reasonable atroom temperature and 422°K (300° F).However, the crack growth for tests at78° K (-320° F) seems to be stunted at AK
3-13
values greater than 11. 0 MN/m'3' 2 (10 ksi /in. ). In general, the values obtained atthe lower AK seem to be more erratic than those at higher AK. This effect is partlydue to the relative spread in the logarythmic plots.
The stress ratio (H) used for this test program was 0. 3, which somewhat limited themaximum AK available for cyclic testing. For example, assume Kjc = 30 MN/m3/2
KIc =
AK = 30 (1-3)
AK = 21 MN/m3/2
For this condition then, any crack growth at a A K of 21 MN/m ' 2 would cause thespecimen to fail. As stated earlier, all specimens that survived cyclic testing werestatically tested to failure in their respective environments.
3.2.4 DOUBLE CANTILEVER BEAM (DCS) SUSTAINED LOAD TESTS. Sustainedload tests were performed on the 2. 54 cm (1. 0 in. ) DCB specimens at room temper-ature (50-percent relative humidity), in 3. 5-percent NaCl solution, in air at 422° K(300° F), in gaseous hydrogen at room temperature, in gaseous hydrogen at 422° K,and in liquid hydrogen. (The gaseous hydrogen tests were under a static pressure of20psig.)
Except for several specimen orientations (primarily L(1A)) where unorthodox failuresoccurred (see cyclic testing), all specimens were subjected to increasing load steps ina similar manner to the cyclic tests. Between sustained load steps, specimens werereturned to a pre-cracking regimen (room temperature) to minimize crack bluntingfor the next load step and to prove masker bands. Ideally, the first load steps wouldshow no crack growth, the second step would provide growth within the allotted time,and the third step would cause failure or additional crack growth. If the specimensurvived the sustained load testing, it was statically tested to failure in its respectiveenvironment.
The majority of specimens were subjected to three or four load steps. Instrumentationwas attached to indicate the presence of cracking and to determine if crack growth oc-curred upon loading. If crack growth was indicated by instrumentation, this informationwas noted during fractographic examination in an attempt to determine crack growthrates. As in the cyclic test specimens, crack growth was extremely difficult to deter-mine using polarized light fractographic techniques.
Although the basic procedures were similar for all sustained load tests, these weredivided into two groups: 1) hydrogen tests and 2) air and 3. 5-percent NaCl solutiontests. Each specimen was planned for 300 minutes of exposure at each load step.
3-14
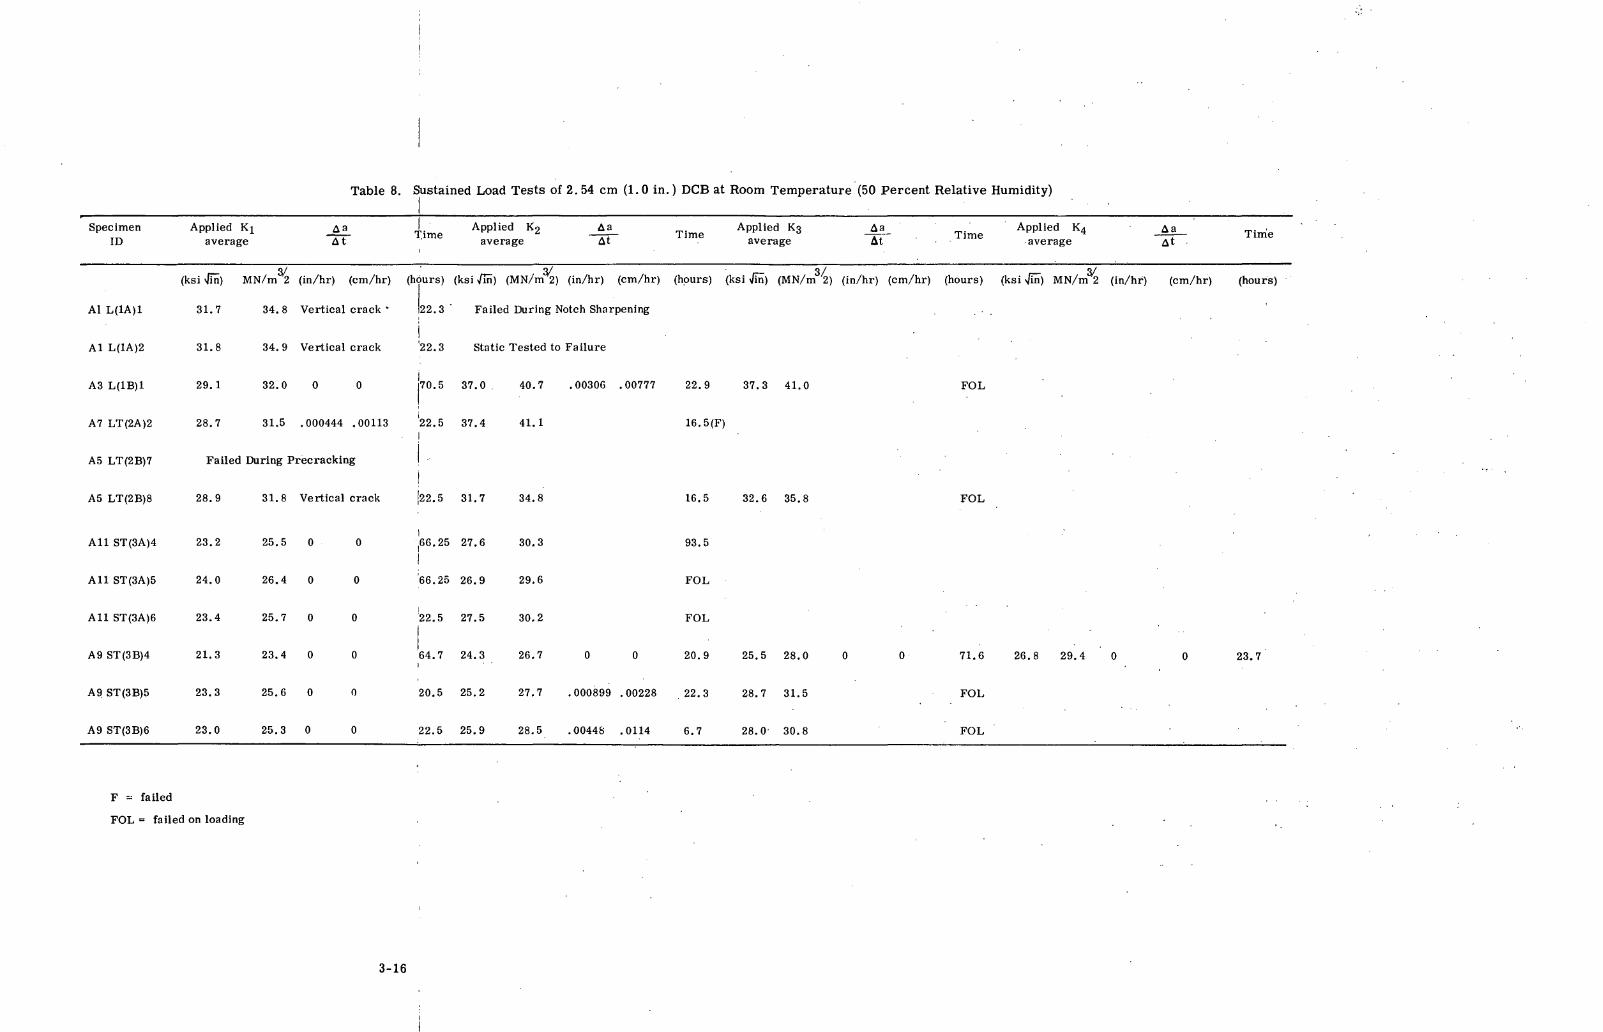
Table 8. Sustained Load Tests of 2. 54 cm (1.0 in.) DCB at Room Temperature (50 Percent Relative Humidity)
SpecimenID
Al
Al L(1A)2
A3 L(1B)1
All ST(3A)5
A 9 ST(3B)4
Applied KIaverage A t T.ime
Applied Iaverage
AaAt Time Applied K
averageAaAt Time
Applied K4
averageAaAt
31.7 34.8 Vertical crack 22.3 " Failed During Notch Sharpening
31.8 34.9 Vertical crack '22.3 Static Tested to Failure
29.1 32.0 0 70.5 37.0 40.7 .00306 .00777 22.9 37.3 41.0 FOL
A7 LT(2A)2 28.7 31.5 .000444 .00113 22.5 37.4 41.1. I
A5 LT(2B)7 Failed During Precracking
iA5 LT(2B)8 28.9 31.8 Vertical crack J22.5 31.7 34.1
All ST(3A)4 23.2 25.5 0 0
24.0
All ST(3A)6 23.4
21.3
26.4 0
25.7 0
23.4 0
,66.25 27.6 30.3
66.25 26.9 29.6
22.5 27.5 30.2
16.5(F)
16.5 32.6 35.
93.5
FOL
FOL
FOL
Time
(ksi Jin) MN/m 2 (in/hr) (cm/hr) (hours) (ksi /In) (MN/m 2) (in/hr) (cm/hr) (hours) (ksi Tin) (MN/m 2) (in/hr) (cm/hr) (hours) (ksi v/in) MN/m 2 (in/hr) (cm/hr) (hours)
71.6 26.8 29.4 0 23.7
A? ST(3B)5
A9 ST(3B)6
23.3
23.0
25.6 0
25.3 0
0
0
20.5 25.2
22.5 25.9
27.7
28.5
.000899
.00448
.00228
.0114
. 22.3
6.7
28.7
28.0
31.5
30.8
FOL
FOL
F = failed
FOL ** failed on loading
3-16
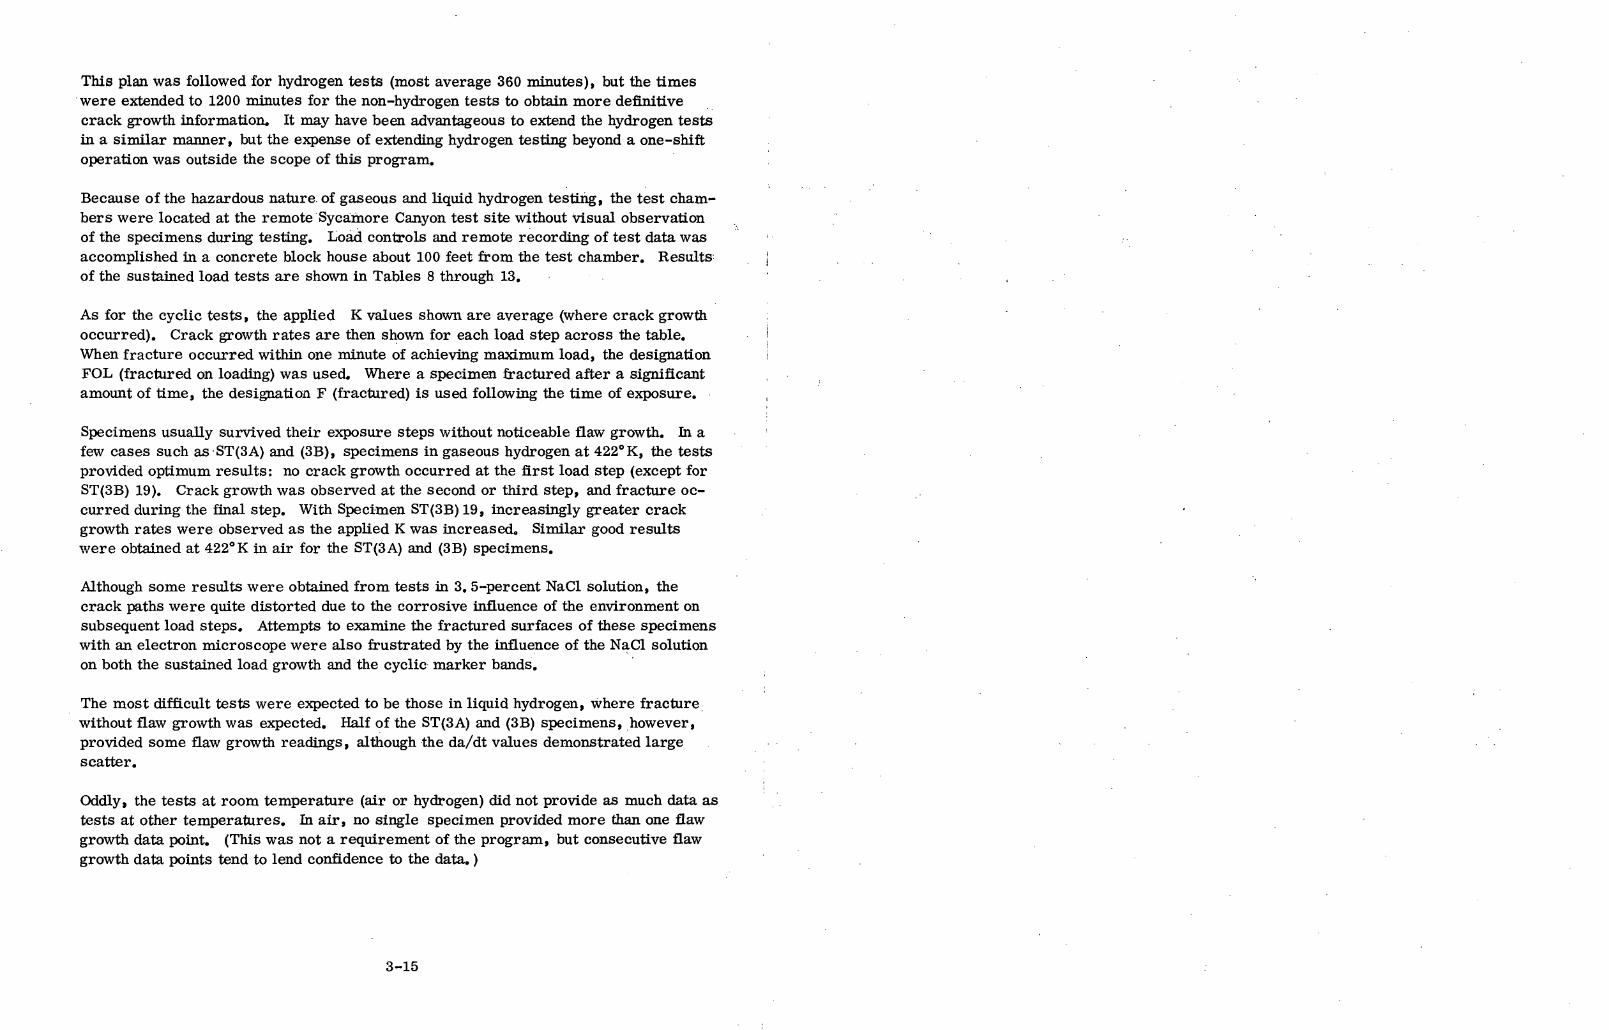
This plan was followed for hydrogen tests (most average 360 minutes), but the timeswere extended to 1200 minutes for the non-hydrogen tests to obtain more definitivecrack growth information. It may have been advantageous to extend the hydrogen testsin a similar manner, but the expense of extending hydrogen testing beyond a one-shiftoperation was outside the scope of this program.
Because of the hazardous nature of gaseous and liquid hydrogen testing, the test cham-bers were located at the remote Sycamore Canyon test site without visual observationof the specimens during testing. Load controls and remote recording of test data wasaccomplished in a concrete block house about 100 feet from the test chamber. Resultsof the sustained load tests are shown in Tables 8 through 13.
As for the cyclic tests, the applied K values shown are average (where crack growthoccurred). Crack growth rates are then shown for each load step across the table.When fracture occurred within one minute of achieving maximum load, the designationFOL (fractured on loading) was used. Where a specimen fractured after a significantamount of time, the designation F (fractured) is used following the time of exposure.
Specimens usually survived their exposure steps without noticeable flaw growth. In afew cases such as ST(3A) and (3B), specimens in gaseous hydrogen at 422°K, the testsprovided optimum results: no crack growth occurred at the first load step (except forST(3B) 19). Crack growth was observed at the second or third step, and fracture oc-curred during the final step. With Specimen ST(3B) 19, increasingly greater crackgrowth rates were observed as the applied K was increased. Similar good resultswere obtained at 422° K in air for the ST(3A) and (3B) specimens.
Although some results were obtained from tests in 3. 5-percent NaCl solution, thecrack paths were quite distorted due to the corrosive influence of the environment onsubsequent load steps. Attempts to examine the fractured surfaces of these specimenswith an electron microscope were also frustrated by the influence of the Nad solutionon both the sustained load growth and the cyclic marker bands.
The most difficult tests were expected to be those in liquid hydrogen, where fracturewithout flaw growth was expected. Half of the ST(3A) and (3B) specimens, however,provided some flaw growth readings, although the da/dt values demonstrated largescatter.
Oddly, the tests at room temperature (air or hydrogen) did not provide as much data astests at other temperatures. In air, no single specimen provided more than one flawgrowth data point. (This was not a requirement of the program, but consecutive flawgrowth data points tend to lend confidence to the data.)
3-15
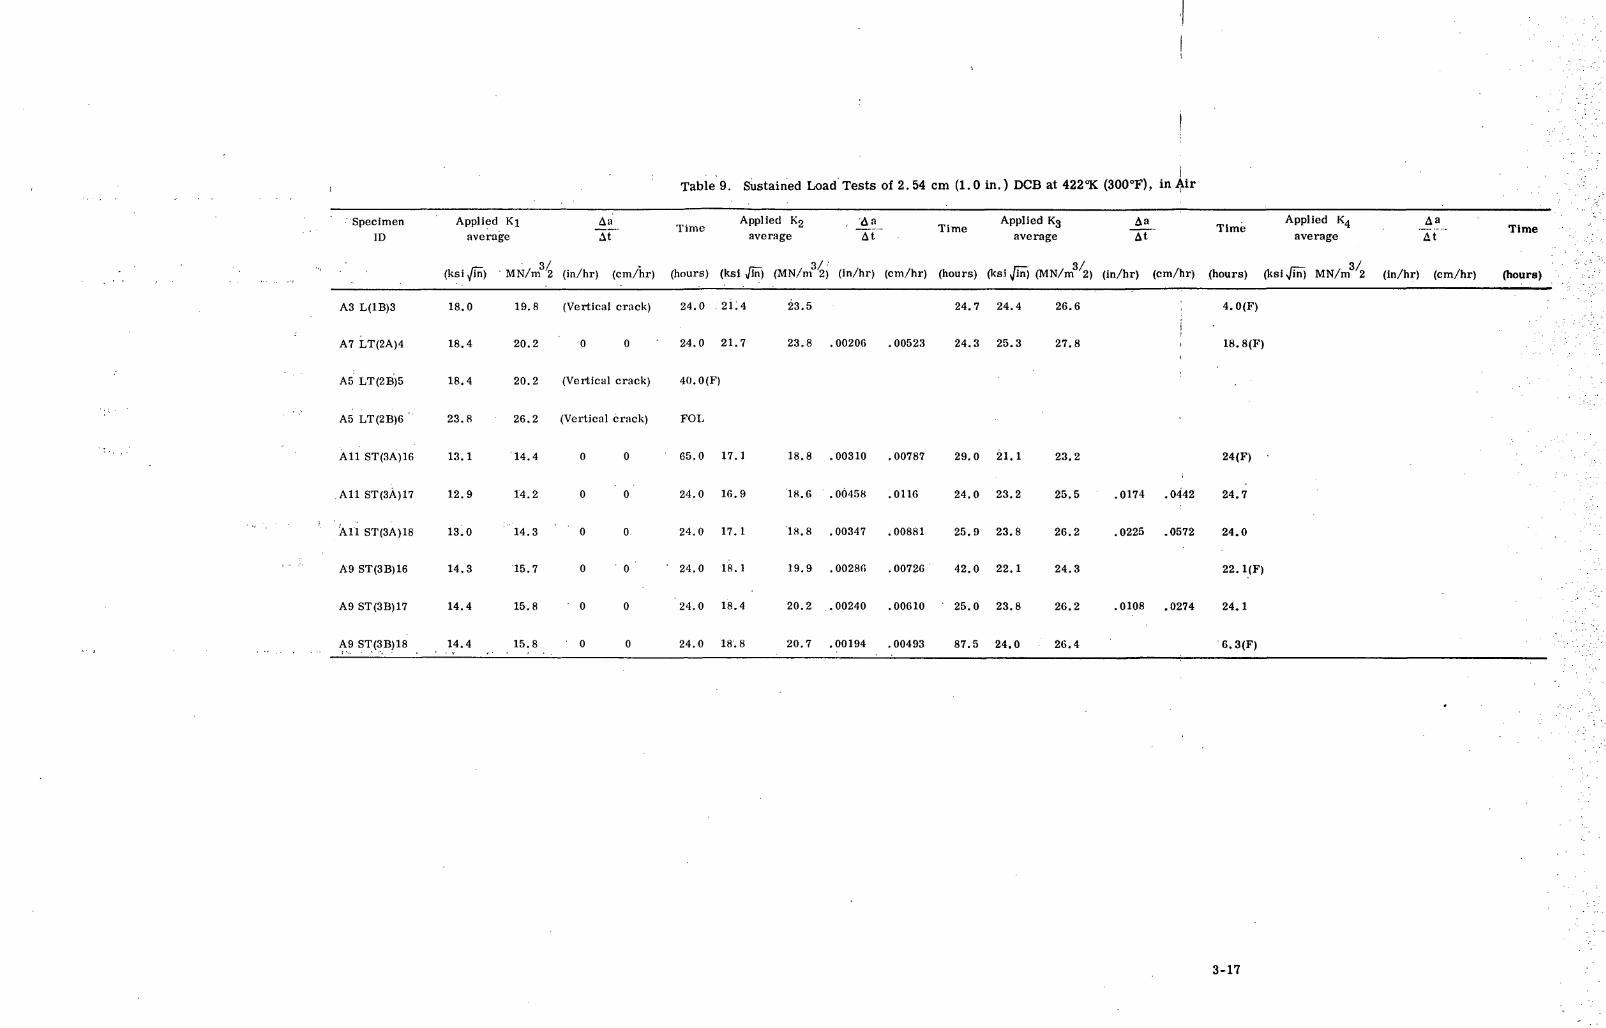
Table 9. Sustained Load Tests of 2. 54 cm (1.0 in.) DCB at 422°K (300°F), in Air
SpecimenID
A3 L(1B)3
A7 LT(2A)4
A5 LT(2B)5
A5 LT(2B)6 "
All ST(3A)16
All ST(3A)17
All ST(3A)18
A9 ST(3B)16
A9 ST(3B)17
A9 ST(3B)18
Applied KIaverage
i— • ' , 3/(ksi yin) MN/m 2
18.0
18.4
18.4
23.8
13.1
12.9
13.0
14.3
14.4
14.4
19.8
20.2
20.2
26.2
14.4
14.2
14.3
15.7
15.8
15.8
A aAt'"
(in/hr) (cm/hr)
(Vertical crack)
0 0
(Vertical crack)
(Vertical crack)
0 0
0 0
0 0
0 0
0 0
0 0
Time
(hours)
24.0
24.0
Applied I<2 A aaverage At
3/ •(ksi Jin) (MN/m 2) (in/hr) (cm/hr)
.21.4 23.5
21.7 23.8 .00206 .00523
Applied Kq A aTime — — —average At
• n ^/
(hours) (ksi ^in) (MN/m 2) (in/hr) (cm/hr)
24.7 24.4
24.3 25.3
26.6 i
i27.8 i
1
Applied KA A aTime 4 •-=•-- Timeaverage At
n I
(hours) (ksiy/in) MN/m 2 (in/hr) (cm/hr) (hours)
4. 0(F)
is.8(F) :
40.0(F) : .
FOL
65.0
24.0
24.0
' 24.0
24.0
24.0
17.1 18.8 .00310 .00787
16.9 18.6 .00458 .0116
17.1 18.8 .00347 .00881
18.1 19.9 .00286 .00726
18.4 20.2 ..00240 .00610
18.8 20.7 .00194 .00493
29.0 21.1
24.0 23.2
25.9 23.8
42.0 22.1
25.0 23.8
87.5 24.0
23.2
25.5 .0174 .0442
26.2 .0225 .0572
24.3
26.2 .0108 .0274
26.4
24(F)
24.7
24.0
22. 1(F)
24.1
6.3(F)
3-17
Table 10. Sustained Load Tests of 2. 54 cm (1.0 in.) DCB in 3. 5 Percent NaCl
Specimen.ID
Applied Kaverage
AaAt
TimeApplied I<2
averageAa_At
TimeApplied Kg
average.
At Time Applied Kaverage
-At
^_^ o/ ^_ o/ | o / o /
(ksi^in) MN/m 2 (in/hr) (cm/hr) (hours) (ksi/in)(MN/m 2) (in/hr) (cm/Hr) (hours) (ksi/in) (MN/m 2) (in/hr) (cm/hr) (hours) (ksi^Tnj MN/m 2 (in/hr) (cm/hr)
Time
(hours)
Al L(1B)9
A7 LT(2A)9
A5 LT(2B)3
A5 LT(2B)4
29.1
23.0
31.4
26.8
32.0 0
25.3
34.5 Vertical crack
22.2 35.4
18.0 28.9
23.7 33.6
29.4 Vertical crack 21.7 31.4
38.9 .00173
31.8 0
36.9
34.5
All ST(3A)7 20.6 22.6 0
All ST(3A)8 22.7 24.9 .0
All ST(3A)9 22.6 .24.8 0
0
0
0
0
14.0 25.1 . 27.6 0
7.0 25.1
19.0 24.8
64.0 26.5
28.3 0
27.2 0
29.1 0
.00439 17.3 38.1 41.9
0 21.5 33.8 37.1 0 0
23.7 34.4 37.8
18.0 33.1 36.4
0 7.0 27.6 30.3 0 0
0 7.0 28.1 30.9
0
0
FOL
37.7 41.4
20.0 35.7 39.2
64.3 35.8 39.3
7.0 29.2 32.1
.75(F)
17.0 26.3 28.9 .0025 .0064 16.0 Static Test to Failure
A9 ST(3B)7 23.8 26.2 0
A9 ST(3B)8 24.0 26.4 0 0 12.0 26.8 29.4 .0104 .0264 12.5 28.7 31.5
IA9 ST(3B)9 23.9 26.3 .00244 .00620 20.5 28.2 , 31.0 .0056 i .0142 14.25 27.7 30.4
24.0 27.6 30.3 .0104 .0264 7.0 29.3 32.2
FOL
FOL
FOL
6.75(F)
l.O(F)
3.5(F)
FOL
3-18
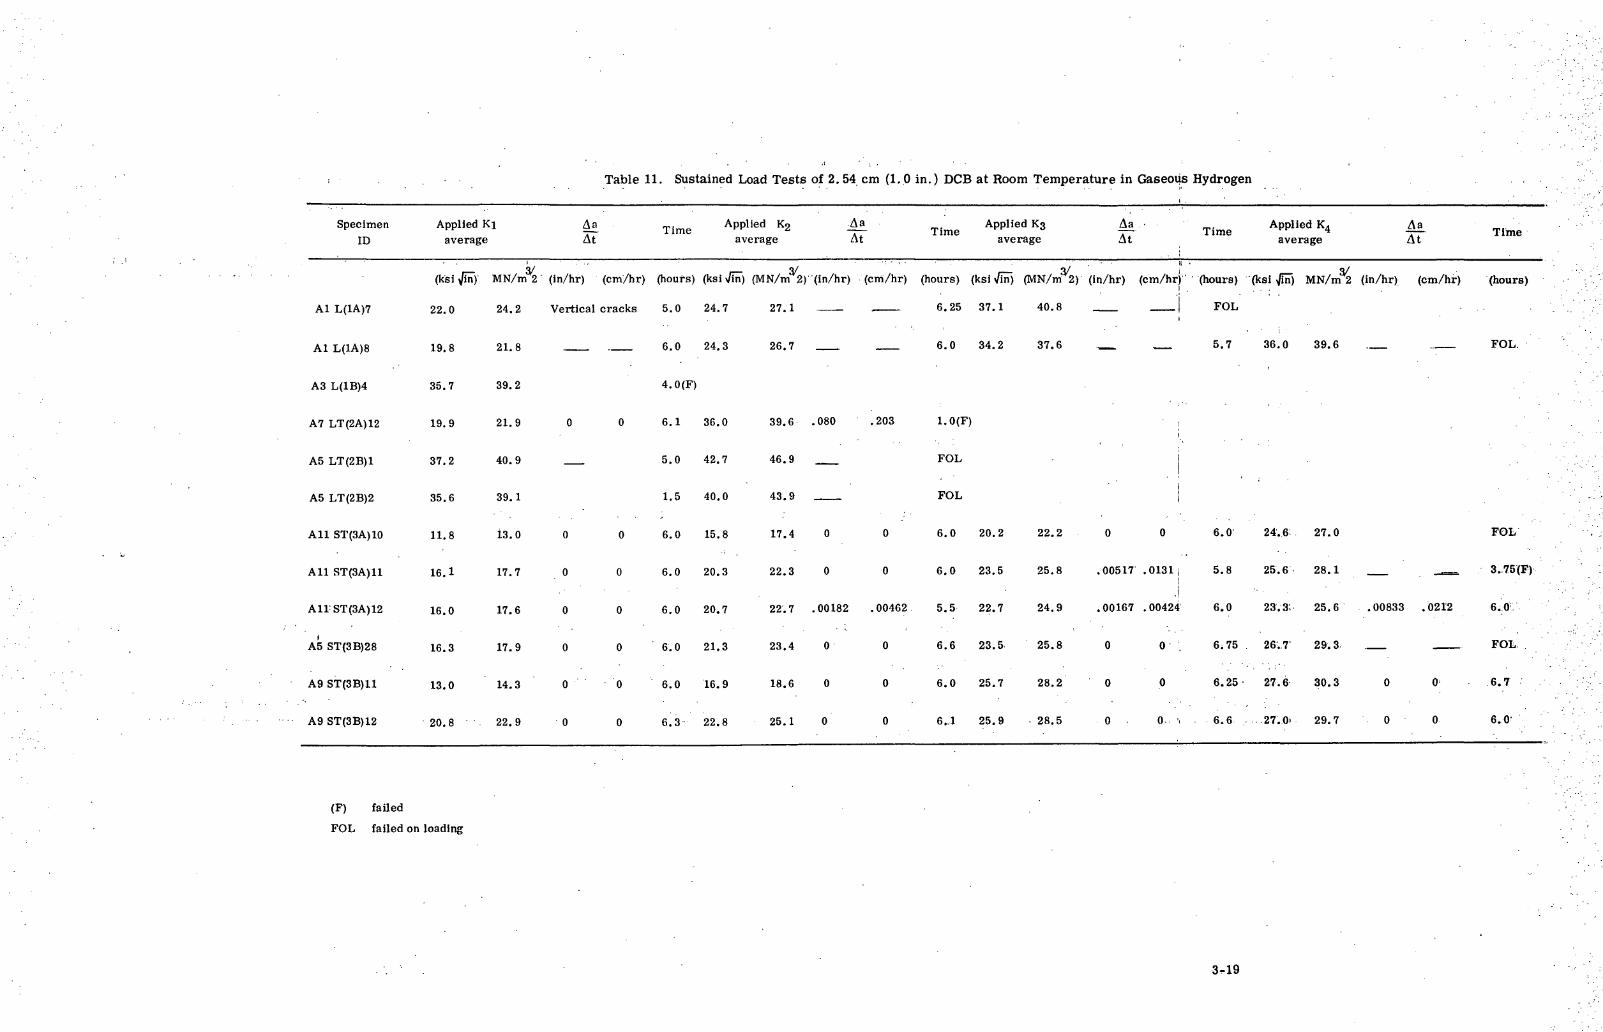
Table 11. Sustained Load Tests of 2. 54 cm (1.0 in.) DCB at Room Temperature in Gaseous Hydrogen
SpecimenID
Al L(1A)7
Al L(1A)8
A3 L(1B)4
A7 LT(2A)12
A5 LT(2B)1
A5 LT(2B)2
All ST(3A)10
All ST(3A)11
A1IST(3A)12
A5 ST(3B)28
A9 ST(3B)11
A9 ST(3B)12
Applied Klaverage
(ksi fin)
22.0
19.8
35.7
19.9
37.2
35.6
11.8
16.1
16.0
16.3
13.0
20.8
MN/iti2
24.2
21.8
39.2
21.9
40.9
39.1
is.o
17.7
17.6
17.9
14. 3
22.9
^ TimeAt
(in/hr) (cm/hr) (hours)
Vertical cracks 5.0
fi n
4.0(F)
0 0 6.1
5.0
1.5
0 0 6.0
0 0 6.0
0 0 6.0
0 0 6.0
0 0 6.0
0 0 6.3
Applied Ko Aa Applied Ky AaTT Time ~T —average At average At
3/ 3/(ksiVin) (MN/m 2) (in/hr) (cm/hr) (hours) (ksi <fin) (MN/m 2) (in/hr) (cm/hr
24 7 27 1 . 6.?,S 37.1 40.8
9!4.3 9.fi,7 6.0 S4.2 37.fi .
36.0 39.6 .080 .203 l.O(F)
42.7 46.9 FOL
40.0 43.9 FOL
15.8 17.4 0 0 6.0 20.2 22.2 0 0
20.3 22.3 0 0 6.0 23.5 25.8 .00517 .0131
Time A"pliedK4 fa Timeaverage At
3/i" (hours) (ksi ^nj MN/m 2 (in/hr) (cm/hr) (hours)
FOL'
K,7 Sfi .n 39, fi FOT.
6.0 24.6, 27.0 FOL
5.8 25.6 28.1 3.75(F)
20.7 22.7 .00182 .00462 5.5 22.7 24.9 .00167 .00424 6.0 23.3; 25.6 .00833 .0212 6.0
21.3 23.4 0 0 6.6 23.5 25.8 0 0
16.9 18.6 0 0 6.0 25.7 28.2 0 0
22.8 25.1 0 0 6..1 25.9 • 28.5 0 0.
6.75 26.7 29.3 FOL.
6.25 27.6 30.3 0 0 6.7
6.6 .27.0 ' 29.7 0 0 6.0-
(F) failed
FOL failed on loading
3-19
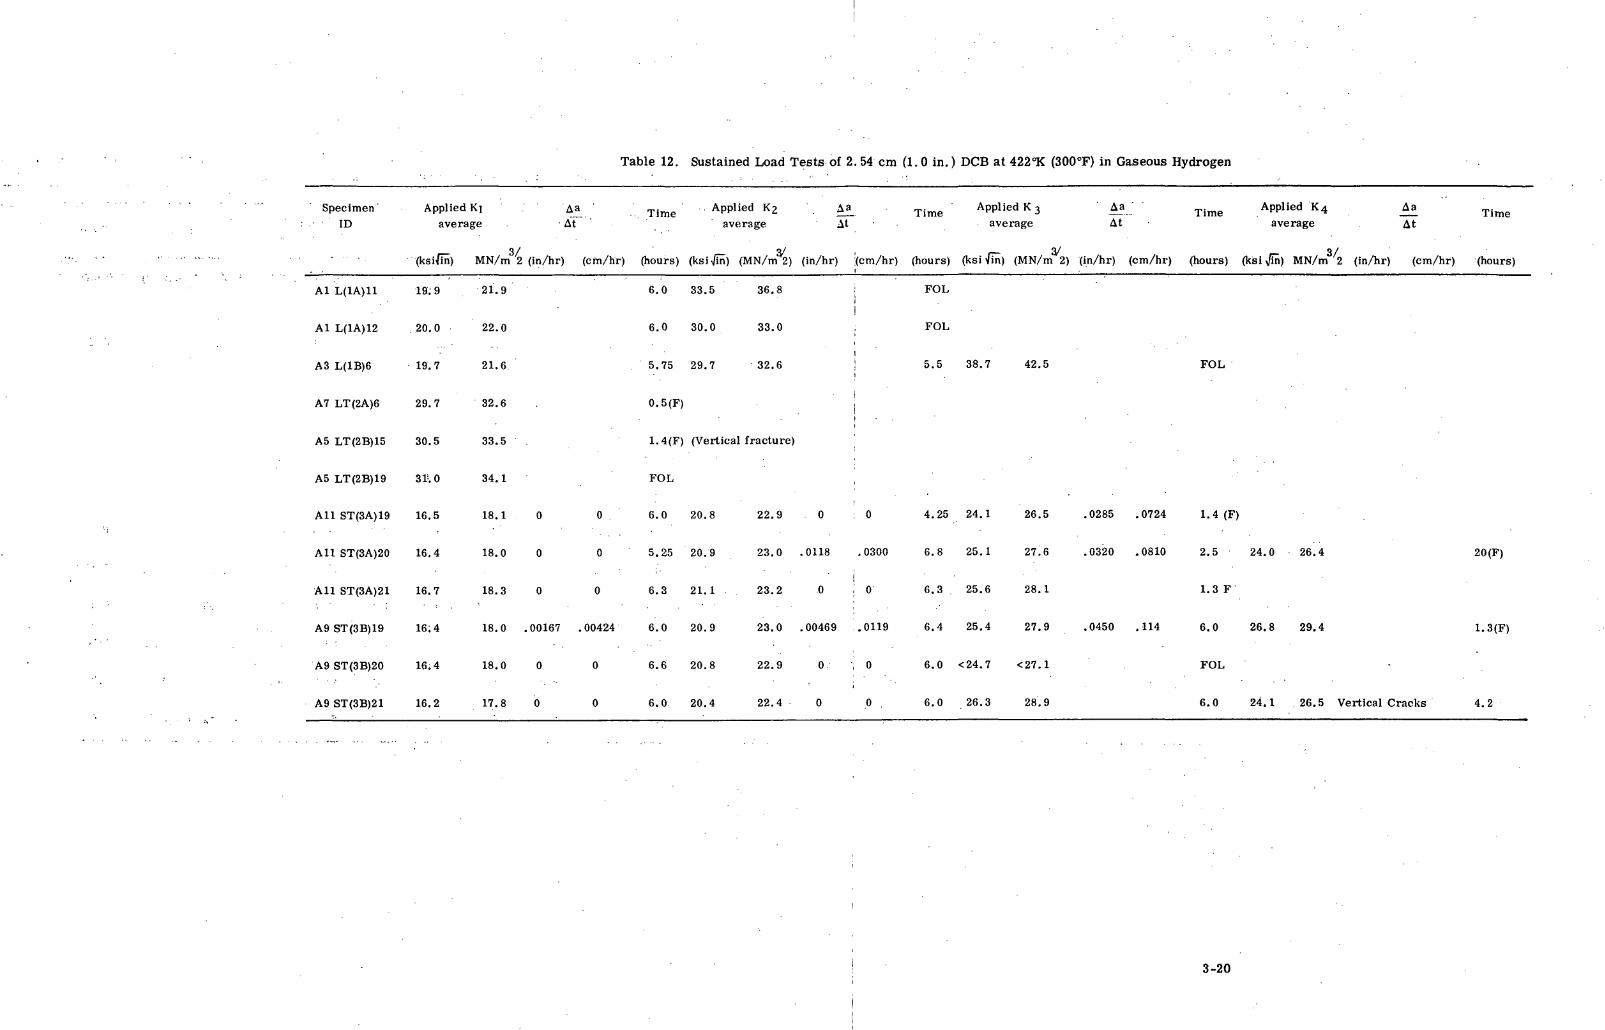
Table 12. Sustained Load Tests of 2. 54 cm (1.0 in.) DCB at 422°K (300°F) in Gaseous Hydrogen
Specimen'ID
Al L(1A)11
Al L(1A)12
A3 L(1B)6
A7 LT(2A)6
A5 LT(2B)15
A5 LT(2B)19
All ST(3A)19
All ST(3A)20
All ST(3A)21
A9 ST(3B)19
A9 ST(3B)20
A9 ST(3B)21
Applied KI Aaaverage • At
3/(ksi/in) MN/m 2 (in/hr) (cm/hr)
19: 9
20.0
19.7
29.7
30.5
3UO
16.5
16.4
16.7
16; 4
16.4
16.2
21.9
22.0
21.6
32.6
33.5
34.1
18.1 0 0
18.0 0 0
18.3 0 0
18.0 .00167 .00424
18.0 0 0
17.8 0 0
. Time
(hours)
6.0
6.0
5.75
0.5(F)
Applied KZ Aa Time Applied K 3 Aa Time Applied K4 Aaaverage At • average At average At
n/ | O/ o/
(ksi^) (MN/m 2) (in/hr) '(cm/hr) (hours) (ksi fin) (MN/m 2) (in/hr) (cm/hr) (hours) (ksi x/in) MN/m 2 (in/hr) (cm/hr)
33.5
30.0
29.7
36.8 : FOL
i33.0 , FOL
i32.6 ! 5.5 38.7 42.5 FOL
1
i11
Time
(hours)
1.4(F) (Vertical fracture)
FOL
6.0
5.25
6.3
6.0
6.6
6.0
20.8
20.9
21.1
20.9
20.8
20.4
; -
22.9 0 0 4.25 24.1 26.5 .0285 .0724 1.4(F)
23.0 .0118 .0300 6.8 25.1 27.6 .0320 .0810 2.5 24.0 26.4
i23.2 0 i 0 6.3 25.6 28.1 1. 3 F
23.0 .00469 .0119 6.4 25.4 27.9 .0450 .114 6.0 26.8 29.4
22.9 0 , 0 6 . 0 <24.7 <27.1 F O L
22.4 0 0 . 6.0 26.3 28.9 6.0 24.1 26.5 Vertical Cracks
20 (F)
1.3(F)
4.2
3-20
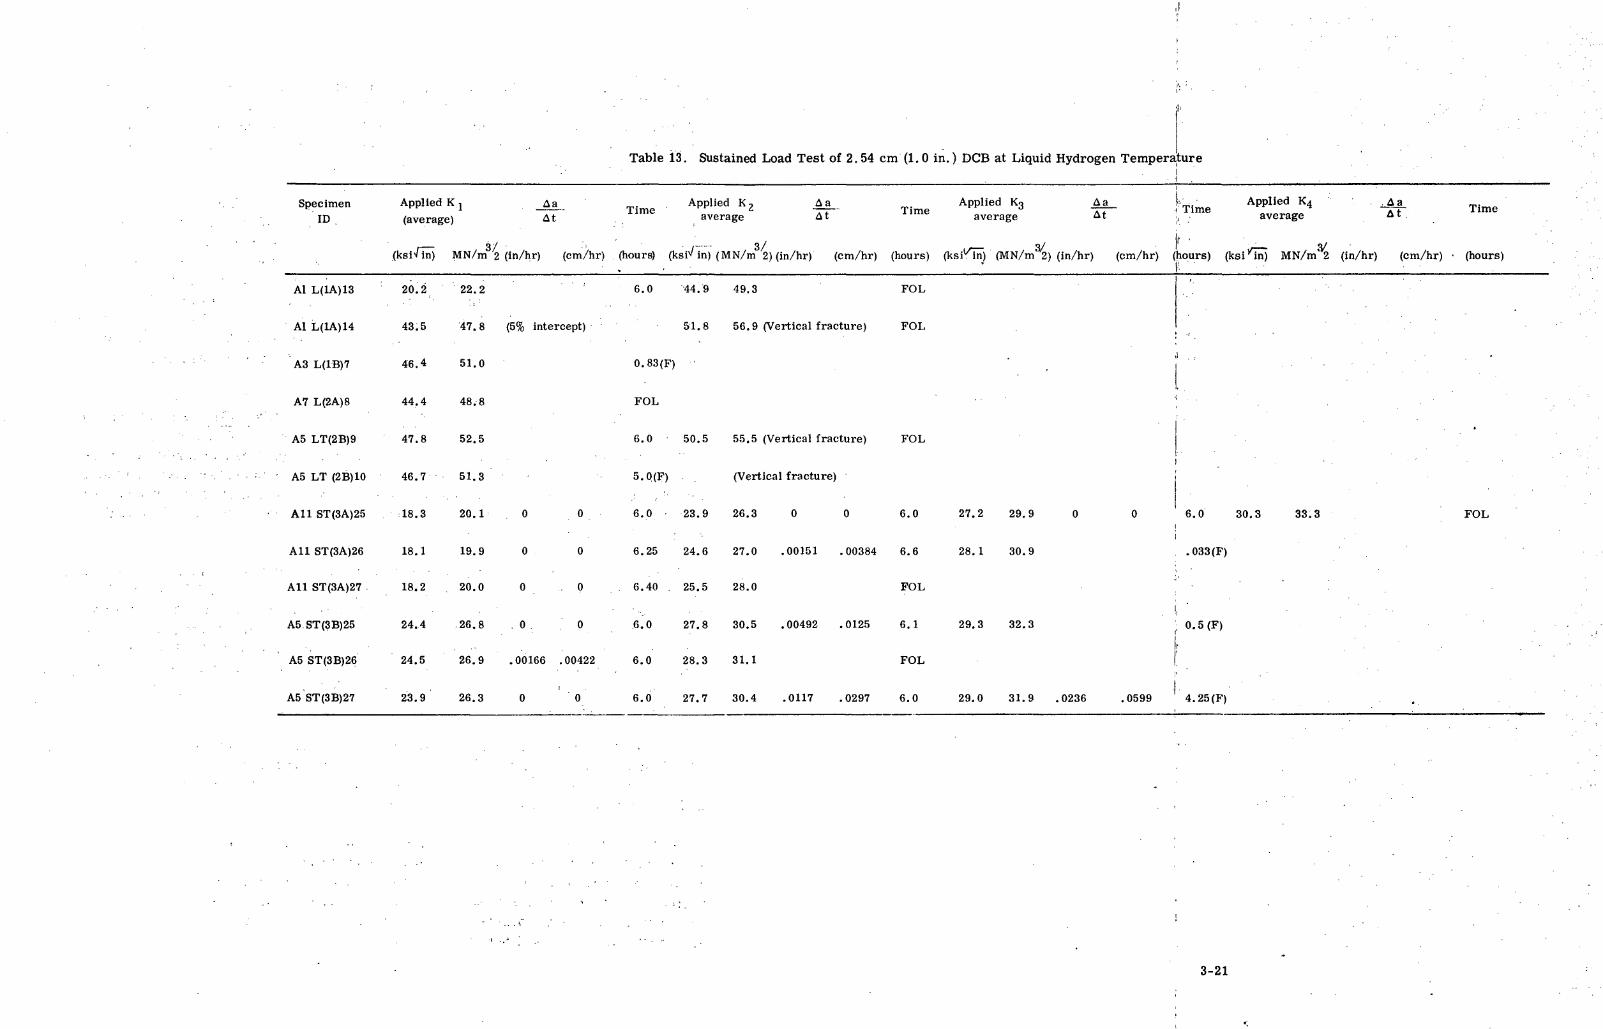
SpecimenID
Table 13. Sustained Load Test of 2.54 cm (1.0 in.) DCB at Liquid Hydrogen Tempera
Applied K j Aa .1 • Time(average) At
Applied K2 A a Applied K3 A aaverage At lime average At
ture.
•
'time Applied K4 •** Timeaverage At
(ksi'TIn) MN/m 2 (in/hr) (cm/hr) (hours) (ksi^in) (MN/m 2) (in/hr) (cm/hr) (hours) (ksil/in) (MN/rn2) (in/hr) (cm/hr) (hours) (ksi/in) MN/ni2 (in/hr) (cm/hr) • (hours)» • !'• '
Al L(1A)13
Al L(1A)14
A3 L(1B)7
A7 L(2A)8
A5 LT(2B)9
A5 LT (2B)10
All ST(3A)25
All ST(3A)26
All ST(3A)27
A5 ST(3B)25
A5 ST(3B)26
A5 ST(3B)27
20.2 22.2 ' ' ' 6.0
43.5 47.8 (5% intercept)
46.4 51.0 0.83(F)
44.4 48.8 FOL
47.8 52.5 6.0
46.7 51.3 5.Q(F)
18.3 20.1 0 0 6.0
18.1 19.9 0 0 6.25
18.2 20.0 0 .0 . 6.40 .
24.4 .26.8 .0 0 6.0
24.5 26.9 .00166 .00422 6.0
23.9 26.3 0 0 6.0
44.9 49.3 FOL
51.8 56.9 (Vertical fracture) FOL
. '
. . •! '. . . ' •
50.5 55.5 (Vertical fracture) FOL
(Vertical fracture)
23.9 26.3 0 0 6.0 27.2 29.9 0 0.
6.0 30.3 33.3 FOL
24.6 27.0 .00151 .00384 6.6 28.1 30.9 .033(F)
25.5 28.0 FOL
27.8 30.5 .00492 .0125 6.1 29.3 32.3 0.5(F)
28.3 31.1 FOL
27.7 30.4 .0117 .0297 6.0 29.0 31.9 .0236 .0599 4.25(F) .
3-21
3.2.5 THRESHOLD VALUES. Crack and fracture thresholds from the sustained loaddata are shown in Tables 14 and 15 for each of the six environments. Thresholds are
*defined as the stress intensity factor below which cracking or fracture does not occurwithin the time limit of the program,, Again, the time limits for hydrogen tests was360 minutes, with 1200 minutes for non-hydrogen tests.
Many of the values shown in the tables were quite conservative, since there were largedifferences in load steps for certain specimen orientations. If, for example, a speci-men survived an applied K of 15 MN/m3/2 but failed at a K of 39 MN/m3/2, the thresh-old was listed as 15. In fact, the true K may fall between those two values. All thresh-olds for the L(1A) specimens are conservative, since all fractures occurred in thedirection of loading rather than in the desired direction. The LT(2A) values for GH2
(room temperature and 422°K air as well ..as the LT(2B) value in 422° K air) are probablyconservative also. It appears that the fracture thresholds for the ST(3A) and (3B) ori-entations are higher in 3.5 percent NaCl solution than in air at 50-percent relativehumidity.
3.2. 6 PLANE STRAIN FRACTURE TOUGHNESS AFTER EXPOSURE. Part of the plan-ning of this program provided for obtaining more than one type of fracture data for eachDCB fracture test specimen. As reported, the optimum exposure test would have pro-vided flaw growth information, threshold information for sustained load tests, and tough-ness data under subsequent static tests. However, some specimens failed under cyclicor sustained load exposures. If the specimen survived* it was tested to failure in theenvironment to which it was exposed.
In all cases, an apparent fracture toughness value was calculated. (The word "apparent"is used to describe the toughness values obtained in deference to ASTM Standard E99,which does not recognize a DCB as a standard plane-strain fracture toughness test spe-cimen. ) When the specimen failed during cyclic or sustained load testing, a toughnessvalue was calculated using the maximum load and the last crack size obtainable underfractographic examination. For comparative purposes, critical crack intensity factor(apparent Kjc) and maximum fracture toughness values were both calculated for thespecimens statically tested to failure.
The apparent Kjc value was obtained using the 5-percent secant method described byASTM Standard E399. Flaw sizes, critical loads, apparent fracture toughness, andmaximum fracture toughness values are listed in Table 16 for cyclic test specimensand in Table 17 for sustained load specimens.
In virtually all cases, there is very little difference between the apparent fracturetoughness and the maximum fracture toughness for those specimens in which bothvalues were obtained. In some cases, the two values were identical, indicating a min-imum of deviation from linearity in the load-compliance curves. For hydrogen tests,only maximum fracture toughness values were calculated, since the static fracture testload-compliance curves either showed little deviation from linearity or were subjected
3-22
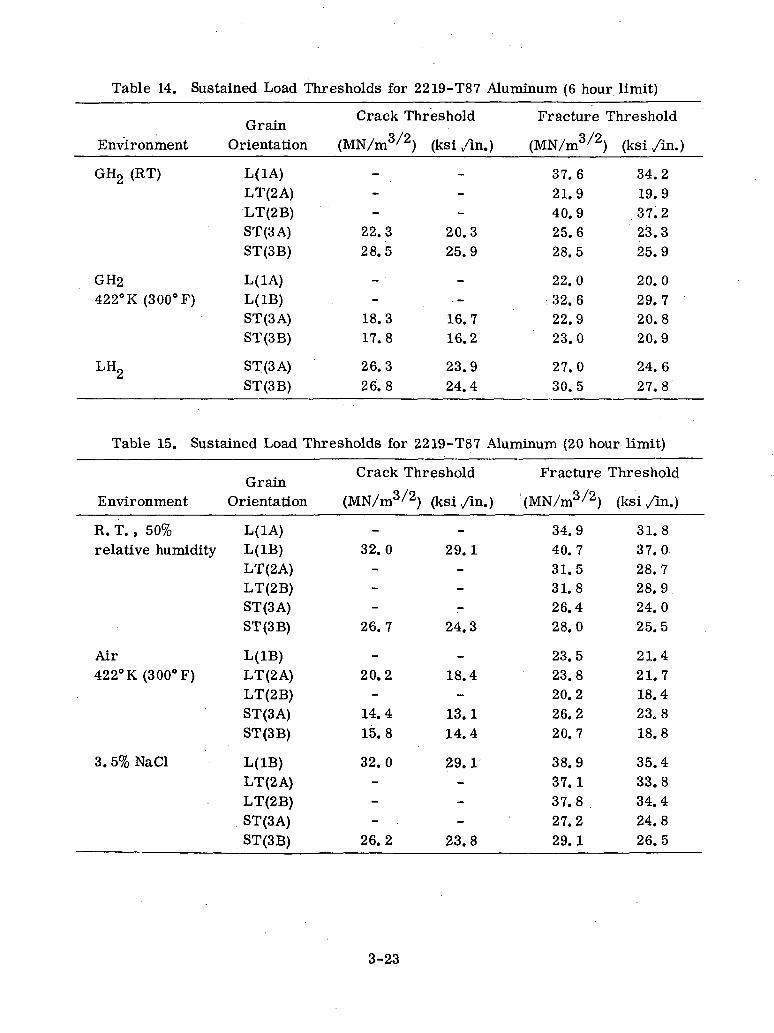
Table 14. Sustained Load Thresholds for 2219-T87 Aluminum (6 hour limit)
Environment
GH2 (RT)
GH2422° K (300° F)
LH2
GrainOrientation
L(1A)LT(2A)LT(2B)ST(3A)ST(3B)
L(1A)L(1B)ST(3A)ST(3B)
ST(3A)ST(3B)
Crack Threshold
(MN/m3/2) (ksi /in.)
--
'22.3 20.328.5 25.9
- '.
18. 3 16. 717.8 16.2
26.3 23.926.8 24.4
Fracture
(MN/m3/2
37.621.940.925.628.5
22.0:32. 6
22.923.0
27.030.5
Threshold
) (ksi /in.)
34.219.937.223.325.9
20.029.720.820.9
24.627.8
Table 15. Sustained Load Thresholds for 2219-T87 Aluminum (20 hour limit)
Environment
R. T. , 50%relative humidity
Air422° K (300° F)
3. 5% NaCl
GrainOrientation
L(1A)L(1B)LT(2A)LT(2B)ST(3A)ST(3B)
L(1B)LT(2A)LT(2B)ST(3A)ST(3B)
L(1B)LT(2A)LT(2B)ST(3A)ST(3B)
Crack Threshold
(MN/m3/2) (ksi/in.)
-32.0 29.1---
26. 7 24. 3
-20.2 18.4-
14. 4 13. 115.8 14.4
32.0 29.1--- .
26. 2 23. 8
Fracture
'(MN/m3/2)
34.940.731.531.826.428.0
23.523.820.226.220.7
38.937.137.827.229.1
Threshold
(ksi /in.)
31.837.028.728.924.025.5
21.421.718.423.818.8
35.433.834.424.826.5
3-23
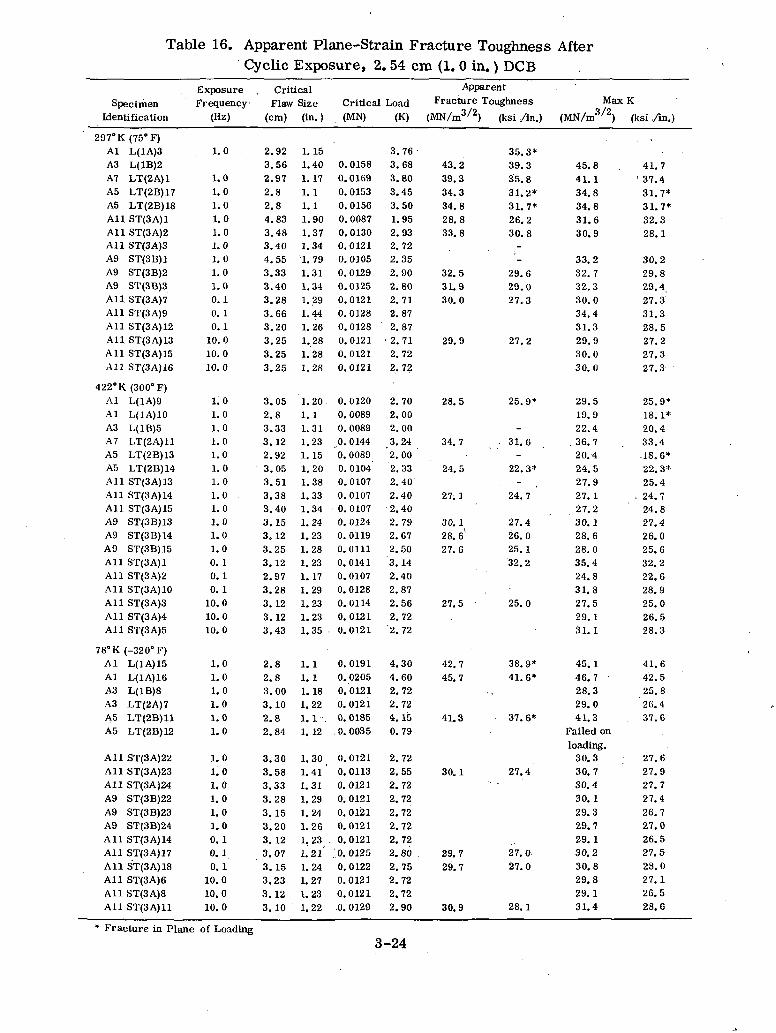
Table 16. Apparent Plane-Strain Fracture Toughness AfterCyclic Exposure, 2.54 cm (1. 0 in.) DCB
SpecimenIdentification
297°KAlA3A7A5A5AHAHAllA9A9A9AllAllAllAllAllAl l
422°KAlAlA3A7A5A5AllAllAllA9A9A9AllAllAllAllAllAll
(75° F)L(1A)3L(1B)2LT(2A)1LT(2B)17LT(2B)18ST(3A)1ST(3A)2ST(3A)3ST(3B)1ST(3B)2ST(3B)3ST(3A)7ST(3A)9ST(3A)12ST(3A)13ST(3A)15ST(3A)16
(300° F)L(1A)9L(1A)10L(1B)5LT(2A)11LT(2B)13LT(2B)14ST(3A)13ST(3A)14ST(3A)15ST(3B)13ST(3B)14ST(3B)15ST(3A)1ST(3A)2ST(3A)10ST(3A)3ST(3A)4ST(3A)5
Exposure . CriticalFrequency Flaw Size
(Hz) (cm) (in. )
1.0
1.01.01.01.01.01.01.01.01.00.10. 10.1
10.010.010.0
1.01.01.01.01.01.01.01.01.01.01.01.00. 10.10.1
10.010.010.0
2.923.562.972.82.84.833.483.404.553.333.403.283.663.203.253.253.25
3.052.83.333.122.923.053.513.383.403.153.123.253.122.973.283. 123.123.43
1.151.401.171.11.11.901.371.341. 791.311.341.291.441.261.281.281.28
1.20.1. 11.311.231.151.201.381.331.341.241.231.281.231.171.291.231.231.35 •
Critical(MN)
0.01580.01690. 01530.01560. 00870.01300.01210. 01050.01290.01250.01210.01280.01280.01210.01210.0121
0.01200.00890. 00890. 01440. 00890. 01040.01070.0107
• 0.01070. 01240.01190.01110.01410.01070.01280.01140.01210.0121
ApparentLoad Fracture Toughness
(K) (MN/m3/2) (ksi ./in.)
3.763.683.803.453.501.952.932.722.352.902.802.712.872.87
• 2.712.722.72
2. 702.002.003.242.002.332.402.402.402.792.672.503.142.402.872.562.722.72
43.239.334.334.828.833.8
32.531.930.0
29.9
28.5
34.7
24.5
27. 1
30. 128. 6'27.6
27.5
35.3*39.335.831.2*31.7*26.230.8-'-
29.629.027.3
27.2
25.9*
-31.6-
22.3*.
24.7
27.426.025.132.2
25.0
Max
(MN/m3/2)
45.841.34.34.31.30.
33.32.32.30.34.31.29.30.30.
29.19.22.
. 36.20.24.27.27.27.30.28.28.35.24.31.27.29.31.
18869
273043900
5947
•45912160488511
K(ksi /in.)
41.7' 37.431.7*31.7*32.328.1
30.229.829.427.331.328.527.227.327.3
25.9*18.1*20.433.4-18.6*22.3*25.4
, 24.724.827.426.025.632.222.628.925.026.528.3
78° K (-320° F)AlAlA3A3A5A5
L(1A)15L(1A)16L(1B)8LT(2A)7LT(2B)11LT(2B)12
1.01.01.01.01.01.0
2.82.83.003.102.82.84
1. 11.11. 181.221. 1 -..1.12
0.01910. 02050.01210.01210. 01850. 0035
4.304.602.722.724.150. 79
42.745.7
41.3
38.9*41.6*
37. 6*
45.46.28.29.41.
17303
41.642. 525.826.437.6
Failed onloading.
AllAllAllA9A9A9AllAllAllAllAllAll
ST(3A)22ST(3A)23ST(3A)24ST(3B)22ST(3B)23ST(3B)24ST(3A)14ST(3A)17ST(3A)18ST(3A)6ST(3A)8ST(3A)11
1.01.01.01.01. 01.00.10.10. 1
10.010.010.0
3.303.583.333.283.153.203. 123.073.153.233.123.10
1.301.411.311.291.241.261.23 .1.211.241.271.231.22
0.01210. 01130.01210. 01210. 01210. 01210.0121
,.0.01250. 01220.01210.0121.0. 0129
2.722.552.722.722.722.722.722.802.752.722.722.90
30.1
29.729.7
30.9
27.4
27.027.0
28.1
30.30.30.30.29.29.29.30.30.29.29.31.
374137128814
27.627.927.727.426.727.026.527.528.027.126.528.6
Fracture in Plane of Loading3-24
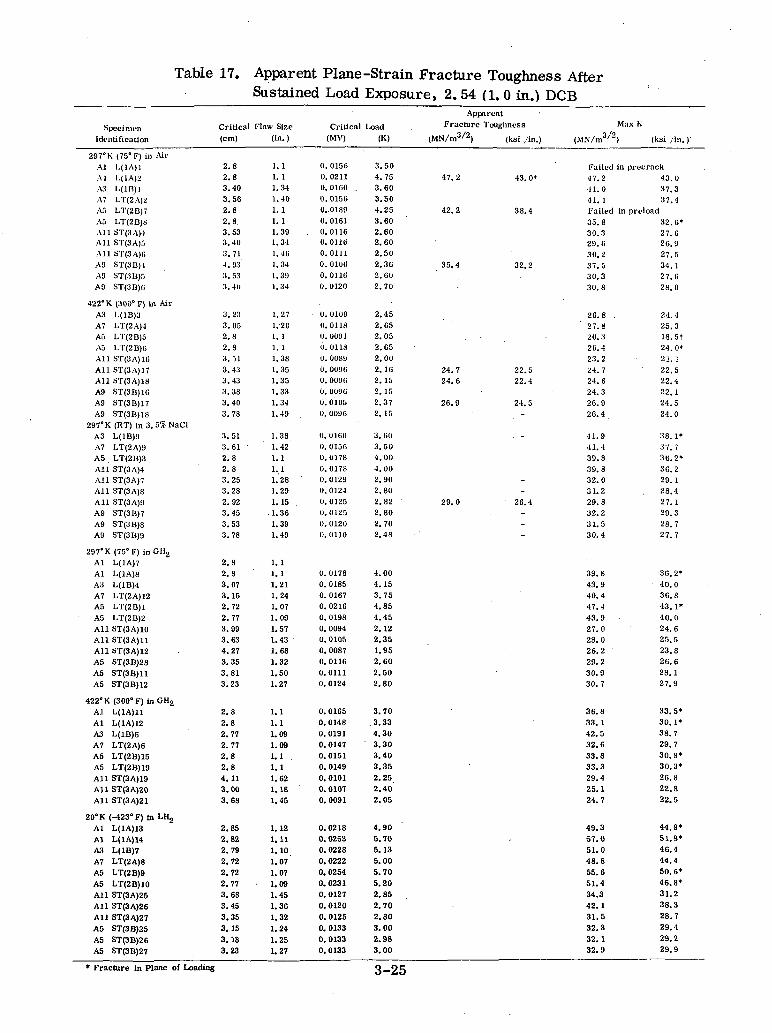
Table 17. Apparent Plane-Strain Fracture Toughness AfterSustained Load Exposure, 2.54 (1.0 in.) DCB
SpecimenIdentification
297° K (75° F) in AirAl L(1A)1Al I.(1A)2.•V! L(in)]A7 LT(2A)2A5 LT(2B)7A5 LT(2B)SAll ST(3A)4All ST(3A)5All ST(3A)«A9 ST(3BHA3 ST(3B)5A9 ST(3B)G
422° K. (300° F) in AirA3 L(1B)3A7 LT(2A)4A5 LT(2B)5AD LT(2B)GAll ST(3A)10All ST(3A)17All ST(3A)18A9 ST(3B)1CA9 ST(3B)17A9 ST(3B)18
297°K (RT) in 3. 5% NaClA3 L(1B)9A7 LT(2A)9A5 LT(2B)3All ST(3A)4All ST(3A)7All ST(3A)8All ST(3A)9A9 ST(3B)7A9 ST(3B)8A9 ST(3B)9
297°K (75° F) in GH2
Al L(1A)7Al L(1A)8A3 L(1B)4A7 LT(2A)12AS LT(2B)1A5 LT(2B)2All ST(3A)10All ST(3A)11All ST(3A)12AS ST(3B)28AS ST(3B)11AS ST(3B)12
422* K (300° F) in GH2
Al L(1A)11Al L(1A)12A3 L(1B)6A7 LT(2A)6AS LT(2B)15AS LT(2B)19All ST(3A)19All ST(3A)20All ST(3A)21
20° K (-423° F) in LHjAl L(1A)13Al L(l A) 14A3 L(1B)7A7 LT(2A)8AS LT(2B)9AS LT(2B)10All ST(3A)25All ST(3A)26All ST(3A)27AS ST(3B)25A5 ST(3B)26AS ST(3B)27
Critical Flaw Size(cm) (in. )
2.82.83.403.56
2.8
2.8.3.533.40
3.71J.933.533. JO
3.23
3.052.8
2.83.513.43
3.43
3.383.40
3.78
3.51
3.61
2.82.83.25
3.282.92
3.453.53
3.78
2.8
2.8
3.073.152.72
2.77
3.993.63
4.27
3.35
3.813.23
2.82.82.772.77
2.82.8
4.11
3.00
3.68
2.85
2.82
2.792.72
2.722.77
3.683.453.353.153.183.23
1.11. 11.341.401.1
1. 11.391.341.461.341.391.34
1.271.201. 11. 11.381.351.351.331.341.49
1.381.421. 11. 11.281.291.15
.1.361.391.49
1.1
1.11.211.241.071.091.571.431.681.321.501.27
1.1
1.11.091.091.11.11.621.181.45
1.121.111.101.071.071.091.451.361.321.241.251.27
Critical(MV)
0.01560.02110. 01CO .0.01560..01890.0161
. 0.01160.01160.01110.01060.01160.0120
0. 0109(1.01180. 009 J0.01180. 00890. 00900. 00900. 00960.01050. 0096
0.01600. 015G0.01780.01780. 01290.01240.01250. 01250. 01200. 0110
0.01780.01850.01670. 02160. 01980. 00940. 01050. 00870.01160.01110. 0124
0.01650. 01480.01910. 01470. 01510. 01490. 01010. 01070. 0091
0.02180. 02530. 02280. 02220.02540.02310. 01270. 01200. 01250. 01330. 01330. 0133
ApparentLoad Fracture Toughness
(K) (MN/m3/2) (ksiv/in.) (MN/m3/2
3.504. 75 47. 23.60
3.50
4.25 42.23.602.602.60
2.50
2.36 35.42.60
2.70
2.45
2.652. 05 .
2.652.00
2. 16 24. 72. 15 24. 62.15
2.37 26.92.15
3.60
3.504.00
4.002.90
2.802.82 ' 29.0
2.802.70
2.48
4.00
4.15
3.754.85
4.45
2.122.35
1.952.60
2.50
2.80
3.70
.3.33
4.30' 3.30
3.403.35
2.25
2.40
2.05
4.90
5.705.13
5.00
5.70
5.202.852.702.803.002.983.00
Failed43. 0» 47.2
41.041. 1
38.4 Failed35.830.329. G30.2
32.2 • 37.530.330.8
26.8 .27.820.32G. 423.2
22.5 24.722.4 24.6
24.324.5 26.9
26.4
. - 41.941.439.839.832.031.2
26.4 29.832.231.530.4
39.843.940.447.443.927.028.026.229.230.930.7
36.833. 142.532.633.833.329.425.124.7
49.357.051.048.855.651.4
34.3
42.131.5
32.332.132.9
Max K
) (ksi /in. )'
in precrack43.037.337.4
in preload32.6*27.626.927.534.1
27.628.0
24.425.318.5*
24.0*21.1
22.522.4
22.124.5
24.0
38.1*
37.736. 2*
. 36.229.1
28.4
27.129.3
28.727.7
36.2*
40.036.843.1*
40.0
24.625.5
23.8
26.628.127.9
33.5*30.1*
38.729.7
30.8*30.3*
26.8
22.822.5
44.9*
51.9*46.4
44.4
50.6*
46.8*31.2
38.3
28.7
29.4
29.2
29.9
* Fracture in Plane of Loading 3-25
to other noise indications that were impossible to isolate. (The hydrogen tests weremonitored and recorded at a remote site through .the use of extensive landlines, whichmay have had an influence on the compliance curves.)
In some cases, particularly for the L(1A) specimens, the toughness values calculatedare quite conservative because all fractures were in the direction of loading ratherthan in the intended direction. In virtually all cases, the crack changed its directiondirectly after the cycling precracking. Consequently, for purposes of these calculations,the critical crack size usedwas in the region of 3. 0 cm (1.18 in.).
As for the 0. 318 cm (0.125 in.) thick specimens, toughness values are consistentlylower for the ST(3A) and ST(3B) grain orientations. Also, minimum values for theST(3A) and (3B) orientations always seemed to occur at room temperature after sus-tained load exposure. Again, the specimens exposed to the 3. 5-percent NaCl solutionprovided higher fracture toughness values than the specimens exposed to room tem-perature air.
3. 2. 7 EFFECT OF NO PRECRACKING. To determine the effect of precracking offracture and flaw growth of the 2219-T87 specimens, various tests were performedwithout the benefit of fatigue precracking. The following tests were performed:
a. Static test, 2. 54 cm (1. 0 in.) DCB, room temperature
b. Sustained load, 2. 54 cm (1. 0 in.) DCB, room temperature
c. Sustained load, 2. 54 cm (1. 0 in.) DCB, 3. 5% NaCl
d. Cyclic load (1 cps), 2. 54 cm (1. 0 in.) DCB, room temperature, R = +0.3
e. Cyclic load (1 cps), 2.54 cm (1.0 in.) DCB, room temperature, R = +0.3
f. Static test, 0.318 cm (0.125 in.) fracture, 78°K (-320°F)
g. Cyclic load (1 cps), 0.318 cm (0.125 in.) fracture, room temperature
All tests were performed in the same manner as the corresponding precracked tests.
3.2. 7.1 Static Test. The apparent plane strain fracture toughness of the non-precracked DCB Specimen (ST 3A) was 43. 5 MN/m3/2 (39. 6 ksi /In.) at room tem-perature at 50-percent relative humidity. The majority of precracked specimensprovided values of less than 32 MN/m3/2 in tests at room temperature.
3.2. 7.2 Sustained Load Tests. The specimens used in sustained load testing (DCB,ST(3A) orientation) were exposed significantly longer in the environment, with periodicobservations for crack growth. One specimen exposed to room-temperature air at 50-percent relative humidity showed no crack growth for the following conditions.
3-26
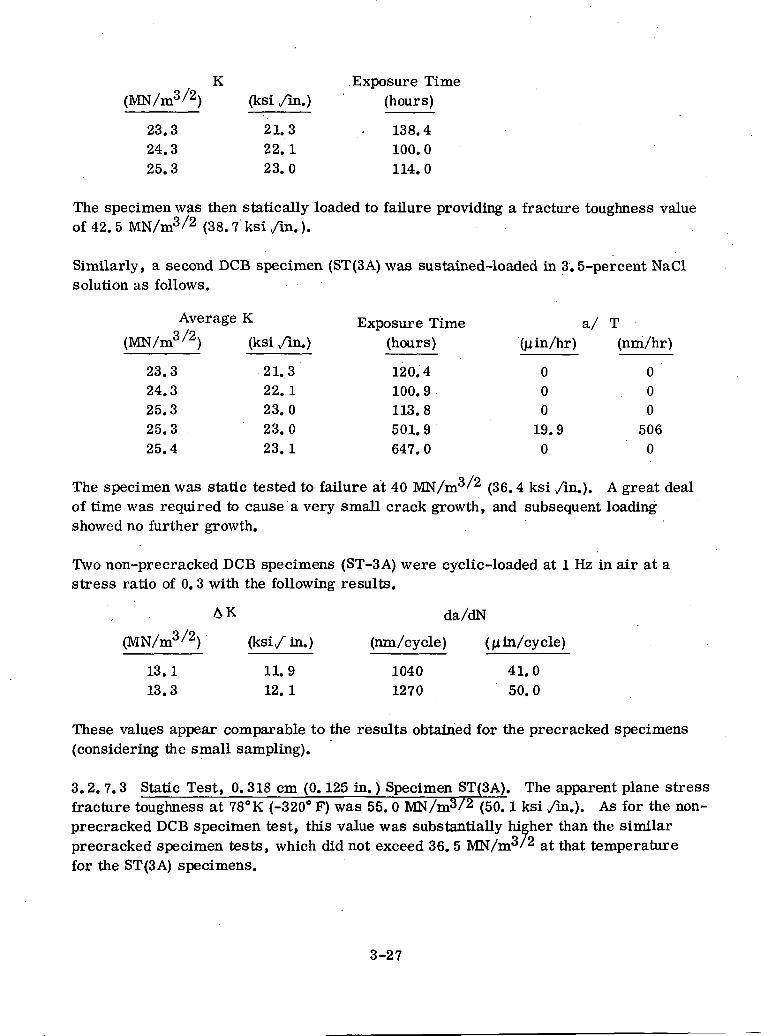
K Exposure Time(MN/m3/2) (ksi/in.) (hours)
23.3 21.3 - 138.424.3 22.1 100.025.3 23.0 114.0
The specimen was then statically loaded to failure providing a fracture toughness valueof 42. 5 MN/m3/2 (38.7 ksi/in.).
Similarly, a second DCB specimen (ST(3A) was sustained-loaded in 3. 5-percent NaClsolution as follows.
Average K Exposure Time a/ T(MN/m3/2) (ksi /in.) (hours) (^in/hr) (nm/hr)
23.3 21.3 120.4 0 024.3 22.1 100.9 0 025.3 23.0 113.8 0 025.3 23.0 501.9 19.9 50625.4 23.1 647.0 0 0
The specimen was static tested to failure at 40 MN/m3/2 (36. 4 ksi /in.). A great dealof time was required to cause a very small crack growth, and subsequent loadingshowed no further growth.
Two non-precracked DCB specimens (ST-3A) were cyclic-loaded at 1 Hz in air at astress ratio of 0. 3 with the following results.
da/dN
(MN/m3/2) (ksi/in.) (ran/cycle) (j* in/cycle)
13.1 11.9 1040 41.013.3 12. 1 1270 50.0
These values appear comparable to the results obtained for the precracked specimens(considering the small sampling).
3. 2. 7. 3 Static Test, 0.318 cm (0. 125 in.) Specimen ST(3A). The apparent plane stressfracture toughness at 78° K (-320° F) was 55. 0 MN/m3/2 (50. 1 ksi /in.). As for the non-precracked DCB specimen test, this value was substantially higher than the similarprecracked specimen tests, which did not exceed 36. 5 MN/m3/2 at that temperaturefor the ST(3A) specimens.
3-27
3.2. 7.4 Cyclic Test. 0.318 cm (0.125 in.) Specimen ST(3A). Three load steps wereapplied without precracking. The specimens were tested at 1. 0 Hz in air at roomtemperature with R = 0.3. The following results were obtained.
Average AK da/dN
(MN/m3/2) (ksi /in.) (run/cycle) Qi in/cycle)
13.5 12.3 161 6.3011.'0 9.97 225 8.9023.4 21.3 1810 714.0
Values obtained for the first two load steps of the unprecracked specimens fall withinthe scatter limits of the precracked specimens. However, the third load step providesa growth rate somewhat greater than that of the precracked ST(3A) specimens.
3.3 PART"THROUGH CRACK (PTC) TESTS
Static PTC test results are shown in Table 18 for tests performed at room temperatureand 78° K (-320° F). Very little differences are shown between longitudinal and longtransverse specimens. As expected, alloy toughness increased somewhat at 78°K(-320° F).
There is no clear relationship between toughness and the crack aspect ratio (a/2C).It appears that the greater depth of crack provides slightly greater toughness, but theinfluence is very small and erratic. Since the back face magnification factor increasesas flaw depth increases, the slight variation may be due to this mathematical influence,,
If the maximum gross stress is examined, however, the influence of the flaw depth isnot apparent. Similarly, there seems to be no correlation between gross stress andcrack aspect ratio. It would seem that the specimen containing the largest crack wouldprovide the lowest gross stress, but such was not the case.
3.3.1 PTC CYCLIC TESTS, 0.318 cm (0.125 in.) SPECIMENS. Part through crack(PTC) specimens 0.318 cm (0.125 in.) thick were cycled at slow rates (about 0. 05 Hz)in room temperature air and in liquid nitrogen. Crack growth in the 2c direction wasmeasured optically during testing and in the a and 2c directions after fracture. Resultsof the tests at room temperature and 78°K (-320° F) are shown in Table 19. In speci-mens of this thickness, flaw growth rates are difficult to measure because of the prob-lems associated with measuring very small crack extensions. Consequently, it wasalmost impossible to measure more than one crack growth rate per specimen. Eventhose measurements were not precise, as evidenced by the rather large scatter in testdata.
Where possible, the stress intensity factor at fracture was measured. Again, the in-ability to measure crack size and shape precisely resulted in sizable scatter.
3-28
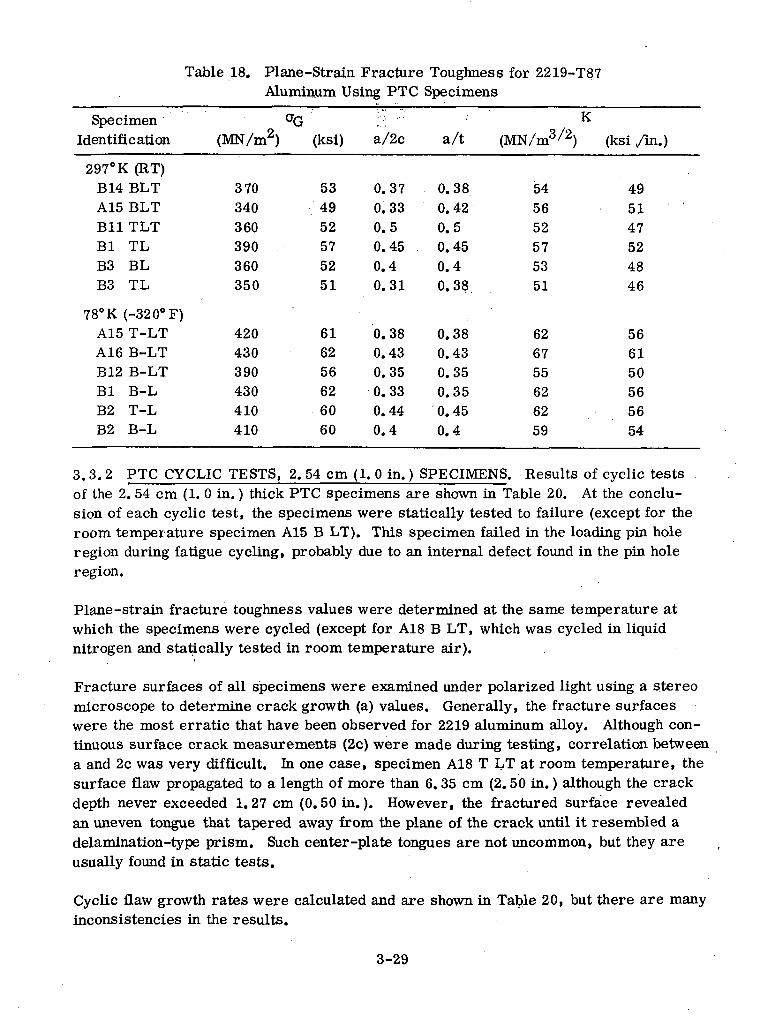
Table 18. Plane-Strain Fracture Toughness for 2219-T87Aluminum Using PTC Specimens
SpecimenIdentification
297° K (RT)B14 BLTA15 BLTBll TLTBl TLB3 BLB3 TL
(MN/m2)
370340360390360350
(ksi)
534952575251
a/2c
0.370.330.50.450.40.31
K
a/t (MN/m3/2) (ksi /in.)
. 0.380.420.50.450.40.38.
545652575351
495147524846
78° K (-320° F)A15 T-LTA16 B-LTB12 B-LTBl B-LB2 T-LB2 B-L
420430390430410410
616256626060
0.380.430.350.330.440.4
0.380.430.350.350.450.4
626755626259
566150565654
3.3.2 PTC CYCLIC TESTS, 2. 54 cm (1. 0 in.) SPECIMENS. Results of cyclic testsof the 2. 54 cm (1. 0 in.) thick PTC specimens are shown in Table 20. At the conclu-sion of each cyclic test, the specimens were statically tested to failure (except for theroom temperature specimen A15 B LT). This specimen failed in the loading pin holeregion during fatigue cycling, probably due to an internal defect found in the pin holeregion.
Plane-strain fracture toughness values were determined at the same temperature atwhich the specimens were cycled (except for A18 B LT, which was cycled in liquidnitrogen and statically tested in room temperature air).
Fracture surfaces of all specimens were examined under polarized light using a stereomicroscope to determine crack growth (a) values. Generally, the fracture surfaceswere the most erratic that have been observed for 2219 aluminum alloy. Although con-tinuous surface crack measurements (2c) were made during testing, correlation betweena and 2c was very difficult. In one case, specimen A18 T LT at room temperature, thesurface flaw propagated to a length of more than 6.35 cm (2.50 in.) although the crackdepth never exceeded 1.27 cm (0.50 in.). However, the fractured surface revealedan uneven tongue that tapered away from the plane of the crack until it resembled adelamination-type prism. Such center-plate tongues are not uncommon, but they areusually found in static tests.
Cyclic flaw growth rates were calculated and are shown in Table 20, but there are manyinconsistencies in the results.
3-29
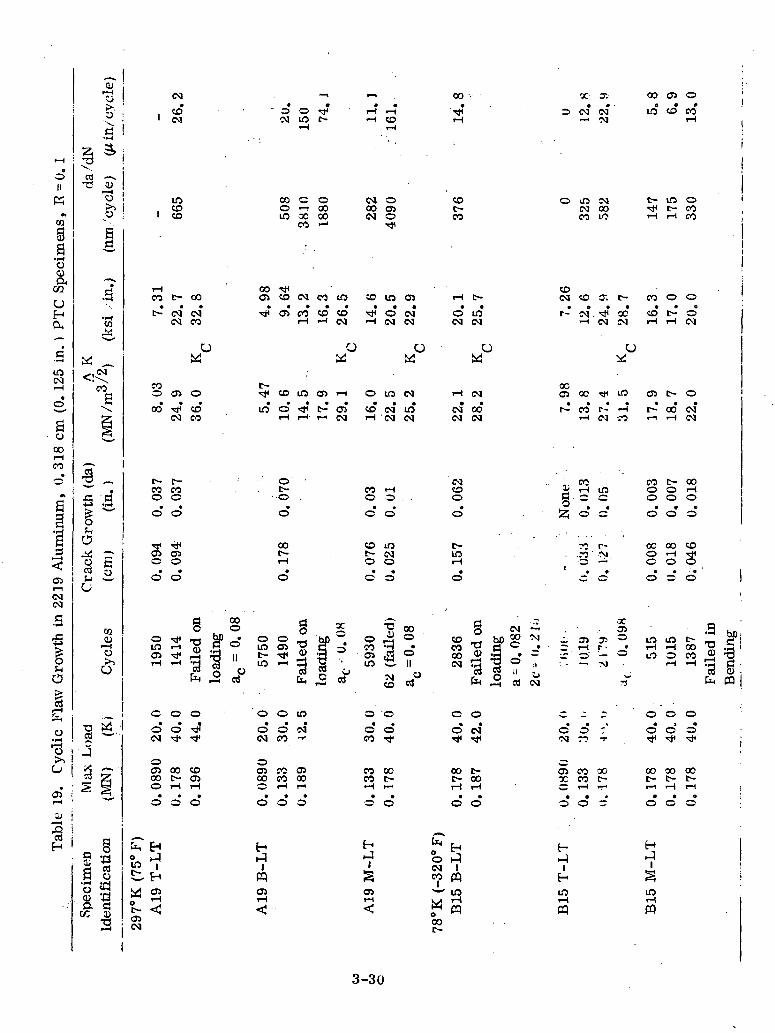
0II
••CQ
sfl'o
CQr.
EHCu
C
CM
O
8ooorH
«
9g13*^-*
os<N<N
\v G
row
th i
n
£Cj
o>>O.
OSrH
1
2
,3
*<!
I
J
O^Oj*sooj
T3
C• ~\
jCy
^>
C
g•I-l
I
"
-St '^g
E--N
CUOr lo
53
•
'CQ
\COg
y^&l$,
.3"~'
~g*5^
CQ
i — l0
_
£4 .'
i *»*xjtj^H
§
•j3nS•rH
1
2
CM•
CD1 IN
i <°I <o
rHCO t- 00
C-* CM* <NCM CO
U
CO0 OS O
00 * CD<N CO
t- c-
§ §
0 O
os os0 O
1 00 O
o "tf T-< bS 3 ® -OS -^ r_, —
*-• - S 1
O O O• • •
"5 "5 " ^
CM •<* •*
0os oo coOO t- OSO i-H rH
• • •0 0 0
fa EH
J2 J>— ' t~*
°t- 3osCQ
•• o o?g m
1-1
co oO r^
in occo
oo ^OS CO <N
• OS COI— 1
• co inin o ^
rH rH'
ot-0
o*
00c—i-H
a
0
oo a° o
3 O* ° ° Tj
I, t- •* **
o w 1rt U,
o o ino o c«*eg eo -•
oOS CO OSOO CO 00O rH T-l
• • •o o o
t-hH1
PHOSrH
*3< rHO -H
O CM00 0000 CXI»-J
co in 10CO CD Tfr-l CXJ iH
X?
OS t-i O
C- OS CDt- (N rH
COO
0*
COt-0
0
o
ocbp°. 09 o ^•d ' C7S
w ' ^C f
r C"3
ooeo
COeo^H
v
O
E-i-J
^"OSTH
co •• •
CD rH
. ""*
o coos t-O CO
in os t-i t-o CM o in(N CM <N CM
0 0
in CM I-H CM
CM in CM oo'<N CXI (N CM
NT-H CD0 . . O
o* o
m t-CM in0 rH
m m
0 0
t
^00 § CM -5ri <=> CD ^ hO § ^
*~ o ™ o '' oCO rf fa -2 CS CM
'0 0 O• • •
O O CXI•* •* -
00 00 t-C- C~ 00r- I-H I-H• • •
O O 0
^^
« EH0 KJI
'y PQ" in
M ^o PICOf-
OC X
D <N CM
O in CMCM 00CO if}
CDCM co cr. t-
^ CM . Tj* 00-H CM CM
U
00os oc j< in
r-* CO (••- -HrH PI CO
- . - • • -Ij rH in| = e
S5 o* o*
- • -^ ' •
O — "•1 -• -;
Xos
^ 05 55 °
i o r- o'
^ — ~o o :'<M r; -t-
.•OS CO 00x co c-O rH •—• • •
o o tr
t-
ii1
mT-l
M
ooo
m
t-jirH
CO
corH
OS
fj
i— t
COooo*
oooo
9
o
ini-Hm
o•
o•
ooc-f—l
m
o
Hi— 1l^inrH
OSo
CD
inc-i-H
O
c-rH
t-
oo*i-H
e-o0
o
ooo
9
'
morH
0
o•*
coo?-H
4
O
O0
CO1-1
0COco
o0CM
O
<N*CM
ooi-HO
0
CD
s.• o 'O
'
1387
Faile
d in
Ben
ding
oo '•
\
oot-r— 1 [
o I
:
3-30
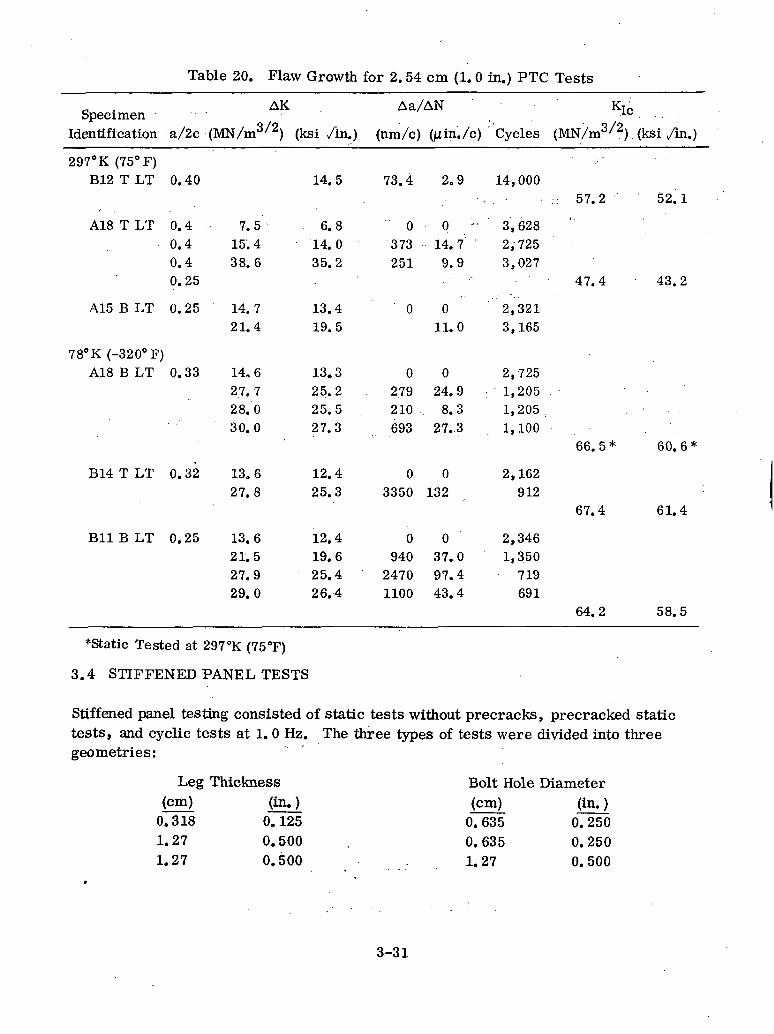
Table 20. Flaw Growth for 2.54 cm (1.0 in.) PTC Tests
0 . AK Aa/AN KIcSpecimen , 1U
Identification a/2c (MN/m3/2) (ksi /in.) (nm/c) (/z in./c) "Cycles (MN/m3/2). (ksi/in.)
297° K (75° F)B12 T LT 0.40 14.5 73.4 2.9 14,000
• , . • • • :.: 57.2 52. 1
A18 T LT 0.4 7.50.4 15.40.4 38.60.25
A15 B LT 0. 25 14. 721.4
78°K (-320° F)A18 B LT 0. 33 14, 6
27. 728.030. 0
B14 T LT 0. 32 13. 627.8
Bll B LT 0.25 13.621.527.929.0
. 6.814.035.2
13.419.5
13.325.225.527.3
12.425.3
12.419.625.426.4
0373251
0
0279210
693
03350
0940
24701100
o •-14.7' '9.9
011.0
024.98.3
27..S
0132
037.097.443.4
3,6282,7253,027
47.4 43.2
2,3213,165
2,7251,205 . ' •1,205 , .1,100 .
66. 5 * 60. 6 *
2,162912
67.4 61.4
2,3461,350
719691
64. 2 58. 5
*Static Tested at 297°K (75°F)
3.4 STIFFENED PANEL TESTS
Stiffened panel testing consisted of static tests without precracks, precracked statictests, and cyclic tests at 1. 0 Hz. The three types of tests were divided into threegeometries:
Leg Thickness Bolt Hole Diameter(cm) (in.) (cm) (in.)
0.318 0.125 0.635 0.2501.27 0.500 , 0.635 0.2501.27 0.500 . 1.27 0.500
3-31
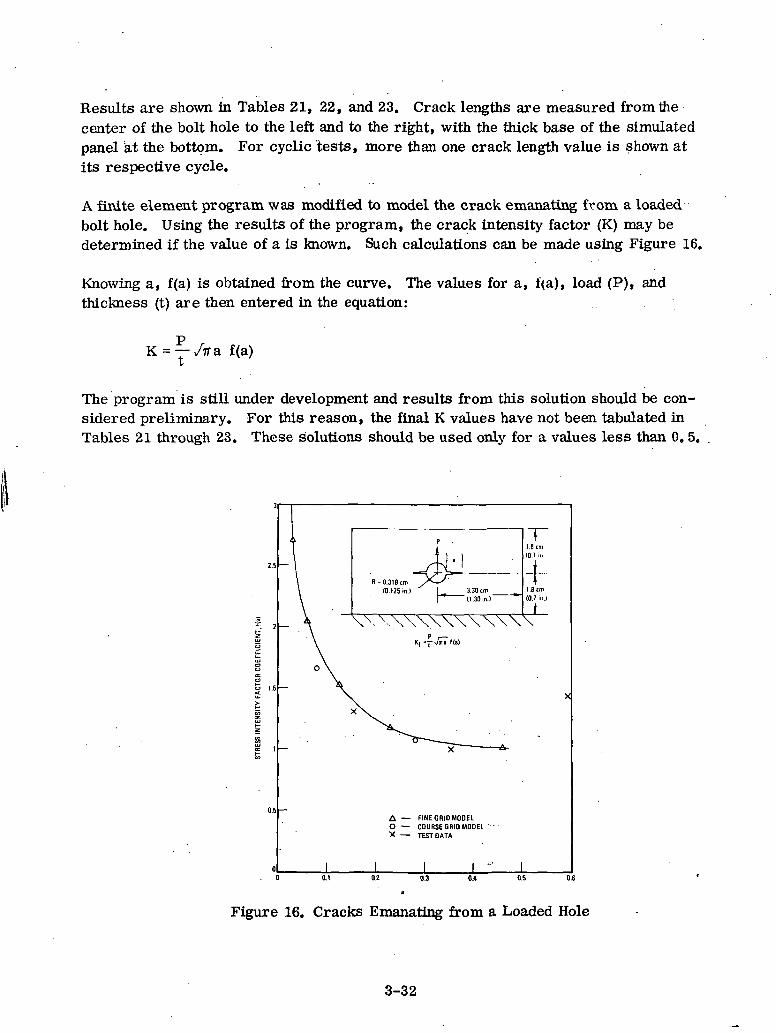
Results are shown in Tables 21, 22, and 23. Crack lengths are measured from thecenter of the bolt hole to the left and to the right, with the thick base of the simulatedpanel at the bottom. For cyclic tests, more than one crack length value is shown atits respective cycle.
A finite element program was modified to model the crack emanating from a loadedbolt hole. Using the results of the program, the crack intensity factor (K) may bedetermined if the value of a is known. Such calculations can be made using Figure 16.
Knowing a, f(a) is obtained from the curve. The values for a, t(a), load (P), andthickness (t) are then entered in the equation:
= -/Tta. f(a)
The program is still under development and results from this solution should be con-sidered preliminary. For this reason, the final K values have not been tabulated inTables 21 through 23. These solutions should be used only for a values less than 0. 5.
A — FINE GRID MODELO — COURSE GRID MODELX TEST DATA
Figure 16. Cracks Emanating from a Loaded Hole
3-32
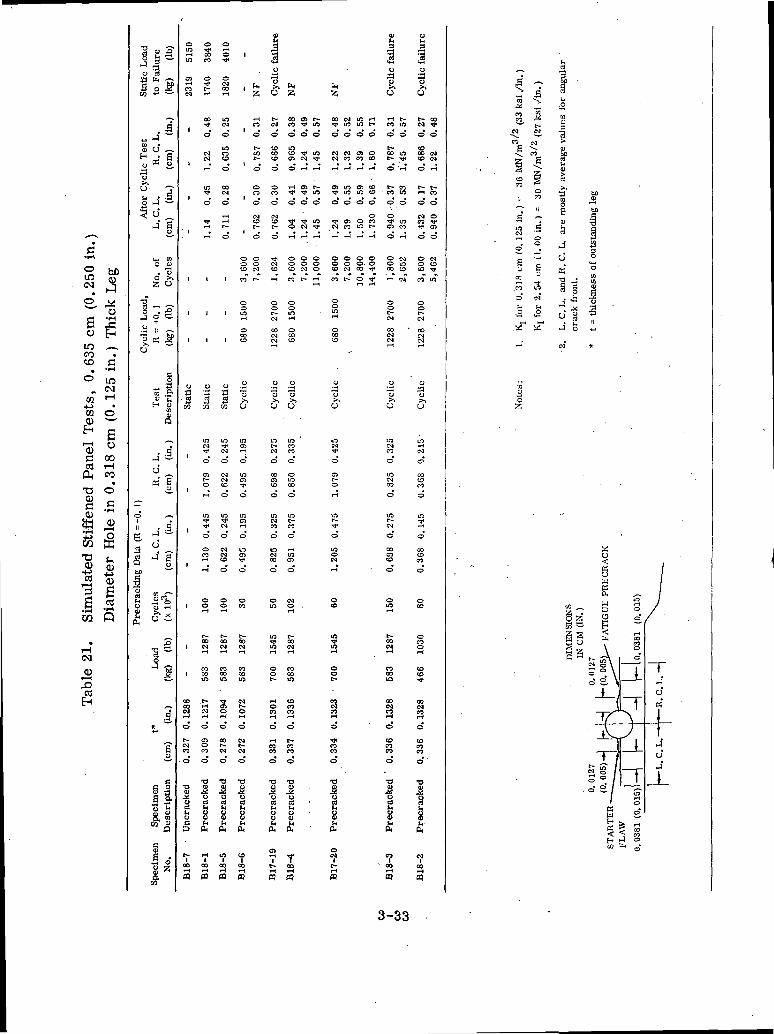
ao
IDCOCD
02-MCQm
5
C••->
10
oo
T3 O
"
1£ «•S •*~t
CQ Q
1"o
TJ
w
CQ0)
u
1<i
ioJCJ
u
u
.—.
o
IIg.
-3Sbo
o2O
£t-ift
OJ A
•3
SI1
4 *"*o —
• SP* o
J4 —u4 ?
O
WH CQO CV
O ^
II -*.CM .is
g- aS .a
CO
. .g"cJ
0
__
4 SoJ 1
**•'
1CO r-t>> *o c.
•g a
J S
*
1*-"
a
§ 5a 3.8 oa. a« u
Q
ao
•5 o° z1
Oinin
01rHCOCM
I
t
' 1
\
1
t)
W
1
1
1
1
1 .
1
1
00
0
c-0)CO
o
•sij£a
c-
OO
B)
0
CO
o
00
o
CM
rH
^fo
rH
rH
1
1
O3-3
inCM•
O
Oit-o1-1
in•o
oCO
rH
O0
J^00
COCOin
5
O
OioCO
o
•aJ8d
8U,
ft
CO
m
or-lO
O
CO
so
io
CO
o
rH
t-
o
1
oGOT
inCM
o
CM
CD
O
inoao
CM
SO
Oo
t-COCM
Sin
aoo
00t-
o
TJ
1aI
ft
inCO
CQ
,
i
(
oo
oomrH
OCOCD
O
*yO
in
"~Jo
in
-*o
inm
o
inOS
o
oCO
t-00O)
COCOvn
So
0
CMc-M
O
•o
18t-i
CO1
CO
CQ
%
CO
o
r-00f-
o
oCO
o
CMCDt-
0
Oo
failu
re
o
u
CM
O
COCOCD
O
oCO
o
CMCDr-C3
CD
OO
CO
C-J
u
O
int—CM
O
COOS
o
mCMCO
o
inCO
o
oin
in
oo
0CO
o
rH
O
•a&u
u(Uha,
a>'ft-
m
%
OO OS t-co ^ mo o o
lOco Tt« mOS CM ^P
i-H OS E—
o o o
s «
o o oo o oCO IN O
ooinrH
oCOCO
u
"ou
m 'COCO
o
om00
0
inc-coo
rH
OOS
O
CNO .
r-co
CO00in
CDCOCO
0
t*S30
•aSorto<u
£
Tan
PQ
§
00 CM in iH•^ in m t-o o o o
CM CM OS OCM CO CO CO
TJ* in in coo o o o
o•<}< OS O COCM co m t-
o o o oo o o oCD CM CO rf
OOin
o00ID
-
JJ
*o
U
inCM•
O
c-o1-1
ID
•
O
inoCM
rH
OCD
in
Soo*"
srH
O
•*COCO
o
T5
^280.
o(N
e-
3
g
o
uo
rHCO
o
c-00
o
t--coo
oeno
0o00
oof-CM
CO(MCM
O
"o
o1
0CMCO
o
mCMOO
O
^CM
O
COOSCO
o
oinrH
C-00
COoolf>
COCM
3O
COCOCO
o
'•a
^28P,
7CO
3
ino
in
rH
ino
inCO
LO
<D
IU
t- 00
o o
COCO CMCD CM
O rH
t- t-rH CO
0 0
N OCO Tf
o o
O N
CD Tf
OO
CO
CMrH
O
U
U
CM
O
CO
CO
o
in-^o
CO
CO
o
oCO
osCOCO
COCMso
CO
8ci* '
•o
1ocu(H
*?00rH«
5 2
6;js
o2!
5
13
5"
•S i
to
73
ag
4uK-a ^§ §
" a „4 t3 ^
3-33
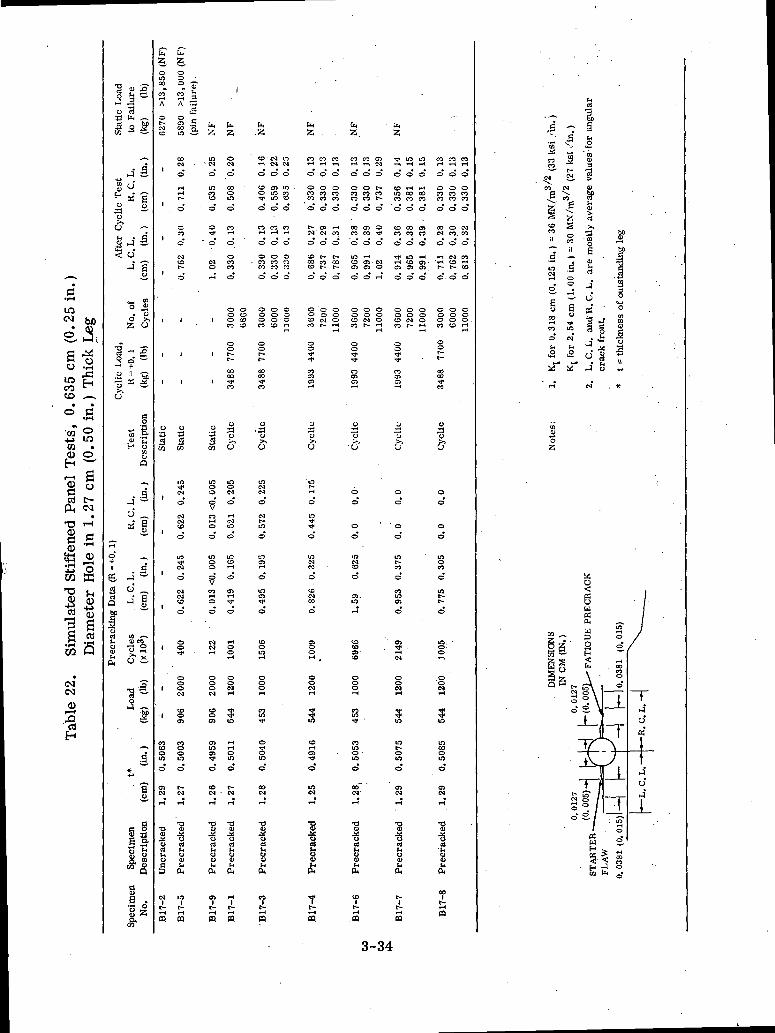
^^•
S3•rH
<M bfl
S *0 SW *rH
Ift E^CO ^^to — ,
°* H•rH'CO ^
"w •o o£H *s—'
•-• su gccd t—
(X, <Mv
m
c .Si§ 3T! ow ffi-o ^"pj +•3 S
as.
<MIM
i-*
as
__ >
rf 2 £
y *c3B &. ~*3 o j*PCO * C.
-^ J-l1 <->0*1
oo ~
S-t • C5S 4 5< o
£
[0o _«. o
IS O
f ~.I.a * Mo ••— -
u
o*•* 5.
H oCOo»Q
~.3
o _^EJ y
3-— "
o ._+ ^
g, _j —
| J ?
bo ^
SoCtJ (0 — *
s fl14 o 2-
•o '§oJ g
i*
B""*
rt
II11
QJ
§ 0-•rt OS r5
fcT C
O O
00 O •£?•
n co" "A A ^1
o ° r-
s i sCOCM
O
,_,
s. 0*
g^
r-i
o
t i
i i
i i
H -H
I I
§CM
0*
O)<N
1 .O
So
CMCM
1 •O
1 O
oo
1 OCM
CO1 O
CO COCO Oo oin ino o*
O3 t-CM CM
rH rH
<u ***J£ Oo rta j~>u o§ £w CU
CM ini i
c- c-rH rHCQ PQ
fe
m•- No
tnso
o
o
§rH
'
.y
t»
inoo
?'CO
oo
i?COrH
O
HoooCM
§
Oiinen
o
COCM
""*
1S0>t-l
ot-rHm
i
§oCM
O
COgo
ao'
CO
o*
o oo «>0 COCO O
oo
COCO
CO
o;3
61
gCM
o"
^H
CM
o
COrH
o
rH
O
o1-1
ooCMrH
^
Oino
c-d
*"*
1tt
rH1r-rHm
."Z
CO CM to
O O O
CO CP IO -s s §0 0 0
CO CO COrH t-H H
O O O
CO § CO
o o o
o o oo o oo o oCO CO rt
oop-r-
COCO
CO
y.^3
2*
LOCMCM
O
CM
mo
io
en
o
1rH
0srH
S?
osino
COCM
*""*
"OIo8
7t-rHCQ
S , .eo co co
o o o
o o oCO CO CO
o o o
t- en rHCM' CM CO
O O O
S t3 £
O O O
S o oo o
CD CM OCO t- rH
Oo
8en
y
Z3y
U
r~iH
O
in
o"
CO
o
COCMCO
o
so
o0CMrH
^
en
0
inN.*"*
1sto£
tt-rHCQ
a.
co co en
o o o
o o t-CO CO CO
o o o
OO CJi O
o o o
S S'o0 0 rH
o o oo o oCO CM Oeo P- «-H
oo
COOJ
rH
y
•6'
oo"
oo"
i0*
en.mrH
CTJ-
o§rH
" .
CO
sino
co"«•1-1
J^o
£
CO
rH
.CQ
u.
•* in in
o o o
CO rH rH
in oo ooCO CO CO
o o o
co co mCO CO CO
o o o
en en m'o o o
0 0 0o o oCO CM OCO r- rH
oo
CO05
-H
o
^*y
61
o<z?
' oo"
r-CO
o
seno
CM
OOCMrH
3«m
mt-0tno
enCM
^
•Srt
O0>
rU
r-I
c—rlCQ
CO CO CO
o o o
0 0 0CO CO CO
o o o
00 O CM
o o o
£ ^:coO-.O 0
o o o§o oo o .CO CO rH
®
cS
CO
o
z3
$
oo
o0*
oCO
o
int-e-o
m, •o.orH
OOCMrH
3Jm
inCOoino
enCM
rH
1O<u£
Tt-rHCQ
LIrt
• - — • gju
,S -7 §""' 5 «H
•s ^ 5•^ To 'm
CO 3
c^ £J. >eo CM <u
c "*^ bfi< «. £S "5^ 55 rt50 S >," o 5il „ M
7 1 £•5 ~ a•n 3 %CM ™
3 °. jE" i °-O £3 cd
CO » S ^
co in §5• • .o CM • i
IH S- J _•,
"1 1 y! 1x x j t•H N
O
OZ
Xo<
gwCfi£
g- 3
i§ |Sg 2Sz \3S -s\
3 8\° . \* O \o S. ^
f— ~ j
1
IFpSs /3°. /o-S/
awH
5-g
blO
c1
f
B1
! S, s> h^c
U
!. *
• /./
io /g /rf/
. COCOoo"
— ; T1 T" *3
O— T
t «
_J_ J
H— -3
t I
;- wrH
. 0
0
|iJ 0
* o-
3-34
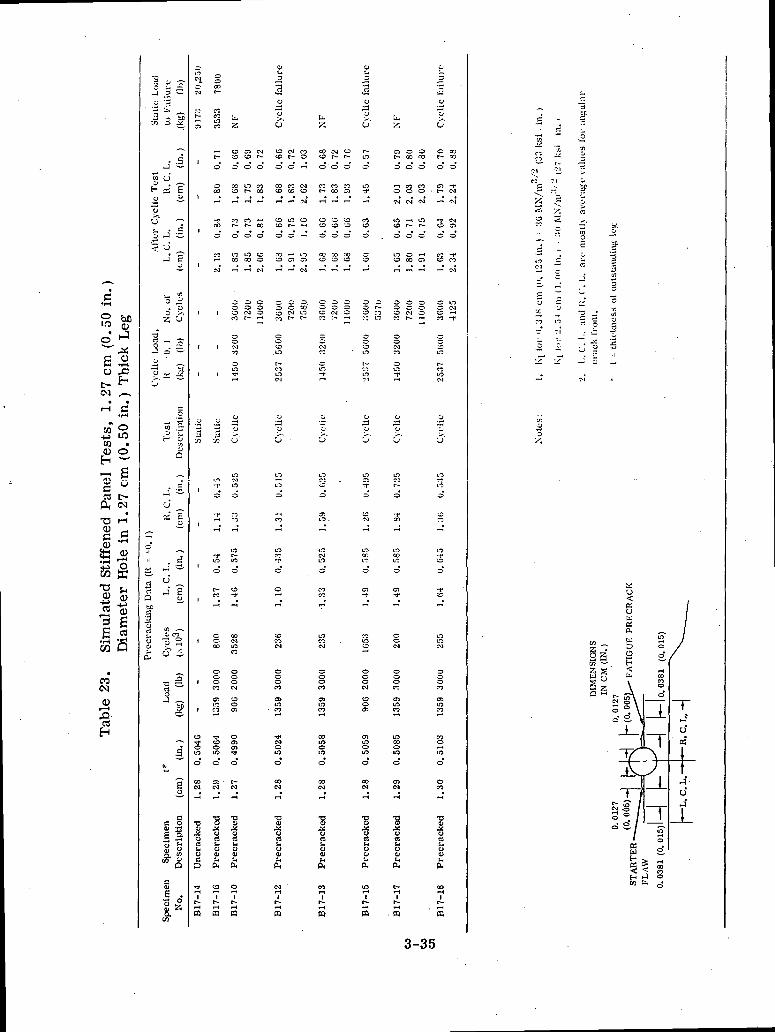
1?
S |O •""
^ oC .50 £1
E™*<M -
• *rH C•*•*
°^ SCO .CD O
EH ""'*— t Sf\\ r?s «ea c-
PH iNT5 rHCD ^^C C
.tH
*M rt}
« ow SB
CD Q)
45 "SI «3523
(M
SH
j^3;o
W
^CJ
CT
3<
i,0
73- '
q-
.fii
£
o
g
Prc
cra
ck
'3 =-
^ tc
-^
. .2
CJ
d f
"7-j 3.;_>-f S
J
«!
. UD /-*-.
— ^"
~- 5~" ' —
=
__ S
w .5*H S
a
^
,• -S"^ 'u ^2: £
^
^^
o-*J "sj_
If
S"rt ""o
£.
I^ ^
?o
c §
III§W Q
11
1 o
&*
CM
fC
S
,
i
(
t
,
O
'3•ji
,
(
'
,
'
'
CO
so
00
•^
^uC3
Uc
"I1rH
1r-
«
oCOt—
COCO
CO
r-1
t-0
00
rH
-pCO
o
CO
1
,
0
•573
-ro
T
1-1
-1*LO
O
CO
"*
§00
oooCO
Cl
CO
so
o
s1-1
1CJ
oOJ
CO
1r-
CQ
U,
co aCO CO
o o
oo inco r-
CO COo t-
0 0
LO LOoo oo
o o0 OCO CMCO ^~
o
io
o
•-1
.y"pu'
LO
LO
o
«rH
LO
LO
o
s*"*
00
mCO
oooCM
O
oCl
o
t-CM
^
•aourt00)
a!
0
1f".
m
CM
O
COCO
00
o
o
ooo
au3
3o
"u6'
CO CM COco r~ oO O -H
S CO CM00 CO
CO f- rH
O O -H
OO i-1 LO
0 O Oo o ooO CM LO7T f- C-
ooCO
.LO
IT-
COLOCM
CJ
1)
u1 -
LO
LO
O
CO
1-1
LOCO
o
o
^
COCOCM
oooCO
o>COT-l
CMomo
oo
rH
•c
rtbCD
CMrH1
2
u.
00 CM COco t~ r—
O 0 O
CO CO COr- oo O
CO CO COCO CO CO
0 0 0
oo co aoCO 10 CO
o o oO O 0CO CM O
=CMCO
-T1-1
.i0u'
LO
o
LO .
1-1
LOCMLO
o
COCO
r*
LOCOCM
oooCO
dinCOr-t
GO
o
o
ooCM
r-(
•8•gB
o
£
CO
1t-3
o
[rt
CJ
p6'
r-LO
o
LO
so
3
o oO r-s s
oCOlO
r-10M
u
"o
^'
LO
^o
CM
^
LO00
=Cl-r
^
i
oooCM
COoOS
enomo
00M
*"*
•8•grtJj01•*
«nrH
1t-
«
,._
^O 0 OC- CO CO
o o o
S 8 8
co r- P-O 0 O
LO O rHCO 00 O
CO CM O
ooCMCO
oLO
•-1
0
"p6'
LOC*!r-o
3rH
LO00LO
o
Cl
^
ooCM
oooCO
enCO1-t
inCOo•ino
OSCM
rH
1CJrtLioQJ
p,.
1
. 3
o3
J20
pu
C COr- coo o
r- CM
3 S5o o
S 3
O LOO CM0 rH
co -r
o
LO
LO
,jj
"po"
LO
ioo
ro1-1
LO-rCO
0*
3 '~"
sCM
ooCO
OSinCO
COomo
oCO
*-*
1C5LioCD
£
CO
1r-
s
y r —
3-35
SECTION 4
CONCLUSIONS
The material supplied for this program is somewhat unusual compared to other sheetor plate 2219-T87 aluminum alloy. Since the material was supplied in the 8.26 cm(3.25 in.) thick plate condition, it seems reasonable that such a material would requirefastidious processing to provide the required mechanical properties. The micro-structure, tensile test results, surface flaw test results, and sonic of the DCB testresults suggest that this material would have different behavior than materials inthinner gages, even within the acceptable limits for plane strain.
Since no certifications of properties were obtained with the material, it is possiblethat the processing provided an alloy with slightly less cold work than required forT87 while providing greater toughness and slightly less strength. The toughnessvalues obtained were similar to those of the newer 2219 alloy, known as 2419 alumi-num alloy. Even so, the tested material would probably be representative of 2219-T87 (or its new designation) in plate thicknesses greater than 7.62 (3.00 in.).
The purpose of this program was to obtain data for the alloy at temperatures from20°K (-423° F) to 422°K (300° F) in various environments and under various loadingconditions. Data was obtained under static, cyclic, and sustained load conditionsfor six grain orientations using various types of specimens. The following generalconclusions may be drawn.
a. The apparent plane-strain and plane-stress fracture toughness of 2219-T87 alumi-num alloy is lowest when material is loaded in the short transverse grain direction,independent of the test temperature. When toughness values of 0.318 cm (0.125 in.)thick specimens were determined in air at 50 percent relative humidity, for example,all short transverse specimens provided values less than 45 MN/m3'2, while valuesexceeding 65 MN/m3/2 were obtained for other grain orientations. These relativenumbers held for similar specimens tested in liquid nitrogen. Similarly, apparentplane strain fracture toughness values obtained from 2. 54 cm (1. 00 in.) thick DCBspecimens were about 30 for short transverse and 37 MN/m3/2 for longitudinal orloug transverse orientations after previous cyclic exposure in room temperature air.
While the exact ratio of toughness for longitudinal to short transverse grain direc-tions varies somewhat, the same relative observation can be made at 422°K and78°K for specimens exposed cyclically or to sustained loads as well as for speci-mens exposed cyclically or to sustained loads as well as for specimens exposedto 3. 5 percent NaCl solution.
4-1
b. The apparent fracture toughness of the material is higher for specimens that are0. 318 cm (0.125 in.) thick than for specimens that are 2.54 cm (1.00 in.) thick.
In addition to the values shown in paragraph a, other results justify this conclusion.For example, the highest fracture toughness value obtained for tests of 2. 54-cm-thick DCB specimens in air was 47.2 MN/m3'2, while the maximum value for a0.318-cm specimen was 68.1 MN/m3'2. Again, approximately the same relativeratios were noted for other environmental conditions.
c. Apparent plane strain fracture toughness values obtained from part-through-crackspecimens are higher than results obtained from other specimens.
Since static PTC test specimens were 2.54 cm thick, the results should be com-parable to the DCB test results. At room temperature, the apparent plane strainfracture toughness values ranged from 51 to 57 MN/m3/2 for PTC tests (up to 67at 78°K), while comparable values for the DCB tests were in the low 40s.
4-2
SECTION 5
REFERENCES
1. Brown, W. F. and Srawley, J. E., Plane Strain Crack Toughness Testing of HighStrength Materials, ASTM Special Publication No. 410, March 1967.
2. Brown, W. F. , Review of Developments in Plane Strain Fracture Toughness Test-ing, ASTM STP 463, September 1970.
3. Gallagher, J. P., "Experimentally Determined Stress Intensity Factors forSeveral Contoured Double Cantilever Beam Specimens," Engineering FractureMechanics, Vol. e, 1971.
4. Mostovoy, S. , Crosley, P. B. , Repling, E. J., "Use of Crack Line Loaded Speci-mens for Measuring Plane-Strain Fracture Toughness, Journal of Materials,Vol. 2, No. 3, 1967.
5. Amateau, M. F. , and Steigerwald, E. A., "Test Methods for Determining Frac-ture Toughness of Metallic Materials," AFML-TR-67-145, 1967.
6. Hoagland, R. G. , "On the Use of the Double Cantilever Beam Specimens for Deter-mining the Plane Strain Fracture Toughness of Metals," Journal of Basic Engineer-ing, September 1967.
7. Hoagland, R. G.,Bement, A. L., andRowe, R. G., "Applications of FractureMechanics in Evaluating Initiation and Propagation of Brittle Fracture in ReactorStructural Components," Effects of Radiation on Structural Metals, ASTM STP 426,1967.
8. Freed, C. N. , "Effect of Side Grooves and Fatigue Crack Length on Plain-StrainFracture Toughness," NRL Report 6654, 1967.
9. Freed, C. N., Goode, R. J., and Judy, R. W., Jr., "Comparison of FractureToughness Test Procedures for Aluminum Alloys," NRL Report 6653, 1969.
10. ASTM, ASTM Standards, Part 31, 1972.
11. Wessel, E. T., "State of the Art of the WOL Specimen for KIc Fracture ToughnessTesting," Engineering Fracture Mechanics, Vol. 1, 1968.
12. Wilson, W. K., "Stress Intensity Factors for Deep Cracks in Bending and CompactTension Specimens," Engineering Fracture Mechanics, Vol. 2, 1970.
13. Kropp, C. J., "Development of Improved Aerospace Vehicle Materials," ConvairAerospace Report GDC-ERR-AN-1210, 1967.
5-1
GENERAL DYNAMICSConvair Aerospace Division