Embed Size (px)
Citation preview
Ca2+-activated K + Channels in Human
Leukemic T Cells
STEPHAN GRISSMER, RICHARD S. LEWIS, a n d MICHAEL D. CAHALAN
From the Department of Physiology and Biophysics, University of California, Irvine, California 92717
ABSTRACT Using the patch-clamp technique, we have identified two types of Ca2+-activated K + (K(Ca)) channels in the human leukemic T cell line, Jurkat. Substances that elevate the intracellular Ca ~+ concentration ([Ca"+]~), such as ionomycin or the mitogenic lectin phytohemagglutinin (PHA), as well as whole-cell dialysis with pipette solutions containing elevated [CaZ+],, activate a voltage-inde- pendent K + conductance. Unlike the voltage-gated (type n) K + channels in these cells, the majority of K(Ca) channels are insensitive to block by charybdotoxin (CTX) or 4-aminopyridine (4-AP), but are highly sensitive to block by apamin (K d < 1 riM). Channel activity is strongly dependent on [CaZ+]i, suggesting that multiple Ca ~+ binding sites may be involved in channel opening. The Ca ~+ concentration at which half of the channels are activated is 400 riM. These channels show little voltage dependence over a potential range of - 100 to 0 mV and have a unitary conductance of 4-7 pS in symmetrical 170 mM K +. In the presence of 10 nM apamin, a less prevalent type of K(Ca) channel with a unitary conductance of 40-60 pS can be observed. These larger-conductance channels are sensitive to block by CTX. Pharmacological blockade of K(Ca) channels and voltage-gated type n channels inhibits oscillatory Ca '~+ signaling triggered by PHA. These results suggest that K(Ca) channels play a supporting role during T cell activation by sustaining dynamic patterns of Ca 2+ signaling.
I N T R O D U C T I O N
Mitogenic stimulation of human T cells evokes an increase in [Ca~+]~, a result of both liberation of Ca 2÷ f rom intracellular stores and Ca 2÷ influx across the plasma membrane (Tsien, Pozzan, and Rink, 1982; Imboden and Stobo, 1985; June, Ledbetter, Rabinovitch, Martin, Beatty, and Hansen, 1986; Lewis and Cahalan, 1989; reviewed by Weiss and Imboden, 1987). Recent studies have shown that stimuli that p romote the breakdown of inositol phospholipids in many cell types evoke oscilla- tions o f [Ca2+]i, which in some cases appear to comprise a frequency-encoded signal t ransduction system (for review, see Berridge, Cobbold, and Cuthbertson, 1988). The
Address reprint requests to Dr. Michael D. Cahalan, Department of Physiology and Biophysics, University of California, lrvine, CA 92717.
Dr. Lewis's present address is Department of Molecular and Cellular Physiology, Stanford University School of Medicine, Stanford, CA 94305.
J. GEN. PsVSlOU. © The Rockefeller University Press. 0022-1295/92/01/0063/22 $2.00 Volume 99 January 1992 63-84
63
64 THE JOURNAL OF GENERAL PHYSIOLOGY • VOLUME 9 9 • 1 9 9 2
Jurkat cell line, derived from a human T cell leukemia, has been widely used as a model system for studying Ca 2+ signaling and other early events in the activation process. Jurkat cells become activated by exposure to the mitogenic lectin phytohe- magglutinin (PHA), as measured by the stimulated production of interleukin 2, and activation is enhanced by cotreatment with phorbol esters. Ca ~+ influx appears to be necessary for the activation of Jurkat cells, as well as normal T cells, as removal of extracellular Ca ~+ inhibits the response (reviewed by Crabtree, 1989). In single Jurkat T cells, investigated with fura-2 ratio imaging, PHA was found to induce repetitive [Ca2+]~ oscillations (Lewis and Cahalan, 1989). These oscillations peak at micromolar levels with a period of 90-120 s at room temperature and depend critically o n C a 2+
influx from the extracellular medium. Ca 2+ entry in T cells and Jurkat cells is inhibited by depolarization (Gelfand, Cheung, and Grinstein, 1984; Oettgen, Ter- horst, Cantley, and Rosoff, 1985; Lewis and Cahalan, 1989) and is thought to occur through mitogen-regulated, voltage-independent C a 2+ channels (Kuno, Goronzy, Weyand, and Gardner, 1986; Lewis and Cahalan, 1989).
Although C a 2+ entry across the plasma membrane would be expected to depolarize the cell, several studies of human T and B cells and mouse thymocytes have shown instead that membrane hyperpolarization accompanies the rise in [Cae+]i (Tsien et al., 1982; Felber and Brand, 1983; Wilson and Chused, 1985; Tatham, O'Flynn, and Linch, 1986; MacDougaU, Grinstein, and Gelfand, 1988; reviewed by Grinstein and Dixon, 1989). Preliminary fluorescent indicator studies on individual cells indicate that oscillations in membrane potential accompany the oscillations in [CaZ+]~ in Jurkat T cells (Lewis, Grissmer, and Cahalan, 1991). The hyperpolarization can be ex- plained by the presence of K + channels that have been activated by internal Ca ~+, a conclusion supported by measurements of ~Rb + efflux from cells stimulated with CaZ+-mobilizing agents (reviewed by Rink and Deutsch, 1983; Grinstein and Dixon, 1989). Recent patch-clamp experiments have provided direct evidence for Ca e+- activated K ÷ channels in human B cells and rat thymocytes (Mahaut-Smith and Schlichter, 1989), but their pharmacological sensitivities, prevalence, and possible role in Ca z+ signaling have not yet been described.
In this paper we characterize the properties of K(Ca) channels in Jurkat T ceils and address their functions. Membrane depolarization has been shown to inhibit Ca z÷ influx during T cell activation (Lewis and Cahalan, 1989). The ability of K(Ca) channels to produce membrane hyperpolarization may well maximize the electrical driving force governing Ca 2+ influx and thereby facilitate C a 2+ signaling in activated cells. This idea was tested by measuring the effects of highly specific K + channel blockers on Ca ~+ signaling in single, mitogen-stimulated Jurkat cells.
A preliminary report characterizing these channels has appeared (Grissmer and Cahalan, 1989a).
M E T H O D S
Cells
Jurkat E6-1 cells were obtained from the American Type Culture Collection (Rockville, MD) and maintained in a culture medium of RPMI-1640 supplemented with 1 mM L-glutamine and
GRISSMER ET AL. Ca2+-activated K + Channels in T Lymphocytes 65
10% heat-inactivated fetal bovine serum in a humidified, 5% CO2 incubator at 37°C. Cells growing in log phase at a density of 0.4-1.8 × 10~/ml were used in experiments.
Solutions
The cells were bathed in normal Ringer solution containing (raM): 160 NaCI, 4.5 KCI, 2 CaCI~, 1 MgCI 2, and 5 N-hydroxyethylpiperazine-N'-2-ethanesulfonic acid (HEPES), adjusted to pH 7.4 with NaOH and having an osmolarity of 290-320 mosM. K ÷ Ringer was prepared by re- placing all Na + with K +. A simple syringe-driven perfusion system was used to exchange solutions in the recording chamber (~ 250 ~1 volume) within 15-20 s.
For whole-cell recordings, internal (pipette) solutions contained (raM): 160 K aspartate, 2 MgCI 2, 5 HEPES, and 1.6 ethylene glycol-bis(~-aminoethylether) N,N,N',N'-tetraacetic acid (EGTA), adjusted to pH 7.2 with KOH and having an osmolarity of 290-320 mosM. Varying amounts of CaCI~ were added to the pipette solution to yield free [Ca2+]i between 10 -9 M (no added CaCI~) and >__ 10 -5 M (1.59 mM CaCI~); [Ca~+]i was calculated assuming a K d for EGTA and Ca ~÷ at pH 7.2 of 10 -7 M (Portzehl, Caldwell, and Ruegg, 1964).
For perforated-patch recording, a freshly made stock solution of nystatin (mycostatin; 15 mg/ml in dimethyl sulfoxide) was diluted to a final concentration of 100-300 p,g/ml in one of two pipette solutions: 150 K aspartate, 10 MgCi 2, 2 CaCl 2, and 5 K-HEPES (pH 7.2), or 55 KC1, 70 K2SO 4, 7 MgCI 2, 2 CaCI~, 5 glucose, and 10 K-HEPES (pH 7.2). To promote the formation of membrane-pipette seals, the tip of the patch pipette was filled first with nystatin-free solution, and the nystatin solution was used to fill the remainder of the pipette.
Ionomycin was purchased from Caibiochem Corp. (La Jolla, CA), nystatin and apamin from Sigma Chemical Co. (St. Louis, MO), and tetraethylammonium chloride (TEA +) from Eastman Kodak Co. (Rochester, NY). Charybdotoxin (CTX) was a generous gift from either Dr. Chris Miller (Graduate Department of Biochemistry, Brandeis University, Waltham, MA) or Dr. Maria Garcia (Merck Institute, Rahway, NJ). BSA (1 mg/ml; Sigma Chemical Co.) was usually added to toxin-containing solutions. Fura-2 and fura-2/AM were purchased from Molecular Probes, Inc. (Eugene, OR).
Patch-Clamp Recording
Experiments were carried out using standard whole-cell and cell-attached recording methods (Hamill, Marty, Neher, Sakmann, and Sigworth, 1981; Cahalan, Chandy, DeCoursey, and Gupta, 1985). The perforated-patch variant of the patch-clamp technique (Horn and Marty, 1988) was used in some experiments to prevent the possible washout of essential cytoplasmic factors during conventional whole-cell recording. All experiments were done at room temper- ature (22-26°C). Electrodes were pulled from Accu-fiU 90 Micropets (Becton Dickinson & Co., Parsippany, NJ) in three stages, coated with Sylgard (Dow Coming Corp., Midland, MI), and fire-polished to resistances of 2-7 MI~. Membrane currents were recorded with a List EPC-7 patch-clamp amplifier (Adams and List Associates, Ltd., Great Neck, NY) without series resistance compensation at a bandwidth of 2 kHz. Capacitative current was removed by analog subtraction. The command input of the patch-clamp amplifier was controlled by a PDP 11/73 computer via a digital-to-analog converter (Indec Systems, Sunnyvale, CA); all command potentials were corrected for the junction potentials of the internal solutions. The holding potential in all experiments was - 8 0 inV. Voltage-ramp stimuli were often used to assess the components of membrane conductance rapidly. Usually the voltage was ramped from -120 to 30 mV within 225 ms every 5 s (sampling rate 457 p~s per point) unless otherwise stated. This procedure results in a small, depolarizing shift in the apparent voltage dependence for the voltage-gated K + channels, relative to that determined by voltage steps. Because the K(Ca) channels are voltage independent, slope conductances at potentials more negative than - 2 0 mV are proportional to the number of open K(Ca) channels.
66 THE JOURNAL OF GENERAL PHYSIOLOGY • VOLUME 99 • 1992
Single-Cell Calcium Measurements
Calcium measurements were made from single fura-2-1oaded Jurkat cells as described in detail previously (Lewis and Cahalan, 1989). Briefly, cells were loaded at a density of 106/ml with 3 p.M fura-2/AM in culture medium for 30 min at 37°C. After the cells were washed with medium, they were plated onto polylysine-coated glass coverslip chambers on the stage of an IM-35 microscope (Carl Zeiss, Oberkochen, Germany). Medium was replaced by Ringer solution several minutes before the start of the experiment.
In video-imaging experiments, alternating illumination at 345 and 375 nm (slit widths = 12 nm) was produced by a duat-monochromator, xenon arc light source (Deltascan I; Photon Technology International, Princeton, NJ) and electronic shutter (Vincent Associates, Rochester, NY), and a 405-nm dichroic mirror. Emission was collected through a 510-nm emission filter (bandwidth = 180 nm) with a SIT video camera (Hamamatsu Corp., Bridgewater, NJ) linked to a VideoProbe image processor (ETM Systems, Mission Viejo, CA). All optical filters were from Omega Optical Inc. (Brattleboro, VT). Background-corrected averaged images at the two excitation wavelengths were divided pixel-by-pixel and stored on hard disk for off-line analysis. Because erroneous estimates for [Ca2+]~ in Jurkat cells may result from calibration of fura-2 in free solution (Grynkiewicz, Poenie, and Tsien, 1985; see Lewis and Cahalan, 1989), [Ca2+]i values were estimated from the ratios using a previously described patch-pipette calibration method (Aimers and Neher, 1985) in which single cells are dialyzed with pipette solutions containing EGTA alone, 10 mM Ca ~+, or 30 mM EGTA with 180 nM free Ca z+ (Lewis and Cahalan, 1989).
In experiments combining patch recording with fura-2 measurement, a photomultiplier tube (model 647-04; Hamamatsu Corp.) and photon-counting photometer (model 126; Pacific Instruments, Concord, CA) were used to collect light under program control from a patch- clamped cell. Light from a Zeiss 75-W Hg arc lamp was diverted by a beam splitter through two shuttered light paths, containing 10-nm band-pass filters centered at either 350 or 385 nm, respectively. Alternating the shutters while limiting the light exposure to 200 ms per 1.2 s data collection cycle provided fura-2 light excitation while minimizing photobleaching. The photom- eter output was sampled and processed on-line using the patch-clamp interface, as described elsewhere (Lewis and Cahalan, 1989). Solution calibrations of [Ca 2+] were used in the photomultiplier measurements, with appropriate scaling to correct for the ~ 1.5-fold higher K~ of tiara-2 inside cells (cf. Almers and Neher, 1985; Negulescu and Machen, 1991).
R E S U L T S
Elevation of lntraceUular Ca 2+ Activates K + Conductance in Perforated-Patch Recording
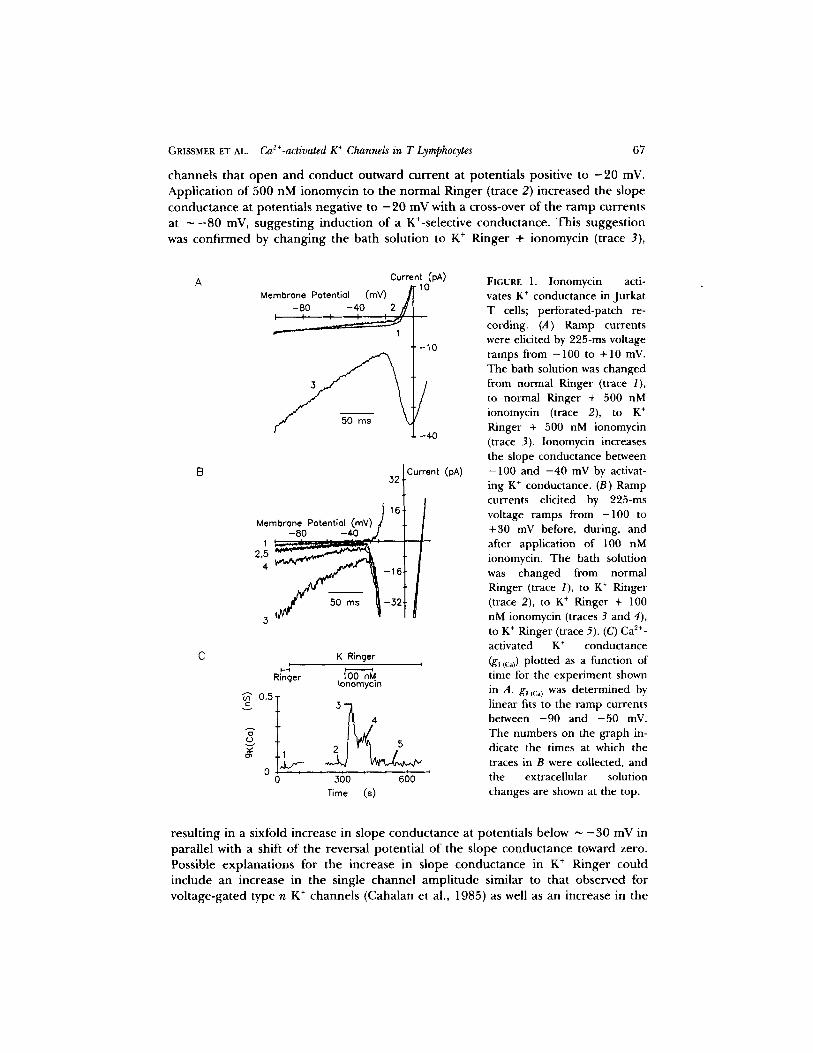
To test for the presence of K(Ca) channels in Jurkat cells, we elevated [Ca2÷]~ by applying ionomycin extracellularly while measuring conductance changes with the perforated-patch recording technique (Horn and Marty, 1988). Current was recorded in response to voltage ramps applied to the membrane to enable rapid measure- ments of conductance changes during the experiment. Mthough the ramp stimulus distorts the apparent voltage dependence of voltage-gated K + channels, it is a useful and accurate probe for voltage-independent conductances (see Methods). Fig. 1 A shows ramp currents recorded from a cell in an ionomycin experiment. The ramp current recorded in normal Ringer solution (trace 1) illustrates the two dominant electrophysiological characteristics of unstimulated Jurkat T cells: low membrane slope conductance at potentials negative to ~ - 2 0 mV, and voltage-gated type n K +
GRISSMER El" AL. Ca2+-activated K + Channels in T Lymphocytes 67
channels that open and conduct outward current at potentials positive to - 2 0 mV. Applicat ion of 500 nM ionomycin to the normal Ringer (trace 2) increased the slope
conductance at potentials negative to - 20 mV with a cross-over of the r amp currents at ~ - 8 0 mV, suggesting induct ion of a K+-selective conductance. This suggestion was confirmed by changing the bath solution to K ÷ Ringer + ionomycin (trace 3),
C
Current (pA)
Membrone Potentiol (mY) ~ - 10 -BO -40 2
1
-10
-40
321 current
Membrone Potential (mY)) 16t /
3
(pA)
K Ringer
Ringer I00 n~l lonomycin
0'5 I ~ 3 4-
g ,
o o '3 o' 660 Time (s)
FIGURE 1. Ionomycin acti- vates K ÷ conductance in Jurkat T cells; perforated-patch re- cording. (A) Ramp currents were elicited by 225-ms voltage ramps from -100 to +10 mV. The bath solution was changed from normal Ringer (trace I), to normal Ringer + 500 nM ionomycin (trace 2), to K + Ringer + 500 nM ionomycin (trace 3). Ionomycin increases the slope conductance between - 1 0 0 and - 40 mV by activat- ing K + conductance. (B) Ramp currents elicited by 225-ms voltage ramps from -100 to +30 mV before, during, and after application of 100 nM ionomycin. The bath solution was changed from normal Ringer (trace 1), to K + Ringer (trace 2), to K + Ringer + 100 nM ionomycin (traces 3 and 4), to K + Ringer (trace 5). (C) Ca 2÷- activated K ÷ conductance (gt ~(:,~) plotted as a function of time for the experiment shown in A. g, ((:,) was determined by linear fits to the ramp currents between - 90 and - 50 mV. The numbers on the graph in- dicate the times at which the traces in B were collected, and the extracellular solution changes are shown at the top.
resul t ing in a sixfold increase in slope conductance at potentials below ~ - 3 0 mV in parallel with a shift of the reversal potent ial of the slope conductance toward zero. Possible explanat ions for the increase in slope conductance in K ÷ Ringer could include an increase in the single channel ampl i tude similar to that observed for voltage-gated type n K + channels (Cahalan et al., 1985) as well as an increase in the
68 THE JOVRNAL Or" 6ENERAL PHVSIOLOSV • VOLr0ME 99. 1992
open time of the channel. In all subsequent experiments described in this paper, Ringer solutions containing elevated [K+]o were used to increase the driving force for K ÷ (and thereby maximize K + current) at negative potentials.
The time course of the ionomycin effect was studied in the experiment shown in Fig. 1 B. The ramp current recorded in normal Ringer solution (trace 1) is similar to that shown in Fig. 1 A. Changing the bath to K + Ringer (trace 2) doubles the slope of the leak current and changes the sign of the type n current. The inward K ÷ current peaks at ~ - 1 0 0 pA (off scale), then decreases and changes direction near the estimated equilibrium potential for K ÷ of 0 mV. Addition of 100 nM ionomycin to K + Ringer greatly increases the slope of the ramp current at potentials negative to - 3 0 mV (trace 3). This effect is transient, however, as the slope decreases 60 s later (trace 4), and is virtually reversible when ionomycin is removed (trace 5).
To quantify the ionomycin effect, the slope conductance, g~cca), between - 9 0 and - 5 0 mV was measured for a series of ramp currents and plotted as a function of time (Fig. 1 C). In this instance, ionomycin induced an eightfold increase in conductance, which declined spontaneously to a plateau value approximately four times the baseline level. The linear shape of its current-voltage relation (see also Fig. 3 A) indicates that the conductance has little or no voltage dependence.
Comparison of g~c,, and [Ca2+], in a Single Cell
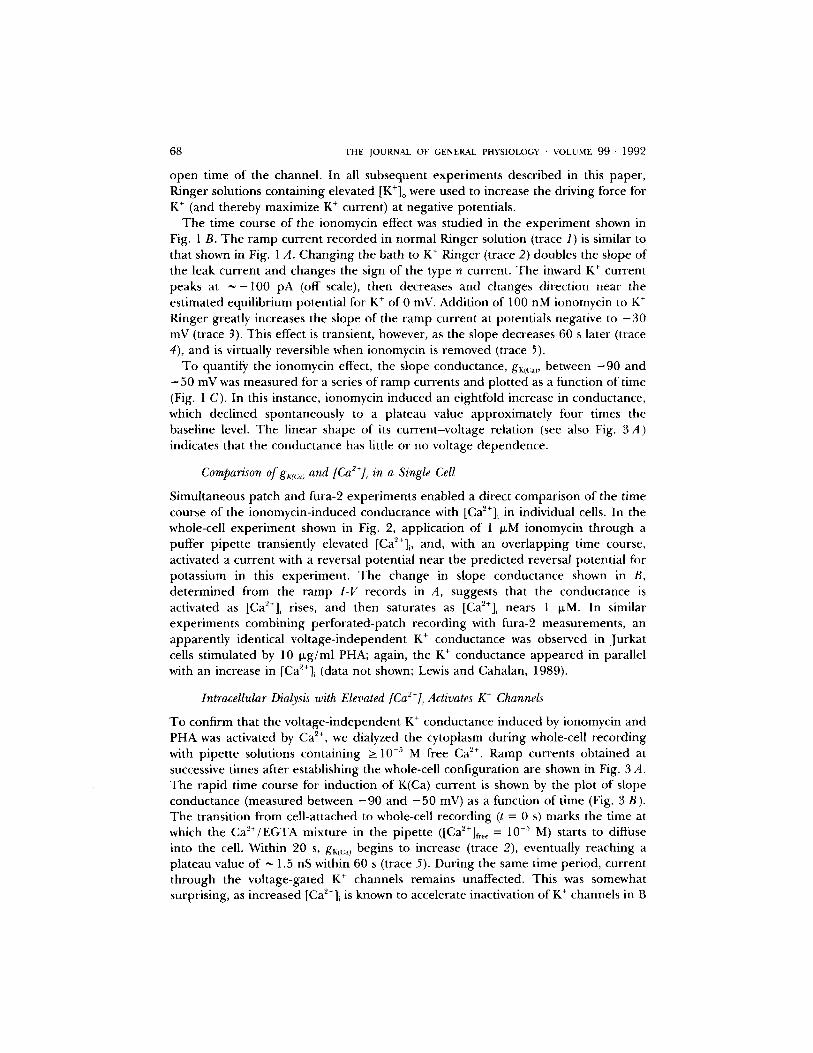
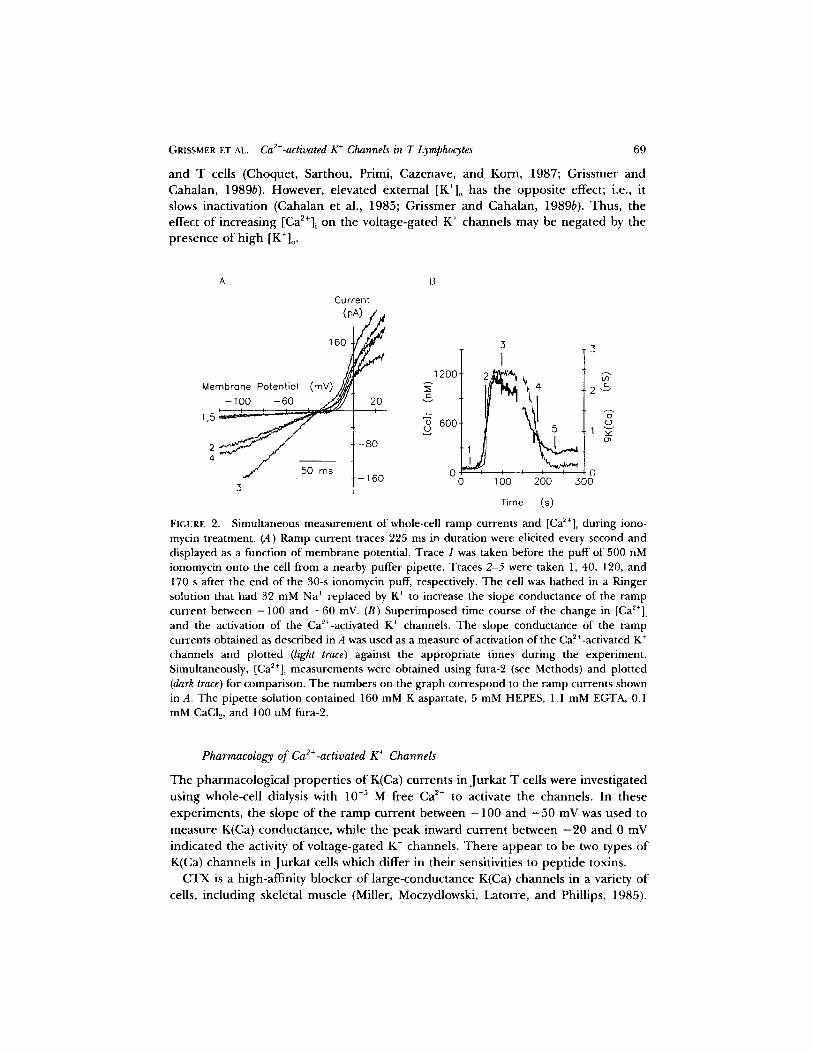
Simultaneous patch and fura-2 experiments enabled a direct comparison of the time course of the ionomycin-induced conductance with [Ca2+]i in individual cells. In the whole-cell experiment shown in Fig. 2, application of 1 IxM ionomycin through a puffer pipette transiently elevated [Ca2+]i, and, with an overlapping time course, activated a current with a reversal potential near the predicted reversal potential for potassium in this experiment. The change in slope conductance shown in B, determined from the ramp I-V records in A, suggests that the conductance is activated as [Ca2+]~ rises, and then saturates as [Ca2+]i nears 1 ~zM. In similar experiments combining perforated-patch recording with fura-2 measurements, an apparently identical voltage-independent K + conductance was observed in Jurkat cells stimulated by 10 ~g/ml PHA; again, the K + conductance appeared in parallel with an increase in [Ca2+]~ (data not shown; Lewis and Cahalan, 1989).
Intracellular Dialysis with Elevated [Ca2+], Activates K + Channels
To confirm that the voltage-independent K + conductance induced by ionomycin and PHA was activated by Ca 2+, we dialyzed the cytoplasm during whole-cell recording with pipette solutions containing >_ 10 -~ M free Ca 2+. Ramp currents obtained at successive times after establishing the whole-cell configuration are shown in Fig. 3,4. The rapid time course for induction of K(Ca) current is shown by the plot of slope conductance (measured between - 9 0 and - 5 0 mV) as a function of time (Fig. 3 B). The transition from cell-attached to whole-cell recording (t = 0 s) marks the time at which the Ca'-'+/EGTA mixture in the pipette ([Ca~+]~ee = 10 -~ M) starts to diffuse into the cell. Within 20 s, gK~c:~ begins to increase (trace 2), eventually reaching a plateau value of ~ 1.5 nS within 60 s (trace 5). During the same time period, current through the voltage-gated K + channels remains unaffected. This was somewhat surprising, as increased [Ca2+], is known to accelerate inactivation of K + channels in B
GRISSMER El" AL. Ca2+-activated K + Channels in T Lymphocytes 69
and T cells (Choquet , Sar thou, Primi, Cazenave, and Korn, 1987; Gr i ssmer and Cahalan , 1989b). However, e levated ex te rna l [K+]o has the oppos i te effect; i.e., it slows inactivation (Cahalan et al., 1985; Gr issmer and Cahalan, 1989b). Thus , the effect o f increas ing [Ca2+]i on the vol tage-ga ted K ÷ channels may be nega ted by the presence of h igh [K÷]o.
A B
Membrane Potential -100 -60
1 , 5 ~
4 _ _ _ _
3
Current
160
( m J 20 I
-80
-160
1200
E
o 600
0 o
3 3 I
I I I I 0
1 oo 200 300
Time (s)
E 2 v
( D
FIGURE 2. Simultaneous measurement of whole-cell ramp currents and [Ca2+]~ during iono- mycin treatment. (A) Ramp current traces 225 ms in duration were elicited every second and displayed as a function of membrane potential. Trace 1 was taken before the puff of 500 nM ionomycin onto the cell from a nearby puffer pipette. Traces 2-5 were taken 1, 40, 120, and 170 s after the end of the 30-s ionomycin puff, respectively. The cell was bathed in a Ringer solution that had 32 mM Na + replaced by K + to increase the slope conductance of the ramp current between -100 and - 6 0 mV. (B) Superimposed time course of the change in [CaZ+]~ and the activation of the Ca'2+-activated K + channels. The slope conductance of the ramp currents obtained as described in A was used as a measure of activation of the Ca ~÷-activated K + channels and plotted (light trace) against the appropriate times during the experiment. Simultaneously, [Ca~÷]~ measurements were obtained using fura-2 (see Methods) and plotted (dark trace) for comparison. The numbers on the graph correspond to the ramp currents shown in A. The pipette solution contained 160 mM K aspartate, 5 mM HEPES, 1.1 mM EGTA, 0.1 mM CaCI~, and 100 uM fura-2.
Pharmacology o f Ca2+-activated K + Channels
T h e pharmaco log ica l p rope r t i e s o f K(Ca) currents in Ju rka t T cells were invest igated us ing whole-cell dialysis with I0-- ' M free Ca 2+ to activate the channels . In these
exper iments , the s lope of the r a m p current between - 1 0 0 and - 5 0 mV was used to
measure K(Ca) conductance , while the peak inward cur ren t between - 2 0 and 0 mV indica ted the activity of vo l tage-ga ted K ÷ channels . T h e r e a p p e a r to be two types of K(Ca) channels in Ju rka t cells which differ in their sensitivities to p e p t i d e toxins.
CTX is a high-affinity b locker o f l a rge-conductance K(Ca) channels in a variety o f cells, including skeletal muscle (Miller, Moczydlowski, Latorre , and Phillips, 1985).
70
A
THE JOURNAL OF GENERAL PHYSIOLOGY - VOLUME 9 9 " 1992
B
Current (pA)
Membrane Potential 8 0 / • -8o . - " ° . [ .
5 ~' I - 1 6 0
gK(Co) (.s)
2.o-
1.0
0.0
34
-100 0 100
50 ms Time after break-in (s)
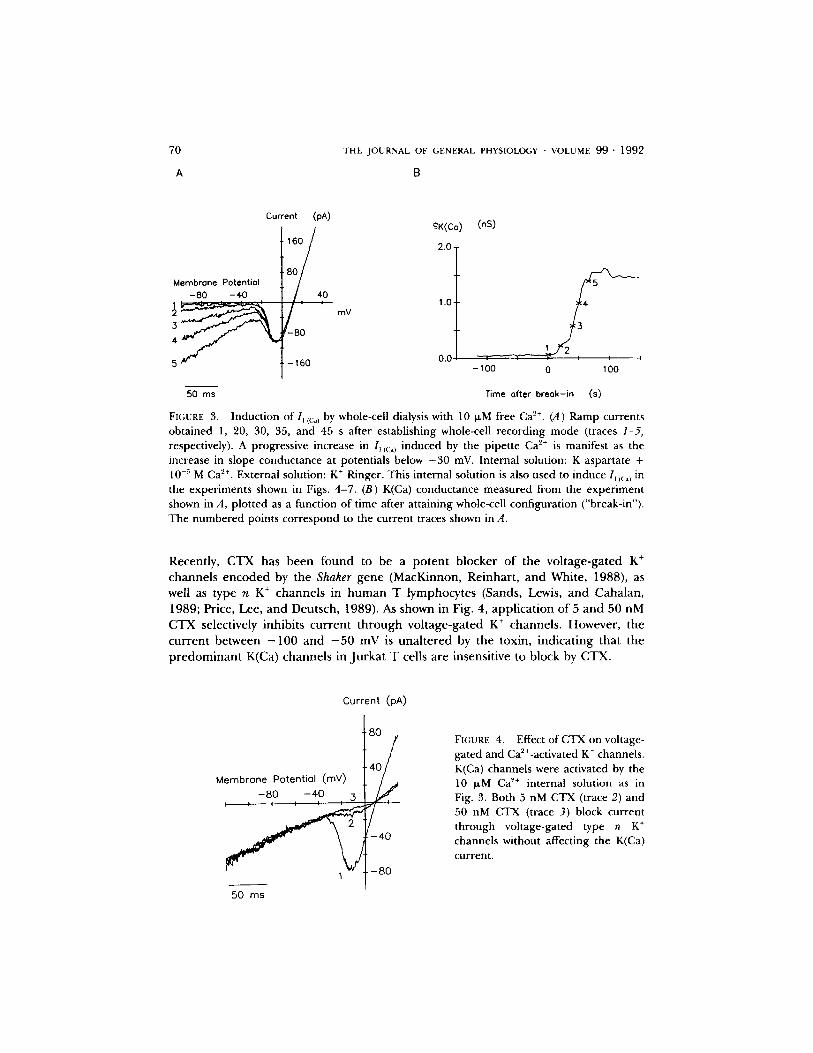
FIGURE 3. Induction of I, ic:.l by whole-cell dialysis with 10 I~M free Ca 2+. (A) Ramp currents obtained 1, 20, 30, 35, and 45 s after establishing whole-cell recording mode (traces 1-5, respectively). A progressive increase in l,(c:,~ induced by the pipette Ca '2÷ is manifest as the increase in slope conductance at potentials below -30 mV. Internal solution: K aspartate + 10 -~ M Ca '2+. External solution: K + Ringer. This internal solution is also used to induce 1, (c:~) in the experiments shown in Figs• 4-7. (B) K(Ca) conductance measured from the experiment shown in A, plotted as a function of time after attaining whole-cell configuration ("break-in")• The numbered points correspond to the current traces shown in A.
Recently, CTX has been found to be a potent blocker of the voltage-gated K ÷ channels encoded by the Shaker gene (MacKinnon, Reinhart , and White, 1988), as well as type n K ÷ channels in h u m a n T lymphocytes (Sands, Lewis, and Cahalan, 1989; Price, Lee, and Deutsch, 1989). As shown in Fig. 4, applicat ion of 5 and 50 nM CTX selectively inhibits current through voltage-gated K + channels. However, the current between - 1 0 0 and - 5 0 mV is unal tered by the toxin, indicat ing that the p redominan t K(Ca) channels in Jurkat T cells are insensitive to block by CTX.
Current (pA)
40 Membrane Potential (mY)
~ 40
80
50 ms
FIGURE 4. Effect of CTX on voltage- gated and Ca2+-activated K + channels. K(Ca) channels were activated by the 10 ixM Ca ~+ internal solution as in Fig. 3. Both 5 nM CTX (trace 2) and 50 nM CTX (trace 3) block current through voltage-gated type n K ÷ channels without affecting the K(Ca) current.
GRISSMER ET AL. Ca2+-activated K + Channels in T Lymphocytes 7t
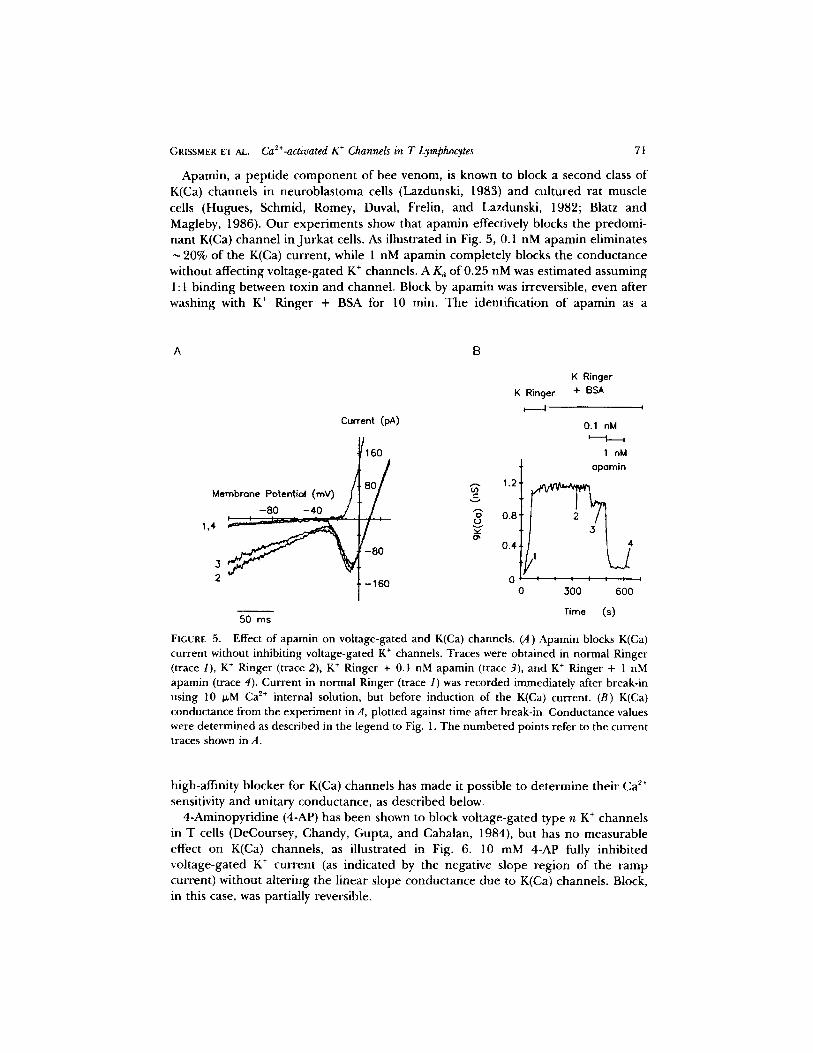
Apamin, a peptide component of bee venom, is known to block a second class of K(Ca) channels in neuroblastoma cells (Lazdunski, 1983) and cultured rat muscle cells (Hugues, Schmid, Romey, Duval, Frelin, and Lazdunski, 1982; Blatz and Magleby, 1986). Our experiments show that apamin effectively blocks the predomi- nant K(Ca) channel in Jurkat cells. As illustrated in Fig. 5, 0.1 nM apamin eliminates
20% of the K(Ca) current, while 1 nM apamin completely blocks the conductance without affecting voltage-gated K + channels. A Kd of 0.25 nM was estimated assuming 1:1 binding between toxin and channel. Block by apamin was irreversible, even after washing with K + Ringer + BSA for 10 min. The identification of apamin as a
A B
Current (pA)
J Membrone Potentiol (mV) [
j ,
• . - 8 . ° . - 4 9 _ j
t160
/ I
- 8 0
-160
50 ms
(_>
ot
K Ringer
K Ringer + BSA
0.1 nM
1 nM opamin
1.2 ~ 4 0.8
0.4
0 . . . . . . . I
0 300 600
Time (s)
FIGURE 5. Effect of apamin on voltage-gated and K(Ca) channels. (A) Apamin blocks K(Ca) current without inhibiting voltage-gated K ÷ channels. Traces were obtained in normal Ringer (trace 1), K + Ringer (trace 2), K + Ringer + 0.1 nM apamin (trace 3), and K + Ringer + 1 nM apamin (trace 4). Current in normal Ringer (trace 1) was recorded immediately after break-in using 10 I~M Ca ~+ internal solution, but before induction of the K(Ca) current. (B) K(Ca) conductance from the experiment in A, plotted against time after break-in. Conductance values were determined as described in the legend to Fig. 1. The numbered points refer to the current traces shown in A.
high-affinity blocker for K(Ca) channels has made it possible to determine their Ca 2+ sensitivity and unitary conductance, as described below.
4-Aminopyridine (4-AP) has been shown to block voltage-gated type n K ÷ channels in T cells (DeCoursey, Chandy, Gupta, and Cahalan, 1984), but has no measurable effect on K(Ca) channels, as illustrated in Fig. 6. 10 mM 4-AP fully inhibited voltage-gated K ÷ current (as indicated by the negative slope region of the ramp current) without altering the linear slope conductance due to K(Ca) channels. Block, in this case, was partially reversible.
72 THE JOURNAL OF GENERAL PHYSIOLOGY • VOLUME 99 - 1992
Current (pA)
t°/1 16
Membrane Potential I 8 0 / / 3 -8O -4O [ ~ j . 2
i i i i i ~ mV
-80
160
50 ms
FIGURE 6. Effect of 4-AP on voltage- gated and K(Ca) channels. Traces 1-3
were obtained in K + Ringer before, during, and after treatment with K ÷ Ringer containing 10 mM 4-AP, re- spectively. 4-AP blocked I~ iv) without affecting 1~ ic,~. In this cell, the block- ing effect was only partially (~ 30%) reversible.
Both vol tage-ga ted and K(Ca) channels were sensitive to TEA +, a l though to differ ing degrees . Vol tage-ga ted type n K ÷ channels are half b locked by 10 mM TEA +, while the K(Ca) channels are app rox ima te ly five times more sensitive to block by the d rug (K1/~ = 2 mM, n = 3; da ta not shown).
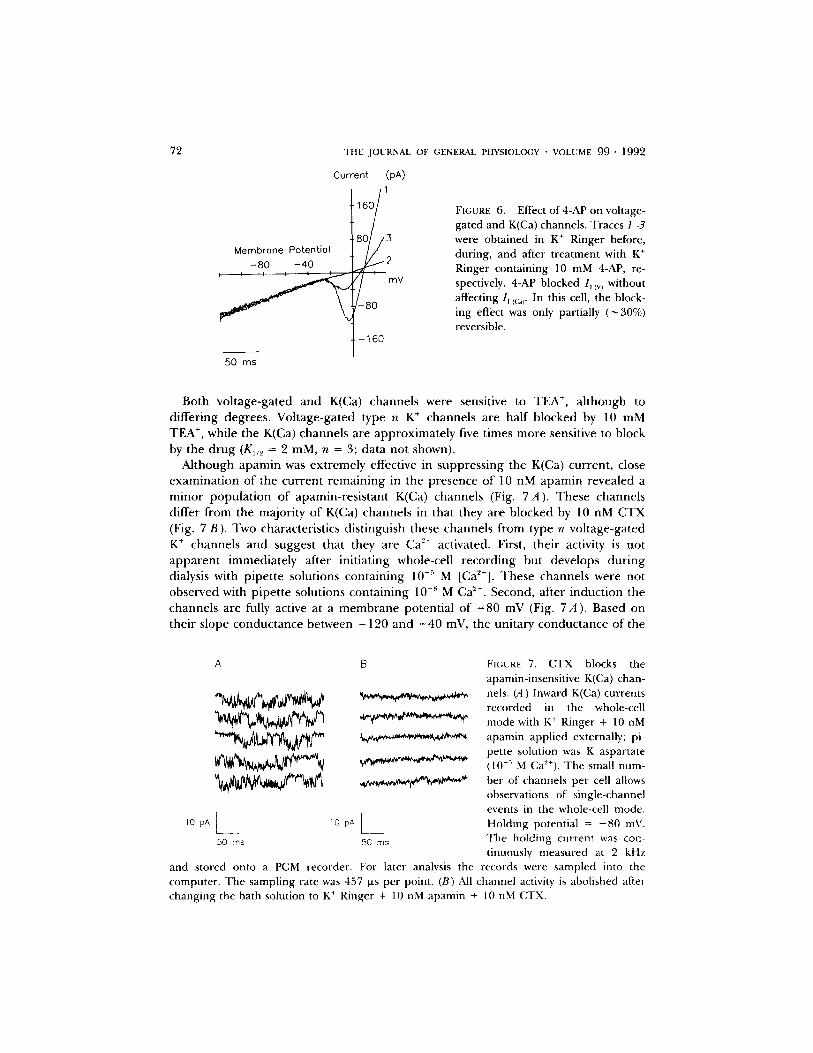
Al though apamin was ex t remely effective in suppress ing the K(Ca) current , close examina t ion o f the cur ren t r ema in ing in the p resence o f 10 nM a p a m i n revealed a minor popu la t ion o f apamin- res i s tan t K(Ca) channels (Fig. 7A) . These channels differ from the majori ty of K(Ca) channels in that they are b locked by 10 nM CTX (Fig. 7 B). Two characterist ics dis t inguish these channels from type n vol tage-ga ted K + channels and suggest that they are Ca 2+ activated. First, their activity is not a p p a r e n t immedia te ly after ini t iat ing whole-cell r ecord ing but develops dur ing dialysis with p ipe t te solutions conta in ing 10 -~ M [Ca2+]. These channels were not observed with p ipe t te solutions conta in ing 10 -8 M Ca > . Second, after induct ion the channels are fully active at a m e m b r a n e potent ia l of - 8 0 mV (Fig. 7 A). Based on their s lope conductance between - 1 2 0 and - 4 0 mV, the uni tary conductance of the
10 pA I__ 50 ms
10 pA
B
[_ 50 ms
FIGURE 7. CTX blocks the apamin-insensitive K(Ca) chan- nels. (A) Inward K(Ca) currents recorded in the whole-cell mode with K + Ringer + 10 nM apamin applied externally; pi- pette solution was K aspartate (10 -~' M Cae+). The small num- ber of channels per cell allows observations of single-channel events in the whole-cell mode. Holding potential = - 8 0 mV. The holding current was con- tinuously measured at 2 kHz
and stored onto a PCM recorder. For later analysis the records were sampled into the computer. The sampling rate was 457 ~s per point. (B) All channel activity is abolished after changing the bath solution to K ÷ Ringer + 10 nM apamin + 10 nM CTX.
GRlSSMER El- AL. Ca2+-activated K + Channels m T Lymphocytes 73
apamin-insensitive K(Ca) channels is 40-60 pS. Because they are present in such low numbers (< 10/cell), these channels were not characterized in detail.
Sensitivity to [Ca2+],
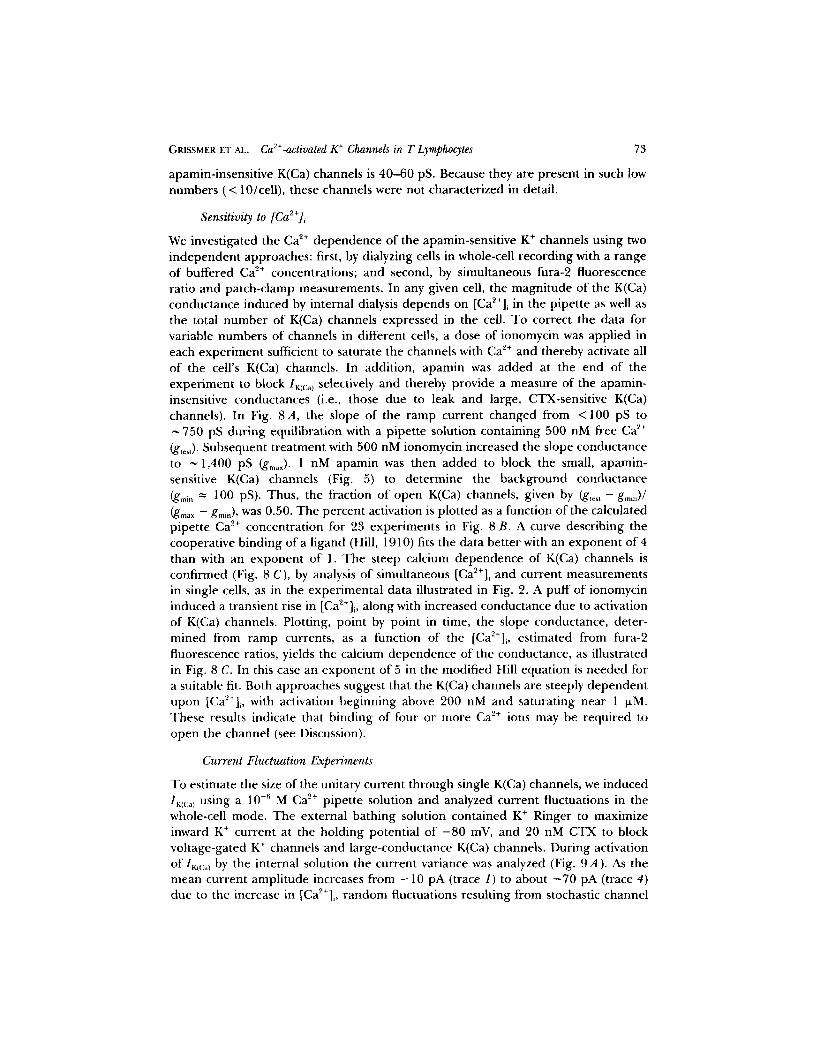
We investigated the Ca ~+ dependence of the apamin-sensitive K ÷ channels using two independent approaches: first, by dialyzing cells in whole-cell recording with a range of buffered Ca z÷ concentrations; and second, by simultaneous fura-2 fluorescence ratio and patch-clamp measurements. In any given cell, the magnitude of the K(Ca) conductance induced by internal dialysis depends on [Ca2+]~ in the pipette as well as the total number of K(Ca) channels expressed in the cell. To correct the data for variable numbers of channels in different cells, a dose of ionomycin was applied in each experiment sufficient to saturate the channels with C a 2+ and thereby activate all of the cell's K(Ca) channels. In addition, apamin was added at the end of the experiment to block l~/c~l selectively and thereby provide a measure of the apamin- insensitive conductances (i.e., those due to leak and large, CTX-sensitive K(Ca) channels). In Fig. 8A, the slope of the ramp current changed from < 100 pS to ~ 750 pS during equilibration with a pipette solution containing 500 nM free Ca ~+ (g,e~t)- Subsequent treatment with 500 nM ionomycin increased the slope conductance to ~ 1,400 pS (gma~)" 1 nM apamin was then added to block the small, apamin- sensitive K(Ca) channels (Fig. 5) to determine the background conductance (gmi, "~ 100 pS). Thus, the fraction of open K(Ca) channels, given by (g .... -gm~n)/ ( g m a x - - groin), was 0.50. The percent activation is plotted as a function of the calculated pipette C a 2+ concentration for 23 experiments in Fig. 8 B. A curve describing the cooperative binding of a ligand (Hill, 1910) fits the data better with an exponent of 4 than with an exponent of 1. The steep calcium dependence of K(Ca) channels is confirmed (Fig. 8 C), by analysis of simultaneous [Ca2+]i and current measurements in single cells, as in the experimental data illustrated in Fig. 2. A puff of ionomycin induced a transient rise in [Ca~+]~, along with increased conductance due to activation of K(Ca) channels. Plotting, point by point in time, the slope conductance, deter- mined from ramp currents, as a function of the [Ca2+]~, estimated from fura-2 fluorescence ratios, yields the calcium dependence of the conductance, as illustrated in Fig. 8 C. In this case an exponent of 5 in the modified Hill equation is needed for a suitable fit. Both approaches suggest that the K(Ca) channels are steeply dependent upon [CaZ÷]i, with activation beginning above 200 nM and saturating near 1 ~M. These results indicate that binding of four or m o r e C a 2+ ions may be required to open the channel (see Discussion).
Current Fluctuation Experiments
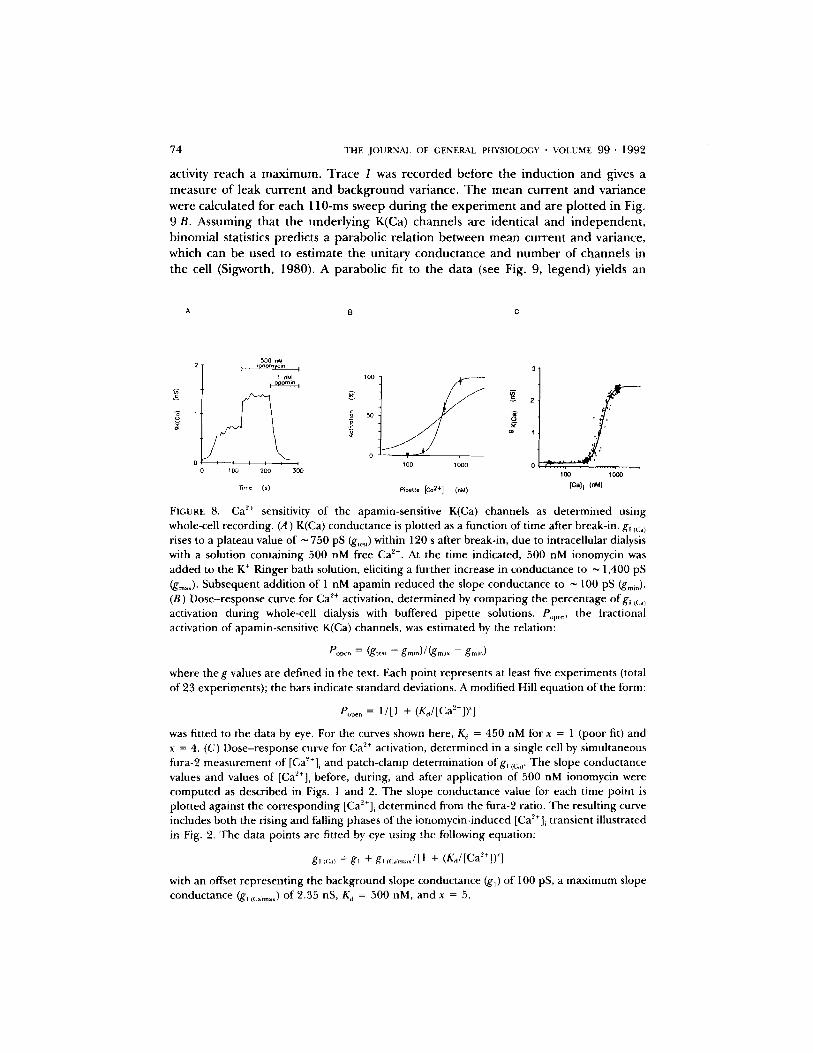
To estimate the size of the unitary current through single K(Ca) channels, we induced IK((:a) using a 10 -6 M Ca 2+ pipette solution and analyzed current fluctuations in the whole-cell mode. The external bathing solution contained K ÷ Ringer to maximize inward K + current at the holding potential of - 8 0 mV, and 20 nM CTX to block voltage-gated K ÷ channels and large-conductance K(Ca) channels. During activation of IK(c, ) by the internal solution the current variance was analyzed (Fig. 9A). As the mean current amplitude increases from - 1 0 pA (trace 1) to about - 7 0 pA (trace 4) due to the increase in [Ca2+]i, random fluctuations resulting from stochastic channel
74 3"HE , J O U R N A L O F G E N E R A L P H Y S I O L O G Y • V O L U M E 9 9 " 1992
activity reach a m a x i m u m . Trace 1 was r e c o r d e d before the i n d u c t i o n a n d gives a m e a s u r e of leak c u r r e n t a n d b a c k g r o u n d var iance. T h e m e a n cu r r en t a n d var iance were ca lcula ted for each 110-ms sweep d u r i n g the e x p e r i m e n t a n d are p lo t t ed in Fig. 9 B. A s s u m i n g tha t the u n d e r l y i n g K(Ca) channe l s are ident ica l a n d i n d e p e n d e n t , b i n o m i a l statistics predic ts a pa rabo l i c re la t ion be tween m e a n c u r r e n t a n d var iance, which can be used to es t imate the un i t a ry c o n d u c t a n c e a n d n u m b e r of c h a n n e l s in the cell (Sigworth, 1980). A parabol ic fit to the da ta (see Fig. 9, l egend) yields an
A B C
3
,5OO nM 2- I lonom)'c,n I
1 aM I opomin [ 100 t ~
1 ~ 50
o , , t I t I I t 1 O0 1000
I O0 200 300
Time (s) Pipette [Co 2+] (nM)
3 '
S 2 ,
1
o . , . . . . . . . . . . . . , . .
lOO l O O O
[Call (nM)
FIOURE 8. Ca 2÷ sensitivity of the apamin-sensitive K(Ca) channels as determined using whole-cell recording. (A) K(Ca) conductance is plotted as a function of time after break-in, g~ tc:.) rises to a plateau value of ~ 750 pS (g,c,,) within 120 s after break-in, due to intracellular dialysis with a solution containing 500 nM free Ca 'z+. At the time indicated, 500 nM ionomycin was added to the K ÷ Ringer bath solution, eliciting a further increase in conductance to ~ 1,400 pS (gm~0' Subsequent addition of 1 nM apamin reduced the slope conductance to ~ 100 pS (g.,i.). (B) Dose-response curve for Ca 2+ activation, determined by comparing the percentage ofg~ ~<~.~ activation during whole-cell dialysis with buffered pipette solutions. P,,p..., the fractional activation of apamin-sensitive K(Ca) channels, was estimated by the relation:
e o ~ ° = ¢g,c., - g . . , ° ) / ( g m ~ . -- g , . , ° )
where the g values are defined in the text. Each point represents at least five experiments (total of 23 experiments); the bars indicate standard deviations. A modified Hill equation of the form:
P.p¢,, = 1/[1 + (K~/[Ca2+]) ~]
was fitted to the data by eye. For the curves shown here, Kj = 450 nM for x = 1 (poor fit) and x = 4. (C) Dose-response curve for Ca ~+ activation, determined in a single cell by simultaneous fura-2 measurement of [Ca~+], and patch-clamp determination ofg~ ~c,r The slope conductance values and values of [Ca2+]~ before, during, and after application of 500 nM ionomycin were computed as described in Figs. 1 and 2. The slope conductance value for each time point is plotted against the corresponding [Ca~+]~ determined from the fura-2 ratio. The resulting curve includes both the rising and falling phases of the ionomycin-induced [Ca~+]~ transient illustrated in Fig. 2. The data points are fitted by eye using the following equation:
g,,:.) = gt + g, It:a)m.J[ 1 + (KM[Ca'-'+]) ~]
with an offset representing the background slope conductance (gO of 100 pS, a maximum slope conductance (g, lC.~m.~) of 2.35 nS, K,i = 500 nM, and x = 5.
GRISSMER ET AL. Ca2+-activated K ÷ Channels in T Lymphocytes 75
es t imate o f ~ 4 0 0 apamin-sens i t ive K(Ca) channels in the cell, each p roduc ing an e l emen ta ry cur ren t of - 0 . 4 p A at - 8 0 mV. Given a near ly l inear I - V re la t ion and a reversal po ten t ia l o f 0 mV in symmetr ical 170 mM K ÷, this value for the uni tary cur ren t co r re sponds to a s ingle-channel conduc tance of 5 pS.
A B
- 4 0
o
-80
~ 2 ~" 2o
'~ 10 E O
"E
• • . : .
• - . . - . . - . : ~! . .. ;. • .:: ~..';.. . . ~. - . ' . f : . . ~ : - .
.t~¢ 22 .4
- 4 0 - 8 0
M e a n C u r r e n t (pA) 2 5 m s
FIGURE 9. Fluctuation analysis of the apamin-sensitive K(Ca) current in the whole-cell recording mode. Ij ((:~) was induced by intracellular dialysis with 1 wM Ca e+, with 20 nM CTX added to the K + Ringer external solution to block voltage-gated K ÷ channels (Fig. 4) and the larger, CTX-sensitive K(Ca) channels present in these cells (Fig. 7). (A) Currents recorded at - 8 0 mV during induction of K(Ca) during dialysis with a pipette solution containing 1 ~M Ca 2+. As lj {(:~) develops, the holding current amplitude progressively increases (traces 2-4) .
Note the changes in current fluctuations as the mean current level is increased• Trace 1 was recorded before the induction of Iv to;,) and gives a measure of leak current and background variance. (B) Current variance plotted as a function of mean current for the experiment in A. Each point represents the variance and mean of a single 110-ms trace. Variance was obtained by averaging the square of the fluctuations around the mean current level. A parabola of the form:
~'~ = i l - f 2 / N
was fitted to the data by the method of least squares, where cr~ is the current variance, i is the current through a single channel, 1 is the mean current, and N is the total number of channels that can be activated in the cell. For the curve shown here, i = -0 .4 pA and N = 400 apamin-sensitive K(Ca) channels.
Ca2+-activated K ÷ C h a n n e l s in Cel l -at tached Patches
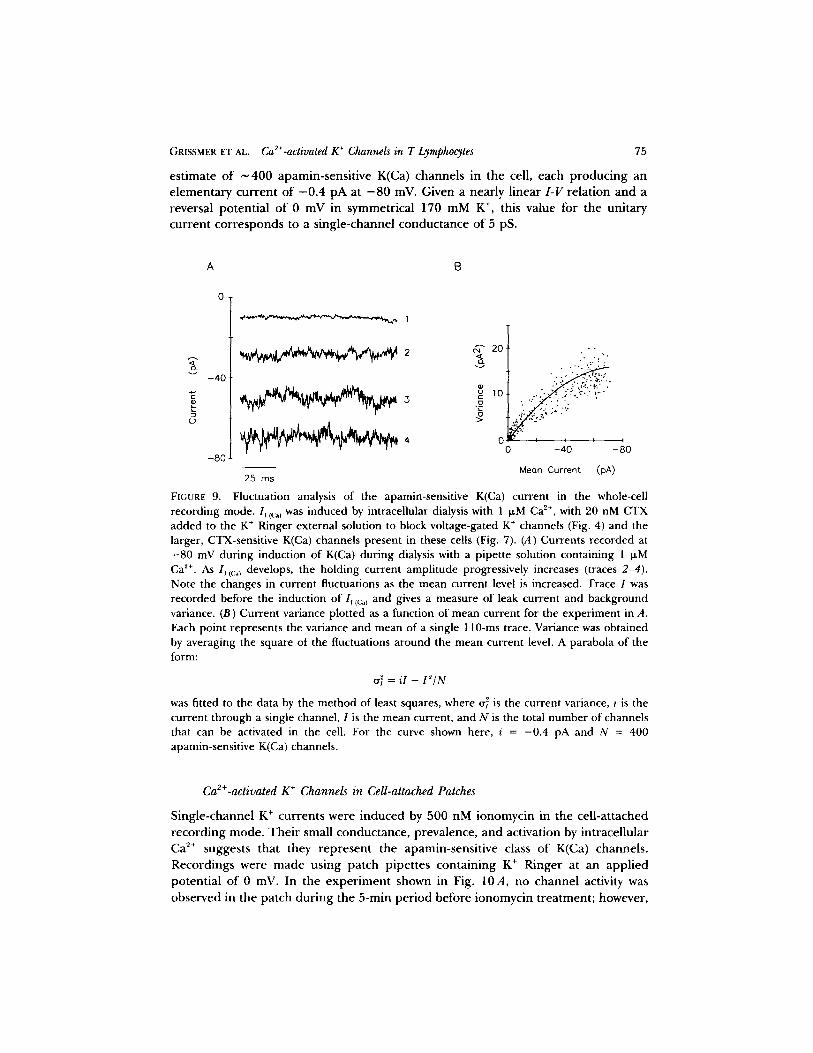
Single-channel K + currents were induced by 500 nM ionomycin in the ce l l -a t tached r eco rd ing mode . T h e i r small conductance , prevalence, and activation by in t racel lu lar Ca 2÷ suggests that they r ep re sen t the apamin-sens i t ive class o f K(Ca) channels .
Recordings were m a d e using pa tch p ipe t tes conta in ing K ÷ Ringer at an a pp l i e d poten t ia l o f 0 mV. In the e x p e r i m e n t shown in Fig. 10A, no channel activity was
observed in the pa tch du r ing the 5-min pe r iod before ionomycin t rea tment ; however,
76 THE JOURNAL OF GENERAL PHYSIOLOGY • VOLUME 9 9 " 1 9 9 2
a puff o f 500 nM ionomycin delivered from a pipette posit ioned within 5 ~m of the cell elicited channel openings within several seconds (Fig. 10 B). The single-channel current ampli tude in this exper iment was determined from an amplitude histogram to be - 0 . 3 5 pA (Fig. 10 C). Assuming that the cell's resting potential in the presence of ionomycin is between - 5 0 and - 8 0 mV and that the K + reversal potential is 0 mV, the single-channel conductance is ~ 4 - 7 pS. This value agrees well with the noise estimates described above and is similar to the 8-pS value repor ted for the smaller of two types o f K(Ca) channels observed in human B cells and rat thymocytes (Mahaut-Smith and Schlichter, 1989).
A B C
,00
o - 0 . 8 -0 .4 0 0.4
1 pA 1 pA pA
50 ms 50 ms
F[cu~E 10. Single K(Ca) channels induced by ionomycin in the cell-attached configuration. In this experiment, the patch pipette contained K + Ringer and was held at a potential of 0 mV; the cell was bathed in normal Ringer. (A) Control current records obtained in the cell-attached mode before application of ionomycin. No channel activity was observed over a period of 5 rain. (B) Currents recorded during application of 500 nM ionomycin from a puffer pipette located within 5 ~.m of the cell. Records in A and B were filtered at 300 Hz using a digital Gaussian algorithm. (C) Amplitude histogram of data collected in the presence of ionomycin. Gaussian curves were fit by eye to the data and are indicated by the smooth line. The peak on the right represents the current when the channel is closed, while the peak on the left is the open-channel level. The single-channel current amplitude, measured as the difference between the two amplitude peaks, is -0.35 pA.
K + Channels and Mitogen-evoked Ca 2. Signaling
A likely function o f K(Ca) channels in T cells is that o f regulating the membrane potential, particularly during periods when cytosolic [Ca 2+] is elevated. Antigenic activation o f T lymphocytes is known to evoke a rapid and sustained rise in [Ca2+]i, which is believed to be part of a sequence of events that leads to cell proliferation and the expression of immune function. In single Jurkat T cells, the [Ca2+]~ rise tr iggered by PHA is oscillatory and is strongly inhibited by membrane depolarization induced with high [K+]o (Lewis and Cahalan, 1989). The highly potent block by apamin of the p redominan t K(Ca) channels in Jurkat cells provides an experimental tool with which
GRISSMEP. ET AL. Ca2+-activated K ÷ Channels in T Lymphocytes 77
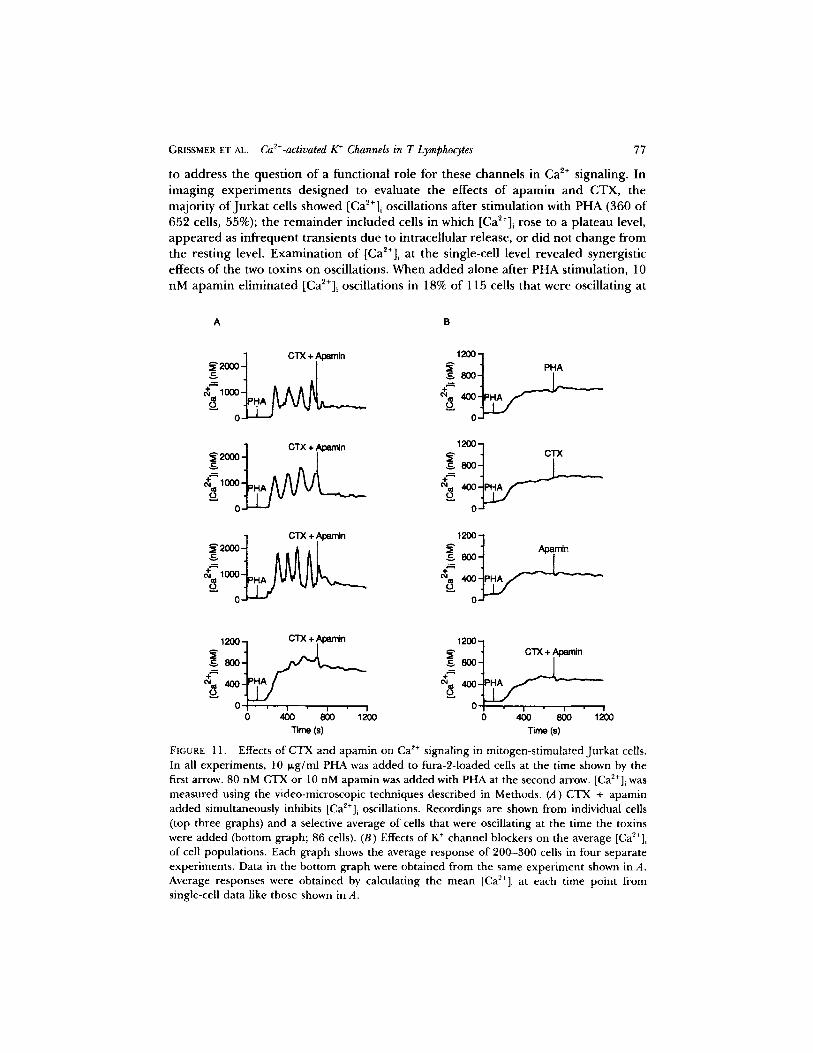
to address the quest ion o f a funct ional role for these channels in Ca 2÷ signaling. In imag ing expe r imen t s des igned to evaluate the effects of a p a m i n and CTX, the major i ty of J u r k a t cells showed [Ca~*]~ oscillations after s t imulat ion with PHA (360 of 652 cells, 55%); the r e m a i n d e r inc luded cells in which [Ca2+]~ rose to a p la teau level, a p p e a r e d as inf requent t ransients due to in t racel lular release, or d id not change f rom the res t ing level. Examina t ion of [CaZ+]~ at the single-cell level revealed synergistic effects of the two toxins on oscillations. When a d d e d a lone after PHA stimulation, 10 nM a p a m i n e l imina ted [Ca2+]~ oscillations in 18% of 115 cells that were oscil lat ing at
A B
~" 2ooo t CTX +Tn 1 ~ o - t ~" 1 PHA
~ O ~
20o0 1 CTX + Apemln
o_ V
~ "] CTX
~" 2000--] CY +Tin 1200 ~'_ 1 Apamln
1200- CTX + Aparnln 1200 ~" ~ t CTX + Apamin
0 I ' I " I ' I ~ 0 I " I " I " f
0 400 800 1200 0 400 800 1200 Time (s) Time (s)
FIGURV 11. Effects of CTX and apamin on Ca r÷ signaling in mitogen-stimulated Jurkat cells. In all experiments, 10 Cg/ml PHA was added to fura-2-1oaded cells at the time shown by the first arrow. 80 nM CTX or 10 nM apamin was added with PHA at the second arrow. [Ca~+]~ was measured using the video-microscopic techniques described in Methods, (A) CTX + apamin added simultaneously inhibits [Ca2+]~ oscillations. Recordings are shown from individual cells (top three graphs) and a selective average of cells that were oscillating at the time the toxins were added (bottom graph; 86 cells). (B) Effects of K ÷ channel blockers on the average [Ca2+]~ of cell populations. Each graph shows the average response of 200-300 cells in four separate experiments. Data in the bottom graph were obtained from the same experiment shown in A. Average responses were obtained by calculating the mean [Ca2+]~ at each time point from single-cell data like those shown in A.
78 THE JOURNAL OF GENERAL PHYSIOLOGY • VOLUME 9 9 " 1992
the time of treatment. CTX at doses sufficient to block the larger K(Ca) channels and type n K ÷ channels completely (40-80 nM) did not discernibly affect [Ca2+]~ oscillations in 130 of 134 cells. However, the two toxins had a substantial effect when applied together (Fig. 11 A), effectively suppressing ongoing oscillations in 70% of 341 cells. These results suggest that K + channels may play an important role in regulating Ca 2+ signals during T cell activation (see Discussion).
Examination of average [Ca2+]~ in the cell population underestimates the effects of apamin and CTX. As shown in Fig. 11 B, a second addition of PHA or PHA + CTX caused a slight elevation of [Ca2+]~, while PHA + apamin alone or in combination with CTX caused no apparent change or a slight decrease, respectively. The population average contains contributions from the several types of single-cell responses de- scribed above, including those of oscillating and nonoscillating cells. The inhibitory effect of the two toxins in combination is enhanced in a selective average made from oscillating cells (compare bottom graphs of Fig. 11,A and B), implying that the toxins depress [Ca2+]~ to a greater extent in oscillating relative to nonoscillating cells.
D I S C U S S I O N
In this study we have identified two classes of K(Ca) channels in a human leukemic T cell line. The predominant K(Ca) channel in Jurkat cells is voltage independent, is sensitive to block by nanomolar concentrations of apamin, and has a unitary conductance of 4-7 pS in the presence of symmetrical 170 mM K +. From the ratio of the average whole-cell gK~ca) tO the single-channel conductance, we estimate that an average of ~400 channels per cell are activated by 1 IxM Ca~ ÷. A second type of K(Ca) channel was observed at much lower density (< 10 per cell), and is easily distinguished from the majority population by its larger conductance (40-60 pS in symmetrical 170 mM K+), resistance to block by apamin, and sensitivity to nanomolar concentrations of CTX. In addition to K(Ca) channels, Jurkat cells express CTX- sensitive, voltage-gated K + channels (type n) with properties similar to those in normal human T lymphocytes (Cahalan et al., 1985; Grissmer and Cahalan, 1989b).
K + channel blockers have been shown to inhibit a variety of lymphocyte functions, including mitogen-stimulated cell proliferation, protein synthesis, and secretion of interleukin 2 (DeCoursey et al., 1984; Chandy, DeCoursey, Cahalan, McLaughlin, and Gupta, 1984; DeCoursey, Chandy, Gupta, and Cahalan, 1985; Chandy, DeCour- sey, Fischbach, Talal, Cahalan, and Gupta, 1986; Deutsch, Krause, and Lee, 1986; Sabath, Monos, Lee, Deutsch, and Prystowsky, 1986; Schell, Nelson, Fozzard, and Fitch, 1987; Price et al., 1989; Sutro, Vayuvegula, Gupta, and Cahalan, 1989; Amigorena, Choquet, Teillaud, Korn, and Fridman, 1990; Cahalan and Lewis, 1990; reviewed in Lewis and Cahalan, 1990). The pharmacological dissection described here may provide a basis for further interpreting effects of K ÷ channel blockers in lymphocytes. The profound inhibition of mitogen-evoked [Ca2+]~ oscillations by apamin and CTX, but not by either agent alone (Fig. 11), suggests that voltage-gated and CaZ+-activated K + channels cooperate in regulating Ca 2+ signaling during T cell activation (see below).
Previous studies have indicated that at least two types of K(Ca) channels exist in normal human T and B lymphocytes and rat thymocytes; these may correspond to the apamin- and CTX-sensitive types we describe here. Single-channel recordings in
GRISSMER E~" AL. Ca2+-activated K ÷ Channels in T Lymphocytes 79
the cell-attached mode demonstrated two types of K(Ca) channels in human tonsillar B lymphocytes and rat thymocytes, with conductances in the range of 6-8 pS and 18-25 pS (Mahaut-Smith and Schlichter, 1989; Mahaut-Smith and Mason, 1991). Although the smaller-conductance channel was not studied in detail, its conductance is quite similar to the 4-7-pS apamin-sensitive channels we have observed under similar ionic conditions. The 25-pS K(Ca) channel, which was the main focus of their study, displays a somewhat lower conductance than the 40-60-pS K(Ca) channel we have described; it is worth noting, however, that the conductance of the 25-pS K(Ca) channel increased to 34 pS after the cell-attached patch was excised. Thus, as the authors suggest, it is possible that the channel is modified by disruption of the normal cytoplasmic environment, for example through patch excision or whole-cell dialysis. A second study by Grinstein and Smith (1990) used voltage-sensitive dyes to describe two components of ionomycin-induced hyperpolarization in human T ceils. The bulk of the hyperpolarization was blocked by CTX, leaving a minor second component. It is possible that the CTX-sensitive portion results from the 40-60-pS K(Ca) channels, while the minor component is due to apamin-sensitive K(Ca) channels. This interpretation is consistent with the finding that the current through the larger, CTX-sensitive K(Ca) channels in human peripheral T cells greatly exceeds that through the smaller, apamin-sensitive type (Grissmer and Cahalan, 199 I). These CTX-sensitive K(Ca) channels are also much more abundant in activated human B cells and in a rat plasmacytoma (RPC 5.4) cell line (Partiseti, Choquet, Diu, and Korn, 1991; Cahalan and Choquet, 1991) than in Jurkat cells. In Jurkat cells, the predominant K(Ca) channel is the apamin-sensitive type.
Apamin-sensitive CaZ+-activated K + Channels
Because the threshold [CaZ+]~ for activating apamin-sensitive K(Ca) channels is at or above the normal resting [Cae*]~ of ~ I00 nM (Imboden and Stobo, 1985; Lewis and Cahalan, 1989), these channels are not likely to make a large contribution to the resting potential. However, during mitogenic or antigenic stimulation, when [CaZ÷]~ reaches micromolar levels, these channels may play a dominant role in determining the membrane conductance (discussed below). Channel activation depends steeply on [Ca2+]i, and the relation between [Ca2÷]~ and open probability can be best described by a modified Hill equation with an exponent of 4 or more (Fig. 8). One possible explanation for the steepness of this relation is that several Ca -~÷ ions must bind to the channel or to an associated molecule in order to open the pore, as is the case for other K(Ca) channels (Latorre and Miller, 1983).
CTX-sensitive Ca2+-activated K ÷ Channels
Because the 40-60-pS K(Ca) channel shares a high sensitivity to CTX with two other types of voltage-gated K + channels in T cells (types n and n'; Lewis and Cahalan, 1988; Sands eta[ . , 1989), CTX cannot be used selectively in intact lymphocytes to probe the functions of the large K(Ca) channel alone (or of voltage-gated K + channels). We have not investigated the Ca ~+ sensitivity of large K(Ca) channels in Jurkat cells in detail, because the channels are present only at very low numbers. Mahaut-Smith and Schlichter (1989), however, report activity of the 25-pS K +
8 0 T H E J O U R N A L O F G E N E R A L P H Y S I O L O G Y • V O L U M E 99 - 1 9 9 2
channel at 200-300 nM Ca z+, implying that the [Ca2+]i rise induced by antigenic or mitogenic stimulation may suffice to activate the channel.
A Physiological Role for Ca2+-activated K + Channels
The finding that apamin selectively blocks the small-conductance variety of K(Ca) channels with high affinity made it possible to explore the physiological role of these channels. A problem often inherent in the pharmacological approach to elucidating channel function is that many blocking drugs cross-react between multiple channel types. For example, agents such as TEA and CTX are known to block voltage-gated K* channels in T cells (Chandy et al., 1984; DeCoursey et al., 1984; Sabath et al., 1986; Price et al., 1989; Sands et al., 1989), and in the present study we have shown that these compounds also block K(Ca) channels. The high affinity and selectivity of apamin-induced block provides an effective means of probing the contribution of the low-conductance K(Ca) channels to T cell functions.
The effects of apamin and CTX on Ca 2+ signaling were examined at the level of cell populations and single cells. Whereas the average [Ca2+]i of PHA-stimulated cell populations was little affected by the toxins applied alone or in combination, single-cell measurements revealed potentially significant synergistic effects. Apamin abolished ongoing [Ca2+]i oscillations in 18% of the cells; the proportion of inhibited cells was increased to 70% by combining apamin with CTX, even though CTX by itself did not affect [Ca2+]i in single cells. The comparatively modest effect of CTX + apamin at the cell population level may be explained by the fact that the population average included cells that were inhibited by the toxins as well as others that were not. The more marked inhibition observed in the selective [Ca~+]~ average of oscillating cells (Fig. 11 A) implies that oscillating cells were on average somewhat more sensitive to the toxins than were nonoscillating cells. Thus, studying the effects of channel blockers at the single-cell level can reveal potentially significant effects that are hidden in the average response of a heterogeneous cell population. A previous study of normal human T cells demonstrated only a slight diminution of the average mitogen-stimulated [Ca~+]i response by 20 mM TEA (Gelfand, Cheung, and Grinstein, 1986). Further work is needed to determine whether complete blockade of K(V) and K(Ca) channels modulates Ca '2+ signaling at the single-cell level in normal lymphoid cells, as shown here for Jurkat T cells.
How might K ÷ channels be involved in the generation of intracellular Ca z+ signals? Several lines of evidence support a hypothesis in which K + channels are required to maintain the electrical driving force governing Ca z+ influx. The membrane potential is known to be an important regulator of [Ca~+]~ influx in T cells, as high-K + depolarization of human T cells or T cell lines inhibits mitogenic C a 2+ signaling and subsequent cell activation events (Gelfand et al., 1984; Oettgen et al., 1985). This result is also consistent with the properties of mitogen-regulated Ca ~+ currents in T cells measured with patch-clamp techniques. The Ca "2÷ conductance is not measurably voltage dependent; thus, depolarization would be expected to reduce Ca z+ influx by diminishing the driving force o n C a 2+ (Kuno et al., 1986; Lewis and Cahalan, 1989).
Previous evidence suggests that both voltage-gated and Ca2+-activated K + channels contribute to the membrane potential of T cells under different conditions. Resting human T cells are depolarized by 4-AP (Wilson and Chused, 1985) or CTX (Grinstein
GRISSMER ET AL. Ca2÷-activated K + Channels in T Lymphocytes 81
and Smith, 1990), agents that block voltage-gated type n K ÷ channels (DeCoursey et al., 1984; Sands et al., 1989) but not the apamin-sensitive K(Ca) channel (Figs. 4 and 6). Moreover, the voltage dependence of n channel activation is consistent with the opening of a few n channels at the resting potential (Cahalan et al., 1985; Lee and Deutsch, 1990; Pahapill and Schlichter, 1990). Because [Ca2+]i in resting cells is ~ 100 nM, below the threshold for activating the known types of K(Ca) channels in T cells (Fig. 8 B and C; Mahaut-Smith and Schlichter, 1989), activity of K(Ca) channels in resting T cells is unlikely. However, previous indirect evidence indicates that K(Ca) channels open under conditions of elevated [Ca2+]i. Membrane hyperpolarization coinciding with the elevation of [CaZ÷]~ has been observed in mouse and human T cells stimulated with mitogens or Ca 2+ ionophores (Tsien et al., 1982; Felber and Brand, 1983; Wilson and Chused, 1985; Tatham et al., 1986; Grinstein and Smith, 1990). In human T cells, ionomycin-induced hyperpolarization can be blocked by CTX (Grinstein and Smith, 1990), consistent with recent patch-clamp findings that the larger, CTX-sensitive K(Ca) channel predominates in resting human T cells (Grissmer and Cahalan, 1991).
Contributions of both voltage-gated and Ca2+-activated K ÷ channels to the mem- brane potential may explain the effects of blockers o n [Ca2+]i in Jurkat cells (Fig. 11). After [Ca2+]i rises in response to PHA, apamin-sensitive K(Ca) channels may hyper- polarize the membrane below the voltage threshold for n channel activation, such that CTX has no effect. Apamin blocks the bulk of IKIc~ ~ and thereby may depolarize the cells into the range in which type n channels are opened. The increased activity of n channels would act to prevent further depolarization and maintain a large degree o f C a 2+ influx, perhaps explaining why apamin inhibits [Ca2+]i oscillations in only a small fraction of the cells. By blocking both n channels and K(Ca) channels, treatment with the two toxins together would be expected to cause further depolar- ization, thereby reducing C a 2+ influx and inhibiting the oscillations in a synergistic fashion. It is tempting to speculate that the apparent redundancy of function in these subclasses of K ÷ channels may have arisen as a fail-safe mechanism to ensure the regulation of C a 2÷ influx. However, additional mechanisms may also contribute to the membrane potential, since blocking all of the known types of K ÷ channels in Jurkat cells depresses [Ca2+]i to a much smaller extent than does depolarization to 0 mV with high [K+]o (see Lewis and Cahalan, 1989).
We conclude that K + channels help to regulate C a 2+ signaling in mitogen- stimulated Jurkat cells, most probably by modulating the driving force that governs Ca 2÷ influx through mitogen-gated Ca z+ channels. A further test of this hypothesis will involve simultaneous measurements of [Ca2÷]i and ~ using fura-2 and voltage- dependent dyes (Lewis et al., 1991). Oscillations in Jurkat cells are extraordinarily dependent on Ca z+ influx across the plasma membrane (Lewis and Cahalan, 1989). There are at least two ways in which blocker-induced depolarization might inhibit [CaZ÷]~ oscillations. First, oscillations may depend on a minimum rate of Ca 2* influx, and depolarization may simply reduce influx below the threshold. Alternatively, K ÷ channel blockers may prevent fluctuations of the membrane potential during [CaZ+]~ oscillations, which may constitute an important feedback limb of the oscillation mechanism. Further work is required to determine which of these explanations is correct, and to elucidate the normal role of [Ca2+]i oscillations in T cell activation.
82 THE JOURNAL OF GENERAL PHYSIOLOGY - VOLUME 99" 1992
We would like to thank Ms. Ruth Davis for technical help, Dr. Steve Hess tor discussion and assistance in preparing figures, and Dr. Chris Miller and Dr. Maria Garcia for providing samples of CTX.
This work was supported by NIH grants NS-14609 and GM-41514, by a grant from the Office of Naval Research, and by a Research Fellowship to S. Grissmer from the Deutsche Forschungsgemein- schaft (Gr 848/2-2).
Original version received 22 October 1990 and accepted version received 9 September 1991.
R E F E R E N C E S
Almers, W., and E. Neher. 1985. The Ca signal from fura-2 loaded mast cells depends strongly on the method of dye-loading. FEBS Letters. 192:13-18.
Amigorena, S., D. Choquet, J.-L. Teillaud, H. Korn, and W. H. Fridman. 1990. Ion channel blockers
inhibit B cell activation at a precise stage of the GI phase of the cell cycle: possible involvement of
K + channels.Journal oflmmunology. 144:2038-2045.
Berridge, M.J., P. H. Cobbold, and K. S. R. Cuthbertson. 1988. Spatial and temporal aspects of cell
signalling. Philosophical Transactions of the Royal Society of London B. 320:325-343. Blatz, A. L., and K. L. Magleby. 1986. Single apamin-blocked Ca-activated K + channels of small
conductance in cultured rat skeletal muscle. Nature. 323:718-720.
Cahalan, M. D., K. G. Chandy, T. E. DeCoursey, and S. Gupta. 1985. A voltage-gated K ÷ channel in
human T lymphocytes. Journal of Physiology. 358:197-237. Cahalan, M. D., and D. Choquet. 1991. Intracellular Ca 2+ signalling in a plasmacytoma cell line.
Biophysical Journal. 59:13a. (Abstr.) Cahalan, M. D., and R. S. Lewis. 1990. Functional roles of ion channels in lymphocytes. Seminars in
Immunology. 2:107-117. Chandy, K. G., T. E. DeCoursey, M. D. Cahalan, C. McLaughlin, and S. Gupta. 1984. Voltage-gated
potassium channels are required for human T lymphocyte activation. Journal of Experimental Medicine. 160:369-385.
Chandy, K. G., T. E. DeCoursey, M. Fischbach, N. Talal, M. D. Cahalan, and S. Gupta. 1986. Altered
K + channel expression in abnormal T lymphocytes from mice with the lpr gene mutation. Science. 233:1197-1200.
Choquet, D., P. Sarthou, D. Primi, P. A. Cazenave, and H. Korn. 1987. Cyclic AMP-modulated
potassium channels in murine B cells and their precursors. Science. 235:1211-1214.
Crabtree, G. R. 1989. Contigent genetic regulatory events in T lymphocyte activation. Science. 243:355-361.
DeCoursey, T. E., K. G. Chandy, S. Gupta, and M. D. Cahalan. 1984. Voltage-gated K ÷ channels in human T lymphocytes: a role in mitogenesis? Nature. 307:465-468.
DeCoursey, T. E., K. G. Chandy, S. Gupta, and M. D. Cahalan. 1985. Voltage-dependent ion
channels in T lymphocytes. Journal of Neuroimmunology 10:71-85. Deutsch, C., D. Krause, and S. C. Lee. 1986. Voltage-gated potassium conductance in human T
lymphocytes stimulated with phorbol ester. Journal of Physiology. 372:405-423. Felber, S. B., and M. D. Brand. 1983. Early plasma-membrane-potential changes during stimulation
of lymphocytes by concanavalin A. Biochemical Journal. 210:885-891. Gelfand, E. W., R. K. Cheung, and S. Grinstein. 1984. Role of membrane potential in the regulation
of lectin-induced calcium uptake.Journal of Cellular Physiology. 121:533-539. Gelfand, E. W., R. K. Cheung, and S. Grinstein. 1986. Mitogen-indnced changes in Ca z+ permeability
are not mediated by voltage-gated K ÷ channels. Journal of Biologzcal Chemistry. 261:11520-11523. Grinstein, S., and S.J. Dixon. 1989. lon transport and membrane potential in lymphocytes: changes
during activation. Physiological Reviews. 69:417-482.
GRISSMER ET AL. Ca2+-activated K ÷ Channels in T Lymphocytes 83
Grinstein, S., and J. D. Smith. 1990. Calcium-independent cell volume regulation in human
lymphocytes. Journal of General Physiology. 95:97-120.
Grissmer, S., and M. D. Cahalan. 1989a. Ionomycin activates a potassium-selective conductance in
human T lymphocytes. Biophysical Journal. 55:245a. (Abstr.)
Grissmer, S., and M. D. Cahalan. 1989b. Divalent ion trapping inside potassium channels of human T
lymphocytes. Journal of General Physiology. 93:609-630.
Grissmer, S., and M. D. Cahalan. 1991. Ca2+-activated K ÷ channels in resting and activated human
peripheral T lymphocytes. Biophysical Journal. 59:213a. (Abstr.)
Grynkiewicz, G., M. Poenie, and R. Y. Tsien. 1985. A new generation of calcium indicators with
greatly improved fluorescence properties.Journal of Biological Chemistry. 260:3440-3448.
Hamill, O. P., A. Marty, E. Neher, B. Sakmann, and F. J. Sigworth. 1981. Improved patch-clamp
techniques for high-resolution current recording from cells and cell-free membrane patches.
Pfliigers Archiv. 391:85-100. Hilt, A. V. 1910. The possible effects of the aggregation of the molecules of haemoglobin on its
dissociation curves. Journal of Physiology. 40:iv-vii.
Horn, R., and A. Marty. 1988. Muscarinic activation of ionic currents measured by a new whole-cell
recording method. Journal of General Physiology. 92:145-159.
Hugues, M., H. Schmid, G. Romey, D. Dural, C. Frelin, and M. Lazdunski. 1982. The Ca 2÷-
dependent slow K ÷ conductance in cultured rat muscle cells: characterization with apamin. EMBO Journal. 1:1039-1042.
Imboden, J. B., and J. D. Stobo. 1985. Transmembrane signalling by the T cell antigen receptor.
Journal of Experimental Medicine. 161:446-456.
June, C. H., J. A. Ledbetter, P. S. Rabinovitch, P. J. Martin, P. G. Beatty, andJ . A. Hansen. 1986.
Distinct patterns of transmembrane calcium flux and intracellular calcium mobilization after
differentiation antigen cluster 2 (E rosette receptor) or 3 (T3) stimulation of human lymphocytes.
Journal of Clinical Investigation. 77:1224-1232.
Kuno, M., J. Goronzy, C. M. Weyand, and P. Gardner. 1986. Single-channel and whole-cell
recordings of mitogen-regulated inward currents in human cloned helper T lymphocytes. Nature. 323:269-273.
Latorre, R., and C. Miller. 1983. Conduction and selectivity in potassium channels. Journal of Membrane Biology. 71 : 11-30.
Lazdunski, M. 1983. Apamin, a neurotoxin specific for one class of CaZ+-dependent K ÷ channels. Cell Calcium. 4:421-428.
Lee, S. C., and C. Deutsch. 1990. Temperature dependence of K ÷ channel properties in human T
lymphocytes. Biophysical Journal. 57:49-62.
Lewis, R. S., and M. D. Cahalan. 1988. Subset-specific expression of potassium channels in
developing murine T lymphocytes. Science. 239:771-775.
Lewis, R. S., and M. D. Cahalan. 1989. Mitogen-induced oscillations of cytosolic Ca 2÷ and
transmembrane Ca ~+ current in human leukemic T cells. Cell Regulation. 1:99-112.
Lewis, R. S., and M. D. Cahalan. 1990. Ion channels and signal transduction in lymphocytes. Annual Review of Physiology. 52:415-430.
Lewis, R. S., S. Grissmer, and M. D. Cahalan. 1991. Role of K ÷ channels in regulating calcium
signaling in leukemic T lymphocytes. Biophysical Journal. 59:13a. (Abstr.)
MacDougall, S. L., S. Grinstein, and E. W. Gelfand. 1988. Activation of Ca2+-dependent K ÷ channels
in human B lymphocytes by anti-immunoglobulin.Journat of Clinical Invest2gation. 81:449-454. MacKinnon R., P. H. Reinhart, and M. M. White. 1988. Charybdotoxin block of Shaker K ÷ channels
suggests that different types of K ÷ channels share common structural features. Neuron. 1:997-1001.
84 THE JOURNAL OF GENERAL PHYSIOLOGY • VOLUME 99" 1992
Mahaut-Smith, M. P., and M.J. Mason. 1991. Ca2+-activated K + channels in rat thymic lymphocytes:
activation by concanavalin A. Journal of Physiology. 439:513-528.
Mahaut-Smith, M. P., and L. C. Schlichter. 1989. Ca~+-activated K + channels in human B lympho-
cytes and rat thymocytes. Journal of Physiology. 415:69-83.
Miller, C., E. Moczydlowski, R. Latorre, and M. Phillips. 1985. Charybdotoxin, a protein inhibitor of
single CaZ+-activated K + channels t~om mammalian skeletal muscle. Nature. 313:316-318.
Negulescu, P. A., and T. E. Machen. 1991. Intracellular ion activities and membrane transport in
parietal cells measured with fluorescent dyes. Methods in Enzymology. 192:38-81.
Oettgen, H. C., C. Terhorst, L. C. Cantley, and P. M. Rosoff. 1985. Stimulation of the T3-T cell
receptor complex induces a membrane-potential-sensitive calcium influx. Cell. 40:583-590.
Pahapill, P. A., and L. C. Schlichter. 1990. Modulation of potassium channels in human T
lymphocytes: effects of temperature. Journal of Physiology. 422:103-126.
Partiseti, M., D. Choquet, A. Diu, and H. Korn. 1991. Differential regulation of the expression of
voltage and calcium activated K + channels on human splenic B lymphocytes. Biophysical Journal. 59:95a. (Abstr.)
Portzehl, H., P. C. Caldwell, andJ. C. Ruegg. 1964. The dependence of contraction and relaxation of
muscle fibres from the crab Maia squinado on the internal concentration of free calcium ions.
Biochimica et Biophysica Acta. 79:581-591.
Price, M., S. C. Lee, and C. Deutsch. 1989. Charybdotoxin inhibits proliferation and interleukin 2
production in human peripheral blood lymphocytes. Proceedings of the National Academy of Sciences, USA. 86:10171-10175.
Rink, T. J., and C. Deutsch. 1983. Calcium-activated potassium channels in lymphocytes. Cell Calcium. 4:463~,73.
Sabath, D. E., D. S. Monos, S. C. Lee, C. Deutsch, and M. B. Prystowsky. 1986. Cloned T-cell
proliferation and synthesis of specific proteins are inhibited by quinine. Proceedings of the National Academy of Sciences, USA. 83:4739--4743.
Sands, S. B., R. S. Lewis, and M. D. Cahalan. 1989. Charybdotoxin blocks voltage-gated K ÷ channels
in human and murine T lymphocytes. Journal of General Physiology. 93:1061-1074.
Schell, S. R., D. J. Nelson, H. A. Fozzard, and F. W. Fitch. 1987. The inhibitory e~tects of K +
channel-blocking agents on T lymphocyte proliferation and lymphokine production are
"nonspecific." Journal of Immunology. 139:3224-3230.
Sigworth, F.J. 1980. The variance of sodium current fluctuations at the node of Ranvier.Journal of Physiology. 307:97-129.
Sutro, J. B., B. S. Vayuvegula, S. Gupta, and M. D. Cahalan. 1989. Voltage-sensitive ion channels in
human B lymphocytes. Advances in Experimental Medicine and Biology. 254:113-122.
Tatham, P. E. R., K. O'Flynn, and D. C. Linch. 1986. The relationship between mitogen-induced
membrane potential change and intracellular free calcium in human T lymphocytes. Biochimica et Biophysica Acta. 856:202-211.
Tsien, R. Y., T. Pozzan, and T. J. Rink. 1982. T-cell mitogens cause early changes in cytoplasmic free
C a 2+ and membrane potential in lymphocytes. Nature. 295:68-71. Weiss, A., and J. B. Imboden. 1987. Cell surface molecules and early events involved in human T
lymphocyte activation. Advances in Immunology. 41:1-38.
Wilson, H. A., and T. M. Chused. 1985. Lymphocyte membrane potential and Ca~+-sensitive
potassium channels described by oxonol dye fluorescence measurements. Journal of Cellular Physiology. 125:72-81.