Embed Size (px)
Citation preview

CABIN AIR QUALITY ON NON-SMOKING COMMERCIAL FLIGHTS: A REVIEW OF PUBLISHED DATA ON AIRBORNE POLLUTANTS
Ruiqing Chen1, Lei Fang2, Junjie Liu1, Britta Herbig3, Victor Norrefeldt4, Florian Mayer4,
Richard Fox5 and Pawel Wargocki2*
1 Tianjin Key Laboratory of Indoor Air Environmental Quality Control, School of Environmental Science and Engineering, Tianjin University, China
2 International Centre for Indoor Environment and Energy, Department of Civil Engineering, Technical University of Denmark
3 LMU University Hospital Munich, Institute and Clinic for Occupational, Social and Environmental Medicine, Germany
4 Fraunhofer Institute for Building Physics IBP, Holzkirchen Branch, Germany 5 Aircraft Environment Solutions Inc., USA * Corresponding author: email [email protected]
Abstract
We reviewed 47 documents published 1967-2019 that reported measurements of volatile
organic compounds (VOCs) on commercial aircraft. We compared the measurements with the
air quality standards and guidelines for aircraft cabins and in some cases buildings. Average
levels of VOCs for which limits exist were lower than the permissible levels except for benzene
with average concentration at 5.9±5.5 μg/m3. Toluene, benzene, ethylbenzene, formaldehyde,
acetaldehyde, limonene, nonanal, hexanal, decanal, octanal, acetic acid, acetone, ethanol,
butanal, acrolein, isoprene and menthol were the most frequently appearing compounds. The
concentrations of SVOCs (Semi-Volatile Organic Compounds) and other contaminants did not
exceed standards and guidelines in buildings except for the average NO2 concentration at 12
ppb. Although the focus was on VOCs, we also retrieved the data on other parameters
characterizing cabin environment. Ozone concentration averaged 38±30 ppb below the upper
limit recommended for aircraft. The outdoor air supply rate ranged from 1.7 to 39.5 L/s per
person and averaged 6.0±0.8 L/s/p (median 5.8 L/s/p), higher than the minimum level
recommended for commercial aircraft. Carbon dioxide concentration averaged 1,315±232 ppm,

lower than what is permitted in aircraft and close to what is permitted in buildings. Measured
temperatures averaged 23.5±0.8°C and were generally within the ranges recommended for
avoiding thermal discomfort. Relative humidity averaged 16%±5%, lower than what is
recommended in buildings.
Key words: Commercial aircraft; Cabin air quality; In-flight measurement; Contaminants;
Thermal environment.
Practical Implications
The present work provides an empirical benchmark for contaminants at the concentrations
typically measured on commercial aircraft on which no tobacco smoking occurs. The
information can be used to study the risk of adverse health effects and discomfort for passengers
during commercial flights. The data can serve as a reference in policy documents that set the
permissible levels of airborne pollutants in aircraft cabins. Aircraft manufacturers may find the
present data useful in developing new tools and solutions for monitoring and mitigating
elevated levels of pollutants in aircraft cabins.
Abbreviations
ACH: Air Change rate per Hour
ACGIH: American Conference of Governmental Industrial Hygienists
AHSD: Air Health Science Division office
ANSI: American National Standards Institute
AP: Aviation Regulations
ASD-STAN: Aerospace and Defence Industries Association of Europe-Standardization
ASHRAE: American Society of Heating Refrigerating and Air-Conditioning Engineers

ASTM: American Society of Testing Materials
CAA: Civil Aviation Authority
CCAC: Civil Aviation Administration of China
CEN: Comité Européen de Normalisation
CFU: Colony Forming Unit
CO: Carbon monoxide
CO2: Carbon Dioxide
CSS: Consolidated Safety Services
DEHP: Diphenyl-2-ethylhexyl phosphate
EASA: European Aviation Safety Agency
ECS: Environmental Control System
EN: European Norm
EPA: Environmental Protection Agency
EU: European Union
FAA: Federal Aviation Administration
FH: Flight hours
FID: Flame Ionisation Detector
IAC: Russia's Interstate Aviation Committee
IAGVs: Indoor Air Guideline Values
JAA: Joint Airworthiness Authorities
LOD: Level of Detection
6-MHO: 6-methyl-5-hepten-2-one
NIOSH: National Institute for Occupational Safety and Health
NOAEL: No observed adverse effect level
NR: Not reported

O3: Ozone
ODT: Odour detection threshold
OEHHA: Office of Environmental Health Hazard Assessment
PELs: Permissible Exposure Levels
PID: Photo-Ionisation Detector
PM: Particulate Matter
PMV: Predicted Mean Vote
PPD: Predicted Percentage Dissatisfied
RELs: Recommended Exposure Levels
RH: Relative humidity
RSP: Respirable Suspended Particulates
SD: Standard Deviation
SI: Supplementary Information
SOA: Secondary organic aerosols
ST: Short Term Exposure Levels
SVOCs: Semi-volatile organic compounds
TBP: Triisobytyl phosphate
TCAC: Technical cabin air contamination
TCE: Trichloroethylene
TCEP: Tris (chloroethyl) phosphate
TCPP: Tris (chloro-isopropyl) phosphate
TCPs: Tricresyl phosphates
TDCPP: Tris (1,3-dichloro-isopropyl) phosphate
TEHP: Tris (ethyl-hexyl) phosphate
TiBP: Tributyl phosphate

T-m-CP: Tri-m-cresyl phosphate
T-mmp-CP: Tri-mmp-cresyl phosphate
T-mpp-CP: Tri-mpp-cresyl phosphate
TMPP: Trimethyllolpropane phosphate
TnBP: Tri-n-butyl phosphate
TOCP: Triorthocresyl phosphate
T-p-CP: Tri-p-cresyl phosphate
TPP: Triphenyl phosphate
TBEP: Tris (butoxy-ethyl) phosphate
TXP: Trixylyl phosphate
TVOC: Total concentration of VOCs
TWA: Time Weighted Average
US: United States
VOCs: Volatile organic compounds
WHO: World Health Organization
1. Introduction
Commercial airlines carried more than 4.5 billion passengers in 20181 and before the COVID-
19 pandemic occurred this number was expected to grow2. Around 96 billion gallons of fuel
were consumed by commercial airlines worldwide in 20193. Two to five percent of fuel is used
to maintain pressurization and ventilation of the air in aircraft cabins4. Ventilation reduces the
risk of adverse health effects and improves the comfort and well-being of passengers on
commercial aircraft as well as the working conditions for crew members. Consequently,
maintaining adequate air quality through proper ventilation and filtration of aircraft cabins is
important not only from the passenger and crew members point of view but also for the airline
because economically significant fuel savings can be achieved if the systems for maintaining
cabin environmental quality are operated and controlled according to the actual pollution loads
while not exceeding the permissible levels of the parameters defining the quality of air in the
aircraft cabin. The ventilation of aircraft cabins is particularly energy demanding because the
air is taken from the jet engines (so-called bleed air) or compressed by electrically driven
compressors and must be conditioned before it can be used for ventilation. Aircraft cabin
ventilation is composed typically of 60-80% outdoor air (bleed air) and 20-40% recirculated air
(extracted from the cabin)5,6. The B787 does not use bleed air but an electric air compressor to
provide outdoor air to the aircraft cabin; cabin air in the B787 contains approximately 50%
fresh air and 50% recirculated air. The National Research Council (US) Committee suggested
some models of aircraft should use different amounts of recirculation or even no recirculation7
but the European Aviation Safety Agency (EASA) states that each passenger and crew
compartment must be ventilated and each crew compartment must have enough outdoor air (not
less than 0.28 m3/min) to enable crewmembers to perform their duties without undue discomfort
or fatigue8. The Environmental Control System (ECS) that provides conditioned air to the cabin
crew and passengers is the most energy demanding sub-system of an aircraft, being responsible
for up to 5% of the total fuel consumption of the engines9. The traditional ECS requires a
minimum of 0.4 pounds per minute per person outside air to maintain pressurization and
avionics cooling10, and the air supplied may exceed the regulatory requirement of 0.55 pounds
per minute per person of outside air in order to account for flow measurement error in the bleed
air supply system to the ECS8. The new optimized ECS has potential for reducing fuel
consumption by reducing the ventilation rate required to achieve permissible levels of air
quality. It is estimated that it could potentially save nearly 0.8% to 2% of the fuel in comparison
with traditional ECS if the outdoor air supply rate could be reduced9,11. This amounts to fuel
savings of between 235,000 litres (62,000 gallons) and 587,500 litres (155,000

gallons)/year/airplane.
Ventilation is used to control the levels of pollutants generated inside the cabin as well as to
remove some heat12. Ventilation removes or dilutes the pollutants generated by the occupants,
their activities, the materials in the cabin and any other activities that are taking place in the
cabin such as the preparation and serving of meals. Ventilation can also be the carrier of engine
generated emissions as well as of contaminants present outdoors (e.g., ozone). Because
commercial aircraft traffic has increased, cabin air quality and its relation to cabin ventilation
has become a topic of considerable interest in recent years13. Many studies examined the effects
of cabin air quality on passengers14-18 and flight attendants19-21. The types and levels of air
pollutants typically measured on commercial flights must be well defined and information on
how they affect comfort and well-being and the risk for adverse health effects on passengers,
flight attendants and pilots must be documented for proper risk assessment and for the accurate
operation of systems for controlling cabin air quality.
The present paper focuses on cabin air pollutants and extends the available information on the
types of pollutants and the concentrations measured on commercial flights, which has been
summarized in reviews published in the past15,22-24. We briefly summarize a few of them in the
following.
Nagda et al.22 published a detailed review in 2000 of studies reporting measurements of cabin
air quality that had been carried out since the mid-1980s. They reported measurements in
studies of up to about 100 flights. These included information on bioaerosols, carbon monoxide
(CO), carbon dioxide (CO2) and particulate matter (PM). Only a few of the studies measured
formaldehyde, ozone (O3), or volatile organic compounds (VOCs); semi-volatile organic

compounds (SVOCs) were measured but were extremely low in concentration (below detection
limits of 1 µg/m3) and thus not reported as no conclusions could be drawn; naphthalene was the
only SVOC barely above the minimum detection limits.
Space et al. 23 reviewed in 2000 the same studies as Nagda et al.22 and agreed that in general
the levels of pollutants measured in aircraft were low and comparable to the levels found in
buildings. In particular, microbial levels in airplane cabins were found to be lower than those
in a typical dwelling or office building. CO and respirable particulate levels were within comfort
and health guidelines25, maximum O3 concentrations were lower than FAA25 regulatory limits,
and formaldehyde concentrations were lower than the maximum value recommended in
ASHRAE 62 Standard26. The average reported concentrations of CO2 were about 1,500 ppm
and were thus higher than 1,000 ppm which is the upper level typically recommended in
buildings for odour control, but they were not higher than is found in other means of
transportation such as trains, buses, or subways. Concentrations of VOCs were measured with
a variety of techniques, but the data were inadequate for developing well-founded
recommendations and conclusions. It was considered possible that interactions between some
pollutants and other parameters defining the quality of an aircraft cabin environment could
cause discomfort for crew members or passengers.
Nagda and Rector15 published a review in 2003 of six studies involving two to thirty flights;
the concentrations of both VOCs and SVOCs were reported. The review concluded that
contaminant levels in aircraft cabins during routine aircraft operations were about the same as
those in residential and office buildings. However, two exceptions were noted. The measured
levels of ethanol and acetone were higher in aircraft than in buildings and the levels of benzene,
tetrachloroethylene and xylenes were lower. It was also noted in the data from two studies that

under normal operating conditions the levels of SVOCs, including trimethylolpropane
phosphate (TMPP) and triorthocresyl phosphate (TOCP) were typically below the limits of
detection. The review suggested that any generalization of results from different measuring
campaigns would require data from a larger sample of flights, covering different types of
aircraft and operating conditions. Furthermore, it was suggested that measured VOCs and
SVOCs, although also seen in other environments, might not include the full spectrum of
pollutants and their reaction products that are present in aircraft27. The authors therefore called
for a comprehensive assessment of the chemical species found in aircraft cabin air.
Lindgren24 studied in 2003 the aircraft cabin environment and identified the personal and
environmental risk factors associated with symptoms and perceptions of cabin air quality. He
also investigated whether a ban on smoking and increased relative humidity of air on
intercontinental flights could have a beneficial health effect. The review concluded that the
relative humidity, reported to be 3% to 8% during intercontinental flights, was very low. Mould
and bacteria ranged between 10 and 300 Colony Forming Units (CFU)/m3. Tobacco smoking,
which was still permitted at the time of this study, increased the number of respirable particles
present in cabin air from 3 to 49 µg/m3 and increased the amount of cotinine in urine. The
exposure to tobacco smoke was highest in the aft part of the cabin, where the smoking section
was located. Lindgren22 concluded that tobacco smoke and the low relative humidity of cabin
air in aircraft are important environmental factors and that atopy and work stress could be
significant risk factors for symptoms and adverse environmental perceptions.
The present review was a part of the ComAir28 and CognitAir projects that investigated how
cabin ventilation and exposure to pollutants on commercial aircraft affect the cognitive
performance, comfort, and well-being of passengers; some results obtained in these projects are

reported elsewhere28 and all will be reported later when the analyses are completed. It was
additionally initiated by the increasing interest in developing methods that would
simultaneously control cabin air quality to improve comfort and reduce health risks while also
reducing the increased fuel consumption caused by over-ventilating the aircraft. The overall
aim was to identify all VOC studies published to date that reported measurements of air quality
on aircraft and to summarize the results to create a proper reference. Among the many initial
questions, the present review was intended to provide answers to the following queries: (i) How
many studies performed measurements on aircraft cabin environment and how many flights on
different aircraft were included in these studies? (ii) Which types of environmental parameters
and contaminants were measured? (iii) What were the most measured contaminants? and (iv)
What levels of each contaminant were measured? A central question was whether the measured
levels of contaminants complied with the current standards and recommendations regulating
aircraft cabin air quality. For this purpose, we also reviewed standards, guidelines, and
regulations governing air quality in aircraft cabins and other relevant regulations and guidelines
and compared them with the reported levels.
2. Review methodology
We searched Google Scholar, Web of Science and Research Gate for articles and reports on
measurements of air quality in commercial aircraft published before November 2019. The main
key words included: aircraft cabin air quality, air pollutants, gaseous contaminants, VOCs,
SVOCs, particles, microorganisms. We selected primarily archival articles that provided
adequate information on measurements of pollutants and their concentrations, and the
measuring methods used. Our focus was mainly measurements of VOCs, but we present also
all other measurements that were reported together with the VOCs in the studies that we
identified during our search.

More than 40,000 publications were found in the initial search. They were screened by reading
through their titles and abstracts. Among them, forty-seven original documents were selected
for the purpose of this review. We included papers reporting measurements on aircraft under
normal commercial flight conditions. We did not include studies reporting measurements in the
simulated mock-up of an aircraft29,30, focusing on engine emissions31, reporting unusual
exposures during which crew members complained about cabin air quality32 or aimed at
developing air monitoring and its applications33. The selected documents reported
measurements published as early as in 1967. The following measurements were reported in the
selected studies in addition to VOCs: temperature, relative humidity (RH), ventilation,
concentrations of CO2, CO, NOx, O3 and SVOCs, particulate matter (PM) and microorganisms.
We report the measurements on non-smoking aircraft and all data including aircraft where
smoking occurred are presented in SI.
The data pertinent to the objectives of the present review were extracted from the selected
documents and presented both in tabular form and graphically. To create a proper reference, we
extracted the following information: names of the authors, publication year, flight duration
(haul-type), study location, number of flights during which the measurements were made and
aircraft type. We also extracted all available information on VOC measurements and performed
quality assurance/quality control (QA/QC) analysis similar to the one performed by Nagda and
Rector15; these data are presented in SI in Table S1, and in Table 9.
The average and median measured levels of the identified contaminants were calculated and
presented together with the minimum and maximum levels in each study. The averages were
weighted by the number of flights during which the measurements were made. Similar data

treatment was used for other parameters that included temperature, RH, and ventilation. The
measured values reported in the forty-seven papers included in the present review were
compared with the permissible levels included in the standards and guidelines. For this purpose,
we reviewed standards or recommendations that are pertinent to air quality in aircraft.
We additionally compared average levels of VOCs with their published odour detection
thresholds (ODT) to determine probability of detection of the pollutants that were reported. To
obtain ODT we used modelled thresholds by Abraham et al.34; these modelled thresholds
correlate well with the experimental ODTs obtained by Nagata and Takeuchi35.
3. Results and discussion
3.1 Overview of standards and guidelines related to air quality in aircraft cabins
Seven standards, guidelines, and regulations were collected and reviewed. They are listed in
Table 1. Two of them are from the USA 36,37, three from Europe 10,38,39, one from Russia 40, and
one from China 41.
Table 1 presents the specific upper limits for the air contaminants listed in these documents.
These contaminants are: CO, CO2, O3, VOCs, SVOCs, PM, bacteria, and fungi. Ventilation
requirements that affect cabin air quality are also listed.
Only two documents contain upper limits for specific VOCs. These are BS-EN461839 and AP-
2540; they are listed in Table 2. We present the prescribed levels in BS-EN461839 but note that
the standard has been withdrawn as a result of a decision of the European committee CEN/BT
31/2013. We kept this document for future reference as it is one of only two attempts to regulate
the levels of VOCs on aircraft.

BS-EN461839 stipulates that the bacteria, virus and fungus limits should be those applied to the
levels of micro-organisms in non-industrial indoor environments42 and in the workplace as
prescribed by one European guideline43; the limits for mixed populations of fungi and bacteria,
not being a main focus of the present review, are presented in Supplementary Information (SI)
in Table S1242.
It is worth mentioning that ASHRAE Standard 16136 listed in Table 1 also prescribes the quality
of the thermal environment in the cabin. The temperatures should be in the range between
18.3°C-23.9°C both during in-flight and on-ground operations, and should not exceed 26.7°C
during in-flight, and 26.7°C (with entertainment systems not operating) or 29.4°C (with
entertainment systems in operation) on the ground. ASHRAE handbook44 suggests that typical
design temperatures for commercial aircraft should be between 24°C and 27°C for hot-day
ground design conditions, 21°C for cold-day ground-operating conditions, and 24°C during
cruise for both, and that the air distribution system should by design provide approximately 4.7
L/s/p of outdoor air. No other recommendations are provided. Aircraft design requirements do
not follow building recommendations for RH levels for occupant comfort because the upper
humidity limits are imposed by safety during flight to reduce any condensation that might result
in corrosion of the fuselage and the risk of electrical short-circuiting36; RH in B787 is about 25%
because of the use of composite materials45.

Table 1 Requirements regarding air quality in aircraft, where TWA stands for Time-Weighted Average.
Parameter FAR37 ASHRAE 16136 JAR38 CS10 BS-EN461839 CCAR41 AP-2540
CO 50 ppm*
9 ppm TWA10min
50 ppm 50 ppm
50 ppm peak
50 ppm 50 ppm 50 ppm 1 min peak 25 ppm TWA1h 10 ppm TWA8h
O3
100 ppb TWA 3h
100 ppb TWA 3h
100 ppb TWA 3h
100 ppb TWA 3h
100 ppb TWA 3h
100 ppb TWA 3h
100 ppb TWA 3h
250 ppb any time 250 ppb any time 250 ppb any time 250 ppb any time 250 ppb any time 250 ppb any time 250 ppb any time 60 ppb TWA 8h
CO2 5000 ppm - 30000 ppm 5000 ppm 20000 ppm 15min
5000 ppm 5000 ppm 5000 ppm peak 2,000 ppm
Ventilation rate
0.55 pounds/min per person
(corresponding to 3.5 L/s per person)
3.5 L/s per person (min. outside) 4.7 L/s per person
(min. outside) 4.7 L/s per person
(min. outside) -
0.55 pounds/min per person
(corresponding to 3.5 L/s per person)
- 7.1 L/s per person
(min. total)
VOCs - - - - See Table 2 - See Table 2
PM2.5 - - - -
100 μg/m3 TWA 1h (health)
40 μg/m3 continuous (health)
- -
PM10 - - - - 150 μg/m3 TWA 24h - -
Bacteria and fungi - - - - See Table S12 - -
SVOCs - - - - - -
Phosphate cresol mixture 0.5 mg/m3 Dioctyl sebacate 5 mg/m3
*The original language is 1 part in 20,000 parts of air.
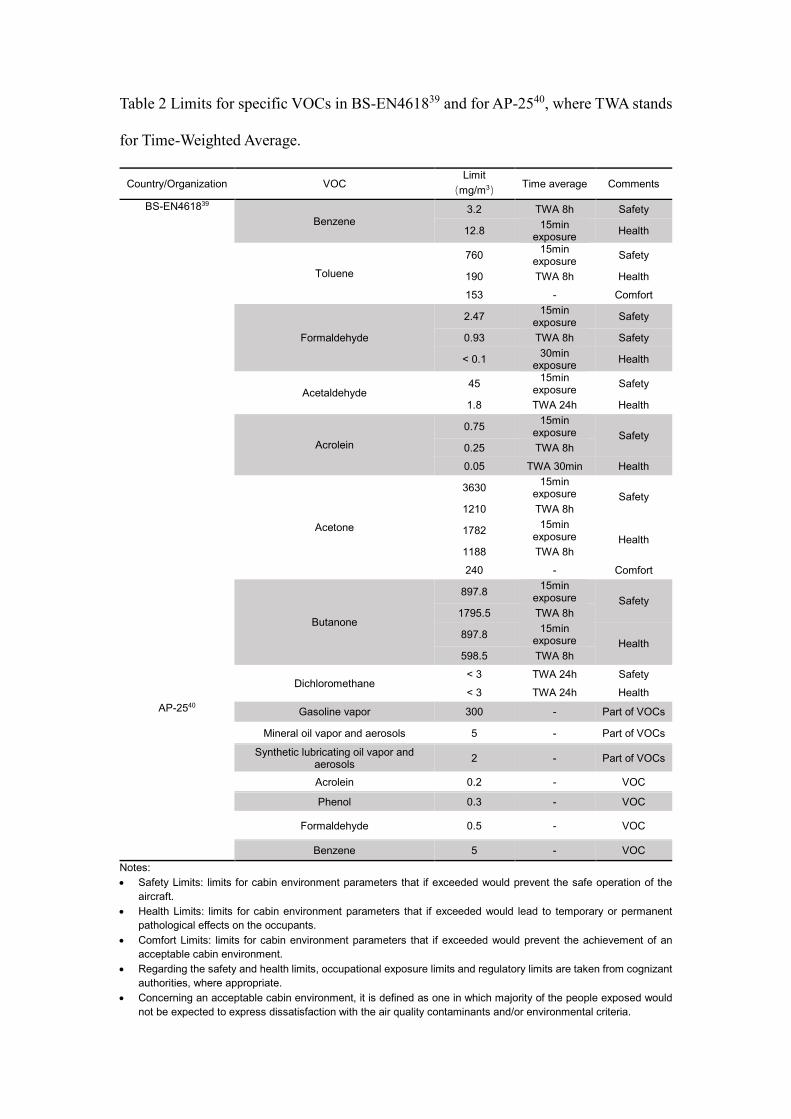
Table 2 Limits for specific VOCs in BS-EN461839 and for AP-2540, where TWA stands
for Time-Weighted Average.
Country/Organization VOC Limit
(mg/m3) Time average Comments
BS-EN461839 Benzene
3.2 TWA 8h Safety
12.8 15min exposure Health
Toluene
760 15min exposure Safety
190 TWA 8h Health
153 - Comfort
Formaldehyde
2.47 15min exposure Safety
0.93 TWA 8h Safety
< 0.1 30min exposure Health
Acetaldehyde 45 15min
exposure Safety
1.8 TWA 24h Health
Acrolein
0.75 15min exposure Safety
0.25 TWA 8h
0.05 TWA 30min Health
Acetone
3630 15min exposure Safety
1210 TWA 8h
1782 15min exposure Health
1188 TWA 8h
240 - Comfort
Butanone
897.8 15min exposure Safety
1795.5 TWA 8h
897.8 15min exposure Health
598.5 TWA 8h
Dichloromethane < 3 TWA 24h Safety
< 3 TWA 24h Health AP-2540 Gasoline vapor 300 - Part of VOCs
Mineral oil vapor and aerosols 5 - Part of VOCs
Synthetic lubricating oil vapor and aerosols 2 - Part of VOCs
Acrolein 0.2 - VOC
Phenol 0.3 - VOC
Formaldehyde 0.5 - VOC
Benzene 5 - VOC Notes: • Safety Limits: limits for cabin environment parameters that if exceeded would prevent the safe operation of the
aircraft. • Health Limits: limits for cabin environment parameters that if exceeded would lead to temporary or permanent
pathological effects on the occupants. • Comfort Limits: limits for cabin environment parameters that if exceeded would prevent the achievement of an
acceptable cabin environment. • Regarding the safety and health limits, occupational exposure limits and regulatory limits are taken from cognizant
authorities, where appropriate. • Concerning an acceptable cabin environment, it is defined as one in which majority of the people exposed would
not be expected to express dissatisfaction with the air quality contaminants and/or environmental criteria.

• Comfort limits where appropriate are taken from cognizant authorities that provide indoor environment standards and guidelines.
3.2 Overview of studies reporting measurements of air quality in aircraft
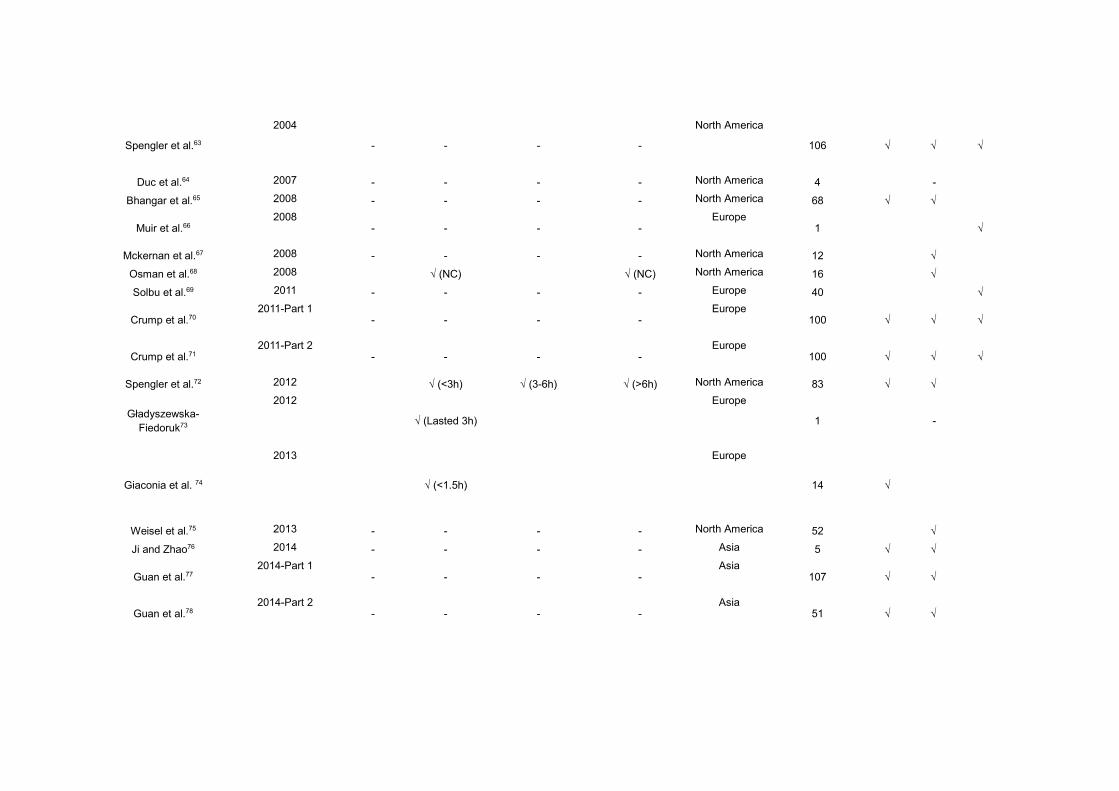
Table 3 provides a summary of the studies included in the present review. It shows that
the measurements reported were performed on 2,251 flights and that the first study was
published as early as 1967. About forty different aircraft types were examined including
those used for regional or intercontinental flights. The length of flight determined
different categories of flight duration from very short-haul, short-haul, medium-haul to
long-haul flights the categories of flight duration used in the original studies were
adopted as there were differences in the methods used to categorize flight duration
between various studies. Accurate determination of flight duration was considered
irrelevant for the purpose of the present review.
The U.S. ban on inflight smoking began with domestic flights of two hours or less in
April 1988, and was extended to domestic flights of six hours or less in February 1990,
followed by the extension to all domestic and international flights in 200046. The ban
in the EU was introduced in 199747. We therefore considered all studies published after
2000 to have reported measurements on aircraft on which smoking did not occur unless
the authors stated that smoking was still taking place. For the studies published before
2000 we specifically looked for information on whether the measurements were made
on aircraft where smoking did not occur, see Table 3 for details.
Table 4 summarizes parameters characterizing cabin air quality measured in the studies
included in the present review together with the number of flights on which the
measurements were made. VOCs and SVOCs were reported in 27 and 12 studies

respectively on 1080 and 540 flights. PM was measured in 17 studies on a total of 451
flights. The other contaminants measured were CO, NO, NO2, NOX, SO2; they were
measured respectively on 378, 5, 37, 41 and 5 flights. Bacteria, fungi, and moulds were
measured on 195, 152 and 2 flights respectively. O3 was measured in 21 studies on 1092
flights. Ventilation was measured on 364 flights in nine studies. CO2 was measured in
20 studies covering 655 flights. Fourteen studies measured temperature on 371 flights.
Seventeen studies measured RH on 407 flights. The details of measurements,
measurement location and QA/QC analysis are shown in Table S1 in SI; the
measurements were mainly made in the passenger area.

Table 3 Summary of studies included in the present review that reported measurements of air quality in aircraft cabins.
Study
Year
Flight typea
Study location Number of flights
Aircraft type
Very short-haul flights
Short-haul flights Medium-haul flights Long-haul flights Airbus Boeing Others
Brabets et al.48 1967 - - - - North America 285 -
Bishof49 1973 - - - - Europe 14 √ √
Perkins et al.50 1979 - - - - North America 2 √
Rogers51 1980 √ (NC) √ (NC) North America 157 √ √ √
Nagda et al.52 1992 - - - - North America 92 √ √ √
Dechow et al.53 1997 √ (NC) √ (NC) Europe 2 √
ASHRAE54 1999NS √ (NC) √ (NC) North America 8 √
Lee et al.55 1999 √ (1h
25min) - - √ (14h 15min) Asia
16 √ √
Haghighat et al.56 1999 - - - - North America 43 √ √ √
Fox6 2000NS NC North America 2 √
Dumyahn et al.57 2000NS NC(1h-7.2h) North America 49 √
Ree et al.58 2000 - - - - Europe 40 √
Wieslander et al.59 2000
- - - - Europe
2 √
Nagda et al.60 2001
- - - - North America
10 √
Lindgren and Norbäck47 2002S
- - - - Europe
26 √
Waters et al.61 2002S
√ (< 2h) √ (2-8 h) √ (>8h) North America
36 -
Spicer et al.62
2004-RP-1262 Part 1 √ (3 h-3h 49 min)
North America
4 √ √
Spengler et al.63
2004
- - - -
North America
106 √ √ √
Duc et al.64 2007 - - - - North America 4 -
Bhangar et al.65 2008 - - - - North America 68 √ √
Muir et al.66 2008
- - - - Europe
1 √
Mckernan et al.67 2008 - - - - North America 12 √
Osman et al.68 2008 √ (NC) √ (NC) North America 16 √
Solbu et al.69 2011 - - - - Europe 40 √
Crump et al.70 2011-Part 1
- - - - Europe
100 √ √ √
Crump et al.71 2011-Part 2
- - - - Europe
100 √ √ √
Spengler et al.72 2012 √ (<3h) √ (3-6h) √ (>6h) North America 83 √ √
Gładyszewska-Fiedoruk73
2012 √ (Lasted 3h)
Europe
1 -
Giaconia et al. 74
2013
√ (<1.5h)
Europe
14 √
Weisel et al.75 2013 - - - - North America 52 √
Ji and Zhao76 2014 - - - - Asia 5 √ √
Guan et al.77 2014-Part 1
- - - - Asia
107 √ √
Guan et al.78 2014-Part 2
- - - - Asia
51 √ √

Li et al.79
2014 √ (1h 27min-
3h 50min)
Asia
9 √
Ree et al.80 2014 - - - - Europe 20 √
Wang et al.81 2014 - - - - Asia 14 √
Wang et al.82 2014 - - - - Asia 14 √
Guan et al.83 2015 - - - - Asia 6 -
Gao et al.84 2015 - - - - Asia 5 √
Rosenberger et al.85 2016 √ (NC) √ (NC) Europe 108 √
Schuchardt et al.86 2017 √ (NC) √ (NC) Europe 69 √ √
Cao et al.87 2017 √ (NC) Asia 64 √ √
Cao et al.88 2018 √ (<2h) √ (2–6h) Asia 179 √ √ √
Rosenberger14 2018 - - - - Europe 17 √
Schuchardt et al.89 2019 - - - - Europe 177 √ √
Guan et al.90 2019 - - - - Asia 14 √ √
Liu et al.91 2019 - - - - Asia 7 √ √
Total 1967-2019 1 11 5 10
2251 22 35 12 Notes: • NC: not clear. • a: length of flight according to the information provided in the reviewed papers; it was not possible to provide the length of flights in minutes/hours. • Studies reported after 2000 are on non-smoking flights unless indicated with S at the date; studies before 2000 were considered to be carried out on smoking flights unless indicated NS at the
date.

Table 4 Number of flights on which air quality parameters were measured in the studies selected for the present review.
Study Year Parameters measured in aircraft cabin(Flight number)
Temperature RH Ventilation CO2 O3 VOCs SVOCs Particulates CO NO NO2 NOx SO2 Bacteria Fungi Molds Brabets et al.48 1967 285
Bishof49 1973 14
Perkins et al.50 1979 2
Rogers51 1980 157
Nagda et al.52 1992 92 92 35 92 92 92 92 92 92
Dechow et al.53 1997 2 2 2
ASHRAE54 1999 8 8 8 8 8 8 8 8 8
Lee et al.55 1999 16 16 16 16 5 8 8 5 5 5 5 3 3
Haghighat et al.56 1999 43 43 43
Fox6 2000 2 2 2 2 2 2
Dumyahn et al.57 2000 49 49 49 27 49 49 49 27 49 49
Ree et al.58 2000 18 31
Wieslander et al.59 2000 2 2 2 2 2 2 2 2
Nagda et al.60 2001 10 10 10 10 10 10 10
Lindgren and Norbäck47 2002 5 5 24 5 13 22 26 5
Waters et al.61 2002 36 36 36 36 36 36 36 36
Spicer et al.62 2004-RP-1262 Part
1 4 4 4 4 4 4 4 4 4
Spengler et al.63 2004 106
Duc et al.64 2007
4
Bhangar et al.65 2008 68
Muir et al.66 2008 1 1
Mckernan et al.67 2008
12
Osman et al.68 2008
16
Solbu et al.69 2011 31 40

Crump et al.70 2011-Part1
100 100 40
Crump et al.71 2011-Part2
100 100
Spengler et al.72 2012 83 83 83 83 83 83 63(21 available) 81 83
Gładyszewska-Fiedoruk73 2012 1 1 1
Giaconia et al.74 2013 14 14 14
Weisel et al.75 2013 52 52
Ji and Zhao76 2014 5 5 5
Guan et al.77 2014 107
Guan et al.78 2014-Part1
51
Li et al.79 2014-Part2
5 5 9
Ree et al.80 2014 20
Wang et al.81 2014 14
Wang et al.82 2014 14
Guan et al.83 2015 6 6 6
Gao et al.84 2015 5 5
Rosenberger et al.85 2016 108
Schuchardt et al.86 2017 20 20 69 69 69 69
69
Cao et al.87 2017 64
Cao et al.88 2018 179 179
Rosenberger14 2018 17 17 17 17
17
Schuchardt et al.89 2019 177 177
Guan et al.90 2019 14 14 14
Liu et al.91 2019 4 1 7
Number of studies 1967-2019 14 17 9 20 21 27 12 17 11 1 3 2 1 10 4 1 Number of flights 1967-2019 371 407 364 655 1092 1080 540 451 378 5 37 41 5 195 152 2

3.3 Measured VOCs
Different methods were used to detect and analyse VOCs in studies included in the
present review. We grouped the results according to the method used.
Two methods were used to monitor the total concentration of VOCs (TVOCs). These
were the Flame Ionisation Detector (FID)55 and the Photo-Ionisation Detector
(PID)70,71,83,86. Average TVOC concentration measured using a real-time FID monitor
was about 8 mg/m3. Average TVOC concentration measured using a real-time PID
method was 277 μg/m3; the range was from 0 to 38 mg/m3. FID is often reported as ppb
methane and PID as ppb isobutylene equivalent; Schuchardt et al.89 reported it as
Toluene equivalent in µg/m3. We were not able to determine the calibration details for
these detectors, but they may explain the large differences in TVOC observed between
the two methods.
Three sampling methods were used to measure VOCs: active sampling, passive
sampling, and canister sampling. Active sampling was used in the majority of the
studies included in the present review, resulting in 140 measured VOCs53,54,61,70-
72,75,76,78,81,82,84-86. There is no detailed concentration data on the type of contaminants
for other active sampling studies of VOCs14,69,77,83,89. Passive sampling was used in a
few studies resulting in 48 measured VOCs47,59,62,92, while canister sampling was used
in five studies resulting in 96 measured VOCs60,62,72. As active sampling detected more
compounds and was used in the greatest number of studies the results obtained in this
way are presented below. All other measurements are tabulated in SI where a distinction
is made between the compounds measured on all flights and on non-smoking flights

only.
The concentrations of VOCs measured using active sampling were in the range from 0
to 3 mg/m3 with the average concentration ranging between 0.1 and 100 μg/m3. For
non-smoking flights, Figure 1 shows the VOCs measured in 12 studies. Fifteen classes
of VOCs were measured, with alcohols accounting for most of the compounds
measured (57.8%) followed by aldehydes (6.4%), alkanes (4.8%), terpenes (4.5%),
aromatics (3.5%) and ketones (3.4%); all other groups of VOCs each accounted for less
than 3% of the compounds measured (Figure 1). Comparing concentrations of
measured VOCs with the permissible levels set out by AP-2540 and the now withdrawn
BS-EN461839, it can be seen that even the maximum concentrations of the listed
compounds measured in the aircraft cabins were lower than the prescribed limits (Table
5).
Figure 1 VOCs measured on non-smoking aircraft in 12 studies classified by chemical
functional group54,70-72,75,76,78,81,82,84-86.

Table 5 Concentrations of measured VOCs in non-smoking commercial flights
compared with the permissible levels set out by BS-EN461839 (withdrawn) and AP-25
40, where TWA stands for Time Weighted Average.
VOC
Chemical Abstract
System (CAS) no.
Concentration(μg/m3) Limit(mg/m3) Time average Comments
Avg. SD Min. Max.
Benzene 71-43-2 5.9 5.5 0.0 78 3.239 TWA 8h Safety 12.839 15min exposure Health
Toluene 108-88-3 15 12 0.0 209 76039 15min exposure Safety 19039 TWA 8h Health 15339 - Comfort
Formaldehyde 50-00-0 5.4 1.5 0.0 44
2.4739 15min exposure Safety 0.9339 TWA 8h Safety < 0.139 30min exposure Health 0.540 - VOC
Acetaldehyde 75-07-0 6.4 1.2 0.3 90 4539 15min exposure Safety 1.839 TWA 24h Health
Acrolein 107-02-8 < 0.8 1.0 0.0 53
0.7539 15min exposure Safety 0.2539 TWA 8h 0.0539 TWA 30min Health 0.240 - VOC
Acetone 4468-52-4 14 5.6 <LOD 384
363039 15min exposure Safety 121039 TWA 8h 178239 15min exposure Health 118839 TWA 8h 24039 - Comfort
Butanone 78-93-3 2.4 0.8 0.0 32
897.839 15min exposure Safety 1795.539 TWA 8h 897.839 15min exposure Health 598.539 TWA 8h
Phenol 108-95-2 1.2 0.1 0.1 5.0 0.340 - VOC Note: in some cases, the admissible levels for 8-hour exposure are higher than admissible levels for 30 min exposure; the reason is that they refer to different outcomes, as indicated in the table above.

Table 6 shows a list of compounds that were measured in two or more studies, with the
highest concentration, with the lowest ODTs. The compounds most frequently
appearing on these lists were toluene, benzene, ethylbenzene, formaldehyde,
acetaldehyde, limonene, nonanal, hexanal, decanal, octanal, butanal, acetic acid,
acetone, ethanol, acrolein, isoprene, and menthol; aldehydes and acids were with the
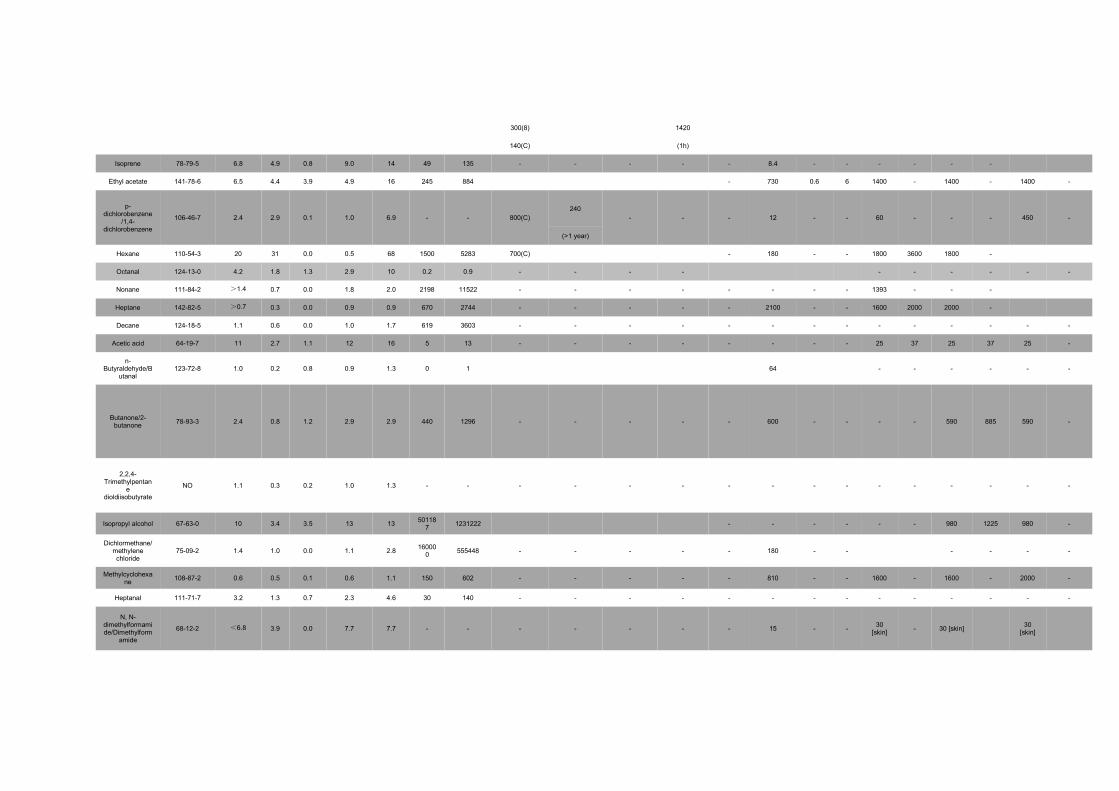
lowest ODTs (the SI provides more detail). Table 7 shows compounds that were
frequently measured (measured in ≥ 2 studies) and compared with some examples of
Indoor Air Guideline Values (IAGVs) for VOCs proposed by WHO, US and in various
other countries.
Toluene, benzene and ethylbenzene are fuel-related and engine-related compounds39,
and toluene concentration was previously regulated39. The maximum measured
concentrations of toluene (Table 7) were lower than the previously recommended
maximum level of toluene (Table 2). Toluene was among the few pollutants that were
most frequently found to be present on aircraft at high concentrations (Table 6 and Table
S10 in SI); this reflects the sampling methods applied collecting mainly hydrocarbons
and not oxygenates and other miscellaneous compounds. According to the Indoor Air
Guideline Values (IAGVs) (Table 7), the average benzene concentration of
5.9±5.5μg/m3 exceeded the 8-hour Recommended Exposure Levels (RELs) and the
Chronic RELs93. Benzene is a genotoxic carcinogen in humans and no safe level of
exposure can be recommended. The geometric mean of the range of the estimates of
the excess lifetime risk of leukaemia at an air concentration of 1 μg/m3 is 6 × 10⁻⁶. The
concentrations of airborne benzene associated with an excess lifetime risk of 1/10,000,
1/100,000 and 1/1,000,000 are 17, 1.7 and 0.17 μg/m3, respectively. The average level

of benzene measured on aircraft was around 5.9±5.5μg/m3 which corresponds to excess
lifetime risk of leukemia of 1/30,00094. Figure S1 in SI presents the relationship
between measured toluene and benzene levels in 5 studies66,76,78,81,86 that can be used to
estimate benzene levels based on the toluene levels. It shows that the concentration of
toluene is twice that of benzene.
Formaldehyde and acetaldehyde are likely to have been products of the O3 chemistry
that occurs in aircraft95-97, and associated with lubricant and hydraulic oils and fuel39.
They were being considered for regulation by BS-EN 461839 before it was withdrawn
(Table 2 and Table 5).
Many sources can emit limonene, such as fragrances in aircraft cabins, fragrances in
wet napkins, cleaning agents and deodorizers97,98, as well as from soft drinks99 and (earl
grey) tea100 and citrus fruits99. It is one of pollutants that was measured frequently and
at high concentration (Table 6). It is also worth mentioning that limonene was
frequently detected on cabin air filters at 4 mg/g carbon (6.0% of the total mass of all
compounds) that had been used for 660 flight hours, and at 6 mg/g carbon (3.7% of the
total mass of all compounds) on filters that had been used for 3,937 flight hours101.
Limonene can undergo chemical transformations. Reactions with O3 can produce
secondary organic aerosols (SOAs)102,103 and aldehydes97,98, among others
formaldehyde and acetaldehyde, and oxy and poly-oxygenated gaseous VOCs/SVOCs.
Nonanal, capronaldehyde/hexaldehyde/hexanal, decanal and octanal were detected
frequently in aircraft cabins at high concentrations (Table 6). These pollutants are
associated with the presence of humans but are the results of heterogeneous reactions

between O3 and human skin oils75,84,104. Skin oils are present on human skin but can
also be present on clothing and on all surfaces that have been touched by human skin,
such as seats, armrests, and headrests.
The products of the chemical reaction between squalene and O3 is one of the sources of
acetic acid in aircraft cabins84, which is one of the pollutants that were measured
frequently at high concentration (Table 6). Ethanol is associated with emissions from
humans due to metabolic processes (or consumption of alcohol)105, it is one of
pollutants that was measured frequently and at the highest concentration (Table 6).
Acetone is also a pollutant emitted by humans105 that was one of the compounds
measured most frequently and with the highest concentrations on aircraft (Table 6);
acetone was being considered for regulation by BS-EN 461839 before it was withdrawn
(Table 2).
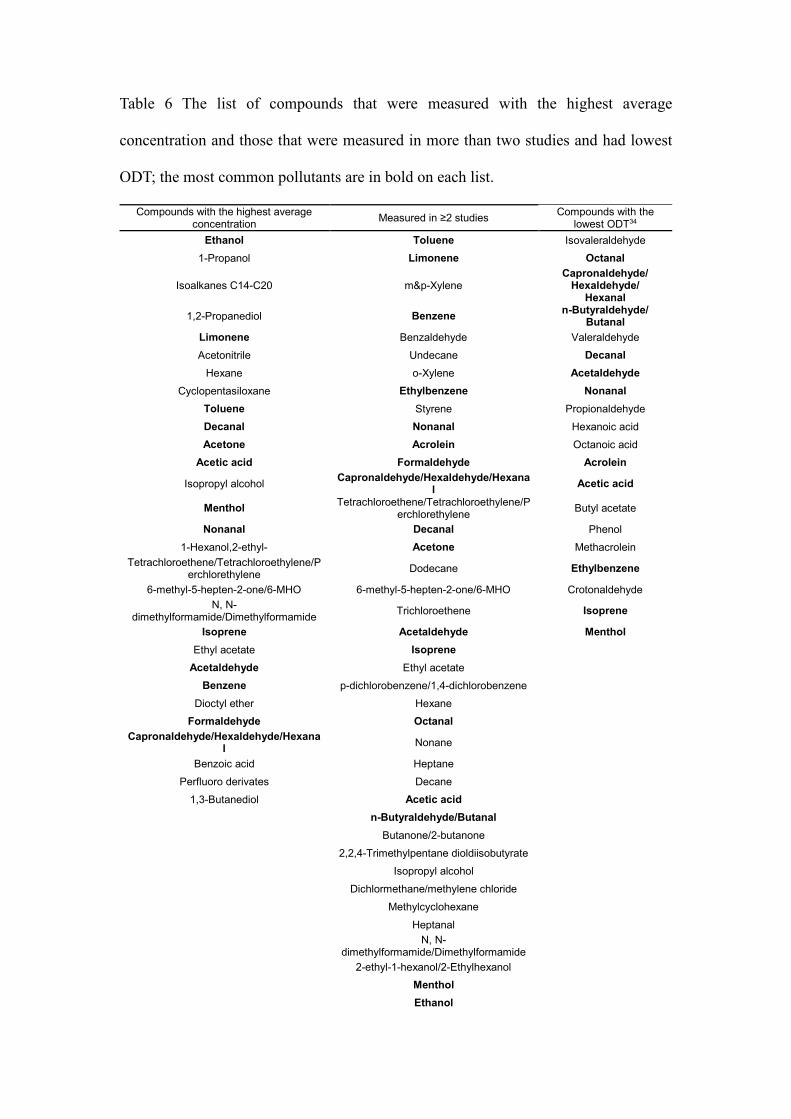
Table 6 The list of compounds that were measured with the highest average
concentration and those that were measured in more than two studies and had lowest
ODT; the most common pollutants are in bold on each list.
Compounds with the highest average concentration Measured in ≥2 studies Compounds with the
lowest ODT34 Ethanol Toluene Isovaleraldehyde
1-Propanol Limonene Octanal
Isoalkanes C14-C20 m&p-Xylene Capronaldehyde/
Hexaldehyde/ Hexanal
1,2-Propanediol Benzene n-Butyraldehyde/ Butanal
Limonene Benzaldehyde Valeraldehyde Acetonitrile Undecane Decanal
Hexane o-Xylene Acetaldehyde Cyclopentasiloxane Ethylbenzene Nonanal
Toluene Styrene Propionaldehyde Decanal Nonanal Hexanoic acid Acetone Acrolein Octanoic acid
Acetic acid Formaldehyde Acrolein
Isopropyl alcohol Capronaldehyde/Hexaldehyde/Hexanal Acetic acid
Menthol Tetrachloroethene/Tetrachloroethylene/Perchlorethylene Butyl acetate
Nonanal Decanal Phenol 1-Hexanol,2-ethyl- Acetone Methacrolein
Tetrachloroethene/Tetrachloroethylene/Perchlorethylene Dodecane Ethylbenzene
6-methyl-5-hepten-2-one/6-MHO 6-methyl-5-hepten-2-one/6-MHO Crotonaldehyde N, N-
dimethylformamide/Dimethylformamide Trichloroethene Isoprene
Isoprene Acetaldehyde Menthol Ethyl acetate Isoprene
Acetaldehyde Ethyl acetate
Benzene p-dichlorobenzene/1,4-dichlorobenzene
Dioctyl ether Hexane
Formaldehyde Octanal Capronaldehyde/Hexaldehyde/Hexana
l Nonane
Benzoic acid Heptane
Perfluoro derivates Decane
1,3-Butanediol Acetic acid n-Butyraldehyde/Butanal Butanone/2-butanone 2,2,4-Trimethylpentane dioldiisobutyrate Isopropyl alcohol Dichlormethane/methylene chloride Methylcyclohexane Heptanal
N, N-dimethylformamide/Dimethylformamide
2-ethyl-1-hexanol/2-Ethylhexanol Menthol Ethanol

Tridecane Pentane 3-Carene a-Pinene b-Pinene
Octane
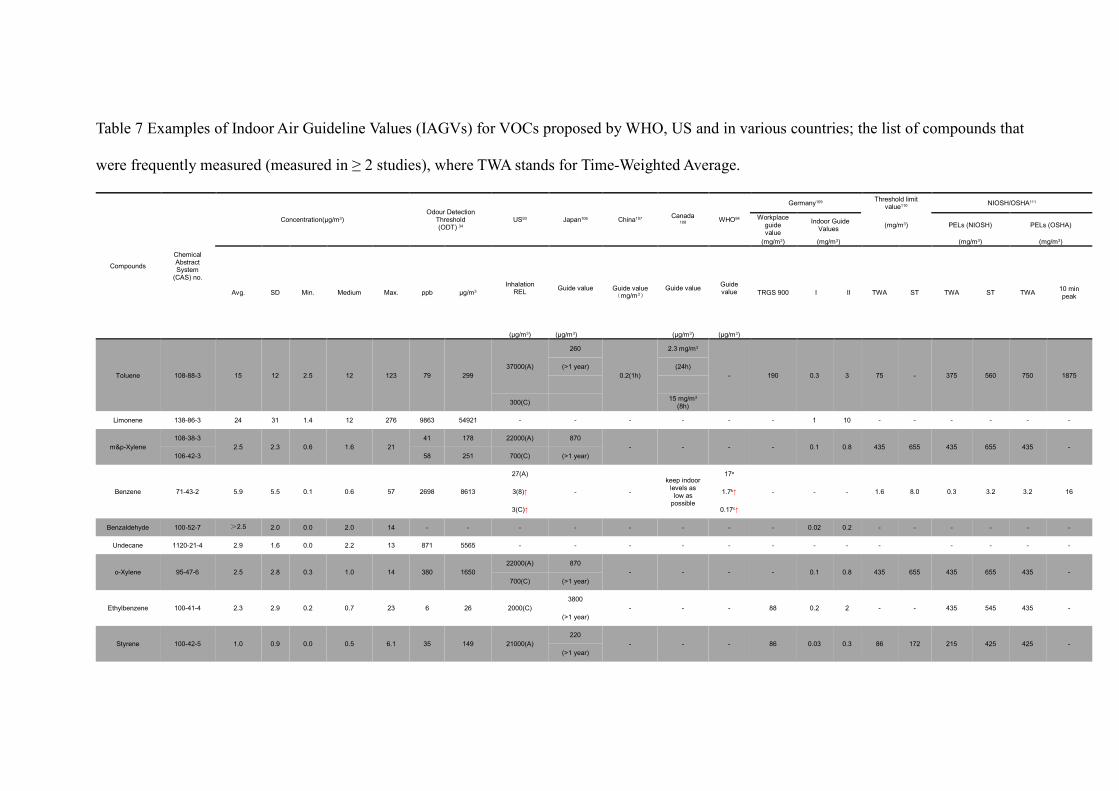
Table 7 Examples of Indoor Air Guideline Values (IAGVs) for VOCs proposed by WHO, US and in various countries; the list of compounds that
were frequently measured (measured in ≥ 2 studies), where TWA stands for Time-Weighted Average.
Compounds
Chemical Abstract System
(CAS) no.
Concentration(μg/m3) Odour Detection
Threshold (ODT) 34
US93 Japan106 China107 Canada 108 WHO94
Germany109 Threshold limit value110 NIOSH/OSHA111
Workplace guide value
Indoor Guide Values (mg/m3) PELs (NIOSH) PELs (OSHA)
(mg/m3) (mg/m3) (mg/m3) (mg/m3)
Avg. SD Min. Medium Max. ppb μg/m3 Inhalation
REL Guide value Guide value(mg/m3)
Guide value Guide value TRGS 900 I II TWA ST TWA ST TWA 10 min
peak
(μg/m3) (μg/m3) (μg/m3) (μg/m3)
Toluene 108-88-3 15 12 2.5 12 123 79 299 37000(A)
260
0.2(1h)
2.3 mg/m3
- 190 0.3 3 75 - 375 560 750 1875 (>1 year) (24h)
300(C) 15 mg/m3 (8h)
Limonene 138-86-3 24 31 1.4 12 276 9863 54921 - - - - - - 1 10 - - - - - -
m&p-Xylene 108-38-3
2.5 2.3 0.6 1.6 21 41 178 22000(A) 870
- - - - 0.1 0.8 435 655 435 655 435 - 106-42-3 58 251 700(C) (>1 year)
Benzene 71-43-2 5.9 5.5 0.1 0.6 57 2698 8613
27(A)
- -
keep indoor levels as low as
possible
17a
- - - 1.6 8.0 0.3 3.2 3.2 16 3(8)↑ 1.7b↑
3(C)↑ 0.17c↑
Benzaldehyde 100-52-7 >2.5 2.0 0.0 2.0 14 - - - - - - - - 0.02 0.2 - - - - - -
Undecane 1120-21-4 2.9 1.6 0.0 2.2 13 871 5565 - - - - - - - - - - - - -
o-Xylene 95-47-6 2.5 2.8 0.3 1.0 14 380 1650 22000(A) 870
- - - - 0.1 0.8 435 655 435 655 435 - 700(C) (>1 year)
Ethylbenzene 100-41-4 2.3 2.9 0.2 0.7 23 6 26 2000(C) 3800
- - - 88 0.2 2 - - 435 545 435 - (>1 year)
Styrene 100-42-5 1.0 0.9 0.0 0.5 6.1 35 149 21000(A) 220
- - - 86 0.03 0.3 86 172 215 425 425 - (>1 year)

900(C)
Nonanal 124-19-6 7.8 5.6 1.9 5.4 24 1 3 - 41
- - - - - - - - - - - (>1 year)
Acrolein 107-02-8 <0.8 1.0 <LOD 0.4 3.2 4 8
2.5(A)
- - - - 0.2 - - - 0.25 0.25 0.8 0.25 - 0.7(8)
0.35(C)
Formaldehyde 50-00-0 5.4 1.5 2.7 5.9 7.1 500 614
55(A) 100
0.1
50 100
0.37 0.1 not derived
- 0.37 0.02 - 0.92 -
(30min) (8h) (30min)
9(8) 123 360
(1h) (4h)
9(C) 600
(NOAEL)
Capronaldehyde/Hexaldehyde/H
exanal 66-25-1 5.2 4.8 1.7 2.8 14 0 1 - - - - - - - - - - - - - -
Tetrachloroethene/Tetrachloroethylene/Perchlore
thylene
127-18-4 7.3 5.7 0.6 3.8 16 769 5213 - - - - - - 0.1 1 - -
Minimize workplac
e exposur
e concentr
ations
- 678 -
Decanal 112-31-2 14 5.0 2.7 15 36 0 3 - - - - - - - - - - - - - -
Acetone 4468-52-4 14 5.6 0.5 16 49 832 1975 - - - - - 1200 - - 1185 2375 590 - 2400 -
Dodecane 93685-81-5 3.1 1.8 0.0 1.9 13 110 765 - - - - - - - - - - - - - -
6-methyl-5-hepten-2-one/6-
MHO 129085-68-3 7.0 3.5 0.2 8.5 16 - - - - - - - - - - - - - - - -
Trichloroethene 79-01-6 0.4 0.2 0.1 0.3 0.7 3899 20941 - - - -
230d
- - - - - - - 537 - 23e
2.3f
Acetaldehyde 75-07-0 6.4 1.2 5.2 5.3 7.7 1 3 470(A) 48
- 280
- 91 0.1 1 - 45 - - 360 - (>1 year) (24h)
300(8) 1420
140(C) (1h)
Isoprene 78-79-5 6.8 4.9 0.8 9.0 14 49 135 - - - - - 8.4 - - - - - -
Ethyl acetate 141-78-6 6.5 4.4 3.9 4.9 16 245 884 - 730 0.6 6 1400 - 1400 - 1400 -
p-dichlorobenzene
/1,4-dichlorobenzene
106-46-7 2.4 2.9 0.1 1.0 6.9 - - 800(C) 240
- - - 12 - - 60 - - - 450 -
(>1 year)
Hexane 110-54-3 20 31 0.0 0.5 68 1500 5283 700(C) - 180 - - 1800 3600 1800 -
Octanal 124-13-0 4.2 1.8 1.3 2.9 10 0.2 0.9 - - - - - - - - - -
Nonane 111-84-2 >1.4 0.7 0.0 1.8 2.0 2198 11522 - - - - - - - - 1393 - - -
Heptane 142-82-5 >0.7 0.3 0.0 0.9 0.9 670 2744 - - - - - 2100 - - 1600 2000 2000 -
Decane 124-18-5 1.1 0.6 0.0 1.0 1.7 619 3603 - - - - - - - - - - - - - -
Acetic acid 64-19-7 11 2.7 1.1 12 16 5 13 - - - - - - - - 25 37 25 37 25 -
n-Butyraldehyde/B
utanal 123-72-8 1.0 0.2 0.8 0.9 1.3 0 1 64 - - - - - -
Butanone/2-butanone 78-93-3 2.4 0.8 1.2 2.9 2.9 440 1296 - - - - - 600 - - - - 590 885 590 -
2,2,4-Trimethylpentan
e dioldiisobutyrate
NO 1.1 0.3 0.2 1.0 1.3 - - - - - - - - - - - - - - - -
Isopropyl alcohol 67-63-0 10 3.4 3.5 13 13 501187 1231222 - - - - - - 980 1225 980 -
Dichlormethane/methylene chloride
75-09-2 1.4 1.0 0.0 1.1 2.8 160000 555448 - - - - - 180 - - - - - -
Methylcyclohexane 108-87-2 0.6 0.5 0.1 0.6 1.1 150 602 - - - - - 810 - - 1600 - 1600 - 2000 -
Heptanal 111-71-7 3.2 1.3 0.7 2.3 4.6 30 140 - - - - - - - - - - - - - -
N, N-dimethylformamide/Dimethylform
amide
68-12-2 <6.8 3.9 0.0 7.7 7.7 - - - - - - - 15 - - 30 [skin] - 30 [skin] 30
[skin]

2-ethyl-1-hexanol/2-
Ethylhexanol 104-76-7 4.7 1.0 2.9 4.0 5.9 74 395 - - - - - 0.1 - - - - - - - -
Menthol 15356-70-4
9.6 3.6 1.0 12 12 22 140 - - - - - - - - - - - - - - 491-02-1
Ethanol 64-17-5 386 899 81 82 3009 331 624 - - - - - 380 - - - 1900 1900 - 1900 -
Tridecane 629-50-5 1.5 0.4 0.0 1.7 1.7 - - - - - - - - - - - - - - - -
Pentane 109-66-0 1.4 0.4 0.4 1.4 4.7 1400 4128 - - - - - 3000 - - 1770 - 350 - 2950 -
3-Carene 13466-78-9 1.1 0.5 0.0 1.3 1.3 1671 9305 - - - - - - - - - - - - - -
a-Pinene 80-56-8 1.1 0.3 0.0 1.2 1.2 18923 105374 - - - - - - - - - - - - - -
b-Pinene 127-91-3 0.5 0.2 0.0 0.6 0.6 11749 65424 - - - - - - - - - - - - - -
Octane 111-65-9 >0.5 0.1 0.0 0.5 0.6 1698 7929 - - - - - 2400 - - 2350 - 350 - 1410 -
Notes: • concentration (average, SD, average minimum, average medium, average maximum). • A = acute, 8 = 8-hour, C = chronic. Exposure averaging time for acute RELs is 1 hour. For 8-hour RELs, the exposure averaging time is 8 hours, which may be repeated. Chronic RELs are designed
to address continuous exposures for up to a lifetime: the exposure metric used is the annual average exposure. • a: an excess lifetime risk of 1/10000. • b: an excess lifetime risk of 1/100000. • c: an excess lifetime risk of 1/1000000. • d: an excess lifetime cancer risk of 1/10000. • e: an excess lifetime cancer risk of1/100000. • f: an excess lifetime cancer risk of 1:1000000. • NOAEL: no observed adverse effect level. • PELs: Permissible Exposure Levels. • ST: Short Term Exposure Levels. • ↑: means the average was higher than the guideline value.

3.4 Measured SVOCs
The presence of a range of SVOCs in aircraft cabin and cockpit air has been recorded
in several studies69,80,85,89,112-117. The cabin air supply in most jet aircraft is obtained by
extraction of heated and compressed bleed air from the jet engine cores, prior to mixing
with filtered recycled cabin air. Furthermore, the aircraft hydraulic reservoir vent is
connected to the cabin air ventilation system, making it possible for hydraulic oil
aerosols to enter cabin air118; they also have other sources as shown by Schuchardt et
al89. SVOCs have been suspected as the source of hazardous neurotoxic substances and
potentially responsible for some of the reported health effects in aircraft cabins and
flight decks19,80,112. Because of technical difficulties, measurements of SVOCs in
aircraft cabins have been in focus only in recent years. Nagda and Rector15 reported that
under normal operating conditions the levels of SVOCs other than tricresyl phosphates
(TCPs) (which does not have anything to do with hydraulic systems) but including
TMPP and TOCP, originating most likely from engine oil contamination of the cabin
air and TBP (tributyl phopsphate) originating from hydraulic oil, are typically below
the detection limits. This agrees with the operation of the ventilation system on aircraft.
Bleed air is used to pressurize the hydraulic fluid reservoir and fresh-water tank on
some aircraft systems. The hydraulic pressurization systems that use bleed air to
pressurize the reservoir use dual check-valves to prevent back-flow of hydraulic fluid
into the bleed air. In the rare case of a dual check-valve failure, hydraulic fluid could
enter the bleed air system. This cannot occur in the B787 because it does not use a bleed
air system. During taxi line-up, aircraft ingest exhaust from other aircraft, and TCP is
present in aircraft engine exhaust89,119.
Table 8 provides a summary of the SVOCs that were detected. They are grouped by the

measurements performed on the aircraft either in which there was a subjective
perception of smell in the cabin, and technical cabin air contamination (TCAC) flights89,
which were attributed to oil entry from leaking engine seals in individual flight phases.
Smell-events were documented in nine studies60,62,66,69-72,80,86 but the smell events could
happen not only because of SVOCs. A total of 36 SVOCs were measured, and their
concentrations were from below the Limit of Detection (LOD) to 49 μg/m3. The SVOCs
with high concentrations and high frequency of detection were naphthalene (average
concentration 1,241±166 ng/m3), tributyl phosphate (TiBP) (average concentration
495±59 ng/m3), tris (chloro-isopropyl) phosphate (TCPP) (average concentration
506±0.4 ng/m3) and trichloroethylene (TCE) (average concentration 483±36 ng/m3); it
is worth mentioning that tributyl phosphate (TiBP) was also detected on discarded cabin
air filters at 1 mg/g carbon for filters that had been used for 660 flight hours and at 2
mg/g carbon for filters that had been used for 3,937 flight hours101. TMPP was not
detected, while TOCP concentrations ranged from 0 to 22,800 ng/m3 with an average
of 50±14 ng/m3; in the study by Schuchardt et al.89, TOCP was below LOD.
Among SVOCs for which there were regulations, maximum levels of phosphate cresol
mixture and dioctyl sebacate were stipulated in AP-2540, but they were not measured in
the studies included in the present review. Generally, Table 8 also shows that the
concentration of SVOCs measured in aircraft cabins with and without events were
lower than the statutory limits for the same compounds in buildings.

Table 8 Examples of Indoor Air Guideline Values (IAGVs) for SVOCs proposed by WHO, US and in various countries.
Compounds
Chemical Abstract System
(CAS) no.
No events With events
Relevant regulations and guidelines Concentration(ng/m3) Number of Concentration(ng/m3) Number of
Avg. SD Min. Max. Study Flight Avg. SD Min. Max. Study Flight Tri-ortho-cresyl
phosphate/ Tri-o-cresyl Phosphate
(TOCP)
78-30-8 50 14 0 22800 4 163 <LOD - - - 1 177 0.1mg/m3 [skin] 111 0.1mg/m3 8h 110
Tributyl phosphate (TiBP) 126-73-8 495 59 37 9100 2 149 625 5.4 140 1990 2 194 11mg/m3 120
2.38mg/m3 8h 110 Tricresyl
phosphates (TCP)
1330-78-5 35 7.7 0.3 14900 4 90 - - - - - - 0.1 mg/m3 [skin] 111
Naphthalene 91-20-3 1241 166 0 49100 3 83 - - - - - -
9μg/m3 C 93
10μg/m3 1year 94,108
2mg/m3 120
57.8mg/m3 8h 110
85.7mg/m3 15min 110
Trichloroethylene (TCE) 79-01-6 483 36 0 20100 1 80 - - - - - -
537mg/m3 8h 111
53.7mg/m3 8h 110
134mg/m3 15min 110
Triisobutyl phosphate (TBP) 126-71-6 92 9.3 3 1610 1 69 80 0.7 7 220 2 194 50 mg/m3 120 Tris (chloroethyl)
phosphate (TCEP)
115-96-8 15 1.0 1 324 1 69 28 1.5 0 70 2 194 0.05 mg/m3 109 0.005 mg/m3 109
Tris (chloro-isopropyl)
phosphate (TCPP) 13674-84-5 506 0.4 23 9977 1 69 432 20 0 400 2 194
- Tris (1,3-dichloro-
isopropyl) 13674-87-8 7.7 0.3 1 49 1 69 10 0.5 0 10 2 194 -

phosphate (TDCPP) Triphenyl
phosphate (TPP) 115-86-6 8.7 0.3 1 119 1 69 14 1.0 11 56 2 194 3mg/m3 8h 110,111 Tris (butoxy-ethyl)
phosphate (TBEP)
78-51-3 71 4.4 0 642 1 69 249 69 29 2370 2 194 -
Diphenyl-2-ethylhexyl phosphate (DPEHP)
1241-94-7 15 0.2 0 282 1 69 20 0.7 2 155 2 194
- Tris (ethyl-hexyl)
phosphate (TEHP)
78-42-2 < LOD - 0 88 1 69 11 0.0 1 25 2 194 -
Tri-m-cresyl phosphate (T-m-CP)
563-04-2 4.4 0.3 1 428 1 69 7.5 0.4 - - 1 177 -
Tri-mmp-cresyl phosphate
(T-mmp-CP) NO 6.5 0.4 1 691 1 69 9.7 0.6 - - 1 177
- Tri-mpp-cresyl
phosphate (T-mpp-CP)
NO 4.2 0.2 1 339 1 69 6.9 0.4 - - 1 177 -
Tri-p-cresyl phosphate (T-p-CP)
563-04-2 2.1 0.1 1 57 1 69 2.9 0.2 - - 1 177 -
Trixylyl phosphate (TXP) NO < LOD - < LOD < LOD 1 69 35 0.3 - - 2 194 -
Acenaphthylene 208-96-8 0.8 0.6 2.6 3.3 2 14 - - - - - - - Acenaphthene 83-32-9 5.7 4.7 17 24 2 14 - - - - - - -
Fluorene 86-73-7 3.0 2.2 8.8 12 2 14 - - - - - - - Hexachlorobenzen
e 118-74-1 0.2 0.2 0.4 2.3 2 14 - - - - - - 0.002mg/m3 8h 110
Phenanthrene 85-01-8 4.9 3.7 13 21 2 14 - - - - - - 0.1mg/m3 NIOSH 8h 111 0.2mg/m3 OSHA 8h 111
Anthracene 120-12-7 0.3 0.2 0.8 1.1 2 14 - - - - - - 0.1mg/m3 NIOSH 8h 111 0.2mg/m3 OSHA 8h 111
Trimethylolpropane phosphate
(TMPP) 1005-93-2 0 - - - 1 10 - - - - - -
- Fluoranthene 206-44-0 0.5 0.4 0.0 1.9 2 14 - - - - - - -

Pyrene 129-00-0 2.6 1.9 3.6 15 2 14 - - - - - - 0.1mg/m3 NIOSH 8h 111 0.2mg/m3 OSHA 8h 111
Tri-n-butyl phosphate
(TnBP) NO 330 421 20 4100 1 6 - - - - - -
- Retene 483-65-8 1.4 - 0.8 2.0 1 4 - - - - - - -
cis-Permethrin 61949-76-6 0.9 - ND 0.9 1 4 - - - - - - - trans-Permethrin 61949-77-7 1.5 - 1.1 2.0 1 4 - - - - - - -
Seven other PAH compounds NO 0.9-
10.5 - - - 1 4 - - - - - - -
2,5-Diphenylbenzoqui
none 844-51-9 <2100 - NR NR 1 1 - - - - - -
-
Dioctyl phthalate 117-81-
7/68515-43-5/8031-29-6
1300 - NR NR 1 1 - - - - - -
-
Tertiary butylphenol
88-18-6/27178-34-
3 <2100 - NR NR 1 1 - - - - - -
- Trimethylpentylph
enol NO <2100 - NR NR 1 1 - - - - - - - • NR: not reported. • ND: not detected. • C=chronic. Chronic RELs are designed to address continuous exposures for up to a lifetime: the exposure metric used is the annual average exposure.

3.5 Other contaminants and O3
Table S13 in the SI lists the average concentrations of other contaminants and the ranges
of concentration measured in aircraft cabins, together with their maximum
recommended levels in regulations and guidelines. These contaminants are: CO, NO,
NO2, NOX, SO2, bacteria, fungi, mould, and PM, such as PM2.5, PM10 and Respirable
Suspended Particulates (RSP). The regulations and guidelines apply both to aircraft
cabins and buildings. Except for NO2, the average concentrations of other contaminants
were lower than the limits set by regulations and guidelines. The average NO2
concentration was 12 ppb which is higher than the recommended maximum of 11 ppb
for TWA 24 h108. Bacteria were at intermediate levels and fungi were at a low level. The
maximum measured levels of CO concentration were higher than the permissible level
for 15-min exposures.
Ozone (O3) enters aircraft cabins through the ventilation system. Commercial aircraft
typically cruise at an altitude of 18,000 to 41,000 feet (5,490 to 12,500 meters)63,121,122.
At these cruising altitudes they are in the troposphere in higher latitudes75, where O3 is
at concentrations ranging from 25 ppb to ~900 ppb75,123,124. After entering the cabin, O3
will decompose on surfaces and may also undergo reactions with other pollutants on
surfaces and in the air; the resulting concentration will therefore be lower than in the
supply air.
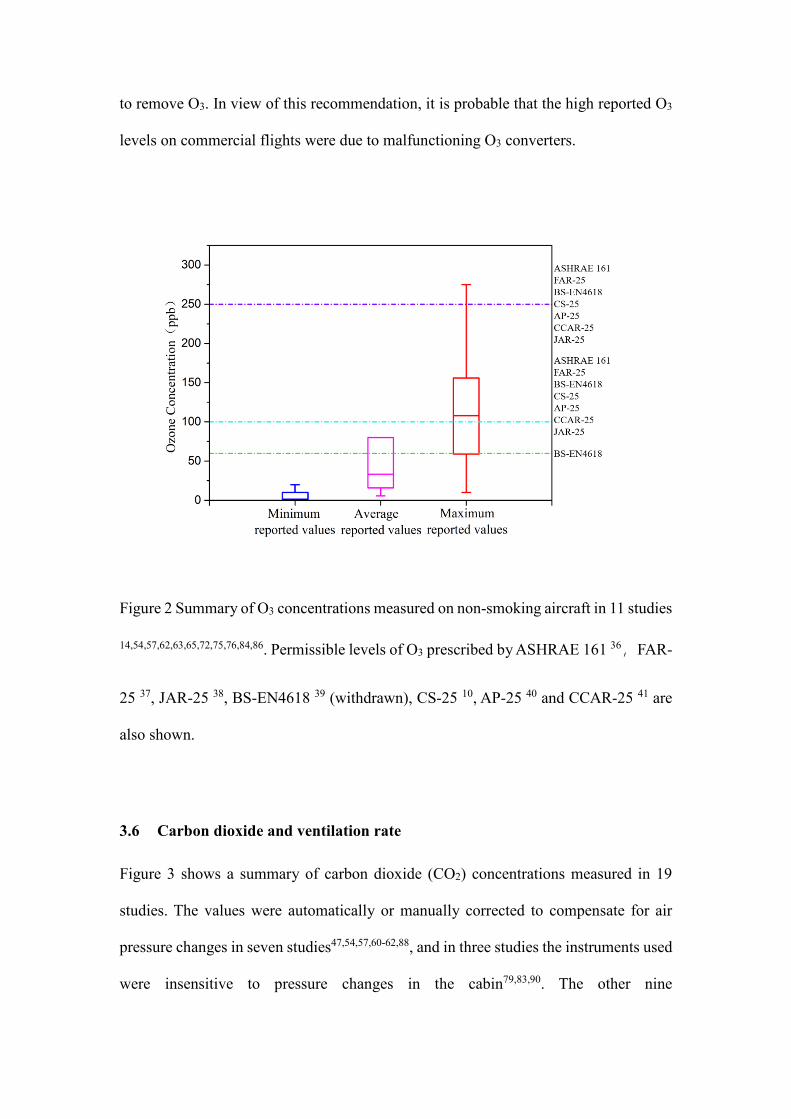
Figure 2 shows the summary of the O3 levels measured on commercial flights in 11
studies. Figure S2 in SI shows the changes with time in average O3 concentration
reported in different measuring campaigns on non-smoking flights54,63,65,72,76,86.

Reported ozone levels have been decreasing with time, as more attention has been paid
to ozone in aircraft cabins. The O3 concentrations were reported to have been corrected
to compensate for air pressure changes in three studies62,63,75; the other eight studies did
not report whether this correction had been applied14,54,57,65,72,76,84,86. As so few studies
reported that corrections had been made, we did not distinguish between the two groups
as we did in the case of measurements of CO2. The reported O3 levels were between 0
and 275 ppb. The minimum levels reported were between 0 and 20 ppb, with a median
minimum O3 concentration of 2 ppb (Figure 2). The maximum levels reported were
between 10 and 275 ppb with a median of 108 ppb (Figure 2). The average
concentration of O3 reported was 38±30 ppb (ranging from 6-80ppb), and the median
was 33 ppb (Figure 2). With few exceptions, all of the reported levels were below 250
ppb, which is the limit recommended by the documents prescribing acceptable
conditions in aircraft10,36-41, see Table 1, but 75% of the maximum reported
concentrations exceeded 100 ppb10,36-41; 87.5% of the reported maximum
concentrations and 31% of the reported average O3 concentrations exceeded 60 ppb39
(Figure 2). All mean and minimum reported levels were below 100 ppb (Figure 2).
However, average concentration exceeded the recommended levels averaged over 8
hours, which were 20 ppb108, 50 ppb125 and 50 ppb for heavy workloads110, and were
below the recommended levels in air averaged over an 8 hour working day, which were
100 ppb111, 80 ppb(acute level) 93, 200 ppb (2-hour average)110, and 100 ppb and 80 ppb
for light and moderate workloads110. The World Health Organization125 defines high
levels as 240 µg/m3, the interim target as 160 µg/m3 and the air quality guideline at 100
µg/m3 for 8 hour exposures (conversion factor to ppb is ca. 0.5). ASHRAE 161-201336
recommends that in flights on which excessive O3 levels are likely to occur, O3
concentrations should be continuously monitored and O3 converters should be operated
to remove O3. In view of this recommendation, it is probable that the high reported O3
levels on commercial flights were due to malfunctioning O3 converters.
Figure 2 Summary of O3 concentrations measured on non-smoking aircraft in 11 studies
14,54,57,62,63,65,72,75,76,84,86. Permissible levels of O3 prescribed by ASHRAE 161 36,FAR-
25 37, JAR-25 38, BS-EN4618 39 (withdrawn), CS-25 10, AP-25 40 and CCAR-25 41 are
also shown.
3.6 Carbon dioxide and ventilation rate
Figure 3 shows a summary of carbon dioxide (CO2) concentrations measured in 19
studies. The values were automatically or manually corrected to compensate for air
pressure changes in seven studies47,54,57,60-62,88, and in three studies the instruments used
were insensitive to pressure changes in the cabin79,83,90. The other nine

studies14,52,55,56,59,72-74,86 did not report whether the reported CO2 concentrations had
been compensated for changes in air pressure. The results are consequently divided into
two groups: studies that corrected CO2 measurements for changes in pressure and
studies that did not state whether this correction was applied. For the former, the
minimum measured CO2 concentrations were in the range 410-874 ppm, maximum
measured CO2 concentrations were in the range 1,485-3,374 ppm, while average CO2
concentration was 1,315±232 ppm (the median was 1,387 ppm). For the latter, the
minimum measured CO2 concentrations were in the range 293-1,100 ppm, the
maximum measured CO2 concentrations were in the range between 1,190-5,177 ppm,
while the average CO2 concentration was 1,320±302 ppm (the median was 1,404 ppm).
It can be seen that there were only marginal differences in the measured CO2 between
the two groups of studies. The lowest values of minimum measured CO2 concentrations
were lower than the CO2 concentration in outdoor air, which currently ranges from 365
ppm to 390 ppm126-129, which may suggest some measurement error.
Compared with the aircraft airworthiness standard (Table 1), all measured CO2
concentrations, except for one event, were lower than 5,000 ppm10,37,39-41. All average
and minimum CO2 concentrations measured were lower than 2,000 ppm10,37,39-41,
although 87% of average CO2 concentrations were higher than 1,000 ppm, which is
generally considered as a target for achieving acceptable air quality in occupied
buildings130.
CO2 is a product of human metabolism and thus indicates the rate of emission of
bioeffluents from passengers and cabin crew in aircraft. It is always present in spaces
where humans are present. This applies to most commercial buildings and to passenger
transport vehicles, including aircraft129. The concentration of CO2 depends on three
factors: number of people, outdoor/ambient air supply rate per person, and ventilation
efficiency, i.e., how well the air is mixed within a volume/space88 CO2 is an index of
ventilation when people are present and can be used to verify whether the recommended
rates of outdoor air are being delivered into an aircraft cabin; in this context it is also
considered to be a marker of indoor air quality. One study showed that CO2
concentration was significantly and inversely correlated with ventilation rate (r=-0.96,
P< 0.05) for the same aircraft (Airbus 319)74 and this was also the case in another study
that used data from different aircraft (B777, A330, B787, A320, B737, A320) (r=-0.93,
P< 0.05)90. The potential effects of CO2 on humans are summarized by Fisk et al.131 and
Du et al.132.
The reported outdoor air supply rates ranged from 1.7 to 39.5 L/s per person with the
average and median at 6.0±0.8 L/s/p and 5.8 L/s/p, respectively47,59,62,72,74,79,83,88,90. All
of the reported average values exceeded the minimum recommended outdoor air supply
rate of 3.5 L/s/p36,37,41, and 97% met the design requirements of 4.7 L/s/p set by10,38; 96%
of the reported values met the outdoor air supply rate of 5 L/s/p recommended by the
ASHRAE handbook44. One study reported the total air change rate per hour (ACH)52
that ranged from 17.7 to 27.5 h-1 with an average of 22.6±4.1h-1; this was compatible
with the air change rates calculated using outdoor air supply rates52,56,73.

Figure 3 Summary of CO2 concentrations measured on aircraft in 19 studies14,47,52,54-
57,59-62,72-74,79,83,86,88,90. The CO2 limits prescribed by BS-EN461839, FAR-2537, CS-2510,
AP-2540, CCAR-2541 and ASHRAE handbook44 are also shown.
3.7 Temperature and relative humidity in aircraft
Figure 4 shows a summary of the temperatures measured in 14 studies. The minimum
measured temperatures were in the range from 17.4oC to 24.6oC. The maximum
temperatures were in the range from 25.4oC to 31.0oC. The average and Standard
Deviation (SD) of the measured temperatures were 23.5±0.8℃; the median was 24.0°C.
The figure shows additionally that average temperatures were almost within the range
recommended by ASHRAE 16136 and the ASHRAE handbook44. The results presented
in Figure 4 are from all flight phases and it is impossible to separate the measurements
reported in different studies based on the flight phase; it is probable that maximum

reported temperatures were measured on the ground with doors open.
Figure 4 Summary of temperature levels measured on aircraft in 14 studies6,47,52,54-57,59-
62,72,73,86. The ranges recommended by ASHRAE 16136 and ASHRAE handbook44 are
also shown.
Figure 5 shows a summary of the relative humidity (RH) levels measured in 17 studies.
The minimum measured RH levels were in the range from 0.9% to 15%, the lowest
levels representing most likely flights with very few passengers. The maximum
measured RH levels were in the range from 13% to 77%. The average and SD of the
measured RH values were 16%±5%; the median was 17%. As in the case of temperature,
the results presented in Figure 5 are from all flight phases and it is impossible to separate
the measurements reported in different studies according to the flight phase, but it is
probable that the maximum levels reported were measured on the ground with doors
open and the minimum levels were measured at cruising altitude. The main sources of
humidity in an aircraft cabin are exhaled air and perspiration from the occupants.
ASHRAE 16136 does not mandate lower and upper humidity requirements. In buildings,
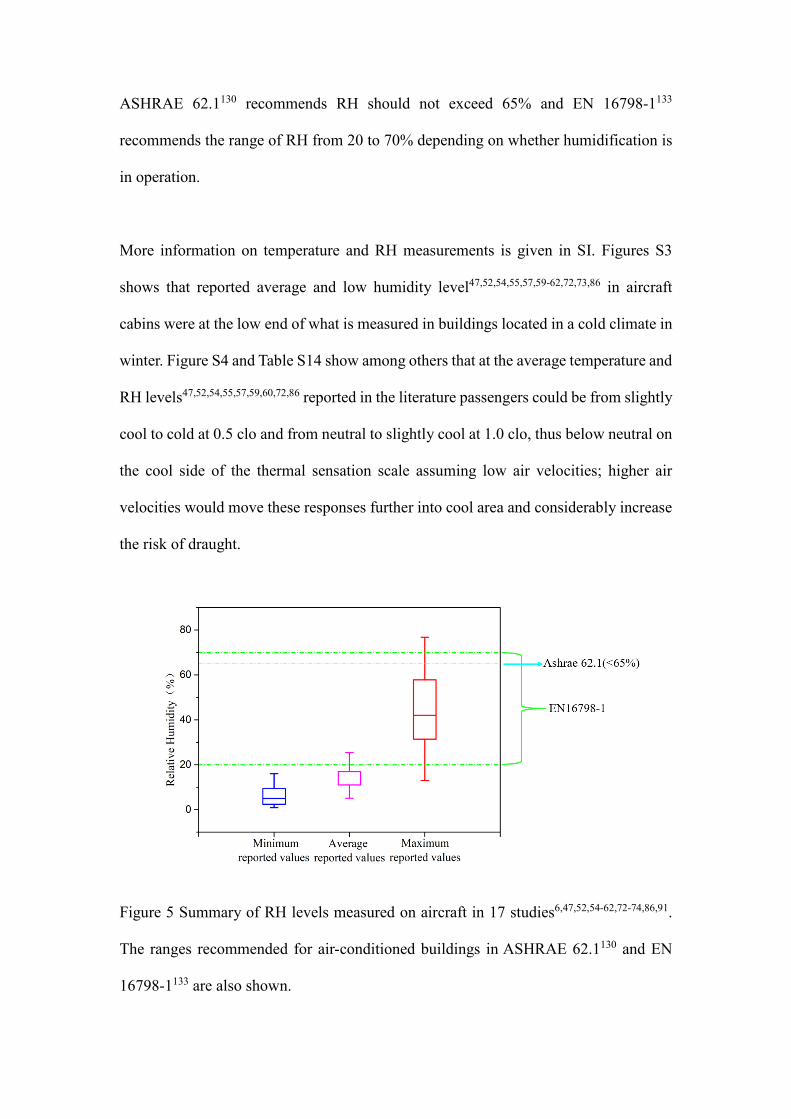
ASHRAE 62.1130 recommends RH should not exceed 65% and EN 16798-1133
recommends the range of RH from 20 to 70% depending on whether humidification is
in operation.
More information on temperature and RH measurements is given in SI. Figures S3
shows that reported average and low humidity level47,52,54,55,57,59-62,72,73,86 in aircraft
cabins were at the low end of what is measured in buildings located in a cold climate in
winter. Figure S4 and Table S14 show among others that at the average temperature and
RH levels47,52,54,55,57,59,60,72,86 reported in the literature passengers could be from slightly
cool to cold at 0.5 clo and from neutral to slightly cool at 1.0 clo, thus below neutral on
the cool side of the thermal sensation scale assuming low air velocities; higher air
velocities would move these responses further into cool area and considerably increase
the risk of draught.
Figure 5 Summary of RH levels measured on aircraft in 17 studies6,47,52,54-62,72-74,86,91.
The ranges recommended for air-conditioned buildings in ASHRAE 62.1130 and EN
16798-1133 are also shown.
3.8 Limitations and general comments
This review summarizes the measurements performed on 2,251 flights. The number of
flights is considered to be sufficient for it to be possible to draw reasonable conclusions
regarding the air quality conditions on commercial aircraft even though the
measurements were made on more than 40 types of aircraft. There was a need for a
thorough and data-rich review of cabin air quality to enable broader generalization of
the results and definitive conclusions15. This work responds to this need.
The VOC and SVOC concentrations we summarize were measured on the non-smoking
flights that are typical today. We focused mainly on active sampling and we did not take
into account whether it was stated whether an adjustment for cabin pressure had been
applied. Applied measuring techniques and QA/QC analysis are presented in detail in
Table 9; Table S1 provides information for all types of measurements reported in the
present review.
The selection of sampling and analytical methods for VOCs for 256,14,47,53,57,59-62,66,69-
72,75-78,81-86,89 out of 27 studies6,14,47,53-55,57,59-62,66,69-72,75-78,81-86,89 was consistent with the
recommendations of American Society of Testing Materials (ASTM) D6399134 among
all studies (smoking and non-smoking flights). VOCs sampling and analytical methods
for 216,14,57,60,62,66,69-72,75-78,81-86,89 out of 22 studies 6,14,54,57,60,62,66,69-72,75-78,81-86,89 on the
non-smoking flights was consistent with the recommendations of ASTM D6399134. One
study54 was consistent with the recommendations of NIOSH Method (VOCs)135 and the
Environmental Protection Agency (EPA) method TO11-A136 (formaldehyde and

acrolein). ASTM guidance was not available at the time reported by Nagda and Rector15.
Fifteen studies6,57,60,62,66,70-72,76-78,81,82,84,85 employed field blanks to characterize any
contamination of samples during physical handling and eleven studies57,60,69-72,75-78,84
used duplicates to characterize precision among 22 studies on the non-smoking flights;
only one study60 reported the quality control results.
The selection of sampling and analytical methods for SVOCs in four6,14,86,89 out of
twelve studies6,14,60,62,66,69-72,80,86,89 was consistent with the ASTM D6399 method for all
studies (smoking and non-smoking flights). SVOCs sampling and analytical methods
for four6,14,86,89 out of eleven studies6,14,60,62,66,69-72,86,89 on the non-smoking flights was
consistent with the recommendations of ASTM D6399134. One studies60 was consistent
with the recommendations of EPA Standard Method TO-11A136. Two studies70,71 was
consistent with the recommendations of ISO 16000-6137 and BS EN ISO 16017-1138.
Four studies62,66,69,72 was not reported which standard they reference. Seven
studies6,60,62,66,70-72employed field blanks to characterize any contamination of samples
during physical handling and five studies60,69-72 used duplicates to characterize
precision among eleven studies on the non-smoking flights. Only one study60 reported
the quality control results.

Table 9 Description of measuring techniques and QA/QC analysis for VOCs and
SVOCs.
Study Parameter* VOCs SVOCs
Dechow et al.53
MT
Aldehydes and ketones: TX/(GCMS/AED)/DNPH/(HPLC/UVD); VOCs:
AC/SE/GC/FID; TX/SE/GC/ECD; TX/SE/GC/MS; TX/TD/GC/MS
QA/QC A (VOCs and aldehydes)
C
ASHRAE54
MT VOCs: NIOSH Method, CL, TX/GC/FID; Formaldehyde, acrolein: EPA method TO11-A, DNPH/HPLC
QA/QC B (VOCs and aldehydes)
C NR
Lee et al.55
MT FID by Total Hydrocarbon Analyzer
QA/QC ASTM, ACGIH, APHA, NIOSH, D
C
Fox 6
MT Aldehydes and ketones: DNPH/HPLC; VOCs: EC/GC/MS PUF/XAD/ GC/MS
FC MM
QA/QC A, B A, B
C
Dumyahn et al.57
MT EC/GC/MS
QA/QC A, B, D
C
Wieslander et al.59
MT VOCs: TX/GCMS; Formaldehyde: DNPH/HPLC;
QA/QC A
C
Nagda et al.60
MT Aldehydes and Ketones: EPA Standard Method TO-11A, DNPH/HPLC; VOCs: EPA Standard Method TO-
14A, EC/GCMS
EPA Standard Method TO-11A, PUF/XAD/HPLC
QA/QC A, B, D (VOCs and aldehydes) B, D
C M M
Lindgren and Norbäck47
MT Formaldehyde: glass fiber filters impregnated with DNPH, the diffusive samplers/GCMS
QA/QC A
C
Waters et al.61
MT
VOCs: NIOSH Manual of Analytical Methods,TD/GCMS; Aldehydes: NIOSH Manual of Analytical Methods,
CPP/GC/FID/MS; Ethanol: NMAM 1400, CL/GC-FID; Aliphatic hydrocarbons: NMAM 1500, CL/GC-FID; Aromatic hydrocarbons: NMAM 1501, CL/GC-FID
QA/QC A
C
Spicer et al.62
MT Passive Sampling; EC (cruise and bleed)/GCMS A time-integrated
adsorbent sample/XAD/GCMS
FC MM MM
QA/QC A, B B
C M M, PC
Muir et al.66 MT TD/GCMS; SPME/GCMS; PID (fume event) TD/GCMS;
SPME/GCMS; PID (fume event)

QA/QC A, B B
C
Solbu et al.69
MT TX/TD/GC-EI-MS Gass adsorbent tube/GC-EI-MS
QA/QC A, D D
C
Crump et al.70
MT TVOCs: PID; VOCs: ISO 16000-6 and BS EN ISO 16017-1, Sorbent tube/TD/GC/MS
ISO 16000-6 and BS EN ISO 16017-1
Sorbent tube/TD/GC/MS
QA/QC A, B, D B, D
C
Crump et al.71
MT TVOCs: PID; VOCs: ISO 16000-6 and BS EN ISO 16017-1 Sorbent tube/TD/GC/MS
ISO 16000-6 and BS EN ISO 16017-1
Sorbent tube samples/TD/GC/MS
QA/QC A, B, D B, D
C
Spengler et al.72
MT VOCs: airlines A: EC/GCMS; airlines B and C: USEPA Compendium Method TO-17, TD/GCM; Aldehyde and
ketone: airlines A, B and C: DNPH/HPLC
TCP: Whatman QMA 37 mm quartz
filters/SE/GCMS; SVOCs: SKC model
226-143 glass sorbent
tubes/XAD/SE/GCMS QA/QC A, B, D B, D
C
Weisel et al.75 MT TX/GC/MS
QA/QC A, D C C
Ji and Zhao76
MT TX/TD/GC/MS
QA/QC A, B, D
C PC
Guan et al.77
MT TX/TD/GC/MS
QA/QC A, B, D
C
Guan et al.78
MT TX/TD/GC/MS
QA/QC A, B, D
C
Ree et al.80
MT Wipe samples/GCMS
QA/QC
C
Wang et al.81 MT EPA, TX/TD/GCMS
QA/QC A, B C M
Wang et al.82
MT EPA, TX/TD/GCMS
QA/QC A, B
C M
Guan et al.83
MT TVOCs: a ppbRAE 3000-PID
QA/QC A
C NSP

Gao et al.84 MT TX/TD/GC/MS
QA/QC A, B, D C C
Rosenberger et al.85
MT Aldehydes: DNPH/HPLC-UV
FC MM
QA/QC A, B
C
Schuchardt et al.86
MT Aldehydes: DIN ISO 16000-3, DNPH/HPLC/UV; VOCs: DIN ISO 16000-6-TX/MS/FID
ISO 16000-31/2014 Indoor air - Part 31,
PUR/SE/GCMS QA/QC A A
C C C
Rosenberger14
MT VOCs: TX/TD/GCMS; Aldehydes: DNPH/HPLC/UV/VIS; TVOCs: PID PUR/GCMS
QA/QC A, ISO 16000 series, D A, ISO 16000 series
C
Schuchardt et al.89
MT VOCs: ISO 16000-3/2011 Indoor air – Part 6,
TX/TD/GC/MS or MS-FID. Aldehydes: ISO 16000-3/2011 Indoor air – Part 3, DNPH/HPLC/UV
TCP:ISO 16000-31, 2014-Part 31,
PUR/SE/GC/MS FC MM
QA/QC A, ISO 16000-6: 2011 A, ISO 16000-6: 2011
C * MT-measuring technique (AC, activated carbon sorbent; CL, a charcoal sorbent tube; DNPH, 2,4-
dinitrophenylhydrazine-coated sorbent; EC, evacuated canister; ECD, electron capture detector; FID, flame ionization
detector; GC, gas chromatography; HPLC, high performance liquid chromatography; AED, atomic-emission detector;
UVD, UV-detector; MM, mass flowmeter; MS, mass spectrometry; PID, photoionization detector; EI, electron ionization;
IC, Ion Chromatograph; CPP, coated porous polymer; PUF, polyurethane foam sorbent; SE, solvent elution; TD, thermal
desorption; TX: Tenex sorbent; SPMF, Solid Phase Microextract Fibres; OPC, optical particle counter; CPC, condensed
particle counter; NDIR, Non-dispersive infrared spectrometry; PCR, Polymerase chain reaction technology).
FC-Flow control.
QA/QC-quality assurance/quality control (A, consistent with recommendations of ASTM D6399; B, field blanks; D,
duplicate samples).
C-Calibration (M, multipoint calibration; NRC, no pressure calibration; PC, pressure calibration; CSG, calibrated by
standard gases; NSP, not sensitive to pressure).
NR - not reported.
Most measurements of VOCs and SVOCs were performed only once using integrating
samplers and the sensors and samplers were positioned in only one location in the cabin.
In order to obtain more accurate data, the number of samples should be increased in
space and time in future research and a method for real-time monitoring data instead of
intermittent sampling should be used.
The quality of the measured data included in the present review can be discussed. With
respect to the measurements of temperature and RH the studies included in the present
review included only partial details of the measurement technique, range, resolution,
accuracy and whether the instruments were calibrated or not. In general, it was reported
that the measuring instruments had good accuracy for temperature
measurements54,60,62,72-74 and for RH measurements54,60,62,72,73.
With respect to CO2 measurements some studies failed to include information on
whether a correction for cabin pressure at altitude had been applied. The studies in
which no correction for pressure was mentioned used a variety of measuring
instruments with an accuracy of about ±3%72, ±100 ppm CO2 below 10,000 ppm and
above 100 ppm or ±3% at concentrations below 100ppm73. The studies in which
correction of CO2 was reported also used a variety of measuring instruments. ASHRAE
and CSS 54 and Spicer et al. 62 reported measurements using instruments with an
accuracy of ±5%. Cao et al. 88 reported that their CO2 sensor could provide better
accuracy for the lower levels more likely to be encountered in aircraft cabins and in
their study, 98% of measured CO2 concentrations were within this range.
We analysed measured O3 data only on non-smoking flights. We did not consider the

influence of aircraft pressure and altitude on measured concentration as there were very
few data. The accuracy of the instruments was greater than 1.0 ppb or 2%72,75 or greater
than 1.5 ppb or 2%62,65 although some had an accuracy of ±0.1 ppm54.
The present results can be used for different purposes, e.g., to benchmark the air quality
levels in aircraft cabins or to select the target compounds that can be considered as
markers of air quality and could constitute an air quality metric. This would however
require studies with humans that observed their different responses to changing levels
of the selected target pollutants. It would be useful to examine whether there is a
relationship between measured concentrations of VOCs and carbon dioxide (CO2) using
the data provided by the literature review. However, the information provided in the
reviewed papers was not sufficient to perform such a correlation.
4. Conclusions
We reviewed the literature to identify the airborne pollutants present on commercial
aircraft and the regulations regarding air quality on aircrafts. The measurements
reported by forty-seven studies on 2,251 flights showed that the majority of measured
compounds were alcohols followed by aldehydes, alkanes, terpenes, aromatics and
ketones. Among the most prevalent compounds reported were toluene, ethylbenzene,
benzene, formaldehyde, acetaldehyde, limonene, nonanal, hexanal, decanal, octanal,
acetic acid, acetone, ethanol, butanal, acrolein, isoprene and menthol. Measured VOCs
were within the permissible limits where they exist, except for benzene. SVOCs were
below the limits prescribed for any indoor environment. Average O3 concentrations
were below air quality guidelines for aircraft cabins but exceeded air quality guidelines

for residential buildings or workplaces. Average CO2 and outdoor air supply rates were
within recommended levels. Average temperature was within the limits recommended
for thermal comfort while RH values were at the low end of what occurs even in
buildings located in cold climates in winter. The present results provide a benchmark
reference for airborne pollutants on aircraft in the development of advanced solutions
for improving cabin air quality. The present work should continue by relating the
measured levels to the responses of crew members and passengers to provide further
evidence of the need to improve the control of aircraft cabin air quality and to identify
the pollutant levels that should be regulated, as well as smell events and proper risk
assessment thereof. The impact of other factors such as the low RH should be
considered as well.
Acknowledgements
This work received funding from the Clean Sky 2 Joint Undertaking under the European
Union’s Horizon 2020 research and innovation programme under grant agreement No.
820872-ComAir-H2020-CS2-CFP07-2017-02. The grant supported the ComAir
project with the title “Investigation of cabin ventilation strategies impact on aircraft
cabin air quality and passengers’ comfort and well-being through subject study in
realistic aircraft environment”. The work was also supported by the CognitAir project
with the title “CO2 and VOCs requirements for aircraft cabins / occupied spaces based
on cognitive performance, comfort responses and physiological changes depending on
pressure level”. CognitAir was financially supported by Honeywell, Airbus, Pall,
Embraer and Liebherr and was co-funded by ASHRAE. We thank Prof. David P. Wyon
for his constructive comments and revisions and Dr. J. Enrique Cometto-Muñiz for his

advice on odour thresholds. The authors declare no conflict of interest and are
responsible for the content of this publication.
References
1. Mazareanu E. Air transportation - Statistics & Facts. 2020. https://www.statista.com/topics/1707/air-transportation/.pdf Accessed Mar 4, 2020. 2. Mazareanu E. Global air traffic - scheduled passengers 2004-2020. 2020. https://www.statista.com/statistics/564717/airline-industry-passenger-traffic-globally/.pdf Accessed Jun 10, 2020. 3. Mazareanu E. Commercial airlines worldwide - fuel consumption 2005-2020. 2020. https://www.statista.com/statistics/655057/fuel-consumption-of-airlines-worldwide/.pdf Accessed Jun 10, 2020. 4. Rosero JA, Ortega JA, Aldabas E, Romeral L. Moving Towards a More Electric Aircraft. IEEE A&E Systems Magazine 2007: 3-9. 5. Aviation. How much air is recirculated (vs. bleed air injected) in modern airliners cabin? 2017. https://aviation.stackexchange.com/questions/43702/how-much-air-is-recirculated-vs-bleed-air-injected-in-modern-airliners-cabin.pdf Accessed 2017. 6. Fox RB. Air quality and comfort measurement aboard a commuter aircraft and solutions to improve perceived occupant comfort levels. In: Nagda, N.L. (ed.) Air Quality and Comfort in Airliner Cabins: ASTM STP 1393. West Conshohocken, PA, American Society for Testing and Materials 2000: 161–186. 7. NRCC. The Airliner Cabin Environment and the Health of Passengers and Crew. Washington (DC): National Academies Press (US); 2002. 344 p. 8. EASA. Certification Specifications and Acceptable Means of Compliance for Large Aeroplanes. 2003. 9. Zavaglio E, Le Cam M, Thibaud C, Quartarone G, Zhu Y, Franzini G, Roux PD, Dinca M, Walte A, Rothe P, (2019) Innovative Environmental Control System for Aircraft, 49th International Conference on Environmental Systems, 7-11 July 2019, Boston, Massachusetts. 10. EASA. CS-25 Certification Specifications and Acceptable Means of Compliance for Large Aeroplanes, Amendment 23. 2019. 11. Newman WH, Viele MR. Engine bleed air reduction in DC-10. 1980. 12. Liu W, Mazumdar S, Zhang Z, Poussou SB, Liu J, Lin C-H, Chen Q. State-of-the-art methods for studying air distributions in commercial airliner cabins. Building and Environment 2012; 47: 5-12. 13. Crump D. Air quality in aircraft: A continuing debate. Indoor and Built Environment 2016; 25: 725-727. 14. Rosenberger W. Effect of charcoal equipped HEPA filters on cabin air quality in aircraft. A case study including smell event related in-flight measurements. Building and Environment 2018; 143: 358-365. 15. Nagda NL, Rector HE. A critical review of reported air concentrations of organic compounds in aircraft cabins. Indoor Air 2003; 13: 292–301. 16. Lindgren T, Norbäck D. Health and perception of cabin air quality among Swedish commercial airline crew. Indoor Air 2005; 15. 17. Ahmadpour N, Lindgaard G, Robert J-M, Pownall B. The thematic structure of passenger comfort experience and its relationship to the context features in the aircraft cabin. Ergonomics 2014; 57: 801-815. 18. Harshada P, Mirabelle DC. Passenger-centric factors influencing the experience of aircraft comfort. Transport Reviews 2017; 38: 252-269. 19. Wolkoff P, Crump DR, Harrison PTC. Pollutant exposures and health symptoms in aircrew and office workers: Is there a link? Environment International 2016; 87: 74-84. 20. McNeely E, Gale S, Tager I, Kincl L, Bradley J, Coull B, Hecker S. The self-reported health of U.S. flight attendants compared to the general population. Environ Health 2014; 13: 13. 21. Griffiths RF, Powell DM. The occupational health and safety of flight attendants. Aviat Space Environ Med 2012; 83: 514-521. 22. Nagda NL, Rector HE, Li Z, Space DR. Aircraft Cabin Air Quality A Critical Review of Past Monitoring Studies. ASTM Spec. Tech. Publ. 2000. 23. Space DR, Johnson RA, Rankin WL, Nagda NL. The airplane cabin environment: Past, present and future research. ASTM Spec. Tech. Publ. 2000. 24. Lindgren T. Cabin Air Quality in Commercial Aircraft: Exposure, Symptoms and Signs.

Comprehensive Summaries of Uppsala Dissertations from the Faculty of Medicine 1262. 2003. 25. FAA. 14 CFR 25,“Code of Federal Regulations,” Airworthiness Standards, Title 14, §25, Washington, DC. 1998. 26. ANSI/ASHRAE. ANSI/ASHRAE Standard 62, Ventilation for Acceptable Indoor Air Quality. Atlanta, GA. 1989. 27. Wolkoff P, Nielsen GD. Organic compounds in indoor air-their relevance for perceived indoor air quality? Atmospheric Environment 2001. 28. Norrefeldt V, Mayer F, Herbig B, Ströhlein R, Wargocki P, Fang L. Effect of Increased Cabin Recirculation Airflow Fraction on Relative Humidity, CO2 and TVOC. Aerospace 2021; 8. 29. Jones B, Amiri SN, Roth JW, Hosni M, (2016) The Nature of Particulates in Aircraft Bleed Air Resulting from Oil Contamination. 30. Weisel CP, Fiedler N, Weschler CJ, Ohman-Strickland PA, Mohan KR, McNeil K, Space DR. Human symptom responses to bioeffluents, short-chain carbonyls/acids, and long-chain carbonyls in a simulated aircraft cabin environment. Indoor Air 2017; 27: 1154-1167. 31. Solbu K, Daae HL, Thorud S, Ellingsen DG, Lundanes E, Molander P. Exposure to airborne organophosphates originating from hydraulic and turbine oils among aviation technicians and loaders. J Environ Monit 2010; 12: 2259-2268. 32. van Netten C. Air Quality and Health Effects Associated with the Operation of BAe 146-200 Aircraft. Applied Occupational and Environmental Hygiene 1998; 13: 733-739. 33. van Netten C. Design of a small personal air monitor and its application in aircraft. Sci Total Environ 2009; 407: 1206-1210. 34. Abraham MH, Sanchez-Moreno R, Cometto-Muniz JE, Cain WS. An algorithm for 353 odor detection thresholds in humans. Chem Senses 2012; 37: 207-218. 35. Nagata Y, Takeuchi N. Measurement of Odor Threshold by Triangle Odor Bag Method. Odor Measure Rev. 2003: 118-127. 36. ASHRAE. ANSI/ASHRAE Standard 161-2013, Air Quality within Commercial Aircraft, Atlanta. 2013. 37. FAA. Federal Aviation Regulations (FAR) Part 25 Airworthiness standards: Transport category airplanes, Washington. 2019. 38. JAA. Joint Airworthiness Requirements (Change 15) Part 25 Large Aeroplanes, Cheltenham: Civil Aviation Authority. 2007. 39. ASD-STAN. prEN 4618: 2013 Aerospace series-aircraft internal air quality standards: criteria and determination methods,Brussels: ASD-STAN. 2013. 40. IAC. Aviation Regulations (AP) Part 25 Airworthiness standards for Transport category Airplanes (in Russia). 2005. 41. CCAC. Chinese civil aviation regulations Part 25 airworthiness standards for transport aircraft, Order of CAAC no. 19 of 2016. 2016. 42. Wanner H-U, Verhoeff A, Colombi A, Flannigan B, Gravesen S, Mouileseaux A, Nevalainen A, Papadakis J, Seide K. Biological particles in Indoor Environments. European Collaborative Action, Indoor air quality and its impact on man. Commission of the European Communities, Luxembourg, 1993. 43. EU, BIA. ‘Guidelines workplace, Germany' according EU frame-guidelines 89/391; BIA’s report 2/95 'Indoor Air Quality’, Germany. 44. ASHRAE. ASHRAE Handbook HVAC Applications. 2019. 45. Park MY. These Are the Healthiest Planes in the Sky. 2018. https://thepointsguy.com/news/the-healthiest-planes-in-the-air-today/ Accessed May 7, 2018. 46. Reed T. Twenty-five Years Ago, U.S. Airlines Banned Smoking On Domestic Flights. Aerospace and Defense 2015. 47. Lindgren T, Norbäck D. Cabin air quality indoor pollutants and climate during intercontinental flights with and without tobacco smoking. Indoor Air 2002; 12: 263-272. 48. Brabets RI, Hersh CK, Klein MJ. Ozone measurement survey in commercial jet aircraft. Journal of Aircraft 1967; 4: 59-64. 49. Bischof W. Ozone measurements in jet airliner cabin air. Water, Air, and Soil Pollution 1973; 2: 3-14. 50. Perkins PJ, Holdeman JD, Nastrom GD. Simultaneous Cabin and Ambient Ozone Measurements on Two Boeing 747 Airplanes. 1979. 51. Rogers JW. Results of FAA cabin ozone monitoring program in commercial aircraft in 1978 and 1979. 1980. 52. Nagda NL, Koontz MD, Konheim AG, Hammond SK. Measurement of cabin air quality aboard commercial airliner. Atmospheric Environment 1992; 26: 2203-2210. 53. Dechow M, Sohn H, Steinhanses J. Concentrations of selected contaminants in cabin air of airbus aircrafts. Chemosphere 1997; 35: 21-31.

54. ASHRAE, CSS. Relate Air Quality and Other Factors to Symptoms Reported by Passengers and Crew on Commercial Transport Category Aircraft. 1999. 55. Lee S-C, Poon C-S, Li X-D, Luk F. Indoor Air Quality Investigation on Commercial Aircraft. Indoor Air 1999; 9: 180-187. 56. Haghighat F, Allard F, Megri AC, Blondeau P, Shimotakahara R. Measurement of thermal comfort and indoor air quality aboard 43 flights on commercial airlines. Indoor and Built and Environment 1999; 8: 58-66. 57. Dumyahn TS, Spengler JD, Burge HA, Muilenburg M. Comparison of the environments of transporation vehicles: results of two surveys. In: Nagda, N.L. (ed.) Air Quality and Comfort in Airliner Cabins: ASTM STP 1393. West Conshohocken, PA, American Society for Testing and Materials 2000: 3–23. 58. Ree dH, Bagshaw M, Simons R, Brown RA. Ozone and relative humidity in airline cabins on polar routes measurements and physical symptoms. ASTM Spec. Tech. Publ. 2000. 59. Wieslander G, Lindgren T, Norback D, Venge P. Changes in the ocular and nasal signs and symptoms of aircrews in relation to the ban on smoking on intercontinental flights. Scand J Work Environ Health 2000; 26: 514-522. 60. Nagda NL, Rector HE, Li Z, Hunt EH. Determine Aircraft Supply Air Contaminants in the Engine Bleed Air Supply System on Commercial Aircraft. 1791 Tullie Circle, NE, Atlanta, GA 30329-2305; 2001. 61. Waters MA, Bloom TF, Grajewski B, Deddens J. Measurements of indoor air quality on commercial transport aircraft. Proceedings: Indoor Air 2002 2002. 62. Spicer CW, Murphy MJ, Holdren MW, Myers JD, MacGregor IC, Holloman C, James RR, Tucker K, Zaborski R. Relate Air Quality and Other Factors to Comfort and Health Symptoms Reported by Passengers and Crew on Commercial Transport Aircraft (Part I) (ASHRAE Project 1262-TRP). 2004. 63. Spengler JD, Ludwig S, Weker RA. Ozone exposures during trans-continental and trans-pacific flights. Indoor Air 2004; 14: 67–73. 64. Duc ML, Stuecker T, Venkateswaran K. Molecular bacterial diversity and bioburden of commercial airliner cabin air. Canadian Journal of Microbiology 2007; 53: 1259-1271. 65. Bhangar S, Cowlin SC, Singer BC, Sextro RG, Nazaroff WW. Ozone levels in passenger cabins of commercial aircraft on North American and transoceanic. Environmental Science & Technology 2008; 42: 3938-3943. 66. Muir H, Walton C, Mckeown R. Cabin Air Sampling Study Functionality Test. Cranfield University School of Engineering 2008. 67. McKernan LT, Wallingford KM, Hein MJ, Burge H, Rogers CA, Herrick R. Monitoring microbial populations on wide-body commercial passenger aircraft. Annals of Occupational Hygiene 2008; 52: 139-149. 68. Osman S, Duc ML, Dekas A, Newcombe D, Venkateswaran K. Microbial burden and diversity of commercial airline cabin air during short and long durations of travel. The ISME Journal 2008; 2: 482-497. 69. Solbu K, Daae HL, Olsen R, Thorud S, Ellingsen DG, Lindgren T, Bakke B, Lundanes E, Molander P. Organophosphates in aircraft cabin and cockpit air-method development and measurements of contaminants. Journal of Environmental Monitoring 2011; 13: 1393-1403. 70. Crump D, Harrison P, Walton C. Aircraft Cabin Air Sampling Study; Part 1 of the Final Report. Institute of Environment and Health report 2011. 71. Crump D, Harrison P, Walton C. Aircraft Cabin Air Sampling Study; Part 2 of the Final Report. Institute of Environment and Health report 2011. 72. Spengler JD, Vallarino J, McNeely E, Estephan H. In-Flight/Onboard Monitoring: ACER’s Component for ASHRAE 1262, Part 2. Final Report, 2005-2010. 2012. 73. Gładyszewska-Fiedoruk K. Indoor air quality in the cabin of an airliner. Journal of Air Transport Management 2012; 20: 0-30. 74. Giaconia C, Orioli A, Gangi AD. Air quality and relative humidity in commercial aircrafts: An experimental investigation on short-haul domestic flights. Building and Environment 2013; 67: 69-81. 75. Weisel C, Weschler CJ, Mohan K, Vallarino J, Spengler JD. Ozone and Ozone Byproducts in the Cabins of Commercial Aircraft. Environmental Science & Technology 2013; 47: 4711-4717. 76. Ji W, Zhao B. Estimation of the contribution of secondary organic aerosol to PM2.0 concentration in aircraft cabins. Building and Environment 2014; 82: 267-273. 77. Guan J, Gao K, Wang C, Yang X, Lin C-H, Lu C, Gao P. Measurements of volatile organic compounds in aircraft cabins. Part I: Methodology and detected VOC species in 107 commercial flights. Building and Environment 2014; 72: 154-161. 78. Guan J, Wang C, Gao K, Yang X, Lin C-H, Lu C. Measurements of volatile organic compounds in
aircraft cabins. Part II: Target list, concentration levels and possible influencing factors. Building and Environment 2014; 75: 170-175. 79. Li Z, Guan J, Yang X, Lin C-H. Source apportionment of airborne particles in commercial aircraft cabin environment: Contributions from outside and inside of cabin. Atmospheric Environment 2014; 89: 119-128. 80. Ree HD, Martin VDB, Brand T, Mulder GJ, Simons R, Brinio VVZ, Westerink RHS. Health risk assessment of exposure to TriCresyl Phosphates (TCPs) in aircraft: a commentary. Neurotoxicology 2014; 45: 209-215. 81. Wang C, Yang X, Guan J, Gao K, Li Z. Volatile organic compounds in aircraft cabin: Measurements and correlations between compounds. Building and Environment 2014; 78: 89-94. 82. Wang C, Yang X, Guan J, Li Z, Gao K. Source apportionment of volatile organic compounds (VOCs) in aircraft cabins. Building and Environment 2014; 81: 1-6. 83. Guan J, Li Z, Yang X. Net in-cabin emission rates of VOCs and contributions from outside and inside the aircraft cabin. Atmospheric Environment 2015; 111: 1-9. 84. Gao K, Xie J, Yang X. Estimation of the contribution of human skin and ozone reaction to volatile organic compounds (VOC) concentration in aircraft cabins. Building and Environment 2015; 94: 12-20. 85. Rosenberger W, Beckmann B, Wrbitzky R. Airborne aldehydes in cabin-air of commercial aircraft: Measurement by HPLC with UV absorbance detection of 2,4-dinitrophenylhydrazones. J Chromatogr B Analyt Technol Biomed Life Sci 2016; 1019: 117-127. 86. Schuchardt S, Bitsch A, Koch W, Rosenberger W. CAQ Preliminary cabin air quality measurement campaign. 2017. https://www.easa.europa.eu/sites/default/files/dfu/EASA%20CAQ%20Study%20Final%20Report_21.03.2017.pdf Accessed 2017. 87. Cao Q, Xu Q, Liu W, Lin C-H, Wei D, Baughcum S, Norris S, Chen Q. In-flight monitoring of particle deposition in the environmental control systems of commercial airliners in China. Atmospheric Environment 2017; 154: 118-128. 88. Cao X, Zevitas CD, Spengler JD, Coull B, McNeely E, Jones B, Loo SM, MacNaughton P, Allen JG. The on-board carbon dioxide concentrations and ventilation performance in passenger cabins of US domestic flights. Indoor and Built Environment 2018; 28: 761-771. 89. Schuchardt S, Koch W, Rosenberger W. Cabin air quality-Quantitative comparison of volatile air contaminants at different flight phases during 177 commercial flights. Building and Environment 2019; 148: 498-507. 90. Guan J, Jia Y, Wei Z, Tian X. Temporal variations of ultrafine particle concentrations in aircraft cabin: A field study. Building and Environment 2019; 153: 118-127. 91. Liu M, Liu J, Ren J, Liu L, Chen R, Li R. Bacterial community in commercial airliner cabins in China. Int J Environ Health Res 2019: 1-12. 92. MacGregor IC, Spicer CW, Buehler SS. Concentrations of Selected Chemical Species in the Airliner Cabin Environment. Journal of ASTM International 2008; 5. 93. OEHHA. OEHHA Acute, 8-hour and Chronic Reference Exposure Level (REL) Summary. 2019. 94. WHO. WHO guidelines for indoor air quality: selected pollutants. 2010. 95. Wisthaler A, Tamas G, Wyon D, Strom-Tejsen P, Space D, Beauchamp J, Hansel A, Mark T, Weschler C. Products of Ozone-Initiated Chemistry in a Simulated Aircraft Environment. Environ. Sci. Technol. 2005; 39: 4823-4832. 96. Weschler CJ, Wisthaler A, Cowlin S, Tamás G, Strøm-Tejsen P, Hodgson AT, Destaillats H, Herrington J, Zhang J, Nazaroff WW. Ozone-Initiated Chemistry in an Occupied Simulated Aircraft Cabin. Environ. Sci. Technol. 2007; 41: 6177-6184. 97. Norgaard AW, Kudal JD, Kofoed-Sorensen V, Koponen IK, Wolkoff P. Ozone-initiated VOC and particle emissions from a cleaning agent and an air freshener: risk assessment of acute airway effects. Environ Int 2014; 68: 209-218. 98. Singer BC, Coleman BK, Destaillats H, Hodgson AT, Lunden MM, Weschler CJ, Nazaroff WW. Indoor secondary pollutants from cleaning product and air freshener use in the presence of ozone. Atmospheric Environment 2006; 40: 6696-6710. 99. Sun J. D-Limonene: Safety and Clinical Applications. Alternative Medicine Review 2007; 12: 259-264. 100. Orth A-M, Lu Y, Engel K-H. Assessment of dietary exposure to flavouring substances via consumption of flavoured teas. Part 1: occurrence and contents of monoterpenes in Earl Grey teas marketed in the European Union. Food Additives & Contaminants: Part A 2013; 30: 1701-1714. 101. Simpson S, Roux P, Dinca M. The science behind sensing and filtering cabin air. AST 2019, February 19-20, Hamburg, Germany 2019. 102. Wainman T, Zhang J, Weschler CJ, Lioy PJ. Ozone and Limonene in Indoor Air: A Source of

Submicron Particle Exposure. Environmental Health Perspectives 2001; 108: 1139-1145. 103. Langer S, Moldanová J, Arrhenius K, Ljungström E, Ekberg L. Ultrafine particles produced by ozone/limonene reactions in indoor air under low/closed ventilation conditions. Atmospheric Environment 2008; 42: 4149-4159. 104. Rai AC, Guo B, Lin CH, Zhang J, Pei J, Chen Q. Ozone reaction with clothing and its initiated VOC emissions in an environmental chamber. Indoor Air 2014; 24: 49-58. 105. Tsushima S, Wargocki P, Tanabe S. Sensory evaluation and chemical analysis of exhaled and dermally emitted bioeffluents. Indoor Air 2018; 28: 146-163. 106. MHLW. Committee on Sick House Syndrome: Indoor Air Pollution Progress Report No. 4. 2002. http://www.nihs.go.jp/mhlw/chemical/situnai/kentoukai/rep-eng4.pdf Accessed 2002. 107. MHEPA. GB 18883-2002 indoor air quality standard. 2002. 108. AHSD. Residential indoor air quality guidelines. 2018. 109. AOLG. German Committee on Indoor Guide Values. 2018. 110. ACGIH. Risks of Hazardous Wastes. Appendix F-ACGIH Threshold Limit Value (TLV). 2011. 111. NIOSH. NIOSH pocket guide to chemical hazards. 2005. 112. Winder C, Balouet JC. The toxicity of commercial jet oils. Environmental Research 2002; 89: 0-164. 113. CAA. Cabin air quality-CAA paper 2004/04. 2004. 114. Winder C, Michaelis S. Crew Effects from Toxic Exposures on Aircraft. The Handbook of Environmental Chemistry 2005; 4H: 229-248. 115. Maddalena RL, Mckone TE. Insecticide exposures on commercial aircraft A literature review and screening level assessment. Lawrence Berkeley National Laboratory 2008. 116. Denola G, Hanhela PJ, Mazurek W. Determination of tricresyl phosphate air contamination in aircraft. Ann Occup Hyg 2011; 55. 117. Howard CV, Johnson DW, Morton J, Michaelis S, Supplee D, Burdon J. Is a Cumulative Exposure to a Background Aerosol of Nanoparticles Part of the Causal Mechanism of Aerotoxic Syndrome? J Nanomed Nanosci: JNAN-139. 2018; 2018. 118. Marsillach J, Richter RJ, Kim JH, Stevens RC, MacCoss MJ, Tomazela D, Suzuki SM, Schopfer LM, Lockridge O, Furlong CE. Biomarkers of organophosphorus (OP) exposures in humans. Neurotoxicology 2011; 32: 656-660. 119. Cheng MD. Classification of Volatile Engine Particles. Aerosol and Air Quality Research 2013; 13: 1411-1422. 120. TRGS. Technical Rules for Hazardous Substances. 2006. https://www.baua.de/DE/Angebote/Rechtstexte-und-Technische-Regeln/Regelwerk/TRGS/pdf/TRGS-900.pdf?__blob=publicationFile Accessed 2006. 121. Nicholson TT, Sznajder JI. Fitness to fly in patients with lung disease. Ann Am Thorac Soc 2014; 11: 1614-1622. 122. Begum E, Metin A, Grazia P, Stefano N. Should I stay or should I go? COPD and air travel. Eur Respir Rev 2018; 27. 123. Yates EL, Johnson MS, Iraci LT, Ryoo JM, Pierce RB, Cullis PD, Gore W, Ives MA, Johnson BJ, Leblanc T, Marrero JE, Sterling CW, Tanaka T. An Assessment of Ground Level and Free Tropospheric Ozone Over California and Nevada. Journal of Geophysical Research: Atmospheres 2017; 122: 10089-10102. 124. Bhangar S, Nazaroff WW. Atmospheric ozone levels encountered by commercial aircraft on transatlantic routes. ENVIRONMENTAL RESEARCH LETTERS 2013; 8. 125. WHO. WHO Air quality guidelines for particulate matter, ozone, nitrogen dioxide and sulfur dioxide. 2005. 126. Machida T, Kita K, Kondo Y, Blake D, Kawakami S, Inoue G, Ogawa T. Vertical and meridional distributions of the atmospheric CO2mixing ratio between northern midlatitudes and southern subtropics. Journal of Geophysical Research 2002; 108. 127. Foucher PY, Chédin A, Armante R, Boone C, Crevoisier C, Bernath P. First carbon dioxide atmospheric vertical profiles retrieved from space observation using ACE-FTS solar occultation instrument. Atmospheric Chemistry and Physics Discussions 2010; 10: 26473-26512. 128. Tuzson B, Henne S, Brunner D, Steinbacher M, Mohn J, Buchmann B, Emmenegger L. Continuous isotopic composition measurements of tropospheric CO2 at Jungfraujoch (3580 m a.s.l.), Switzerland: real-time observation of regional pollution events. Atmospheric Chemistry and Physics 2011; 11: 1685-1696. 129. Sawa Y, Matsueda H, Makino Y, Inoue HY, Murayama S, Hirota M, Tsutsumi Y, Zaizen Y, Ikegami M, Okada K. Aircraft Observation of CO2, CO2 O3 and H2 over the North Pacific during the PACE-7 Campaign. Tellus B: Chemical and Physical Meteorology 2017; 56: 2-20.

130. ANSI/ASHRAE. ANSI/ASHRAE Standard 62.1, Ventilation for Acceptable Indoor Air Quality. 2016. 131. Fisk W, Wargocki P, Zhang X. Do Indoor CO2 Levels Directly Affect Perceived Air Quality, Health, or Work Performance? ASHRAE Journal 2019; 61. 132. Du B, Tandoc MC, Mack ML, Siegel JA. Indoor CO2 concentrations and cognitive function: A critical review. Indoor Air 2020; 30: 1067-1082. 133. CEN. EN 16798‑1: 2019. Energy performance of buildings-Ventilation for buildings. 2019. 134. ASTM. ASTM D6399-18. Standard guide for selecting instruments and methods for measuring air quality in aircraft cabins. Designation: D6399-18. 100 Barr Harbor Drive, PO Box C700, West Conshohocken, PA 19428-2959. United States; 2018. 135. U.S. Department of Health and Human Services, Public Health Service, Centers for Disease Control, National Institute for Occupational Safety and Health, NIOSH Manual of Analytical Methods,. 3rd edition, Vol. 1, National Technical Information Service, Springfield, VA, 1984. 136. U.S. Environmental Protection Agency. EPA Compendium of Methods for the Determination of Toxic Organic Compounds in Ambient Air: Methods TO-1 through TO-14. published from 1984 through 1988. 137. ISO 16000-6. Indoor air-Part 6: Determination of volatile organic compounds in indoor and test chamber air by active sampling on Tenax TA sorbent, thermal desorption and gas chromatography using MS/FID. 2004. 138. BS EN ISO 16017-1. Indoor, ambient and workplace air sampling and analysis of volatile organic compounds by sorbent tube thermal desorption capillary gas chromatography Part 1 Pumped sampling. 2001.