Embed Size (px)
Citation preview
Computer-Aided Design & Applications, PACE (1), 2011, 47-65© 2011 CAD Solutions, LLC, http://www.cadanda.com
47
CAD Applications in a Formula SAE Project Based on V Designing Process
Bin Wang1, Zhongmin Zeng2, Tian Feng3 and Yingchao Zhang4
1Jilin University, [email protected] University, [email protected]
3Jilin University, [email protected] University, [email protected]
ABSTRACT
With the purpose of designing and building a FSAE racing vehicle which meets certainrules, the V designing process was combined organically with the process of vehicledevelopment. The guidance of this process enables the team to finish goal setting andsubdividing, component designing, simulating, optimizing, manufacturing and vehicletesting, in a rational procedure. Based on the V designing process, this paper focusedon analysis of the vehicle dynamic performances, design and simulation of differentvehicle components using various CAD software. This procedure effectively improvedthe quality of the products, reduced the costs and shortened the periods of the vehicledevelopment, and also ensured the correctness of the results.
Keywords: Formula SAE, V designing process, CAD, FEA, CFD.DOI: 10.3722/cadaps.2011.PACE.47-65
1 INTRODUCTION
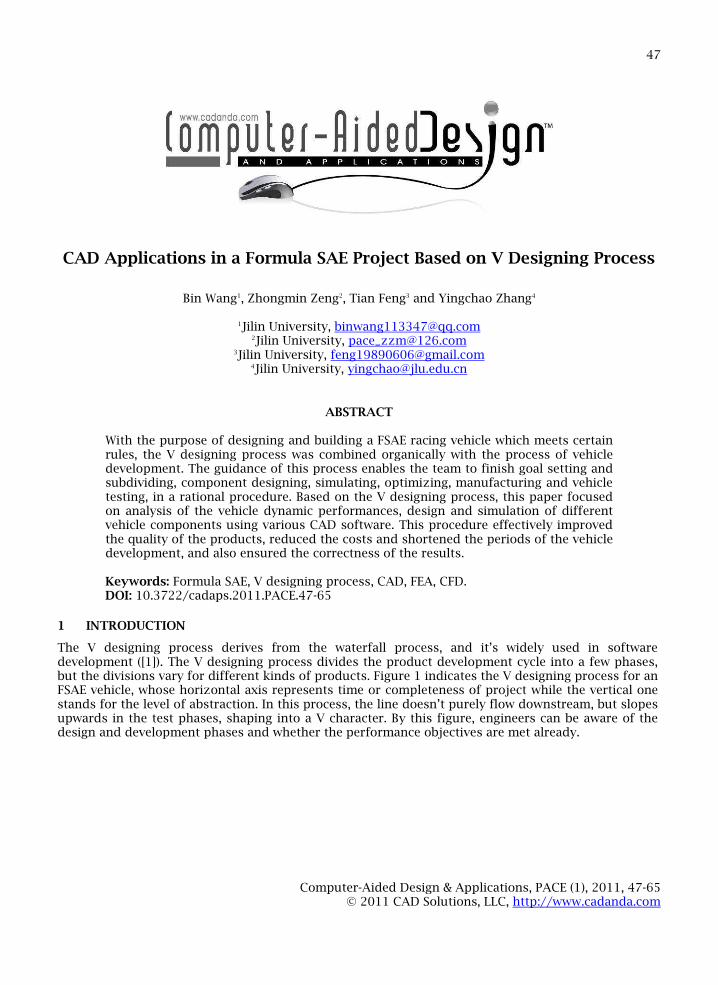
The V designing process derives from the waterfall process, and it’s widely used in softwaredevelopment ([1]). The V designing process divides the product development cycle into a few phases,but the divisions vary for different kinds of products. Figure 1 indicates the V designing process for anFSAE vehicle, whose horizontal axis represents time or completeness of project while the vertical onestands for the level of abstraction. In this process, the line doesn’t purely flow downstream, but slopesupwards in the test phases, shaping into a V character. By this figure, engineers can be aware of thedesign and development phases and whether the performance objectives are met already.
Computer-Aided Design & Applications, PACE (1), 2011, 47-65© 2011 CAD Solutions, LLC, http://www.cadanda.com
48
Fig.Fig. 1: The V designing process for an FSAE vehicle.
Formula SAE is a student design competition that organized by the Society of AutomotiveEngineers (SAE). Every participating team, which is mostly comprised of undergraduates, has to designand build, in one year and according to the rules, a small size formula car. The competition consists ofdynamic events and static events. Mainly, when designing the vehicle, most of the attention will bepaid to the performance requirements in the dynamic events. The V designing process was introducedinto the development of the JLU FSAE racecars and integrated with practice. As is shown in Fig. 1, teamengineers divided the whole process into three main phases. Firstly, the team analyzed the dynamicperformances of the racing vehicle, and then subdivided specific performances and set goals for themin the prophase. Next, according to these goals, engineers analyzed, summarized and at last correlatedthese divided goals with subsystems and components in the metaphase. Henceforth, the designing wasconducted. During the part and component designing phase, CAD software was efficiently utilized andwell incorporated into this development model. After the designing phase, the team started checkingof designed parts in order to guarantee their required qualifications. Only after part checking, canengineers do subsystem evaluation which contains checked parts and components. The post-phase ofV designing process is manufacturing and assembling of components and subsystems, and finallyfinished the testing of the vehicle. Under the guidance of the V designing process and with theassistances of the CAD methods, the JLU Racing Team not only successfully accomplished thedevelopment of the first year’s FSAE vehicle in a short period, but also improved the efficiency andaccuracy of the development.
Computer-Aided Design & Applications, PACE (1), 2011, 47-65© 2011 CAD Solutions, LLC, http://www.cadanda.com
49
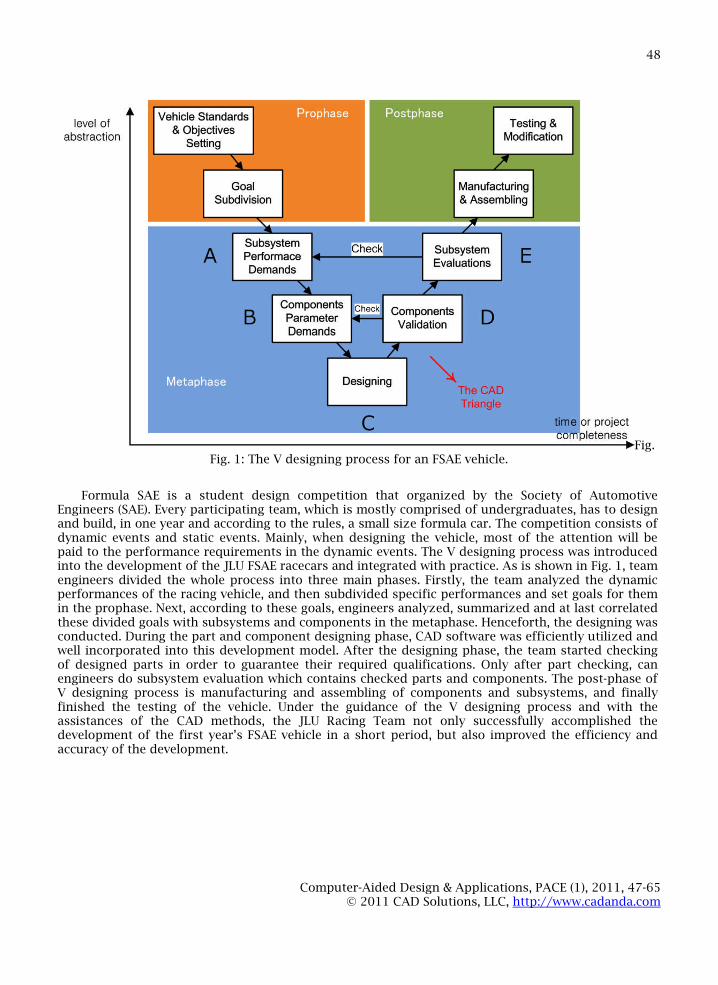
Tab. 1: Contents of metaphase in V designing process.
As is indicated in Fig.1, the most significant and essential phase of V design process is themetaphase, including subsystem demand performance analysis, component specific requirementssetting, designing and validation of components and subsystems. To clarify the steps and contents inmetaphase, Tab.1 shows the main five steps (A, B, C, D, E) from detailed design with self-check steps(E-A, D-B), which mean if designed components cannot pass component check & evaluation step, they
have to be redirected to component parameter demand (B) step to re-examine and reset their originaldesigning goals and parameters. Also, it is the same case for subsystems like unqualified suspension,power-train to pass from E to A, if they fail to meet originally set goals. As a whole, step A containsmost of the aspects related to full car dynamic performances and step B converts the overall researchobjects into several specific areas. Engineers finish 3D modeling and simulation in step C. Mostimportantly, in step D and step E, team engineers pay quite a lot of time and energy to analyze thesimulation results of components and subsystems, especially interpreting dynamic performances intophysical or mathematical terms with ratiocinated formulas. After several times’ modification, theoriginally set performance goals are gradually realized and the overall dynamic performances seem tobe perfect from the view of vehicle engineering. Therefore, the loop of metaphase cycle (A-E) is theheart of JLU FSAE car designing process.
In post-phase of V designing process, attention is paid to manufacturing and assembling the car,after which road tests are conducted to simulate the working conditions during the competition. Quitea lot of problems were found but not severe. Most pages in this passage are arranged for prophaseand metaphase of V designing process, from goal subdivision, designing and simulation to componentanalysis and subsystem evaluation.
Computer-Aided Design & Applications, PACE (1), 2011, 47-65© 2011 CAD Solutions, LLC, http://www.cadanda.com
50
2 GOAL SUBDIVISION
The Formula SAE dynamic events consist of acceleration, skid-pad, autocross, fuel economy andendurance. Obviously, different events place different emphasis on the performance of the race car,and the following table indicates them clearly.
Event Acceleration Skid-pad Autocross Fuel Economy Endurance
DesignObjectives
Light weight Light weight Light weight Engine Modification Light weightDown force Handling
stabilityHandlingstability
Light weight Handlingstability
Frame Rigidity Ride comfort Ride comfort Less Drag Ride comfortLess Drag Dynamic Dynamic
Tab. 2: Design objectives for different dynamic events.
After analyzing working conditions of the vehicle in the competition, several properties shown intable 2 should be taken into consideration in the designing process. To summarize, weight reduction,handling stability, engine power output and lift-drag ratio are the main factors that influencecompetition results. In this phase, design objectives are just unveiled but still need to be interpretedinto physical and mathematical terms. Therefore, in the next phase, design objectives are interpretedinto technical parameters and the suitable CAD software is listed in the table:
PerformanceProperty
Dynamic andless weight
Power &Torque output
Handlingstability
RideComfort
Lift-drag Ratio
Influencingfactors
masspower and
torquecoefficient ofstability K
Framerigidity &inherent
frequency
Down force and dragforce
Goal parameter < 240kgP > 60kW & T >
75 Nm0.0001>K>0
>2600Nm/deg
Front: >15kg@17m/sRear: >28kg@17m/s
CAD software HyperWorksGT-POWER &
ANSYS FLUENTMSC.ADAMS MSC.Patran ANSYS FLUENT
Tab. 3: Detailed goal subdividing and suitable software.
Different influencing factors above have direct link with the vehicle performances in thecompetition. For example, the overall vehicle mass and engine power output play a significant role inacceleration event of the competition. Based on the above, the following steps are dealing with thedesign goal parameters relevant to each performance property and applicable CAD software. They areMass Control (Topology Optimization), Engine Modification (Engine simulation and CFD Analysis),Frame Stiffness and Inherent Frequency Analysis (FEA), Aerodynamic Down Force Analysis (CFDAnalysis) and Handling Stability (Multi-body Dynamic Simulation).
3 MASS CONTROL
The overall mass of a vehicle dramatically influences the dynamic performance especially in theacceleration event in Formula FSAE competition. Also, from the results of Formula SAE in the US andFormula Student in Germany, the lighter a car is, the faster it can run in acceleration event. To do masscontrol, the first thing to do is to analyze the loads and constraints applied in devices. Finite ElementAnalysis and Topology Solution are adapted in the development of suspension devices includingupright, hub and rocker arm. We choose rocker arm as an example to illustrate the mass control byCAD software in the following.
Computer-Aided Design & Applications, PACE (1), 2011, 47-65© 2011 CAD Solutions, LLC, http://www.cadanda.com
51
3.1 Rocker Arm and Its Optimization Process
Rocker arm is an important component which connects push/pull rod, shock, anti-roll bar and frame.The typical rocker arm design is shown as figure 2(a). The loads from the ground are conductedthrough the push/pull rod to rocker arm, and rocker arm plays the part as changing the direction ofthe loads and delivering them to shock. Therefore, rocker arm needs to have adequate strength andstiffness. At the same time, weight reduction also has to be taken into consideration. In order tobalance the two conflicting objectives: maximizing the strength and rigidity and minimizing the weightof the component ([2]), topology method and Altair OptiStruct were introduced into designing therocker arm.
3.2 Modeling
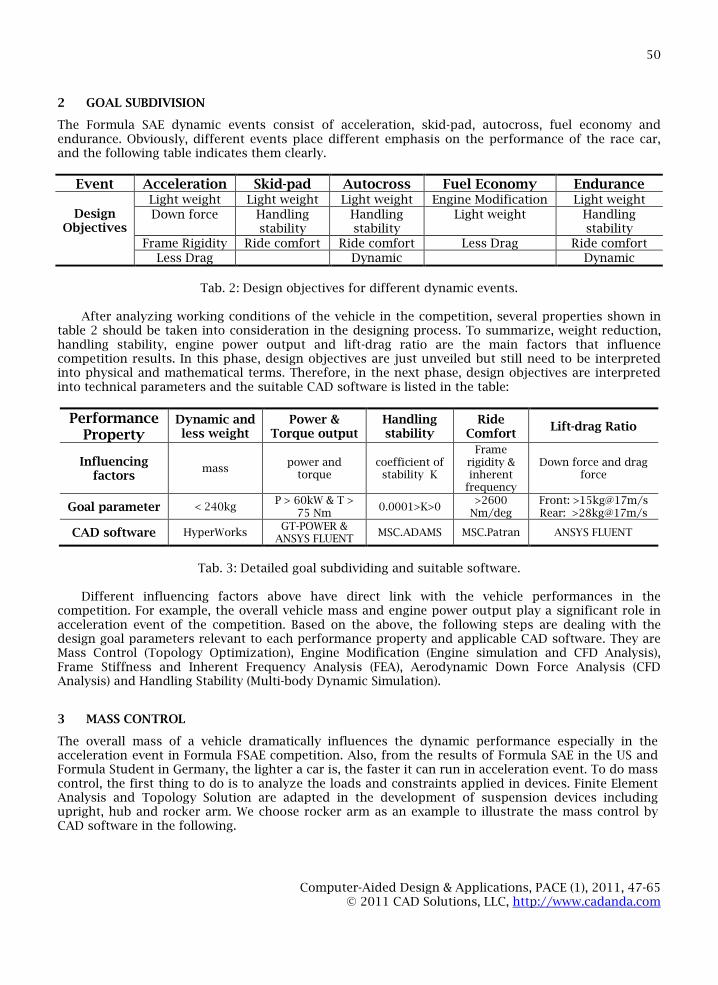
After importing the geometry file into Altair HyperMesh, 44729 tetra elements and 10586 nodes werecreated. Figure 2(b) shows the non-design regions (purple) and the design regions (yellow).
Fig. 2: (a) Typical rocker arm design, (b) The design domain, (c) The simplified model.
In order to cut down the weight as much as possible and ensure the strength, Aluminum 7075 wasa good choice to be the material for the rocker arm. Its elastic modulus is 71.0GPa, Poisson’s ratio is0.33, and density is 2.8Mg/m3.
The results of force applied in the hard-point were adopted directly from MSC full vehicle dynamicsimulation. Comparing the four bad working conditions, the worst case for the front rocker arm wasthe “braking in a sharp corner” scenario (1.310G deceleration and 1.028G lateral acceleration). Afterthe theoretical force analysis of the front rocker arm, a simplified model can be seen as figure 2(c).Taking the pull rod mounting hole as the point of application, the force was decomposed asFx =3887N, Fy =742N.
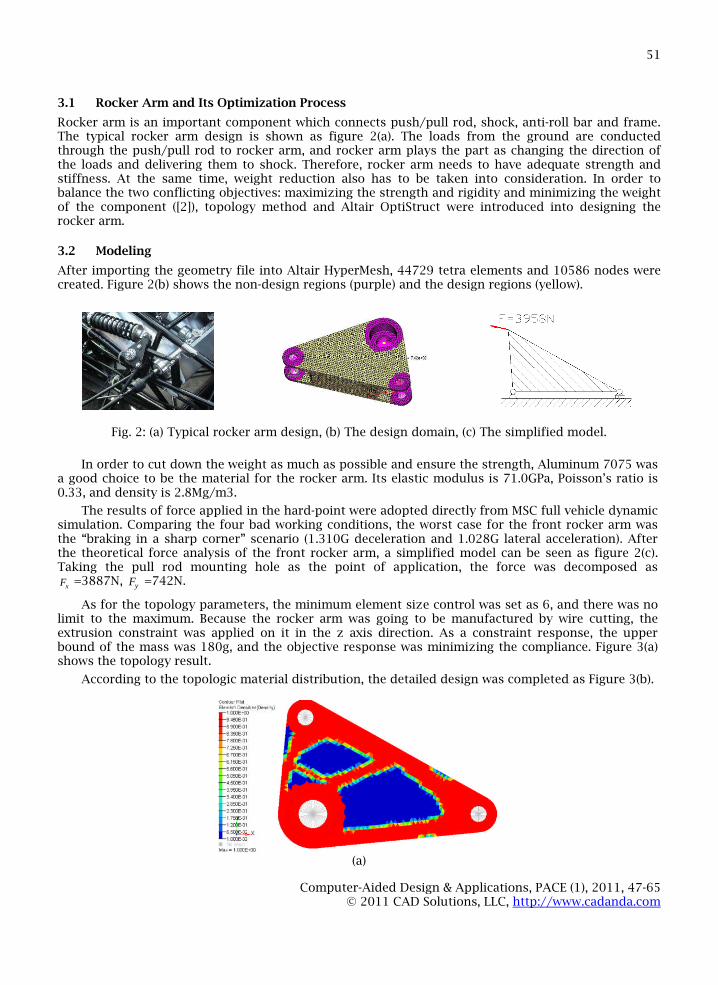
As for the topology parameters, the minimum element size control was set as 6, and there was nolimit to the maximum. Because the rocker arm was going to be manufactured by wire cutting, theextrusion constraint was applied on it in the z axis direction. As a constraint response, the upperbound of the mass was 180g, and the objective response was minimizing the compliance. Figure 3(a)shows the topology result.
According to the topologic material distribution, the detailed design was completed as Figure 3(b).
(a)
Computer-Aided Design & Applications, PACE (1), 2011, 47-65© 2011 CAD Solutions, LLC, http://www.cadanda.com
52
(b)
(c)
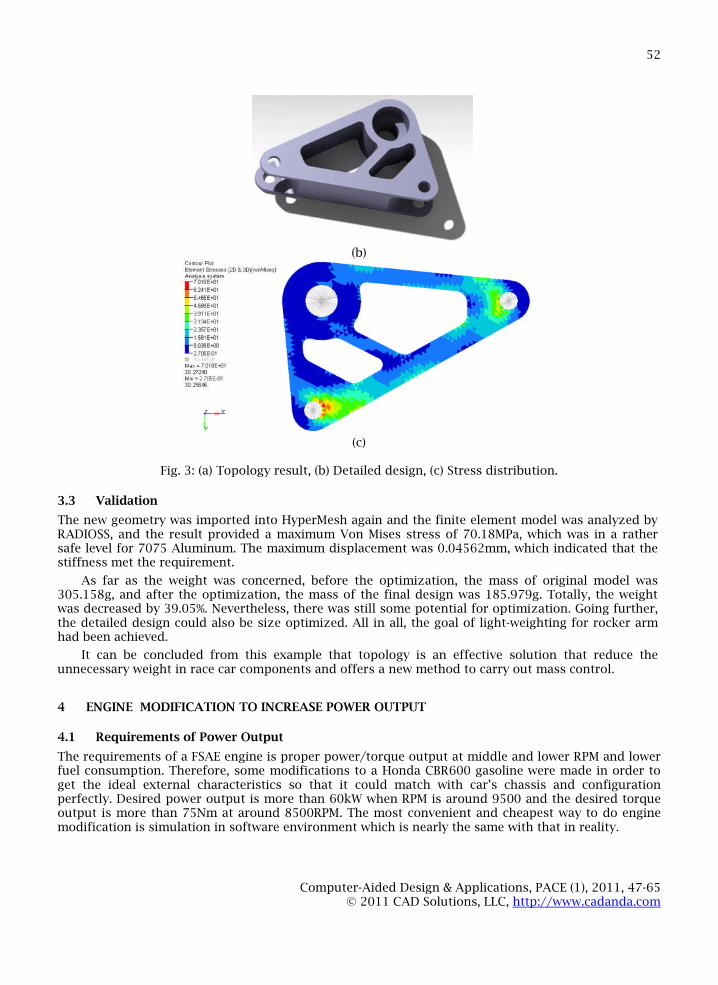
Fig. 3: (a) Topology result, (b) Detailed design, (c) Stress distribution.
3.3 Validation
The new geometry was imported into HyperMesh again and the finite element model was analyzed byRADIOSS, and the result provided a maximum Von Mises stress of 70.18MPa, which was in a rathersafe level for 7075 Aluminum. The maximum displacement was 0.04562mm, which indicated that thestiffness met the requirement.
As far as the weight was concerned, before the optimization, the mass of original model was305.158g, and after the optimization, the mass of the final design was 185.979g. Totally, the weightwas decreased by 39.05%. Nevertheless, there was still some potential for optimization. Going further,the detailed design could also be size optimized. All in all, the goal of light-weighting for rocker armhad been achieved.
It can be concluded from this example that topology is an effective solution that reduce theunnecessary weight in race car components and offers a new method to carry out mass control.
4 ENGINE MODIFICATION TO INCREASE POWER OUTPUT
4.1 Requirements of Power Output
The requirements of a FSAE engine is proper power/torque output at middle and lower RPM and lowerfuel consumption. Therefore, some modifications to a Honda CBR600 gasoline were made in order toget the ideal external characteristics so that it could match with car’s chassis and configurationperfectly. Desired power output is more than 60kW when RPM is around 9500 and the desired torqueoutput is more than 75Nm at around 8500RPM. The most convenient and cheapest way to do enginemodification is simulation in software environment which is nearly the same with that in reality.
Computer-Aided Design & Applications, PACE (1), 2011, 47-65© 2011 CAD Solutions, LLC, http://www.cadanda.com
53
4.2 Modeling
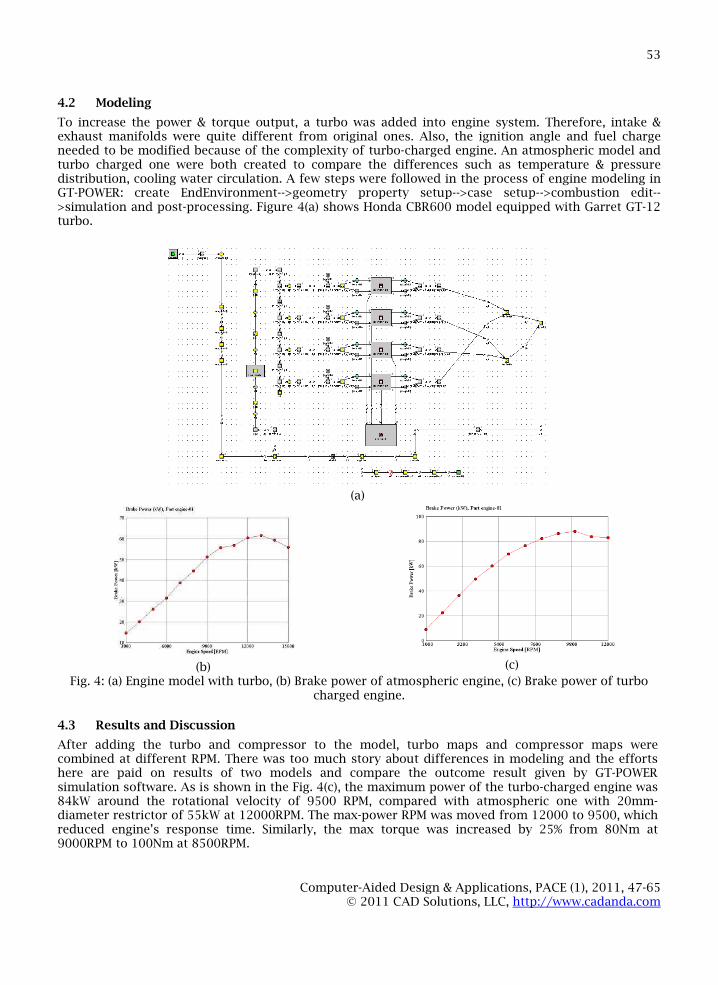
To increase the power & torque output, a turbo was added into engine system. Therefore, intake &exhaust manifolds were quite different from original ones. Also, the ignition angle and fuel chargeneeded to be modified because of the complexity of turbo-charged engine. An atmospheric model andturbo charged one were both created to compare the differences such as temperature & pressuredistribution, cooling water circulation. A few steps were followed in the process of engine modeling inGT-POWER: create EndEnvironment-->geometry property setup-->case setup-->combustion edit-->simulation and post-processing. Figure 4(a) shows Honda CBR600 model equipped with Garret GT-12turbo.
(a)
(b) (c)
Fig. 4: (a) Engine model with turbo, (b) Brake power of atmospheric engine, (c) Brake power of turbocharged engine.
4.3 Results and Discussion
After adding the turbo and compressor to the model, turbo maps and compressor maps werecombined at different RPM. There was too much story about differences in modeling and the effortshere are paid on results of two models and compare the outcome result given by GT-POWERsimulation software. As is shown in the Fig. 4(c), the maximum power of the turbo-charged engine was84kW around the rotational velocity of 9500 RPM, compared with atmospheric one with 20mm-diameter restrictor of 55kW at 12000RPM. The max-power RPM was moved from 12000 to 9500, whichreduced engine’s response time. Similarly, the max torque was increased by 25% from 80Nm at9000RPM to 100Nm at 8500RPM.
Computer-Aided Design & Applications, PACE (1), 2011, 47-65© 2011 CAD Solutions, LLC, http://www.cadanda.com
54
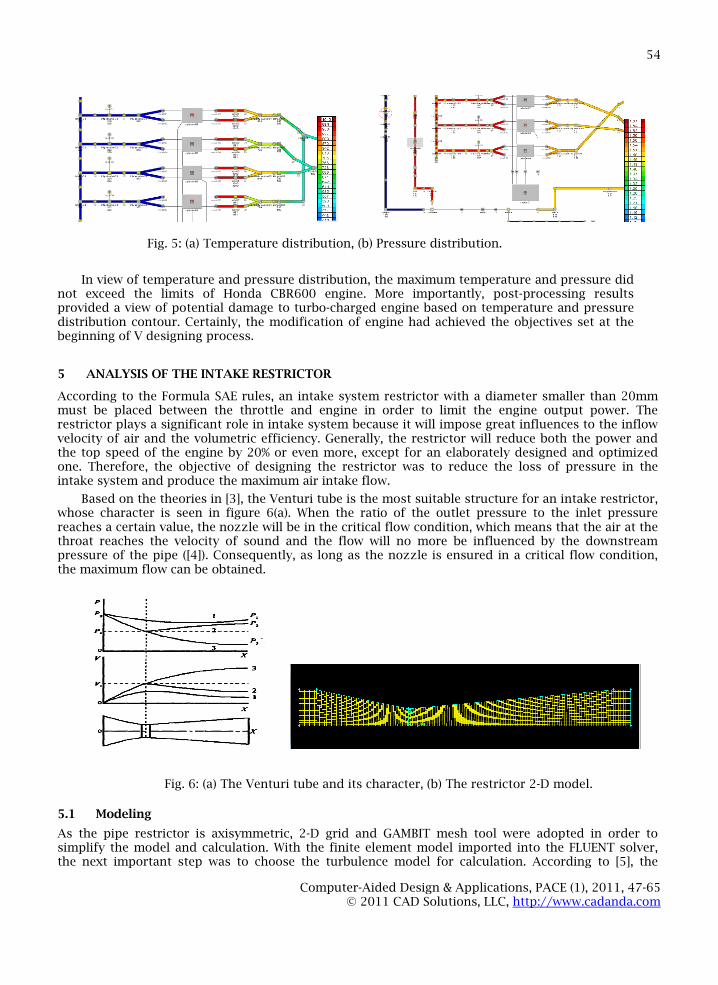
Fig. 5: (a) Temperature distribution, (b) Pressure distribution.
In view of temperature and pressure distribution, the maximum temperature and pressure didnot exceed the limits of Honda CBR600 engine. More importantly, post-processing resultsprovided a view of potential damage to turbo-charged engine based on temperature and pressuredistribution contour. Certainly, the modification of engine had achieved the objectives set at thebeginning of V designing process.
5 ANALYSIS OF THE INTAKE RESTRICTOR
According to the Formula SAE rules, an intake system restrictor with a diameter smaller than 20mmmust be placed between the throttle and engine in order to limit the engine output power. Therestrictor plays a significant role in intake system because it will impose great influences to the inflowvelocity of air and the volumetric efficiency. Generally, the restrictor will reduce both the power andthe top speed of the engine by 20% or even more, except for an elaborately designed and optimizedone. Therefore, the objective of designing the restrictor was to reduce the loss of pressure in theintake system and produce the maximum air intake flow.
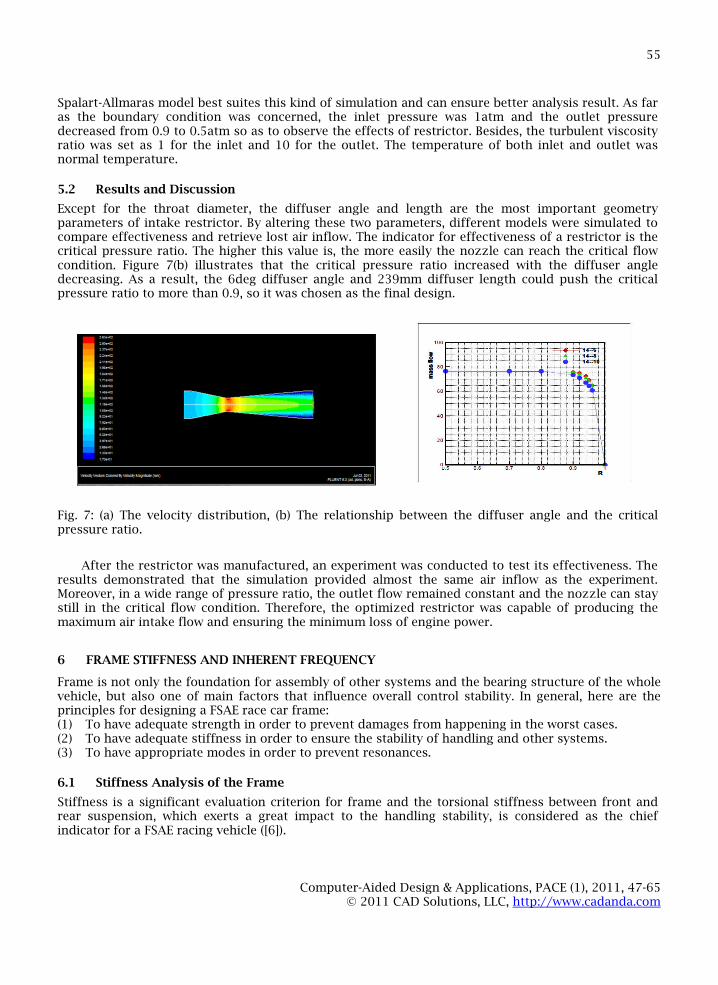
Based on the theories in [3], the Venturi tube is the most suitable structure for an intake restrictor,whose character is seen in figure 6(a). When the ratio of the outlet pressure to the inlet pressurereaches a certain value, the nozzle will be in the critical flow condition, which means that the air at thethroat reaches the velocity of sound and the flow will no more be influenced by the downstreampressure of the pipe ([4]). Consequently, as long as the nozzle is ensured in a critical flow condition,the maximum flow can be obtained.
Fig. 6: (a) The Venturi tube and its character, (b) The restrictor 2-D model.
5.1 Modeling
As the pipe restrictor is axisymmetric, 2-D grid and GAMBIT mesh tool were adopted in order tosimplify the model and calculation. With the finite element model imported into the FLUENT solver,the next important step was to choose the turbulence model for calculation. According to [5], the
Computer-Aided Design & Applications, PACE (1), 2011, 47-65© 2011 CAD Solutions, LLC, http://www.cadanda.com
55
Spalart-Allmaras model best suites this kind of simulation and can ensure better analysis result. As faras the boundary condition was concerned, the inlet pressure was 1atm and the outlet pressuredecreased from 0.9 to 0.5atm so as to observe the effects of restrictor. Besides, the turbulent viscosityratio was set as 1 for the inlet and 10 for the outlet. The temperature of both inlet and outlet wasnormal temperature.
5.2 Results and Discussion
Except for the throat diameter, the diffuser angle and length are the most important geometryparameters of intake restrictor. By altering these two parameters, different models were simulated tocompare effectiveness and retrieve lost air inflow. The indicator for effectiveness of a restrictor is thecritical pressure ratio. The higher this value is, the more easily the nozzle can reach the critical flowcondition. Figure 7(b) illustrates that the critical pressure ratio increased with the diffuser angledecreasing. As a result, the 6deg diffuser angle and 239mm diffuser length could push the criticalpressure ratio to more than 0.9, so it was chosen as the final design.
Fig. 7: (a) The velocity distribution, (b) The relationship between the diffuser angle and the criticalpressure ratio.
After the restrictor was manufactured, an experiment was conducted to test its effectiveness. Theresults demonstrated that the simulation provided almost the same air inflow as the experiment.Moreover, in a wide range of pressure ratio, the outlet flow remained constant and the nozzle can staystill in the critical flow condition. Therefore, the optimized restrictor was capable of producing themaximum air intake flow and ensuring the minimum loss of engine power.
6 FRAME STIFFNESS AND INHERENT FREQUENCY
Frame is not only the foundation for assembly of other systems and the bearing structure of the wholevehicle, but also one of main factors that influence overall control stability. In general, here are theprinciples for designing a FSAE race car frame:(1) To have adequate strength in order to prevent damages from happening in the worst cases.(2) To have adequate stiffness in order to ensure the stability of handling and other systems.(3) To have appropriate modes in order to prevent resonances.
6.1 Stiffness Analysis of the Frame
Stiffness is a significant evaluation criterion for frame and the torsional stiffness between front andrear suspension, which exerts a great impact to the handling stability, is considered as the chiefindicator for a FSAE racing vehicle ([6]).
Computer-Aided Design & Applications, PACE (1), 2011, 47-65© 2011 CAD Solutions, LLC, http://www.cadanda.com
56
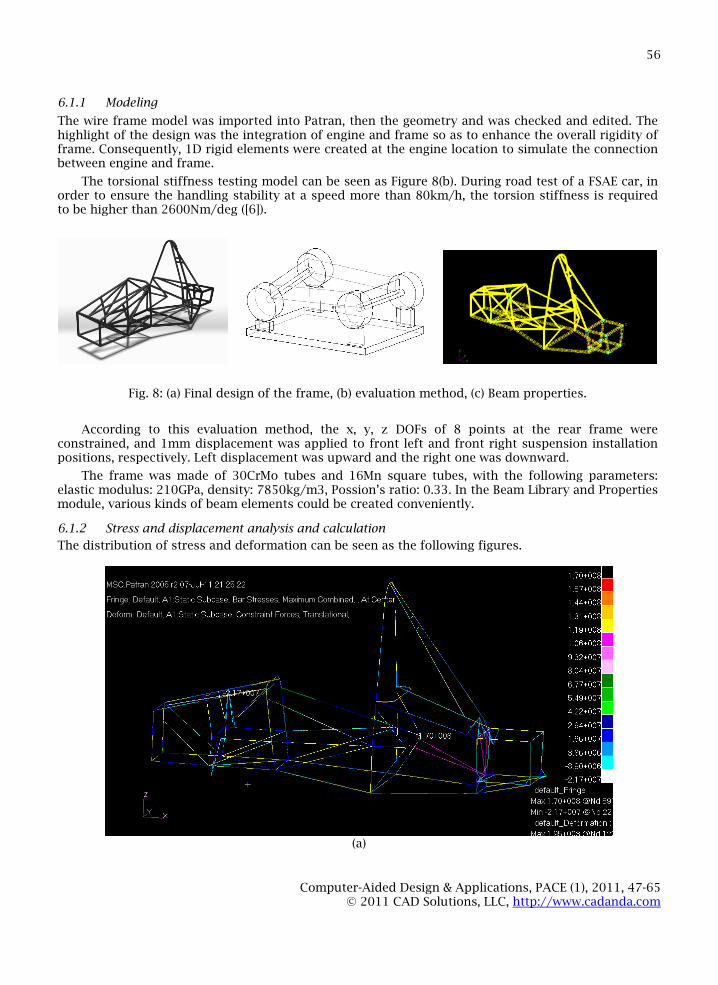
6.1.1 Modeling
The wire frame model was imported into Patran, then the geometry and was checked and edited. Thehighlight of the design was the integration of engine and frame so as to enhance the overall rigidity offrame. Consequently, 1D rigid elements were created at the engine location to simulate the connectionbetween engine and frame.
The torsional stiffness testing model can be seen as Figure 8(b). During road test of a FSAE car, inorder to ensure the handling stability at a speed more than 80km/h, the torsion stiffness is requiredto be higher than 2600Nm/deg ([6]).
Fig. 8: (a) Final design of the frame, (b) evaluation method, (c) Beam properties.
According to this evaluation method, the x, y, z DOFs of 8 points at the rear frame wereconstrained, and 1mm displacement was applied to front left and front right suspension installationpositions, respectively. Left displacement was upward and the right one was downward.
The frame was made of 30CrMo tubes and 16Mn square tubes, with the following parameters:elastic modulus: 210GPa, density: 7850kg/m3, Possion’s ratio: 0.33. In the Beam Library and Propertiesmodule, various kinds of beam elements could be created conveniently.
6.1.2 Stress and displacement analysis and calculation
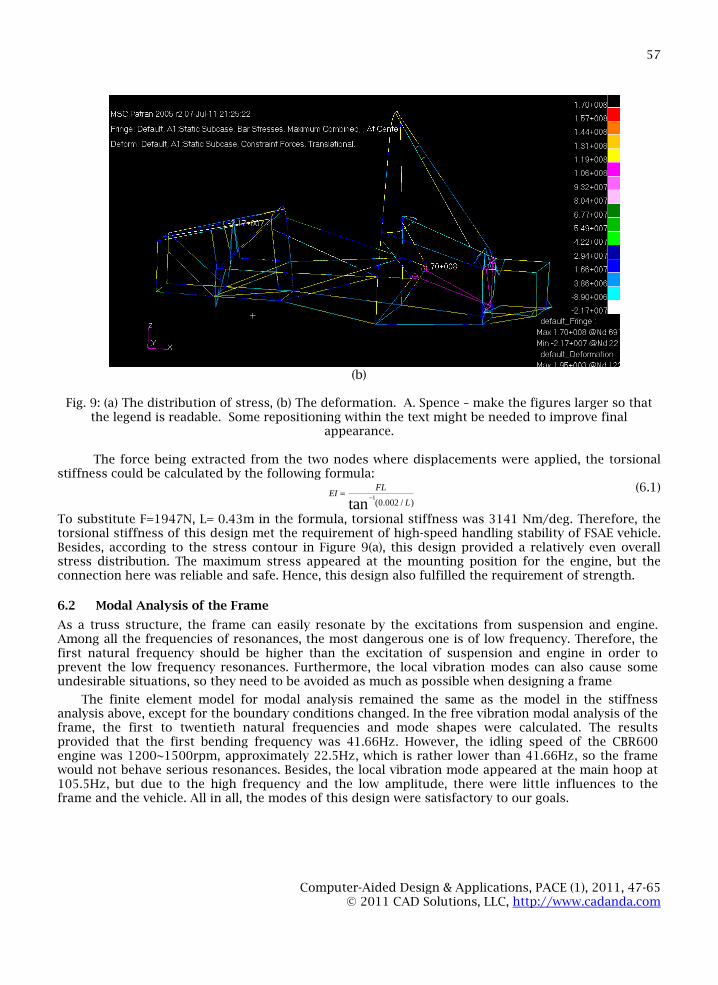
The distribution of stress and deformation can be seen as the following figures.
(a)
Computer-Aided Design & Applications, PACE (1), 2011, 47-65© 2011 CAD Solutions, LLC, http://www.cadanda.com
57
(b)
Fig. 9: (a) The distribution of stress, (b) The deformation. A. Spence – make the figures larger so thatthe legend is readable. Some repositioning within the text might be needed to improve final
appearance.
The force being extracted from the two nodes where displacements were applied, the torsionalstiffness could be calculated by the following formula:
EI FL
1
tan (0.002 / L)
(6.1)
To substitute F=1947N, L= 0.43m in the formula, torsional stiffness was 3141 Nm/deg. Therefore, thetorsional stiffness of this design met the requirement of high-speed handling stability of FSAE vehicle.Besides, according to the stress contour in Figure 9(a), this design provided a relatively even overallstress distribution. The maximum stress appeared at the mounting position for the engine, but theconnection here was reliable and safe. Hence, this design also fulfilled the requirement of strength.
6.2 Modal Analysis of the Frame
As a truss structure, the frame can easily resonate by the excitations from suspension and engine.Among all the frequencies of resonances, the most dangerous one is of low frequency. Therefore, thefirst natural frequency should be higher than the excitation of suspension and engine in order toprevent the low frequency resonances. Furthermore, the local vibration modes can also cause someundesirable situations, so they need to be avoided as much as possible when designing a frame
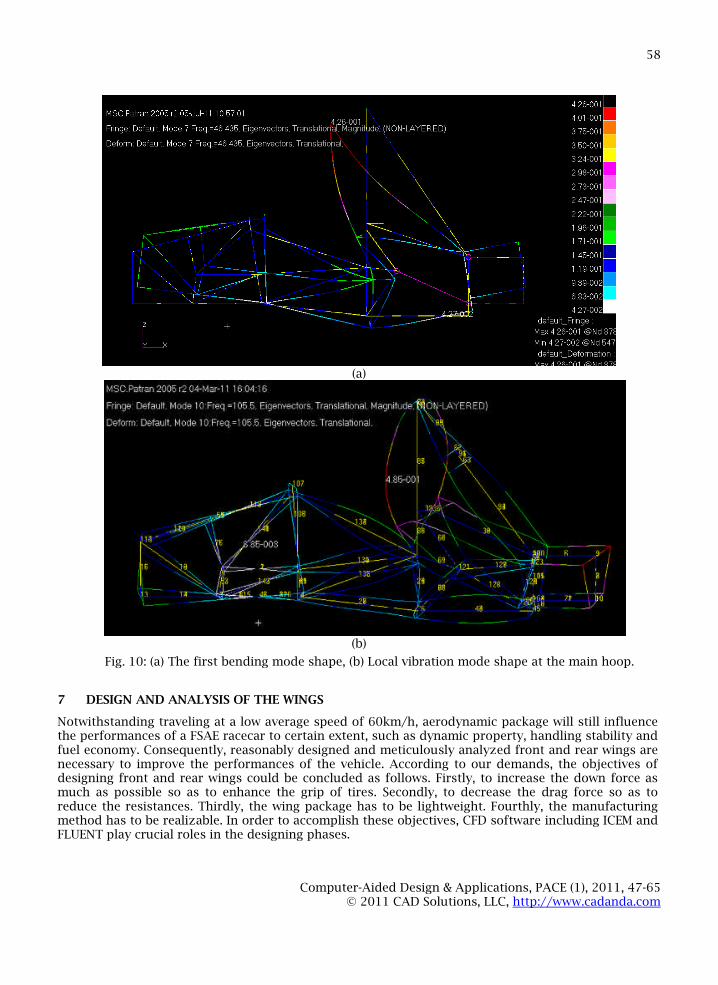
The finite element model for modal analysis remained the same as the model in the stiffnessanalysis above, except for the boundary conditions changed. In the free vibration modal analysis of theframe, the first to twentieth natural frequencies and mode shapes were calculated. The resultsprovided that the first bending frequency was 41.66Hz. However, the idling speed of the CBR600engine was 1200~1500rpm, approximately 22.5Hz, which is rather lower than 41.66Hz, so the framewould not behave serious resonances. Besides, the local vibration mode appeared at the main hoop at105.5Hz, but due to the high frequency and the low amplitude, there were little influences to theframe and the vehicle. All in all, the modes of this design were satisfactory to our goals.
Computer-Aided Design & Applications, PACE (1), 2011, 47-65© 2011 CAD Solutions, LLC, http://www.cadanda.com
58
(a)
(b)
Fig. 10: (a) The first bending mode shape, (b) Local vibration mode shape at the main hoop.
7 DESIGN AND ANALYSIS OF THE WINGS
Notwithstanding traveling at a low average speed of 60km/h, aerodynamic package will still influencethe performances of a FSAE racecar to certain extent, such as dynamic property, handling stability andfuel economy. Consequently, reasonably designed and meticulously analyzed front and rear wings arenecessary to improve the performances of the vehicle. According to our demands, the objectives ofdesigning front and rear wings could be concluded as follows. Firstly, to increase the down force asmuch as possible so as to enhance the grip of tires. Secondly, to decrease the drag force so as toreduce the resistances. Thirdly, the wing package has to be lightweight. Fourthly, the manufacturingmethod has to be realizable. In order to accomplish these objectives, CFD software including ICEM andFLUENT play crucial roles in the designing phases.
Computer-Aided Design & Applications, PACE (1), 2011, 47-65© 2011 CAD Solutions, LLC, http://www.cadanda.com
59
7.1 Profile Design
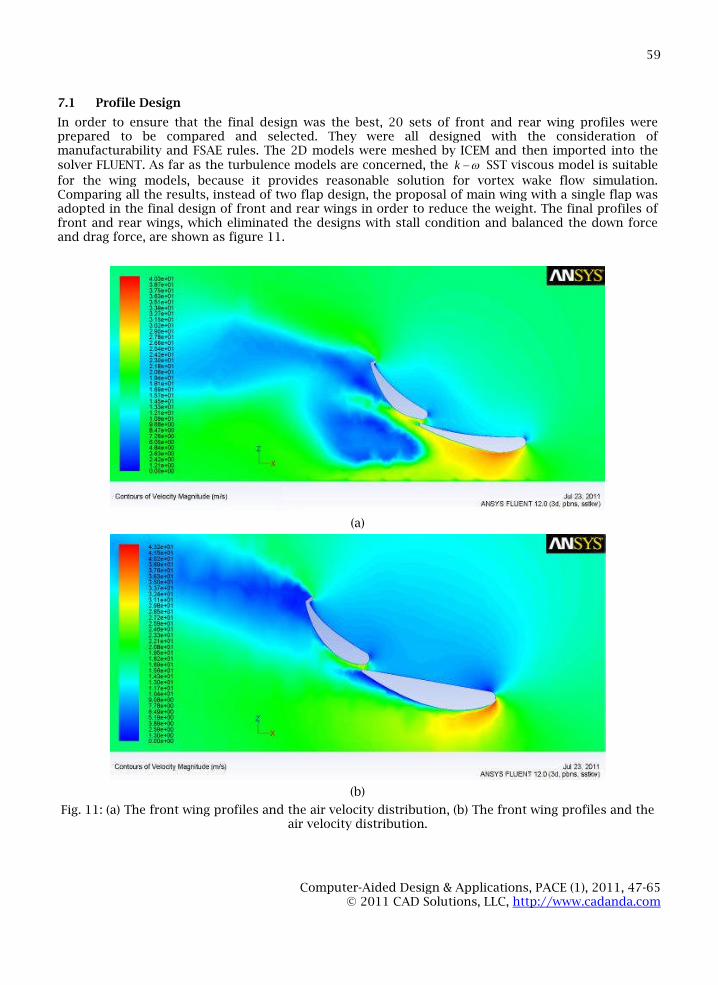
In order to ensure that the final design was the best, 20 sets of front and rear wing profiles wereprepared to be compared and selected. They were all designed with the consideration ofmanufacturability and FSAE rules. The 2D models were meshed by ICEM and then imported into thesolver FLUENT. As far as the turbulence models are concerned, the k SST viscous model is suitable
for the wing models, because it provides reasonable solution for vortex wake flow simulation.Comparing all the results, instead of two flap design, the proposal of main wing with a single flap wasadopted in the final design of front and rear wings in order to reduce the weight. The final profiles offront and rear wings, which eliminated the designs with stall condition and balanced the down forceand drag force, are shown as figure 11.
(a)
(b)
Fig. 11: (a) The front wing profiles and the air velocity distribution, (b) The front wing profiles and theair velocity distribution.
Computer-Aided Design & Applications, PACE (1), 2011, 47-65© 2011 CAD Solutions, LLC, http://www.cadanda.com
60
7.2 Attack Angle Design
Several combinations of attack angles of main wing and flap were tested to find out the best one ([7]).Some of the results can be seen in the Table 4. The results also demonstrated that the down forcewould reach the peak only at a certain combination of main wing and flap attack angles, and the bestcombination of angles was 15deg/50deg for front wings and 10deg/45deg for rear wings.
Tab. 4: (a) The results of angle combination for front wings, (b) The results of angle combination forrear wings.
7.3 Full Car CFD Analysis
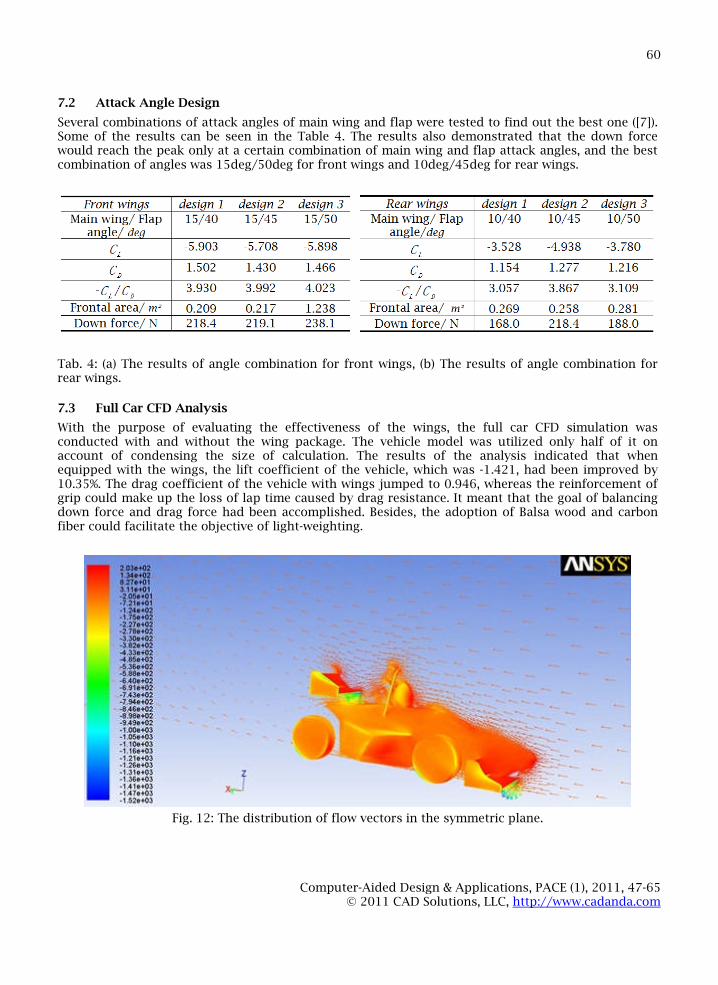
With the purpose of evaluating the effectiveness of the wings, the full car CFD simulation wasconducted with and without the wing package. The vehicle model was utilized only half of it onaccount of condensing the size of calculation. The results of the analysis indicated that whenequipped with the wings, the lift coefficient of the vehicle, which was -1.421, had been improved by10.35%. The drag coefficient of the vehicle with wings jumped to 0.946, whereas the reinforcement ofgrip could make up the loss of lap time caused by drag resistance. It meant that the goal of balancingdown force and drag force had been accomplished. Besides, the adoption of Balsa wood and carbonfiber could facilitate the objective of light-weighting.
Fig. 12: The distribution of flow vectors in the symmetric plane.
Computer-Aided Design & Applications, PACE (1), 2011, 47-65© 2011 CAD Solutions, LLC, http://www.cadanda.com
61
8 MULTI-BODY ANALYSIS
Suspension guarantees the flexible connection between car body and wheels. In racecar design,suspension also needs to limit the change of wheel positioning parameters to the minimum extent andincrease handling stability when the car is cornering at high speed ([8]). Adams-car is an effective toolto simulate the dynamic performance of a suspension and the overall vehicle. In summary, Adamsfacilitates suspension designing and modification in the following aspects: preliminary design of suspension geometry front and rear roll center design hard-point modification steering characteristic simulation
8.1 Suspension Modeling and Simulation
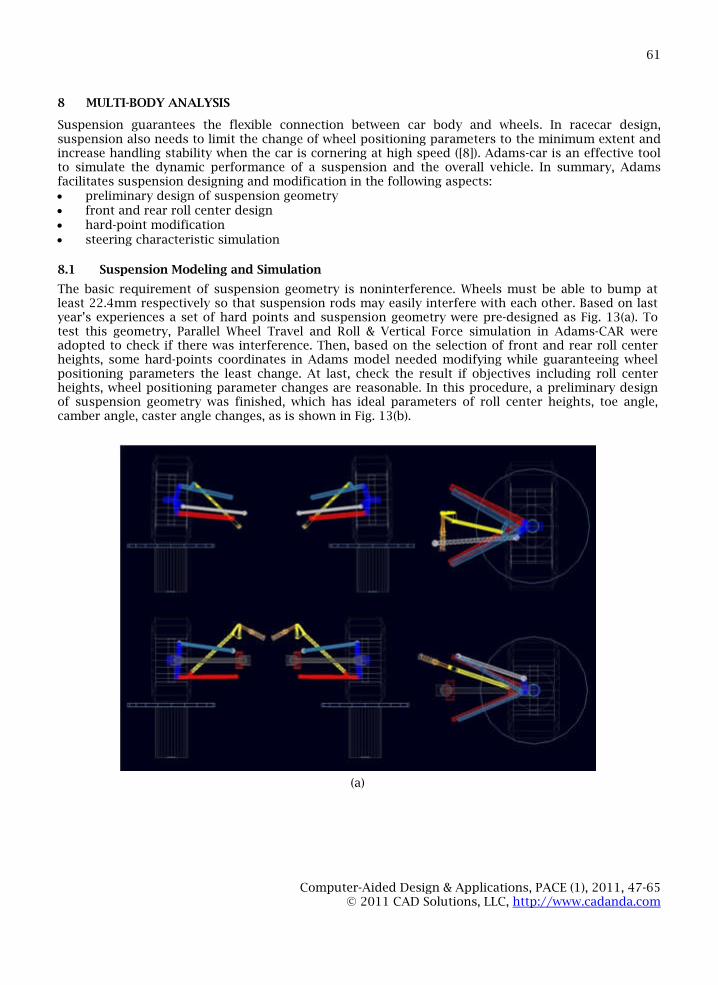
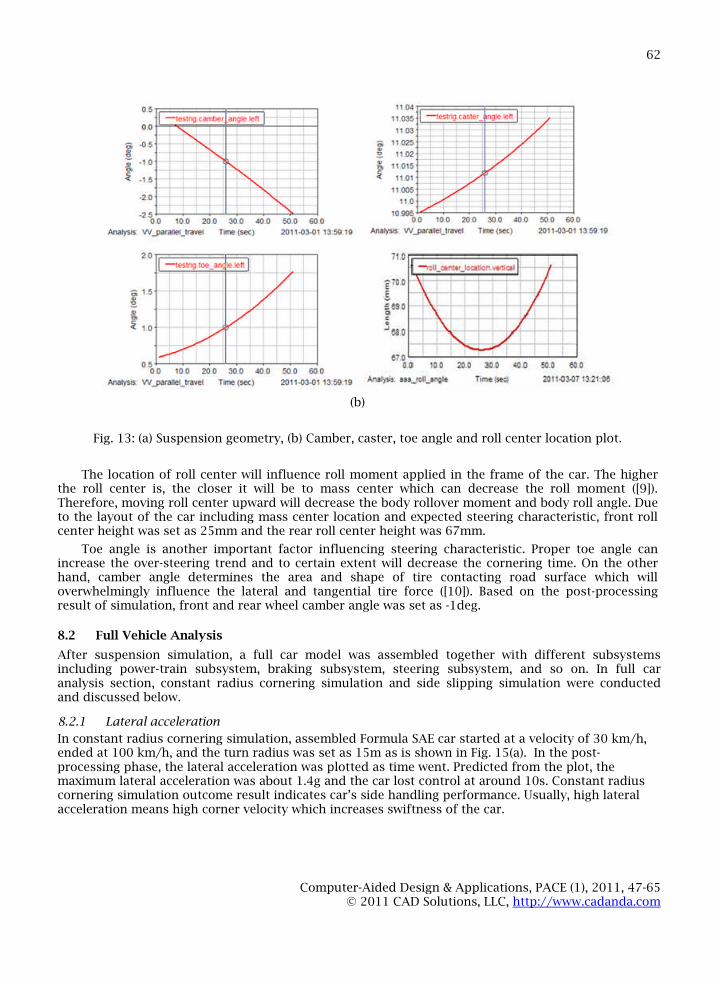
The basic requirement of suspension geometry is noninterference. Wheels must be able to bump atleast 22.4mm respectively so that suspension rods may easily interfere with each other. Based on lastyear’s experiences a set of hard points and suspension geometry were pre-designed as Fig. 13(a). Totest this geometry, Parallel Wheel Travel and Roll & Vertical Force simulation in Adams-CAR wereadopted to check if there was interference. Then, based on the selection of front and rear roll centerheights, some hard-points coordinates in Adams model needed modifying while guaranteeing wheelpositioning parameters the least change. At last, check the result if objectives including roll centerheights, wheel positioning parameter changes are reasonable. In this procedure, a preliminary designof suspension geometry was finished, which has ideal parameters of roll center heights, toe angle,camber angle, caster angle changes, as is shown in Fig. 13(b).
(a)
Computer-Aided Design & Applications, PACE (1), 2011, 47-65© 2011 CAD Solutions, LLC, http://www.cadanda.com
62
(b)
Fig. 13: (a) Suspension geometry, (b) Camber, caster, toe angle and roll center location plot.
The location of roll center will influence roll moment applied in the frame of the car. The higherthe roll center is, the closer it will be to mass center which can decrease the roll moment ([9]).Therefore, moving roll center upward will decrease the body rollover moment and body roll angle. Dueto the layout of the car including mass center location and expected steering characteristic, front rollcenter height was set as 25mm and the rear roll center height was 67mm.
Toe angle is another important factor influencing steering characteristic. Proper toe angle canincrease the over-steering trend and to certain extent will decrease the cornering time. On the otherhand, camber angle determines the area and shape of tire contacting road surface which willoverwhelmingly influence the lateral and tangential tire force ([10]). Based on the post-processingresult of simulation, front and rear wheel camber angle was set as -1deg.
8.2 Full Vehicle Analysis
After suspension simulation, a full car model was assembled together with different subsystemsincluding power-train subsystem, braking subsystem, steering subsystem, and so on. In full caranalysis section, constant radius cornering simulation and side slipping simulation were conductedand discussed below.
8.2.1 Lateral acceleration
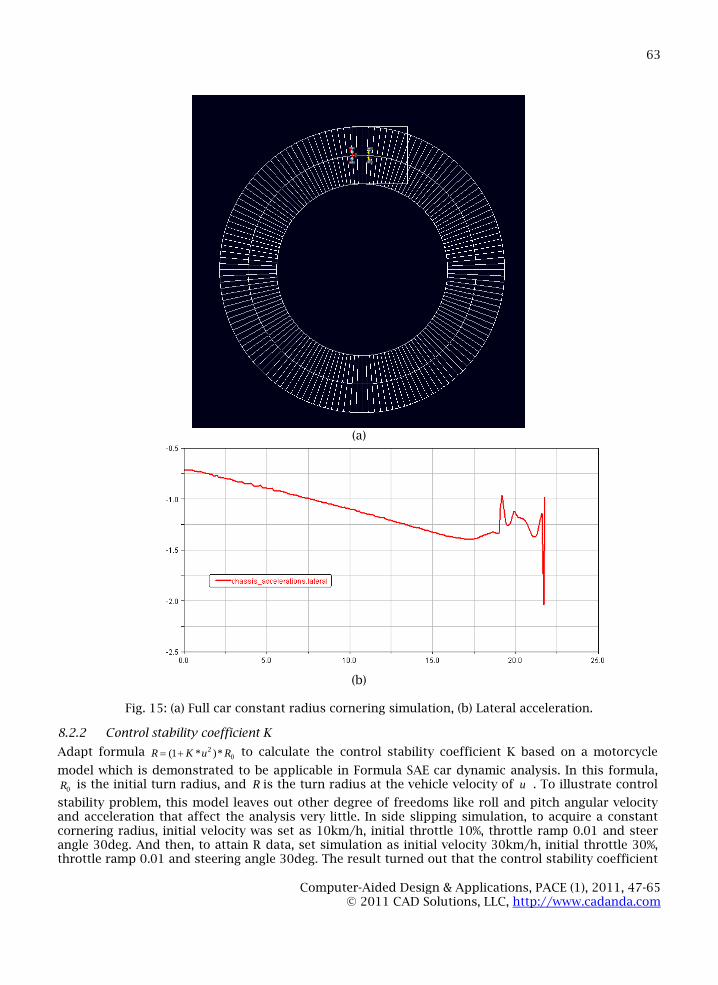
In constant radius cornering simulation, assembled Formula SAE car started at a velocity of 30 km/h,ended at 100 km/h, and the turn radius was set as 15m as is shown in Fig. 15(a). In the post-processing phase, the lateral acceleration was plotted as time went. Predicted from the plot, themaximum lateral acceleration was about 1.4g and the car lost control at around 10s. Constant radiuscornering simulation outcome result indicates car’s side handling performance. Usually, high lateralacceleration means high corner velocity which increases swiftness of the car.
Computer-Aided Design & Applications, PACE (1), 2011, 47-65© 2011 CAD Solutions, LLC, http://www.cadanda.com
63
(a)
(b)
Fig. 15: (a) Full car constant radius cornering simulation, (b) Lateral acceleration.
8.2.2 Control stability coefficient K
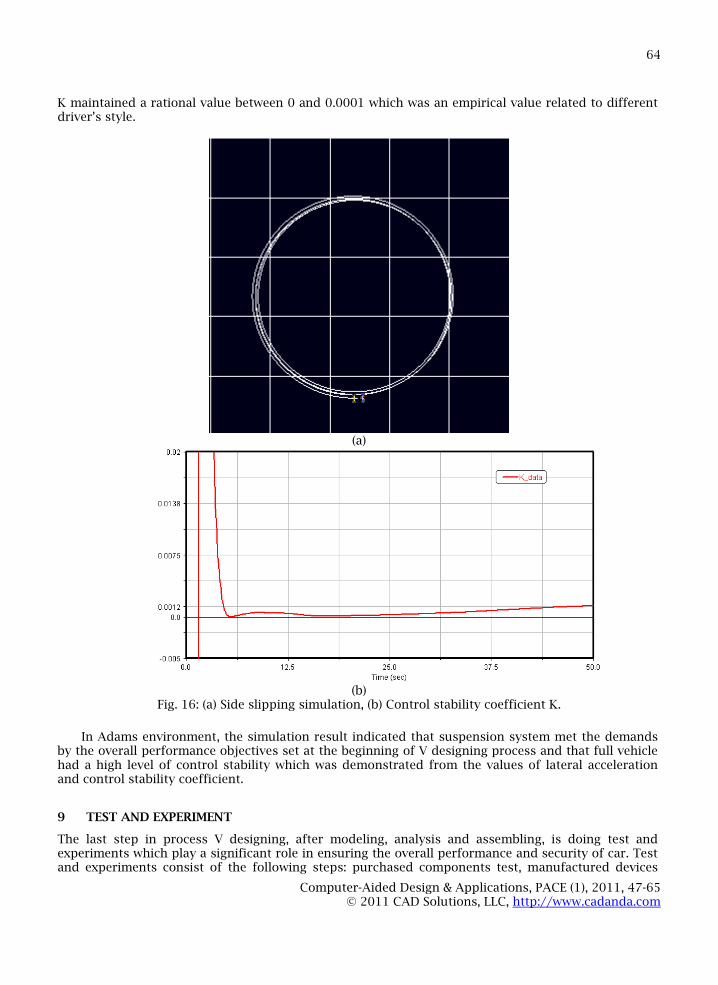
Adapt formula R (1K *u2 )* R0 to calculate the control stability coefficient K based on a motorcycle
model which is demonstrated to be applicable in Formula SAE car dynamic analysis. In this formula,R0 is the initial turn radius, and R is the turn radius at the vehicle velocity of u . To illustrate control
stability problem, this model leaves out other degree of freedoms like roll and pitch angular velocityand acceleration that affect the analysis very little. In side slipping simulation, to acquire a constantcornering radius, initial velocity was set as 10km/h, initial throttle 10%, throttle ramp 0.01 and steerangle 30deg. And then, to attain R data, set simulation as initial velocity 30km/h, initial throttle 30%,throttle ramp 0.01 and steering angle 30deg. The result turned out that the control stability coefficient
Computer-Aided Design & Applications, PACE (1), 2011, 47-65© 2011 CAD Solutions, LLC, http://www.cadanda.com
64
K maintained a rational value between 0 and 0.0001 which was an empirical value related to differentdriver’s style.
(a)
(b)Fig. 16: (a) Side slipping simulation, (b) Control stability coefficient K.
In Adams environment, the simulation result indicated that suspension system met the demandsby the overall performance objectives set at the beginning of V designing process and that full vehiclehad a high level of control stability which was demonstrated from the values of lateral accelerationand control stability coefficient.
9 TEST AND EXPERIMENT
The last step in process V designing, after modeling, analysis and assembling, is doing test andexperiments which play a significant role in ensuring the overall performance and security of car. Testand experiments consist of the following steps: purchased components test, manufactured devices
Computer-Aided Design & Applications, PACE (1), 2011, 47-65© 2011 CAD Solutions, LLC, http://www.cadanda.com
65
and components on-road test, Connection and fastening devices durability test, Electronics and wirescheck. In vehicle road-test, quite a lot of practical problems will be overcome and new technicalsolutions will be found.
10 CONCLUSION
The combination of V designing and CAD software facilitates the designing process and gives aclairvoyant procedures of design objectives. As for the first-year or second-year Formula SAE car, thismethodology saved R&D time and cost about 30% which could be used to do delicate refinements inthe later phases. Furthermore, the rational sequence set by V designing process to adopt CAD softwareincreased the accuracy of calculation and guarantees products’ quality. In the field of automobileindustry, V designing methodology has the potentiality to be widely used, which will in turn promoteits use in other industries.
REFERENCES
[1] Mathur, S.; Malik, S.: Advancements in the V-model, International Journal of ComputerApplications, 1 (12), 2010.
[2] Riordan, C.; Tovar, A.; Renaud, J.: Topology Optimization of a Formula SAE Upright UsingOptiStruct, SAE Paper 2010 - 01 - 0396.
[3] Cengel, Y. A.; Boles, M. A.: Thermodynamics An Engineering Approach, 5th Edition, McGraw-HillScience/Engineering/Math, 2005.
[4] Park, K. A.; Choi, Y. M.; Choi, H. M. et al: The Evaluation of Critical Pressure Ratios of SonicNozzles at Low Reynolds Numbers, Flow Measurement and Instrumentation, 2 (1), 2001, 37-41,DOI:10.1016/S0955-5986(00)00040-6.
[5] Porter, M. A.: Intake Manifold Design using Computational Fluid Dynamics, The UNSW@ADFAJournal of Undergraduate Engineering Research, 1 (2), 2008.
[6] Riley, W. B.; George, A. R.: Design, Analysis and Testing of a Formula SAE Car Chassis, SAE Paper2002 -01 - 3300.
[7] Wordley, S.; Saunders, J.: Aerodynamics for Formula SAE: A Numerical, Wind Tunnel and On-Track Study, SAE Paper 2006 - 01 – 0808.
[8] Smith, C.: Tune to Win, Aero Publishers, Inc., Fallbrook, California, 1985.[9] Milliken, W. F.; Milliken, D. L.: Race Car Vehicle Dynamics, Society of Automotive Engineers, Inc.,
Warrendale, Pennsylvania, 1995.[10] Chang, I.; Kim, N.; Lee, D.; Cha, S. W.: Designing and manufacturing of Formula SAE-Hybrid
racecar for a new engineering education program, Vehicle Power and Propulsion Conference, IEEE,2010.