Embed Size (px)
Citation preview
Innovation Intelligence®
CAE Simulation Catalyzes Composites Growth:
Material Characterization
Modeling
Optimization
Giuseppe Resta
September 11-13, 2013
2013 SPE Automotive Composites
Conference & Exhibition (ACCE)

Intro: CAE Catalyzes Composites Growth in Automotive
• FEA established part of vehicle design process
• OEMs have developed simulation processes to meet Crash, NVH,
Durability, Vehicle Dynamic and Aerodynamic requirements
• CAE brings confidence to engineers and management comfortable with
CAE deliverables for traditional designs
Composite integration in existing automotive infostructure
also means integration in CAE processes

Agenda:
1. CAE for Material Characterization and Composite Failure
2. Stiffness and Strength Requirements
3. Composite CAE Process Overview
4. Laminate Composite Optimization

Innovation Intelligence®
Material Characterization and
Composite Failure

Material Knowledge as Composite Design Foundation
• Material performance and repeatability influenced by supplier and final
manufacturing process
• Role of complex shapes in composite variability
• Higher safety factor is not the answer:
• Predictability during crash may be compromised
• Overdesigned parts defies the initial selection of CF
• More expensive testing than metals > change material less frequently
Classic crash for axisymmetric tube as example
of limited shapes analyzed Dallara: Nose box Crash Simulation with modified
Tsai-Wu model for composites in RADIOSS

Material Characterization & Simulation: Building Block
• Tests and simulations at coupon, element and subcomponent levels
• Properties of materials derived from robust testing strategies and CAE
• Limit number of laminate configurations for coupon tests at the end of envelope
• Perform CAE calibration to cover additional condition and\or shapes for increased
confidence in composites material characterization
• Address the issues of variability, environment conditions, structural discontinuity,
damage, manufacturing defects, design or process-specific details
Building block approach: from coupon to full vehicle models

Material Characterization & Simulation: Micromechanics
• Calculate the homogenized engineering constants of a ply given the
engineering constants for each individual constituent making up the ply
• Calculate the constituent mechanical stress and strain tensors given the
homogenized mechanical strain tensor of the ply and the engineering
constants for each constituent of the ply
• Material and failure modeling
),,,,,,,,( 12231221mmmffffff
ijij VEVGEESS
),,,,,,( 211mmmffff
ii VEVE
Altair Partner Alliance offering in Micromechanics

Material Characterization & Simulation: Optimization
• Material calibration performed using optimization techniques:
• Select as design variables key material parameters
• Run design of experiments (DoE) :
1. understand the relations between responses and design variables.
2. screen the design variables that do not have significant effect on the responses
• Mathematical techniques used to minimize difference between sets of data for
efficient solution finding:
1. minimize the sum of normalized-difference-squared
2. calculating the area between two curves
• System identification to set target values to a number of responses and
automatically creates the difference equation and uses it as the objective function

Material Characterization & Simulation: Failure Modeling
• Composite failure models at the macroscopic level traditionally have
been empirically curve-fit models
• Seeking to curve-fit an assumed interaction equation given empirical
single state failure values
• Composite Failure Modes
• Excessive linear elastic deflection
• Instability or buckling
• Creep
• Fatigue
• Matrix crazing and/or shear yielding (onset of failure in the matrix)
• Fiber fracture (onset of failure in the fiber)
• Transverse ply fracture (creation of new surfaces within a ply)
• Ply delamination (creation of new surfaces between plies)
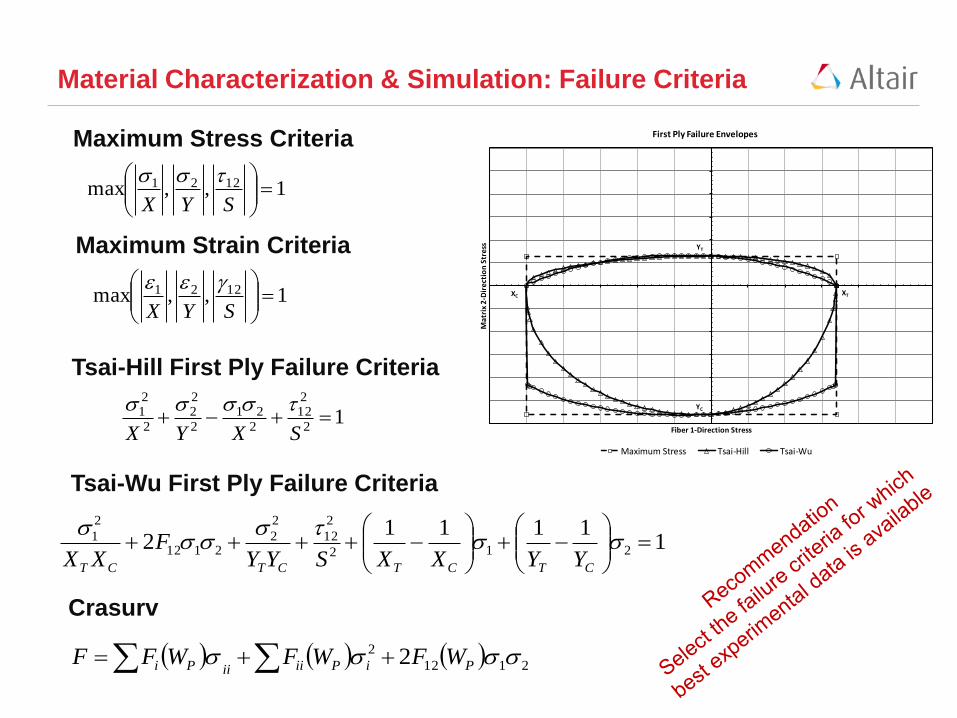
Material Characterization & Simulation: Failure Criteria
1,,max 1221
SYX
Maximum Stress Criteria
Maximum Strain Criteria
1,,max 1221
SYX
12
212
2
21
2
22
2
21
SXYX
Tsai-Hill First Ply Failure Criteria
Tsai-Wu First Ply Failure Criteria
2112
2 2 PiPiiiiPi WFWFWFF
11111
2 212
2
12
2
22112
2
1
CTCTCTCT YYXXSYYF
XX
Mat
rix
2-D
irec
tio
n S
tres
s
Fiber 1-Direction Stress
First Ply Failure Envelopes
Maximum Stress Tsai-Hill Tsai-Wu
XT
YT
XC
YC
Crasurv
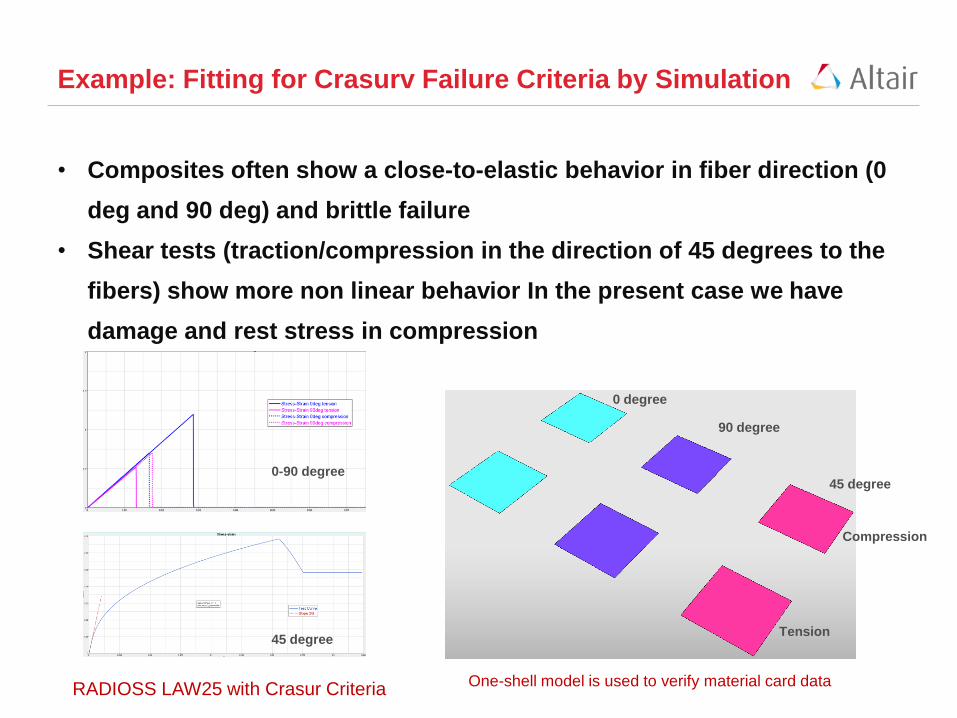
Example: Fitting for Crasurv Failure Criteria by Simulation
• Composites often show a close-to-elastic behavior in fiber direction (0
deg and 90 deg) and brittle failure
• Shear tests (traction/compression in the direction of 45 degrees to the
fibers) show more non linear behavior In the present case we have
damage and rest stress in compression
One-shell model is used to verify material card data
0 degree
90 degree
45 degree
Tension
Compression
0-90 degree
45 degree
RADIOSS LAW25 with Crasur Criteria

• The parameters b and n in Crasurv criteria determined by curve fitting
Example: Fitting for Crasurv Criteria Through Simulation

Innovation Intelligence®
Stiffness and Strength
Requirements

Balancing Stiffness and Crash Requirements
• Stiffness mainly related to ride and handling performance
• Most body structure requirements are stiffness and fatigue dominated
• Strength dominant regions benefit from high specific strength
(side\roof impact)
• Energy management also require high level of elongation (front\rear
crash)
Typical weight involved for crash and stiffness
BIW
322 Kg
CRASH
191 Kg
STIFFNESS
199 Kg
96
95
104
27
Vehicle regions have different requirements
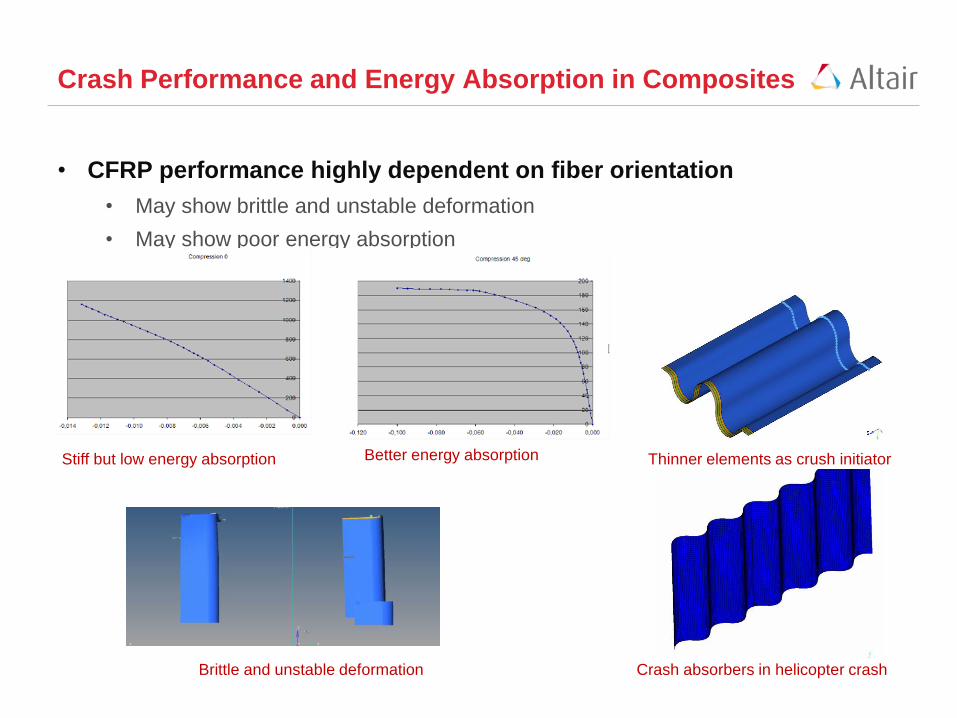
Crash Performance and Energy Absorption in Composites
• CFRP performance highly dependent on fiber orientation
• May show brittle and unstable deformation
• May show poor energy absorption
Brittle and unstable deformation
Stiff but low energy absorption Better energy absorption
Crash absorbers in helicopter crash
Thinner elements as crush initiator

Innovation Intelligence®
Composite CAE Process Overview

Pre Processing Zone or Ply Based Composites Modeling
Visualizations Visually Verify the Math Model
Optimization Composites
Design Optimization & Analysis
Post Processing Composites
Post-Processing & Failure Analysis
Typical CAE Process for Laminate Composites
Solution Export Ply Based Models to
Solver Zone Based Models
Detailed Composite Material
Modeling & Structural Modeling
CAD Manufacturing Interoperability

Typical CAE Modeling Process for Laminate Composites
• Import ply shape (geometric shape, lines) and ply data
(name, thickness, material, relative angles) Import CAD model
• Import existing mesh or create mesh Import/Create mesh
• Realize geometric shapes to FE ply shapes Geometric ply shape
realization
• Contains additional FE required for design/analysis but not required for manufacturing/documentation Template properties
• Defines the stacking sequence direction and the reference material orientation
Stack & Material orientation
• Visually verify math model via 3D visualizations (Ply shapes/orientation/thickness, Stacking sequence) Review & Modify
• Conversion of ply to zone based modeling Ply based model
realization
• Export to any supported solver Export & Solve

Pre-Processing: Composite Modeling Visualization
3D Representation of Traditional 1D & 2D Representations
Visually Verify Engineering Data Associated with a Math Model
3D Representation
Traditional 1D & 2D
Representation
3D Representation with
Composite Layers

Pre-Processing: Plies and Laminate
• Generic modeling approach
• Continuum Shells
• Visualization of elemental thickness against ply thickness as reference
• Review and adjust stacking direction
• 3D ply and ply angle visualization
• By thickness difference’ visualization mode
• Ply to zone based model realization
• Automatic property creation
• Conversion of ply based into zone based model
Normal/Stack direction
review 3D representation of plies
Review of ply angles
Ply based model
Creation of equivalent zone properties
Realize
Laminate

Pre-Processing: Composite Zone-Based Modeling
P1 45
P2 90
P3 -45
P4 0
Zone 1 Zone 2 Zone 3 Zone 2 Zone 1
P5 -45
P6 90
P7 45
Zone 1 – Property Table
Ply Mat Thk Theta
P7 M1 0.01 45
P4 M1 0.01 0
P1 M1 0.01 45
Zone 2 – Property Table
Ply Mat Thk Theta
P7 M1 0.01 45
P5 M1 0.01 -45
P4 M1 0.01 0
P3 M1 0.01 -45
P1 M1 0.01 45
Zone 3 – Property Table
Ply Mat Thk Theta
P7 M1 0.01 45
P6 M1 0.01 90
P5 M1 0.01 -45
P4 M1 0.01 0
P3 M1 0.01 -45
P2 M1 0.01 90
P1 M1 0.01 45
Zone 1
Zone 2
Zone 3
• One property is required for each laminate zone
• Plies are not linked across zones
• Data Duplication
• No Ply Shape
• No Relationship to the Mfg Process
• Design update requires 3 updates

• A composite part is made up of one laminate with multiple plies
• no data duplication
• direct relationship to the manufacturing process
• Ply based modeling process
• define ply shapes and related ply data
• define stacking sequence
• design update requires only 1 update
Pre-Processing: Composite Ply Based Modeling
P1 45
P2 90
P3 -45
P4 0
P6 90
P7 45
P5 -45
Stack Table
Ply Mat Thk Theta
P7 M1 0.01 45
P6 M1 0.01 90
P5 M1 0.01 -45
P4 M1 0.01 0
P3 M1 0.01 -45
P2 M1 0.01 90
P1 M1 0.01 45

Post-Processing: User Defined Failure Criteria
• User Defined Results Utilizing
• Existing Results
• Model Data
• External Tables
• Tcl/Tk or XML Scripts
• Example Onset Theory
Onset of failure occurs due to either dilatation
(change in volume - J1) or distortion (change in
shape - vm) exceeding critical material values
(J1cr, vm
cr)
J1 = 1+3 = x+y
J1/ J1cr < 1.0
vm = sqrt(12+3
2)/2.0
vm /vmcr < 1.0
Result Math applications in post processing

Innovation Intelligence®
Laminate Composite Optimization

Optimization in Composite Design
• Optimization as engineers’ best strategy to design laminate composite
structures and choose the right selection of laminate ply thickness,
orientation, and stacking
• Unless an optimized-based design is followed, the results will be a
composite part often overdesigned with redundant material, which adds
cost and weight
• Optimization injects innovation, urges thinking differently about design,
get the right answer faster, gives more insight into the design behavior
and manages conflicts

Laminate Composites Optimization in Optistruct
1. Free-Size Optimization (Concept) : used to generate design concepts,
while only considering global responses and optional manufacturing
constraints. “What ply shapes, for each ply layer, would build up the most
efficient composite part?”
2. Size Optimization (Dimension) : performed to control the thickness of each
ply bundle, while considering all design responses and optional
manufacturing constraints. “Exactly how many plies of each ply shape are
required to satisfy strength and manufacturing engineering requirements?”
3. Shuffling Optimization (Sequence) : optimization is applied to determine
the detailed stacking sequence, again while considering all behavior
responses and manufacturing constraints. “What are possible stacking
sequences that satisfy final part manufacturing requirements?”
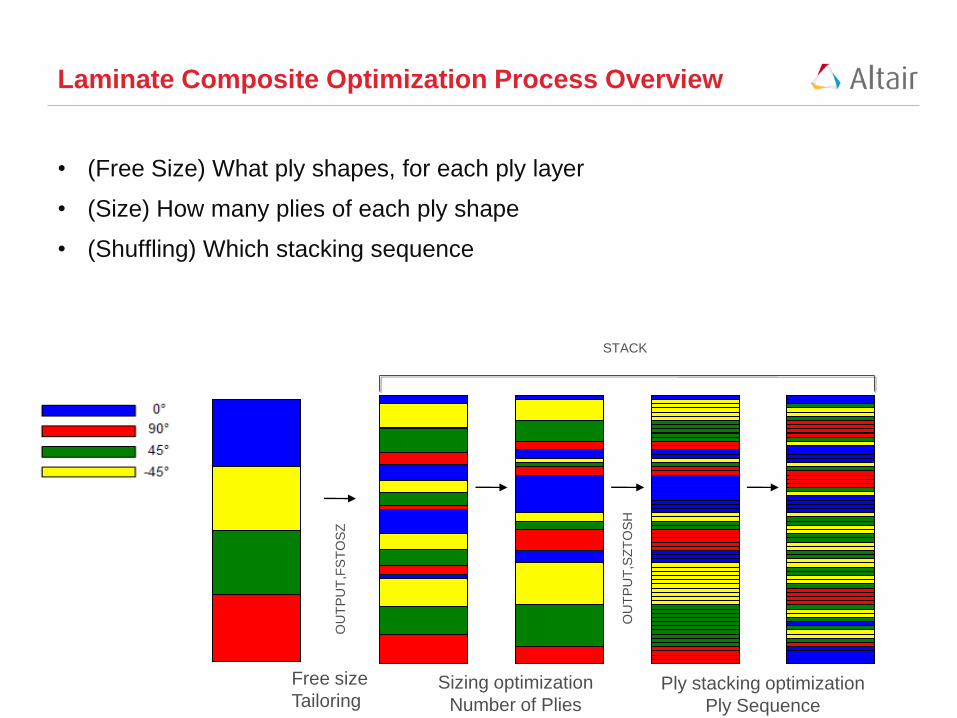
Laminate Composite Optimization Process Overview
• (Free Size) What ply shapes, for each ply layer
• (Size) How many plies of each ply shape
• (Shuffling) Which stacking sequence
STACK
Sizing optimization
Number of Plies
Ply stacking optimization
Ply Sequence
OU
TP
UT
,FS
TO
SZ
OU
TP
UT
,SZ
TO
SH
Free size
Tailoring

Phase I: Composite Free-Size Optimization
• Typical setup
• Objective such as maximize stiffness (minimize compliance)
• Design constraint such as minimize volume fraction
• Design concept stage applied to super plies of nominal thickness
• At this stage of the process the shape of the part is already known
• The thickness for each element of each “super ply” with a particular fiber
orientation varies continuously to achieve the optimal composition of the
composite laminate at every point (element)
T = Ply3 (opti) 90
T = Ply2 (opti) -45 T = Ply4 (nom) 45
PCOMP
sym
T = Lower T = Upper
T = Ply3 (nom) 90
T = Ply2 (nom) -45
T = Ply1 (nom) 0
T = Ply4 (opti) 45
PCOMP
sym
T = Ply1 (opti) 0 T_0
T_Total
After Optimization

Phase I: Free-Size Optimization Interpretation
• Phase-I output contains the composite free-size optimization thickness results which
can be contour plotted to facilitate interpretations of the resulting optimized ply shapes.

Phase I: Free-Size Optimization Results Interpretation
• Automatic extraction of plies from free-sizing optimization
• User defined number of ply bundles per ply orientation
• Tune manufacturing complexity
• Automatic\Manual Ply Shape Interpretation

Phase II: Composite Ply Bundle Size Optimization
• Size optimization modifies a function of key input parameters controlling the
behavior of structural FE such as shell thickness, cross-sectional properties,
and stiffness:
• Free Size to Size automation generates plies for sizing and automatically
defines design variables and design variable property relationships for the
thickness of each ply shape resulting from the composite free-size
optimization. Manufacturing constraints are carried over from the Free Sizing
Phase automatically
• All behavior constraints (failure, displacement, buckling etc.) need to be
added
• Ensure manufacturing thickness is defined for each ply so that discrete ply
thicknesses is selected during the composite size optimization

Phase II: Bundle Sizing with Ply-Based FEA Modeling
• Composite Size Optimization determines number of plies of each ply
shape required to satisfy strength and manufacturing engineering
requirements
• Typical setup
• Design constrain like minimize displacement, strain less than.. no stress failure
• Objective such as minimize mass
Sizing optimization
Ply stacking optimization
OU
TP
UT
,FS
TO
SZ
OU
TP
UT
,SZ
TO
SH
Free size

ABD Matrix and Smear Technology
• Classic Lamination Theory:
• The [A] matrix relates plate resultant forces to middle surface strains defining the
extensional behavior of a laminate.
• The [B] matrix relates plate resultant forces to middle surface curvatures and plate
resultant moments to middle surface strains.
• The [D] matrix relates plate resultant moments to middle surface curvatures
defining the bending behavior of a laminate
• SMEAR technology is used to calculate a stacking sequence independent ABD
matrix for a laminated plate, by utilizing the homogeneous plate [B] and [D]
matrix equations with the laminated plate [A] matrix.
xt
t
x
o
xM
N
DB
BA
M
N
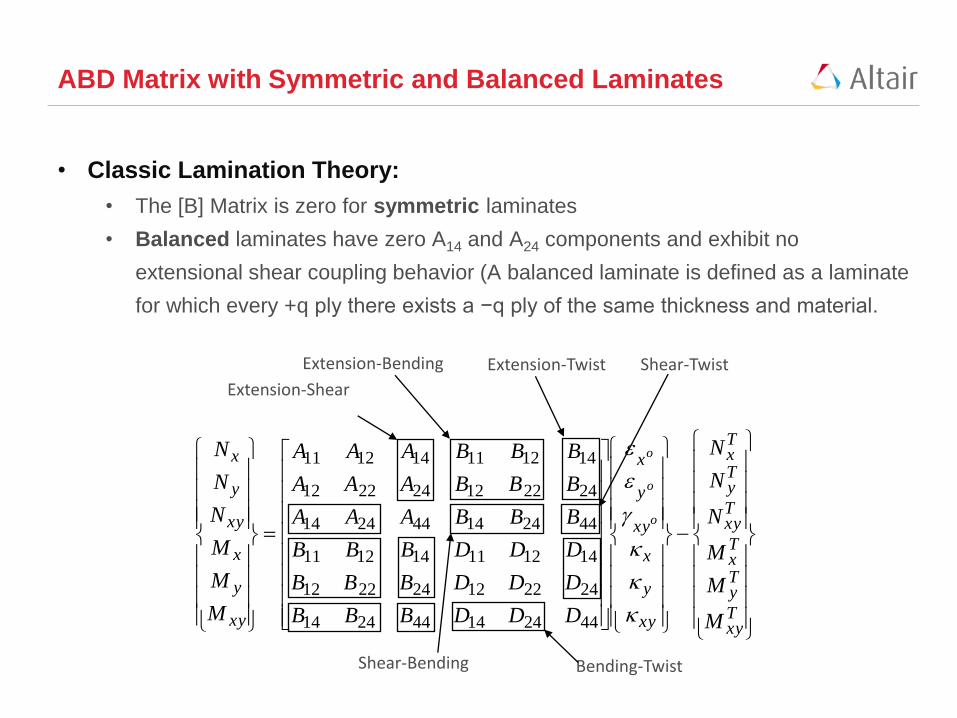
ABD Matrix with Symmetric and Balanced Laminates
• Classic Lamination Theory:
• The [B] Matrix is zero for symmetric laminates
• Balanced laminates have zero A14 and A24 components and exhibit no
extensional shear coupling behavior (A balanced laminate is defined as a laminate
for which every +q ply there exists a −q ply of the same thickness and material.
Txy
Ty
Tx
Txy
Ty
Tx
xy
y
x
xy
y
x
xy
y
x
xy
y
x
M
M
M
N
N
N
DDDBBB
DDDBBB
DDDBBB
BBBAAA
BBBAAA
BBBAAA
M
M
M
N
N
N
o
o
o
442414442414
242212242212
141211141211
442414442414
242212242212
141211141211
Extension-Shear
Extension-Bending Extension-Twist Shear-Twist
Bending-Twist Shear-Bending

Phase III: Composite Stacking Optimization
• Stacking optimization determines optimal stacking sequence for given
design optimization problem while also satisfying additional
manufacturing constraint
• Meet ply book rules, all behavior constraints, stacking manufacturing constraints
Sizing optimization
Ply stacking optimization
OU
TP
UT
,FS
TO
SZ
OU
TP
UT
,SZ
TO
SH
Free size

Conclusions:
• Prediction and validation of composites with CAE brings confidence to
the automotive industry comfortable with its deliverables for traditional
designs
• Material knowledge is at the foundation of composite design. Simulation
enables a more robust material characterization
• Extensive software offering now support the complete composite
design process
• Optimization as engineers’ best strategy to design laminate composite
efficiently