Embed Size (px)
Citation preview

CAEM – Competitive Energy Markets
Optimal Provision of New Electric Load
Thomas R. Casten
Chairman & CEOPrimary Energy, LLC
Scott Tinker, DirectorBureau of Economic GeologyAugust 4, 2003

SummarySummary Successful organizations agree on goals and mission, then Successful organizations agree on goals and mission, then
concentrate on tactics.concentrate on tactics.
Start by understanding the environment. Start by understanding the environment. Rising electric rates, rising fuel costs, concerns about excessive Rising electric rates, rising fuel costs, concerns about excessive
fossil fuel use and global warming, manufacturing job loss, and fossil fuel use and global warming, manufacturing job loss, and fear for our way of life.fear for our way of life.
Expect journalists and politicians to fix blame.Expect journalists and politicians to fix blame.
Figure out how to fix the problemFigure out how to fix the problem Determine consensus goalsDetermine consensus goals Identify opportunities to advance goalsIdentify opportunities to advance goals Quantify the problem and opportunityQuantify the problem and opportunity
Articulate a clear, elegant, missionArticulate a clear, elegant, mission

Three Key Power System GoalsThree Key Power System Goals
Availability of Energy ServicesAvailability of Energy Services
Availability of Energy ServicesAvailability of Energy Services
Availability of Energy ServicesAvailability of Energy Services

Subordinate Power System Subordinate Power System GoalsGoals
Limit capital expenditureLimit capital expenditure Reduce rates Reduce rates Reduce fossil fuel useReduce fossil fuel use Reduce pollutionReduce pollution Reduce global warmingReduce global warming Reduce system vulnerabilityReduce system vulnerability Reduce manufacturing job lossReduce manufacturing job loss

What is the Problem?What is the Problem?Is it the conventional wisdom?Is it the conventional wisdom?
Large generation has economies of Large generation has economies of scalescale
All power will flow through wiresAll power will flow through wires
(New) ‘Technology is the Ticket’ (New) ‘Technology is the Ticket’ President Bush, May 2005President Bush, May 2005
Free markets cannot provide the Free markets cannot provide the world’s most second most important world’s most second most important service (Beer is first)service (Beer is first)

Assess the Power SystemAssess the Power System Did power industry chose optimal Did power industry chose optimal
approaches in the past?approaches in the past?
What is best way to meet expected US and What is best way to meet expected US and world load growth?world load growth?
What are the effects of 100 years of What are the effects of 100 years of monopoly protection of electric monopoly protection of electric distribution?distribution?
Compare options for meeting expected load Compare options for meeting expected load growth growth

Conventional Central GenerationConventional Central Generation
Pollution
Fuel
100 units
Power Plant
=
67 units Waste Energy
33 units ElectricityEnd User
Waste Heat
Transmission Line Losses 3 units (9%)

Combined Heat and PowerCombined Heat and Power
Pollution
Waste Heat
Recovery
CHP Plant
End User Site
33 units Waste Energy
=66 units Useful Work 33 units
Electricity
33 units Thermal Energy
Fuel
100 units

Capital Costs per Kilowatt, Central Capital Costs per Kilowatt, Central versus Decentralized Generationversus Decentralized Generation
Transmission Transmission & &
DistributionDistribution
$1380$1380
$138$138
$1,242$1,242
90%90%
GenerationGeneration
Conventional Conventional Central Central
GenerationGeneration$890$890
Decentralized Decentralized GenerationGeneration
$1,200$1,200
Savings (Loss) Savings (Loss) of Local vs of Local vs
Central Central GenerationGeneration
($310)($310)
% of Central % of Central GenerationGeneration
(34%)(34%)
Total / kW Total / kW of of
GenerationGeneration
$2,270$2,270
$1,338$1,338
$1,068$1,068
47%47%
KW KW required/ required/ kW LoadkW Load
1.521.52
1.071.07
0.470.47
Total Total costs/ kW costs/ kW
New New LoadLoad
$3,450$3,450
$1,432$1,432
$2,018$2,018
59%59%

Central Generation Paradigm Central Generation Paradigm Blinds Society to Cheapest, Blinds Society to Cheapest,
Cleanest Option:Cleanest Option:
Recycling Industrial EnergyRecycling Industrial Energy

Defining Recycled EnergyDefining Recycled Energy Recycled energy is useful energy Recycled energy is useful energy
derived from derived from Exhaust heat from any industrial process; Exhaust heat from any industrial process; Industrial tail gas that would otherwise be Industrial tail gas that would otherwise be
flared, incinerated or vented; and flared, incinerated or vented; and Pressure drop in any gas Pressure drop in any gas

Conventional Industrial SiteConventional Industrial Site
Process Fuel
Electricity Finished Goods
End User Site
Waste Energy

Recycled EnergyRecycled Energy
ElectricitySteam
Hot Water
End User Site
Energy Recycling
Plant
Electricity
Process Fuel
Finished Goods
Waste Energy
SavedEnergy Input

US Industrial Recycling PotentialUS Industrial Recycling Potential Recycled energy could supply 45 to 92 Recycled energy could supply 45 to 92
Gigawatts of fuel-free capacity – 13% of US peakGigawatts of fuel-free capacity – 13% of US peak
Recycled energy is as clean as renewable Recycled energy is as clean as renewable energy – no incremental fuel or emissions, but:energy – no incremental fuel or emissions, but:
Capital costs are $500 to 1,500/kW, only 12% to 40% of Capital costs are $500 to 1,500/kW, only 12% to 40% of solar and wind generation, solar and wind generation,
90% load factors versus 14-40% for solar & wind90% load factors versus 14-40% for solar & wind Recycled energy is both clean and economic option Recycled energy is both clean and economic option
for new power generation.for new power generation.
EIA shows only 2.2 Gigawatts operatingEIA shows only 2.2 Gigawatts operating

Recycled Energy Case Study: Recycled Energy Case Study: Primary EnergyPrimary Energy
NiSource invested $300 million in six projects to NiSource invested $300 million in six projects to recycle blast furnace gas, coke oven exhaust in recycle blast furnace gas, coke oven exhaust in four steel plants, 440 megawatts of electric four steel plants, 440 megawatts of electric capacity and 460 megawatts of steam capacity. capacity and 460 megawatts of steam capacity.
Steel mills save over $100 million per year and Steel mills save over $100 million per year and avoid significant air pollution avoid significant air pollution
The COThe CO22 reduction is equivalent to the uptake of one reduction is equivalent to the uptake of one
million acres of new trees.million acres of new trees.
The projects are profitable; were recently sold for The projects are profitable; were recently sold for $335 million to our firm $335 million to our firm

90 MW Recycled from Coke Production90 MW Recycled from Coke ProductionChicago in BackgroundChicago in Background

Has US Power Industry Made Has US Power Industry Made Optimal Decisions? Optimal Decisions?
We analyzed major power generation We analyzed major power generation technologies over 1988-2002 periodtechnologies over 1988-2002 period
Central generation needs new T&D, DG Central generation needs new T&D, DG needs 10% or less new T&D wires.needs 10% or less new T&D wires.
Assumed 8% cost of capital for CG, 12% Assumed 8% cost of capital for CG, 12% for DGfor DG
Determined retail price/kWh needed in Determined retail price/kWh needed in each year, given then current data.each year, given then current data.

Long Run US Marginal Costs/ MWhLong Run US Marginal Costs/ MWh
020406080
100120140160180
2004
$/M
Wh
Average Retail Oil / Gas Rankine Central SCGT
Central CCGT Central Coal Cogen SCGT
Cogen CCGT Cogen Coal Recycled Energy (thermal recovery)
Central Generation
Distributed Generation

Annual US Utility Additions of Electric Generating Annual US Utility Additions of Electric Generating Capacity by Technology 1988 - 2002Capacity by Technology 1988 - 2002
0
2,000
4,000
6,000
8,000
10,000
12,000
14,000
16,000
Year
Gen
erat
ion
Bu
ilt
(MW
)
Nuclear Coal Oil & Gas
Hydro Pumped Storage SCGT
CCGT Other Other DG

Annual US IPP Additions of Electric Generating Capacity Annual US IPP Additions of Electric Generating Capacity
by Technology 1988 - 2002by Technology 1988 - 2002
0
10000
20000
30000
40000
50000
Year
Gen
erat
ion
Bu
ilt (
MW
)
Hydro Coal Wind Oil & Gas
SCGT CCGT Other Other DG

Spread of 435,000 MW Built by US Electric Utilities Spread of 435,000 MW Built by US Electric Utilities 1973 - 20021973 - 2002
Distributed Generation
1%
Central Generation
99%
Distributed Generation Central Generation

Spread of 175,000 MW Built by US IPPs Spread of 175,000 MW Built by US IPPs 1973 - 20021973 - 2002
Distributed Generation
34%
Central Generation
66%
Distributed Generation Central Generation

Percentage of Electricity from CHP Plants in Percentage of Electricity from CHP Plants in Selected Countries (2004)Selected Countries (2004)
0
10
20
30
40
50
60
DE
sh
are
as a
% o
f to
tal
po
wer
gen
erat
ion

Conclusion of Historical Study Conclusion of Historical Study
Electric monopolies limited choices to Electric monopolies limited choices to central plants, ignoring cheaper and central plants, ignoring cheaper and cleaner distributed generation optionscleaner distributed generation options
IPP companies built DG under PURPA IPP companies built DG under PURPA rules, but shifted to central generation rules, but shifted to central generation with passage of EPACTwith passage of EPACT
Neither monopolies nor IPP’s built Neither monopolies nor IPP’s built projects to recycle industrial waste projects to recycle industrial waste energyenergy

What is Optimum Future What is Optimum Future Generation?Generation?
We modeled 8 scenarios to meet EIA projected We modeled 8 scenarios to meet EIA projected US load growth through 2020 (43%)US load growth through 2020 (43%)
Found each technology’s capital cost, Found each technology’s capital cost, performance, emissions for each yearperformance, emissions for each year
Added 100% T&D for central generation, 10% Added 100% T&D for central generation, 10% for DGfor DG
Met load growth with 8 scenarios: all central, Met load growth with 8 scenarios: all central, all DG and blended scenariosall DG and blended scenarios

Results, CG versus DG Dollars(Dollars in Billions)
ItemItem All CG All DG Savings % Saved
Capacity + T&D $831 $504 $326 39%
Power CostPower Cost $145$145 $92$92 $53$53 36%36%
Tons NOxTons NOx 288288 122122 166166 58%58%
Tons SOTons SO22 333333 1919 314314 94%94%
MM Tonnes MM Tonnes COCO22
776776 394394 381381 49%49%

Capital Cost to Supply 2020 Electric Load Growth
0
100
200
300
400
500
600
700
800
900
6.11% 8% 10% 15% 20% 25% 30% 35% 39.38%
% DG of Total US Generation
$ B
illi
ons
Inv. In New Cent. Gen. Inv. In new Dist. Gen. Inv. In T&D

Retail Costs per KWh for Incremental 2020 Load
0
1
2
3
4
5
6
7
8
9
10
6.11% 8% 10% 15% 20% 25% 30% 35% 39.38%
% DG of Total US Generation
Cen
ts /
KW
h
T&D Amorization on New T&DCapital Amorization + Profit On New CapacityFuelO&M of New Capacity

Added Annual Fossil Fuel Use for Incremental 2020 Load
0
2
4
6
8
10
12
6.11% 10% 20% 30% 39.38%
% DG of Total US Generation
Qua
ds o
f F
ossi
l Fue
l / Y
r
Total "New" Distributed Generation Fuel Use
Total "New" Central Generation Fuel Use

Emissions from Generating Incremental 2020 Electric Load
0
100
200
300
400
500
600
700
6.11% 8% 10% 15% 20% 25% 30% 35% 39.38%
% DG of Total US Generation
Tho
usan
d M
etri
c T
onne
s /
Yea
r
SO2 Emissions NOx Emissions PM10 Emissions

Added Annual CO2 Emissions for Incremental 2020 Load
0
100
200
300
400
500
600
700
800
6.11% 8% 10% 15% 20% 25% 30% 35% 39.38%
% DG of Total US Generation
Mil
lion
Met
ric
Ton
nes
/ Y
ear
CO2 emitted for added Cent Gen. CO2 emitted for added Dist. Gen.

Why does the power industry Why does the power industry make suboptimal decisions?make suboptimal decisions?
Many barriers to market competition, can be Many barriers to market competition, can be likened to the layers of an onionlikened to the layers of an onion
The core of the ‘onion’ is the universal ban The core of the ‘onion’ is the universal ban on private wires.on private wires.
There can never be effective competition There can never be effective competition when power cannot move except through when power cannot move except through the monopolist distribution wiresthe monopolist distribution wires
No polity in the world, to my knowledge, No polity in the world, to my knowledge, allows private electric wires.allows private electric wires.

CAEM Mission (proposed)CAEM Mission (proposed)
Change the way the world makes Change the way the world makes power by persuading governments power by persuading governments
to remove all barriers to competitive to remove all barriers to competitive generation and delivery of power generation and delivery of power and end monopoly protection of and end monopoly protection of
electric distribution.electric distribution.
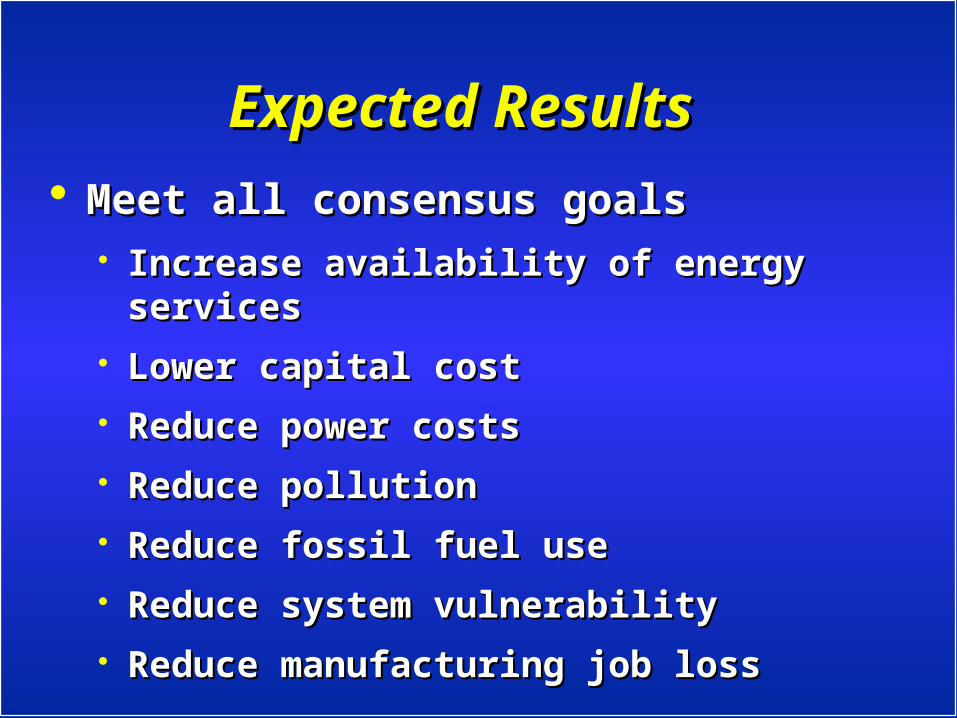
Expected ResultsExpected Results Meet all consensus goalsMeet all consensus goals
Increase availability of energy servicesIncrease availability of energy services Lower capital costLower capital cost Reduce power costsReduce power costs Reduce pollutionReduce pollution Reduce fossil fuel useReduce fossil fuel use Reduce system vulnerabilityReduce system vulnerability Reduce manufacturing job lossReduce manufacturing job loss

Thank you for listening!