Embed Size (px)
Citation preview
Changing numbers, changingneeds? A preliminaryassessment of indigenouspopulation growth 1991-96
J. Taylor
No. 143/1997
DISCUSSION PAPER
Series Note
The Centre for Aboriginal Economic Policy Research (CAEPR) was established inMarch 1990 under an agreement between The Australian National University(ANU) and the Aboriginal and Torres Strait Islander Commission (ATS1C).CAEPR operates as an independent research unit within the University'sFaculty of Arts and is funded by ATSIC, the Commonwealth Department ofSocial Security and the ANU. CAEPR's principal objectives are to undertakeresearch to:
• investigate the stimulation of Aboriginal and Torres Strait Islandereconomic development and issues relating to Aboriginal and Torres StraitIslander employment and unemployment:
• identify and analyse the factors affecting Aboriginal and Torres StraitIslander participation in the labour force; and
• assist in the development of government strategies aimed at raising thelevel of Aboriginal and Torres Strait Islander participation in the labourmarket.
The Director of the Centre is responsible to the Vice-Chancellor of the ANU andreceives assistance in formulating the Centre's research priorities from anAdvisory Committee consisting of five senior academics nominated by the Vice-Chancellor and four representatives nominated by ATSIC, the Department ofEmployment, Education. Training and Youth Affairs and the Department ofSocial Security.CAEPR Discussion Papers are intended as a forum for the rapid disseminationof refereed papers on research that falls within the CAEPR ambit. These papersare produced for discussion and comment within the research community andAboriginal affairs policy arena. Many are subsequently published in academicjournals. Publications can be purchased from:
Centre for Aboriginal Economic Policy Research2nd Floor. J.G. Crawford Building
Faculty of ArtsThe Australian NationalUniversity
Canberra ACT 0200Telephone 02-6279 8211Facsimile 02 - 6249 2789
Abstracts or Summaries of all CAEPR Discussion Papers can be found at thefollowing World Wide Web address: http://online.anu.edu/caepr
Aa with all CAEPR publications, the views expressed in thisDiscussion Paper are those of the author(s) and do not reflect an official
CAEPR position.
Professor Jon AltmanDirector, CAEPR
The Australian National UniversityNovember 1997
Changing numbers, changingneeds? A preliminaryassessment of indigenouspopulation growth, 1991-96
J. Taylor
No. 143/1997
ISSN 1036-1774ISBN 07315 2578 7
Dr John Taylor is a Fellow at the Centre for Aboriginal Economic Policy Research,Faculty of Arts, The Australian National University.

DISCUSSION PAPER NO. 143 III
Table of Contents
Summary v
Acknowledgments vi
Introduction 1
The 1996 indigenous population count 1
Change in indigenous population distribution, 1991-96 3Population change by section-of-State 4
Regional population change 6
Social construction of indigenous identity 7Inter-marriage 9Changes in enumeration procedures 10
Population change in urban neighbourhoods 11
Policy implications 14
Notes 16
References 17Tables
Table 1 Indigenous population change, 1971-96 2Table 2 Aboriginal and Torres Strait Islander population change,
1991-1996 3Table 3 Variation between 1996 indigenous population projections and
1996 ERP by State and Territory 4Table 4 Indigenous population change by section-of-State,
1986-96 4Table 5 Distribution of indigenous population by section-of-State,
1991-96 5Table 6 Responses to the census question on ATSIC origin:
1996 Census and Post- Enumeration Survey 8
FiguresFigure 1 Annual indigenous population growth rates by ATSIC region,
1991-96 6Figure 2 Distribution of indigenous and non-indigenous populations in
major urban CDs ranked by SES index, 1991 and 1996 12Figure 3 Percentage of the population identifying as indigenous
in major urban CDs by decile of socioeconomic status,1991 and 1996.. . 13
C E N T R E F O R A B O R I G I N A L E C O N O M I C P O L I C Y R E S E A R C H

C E N T R E F O R A B O R I G I N A L E C O N O M I C P O L I C Y R E S E A R C H
DISCUSSION PAPER NO. 143
Summary
At the 1996 Census, a total of 352,970 individuals self-identified as indigenousAustralian. This represented an increase of 87,599 or 33 per cent since 1991, anincrease which was way above expectation. As a consequence, demographicanalysis has returned to the familiar condition of uncertainty about intercensalprojections. This raises two questions of fundamental policy interest:
• does the considerable increase in numbers witnessed between 1991 and1996 imply a concomitant increase in need?
• what are the implications of unpredictability for assessing change, and byimplication policy and program performance, using social indicators?
Change in population distributionThe 1996 Census count underlines a long-standing shift in indigenous
population distribution away from the north and west of the continent in favour ofthe east and south, and away from a predominantly rural residence to an urbanexistence.
• New South Wales, Tasmania, Queensland and the Australian CapitalTerritory all experienced population growth well above average;
• as much as 87 per cent of intercensal population growth occurred in majorurban Statistical Divisions.
• many remote regions such as the Kimberley, the Jabiru region of theNorthern Territory and Cape York experienced much lower growth thanexpected.
Social construction of indigenous identityIn canvassing reasons for the large rise in population and the geographic
variation in growth rates, attention is focused on the manner in which theindigenous population is socially constructed.
Indigenous population change is complicated by the dynamic of net changein ethnic identification. Among the factors considered as contributing to this are:
• increased awareness and acknowledgment of indigenous origins;• inter-marriage between indigenous and non-indigenous persons which can
add to the population of indigenous origin by increasing the number ofindigenous births;
• changes in enumeration procedures.
Change in economic statusAmong the key issues for policy arising from increased identification and the
concentration of growth in urban areas, are whether the characteristics of the
C E N T R E F O R A B O R I G I N A L E C O N O M I C P O L I C Y R E S E A R C H
TAYLOR
new (1996) population differ from those of the original (1991) population and whatthe net impact has been in terms of socioeconomic status.
Analysis of aggregate change in income and labour force status as well asresidential location in major cities, suggests that existing estimates of socialpolicy deficits such as housing need and job requirements are likely to vary onlyin quantity but not in kind, except for a possible increased focus on need inurban areas. This finding is only preliminary and more detailed analysis of thefull census data will be required before firm conclusions are drawn.
Policy implications• As long as the census question on Aboriginal and Torres Strait Islander
origins remains the sole means of comprehensively defining the indigenouspopulation, then it is likely that the numbers identified in this way willcontinue to rise steadily;
• despite a substantial number of new entrants to the census-identifiedindigenous population, the overall demographic profile of the group appearsunchanged and as a group indigenous Australians remain substantiallydisadvantaged in terms of socioeconomic status compared to allAustralians;
• there is a pressing requirement for revised estimates and projections of thepopulation;
• in the context of benchmarking outcomes in social and economic policy,consideration should be given to the appropriate denominator for use inmeasuring change in social indicators.
Acknowledgments
I borrowed the title 'Changing numbers, changing needs?' from ananalysis of American Indian demography (see Sandefur, Rindfussand Cohen 1996). The aim was to imply some comparability in theissues raised.The first airing of this paper was at a CAEPR seminar inSeptember 1997 and very useful feedback was provided byseminar participants, especially from John Paice of the AustralianBureau of Statistics Demography program in Canberra.Subsequent development benefited greatly from comments madeby a number of individuals and special thanks are due to JonAltman, Tim Rowse, David Martin, Will Sanders and Alan Gray. Iam greatly indebted to Boyd Hunter for his analysis of populationchange by urban collection districts and for use of his index ofsocioeconomic status. Editorial assistance was provided by HilaryBek and layout by Jennifer Braid.
C E N T R E F O R A B O R I G I N A L E C O N O M I C P O L I C Y R E S E A R C H
DISCUSSION PAPER NO. 143
Introduction
The release of the 1996 Census count of indigenous Australians has generated agood deal of interest among analysts and policy makers. In part, this no doubtreflects a heavy reliance on the five-yearly census for information regarding therelative social and economic status of indigenous people. In this context of censusdependency, population projections based on the 1991 Census count haveassumed considerable policy significance. For example, it has become clear thatthere is an increasing disparity between employment growth and growth in theworking-age population (Tesfaghiorghis and Gray 1992; Altman and Gaminiratne1994; Taylor and Altman 1997). This gap imposes growing social and economiccosts on indigenous people and on the Australian community as a whole (Taylorand Altman 1997). However, confidence in projections of the indigenouspopulation has been undermined somewhat by the higher than expectedpopulation count from the 1996 Census. This necessitates entirely newprojections from a higher base and much thought will also need to be devoted tothe underlying dynamics of population change (Gray 1997).
Inconsistency between census counts has long been a feature of thedemography of indigenous Australians. However, the intercensal change observedbetween 1986 and 1991 suggested that, for the first time, census counts weremoving into line with expectation. Greater predictability in the estimation ofpopulation levels and composition seemed within grasp (Gray and Tesfaghiorghis1993). Against this background, the 1996 Census result returns demographicanalysis to the more familiar condition of uncertainty about intercensalprojections.
A key indication from the 1996 Census is that the growth of the indigenouspopulation is both high and unpredictable in its rate. This raises two questions offundamental policy interest: first of all, does the considerable increase innumbers witnessed between 1991 and 1996 imply a concomitant increase inneed? secondly, what are the implications of a return to unpredictability forassessing change, and by implication policy and program performance, usingsocial indicators? Before addressing these questions, the paper reviews somefeatures of the indigenous population count in 1996.
The 1996 indigenous population count
At the 1996 Census, a total of 352,970 individuals self-identified as indigenousAustralian. This represented an increase of 87,599 or 33 per cent since 1991. Theincrease in the estimated resident population (ERP),1 which adjusts the censuscount for underenumeration, was roughly of the same order rising from 283,560to 372,052, an increase of 31 per cent. Any subsequent population projectionswill commence from this new base with obvious substantial upward revision ofprevious estimates. While growth rates of this magnitude are excessive in purely
C E N T R E F O R A B O R I G I N A L E C O N O M I C P O L I C Y R E S E A R C H
TAYLOR
demographic terms, viewed in the historical context of attempts by the Australianstate to enumerate its indigenous peoples, perhaps the most surprising thingabout this increase is the fact that it should come as a surprise.
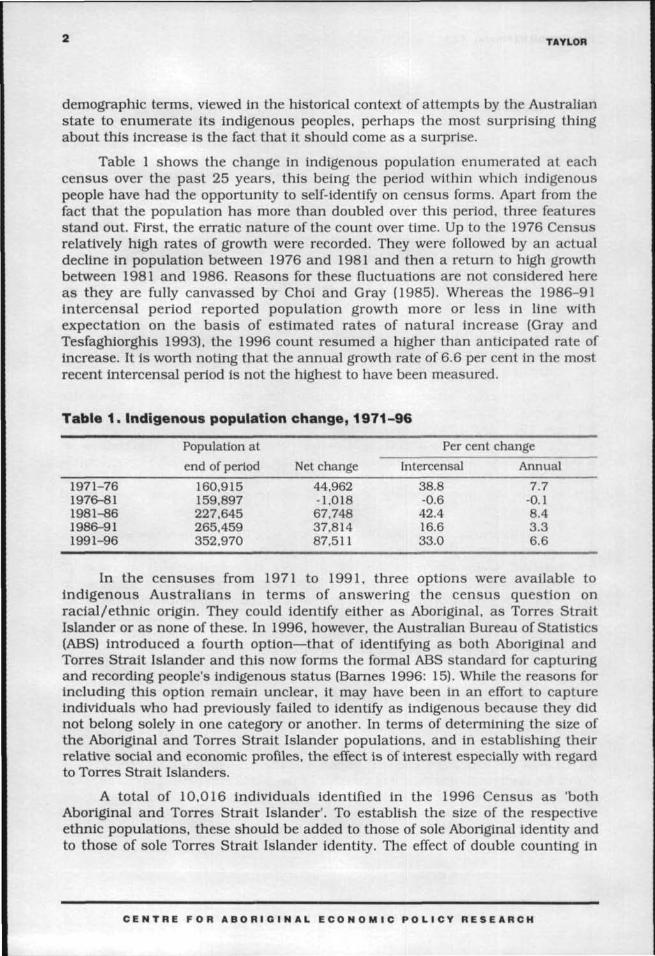
Table 1 shows the change in indigenous population enumerated at eachcensus over the past 25 years, this being the period within which indigenouspeople have had the opportunity to self-identify on census forms. Apart from thefact that the population has more than doubled over this period, three featuresstand out. First, the erratic nature of the count over time. Up to the 1976 Censusrelatively high rates of growth were recorded. They were followed by an actualdecline in population between 1976 and 1981 and then a return to high growthbetween 1981 and 1986. Reasons for these fluctuations are not considered hereas they are fully canvassed by Choi and Gray (1985). Whereas the 1986-91intercensal period reported population growth more or less in line withexpectation on the basis of estimated rates of natural increase (Gray andTesfaghiorghis 1993), the 1996 count resumed a higher than anticipated rate ofincrease. It is worth noting that the annual growth rate of 6.6 per cent in the mostrecent intercensal period is not the highest to have been measured.
Table 1. Indigenous population change, 1971-96
Population at Per cent change
1971-761976-811981-861986-911991-96
end of period160,915159,897227,645265,459352.970
Net change44,962-1,01867,74837,81487,511
Intercensal38.8-0.642.416.633.0
Annual7.7
-0.18.43.36.6
In the censuses from 1971 to 1991, three options were available toindigenous Australians in terms of answering the census question onracial/ethnic origin. They could identify either as Aboriginal, as Torres StraitIslander or as none of these. In 1996, however, the Australian Bureau of Statistics(ABS) introduced a fourth option—that of identifying as both Aboriginal andTorres Strait Islander and this now forms the formal ABS standard for capturingand recording people's indigenous status (Barnes 1996: 15). While the reasons forincluding this option remain unclear, it may have been in an effort to captureIndividuals who had previously failed to identify as indigenous because they didnot belong solely in one category or another. In terms of determining the size ofthe Aboriginal and Torres Strait Islander populations, and in establishing theirrelative social and economic profiles, the effect is of interest especially with regardto Torres Strait Islanders.
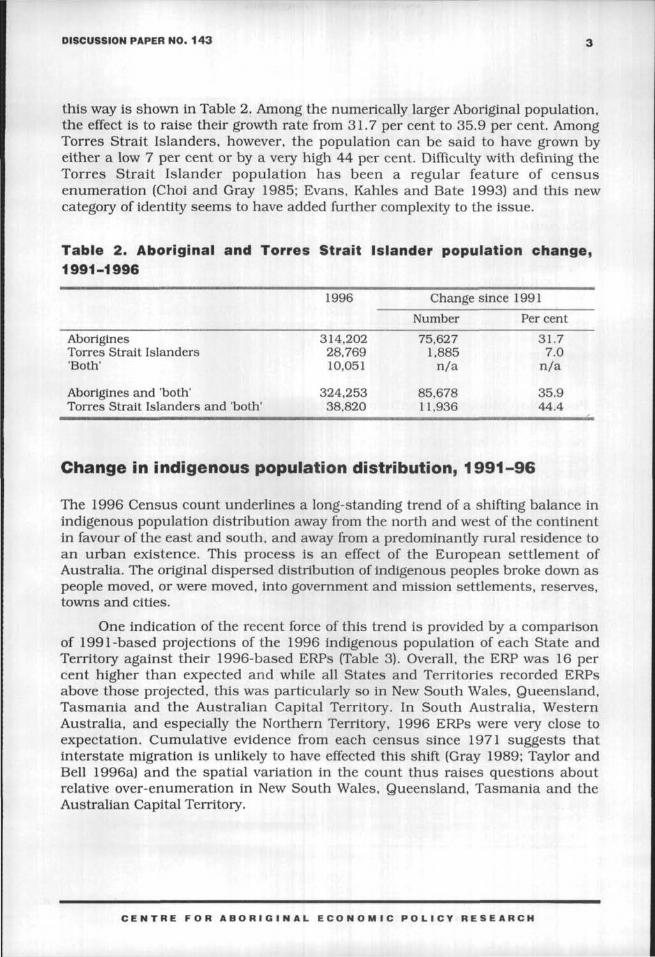
A total of 10,016 individuals identified in the 1996Census as 'bothAboriginal and Torres Strait Islander'. To establish the size of the respectiveethnic populations, these should be added to those of sole Aboriginal identity andto those of sole Torres Strait Islander identity. The effect of double counting in
C E N T R E F O R A B O R I G I N A L E C O N O M I C P O L I C Y R E S E A R C H
DISCUSSION PAPER NO. 143
this way is shown in Table 2. Among the numerically larger Aboriginal population,the effect is to raise their growth rate from 31.7 per cent to 35.9 per cent. AmongTorres Strait Islanders, however, the population can be said to have grown byeither a low 7 per cent or by a very high 44 per cent. Difficulty with defining theTorres Strait Islander population has been a regular feature of censusenumeration (Choi and Gray 1985; Evans, Kahles and Bate 1993) and this newcategory of identity seems to have added further complexityto the issue.
Table 2. Aboriginal and Torres Strait Islander population change,1991-1996
AboriginesTorres Strait Islanders'Both'
Aborigines and 'both'Torres Strait Islanders and 'both'
1996
314,20228,76910,051
324,25338.820
Change since
Number
75,6271,885
n/a
85,6781 1 ,936
1991
Per cent
31.77.0
n/a
35.944.4
Change in indigenous population distribution, 1991-96
The 1996 Census count underlines a long-standing trend of a shifting balance inindigenous population distribution away from the north and west of the continentin favour of the east and south, and away from a predominantly rural residence toan urban existence. This process is an effect of the European settlement ofAustralia. The original dispersed distribution of indigenous peoples broke down aspeople moved, or were moved, into government and mission settlements, reserves,towns and cities.
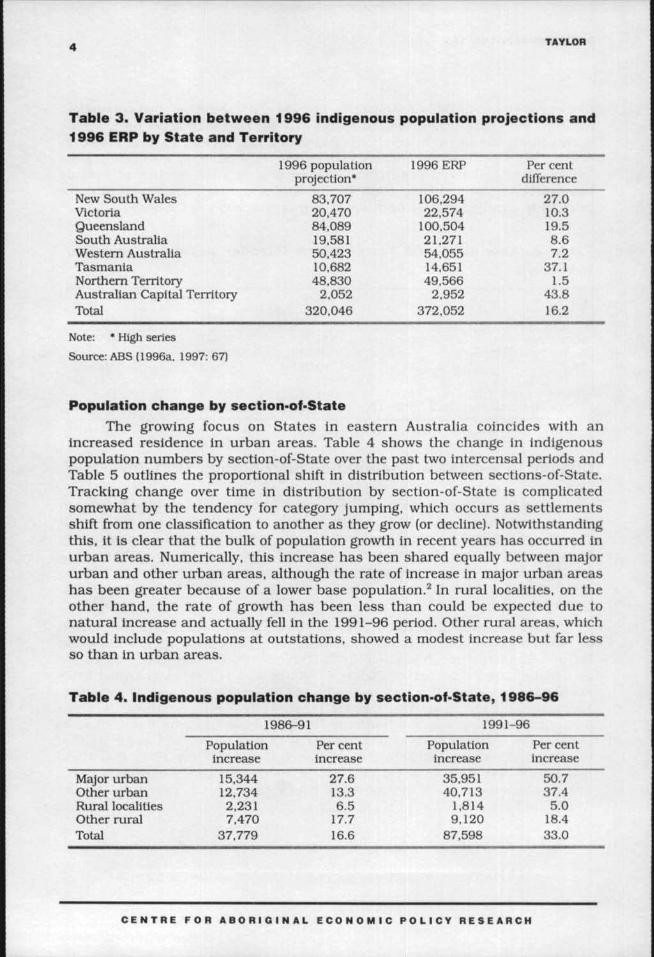
One indication of the recent force of this trend is provided by a comparisonof 1991-based projections of the 1996 indigenous population of each State andTerritory against their 1996-based ERPs (Table 3). Overall, the ERP was 16 percent higher than expected and while all States and Territories recorded ERPsabove those projected, this was particularly so in New South Wales, Queensland,Tasmania and the Australian Capital Territory. In South Australia, WesternAustralia, and especially the Northern Territory, 1996 ERPs were very close toexpectation. Cumulative evidence from each census since 1971 suggests thatinterstate migration is unlikely to have effected this shift (Gray 1989; Taylor andBell 1996a) and the spatial variation in the count thus raises questions aboutrelative over-enumeration in New South Wales, Queensland, Tasmania and theAustralian Capital Territory.
C E N T R E F O R A B O R I G I N A L E C O N O M I C P O L I C Y R E S E A R C H
TAYLOR
Table 3. Variation between 1996 indigenous population projections and1996 ERP by State and Territory
New South WalesVictoriaQueenslandSouth AustraliaWestern AustraliaTasmaniaNorthern TerritoryAustralian Capital TerritoryTotal
1996 populationprojection*
83.70720,47084,08919,58150,42310,68248,830
2,052320,046
1996 ERP
106,29422,574
100,50421,27154,05514,65149,566
2,952372,052
Per centdifference
27.010.319.58.67.2
37.11.5
43.816.2
Note: * High series
Source: ABS (1996a. 1997: 67)
Population change by section-of-StateThe growing focus on States in eastern Australia coincides with an
increased residence in urban areas. Table 4 shows the change in indigenouspopulation numbers by section-of-State over the past two intercensal periods andTable 5 outlines the proportional shift in distribution between sections-of-State.Tracking change over time in distribution by section-of-State is complicatedsomewhat by the tendency for category jumping, which occurs as settlementsshift from one classification to another as they grow (or decline). Notwithstandingthis, it is clear that the bulk of population growth in recent years has occurred inurban areas. Numerically, this increase has been shared equally between majorurban and other urban areas, although the rate of increase in major urban areashas been greater because of a lower base population.2 In rural localities, on theother hand, the rate of growth has been less than could be expected due tonatural increase and actually fell in the 1991-96 period. Other rural areas, whichwould include populations at outstations, showed a modest increase but far lessso than in urban areas.
Table 4. Indigenous population change by section-of-State, 1986-96
1986-91
Major urbanOther urbanRural localitiesOther ruralTotal
Populationincrease15,34412,7342,2317,470
37,779
Per centincrease
27.613.36.5
17.716.6
1991-96Populationincrease
35.95140,713
1,8149,120
87,598
Per centincrease
50.737.45.0
18.433.0
C E N T R E F O R A B O R I G I N A L E C O N O M I C P O L I C Y R E S E A R C H
DISCUSSION PAPER NO. 143
Another way to express these changes is to say that the proportion of theindigenous population resident in urban areas rose from just over two-thirds in1991 (67 per cent) to almost three-quarters in 1996 (73 per cent) (Table 5).Consequently, almost one-third of indigenous Australians are now resident inmajor urban areas and while this is still less than the total population (63 percent), it nonetheless represents a substantial increase from the 15 per cent of theindigenous population counted in 1971. As this process of ever greater populationcounts in urban areas has unfolded, ipsojacto the rural share of the populationhas continued to decline—down from 33 per cent in 1991 to almost one-quarter(27 per cent) in 1996.
If anything, these figures understate both the extent and rise of urbanliving, especially in terms of proximity to metropolitan centres and large cities.ABS criteria for classifying Collection Districts (CDs)as urban or rural are basedon measures of population density, land use and spatial contiguity (ABS 1993).This means that many people who may reasonably be regarded as forming part ofthe city region are not classified as urban dwellers. One way of incorporating suchpopulations is to examine distribution according to major urban StatisticalDivisions (SDs) (that is, SDs with total populations over 100,000 persons). In1991, a total of 70,872 indigenous Australians (27 per cent of the population)lived in major urban SDs.3 By 1996, this figure had risen to 128,452 (36 per centof the indigenous population).
Table 5. Distribution of indigenous population by section-of-State,1991-96
1991
Major urbanOther urbanRural localitiesOther ruralTotal
Population
70,881108,61336,28549,645
265,424
Per centdistribution
26.740.913.718.7
100.0
1996Population
106,832149,32638,09958,765
353,022
Per centdistribution
30.342.310.816.6
100.0
Initial research on the causes of this redistribution focused on the roleplayed by migration, especially to metropolitan centres (Taylor and Bell 1996b:157-8). Subsequent analysis, however, points to the likelihood that post-warmigration to major cities contributed less to indigenous urban population growththan previously claimed (Smith 1980a; Gray 1989), and that much of theapparent shift in population distribution from the 1950s onwards could havebeen due simply to increased enumeration of city-based residents. Certainly, thelow overall effectiveness of migration flows between metropolitan and non-metropolitan areas since 1976 suggest that if migration were ever a major factorleading to an increased indigenous presence in major cities then since the 1970sit has been far less so (Gray 1989; Taylor and Bell 1996a: 400-2).
C E N T R E F O R A B O R I G I N A L E C O N O M I C P O L I C Y R E S E A R C H
TAYLOR
Regional population change
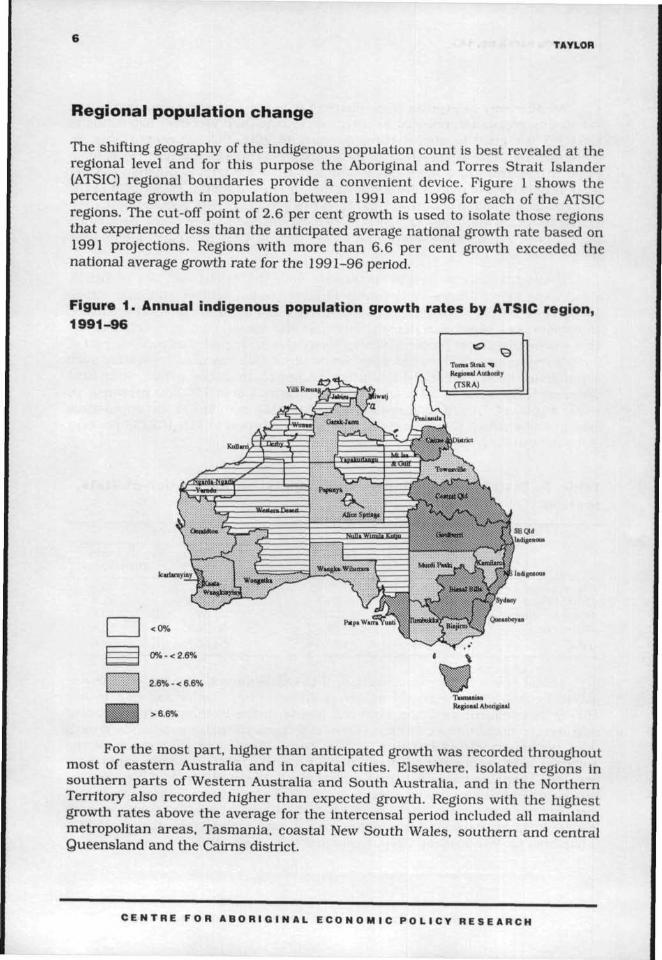
The shifting geography of the indigenous population count is best revealed at theregional level and for this purpose the Aboriginal and Torres Strait Islander(ATSIC) regional boundaries provide a convenient device. Figure 1 shows thepercentage growth in population between 1991 and 1996 for each of the ATSICregions. The cut-off point of 2.6 per cent growth is used to isolate those regionsthat experienced less than the anticipated average national growth rate based on1991 projections. Regions with more than 6.6 per cent growth exceeded thenational average growth rate for the 1991-96 period.
Figure 1. Annual indigenous population growth rates by ATSIC region,1991-96
Regional Aboriginal
For the most part, higher than anticipated growth was recorded throughoutmost of eastern Australia and in capital cities. Elsewhere, isolated regions insouthern parts of Western Australia and South Australia, and in the NorthernTerritory also recorded higher than expected growth. Regions with the highestgrowth rates above the average for the intercensal period included all mainlandmetropolitan areas, Tasmania, coastal New South Wales, southern and centralQueensland and the Cairns district.
C E N T R E F O R A B O R I G I N A L E C O N O M I C P O L I C Y R E S E A R C H
DISCUSSION PAPER NO. 143
Elsewhere, growth was lower than expected and three areas in particularstand out as having growth rates that were particularly lower than expected—ATSIC regions in the Kimberley and Pilbara districts of Western Australia, theJabiru Region across the Top End of the Northern Territory and the PeninsulaRegion in Cape York Peninsula as well as the region covered by the Torres StraitRegional Authority. All of these regions had annual growth rates of less than 2 percent, many had less than 1 per cent, while the Peninsula Region actually declinedin enumerated population.
Inter-regional migration is one demographic factor that may havecontributed to producing this pattern in regional population growth rates. Fullanalysis of the contribution of migration is not yet possible using 1996 Censusdata. However, what we know of migration from previous census analysissuggests that inter-regional population movements are likely to be far lesssignificant than intra-regional moves and of insufficient magnitude to account forobserved variations in rates of population change (Taylor and Bell 1996b: 400-2).As found from analysis of natural increase in the indigenous population (Gray1997), a sizeable unexplained component of growth will no doubt remain afteraccounting for changes in residential location. In canvassing reasons for this,attention is focused on the manner in which the indigenous population is sociallyconstructed.
Social construction of indigenous identity
Unlike the standard demographic equation which calculates population change asa net function of births, deaths and migration, indigenous population change iscomplicated by the added dynamic of net change in ethnic identification. Becauseof this there is no sense in which the indigenous population can be described asclearly defined. Rather, political and cultural processes, including the highlyvariable way in which States, Territories and the Commonwealth have attemptedto enumerate and categorise indigenous people and the choices made byrespondents to the census and other statistical collections, construct the entitywe call 'the indigenous population' (Smith 1980b; Dodson 1994; Anderson 1997).In the more distant past, these sociological and political processes have effectivelyexcluded or devalued indigenous representation in official statistics. The morerecent politics of data collection has seen moves to encourage identification(Altaian 1992).
The most complete exploration of these issues from a demographicperspective remains the work of Smith (1980b) who distinguished between atheoretical total population of any Aboriginal or Torres Strait Islander ancestryand official figures which he referred to as the 'revealed' population. This paper isconcerned with the 'revealed' census population, but part of the unpredictabilityof this population is the latent potential that exists for growth to occur due to theincreased identification of individuals as indigenous Australian in officialstatistics. Similar observations about the growth potential of populations derived
C E N T R E F O R A B O R I G I N A L E C O N O M I C P O L I C Y R E S E A R C H
TAYLOR
from census questions on racial origin/ethnic affiliation have been made in theUnited States (Snipp 1986).
An important point to note about 'revealed' populations is that they mayvary between statistical collections because of different methodologies used andbecause of the manner in which individuals respond to questions on racial/ethnicidentification in differing circumstances. One important example of this, from thepoint of view of interpreting the increased census count, is the difference betweenresponses to the census question on Aboriginal and Torres Strait Islander originand the responses to the same question in the Post-Enumeration Survey (PES).The PES is an interviewer-based follow-up survey to the census. It is conductedthree weeks after the census and in 1996 involved 82,210 persons of whom 1,360(1.65 per cent) stated that they were of indigenous origin. In the 1996 Census,1,482 (1.8 per cent) of the PES respondents stated that they were of indigenousorigin. The actual shifts in identification between the census and the PES areshown in Table 6.
Table 6. Responses to the census question on ATSIC origin: 1996Census and Post- Enumeration Survey
PES
response
12345Total
Census response
1
41,176
2400
1,204
2
13579,298
8010
179,524
3
0185
1,12980
1,322
4
0475
700
122
5
05
2670
38
Total
13980,711
1,26495
182,210
Notes: 1—Not stated; 2—Non-indigenous: 3—Aboriginal: 4—Torres Strait Islander: 5—Both Aboriginaland Torres Strait Islander
Source: Unpublisheddata, ABS, Canberra
This reveals that PES respondents were slightly more likely to identify asAboriginal, Torres Strait Islander or both of these in the census than in the PES(1,482 compared to 1,360, i.e. horizontal categories 3+4+5 compared to verticalcategories 3+4+5 in Table 6). Of the 1,322 who identified as Aboriginal in thecensus, 193 (14.6 per cent) were recorded in a different category of identificationin the PES. Among the 122 who identified as Torres Strait Islanders in thecensus, only 70 (57 per cent) were recorded in the same category in the PES.While the PES sample is admittedly small, it nonetheless reveals the potential forvariation in responses to identification between the self-administered census formand an interview-based PES. At the same time, precisely how such variationmight be interpreted in the context of a greatly increased census count remains amatter for speculation.
Judging by the overall level of population change in the 1986-91 intercensalperiod it had seemed that growth due to increased identification was receding
C E N T R E F O R A B O R I G I N A L E C O N O M I C P O L I C Y R E S E A R C H
DISCUSSION PAPER NO. 143
compared to previous years. Clearly, this was a premature conclusion, althoughthe reasons for a resurgence of indigenous identification in the recent intercensalperiod remain to be established. It is certainly true that a number of events haveoccurred during the 1990s that may have contributed substantially to increasedawareness and acknowledgment of indigenous origins. Among these one mightinclude land rights in New South Wales and Queensland, the Royal Commissioninto Aboriginal Deaths in Custody, the creation of the Aboriginal and Torres StraitIslander Commission (ATSIC) and the conduct of ATSIC elections, increasedgovernment spending on indigenous programs, the rise of indigenous political andservice delivery organisations, the Mabo decision and subsequent passing of theNative Title Act, the High Court Wik decision and the Stolen Generation Inquiry.
The last example is instructive. While the numbers of children and familiesseparated by welfare authorities are difficult to establish with precision, it isestimated that from around 1910until 1970 between one in three and one in tenindigenous children were forcibly removed from their families and communities(Link-Up [NSW] and Wilson 1997; Commonwealth of Australia 1997:29-7). As forthose still living, in the 1994 National Aboriginal and Torres Strait IslanderSurvey some 6 per cent of survey respondents (17,000 persons) reported beingtaken away by authorities from their natural family (ABS 1995:7). The impact ofthese sizeable removals on the unfolding structure and distribution of the self-identified indigenous population remains unknown.
Inter-marriageInter-marriage is defined as formal or de facto marriage between indigenous
and non-indigenous persons. Together with potentially high rates of indigenousidentification among the children of such marriages, this can add to thepopulation of indigenous origin by increasing the number of indigenous births.4 Itis now clear from analysis of census and vital registration data that this is indeedthe case (Gray 1997).
The first indications of high rates of inter-marriage were reported from the1986 Census which revealed that 46 per cent of indigenous couple families wereunions between indigenous and non-indigenous partners (Dugbaza 1995: 42).Further analysis based on the 1991 Census indicated that this proportion hadincreased to 51 per cent and that rates of inter-marriage were greatest in majorurban areas and in the south-east of the country (Dugbaza 1994: 6; O'Reilly1994).5 This leads to regional growth rates that can seem counter-intuitive. Forexample, places such as the Northern Territory, with the highest fertility (but lowrates of inter-marriage), grow as a proportion of the total population less rapidlythan expected while those, as in the south-east, with lower fertility (but highinter-marriage rates), grow faster than expected (Dugbaza 1994,1995; Gray1990,1997).
These divergent rates are reflected in changes to regional populationdistribution. In the 1971 Census, the Northern Territory and New South Walesaccounted for 20 and 21 per cent of the total indigenous population respectively.
C E N T R E F O R A B O R I G I N A L E C O N O M I C P O L I C Y R E S E A R C H
10 TAYLOR
By 1996, these proportions had changed to 15 and 29 per cent despite low levelsof interstate migration (Gray 1989; Taylor and Bell 1996a). It may also go someway to explaining why some south-eastern jurisdictions had the largest gapsbetween 1991 census-based projections and 1996 ERPs as shown in Table 3.
Changes in enumeration proceduresSince 1971, the methods used by the ABS to count the indigenous
population have been gradually extended and improved. In particular, progresshas been made in terms of achieving greater physical coverage of the population.Included in these measures are special procedures for locating and countingindigenous people in remote areas while a feature of the 1996 Censusenumeration was the appointment of Special Indigenous Managers in each Stateand Territory to coordinate efforts generally, including in urban areas. Speciallyrecruited 'Indigenous Assistants' in urban neighbourhoods helped to deliver andcollect forms, to explain the census and even to fill out forms if requested (ABS1996b: 79).As Gray (1997) has pointed out, such arrangements might helpexplain some of the increased identification. Changes in the processing ofcompleted forms also contributed to increased numbers though only slightly. Forexample, in 1991, individuals who identified as Aboriginal or Torres StraitIslander on the census form but who also indicated that they were born overseaswere not counted as indigenous. In 1996, such responses were included in theindigenous count.
Despite such efforts, problems in enumerating the indigenous populationremain. This is suggested by the lower than expected population growth observedin many remote areas where special enumeration procedures were employed.Research has demonstrated that methodological and conceptual problems in theenumeration of remote area populations lead to under-enumeration, particularlyof the young, the more mobile and the more socially marginal (Martin and Taylor1996). The relative exclusion of such cohorts emerged again in the 1996 Census(Gray 1997) and the phenomenon is well recognised by the ABS (Evans, Kahlesand Bate 1993). Also apparent in the 1996 and previous census counts aresubstantially divergent regional trends in population change which may resultfrom census error. To examine one possible source of such error, reference ismade to the indigenous count in Kakadu National Park.
The 1996Census counted substantially fewer indigenous people in theKakadu region than in 1991, whether as their place of enumeration or their usualresidence. The place of enumeration count fell by 30 per cent, from 443 to 310,representing a shift back towards the population levels of the early 1980s in aregion that is known to have experienced rapid indigenous population growthsince that time due to mining and tourism developments. Of course, one reasonfor the lower place of enumeration count could be that usual residents of theregion were absent and counted in another census area on census night.However, usual resident numbers also fell by around 20 per cent from 407 to 327.
C E N T R E F O R A B O R I G I N A L E C O N O M I C P O L I C Y R E S E A R C H
DISCUSSION PAPER NO. 143
Leaving aside the almost complete loss of population from the Jabiru towncamp, it may be significant that a total of 221 usual residents of Kakadu NationalPark did not answer the census question on Aboriginal origin (compared to onlythree in 1991). Since Aboriginal people comprised around half of the Park's usualresidents in 1991 it seems likely that this census error may have contributed tothe apparent decline in indigenous numbers. In administering the remote areacensus forms in 1991, the question on Aboriginal origin was pre-ticked in theaffirmative. In 1996, however, this was not the case and interviewers wereinstructed to elicit an answer and complete the form. Whether this change incensus methodology had any bearing on the increase in 'not stateds' is unknown.If, for the sake of argument, however, all of those forms for usual residents whichhad no answer to the question on Aboriginal origin were on behalf of Aboriginalpeople, which in Kakadu is not an unreasonable assumption, then the Aboriginalusual resident population would have increased by 35 per cent instead ofdeclining by 20 per cent.
In this context, it is worth noting that there was a notable increase in 'notstateds' in virtually all of the remote ATSIC regions where intercensal growth waslower than expected, the only exceptions being Derby and Port Augusta. At thesame time, most regions of above average growth displayed a decrease in thenumber of people who did not answer the question on indigenous origin. InBroome, for example, the number of 'not stateds' increased from 558 in 1991 to1,047 in 1996; in South Hedland from 1,206 to 2,565; in Warburton from 300 to1,078; and in Kununurra from 859 to 1,474. ATSIC regions whose populationswere counted by remote area procedures experienced a combined total increase in'not stateds' of 6,305. Adjustment for such census error is made by the ABS whenestimating ERPs at the ATSIC region level. However, as the Kakadu exampleillustrates, census error on this scale can make a substantial difference to growthrates at sub-regional levels for which ERPs are not available. It is also the casethat any loss of population characteristics, due to this or any other census error,can not be compensated for as these are not capable of adjustment.
Population change in urban neighbourhoods
The role of increased identification as a component of population change and theconcentration of growth in urban areas raises a number of important questionsregarding the impact of new entrants to the population. Among the key issues forpolicy are whether the new (1996) population differs from the original (1991)population and what the net impact of augmenting the population has been interms of socioeconomic status? Demographically, in terms of survival rates,fertility and age distribution, little net effect has been observed (Gray 1997).
Whether a similar lack of impact is evident for economic indicators remainsto be established by detailed analysis of the full census data. However, earlyindications using 1996 data on labour force status suggest some positive shift inemployment levels (36 per cent in 1991 and 41 per cent in 1996), and that the
C E N T R E F O R A B O R I G I N A L E C O N O M I C P O L I C Y R E S E A R C H
12 TAYLOR
unemployment rate had declined markedly (from 31 per cent in 1991 to 23 percent in 1996), although a rigorous appraisal of these figures has yet to include anexamination of employment in the Community Development Employment Projects(CDEP) scheme and its effect on changes in the census labour force data. As faras income is concerned, while average indigenous annual income has risen from$11,800 to $14,300 the income of non-indigenous Australians has also risen andthe ratio between the two has improved only slightly from 0.61 in 1991 to 0.64 in1996.
In the meantime, one proxy measure of change in economic status isprovided by examining shifts in the distribution of population in major urbanareas at the CD level and assessing these in terms of 1991 indexes of SocioEconomic Status (SES) for each CD. The basic hypothesis here is that a lack ofchange in distribution would imply a probable lack of change in socioeconomiccomposition.
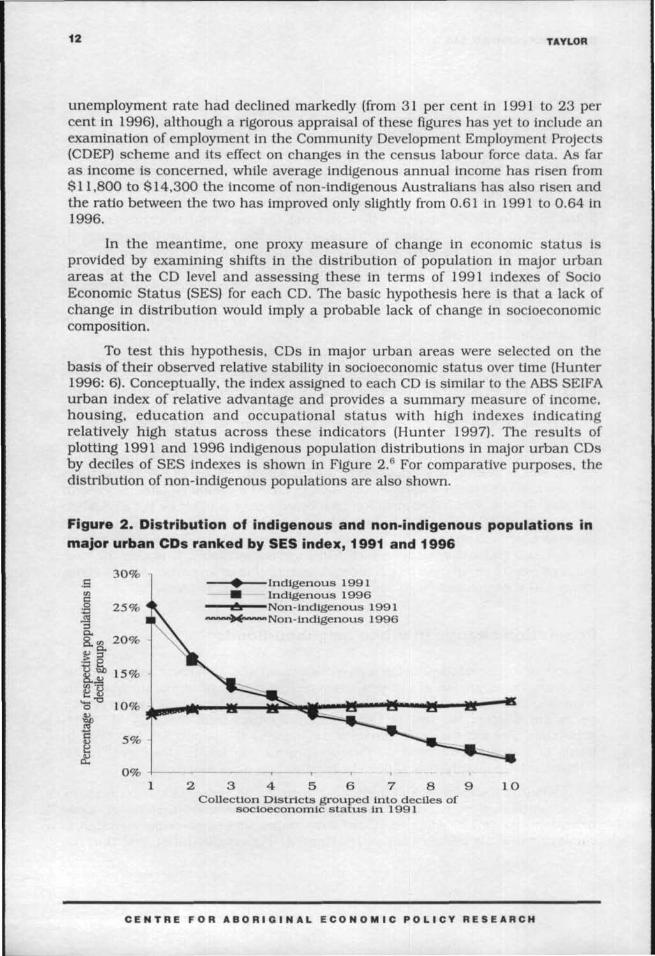
To test this hypothesis, CDs in major urban areas were selected on thebasis of their observed relative stability in socioeconomicstatus over time (Hunter1996: 6). Conceptually, the index assigned to each CD is similar to the ABS SEIFAurban index of relative advantage and provides a summary measure of income,housing, education and occupational status with high indexes indicatingrelatively high status across these indicators (Hunter 1997). The results ofplotting 1991and 1996indigenous population distributions in major urban CDsby deciles of SES indexes is shown in Figure 2.6 For comparative purposes, thedistribution of non-indigenous populations are also shown.
Figure 2. Distribution of indigenous and non-indigenous populations inmajor urban CDs ranked by SES index, 1991 and 1996
•Indigenous 1991Indigenous 1996
•Non-Indigenous 1991"Non-indigenous 1996
0%
Collection Districts grouped into deciles ofsocioeconomic status in 1991
C E N T R E F O R A B O R I G I N A L E C O N O M I C P O L I C Y R E S E A R C H
DISCUSSION PAPER NO. 143 13
The first point to note is the quite different distribution of indigenous andnon-indigenous populations across major urban neighbourhoods. Among non-indigenous city-dwellers, the proportion of the population in each decile ofsocioeconomic status is more or less consistent at around 10 per cent. Forindigenous people, however, the proportion of the population in CDs of lowsocioeconomic status is high and declines steadily with increasing neighbourhoodstatus. More importantly, in the context of the present discussion, is the fact thatlittle change in this pattern is evident between 1991 and 1996.
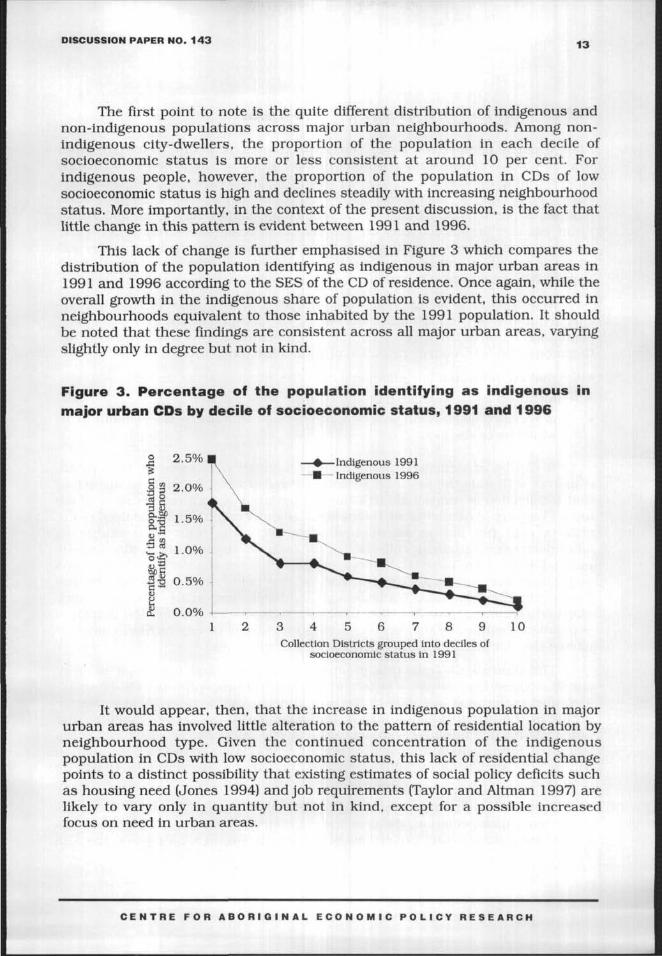
This lack of change is further emphasised in Figure 3 which compares thedistribution of the population identifying as indigenous in major urban areas in1991 and 1996 according to the SES of the CD of residence. Once again, while theoverall growth in the indigenous share of population is evident, this occurred inneighbourhoods equivalent to those inhabited by the 1991 population. It shouldbe noted that these findings are consistent across all major urban areas, varyingslightly only in degree but not in kind.
Figure 3. Percentage of the population identifying as indigenous in
major urban CDs by decile of socioeconomic status, 1991 and 1996
Indigenous 1991Indigenous 1996
Collection Districts grouped into deciles ofsocioeconomic status in 1991
It would appear, then, that the increase in indigenous population in majorurban areas has involved little alteration to the pattern of residential location byneighbourhood type. Given the continued concentration of the indigenouspopulation in CDs with low socioeconomic status, this lack of residential changepoints to a distinct possibility that existing estimates of social policy deficits suchas housing need (Jones 1994) and job requirements (Taylor and Altaian 1997) arelikely to vary only in quantity but not in kind, except for a possible increasedfocus on need in urban areas.
C E N T R E F O R A B O R I G I N A L E C O N O M I C P O L I C Y R E S E A R C H
14 TAYLOR
Policy implications
From a policy perspective, demography contributes an ability to measure andmonitor change in population numbers and composition with a view to estimatingand projecting the client base. The key source of data for this purpose is the five-yearly census and yet this continues to yield counts of the indigenous populationthat are unpredictable. As long as the census question on Aboriginal and TorresStrait Islander origins remains the sole means of comprehensively defining theindigenous population, then it is likely that the numbers identified in this way willcontinue to rise steadily due to improved enumeration, changes in identificationand the flow-on effects of inter-marriage (Gray 1997).
At a time of growing pressure for targeted service delivery that is cost-effective and based on demonstrated need, the prospect of an ever-expandingpopulation requires careful consideration. In this context, it is worth recalling theCommonwealth's three-part definition of an indigenous Australian:
• that an individual has Aboriginal or Torres Strait Islander descent;• identifies as an Aboriginal or Torres Strait Islander; and• is accepted as an Aboriginal or a Torres Strait Islander by the community in
which he or she lives.
It can be argued that the indigenous population revealed by the censusconforms with only the first and second of these criteria, but only to the extentthat a collection of individuals tick the appropriate box on a census form whichasks if they are of Aboriginal or Torres Strait Islander origin. While the third of thecriteria may not always be applied when recording indigenous status inadministrative statistical collections, its lack of application in the censusmethodology does open the prospect that the census-derived indigenouspopulation may be of a different size to any population based on the fullCommonwealth definition. While recognising these complexities, the key policyquestion stemming from the 1996 Census result remains whether the growth ofpopulation identified by the census question on indigenous origins has in any wayaltered the characteristics and extent of demonstrated need.
The indications from this preliminary analysis, and from that of Gray(1997), suggest that despite a substantial number of new entrants to the census-identified indigenous population, the overall demographic, social and economicprofile of the group remains largely the same as in 1991. Consequently, theprognosis for any findings from detailed analysis of change in social indicatorsusing the full census output is that overall need relative to the total populationwill be very similar as previously reported, but in absolute terms there will bemore of it.
Apart from initiating a detailed examination of changes to social indicatorsto confirm this expectation, the pressing requirement from a policy perspective isfor revised estimates and projections of the population. In recent years, the ABS
C E N T R E F O R A B O R I G I N A L E C O N O M I C P O L I C Y R E S E A R C H
DISCUSSION PAPER NO. 143 15
has produced experimental projections of the indigenous population (ABS 1996a),but the methodology used in constructing these has not included any adjustmentfor change in census identification, nor has it attempted to model the effects ofinter-marriage. Demographically, there are sound reasons for avoidingassumptions about change in identification. But in view of the substantial gapbetween 1991 Census-based projections and the 1996 ERP an argument might beadvanced in favour of developing projections based on a range of assessmentsabout the contribution of inter-marriage to population growth (Gray 1997: 10).
The issue at stake here is highlighted in the context of benchmarkingoutcomes in social and economic policy. Basically, what is the appropriatedenominator to use for measuring change in social indicators when the basepopulation can vary so much between census counts? For example, in estimatingfuture job requirements based on 1996 population levels and labour force data,should an assumption about possible increased identification form part of theprojected population of working age? If so, how is the same to be done for labourforce data? Likewise, intercensal indicators that use administrative data for thenumerator and census-based population estimates as the denominator, may berevised downwards because of an expanded denominator, as has alreadyhappened with estimates of indigenous fertility for South Australia and theNorthern Territory (ABS 1996b).
Other policy issues arising from the census count are less conceptual innature and concern the practical implications of emerging trends. It should beclear by now that the census count of Torres Strait Islanders is problematic andthat the task of interpreting such data is not aided by the inclusion of a thirdcategory of ethnicity. If those who identified solely as Torres Strait Islander in thecensus are considered, then the population barely increased. If, however, thoseclaiming dual Aboriginal and Torres Strait Islander origins are added then thepopulation increased substantially. The palpable shift in Torres Strait Islanderidentity in the Post-Enumeration Survey also adds to the complexity. Certainly,outside of the Torres Strait and the rest of Queensland, ABS guidance on the useof Torres Strait Islander statistics would be advisable.
On a broader level, the significance of a clear consolidation of populationdistribution in urban areas and in eastern Australia needs to be contemplated.Current policy emphasises the relative needs of remote rural populations (Herron1996), but one question raised by the substantial geographic bias in populationgrowth rates in favour of the south and east and urban areas is whether this alsoimplies a necessary diversion of resources. Ultimately, this is likely to be apolitical decision but more than just census data will be required to adequatelyestablish demonstrated need. It should be pointed out in this context that actualunderenumeration of some remote populations remains a problem. Consequently,advice on appropriate interpretation of small area statistics should be provided tocommunities when bidding for resources with officially depleted numbers, as inthe Kakadu example. It is not enough to simply publish census results without atleast some accompanying estimation of confidence limits. As the ABS has already
C E N T R E F O R A B O R I G I N A L E C O N O M I C P O L I C Y R E S E A R C H
16TAYLOR
suggested (ABS 1996c), one option for assisting planning in this way would be toestimate service populations.
Notes
1. The ERP is the official ABS estimate of the population. In the compilation of the ERPthe census count by place of usual residence is adjusted for underenumeration by prorating the distribution of non-responses to the census question on Aboriginal orTorres Strait Islander origin, correcting for errors in age reporting to smooth the agedistribution and reconstituting the population according to expected sex ratios(Benham and Howe 1994). Projections are based on ERPs.
2. It should also be noted that the relatively high growth of the population in majorurban areas is partly illusory owing to the reclassification of Townsville-Thuringowaurban centre from 'other urban' to 'major urban' due to an increase in populationfrom 96,230 in 1986 to 101,398 in 1991. In 1991, the population of Townsville-Thuringowa included 4,716 Aborigines and 1,219 Torres Strait Islanders. If thesenumbers are re-cast for 1991 according to their 1986section-of-State classification,this results in a slight decline in the proportion resident in major urban areas and anincrease in those in other urban areas.
3. This included the cities of Sydney, Brisbane, Melbourne, Adelaide, Hobart, Perth,Canberra, Townsville, Gold Coast, Geelong, Newcastle and Wollongong.
4. Gray (1997: 17) provides a simple example of this effect: if an Aboriginal man and anAboriginal woman each have two children, and the man and woman are married toeach other, then the next generation has exactly the same size as the parents'generation; but if each is married to a non-Aboriginal person, the number of childrenis four and the next generation is twice as large.
5. This is in line with expectation given that indigenous people form a much smallercomponent of the total population in such regions compared to places such as theNorthern Territory.
6. The 1996 CD populations were aggregated to their 1991 boundary equivalents forcomparative purposes. If there were major boundary changes between 1991 and 1996or two or more CDs were amalgamated, then the CDs were not used in thecalculations. The reported results were not sensitive to changing this assumption.
C E N T R E F O R A B O R I G I N A L E C O N O M I C P O L I C Y R E S E A R C H
DISCUSSION PAPER NO. 143 17
References
Altman, J.C. 1992. 'Statistics about indigenous Australians: needs, problems, options andimplications', in J.C. Altman (ed)A National Survey of indigenous Australians: Optionsand Implications, Centre for Aboriginal Economic Policy Research, The AustralianNational University, Canberra.
Altman, J.C. and Gaminiratne, K.H.W. 1994. 'Employment implications of the growth ofthe indigenous Australian working-age population to 2001', Australian Bulletin ofLabour, 20 (1):29-44.
Anderson, I. 1997. 'I, the 'hybrid' Aborigine: film and representation', Australian AboriginalStudies, 1997/1:4-14.
Australian Bureau of Statistics (ABS) 1993. 1991 Census Urban Centres/Localities CodeList, cat. no. 2909.0, ABS, Canberra.
Australian Bureau of Statistics (ABS) 1995. National Aboriginal and Torres Strait IslanderSurvey 1994: Detailed Findings, cat. no. 4190.0, ABS, Canberra.
Australian Bureau of Statistics (ABS) 1996a. Experimental Projections: Aboriginal andTorres Strait Islander Population, June 1991^June 2001, cat. no. 3231.0, ABS,Canberra.
Australian Bureau of Statistics (ABS), 1996b. Census Field Officer Manual Item M21, ABS,Canberra.
Australian Bureau of Statistics (ABS), 1996c. 'When ERPs aren't enough: a discussion ofissues associated with service population estimation', Demography Working Paper96/4, ABS, Canberra.
Australian Bureau of Statistics (ABS) 1997. Births, cat. no. 3301.0, ABS, Canberra.
Barnes, A. 1996. 'Recent developments in the collection of Indigenous statistics', in J.C.Altman and J. Taylor (eds) The 1994 National Aboriginal and Torres Strait IslanderSurvey: Findings and Future Prospects, CAEPR Research Monograph No. 11, Centre forAboriginal Economic Policy Research, The Australian National University, Canberra.
Benham, D. and Howe, A. 1994. 'Experimental estimates of the Aboriginal and TorresStrait Islander population 1986-1991: States/Territories and Australia', DemographyWorking Paper: 94/2, Australian Bureau of Statistics, Canberra.
Choi, C. and Gray. A. 1985. 'An Evaluation of Census Counts of the Aboriginal Population,1971, 1976 and 1981', Occasional Paper No. 1985/2, Australian Bureau of Statistics,Canberra.
Commonwealth of Australia 1997. Bringing Them Home: National Inquiry into theSeparation of Aboriginal and Torres Strait Islander Children from their Families, HumanRights and Equal Opportunity Commission, Sydney.
Dodson, M. 1994. The Wentworth Lecture. The end in the beginning: re(de)finingAboriginality', Australian Aboriginal Studies, 1994/1: 2-13.
Dugbaza, T. 1994. 'Recent trends and differentials in Aboriginal and Torres Strait Islanderfertility: 1981-1991', Demography Working Paper 94/1, Australian Bureau ofStatistics, Canberra.
C E N T R E F O R A B O R I G I N A L E C O N O M I C P O L I C Y R E S E A R C H
18 TAYLOR
Dugbaza, T. 1995. 'Some aspects of Aboriginal family structure and fertility', Aboriginal andTorres Strait Islander Health Information Bulletin, 21 (December): 39-48.
Evans, J., Kahles, D. and Bate, C. 1993. '1991 Census data quality: Aboriginal and TorresStrait Islander counts', Demography Working Paper 93/6, Australian Bureau ofStatistics, Canberra.
Gray, A. 1989. 'Aboriginal migration to the cities'. Journal of the Australian PopulationAssociation, 6 (2): 122-44.
Gray, A. 1990. 'Aboriginal fertility: trends and prospects', Journal of the AustralianPopulation Association, 7 (1) : 57-77.
Gray, A. 1997. The explosion of aboriginality: components of indigenous populationgrowth, 1991-1996', CAEPR Discussion Paper No. 142, Centre for AboriginalEconomicPolicy Research, The Australian National University, Canberra.
Gray, A. and Tesfaghiorghis, H. 1993. 'Aboriginal population prospects'. Journal of theAustralian Population Association, 10 (2): 81-101.
Herron, J. 1996. 9th Annual Joe and Enid Lyons Lecture, University House. The AustralianNational University, Canberra, 15 November 1996.
Hunter, B. 1996. 'Indigenous Australians and the socioeconomic status of urbanneighbourhoods', CAEPR Discussion Paper No. 106, Centre for Aboriginal EconomicPolicy Research, The Australian National University, Canberra.
Hunter, B. 1997. 'The structure of Australian neighbourhoods', unpublished paper. Centrefor Aboriginal Economic Policy Research, The Australian National University,Canberra.
Jones, R. 1994. The Housing Need of Indigenous Australians, 1991, Research MonographNo. 8, Centre for Aboriginal Economic Policy Research, The Australian NationalUniversity, Canberra.
Link-Up (NSW) and Wilson, T.J. 1997. In the Best Interest of the Child? Stolen Children:Aboriginal Pain/White Shame, Aboriginal History Monograph No. 14, AboriginalHistory Inc. Canberra.
Martin, D.F. and Taylor, J. 1996. 'Enumerating the Aboriginal population of remoteAustralia: methodological and conceptual issues', Journal of the Australian PopulationAssociation, 13(1): 17-33.
O'Reilly, J.B. 1994. 'Demographic implications of Aboriginal out-marriage', Journal of theAustralian Population Association, 11 (2): 149-59.
Sandefur, G.D., Rindfuss, R.R. and Cohen, B. 1996. Changing Numbers. Changing Needs:American Indian Demography and Public Health, National Academy Press, WashingtonD.C.
Smith, L.R. 1980a. 'New black town or black new town: the urbanisation of Aborigines', inI.H. Burnley, R.J. Pryor and D.T. Rowland (eds.) Mobility and Community Change inAustralia, University of Queensland Press, St. Lucia.
Smith, L.R. 1980b. The Aboriginal Population of Australia, Australian National UniversityPress, Canberra.
C E N T R E F O R A B O R I G I N A L E C O N O M I C P O L I C Y R E S E A R C H
DISCUSSION PAPER NO. 143 19
Snipp, C.M. 1986. 'Who are American Indians? Some observations about the perils andpitfalls of data for race and ethnicity', Population Research and Policy Review, 5: 237-52.
Taylor, J. and Altman, J.C. 1997. The Job Ahead: Escalating Economic Costs of IndigenousEmployment Disparity, Aboriginal and Torres Strait Islander Commission, Canberra.
Taylor, J. and Bell, M. 1996a. The mobility status of Indigenous Australians', in P.L.Newton and M. Bell (eds) Population Shift: Mobility and Change in Australia, AustralianGovernment Publishing Service, Canberra.
Taylor, J. and Bell, M. 1996b. 'Population mobility and Indigenous peoples: the view fromAustralia', International Journal of Population Geography, 2 (2): 153-69.
Tesfaghiorghis, H. and Gray, A. 1992. 'The demographic structure and location of theAboriginal population: employment projections', in J.C. Altman (ed.), AboriginalEmployment Equity by the Year 2000, Centre for Aboriginal Economic Policy Research,The Australian National University, Canberra.
C E N T R E F O R A B O R I G I N A L E C O N O M I C P O L I C Y R E S E A R C H
Centre for Aboriginal Economic Policy Research
For information on earlier CAEPR Discussion Papers and ResearchMonographs please contact:
Publication SalesCentre for Aboriginal Economic Policy Research
Faculty of ArtsAustralian National University
Canberra ACT 0200Telephone: 02-6279 8211Facsimile: 02 - 6249 2789
Abstracts or summaries of all CAEPR Publicationscan be found at the following WWW address:
http://online.anu.edu/caepr/
MONOGRAPH SERIES
1. Aborigines in the Economy:A Select Annotated Bibliography of Policy-Relevant Research1985-90. L.M. Allen, J.C. Altman and E. Owen (with assistance from W.S. Arthur),1991.
2. Aboriginal Employment Equity by the Year 2000, J.C. Altman (ed.), published for theAcademy of the Social Sciences in Australia, 1991.
3. A National Survey of Indigenous Australians: Options and Implications,J.C. Altman (ed.), 1992.
4. Indigenous Australians in the Economy: Abstracts of Research, 1991-92,L.M. Roach and K.A. Probst, 1993.
5. The Relative Economic Status of Indigenous Australians, 1986-91, J. Taylor, 1993.
6. Regional Change in the Economic Status of Indigenous Australians, 1986-91,J.Taylor, 1993.
7. Mabo and Native Title: Origins and Institutional Implications, W. Sanders (ed.), 1994.8. The Housing Need of Indigenous Australians, 1991, R. Jones, 1994. •9. Indigenous Australians in the Economy: Abstracts of Research, 1993-94,
L.M. Roach and H.J. Bek, 1995.
10. The Native Title Era: Emerging Issues for Research, Policy and Practice,J. Finlayson and D.E. Smith (eds), 1995.
11. The 1994 National Aboriginal and Torres Strait Islander Survey: Findings and FutureProspects, J.C. Altman and J. Taylor (eds), 1996.
12. Fighting Over Country: Anthropological Perspectives, D.E. Smith andJ. Finlayson (eds), 1997.
C E N T R E F O R A B O R I G I N A L E C O N O M I C P O L I C Y R E S E A R C H
RECENT DISCUSSION PAPER SERIES
105/1996 Reforming financial aspects of the Native Title Act 1993: an economicsperspective, J.C. Altman.
106/1996 Indigenous Australians and the socioeconomic status of urbanneighbourhoods, B. Hunter.
107/1996 The comparative economic status of CDEP and non-CDEP communityresidents in the Northern Territory in 1991,J.C. Altman andB. Hunter.
108/1996 Indigenous participation in labour market and training programs,J. Taylor and B. Hunter.
109/1996 The economic status of Indigenous Australian households: a statisticaland ethnographic analysis, D.E. Smith and A.E. Daly.
110/1996 Income poverty among Indigenous families with children: estimatesfrom the 1991 Census, R.T. Ross and A. Mlkalauskas.
111/1996 Having it 'both ways': the continuing complexities of community-controlled Indigenous education, R.G. Schwab.
112/1996 The geographic distribution of unemployment-related benefits andCDEP scheme employment, J.C. Altman and B. Hunter.
113/1996 The Aboriginal and Torres Strait Islander Commercial DevelopmentCorporation: a new approach to enterprise?, W.S. Arthur.
114/1996 CDEP as urban enterprise: the case ofYarnteen Aboriginal and TorresStrait Islanders Corporation, Newcastle, D.E. Smith.
115/1996 The determinants of Indigenous employment outcomes: the importanceof education and training, B. Hunter.
116/1996 Linking accountability and self-determination in Aboriginalorganisations, D.F. Martin and J.D. Finlayson.
117/1996 Aboriginal health and institutional reform within Australian federalism,I. Anderson and W. Sanders.
118/1996 Short-term Indigenous population mobility and service delivery.J. Taylor.
119/1996 indigenous labour force status to the year 2000: estimated impacts ofrecent Budget cuts, B. Hunter and J. Taylor.
12O/1996 Community inuoluement in education; an exploration of AmericanIndian education policy and implications for Australia, R.G. Schwab.
121/1996 Touiards greater autonomy for Torres Strait: political and economicdimensions, J.C. Altman, W.S. Arthur and W. Sanders.
122/1996 Indigenous participation in higher education: culture, choice andhuman capital theory, R.G. Schwab.
123/1996 Estimating the social rate of return to education for IndigenousAustralians, P.M. Junankar and J. Liu.
C E N T R E F O R A B O R I G I N A L E C O N O M I C P O L I C Y R E S E A R C H
124/1996 The right to negotiate and native title future acts: implications of theNative Title Amendment Bill 1996. D.E. Smith.
125/1996 Native title and the petroleum industry: recent developments, options,risks and strategic choices. J.C.Altman
126/1996 Aboriginal economic development and land rights in the NorthernTerritory: past performance, current issues and strategic options. J.C.Altman.
127/1997 Indigenous poverty since the Henderson Report, J.C. Altman andB. Hunter.
128/1997 The opportunity costs of future Indigenous labour force status.J. Taylor.
129/1997 Native Title Representative Bodies: the challenge of strategic planning,J. Finlayson.
13O/1997 The potential impact of the Workplace Relations and other LegislationAmendment Act 1996 on Indigenous employees, B. Hunter.
131/1997 Post-compulsory education and training for Indigenous Australians.R.G. Schwab.
132/1997 A Torres Strait Islanders Commission? Possibilities and issues.W. Sanders and W.S. Arthur.
133/1997 Service provision and service providers in a remote QueenslandCommunity, J.D. Finlayson.
134/1997 Indigenous sole parent families: invisible and disadvantaged,A.E. Daly and D.E. Smith.
135/1997 Utilisation of native wildlife by indigenous Australians: commercialconsiderations, J.C. Altman, L.M.Roach and L.E. Liddle.
136/1997 The interrelationships between arrest and employment: more evidenceon the social determinants of indigenous employment, B. Hunter andJ. Borland.
137/1997 A profile of indigenous workers in the private sector, J. Taylor andB. Hunter.
138/1997 Indigenous TAPE graduates: patterns and implications, R.G. Schwab
139/1997 The right to negotiate and the miner's right: a case study of native titlefuture act processes in Queensland, J.D. Finlayson.
14O/1997 The future shape ofABSTUDY: practical and policy implications of therecent proposed changes, R.G. Schwab and S.F. Campbell.
141/1997 Opportunities and problems astride the welfare/work divide: the CDEPscheme in Australian social policy, W. Sanders.
142/1997 The explosion of aboriginally: components of indigenous populationgrowth 1991-96. A. Gray.
143/1997 Changing numbers, changing needs? A preliminary assessment ofindigenous population growth. 1991-96. J. Taylor.
C E N T R E F O R A B O R I G I N A L E C O N O M I C P O L I C Y R E S E A R C H


![forum.konkurdl.konkur.in/PHD/97/199-E-PHD97-[].pdf · (Turning Torso) 199E , as . 199E -0 (Space Frame) 199E ICF (r Arch Dome (r Barrel Vault (r Cylindrical Shell (f LSF 3D Panel](https://img.pdfslide.net/doc/110x75/5f5cb13df833446b803dd6c9/forumkonkurdl-pdf-turning-torso-199e-as-199e-0-space-frame-199e-icf.jpg)