Embed Size (px)
Citation preview

Caesarstone (NASDAQ:CSTE)
Nothing on the counter.
CSTE’s major revenue growth product, marketed as a collaboration with Lowe’s, is not for sale
according to Lowe’s Customer Services and store checks. This is contrary sell-side forecasts
highlighting this as a growth driver.
Of CSTE’s listed sales agents, there is a growing percentage no longer sell (or have never sold)
CSTE products, switching to higher margin products. Agents who sell CSTE are charging a
higher retail price than consumers pay at IKEA for identical products. Ikea countertops include
free installation!
We believe CSTE’s inventory should be revised materially downwards to reflect decreasing
average selling prices within their larger customers.
SEC enquiries into CSTE revenue growth factors inconsistently addressed by management. The
major revenue variance factor, increased average selling price, is not supported by channel
checks which show prices decreasing at major customers/outlets.
CSTE’s market analysis documents are illogical and over represent their poor market impact.
In reality, the significance of growing competition in the USA goes unaddressed by CSTE. The
market is extremely saturated with big players including Vadara Quartz, headed by the former
CSTE USA division CEO Arik Tendler, and low-opex Asia-Pac players1 who can better compete
on price for a virtually undifferentiated product.
Competitor analysis suggests CSTE are either not maintaining machinery adequately or that
machinery is severely underutilised.
CSTE has consistently missed guidance; a theme we identify and is unlikely to change.
Shareholder friendly programmes discontinued. CSTE is now a negative earnings growth
vehicle with no payout policy.
1 http://vicostone.com/


Disclaimer This report has been prepared for educational purposes only. This report and any statements made in
connection with it are the authors’ opinions, which have been based upon publicly available facts,
field research, information, and analysis through our due diligence process, and are not statements of
fact. This document or any information herein should not be interpreted as an offer, a solicitation of
an offer, invitation, marketing of services or products, advertisement, inducement, or representation
of any kind, nor as investment advice or a recommendation to buy or sell any investment products or
to make any type of investment, or as an opinion on the merits or otherwise of any particular
investment or investment strategy.
Any examples or interpretations of investments and investment strategies or trade ideas are intended
for illustrative and educational purposes only and are not indicative of the historical or future
performance or the chances of success of any particular investment and/or strategy.
As of the publication date of this report, you should assume that the authors have a direct or indirect
interest/position in all stocks (and/or options, swaps, and other derivative securities related to the
stock) and bonds covered herein, and therefore stand to realize monetary gains in the event that the
price of either declines.
The authors intend to continue transacting directly and/or indirectly in the securities of issuers
covered on this report for an indefinite period and may be long, short, or neutral at any time hereafter
regardless of their initial recommendation.


Figure 3 Chardan CSTE note – 11 May 2017
The Chardan valuation is on a similar ‘Hollywood’ justification as other sellside analysts, including
Stifel, who appear to have the most inconsistent valuation on a stock ever:
Figure 4 Stifel CSTE note – 24 March 2017
Earnings misses & downgrades, impromptu management changes, auditor concerns, quality concerns,
increasingly competitive markets, and Kibbutz board backstabbing activism are apparently obscure
concepts to Stifel, who simply provide a hindsight note after a major share price fall, then upgrade a
few weeks later, all on the back of an obscure EV/EBITDA multiple.
On top of this, management embarrassingly had to revise its earnings dowwards on the back of
accounting misstatements, an issue perhaps foreshadowed in Spruce Point pieces.
Lowes CSTE’s 20F4 states that the company “commenced offering our products and related services in several
Lowe’s stores in the United States in the first quarter of 2017”. Management commented further on
this development in the company’s Q1 earnings call5:
“We are already in around 200 stores in few of the states, that Lowe selected.”
4 https://www.sec.gov/Archives/edgar/data/1504379/000117891317000750/zk1719638.htm (20F) 5 https://seekingalpha.com/article/4071800-caesarstones-cste-ceo-raanan-zilberman-q1-2017-results-earnings-call-transcript?part=single

It appears, that the company failed to inform Lowe’s of this latest development or CSTE lack the
foresight to communicate with their end-customers effectively to any material sales.
Our channel checks with Lowes’s Customer Service confirm the Transform™
product is not available at Lowe’s stores as of the date of this report, nor is any
other CSTE product.
Physical channel checks into Lowe’s stores and a review of their online catalogue confirms that no
CSTE product is available for purchase at any Lowe’s store as of the date of this report. Meanwhile,
Lowe’s is stocking what appears to be an increasing catalogue of products from CSTE competitors
Silestone.
There are further concerns over the Transform™ product if it ever enters the market on a large scale
basis. An experienced industry contractor has advised he would be hesitant to fit the product as the
thin quartz layer is likely susceptible to wear and tear and cracking, and overlayed on top of old fittings,
which are susceptible to rot and pungent stale water, causes smells near sinks6. The transform product
is not a permanent solution.
SEC The SEC issued a request for further information to clarify a number of ambiguous statements in
CSTE’s 2015 20-F, specifically in regards to revenue movements (including FX and average selling
prices) and aggregated operating segments.
Management’s address of revenue variance factors do not corroborate with our channel checks.
Increased average selling prices do not reflect ground level pricing, which we have
found to be decreasing, and excessive volume increases do not correspond to the
consensus of the CSTE reseller agents we contacted.
Caesarstone claim to have high quality products. Not only was this disproven by Sprucepoint Capital’s
work7, but also now in CSTE’s own revenue growth and margins8. In CSTE’s own conference,
management were unable to explain how the growth occurred. Management could not explain how
there was an increase in Ikea sales.
IKEA CSTE’s statements about average selling prices are contradicted by their customers' advertised selling
prices.
6 https://www.houzz.com/discussions/4428918/caesarstone-transform-quartz-that-fits-over-your-existing-counters 7 http://www.sprucepointcap.com/cste-ltd-followup/ http://www.sprucepointcap.com/cste-ltd-followup/ 8 http://files.shareholder.com/downloads/AMDA-EF2TF/4640176075x0x932856/DFCF7C3C-5B79-4C84-B0BC-0A5A9E349A63/2016 Caesarstone Annual Report.pdf

Between 2015 and 2017, CSTE's Ikea catalogue prices decreased by between ~3%
and 15% (excluding enticements, and free installation!).
The reality is Ikea is suffering as a result of greater competition in the market place.
Silicosis – The cost of doing business! Silicosis is an emerging risk in workers who process quartz and other silicon dust producing materials.
This is an unknown variable for CSTE. Although provisions have been made for those claims filed, it’s
noteworthy that there is a significant class action that could have a material impact on the company’s
balance sheet, approximately, $56m.
There has been no provision for this $56m class action.
Competition Quartz countertops are undoubtedly a market where competition is growing significantly. Price
reductions are being seen in the range of 3-15% in IKEA alone. IKEA prices their stock at a 18%-35%
discount to identical CSTE reseller retail prices.
With so many companies intending to compete within the marketplace, it is of additional concern that
CSTE USA’s former CEO Arik Tendler has entered the market with a product who's marketing appears
to address many of CSTE’s negative online reviews related highlighting quality concerns.
Comparisons A comparative financial analysis against competitor Silestone reinforces our belief that Caesarstone’s
financial statements are misrepresented. Specifically:
Caesarstone’s marketing expenses are remarkably low, considering they allege to have over
10x distributors in the USA vs Silestone
Caesarstone’s maintenance capex spending is substantially lower than Silestone, despite
CSTE’s higher revenues and COGS
Silestone’s margins (as a premium product) are 20% higher, suggesting less volume sold per
unit of revenue and therefore lower wear & tear machinery expenses
All quartz machinery (incl. frequent wear & tear replacement parts) is bought from niche
group of suppliers with limited price variances.


3. Nothing on the counter at Lowe’s
Caesarstone’s market expansion strategy took on another direction in their most recent filings
announcing a collaboration with Lowe’s™, marketing a new overlay product called Transform™.
CSTE’s 20F12 states that the company “commenced offering our products and related services in several
Lowe’s stores in the United States in the first quarter of 2017”.
It appears that either the company failed to inform Lowe’s of this latest development or the time
expectations of commercialising this agreement are entirely flawed. The product is not available at
Lowe’s stores via Customer Service for purchase, pre-order or samples as of the date of this report.
In fact, Lowe’s Customer service has never heard of this product!
Lowe’s in-store channel checks Analysts and investors should check Lowe’s sales channels before suggesting its significance as a
growth driver.
We spoke with Lowe’s on multiple occasions from the time of CSTE’s first collaboration
announcement13 (8 February 2017) to the date of this report making extensive inquiries. Not one of
Lowe’s customer service representatives we spoke to was able to locate Caesarstone’s Transform™
product (or any CSTE product)!
Two customer service agents suggested we try Ikea™ or purchasing another product: Silestone. It is
worthwhile noting that while Lowe’s stocks no Caesarstone of any kind, they have an extensive range
of Silestone and a few other brands, including their own brand.
Not one of Lowe’s customer service representatives we spoke to were able to
locate Caesarstone’s Transform™ product! (Or any Caesarstone product
whatsoever)
The sell side are expecting a material upside in the Lowe’s collaboration and a reputed revenue
‘growth driver’. Based on this data, it's likely investors are going to be left materially disappointed.
Figure 5 Stifel Earnings Analysis – 8 Feb 2017
12 https://www.sec.gov/Archives/edgar/data/1504379/000117891317000750/zk1719638.htm (20F) 13 http://ir.caesarstone.com/secfiling.cfm?filingID=1178913-17-338&CIK=1504379

Online channel check We conducted an online search on Lowe’s website searching by brand (search term: Quartz
Countertops*) 14 (Accessed June 07, 2017).
Figure 6 Lowe's Website Results - Search Term Quartz Countertops
*Other failed search terms included ‘Transform Worktop, Caesarstone, and Overlay Worktop
A Caesarstone product search on Lowe’s website returned no results, and instead
offered a healthy range of competitors’ products.
Key Takeaways Despite extensive searches, both in-store, via customer services and Lowe’s website, there was no
evidence of a Transform roll-out programme. There was no product sample availability, no staff
awareness of the product and Lowe’s customer service advised there was no pre-order availability for
any “Transform™” or Caesarstone product.
Investors in CSTE would be wise to consider Lowe’s spring sales are a key period for the company, as
with most home-center retailers15. Despite stating sales were expected to start in 2017 Q1,
Caesarstone have clearly missed this window of opportunity that the building products sector has
traditionally been reliant on.
Additionally, if the Transform™ product becomes available at Lowe’s at some stage in the future,
investors would be wise to consider:
Lowe’s is a mass-market retailer with no premium status, similar to IKEA, and such an
agreement will further destroy whatever remaining premium-brand recognition CSTE has
left16.
CSTE will have to play "Lowe’s-margin" game
Offering a cheaper substitute product through Lowe's would further deteriorate earnings
through cannibalisation as CTE would essentially be undercutting themselves.
14 https://web.archive.org/web/20170614125742/https://www.lowes.com/pl/Kitchen-countertop-samples-Kitchen-countertops-accessories-Kitchen/4294735654?refinement=4294772983 (Lowe’s Quartz Worktop Search) Accessed: June 14, 2017 15 https://newsroom.lowes.com/news-releases/lowes-seasonal-hiring/ 16 See Spruce Point’s CSTE research for more details on why CSTE is not a premium product - http://www.sprucepointcap.com/cste-ltd/

4. Sales Channels – increased competition, fabricated product
offerings & phantom agentsWe conducted substantial channel checks into agents listed on CSTE’s website and into product lines
over the last 3 months. Our main findings were that:
The Transform™ product is so far unavailable for purchase at Lowe’s.
CSTE’s supply chain is filled with phantom agents who no longer sell (and in many instances,
have never sold) Caesarstone products.
With apparent lack of supply chain management, we doubt that CSTE attempting to recover
any stock they have loaned or extended on credit terms to its reseller agents
A decline in prices over the past year and CSTE’s market being more competitive, it raises the
question as to the real value of their inventory and finished goods. It is our view that CSTE
have to revalue their in-house finished goods inventory and inventory held by resellers
represented within CSTE’s accounts receivable.
CSTE USA’s former CEO Arik Tendler appears to have entered the USA market with a superior
product under the brand Vadara Quartz. Vadara's marketing appears to address quality issues
that plague Caesarstone online reviews (cracking/chipping, staining17 & using chemicals18).
Our channel checks suggest CSTE is meeting their demand straight from the
production line, and reseller built up inventory appears to be unpopular stock
which is difficult to sell.
Poor sales channel management Industry professionals indicate that the market place is significantly more competitive, raising the
question as to whether CSTE can afford to be failing so miserably in managing their customer referral
points.
OMNI-Channel marketing 101 suggest CSTE are ignoring all the basic rules. In the USA, U.K. and
Australian Markets there is an apparent failure to maintain basic up-to-date reseller agent
information. There was basic referral information missing such as email, website and/or telephone
details.
An industry professional questioned ‘whether there is any management of
Caesarstone’s sales channels at all.’
As a comparison, Silestone’s US agent and supplier list appears well maintained, with basic rules of
online sales and referrals being followed.
17 https://countertopinvestigator.com/caesarstone-countertops/ 18 http://ths.gardenweb.com/discussions/2698923/caesarstone-staining
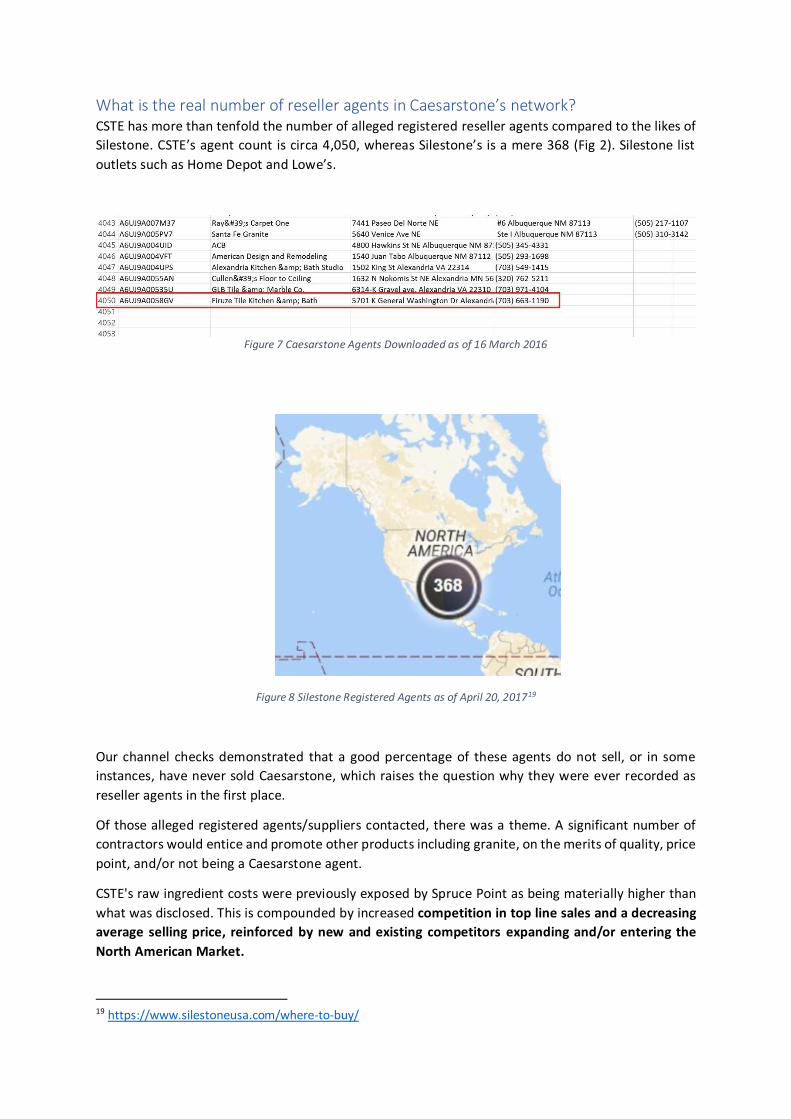
What is the real number of reseller agents in Caesarstone’s network? CSTE has more than tenfold the number of alleged registered reseller agents compared to the likes of
Silestone. CSTE’s agent count is circa 4,050, whereas Silestone’s is a mere 368 (Fig 2). Silestone list
outlets such as Home Depot and Lowe’s.
Figure 7 Caesarstone Agents Downloaded as of 16 March 2016
Figure 8 Silestone Registered Agents as of April 20, 201719
Our channel checks demonstrated that a good percentage of these agents do not sell, or in some
instances, have never sold Caesarstone, which raises the question why they were ever recorded as
reseller agents in the first place.
Of those alleged registered agents/suppliers contacted, there was a theme. A significant number of
contractors would entice and promote other products including granite, on the merits of quality, price
point, and/or not being a Caesarstone agent.
CSTE's raw ingredient costs were previously exposed by Spruce Point as being materially higher than
what was disclosed. This is compounded by increased competition in top line sales and a decreasing
average selling price, reinforced by new and existing competitors expanding and/or entering the
North American Market.
19 https://www.silestoneusa.com/where-to-buy/

It’s likely that CSTE’s biggest customer after Ikea is their own marketing department. If CSTE's reseller
database is accurate, they would require a significant volume of samples.
Given the spread of their reseller network, it’s no wonder that CSTE’s forecasted revenues in Ikea (the
largest customer to date) is a “finger in the wind exercise” and subject to SEC enquiries20.
With a lack of supplier management, we pose the question: what is the cost of display items and
stock on loan to resellers who are no longer selling Caesarstone products? Should agent inventory
be reflected on CSTE’s accounts or on a returns basis if it is not sold a end user, it is our view that CSTE
will have to impair their finished goods inventory held by such agents, (i.e. receivables impairment).
Australia It is difficult to assess CSTE’s commercial relationship footprint in Australia; its second largest market.
There appears to be a significant lack of reselling agents:
http://www.caesarstone.com.au/find-a-display
Only one display room is listed in Sydney, a CSTE branded showroom, and only two in Melbourne,
despite these being high population areas. With competition increasing, CSTE appear to be falling
behind its competitors on a real, targeted footprint basis.
U.K. It appears that CSTE has purchased or collated a defunct database of kitchen fitters, worktop
fabricators and suppliers and transformed this into a reseller catalogue. There is a similar theme to
the USA where agents are either no longer operating, no longer sell Caesarstone, are exclusive to
competitors or have never sold CSTE products.
20 https://www.sec.gov/Archives/edgar/data/1504379/000117891317000754/zk1719670.htm

5. The Transform IssueMuch hype has surrounded CSTE’s new line at Lowe's, expected to have commenced sales Q1 2017:
the 13mm quartz overlay branded as the Transform range. The range is being marketed as a new
alternative to traditional benchtops by fitting a 13mm overlay onto an existing worktop21. Note that
prior to this announcement Caesarstone has never sold 13mm thickness quartz as a countertop option
in the North Americas.
On face value investors would be excited about a new product reaching an as-yet untapped market,
however Caesarstone’s international sales websites tell a different story. Our channel checks suggest
Transform is a repackaged pre-existing product that has been available for sale in overseas market as
far back as March 2016.
22
Pure White 13mm thickness on Australian website dated 13/4/2016
21 http://www.caesarstoneus.com/newsroom/transform/transform/ 22 https://web.archive.org/web/20160314111106/http://www.caesarstone.com.au:80/colour/1141-pure-white

23
Frosty Carrina 13mm thickness on Australian website dated 15/4/2016
13mm product options are listed on many of CSTE's international websitese including but not limited
to Brazil, Australia, the UK and Israel.
Caesarstone has also sold the 13mm quartz in North America before in some of the same colour ranges
as the Transform product but as bathroom splashbacks, not countertops.
23 https://web.archive.org/web/20150315011937/http://caesarstone.com.au/colour/5141-frosty-carrina

The reality of the situation is that Caesarstone’s Transform is likely a mish-mash of 13mm products
that were unsellable overseas and are now being repackaged as a low-margin solution through Lowe's,
in the hope of avoiding substantial inventory impairments.
Is Lowes transform old stock that CSTE were unable to sell, and is now being
repackaged in the hope of avoiding inventory writedowns?
13mm products sold as splashbacks, what are the cracking and heat fracture
risks?

6. Increasing competition
CSTE’s understatement of the year:
“We have also experienced instances of our competitors marketing products with
similar appearances and similar model names to some of our products.
Competition of this nature may increase in the markets in which we operate and
may develop in new markets.24”
Increased Competition The market is becoming significantly more competitive, with the following brands recently entering
into competing with CSTE in the North Americas:
Arenastone
Cimstone
Diresco
Hanstone
Okite
Quarella
Quartz Compac
Quantra (Pokarna Quartz)
Stone Italiana
Radianz by Samsung
Technistone
Trafficstone
Unistone
Vadara Quartz
Vicostone
Zodiaq by Dupont
In addition established players such as Pokarna Quartz have aspirations to expand their US footprint25 26.
These competitors have advantages over CSTE, be they input costs, cost of labour, FX benefits or
quality claims. Based on CSTE’s projections and forecasts, they appear to be ignoring the bottom- and
top-line risks including the carrying value of their ever-increasing inventory and finished goods.
Competition is hotting up globally, with established producers increasingly competing for the same
international market share. Examples being Cambria – a big US quartz manufacturing company moving
24 https://www.sec.gov/Archives/edgar/data/1504379/000117891317000750/zk1719638.htm 25 http://www.stoneupdate.com/news-info/company-insider/1283-pokarna-to-make-48-million-quartz-investment 26
http://www.quantra.in/

into international markets27. “developing the strategic and operational structure for expanding sales,
marketing and distribution of Cambria worldwide.”
Vadara Quartz – another slab in the back for CSTE Mr Arik Tendler is the former CSTE USA CEO and accredited with the expansion and early development
of the Company. The former USA division CEO also appears to be a reader of Spruce Point’s research.
We speculate that Arik Tendler identified the issues and inferior levels of quartz in Spruce Point's
previous report28.
Mr Tendler is now CEO of Vadara Quartz29,30a relatively new brand within the quartz worktop market.
Vadara appear to address quality issues Spruce Point have previously raised and that plague
Caesarstone’s online reviews (cracking/chipping, staining31 & using chemicals32), which appear to be a
deterrent to purchasing CSTE’s worktops. Vadara Quartz appears to have addressed concerns of
consumers and tested their products to the following:
Figure 9 Extract from Vadara Quartz Quality & Performance Claims 33
Key Takeaways If production is ramping up in CSTE’s new facility, where is the demand for this?
Agents we have contacted suggest is that CSTE is not a quality product, and most prefer to
redirect us to other hard surface worktops.
Some agents, despite being registered as suppliers/contact points to purchase CSTE products
either do not sell it (in some cases, have never sold it) or actually are registered distributors
and/or agents for other products.
We believe CSTE wants to give the impression of a company with greater reach, depth and
market share than the reality.
Arik Tendler, accredited with the development and expansion of CSTE, is now in direct
competition with Caesarstone.
27 https://www.cambriausa.com/About-Us/news-events/cambria-international-announcement/
28 http://www.sprucepointcap.com/cste-ltd/ (Page 9) “Quartz Supply Contracts, Lab Tests Suggest Product and Financial Misrepresentations” 29 https://www.linkedin.com/in/arik-tendler-2750b84a/ 30 http://www.vadaraquartz.com/aboutus 31 https://countertopinvestigator.com/caesarstone-countertops/ 32 http://ths.gardenweb.com/discussions/2698923/caesarstone-staining 33 http://www.vadaraquartz.com/aboutus

7. SEC gets involved in ambiguous disclosuresOn September 26 2016 the SEC issued a request for further information in order to clarify a number
of ambiguous statements in the company’s 20-F34.
While these requests are SEC filings attached to the CSTE ticker, they are nowhere to be found on
CSTE’s “SEC Filings” section of their website.
Management’s address of revenue variance factors do not correlate with our channel checks.
Specifically, increased average selling prices do not reflect ground level pricing, which we have found
to be decreasing, and excessive volume increases do not correspond to the consensus of CSTE resellers
we contacted.
The Average Selling Price & IKEA ambiguities The SEC questioned CSTE's revenue variance35.
Figure 10 – SEC Query re ambiguity of revenue variance factors
CSTE responded as follows36:
Figure 11 – CSTE response to SEC Query re ambiguity of revenue variance factors
34 https://www.sec.gov/Archives/edgar/data/1504379/000000000016094507/filename1.pdf 35 SEC Letter – 26 Sep 2016 – https://www.sec.gov/Archives/edgar/data/1504379/000000000016094507/filename1.pdf 36 CSTE Response to SEC Letter – https://www.sec.gov/Archives/edgar/data/1504379/000117891316006696/filename1.htm

The following year’s 20-F provided insight into various metrics which we address below:
Figure 12 – 2016 Revenue Movement concerns
Forecasting, Competition With increased competition, margin pressures and a sales network that needs serious updating, it’s
no wonder CSTE are the subject of SEC enquiries relating to the inherent risks in their forecasts37.
CSTE’s financial forecasting is akin to holding their finger in the wind.
Increased Volume? The consensus from the resellers we have contacted is that CSTE is not a quality product, and many
prefer to redirect us to other hard surface worktops. We actively saw merchants moving away from
this product. How is it that the largest portion of CSTE’s FY 2016 growth was driven by increased
volumes?
Increased Average Selling Price? Our comprehensive channel checks showed no increase in the prices of CSTE products at over the last
two years. In fact, a review of Ikea’s catalogue shows that stock prices are generally decreasing38, 39
Figure 13 – IKEA Sektion price list – FY 2015
37 https://www.sec.gov/Archives/edgar/data/1504379/000000000016094507/filename1.pdf 38 http://www.ikea.com/ms/en US/pdf/buying guides fy15/sektion/SEKTION-bg-ct.pdf 39
http://www.ikea.com/ms/en US/pdf/buying guides fy17/SEKTION countertops sinks faucets bg 080216.pdf


Unfavourable movements to the AUD & CAD? Canada and Australia make up approximately 40% of CSTE’s revenue, or c. $215m. This end figure was
negatively impacted by forex movement to the tune of ~ 18%. We question the implication that
volume has offset an 18% move in forex. We have already expressed our reservations on CSTE’s
alleged volume growth:
Figure 17 – Segment revenue

8. IKEA: Caesarstone’s high-margin cannibalisationOur extensive channel checks identified that CSTE’s IKEA offerings are also offered by independent
contractors, only IKEA’s prices their stock at a 18%-35% discount to CSTE contractors’ retail price.
The contractor price list A USA based CSTE agent was kind enough to provide a copy of his retail price list of CSTE stock, as
follows:
Figure 18 – Reseller retail price list
The IKEA Sektion catalogue Note that many of the above listed designs are also available at Ikea:40
40 IKEA FY 2017 Sektion catalogue (pg. 9) http://www.ikea.com/ms/en US/pdf/buying guides fy17/SEKTION countertops sinks faucets bg 080216.pdf

Figure 19 – IKEA Sektion catalogue
Despite being identical products, IKEA’s buyer catalogue is between 18% and 35% cheaper than the
regular CSTE agent’s retail price, and includes installation!41
41 IKEA FY 2017 Sektion catalogue (pg. 19) http://www.ikea.com/ms/en US/pdf/buying guides fy17/SEKTION countertops sinks faucets bg 080216.pdf
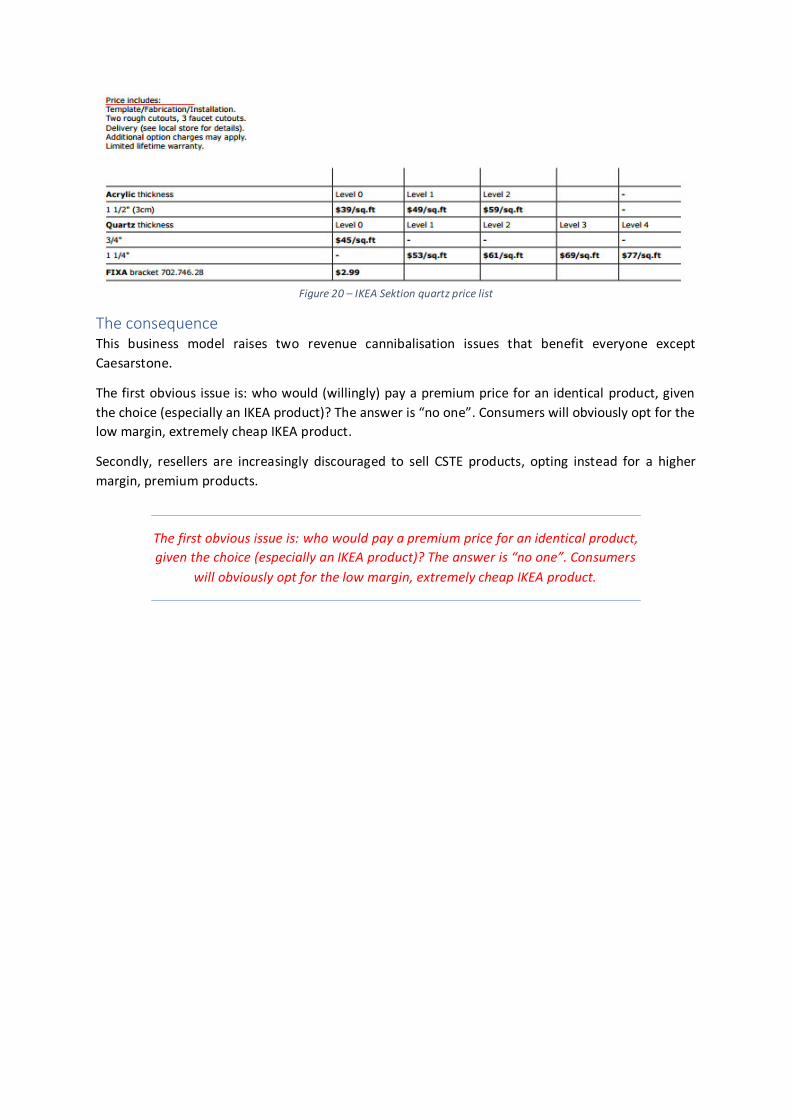
Figure 20 – IKEA Sektion quartz price list
The consequence This business model raises two revenue cannibalisation issues that benefit everyone except
Caesarstone.
The first obvious issue is: who would (willingly) pay a premium price for an identical product, given
the choice (especially an IKEA product)? The answer is “no one”. Consumers will obviously opt for the
low margin, extremely cheap IKEA product.
Secondly, resellers are increasingly discouraged to sell CSTE products, opting instead for a higher
margin, premium products.
The first obvious issue is: who would pay a premium price for an identical product,
given the choice (especially an IKEA product)? The answer is “no one”. Consumers
will obviously opt for the low margin, extremely cheap IKEA product.

9. Silicosis – cost of doing business
The elephant in the room
Silicosis liabilities have a significant range of assumption issues, on the one hand the company made
provisions for the legal action to date, after insurance of circa $19M. So far there had been no
provisions for the class-action suit that was filed in 2014 (circa $56M) , the progress of this case is
unknown to date. 42
Prudence dictates that these legal claims should be risked into any price target going forward. 43 CSTE
discreetly mention that “Consistent with the experience of other companies involved in silica-related
litigation, there may be an increase in the number of asserted claims against us.”
“Consistent with the experience of other companies involved in silica-related
litigation, there may be an increase in the number of asserted claims against us.”
42 https://www.sec.gov/Archives/edgar/data/1504379/000117891317000750/zk1719638.htm 43 http://www.themarker.com/markets/1.3931649

10. Caesarstone vs. Silestone – financial comparisonA comparative financial analysis against Silestone (a.k.a. Cosentino) reinforces our belief that
Caesarstone’s financial statements are misrepresented. Specifically:
Caesarstone’s marketing expenses are remarkably low considering they allege to have over
10 times as many distributors in the USA as Silestone.
Caesarstone’s maintenance capex spending is substantially lower than Silestone’s, despite
CSTE’s higher revenues and COGS.
Silestone’s margins are 20% higher, suggesting less volume sold per unit of revenue and
therefore lower wear & tear machinery expenses.
All quartz machinery (incl. frequent wear & tear replacement parts) are bought from niche
group of suppliers with limited price variance44.
We believe that CSTE is either not properly maintaining its assets, or overstating its sales volume and
revenue while PPE remains underutilized.
Unlevered modelling exercise In order to make a fair comparison, we have derived unlevered operational cash-flows for both
businesses over a 5-year period - CSTE ending in FY 2016, Silestone ending FY 2015 as FY 2016 results
have not yet been released.
In order to remove the effects of growth, we have estimated maintenance capex as the D&A recorded
for the given year. This is fundamentally the value of the assets that will have to be replaced in order
for the businesses to continue its operations.
This analysis highlights what was already apparent at first glance of the accounts: Caesarstone's free
cash flow is inexplicably and illogically better than its competitors. Note that while we have modelled
in CSTE’s lower tax rate, this does not affect our comparative analysis conclusions.
Marketing Expenses CSTE’s marketing expenses have averaged around 13% of revenues over the last four years. We
derived marketing expenses from Silestone’s account by way of elimination45, which appear to be in
the region of 20% of their revenue over the last 2 years. In any case, Silestone have much higher OPEX
overall per Figure 21 below46.
As mentioned through this report, CSTE has over 10 times more distributors than Silestone. CSTE’s
marketing expenses do not reflect this enormous client upkeep with a maintenance cost consequence.
This was reflected in our channel checks where a numerous CSTE’s listed agents simply did not sell the
product.
44 http://www.breton.it/engineeredstone/en#ad-image-0 45 Salaries accounted for, only other costs could be admin, which, given high salaries, are presumably done in house and thus would not be recognised as “External Services”. 46 Silestone FY 2014 Financial Statements. Note: Note: we were unable to retrieve full financial statements for FY 2015, only raw financial data sourced from S&P Capital IQ.

Figure 21 – Silestone (Cosentino) Financial Statements FY 2014
Maintenance Capex As a prelude: all quartz manufacturers buy their machinery from a limited number of manufacturers
and suppliers which are niche to the industry. Industry experts and competitors have advised that
these machines suffer a measurable amount of wear and tear with parts requiring replacement after
a given “mileage” (think of tread on car tires). It is therefore reasonable to assume that CSTE’s
depreciation and maintenance capex schedule would be very similar to its competitors. It is not.
Note that we are discussing maintenance capex, not any other type of acquisition or expansion based
investment outflows, examples of which can be seen over Figures 22 & 23.

Figure 22 – CSTE FY 2015 Financial Statements
Figure 23 – CSTE FY 2016 Financial Statements
Our analysis removed the capital structure effects on the business, transaction costs, minority interest
earnings, and one-time costs. The results can be found on the next the page and are labelled Figures
24 & 25.
EBITDA Margins Readers should also note that Silestone’s EBITDA margins have also declined by over 6 percentage
points over the last 5 years, reflecting the increasingly competitive market in which it operates.
Despite having substantially lower gross margins (almost 20 percentage points!), CSTE’s EBITDA has
grown in the midst of competition and has overtaken Cosentino’s margins!
This means CSTE had to make up more than 20 percentage points of revenue in savings from marketing
or staff cuts just to make up the proportional COGS difference between the two.

NOTE: CSTE figures are in USD, Cosentino figures are in EUR
Figure 24 – Cosentino Unlevered Maintenance Cashflow Assumptions
Figure 25 – CSTE Unlevered Maintenance Cashflow Assumptions
COSENTINO 2010 2011 2012 2013 2014 2015
Revenue 248.3 231.0 253.0 283.4 305.8 367.1
Cost Of Goods Sold 94.2 95.3 104.4 126.4 138.8 153.7
Gross Profit 154.2 135.7 148.6 157.1 167.0 213.4
Gross Margin 62% 59% 59% 55% 55% 58%
Selling General & Admin Exp. (91.3) (83.9) (94.9) (101.5) (111.1) (145.0)
Depreciation & Amort. (21.4) (17.6) (13.1) (13.4) (18.1) (32.9)
Other Operating Expense/(Income) (2.1) (1.8) (2.7) (2.4) (1.9) (2.7)
Operating Expenses (incl. D&A) (114.8) (103.3) (110.7) (117.3) (131.0) (180.6)
Operating Income 39.4 32.4 37.9 39.8 35.9 32.8
EBITDA 60.8 50.0 51.0 53.2 54.0 65.7
Margin 24.5% 21.7% 20.1% 18.8% 17.7% 17.9%
Unlevered Assumptions
EBIT 39.4 32.4 37.9 39.8 35.9 32.8
Tax (25% tax rate) (9.8) (8.1) (9.5) (9.9) (9.0) (8.2)
Add: D&A 21.4 17.6 13.1 13.4 18.1 32.9
Unlevered Cashflow From Ops (exp.) 50.9 41.9 41.5 43.2 45.0 57.5
Capex (assume D&A for maintenance) (21.4) (17.6) (13.1) (13.4) (18.1) (32.9)
Cash from ops/ CAPEX 2.382 2.383 3.166 3.233 2.489 1.747
FCF 29.5 24.3 28.4 29.8 26.9 24.6
COGS 94.2 95.3 104.4 126.4 138.8 153.7
Capex/COGS (0.227) (0.184) (0.126) (0.106) (0.130) (0.214)
CAESARSTONE 2011 2012 2013 2014 2015 2016
Revenue 259.7 296.6 356.6 447.4 499.5 538.5
Cost Of Goods Sold 149.6 168.3 197.7 257.5 299.3 326.1
Gross Profit 110.1 128.3 158.8 189.9 200.2 212.5
Gross Margin 42% 43% 45% 42% 40% 39%
Selling General & Admin Exp. (64.8) (76.3) (84.1) (92.0) (96.1) (110.5)
Depreciation & Amort. (incl. in SG&A) (11.2) (10.5) (11.6) (14.0) (19.2) (25.9)
R & D Exp. (2.5) (2.1) (2.0) (2.6) (3.1) (3.3)
Operating Expenses (incl. D&A) (67.3) (78.4) (86.1) (94.6) (99.2) (113.8)
Operating Income 42.8 49.8 72.7 95.3 101.0 98.7
EBITDA 54.0 60.4 84.4 109.2 120.3 124.6
Margin 20.8% 20.4% 23.7% 24.4% 24.1% 23.1%
Unlevered Assumptions
EBIT 42.8 49.8 72.7 95.3 101.0 98.7
Tax (15% tax rate) (6.4) (7.5) (10.9) (14.3) (15.2) (14.8)
Add: D&A 11.2 10.5 11.6 14.0 19.2 25.9
Unlevered Cashflow From Ops (exp.) 47.6 52.9 73.4 95.0 105.1 109.8
Capex (assume D&A for maintenance) (11.2) (10.5) (11.6) (14.0) (19.2) (25.9)
Cash from ops/ CAPEX 4.255 5.018 6.318 6.795 5.463 4.235
FCF 36.4 42.4 61.8 81.0 85.9 83.9
COGS 149.6 168.3 197.7 257.5 299.3 326.1
Capex/COGS (0.075) (0.063) (0.059) (0.054) (0.064) (0.080)

Comparison to actual figures Cosentino spent c. €33.5m (US$43m, assuming a conservative €1 = US$1.3) on PPE in FY 2014.
Cosentino did not expand its operations in 2014.
Figure 26 – Cosentino FY 2014 Statement of cash flows extract
Cosentino’s sales in FY 2014 were €291m, or US$378m

In 2016, which was a non-expansionary year for CSTE, it spent a mere US$23m on PPE:
Figure 27 – CSTE FY 2016 Statement of cash flows extract
As a means of comparison, consider the following:
CSTE’s FY 2016 revenue was US$538m, against US$378m by Silestone in FY 2014.
CSTE’s gross margin was 39%, compared to Silestone’s 57%.
Given all the machinery and frequent wear and tear parts are provided by, fitted and maintained by a
limited number of niche suppliers with limited cost variables, it is reasonable to presume that :
Cost per unit of volume sold in both factories are the roughly the same
Silestone’s higher margin suggests less sales volume is required per US$1 of revenue.
Silestone’s would be expected to require less maintenance costs associated with wear and
tear
We note that the suppliers for the equipment are based in the Euro zone, however even the
appreciation of the USD does not compensate for this massive discrepancy.
We have no idea how CSTE can spend so little on its CAPEX; but we can hazard a guess. We believe
maintenance is down because production is down, either that or CSTE is failing to maintain its
machines in good order.
Both are equally damning.
We believe the SEC are similarly suspicious on CSTE’s incredible margins and low maintenance capex.
It issued a letter on 26 September 2016 asking why US production lines and Israel production lines
are aggregated into a single reporting segment, reducing visibility on utilisation of each plant47:
47 https://www.sec.gov/Archives/edgar/data/1504379/000000000016094507/filename1.pdf

Figure 28 – SEC Letter Extract – September 26 2016
We believe it would be prudent for the SEC to persist in this matter, as the financial evidence suggests
that it is not feasible for CSTE to achieve their reported results. We believe transparency into CSTE’s
reportable segments would ultimately prove our thesis.


Figure 32 – CSTE market penetration in key markets
Consider the following You could calculate CSTE’s alleged 14% quartz penetration in the USA backwards. CSTE's North
American revenue should be as follows according to Freedonia data:
$96,000𝑚 𝐺𝑙𝑜𝑏𝑎𝑙 𝑆𝑎𝑙𝑒𝑠 × 15% 𝑄𝑢𝑎𝑟𝑡𝑧 𝑃𝑟𝑒𝑓𝑒𝑟𝑒𝑛𝑐𝑒 × 26% 𝑁𝑜𝑟𝑡ℎ 𝐴𝑚. 𝑆𝑒𝑔𝑚𝑒𝑛𝑡
× 14% 𝐶𝑆𝑇𝐸 𝑈𝑆 𝑀𝑎𝑟𝑘𝑒𝑡 𝑃𝑒𝑛𝑒𝑡𝑟𝑎𝑡𝑖𝑜𝑛 = $524𝑚
$524m is 97% of total revenues in FY 2016, and 70% more than CSTE’s reported
North American segment revenue of $308m.
The pie charts provided by management separate geographies and countertop type demands based
on volume, not revenue. However if we were to translate these pie charts into revenue, we would
expect that:
Premium countertop materials (Granite, Marble and Quartz) would be more heavily weighed
than non-premium products (laminate, solid surface, other), as premium products are
obviously more expensive. For example, where Quartz represents 15% of countertops by
volume, we would expect it to represent >15% by revenue.
Developed geographies would be more heavily weighted than less-developed geographies.
For example, we would expect a countertop to be more expensive in North America than in
Latin America or Asia. Therefore North America’s demand distribution of revenue would be
greater than its distribution of volume (i.e. >26%)
North America/Granite would have a larger revenues relative to volumes, making
our calculations conservative.
We back tested these calculations using Australian geographical data. CSTE’s Australian segment
comprises 24.3% of total revenue, with market volume comprising (allegedly) 2% of global demand
and where they claim to have 45% market penetration. Therefore:
45% ∗ 2%
24.3%= 𝐺𝑙𝑜𝑏𝑎𝑙 𝑝𝑜𝑟𝑡𝑖𝑜𝑛 𝑜𝑓 𝑟𝑒𝑣𝑒𝑛𝑢𝑒𝑠 𝑓𝑟𝑜𝑚 1% 𝑜𝑓 𝑡ℎ𝑒𝑖𝑟 𝑠𝑎𝑙𝑒𝑠 = 0.037
0.037 ∗ (41.3% + 15.9%) = 𝐶𝑆𝑇𝐸 𝑁𝑜𝑟𝑡ℎ 𝐴𝑚. 𝑠𝑎𝑙𝑒𝑠 𝑎𝑠 % 𝑜𝑓 𝑔𝑙𝑜𝑏𝑎𝑙 𝑠𝑎𝑙𝑒𝑠 = 2.116%
2.116%
26% (𝑁𝑜𝑟𝑡ℎ 𝐴𝑚. % 𝑜𝑓 𝑔𝑙𝑜𝑏𝑎𝑙 𝑑𝑒𝑚𝑎𝑛𝑑)= 𝟖. 𝟏𝟒% 𝒎𝒂𝒓𝒌𝒆𝒕 𝒑𝒆𝒏𝒆𝒕𝒓𝒂𝒕𝒊𝒐𝒏 𝒊𝒏 𝑼𝑺𝑨

CSTE alleges 14% market penetration in North America.
Whilst this calculation does not consider countertop material preference by geography or even by
volume, it would certainly be a stretch to say that the product mix of surfaces in Australia is so
substantially different to that of the USA, as the calculation is derived from Australian figures.
The mismatch speaks volumes. We believe either:
- CSTE’s performance is not correlated to the global market in which case the data is useless.
- CSTE’s market penetration figures are inflated in which case the data is wrong
Year-on-year quartz growth The surface demand mix increase yoy for quartz countertops appears extreme considering that:
There was an obvious recommendation and sales data channel checked countertop fitters
which suggest a preference towards granite or quartz.
Granite and quartz are the same price
While Quartz surface has grown in the product mix by 50% since 2014, granite’s mix has stayed flat:
Figure 33 – 2014 Global countertop demand by type
Figure 34 – 2016 Global countertop demand by type

Key takeaways We believe Freedonia’s marketing material is a redundant exercise, and the SEC should seek more
clarity into:
Verification of CSTE’s geographical segment data
Authentication of CSTE’s market research data


Announces buyback.
The stock declines significantly but bounces back on the support of the corporate buyback.
Q1’2016 (May 2016) 54
Company reiterates full year guidance, stock rallies.
CEO Shiran abandons what we believe is a sinking ship, just 20 days after reiterating full year
guidance55.
Nov 2, 2016 Q3 56
CSTE Revises 2016 Guidance downward significantly.
Q4’16 Results (Feb 2017) 57
CSTE issues guidance which shows revenue growth, but a decline in adjusted EBITDA (and by
extension EPS)
The Company issued guidance for the full-year of 2017. It expects its 2017 revenue to be in
the range of $580 million to $595 million, and adjusted EBITDA to be in the range of $119
million to $126 million.
Company promotes the Lowe's deal
Takeaway - Looking back you can see this 2017 EBITDA range is even lower than the range that was
forecasted in the same period in 2015!
CSTE Stifel analyst ascribes a 9% improvement in numbers for the full year 2017. They best get their
skates on as near two quarters are over and we have found no evidence of CSTE’s sub-premium
Transform product at Lowe’s.
March 24, 2017
Stifel analyst upgrades to buy
Shares rallied post publication
54 https://www.sec.gov/Archives/edgar/data/1504379/000117891316005256/exhibit 99-1.htm 55 https://www.sec.gov/Archives/edgar/data/1504379/000117891316005512/Exhibit 99-1.htm 56 https://www.sec.gov/Archives/edgar/data/1504379/000117891316006751/exhibit 99-1.htm 57 https://www.sec.gov/Archives/edgar/data/1504379/000117891317000338/exhibit 99-1.htm

13. ConclusionDue to the irregularities displayed in CSTE’s accounts, we have not derived a target price, as we
would have incorporated too many assumptions.