Embed Size (px)
Citation preview

Marta Isabel Silva Dias Licenciada em Biologia Celular e Molecular
Caffeine Effects on the Gene Expression Profile of
iPSC-derived Neuronal Cells
Dissertação para obtenção do Grau de Mestre em Genética Molecular e Biomedicina
Orientador: Assoc. Prof. Carsten O. Daub, Karolinska Institutet
Júri:
Presidente: Dr. Paula Gonçalves, PhD, Assistant Professor Arguente(s): Dr. Sara Xapelli, PhD Vogal(ais): Dr. Pedro Baptista, PhD, Associate Professor
Setembro de 2017

ii

iii
Caffeine Effects on the Gene Expression Profile of iPSC-derived Neuronal Cells
Copyright Marta Isabel Silva Dias, FCT/UNL, UNL
A Faculdade de Ciências e Tecnologia e a Universidade Nova de Lisboa têm o direito, perpétuo e
sem limites geográficos, de arquivar e publicar esta dissertação através de exemplares impressos
reproduzidos em papel ou de forma digital, ou por qualquer outro meio conhecido ou que venha a ser
inventado, e de a divulgar através de repositórios científicos e de admitir a sua cópia e distribuição
com objectivos educacionais ou de investigação, não comerciais, desde que seja dado crédito ao
autor e editor.

iv

v
Acknowledgements
To start with, I would like to thank my supervisor, Carsten Daub, for giving me the opportunity to
develop this project and to take part in other scientific projects as well. For always supporting and
encourage my work, for all the scientific critics and suggestions that allowed me to learn so much.
To my dear group colleagues that, one way or the other, contributed to my work and to lots of
enjoyable and fun moments that I will always remember. A special thanks to Enrichetta, Kadir and
Matthias that closely supervised my work. You were always willing to help me, professionally and
personally. As I once wrote somewhere special, thank you for helping me to grow.
To Charlotte and Paul, for teaching me new techniques and always giving great support. To Andrea
and Isabel for the opportunity to increase my work experience in the lab and for scientific feedback.
Quero agradecer aos meus pais, pelo vosso apoio incondicional sem o qual esta experiência não
teria sido possível. Por todo o apoio e dedicação que sempre me deram, pela motivação quando
faltava e pela apreciação que sempre demonstraram face ao meu trabalho. Ao meu irmão, meu
companheiro desde sempre e que sempre me apoiou, apesar de todos os típicos arrufos de irmãos.
Quero também agradecer a toda a minha família que nunca deixou de mostrar o quanto acreditam
em mim, aos meus avós, aos meus tios e aos meus primos, pelo amor, carinho e dedicação que
sempre me deram.
Quero agradecer ao Diogo, pelo apoio e motivação que sempre me deste, pela paciência com que
aturas as minhas crises de mau-feitio e por saberes sempre como acalmá-las. Por me incentivares a
querer aprender sempre mais e a aceitar novos desafios.
Aos meus amigos que sempre tiveram uma palavra de encorajamento e de conforto e que, de uma
maneira ou outra, contribuíram para este meu percurso académico e pessoal. Um agradecimento
especial à Rita, amiga, companheira, colega de casa que, com muita paciência, esteve sempre
presente, sempre disposta a ajudar e que me acompanhou nesta aventura. E que grande aventura
foi.

vi

vii
Resumo
A cafeina é consumida em grandes quantidades ampla e regularmente sob a forma de café, chá ou
bebidas energéticas. Esta substância psicoactiva e muito popular é muitas vezes procurada devido à
sua capacidade de aumentar a sensação de energia e estado de alerta de quem a consome, assim
como o desempenho físico e cognitivo. Tem, igualmente, uma importante contribuição no aumento
da capacidade de concentração. Estudos anteriores têm vindo a investigar a capacidade de baixas
doses de cafeína para inibir a activação dos receptores de adenosina, bem como diversos outros
efeitos farmacológicos incluindo o seu potencial em vários estudos de doenças neurodegenerativas.
No entanto, pouco é conhecido relativamente aos efeitos da cafeína ao nível da expressão génica
em células neuronais.
Neste estudo, pretendemos compreender se e como concentrações fisiológicas de cafeína podem
afectar a expressão génica em células neuronais derivadas de células estaminais pluripotentes
induzidas humanas. Mais ainda, identificamos enhancers activos em células neuronais e
investigamos em que medida estes podem estar envolvidos na regulação da resposta neuronal à
cafeína.
Por intermédio da utilização de uma técnica de análise do perfil de expressão de RNA – Cap Analysis
of Gene Expression (CAGE) – obtivemos um conjunto abrangente de dados com respeito a regiões
de início de transcrição e actividade em regiões de enhancer em células neuronais expostas a
diferentes concentrações de cafeína (0, 3 e 10 µM).
Identificámos um conjunto de genes que aparenta estar envolvido na mediação da resposta à
cafeína. Após 1 hora de tratamento com 3 µM de cafeína ocorre um aumento de actividade sináptica,
bem como de neurotransmissão dopaminérgica. Processos do sistema imunológico, assim como a
projecção axonal encontram-se reprimidos após 3 horas de exposição a 10 µM de cafeína.
Estes resultados levantam hipóteses concretas sobre processos fisiológicos e genes a eles
associados que podem orientar futuros trabalhos experimentais com fim a validação funcional que,
por sua vez, pode conduzir a novas descobertas respeitantes ao efeito da cafeína no cérebro
humano.
Palavras-Chave
Cafeína, Receptores de Adenosina, Expressão Génica Diferencial, Cap Analysis of Gene Expression
(CAGE), Enhancer, Transcriptoma

viii

ix
Abstract
Caffeine is widely and massively consumed on daily basis in the form of coffee, tea or energy drinks.
This very popular, psychoactive drug is sought after due to its ability to increase energy and alertness,
enhance physical and cognitive performance as well as to improve our ability of focusing. Previous
studies have investigated the ability of caffeine to inhibit the activation of adenosine receptors in low
doses, amongst other pharmacological effects as well as its potential in several neurodegenerative
disease-modeling studies. However, not much is known about the effects that caffeine exerts on gene
expression of neuronal cells.
In this study we aim to understand if and how physiological concentrations of caffeine affect gene
expression in human induced pluripotent stem cell (iPSC)-derived neuronal cells. Moreover, we
identify active enhancers in neuronal cells and investigate the extent to which enhancers might be
involved in the regulation of neuronal responses to caffeine.
Using Cap Analysis of Gene Expression (CAGE) RNA expression profiling, we obtained a
comprehensive data set of transcription start sites and enhancer activity of neuronal cells exposed to
various caffeine concentrations (0, 3 and 10 µM).
We identified a set of genes that appears to be involved in the mediation of caffeine response.
Synaptic activity is upregulated after 1 hour of 3 µM caffeine treatment as well as dopaminergic
neurotransmission. Immune system processes as well as axon guidance events are downregulated
after 3 hours of 10 µM caffeine exposure.
These insights provide concrete hypotheses of physiological processes and associated genes for
guiding further functional validation experiments with the potential to give valuable insights into the
effects of caffeine to the human brain.
Keywords
Caffeine, Adenosine Receptor, Differential Gene Expression, Cap Analysis of Gene Expression
(CAGE), Enhancer, Transcriptome

x

xi
Table of Contents
Acknowledgements ………………………………………………………… v
Resumo ………………………………………………………………………… vii
Abstract …………..…………………………………………………………….. ix
Table of Contents ………………………………………………………………... xi
List of Figures ………………………………………………………………… xiii
List of Tables ………………………………………………………………… vx
List of Abbreviations ………………………………………………………… xvii
1. Introduction ………………………………………………………………… 1
Coffee and Tea – Impact on Society and Economy ………………………… 1
Caffeine ………………………………………………………………… 3
Caffeine Absorption, Distribution and Metabolism ………………………… 3
Pharmacological Effects of Caffeine ………………………………………… 3
Adenosine – Mechanism of Action ………………………………………… 4
iPSC-derived Neuronal Cells – NES cells ………………………………… 6
Gene Regulation and Chromatin Conformation ………………………………… 7
Transcribed Enhancers ………………………………………………………… 8
Cap Analysis of Gene Expression (CAGE) ………………………………… 9
2. Project Aims and Hypothesis ………………………………………… 11
3. Materials ………………………………………………………………………… 13
Cell Differentiation and Caffeine Exposure ………………………………… 13
CAGE Library Preparation ………………………………………………… 14
Sequencing Data and Expression Table ………………………………………… 14
4. Methods ………………………………………………………………………… 15
Experimental Design ………………………………………………………… 15
Data Quality, Outliers and Sample Consistency ………………………………… 16

xii
Enhancer Prediction ……………………………………………………….... 17
Gene Expression Responses to Caffeine Treatment ………………………… 17
Gene Ontology and Pathway Analysis ………………………………………… 19
Enhancer Expression in Response to Caffeine Treatment ………………… 19
Enhancer-Promoter Expression Correlation ………………………………… 19
5. Results ………………………………………………………………………… 21
Data Quality, Outliers and Sample Consistency ………………………………… 21
Chapter 1: How does gene expression mediates caffeine response of neuronal cells
and what genes mediate this response? ………………………………………… 24
Gene Expression in Neuronal Cells ………………………………………… 24
Gene Expression Changes Due to Handling ………………………………… 24
Gene Expression Changes in Cells Treated with Caffeine………………………... 26
Genes Mediating Response to Caffeine Stimulus ………………………………… 27
Chapter 2: Identification of active enhancers in neuronal cells and identification
of enhancers that regulate mediator genes in caffeine response ………… 33
Enhancers in Neuronal Cells ………………………………………………… 33
Enhancer Activity in Response to Caffeine Stimulus ………………………… 33
Caffeine Mediator Genes Regulated by Enhancers ………………………… 35
6. Discussion ………………………………………………………………… 39
7. Future Perspectives ………………………………………………… 45
8. Conclusion ………………………………………………………………… 47
9. References ………………………………………………………………… 49
10. Supplementary Material ………………………………………………… 54

xiii
List of Figures
Figure 1.1 – Amount of caffeine found in common dietary sources of caffeine ……………….. 1
Figure 1.2 – European countries with highest rates of coffee consumption per capita ……… 2
Figure 1.3 – Adenosine and caffeine structure similarities ……………………………………….. 5
Figure 1.4 – Adenosine mechanism of action and caffeine perturbation of this mechanism … 6
Figure 1.5 – Illustration of the sequential steps of CAGE library preparation and
data processing …………………………………………………………………………………………… 10
Figure 3.1 – Illustration of lt-NES cells differentiation process into neuronal cells and
caffeine exposure ……………………………………………………………………………………………13
Figure 3.2 – Illustration of CAGE detection of alternative transcription start sites ……………. 14
Figure 4.1 – Experimental design of the study ………………………………………………………. 15
Figure 4.2 – Representation of all conditions sampled in this study and how they are
compared …………………………………………………………………………………………………… 18
Figure 5.1 – Distribution of, normalized and not normalized, tag cluster expression
counts of filtered data before and after removing outlier sample ……………………………..... 22
Figure 5.2 – Overall differences in gene expression of all samples for normalized
and filtered data …………………………………………………………………………………………… 23
Figure 5.3 – Overall differences in gene expression of all samples for normalized
and filtered data …………………………………………………………………………………………… 23
Figure 5.4 – Gene expression changes regarding non-treated cells and cells treated
with 3 and 10 µM of caffeine in comparison with control samples ……………………………… 25
Figure 5.5 – Caffeine-induced gene expression differences …………………………………….. 27
Figure 5.6 – Evaluation of gene expression responses to treatment with 3 µM of caffeine .... 28
Figure 5.7 – Biological processes perturbed by treatment with 3 µM of caffeine ……………. 29

xiv
Figure 5.8 – Biological pathways perturbed by treatment with 3 µM of caffeine ……………. 30
Figure 5.9 – Evaluation of gene expression responses to treatment with 10 µM of caffeine .. 30
Figure 5.10 – Biological processes perturbed by treatment with 10 µM of caffeine ………… 31
Figure 5.11 – Biological pathways perturbed by treatment with 10 µM of caffeine ………….. 32
Figure 5.12 – Representation of bimodal and bidirectional expression pattern
of 15 highest expressed enhancers in neuronal cells …………………………………………….. 34
Figure 5.13 – Evolution of enhancer expression over time ………………………………………..35
Figure 5.14 – Evolution of enhancer and promoter expression over time of putative
interactions ………………………………………………………………………………………………….38
Supplementary Figure S1 – B cell receptor signaling pathway ……………………………………59
Supplementary Figure S2 – Toll-like receptor signaling pathway ……………………………….. 59
Supplementary Figure S3 – T cell receptor signaling pathway ……………………………………60
Supplementary Figure S4 – Complement and coagulation cascades pathway ………………..60
Supplementary Figure S5 – Cell adhesion molecules pathway …………………………………...61
Supplementary Figure S6 – Axon guidance pathway ……………………………………………….61
Supplementary Figure S7 – Neuroactive ligand-receptor interaction pathway ……………… 62

xv
List of Tables
Table 4.1 – Comparisons used in differential gene expression analysis ……………………… 18
Table 5.1 – Number of differentially expressed tag clusters …………………………………….. 25
Table 5.2 – Number of differentially expressed enhancers ……………………………………… 33
Supplementary Table 1 – Differentially expression results for all comparisons analyzed … 54
Supplementary Table 2 – Biological processes perturbed by treatment with 10 µM of
caffeine ……………………………………………………………………………………………………. 62
Supplementary Table 3 – Biological processes perturbed by treatment with 3 µM of
caffeine ……………………………………………………………………………………………………. 63

xvi

xvii
List of Abbreviations
CAGE – Cap Analysis of Gene Expression
Lt-NES cells – Long-term self-renewing neuroepithelial-like stem cells
iPSC – Induced pluripotent stem cell
TC – Tag cluster
CPM – Counts per million
TSS – Transcription start site
CTSS – CAGE-defined transcription start site
FDR – False discovery rate
GLM – Generalized linear model
GO – Gene ontology
NGS – Next Generation Sequencing
PCA – Principal component analysis
RLE – Relative log expression

xviii

1
Caffeine amount (mg)
1. Introduction
Coffee and Tea – Impact on Society and Economy
Caffeine is widely and massively consumed worldwide. Coffee, tea and energy drinks are three of the
most popular forms of caffeine consumption, with coffee in first place. Chocolate bars and soft drinks
are also a dietary source of caffeine, especially for children (Lorist and Tops, 2003; Fredholm et al.,
1999). Caffeine pills are also one way of caffeine consumption, usually used for cognitive
enhancement. Figure 1.1 displays the caffeine content, in milligrams, of common dietary sources of
caffeine, according to the European Food Safety Authority (European Food Safety Authority, 2015).
Two studies have approached German university students’ consumption of caffeine pills, accounting
for 10.5% students stating that they used caffeine pills at least once in their lifetime in one study
(Franke et al., 2011) and 13.4% in other study (Brand and Koch, 2016). According to Food and Drug
Administration (FDA), caffeine pills can have a caffeine content of 100-200 mg per tablet/capsule.
Figure 1.1 – Amount of caffeine found in common dietary sources of caffeine. Graph
demonstrating the amount of caffeine, in milligrams (mg) that can be found in several dietary
sources, such as coffee, tea and chocolate.

2
Coffee is part of social interaction nowadays. People get together over coffee on their free time, as
well as during working hours as a way to have a pause (Lorist and Tops, 2003). Figure 1.2 illustrates
the average number of coffee cups consumed by one person daily for the top 10 countries that
consume most coffee in Europe (Statista Consumer Market Outlook, 2015). With an average of 3.6
cups of coffee ingested by one person daily, Finland leads the top 10, followed by its neighbors
Sweden, Netherlands and Denmark with 2.9, 2.8 and 2.4 cups of coffee, respectively. Portugal
consumes an average of 1.3 cups of coffee per day, side by side with France. Brazil and North
America are also pronounced coffee consumers worldwide, with an average of 1.6 and 1.2,
respectively.
The levels of caffeine consumption through coffee intake are the reason why studies on the caffeine
effects are so important, so needed and received with great interest by the population. Whether these
studies address short term effect or long term effects, all information regarding the effects of caffeine
on the human body, particularly the human brain, are of great interest for the majority of the
population that more or less consumes caffeine.
Figure 1.2 – European countries with highest rates of coffee consumption per capita.
Illustration of the number of cups of coffee ingested daily per capita, on average, according to the
Statista Consumer Market Outlook from 2015.

3
Caffeine
Caffeine – a methylxanthine – is a plant alkaloid and a very popular psychoactive drug (Glade et al,
2010; Fisone et al, 2003). People appreciate the psychostimulant effects of caffeine and the fact that
there are no negative side effects documented so far, for physiological doses of caffeine. The ability
of caffeine to enhance motor activity is one of the pronounced effects, as caffeine acts in regions of
the brain related to motor activity (Fisone et al, 2003). Moreover, moderate doses of caffeine can
increase energy availability and daily energy expenditure, which is related to enhancement of motor
activity, decrease fatigue and the sense of effort associated with physical activity. Caffeine enhances
cognitive performance, increases alertness, wakefulness and feeling of “energy”. This compound also
has the ability to decrease mental fatigue, accelerate and increase the accuracy of reactions, increase
the ability to concentrate and focus attention, enhance short-term memory and the ability to solve
problems that require reasoning as well as increase the ability to make correct decisions and enhance
cognitive functioning and neuromuscular coordination (Glade et al, 2010). All of these responses
constitute the behavioral effects of caffeine and can be measured and characterized. Commonly,
variations in motor activity are the behavioral outcome of choice when quantifying the stimulant
properties of caffeine.
Caffeine Absorption, Distribution and Metabolism
Upon ingestion, caffeine is almost completely (99%) and rapidly absorbed – 45 minutes upon
ingestion – in the gastrointestinal tract and distributed in the blood stream reaching the whole body
and passing through all biological membranes, such as the blood-brain barrier, due to its lipophilic
properties (Liguori et al., 1997; Bonati et al., 1982). Between 15 and 120 minutes upon ingestion,
caffeine concentration in plasma reaches peak levels (Arnaud, 1987).
Caffeine is metabolized in the liver and easily cleared from the body, presenting a half-life
approximately between 3 and 5 hours (Grant et al., 1987; Fisone et al, 2003; Lorist and Tops, 2003).
The clearance rate of caffeine from the body can be affected by several compounds, such as nicotine
or oral contraceptives (Lorist and Tops, 2003).
Pharmacological Effects of Caffeine
As most methylxanthines, caffeine has a very similar structure to cyclic nucleotides and can,
therefore, easily interact with cyclic nucleotides phosphodiesterases. However, significant effects are
only achieved with concentrations in the millimolar range since caffeine affinity for
phosphodiesterases is low (Fisone et al, 2003). Other studies showed that caffeine inhibits the γ-
aminobutyric acid (GABA) receptor for concentration in the 350-500 µM range (Fisone et al, 2003).

4
The fact that, even with high concentrations of caffeine and a high absorption rate, only a small part is
able to reach intracellular targets, such as phosphodiesterases or GABA receptors, is important to
consider. This means that measuring the effect only on the level of these intracellular targets is not
entirely illustrative of the effects of the concentration in study (Fisone et al, 2003). Caffeine has also
been shown to modulate CREB-dependent gene expression and to induce the expression of
immediate early response genes (Svenningsson et al., 1995; Connolly and Kingsbury, 2010).
Caffeine modulation of neurotransmission in the brain is mainly dependent on its ability to act as
antagonist of adenosine receptors. Adenosine, a purine compound, is a neuromodulator that,
generally, inhibits neuronal activity. Although it clearly has an effect in the central nervous system
neurotransmission processes, adenosine is not considered a neurotransmitter since it does not fulfill
some of the current criteria of neurotransmitter definition; it is not accumulated into vesicles and it is
not released in synapses in a calcium-dependent manner like all neurotransmitters (Fisone et al,
2003).
Adenosine activity depends on the presence of its receptors in various regions of the brain. Four
receptors have been described so far – A1, A2A, A2B and A3 – and are expressed in the brain.
However, receptors A2B and A3 have low levels of affinity for adenosine and have only basal levels of
activation. Caffeine effects do not include inhibition of these two receptors. On the other hand,
adenosine receptors A1 and A2A have high affinity to adenosine/caffeine and can be activated by
nanomolar concentrations of adenosine, which is the normal range present in the brain (Fisone et al,
2003; Lorist and Tops, 2003) and, thus, caffeine effects are mediated by inhibition of the latter two
receptors.
Unlike the majority of mechanisms by which caffeine has its effect on the brain, blockade of
adenosine receptors is the only one that can be triggered by lower concentrations of caffeine (Lorist
and Tops, 2003). Thus, caffeine consumption that derives from a regular and daily ingestion of coffee
or tea should not be expected to activate other mechanism rather than inhibition of adenosine
receptors.
Adenosine – Mechanism of Action
Neurons, like every other cell type, use ATP as a source of energy for most cell processes. In order
for the energy to be available, ATP has to be broken down. When this happens, adenosine is
released as a break down sub product and its intracellular concentration increases in neurons. Part of
this intracellular adenosine leaves the neurons and binds to adenosine receptors through specific
membrane transporters (Fredholm et al., 1999). The effect of adenosine binding to its receptors can
be excitatory or inhibitory, depending on which receptor is activated. As mentioned above, adenosine
activity is mediated mainly by A1 and A2A receptors. A1 receptor is highly expressed in neurons that
stimulate awakeness, whereas A2A receptors are mostly found in neurons that promote sleeping.

5
Adenosine acts on A1 receptors by inhibiting them and on A2A receptors by activating them (Fredholm
et al., 1999). Intense brain activity means neurons used a lot of ATP to provide for energy and the
levels of adenosine are very high. High levels of adenosine binding to A1 receptors decreases activity
of wake-stimulating neurons and high levels of adenosine binding to A2A receptors increase the
activity of sleep-promoting neurons. Therefore, adenosine decreases brain activity and induces sleep,
preventing the brain from overworking. Later, during sleep, adenosine is gradually eliminated until
there is not enough to activate the receptors and activity restarts.
Caffeine, with a similar structure to adenosine (Figure 1.3 and Figure 1.4), can also bind to adenosine
receptors. However, instead of activating them, caffeine acts by competing with adenosine for the
receptors and blocks the receptors so that adenosine cannot bind efficiently until caffeine is cleared
after a period of 2-4 hours, depending on the metabolism rates of the organism.
Caffeine is not considered as addictive and does not present negative side effects, as mentioned
earlier. However, a mechanism known as caffeine tolerance is developed over long periods of
caffeine consumption. When caffeine is ingested continuously, neurons start to increase the synthesis
of adenosine receptors and more caffeine is needed so that the same effect is attained. When
caffeine ingestion stops abruptly, adenosine effect is higher due to a higher number of receptors
being activated and sleep induction intensifies. This leads to drowsiness, irritability, fatigue and
difficulties in concentrating. To reverse these unpleasant symptoms, people keep consuming caffeine
leading to a mild physical addition to caffeine, but not severe enough to be classified as a real
addiction.
Adenosine Caffeine
Figure 1.3 – Adenosine and caffeine structure similarities. On the left panel, an illustration of
adenosine chemical structure. On the right panel, an illustration of caffeine chemical structure. Highlighted in
yellow are the common features of both structures responsible for the ability of both molecules to bind to
adenosine receptors. Figure adapted from PubChem Compound Database.
6
Other organs express adenosine receptors, which is the case of the heart and kidneys. Both these
organs express A1 receptors and binding of these receptors in heart and kidney has the same effect
as in the brain – decreasing the activity of the cells that express them. Caffeine acts as an antagonist
in these organs as well increasing the heart rate and the amount of blood filtered by the kidneys and,
thus, increasing urine production. Subjects who ingest high doses of caffeine can experience
headache, dizziness and insomnia due to over-alertness, jitteriness due to higher heart rate and
dehydration from increased urine production.
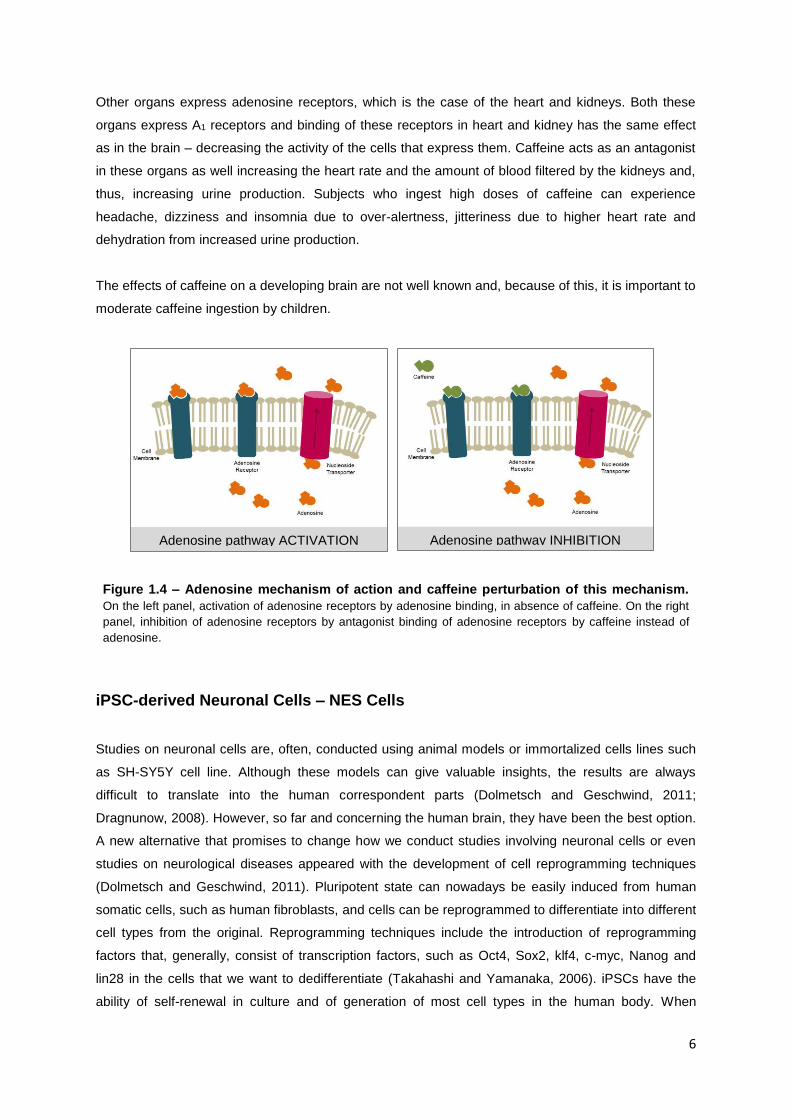
The effects of caffeine on a developing brain are not well known and, because of this, it is important to
moderate caffeine ingestion by children.
iPSC-derived Neuronal Cells – NES Cells
Studies on neuronal cells are, often, conducted using animal models or immortalized cells lines such
as SH-SY5Y cell line. Although these models can give valuable insights, the results are always
difficult to translate into the human correspondent parts (Dolmetsch and Geschwind, 2011;
Dragnunow, 2008). However, so far and concerning the human brain, they have been the best option.
A new alternative that promises to change how we conduct studies involving neuronal cells or even
studies on neurological diseases appeared with the development of cell reprogramming techniques
(Dolmetsch and Geschwind, 2011). Pluripotent state can nowadays be easily induced from human
somatic cells, such as human fibroblasts, and cells can be reprogrammed to differentiate into different
cell types from the original. Reprogramming techniques include the introduction of reprogramming
factors that, generally, consist of transcription factors, such as Oct4, Sox2, klf4, c-myc, Nanog and
lin28 in the cells that we want to dedifferentiate (Takahashi and Yamanaka, 2006). iPSCs have the
ability of self-renewal in culture and of generation of most cell types in the human body. When
Figure 1.4 – Adenosine mechanism of action and caffeine perturbation of this mechanism.
On the left panel, activation of adenosine receptors by adenosine binding, in absence of caffeine. On the right
panel, inhibition of adenosine receptors by antagonist binding of adenosine receptors by caffeine instead of
adenosine.
Adenosine pathway ACTIVATION Adenosine pathway INHIBITION

7
induced pluripotent stem cells are exposed to the adequate combination of growth factors and culture
conditions it is possible to induce differentiation into neuronal cells, or several other differentiated cell
types (Masui et al., 2007). Induced pluripotent stem cell (iPSC) differentiation into neuronal cells has
the potential to overcome the gap between human neuronal studies and the model organisms used to
address them. Previously unattainable, iPSC’s allow the study of human neurons that carry a specific
mutation, which is the case of several neurodegenerative diseases; or simply develop studies on
healthy human neurons, which is the case of the present study.
Falk et al developed a protocol to obtain long-term self-renewing neuroepithelial-like stem cells (lt-
NES cells) from induced pluripotent stem cells and, posteriorly, differentiate these into neuronal cells,
(Falk et al, 20012). This cell line can overcome ethical problems raised by embryonic stem cell use
and obstacles imposed by previously mentioned animal models or immortalized cell lines. It is a
healthy human cell line that provides a mixture of neurons and glial cells, presenting good and
improved modeling of the human brain. Lt-NES cells are a step towards better modeling of
neurodegenerative diseases that affect neurons and glial cells or neurotoxicity studies (Falk et al,
2012).
In the present study, lt-NES cells were differentiated into a mixture of neurons and glial cells used to
assess the response, on gene expression level, when exposing cells to physiological concentrations
of caffeine. Similarly to other studies involving neuronal cells, studies on the effects of caffeine in
neuronal cells, including neurotoxicity studies, have also been conducted either in animal models or
immortalized cell lines, such as SH-SY5Y. Through the use of lt-NES cells-derived neurons and glia
cells, the results obtained are more reliable and close to the real response of healthy human neurons
or glial cells.
Gene Regulation and Chromatin Conformation
All somatic cells share the same DNA; however the selective expression of each cell genome confers
cell type specificity. Expression of different sets of genes in different cell types depends on several
mechanisms of gene regulation that can happen on many levels. Chromatin accessibility can be
regulated to ease or difficult gene expression, by changes in the chromatin structure that facilitate or
constrain the access of transcription machinery to specific regions of the genome. Different
combinations of transcription factors and proximal and distal regulator regions are responsible for
transcription of different sets of genes. mRNA molecules undergo processing steps that can regulate
their final expression. Translation of these molecules into proteins might be increased or decreased
and the resulting proteins can also suffer modifications that will implicate the final function. From gene
expression to phenotype expression several are the regulation steps where the fate of a protein or
functional RNA can be reformed. Gene regulation not only is the foundation of cell type specificity, but
is also the reason for differences between species.

8
State of chromatin conformation interferes with promoter’s availability to be accessed by the
transcription machinery. DNA looping is one way of chromatin remodeling that consists in physical
interaction of two distant genomic regions that force a loop in the DNA. The combination of several
regulatory mechanisms leads to the relaxation of chromatin structure in both regions and the motifs
can interact. This happens when regulatory regions such as enhancers regulate their target promoters
(Calo and Wysocka, 2013).
Transcribed Enhancers
Enhancers, short DNA regions (50-1500 bp), are key regulatory elements of transcription that act
towards promotion of transcription initiation by binding transcription factors that in turn interact with
other transcription factors bound to promoter regions. Enhancers can be located up- or downstream
of the promoters they interact with and they act independent of strand orientation (Maston et al., 2006;
Stees et al., 2012). Downstream enhancers can be located within introns or beyond the 3’ end of the
target gene (Visel et al., 2009). Similarly to promoter regions, enhancers are constituted by modules,
which allows for activation of promoters in a time- and tissue-specific manner (Maston et al., 2006).
Enhancers are cis-acting regulators, acting on promoters located in the same DNA molecule, but not
necessarily on the closest promoter (Andersson et al., 2014) and can be several hundred kilo base
pairs distant from the target promoter (Visel et al., 2009).
Recent development in transcriptomics and genomics endorsed the acknowledgement of the
importance of regulatory elements that far outnumber protein-coding genes (ENCODE Project
Consortium, 2012). These regulatory elements have been gradually associated with several human
diseases and, thus, deep understanding of the mechanisms that underlie gene regulation is very
important (Visel et al., 2009; Li et al., 2016).
Protein-protein interactions between enhancer regions and target promoters as well as DNA-looping
were, for a long time, the explanative models for transcription regulation by enhancers (Heintzman et
al., 2009a). However, studies showed that RNA polymerase II is also found in non-promoter regions
such as enhancers, which indicates active transcription of enhancers. (Koch et al., 2008; Li et al.,
2016). RNA sequencing showed that enhancers are transcribed in a bidirectional fashion originating
enhancer RNA (eRNA) (Kim et al., 2010; De Santa et al., 2010; Djebali et al., 2012; Andersson et al.,
2014). Various genomic features distinguish active enhancers and poised enhancers. Binding of
enhancer regions by p300 and monomethylation of H3K4 in flanking nucleosomes are representative
of poised enhancers and recruitment of RNA polymerase II, production of eRNAs and acetylation of
H3K27 are associated with active enhancers (Heintzman et al., 2009b; Kim et al., 2010, Wang et al.,
2011).
Contribution of gene expression regulation by enhancers is certain and well characterized. However,
the mechanisms by which enhancers regulate gene expression still remain poorly understood. eRNA
9
expression has been confirmed to occur in many cell types and is considered an universal gene
expression regulation mechanism (Kim et al., 2015). Whether and how transcriptional activity at
enhancers contributes to enhancer function is still an open question. Studies indicate that eRNA
synthesis occurs only when the enhancer is interacting with the target promoter (Kim et al., 2010; Lai
et al., 2013). eRNA activity on specific target promoter might be achieved due to its high instability
suggesting eRNA exert their function in the target promoter and not in other promoters located away
from the local of synthesis (Kim et al., 2015).
Cap Analysis of Gene Expression (CAGE)
Cap Analysis of Gene Expression (CAGE) is a high throughput sequencing technique that allows
screening the transcriptome of cells and quantitatively detect gene expression on the promoter level.
The technique is based on several sequencing techniques and it was developed by Piero Carninci
and Yoshihide Hayashizaki’s group at RIKEN Yokohama Institute in Japan. Like many other methods,
CAGE counts with next generation sequencing (NGS) (Takahashi et al., 2012a; Takahashi et al.,
2012b; Shiraki et al., 2003; The FANTOM consortium and the RIKEN PMI and CLST (DGT), 2014).
CAGE uses a cap trapping method to isolate mRNAs from the total RNA extracted from cells. mRNA
molecules are protected in the 5’ end by a structure called CAP. This structure distinguishes mRNA
molecules from the majority of other RNA molecules. During the first steps, random primers initiate
the synthesis of a complementary cDNA strand that will extend up until the capped 5’ end of the
molecule or before that. Only the hybrids in which the cDNA strand reached the capped 5’ end are
kept after single strand RNA regions are digested with RNase. As a result of labelling all cap
structures with biotin, mRNAs can be pulled with streptavidin beads and a library of all cDNAs derived
from the 5’ ends of transcripts is assembled using 5’ end and 3’ end sequencing primers and linkers.
The libraries are sequenced and aligned to the genome. Since CAGE captures 5’ ends of coding or
non-coding RNAs, it means that when the reads are aligned to the genome they are mapping to
transcription start sites (TSSs), regions of the genome where transcription is initiated. The amount of
reads mapping to each TSS indicates the level of expression of each TSS and after associating each
TSS with a specific gene, via genomic annotation, we know the level of expression of each gene.
Since CAGE captures expression of TSSs and usually transcription is initiated in promoter regions,
this method allows the study of alternative promoters as well as assessing which transcription factors
are involved in specific transcription initiation.
CAGE is one of several RNA sequencing techniques, focusing on the expression of TSSs by cap
trapping the 5’ ends of mRNA transcripts. RNA sequencing techniques were developed as an
alternative to the previous gold standard methods, array-based assays. The first obvious advantage
of CAGE over RNA micro arrays is that CAGE allows a genome wide assay, whereas array-based
techniques can only detect as many transcripts as the number of probes used in the array. Of course
the number of probes does not extend to the total of genes in the human genome. Detecting TSSs or

10
promoters’ expression is a characteristic advantage that CAGE shows over the rest of RNA
sequencing techniques as well as array-based methods.
CAGE uniqueness relies on its ability to detect transcription start sites at a single-nucleotide resolution
level, as no other RNA-sequencing technique can. CAGE only sequences small tags of cDNA
corresponding to the 5’ end of mRNAs, which means that lower amounts of sequencing are needed,
compared to RNA-seq techniques.
CAGE can also detect expression of enhancers. Expressed enhancers have bidirectional and bimodal
expression which means that transcription is initiated in both strands, forward and reverse (Andersson
et al., 2014; Arner et al., 2015). With this in mind it is possible to identify expression of enhancer
regions, even though enhancers are very lowly expressed. CAGE has detected 40 000 - 65 000
eRNAs, representing a large part of transcription initiation events in the human transcriptome
(Andersson et al., 2014). An approach similar to the one described by the latter study allows a
categorization of enhancers in cell-specific and ubiquitous enhancers, assessment of interactions
between enhancers and promoter regions as well as identification of single nucleotide polymorphisms
(SNP) potentially associated with human diseases.
The FANTOM5 project established an atlas of CAGE-defined TSSs (Andersson et al., 2014).
Andersson et al. demonstrated that bidirectional transcription is a mark for active enhancers
(Andersson et al., 2014). A simple illustration of sequential steps that follow CAGE library preparation
is depicted in Figure 5.1.
Figure 1.5 – Illustration of the sequential steps of CAGE library preparation and data
processing.
11
2. Project Aims and Hypothesis
Previous studies mainly reported pharmacological targets of caffeine, such as adenosine receptors.
No preceding studies have reported effects on gene expression levels in neuronal cells using iPSC-
derived neuronal cells as model and in a genome-wide fashion. Contrary to other caffeine
mechanisms of action, blockade of adenosine receptors can be triggered by lower concentrations of
caffeine. Thus, we assume that caffeine effect is mediated, even if in part, by changes in gene
expression that occur, presumably, downstream of adenosine receptors mechanism.
In this project, we address three main questions:
1. Identification of genes mediating caffeine response in iPSC-derived neuronal cells in different
concentrations and during different times of exposure.
2. Identification of active enhancers in iPSC-derived neuronal cells.
3. Identification of enhancers that regulate the mediator genes identified in aim 1.
Although this work consists of bioinformatics analysis mainly, prior work was done in order to have the
experimental data that allowed the analysis that culminated in the answers to the questions we
proposed to answer. Cell reprogramming, neuronal differentiation and cap analysis of gene
expression are the experimental methods chosen to address our questions and were performed prior
to the work presented in this thesis.
Answering these questions can provide significant insights on how the human brain reacts to caffeine,
particularly the nervous system. Even though caffeine is already well characterized when it comes to
pharmacological effects in the nervous system, the same does not happen regarding the gene
expression changes associated with these pharmacological effects. Deeper knowledge on gene
expression changes in response to caffeine stimuli, resulting from deep transcriptome sequencing,
can be very valuable and applied to specific studies on neurodegenerative diseases or toxicity, for
example.

12

13
3. Materials
Cell Differentiation and Caffeine Exposure
Human long-term self-renewing neuroepithelial-like stem cells (NES cells) were obtained as described
in Falk et al (2012) and then differentiated into neuronal cells for 38 days by removal of growth
factors. Two batches of cells were treated with 3 µM and 10 µM of caffeine each and 1 batch was not
treated with caffeine. Cells were collected, in replicates of 3 or 4, in the beginning of the experiment –
0 hours – and after 1, 3 and 9 hours. RNA was extracted using NucleoSpin RNA Kit (Macherey-
Nagel), according to manufacturer’s instructions. An illustration of the differentiation process is
depicted in Figure 3.1.
The obtained cells are estimated to be a mixture of 80-90% neurons and 10-20% glial cells, according
to immunofluorescence staining and bright field microscope imaging that confirmed the presence of
these cell types (data not shown). The majority of the cell population showed clear expression of
mature neuronal cell markers, such as MAP2 and NeuN.
This experimental procedure, illustrated in Figure 3.1, was performed before and is out of the scope of
this thesis.
Figure 3.1 – Illustration of lt-NES cells differentiation process into neuronal cells and
caffeine exposure. Proliferation of NES cells occurs during 2 days, followed by removal of growth factors.
Differentiation into neuronal phenotype is triggered and lasts for 38 days. Cells are exposed to caffeine
treatment (0, 3 and 10 µM) and RNA is collected from cells in the beginning of the experiment and after 0, 1, 3
and 9 hours of exposure.

14
CAGE Library Preparation
CAGE libraries were prepared with a total RNA input of 1 µg and 1% yeast (Sacharomyces pombe)
spike-in for normalization, according to the original protocol (Takahashi et al., 2012b). Four libraries
were prepared and pooled together for sequencing in Illumina Hi-Seq 2500 or 2000, in a randomized
order to avoid batch effects. One of four random barcodes was attributed to each library and all four
libraries were pooled together before sequencing. Barcoding of each library is achieved by using
barcoded sequencing 5’ end linkers.
These libraries were prepared before and out of the scope of this thesis.
Sequencing Data and Expression Table
Fastq files were provided as well as already processed data into a final table of expression counts for
each tag cluster (TC), across all samples (see section 4, Experimental Design). Expression counts
refer to the number of reads that align at a particular position. A tag cluster is a group of tags, or
sequencing reads, that map on the same strand of a chromosome and overlap by at least 1 base pair
(bp). Each TC represents a group of CAGE-defined TSS and, therefore, the expression table obtained
after processing of the sequencing data provides, for each sample, the number of transcripts detected
for each CAGE-defined TSS (Figure 3.2). All tag clusters were associated with the corresponding
genes, using GENCODE v19 genome annotation.
The expression table was the starting point of the work presented in this thesis.
Figure 3.2 – Illustration of CAGE detection of alternative transcription start sites. TC 1 and
TC 2 represent different tag clusters. Each CAGE tag represents one CAGE-defined transcription
start site. CAGE tags are mapped to the TSS, the number of tags indicates the expression and a
tag cluster is built based on overlapped mapping of CAGE tags.

15
4. Methods
Experimental Design
The design of the study was conceived in a way that different groups of cells are treated with two
different concentrations of caffeine – 3 µM and 10 µM – or not treated. For each combination of
concentration and time, three or four biological replicates were collected, as indicated in Figure 4.1.
The control sample, encompassing three biological replicates, represents the cells from which RNA
was extracted in the beginning of the experiment. These cells were not exposed to caffeine and the
gene expression levels detected consolidate the normal pattern of expression expected from neuronal
cells. The control sample is used as baseline/reference for all comparisons when assessing the effect
of caffeine on gene expression. It is important to keep in mind that the cell model used consists of
newly differentiated neurons and glial cells and, possibly, a fraction of still differentiating or non-
differentiated cells.
Figure 4.1 – Experimental design of the study. Representation of all samples studied, each one
corresponding to a batch of cells exposed to different caffeine concentrations and different periods
of time. C# represents the nomenclature attributed to the replicates collected from each sample.

16
Data Quality, Outliers and Sample Consistency
As mentioned before, the starting point of this work consists of a table with the number of transcripts
detected at each tag cluster, for a total of 32 samples, representing 10 different experimental
conditions. A big data set was created and 43,631 tag clusters were associated with their
corresponding expression count.
Data was normalized using counts per million (CPM), for differences in library size, and relative log
expression (RLE) that takes into account the size factor. To obtain the counts per million we scale the
counts through division by the library size (total number of fragments detected) and multiplication by
one million. The size factor used in RLE normalization is the ratio between tag cluster expression
counts and the median expression for that tag cluster across all samples.
Lowly expressed TCs were removed from the analysis by applying an ad-hoc threshold of one CPM in
at least two samples. Applying the CPM threshold means that only tag clusters that have two or more
samples with expression higher than 1 CPM are chosen for further analysis. The 10 highest
expressed TCs were also removed, as they were not found to be involved in caffeine response and
represented housekeeping genes, micro RNA (miRNA) and long non-coding RNA (lncRNA). Since
these genes have very high expression, they can alter normalization and influence downstream
analysis.
As mentioned before, barcode randomization of samples was conducted prior to sequencing and
batch effects associated to barcodes were assessed. For samples showing inconsistent expression
levels between replicates of the same condition linked to barcoding, an extra filtering step was
performed. Since the barcoding is random, replicates of the same condition can have different
barcodes. A pattern was found in which for a specific barcode, several TCs had very high expression,
while the equivalent replicates, with different barcode, had very low or no expression. Since this did
not represent a barcode batch effect due to its isolated occurrence (68 in 43,631), this subset of TCs
were removed from the following analysis.
Lastly, outliers were identified using visualization of distribution of normalized and not normalized
expression across all samples. Sample C18 displays a different profile than the rest of the samples,
presenting an abnormal number of TCs with very low or no expression, when compared to the two
other replicates collected from the same condition. This was confirmed by looking at the number of
TCs with no expression in all samples, from which C18 appears to be an outlier.
In order to confirm if C18 was in fact an outlier sample and if any other prominent outliers existed in
the data set, principal component analysis (PCA) was performed as a dimension reduction method,
before and after filtering the data.
17
Enhancer Prediction
For enhancer prediction, Andersson et al. unsupervised predictor was used. In brief, all the 31 CTSS
files are combined into a unique file and split by strand. The CTSS files include all CAGE-defined
transcription start sites (CTSS) detected in each sample. Decomposition-based peak identification
(DPI) clustering algorithm is used to identify tag clusters from all the CTSS. The distance between
peaks is set up using the d parameter. Expression is quantified, and enhancers are identified based
on bidirectional expression. A mask file is used to remove enhancers that overlap with TSSs of known
genes and exons (Andersson et al., 2014).
Lower d parameters result, usually, in better shaped enhancers, as the peaks included in the
enhancer are closer together. Peaks that have a higher distance than d are not included in the
prediction of one specific enhancer. D parameters of 5, 10 and 20 were tested and d=5 revealed the
lowest number of enhancers, however better shaped (bimodal and bidirectional expression) and, thus,
more reliable. Tag clusters englobing only one CAGE peak, were removed.
Gene Expression Responses to Caffeine Treatment
Differential gene expression was performed in R using the generalized linear model (GLM)
implemented in edgeR package 3.14.0 (Robinson et al., 2010). All the comparisons made can be
found in Table 4.1, with highlight on the ones used for the analysis reported in this thesis. The outline
of the comparisons made and how the different results were integrated for one single analysis is
shown in Figure 4.2. A cutoff of 0.1 FDR was used for differential expression significance level. No
cutoff was applied for the fold change (FC), meaning that any value indicating up- or downregulation
was reported.
Differentially expressed genes detected in both treated and non-treated cells were selected according
to the difference between the fold change (log2FC) levels in each condition. A threshold of 0.5 in
log2FC difference was applied to differentiate genes changes due to sample handling and gene
changes in response to caffeine addition to the medium.

18
Condition comparison Description
0µM - 1h | CONTROL Gene expression changes in non-treated cells after
a period of 1, 3 and 9 hours
0µM - 3h | CONTROL
0µM - 9h | CONTROL
3µM - 1h | CONTROL Time-dependent effect of caffeine
in gene expression of cells treated with 3 µM of caffeine after a period of 1, 3 and 9 hours
3µM - 3h | CONTROL
3µM - 9h | CONTROL
10µM - 1h | CONTROL Time-dependent effect of caffeine
in gene expression of cells treated with 10 µM of caffeine after a period of 1, 3 and 9 hours
10µM - 3h | CONTROL
10µM - 9h | CONTROL
3µM - 1h | 0µM - 1h Dose-dependent effect of caffeine
in gene expression of cells treated with 3 µM of caffeine after a period of 1, 3 and 9 hours
3µM - 3h | 0µM - 3h
3µM - 9h | 0µM - 9h
10µM - 1h | 0µM - 1h Dose-dependent effect of caffeine
in gene expression of cells treated with 10 µM of caffeine after a period of 1, 3 and 9 hours
10µM - 3h | 0µM - 3h
10µM - 9h | 0µM - 9h
Figure 4.2 – Representation of all conditions sampled in this study and how they are
compared. Arrows represent all combinations of conditions we compared in this study to identify genes
responding to caffeine treatment. The results obtained from one comparison can be interpreted as the
difference in gene expression of cells belonging to the condition in the beginning of the arrow comparing to
cells belonging to condition in the end side of the arrow.
Table 4.1 – Comparisons used in differential gene expression analysis. All comparisons used
in the analysis are listed associating two samples, each one consisting of a combination of a
concentration and a time of exposure. A description of the meaning of the results retrieved from
each comparison is shown.

19
Gene Ontology and Pathway Analysis
Gene ontology was performed using ToppGene (https://toppgene.cchmc.org) with a FDR cutoff of 0.1
for biological process (BP) category. The input consists of a list of gene symbols of all genes
represented by the TCs in study for each specific contrast described in the results section.
Pathway analysis was performed using WEBgestalt (http://www.webgestalt.org/webgestalt_2013),
considering top 10 relevant pathways. The input consists of a list of gene symbols of all genes
represented by the TCs in study for each specific condition described in the results section. A
background list consisting of all genes represented in the data set was used to enrich the pathway
analysis.
Enhancer Expression in Response to Caffeine Treatment
Differential expression for enhancers was performed in R with edgeR package 3.14.0 using the
generalized linear model (GLM), the same method as the one applied to differential gene expression
(Robinson et al., 2010). The same comparisons as in differential gene expression were applied in
enhancer differential expression (Table 1; Figure 4.2). A cutoff of 0.1 FDR was used as significance
level and no cutoff was applied for the fold change; meaning that any value indicating up- or
downregulation was reported.
Enhancer-Promoter Expression Correlation
In order to associate enhancer expression with promoter, we first identified pairs of enhancers and
promoters with the potential to be interacting. For this, we created an intersection table between the
genomic localization of both of the intervenients and kept enhancer-promoter pairs that co-resided
within 500,000 base pairs. The final list of candidate interactions accounted for 196,031 co-residing
pairs. This list indicates how many possible pairs of enhancers and promoters are close enough in the
genome to allow an interaction.
A correlation coefficient (Pearson correlation) was computed between enhancer CPM counts and
promoter CPM counts, across 31 samples, for all the candidate pairs established from the previous
intersection. P-value was adjusted to FDR and a cutoff of 0.1 for the latter was used to filter the table.
To select the significant putative interacting pairs we applied a 0.5 threshold for the correlation
coefficient. A total of 909 highly correlated enhancer-promoter pairs was obtained and further
analyzed.

20

21
5. Results
The results are divided into two sections. Chapter 1, in which we address aim 1: identification of
mediator genes in caffeine response. Chapter 2, in which we address aims 2 and 3: identification of
active enhancers in neuronal cells and identification of enhancers regulating mediator genes in
caffeine response. Before entering in the chapters mentioned above, we present a common section
about the initial quality control performed on this data set, prior to the analysis reported in all chapters.
Data Quality, Outliers and Sample Consistency
After processing the sequencing results as briefly described before, we obtained a total of 43,631 tag
clusters. Each of these has a corresponding number of read counts per sample, representing the
expression detected. Given the dimension of the data set and the fact that a large fraction of the
detected TCs show only basal expression levels, a filtering step was needed. 32 samples represent
the 32 conditions tested in this study, each one consisting of a different combination of caffeine
concentration and exposure time.
From the initial 43,631 TCs, 35,257 showed expression higher than one CPM in at least two samples
and were kept for analysis. The 10 highest expressed TCs, also removed from analysis, represented
housekeeping genes, miRNA and lncRNA genes, such as tuba1, mir3917 and malat1, respectively.
The final data set used for further analysis consists of 35,189 TSSs and was obtained after removal of
68 TCs with inconsistent expression levels between replicates.
From all 32 samples, sample C18 was shown to be an outlier. Visualization of expression levels
distribution across all samples after filtering enlightens the fact that sample C18 shows a different
profile from the rest of the samples. In Figure 5.1, we see the distribution of expression counts and
sample C18 displays a shift in expression towards zero even after filtering of lowly expressed TCs
(Figure 5.1A). This means that this particular sample has a high number of TCs with low or no
expression detected. Unlike the homologous replicates for the same condition, C18 appears as an
outlier. Normalization of the data for different library sizes does not improve the distribution of
expression for sample C18 relatively to other samples, since this sample has a much smaller library
size due to the high number or TCs with null expression. We concluded that this peculiar extent of null
expression represented an imprecision in the library.
Principal component analysis was used as a method of dimensionality reduction and confirmed that
sample C18 is, in fact, an outlier amongst all 32 samples (Figure 5.2). This sample is clearly
separated from the rest of the samples by both principal components. PCA does not show overall
differences between different conditions (treated and non-treated cells and different time points), as
well as no batch effects. PCA plot after removing the outlier is shown in Figure 5.3A. Although we

22
Figure 5.1 – Distribution of, normalized and not normalized, tag cluster expression counts of
filtered data before and after removing outlier sample. Box plots for n=35,189 representing the
distribution of individual expression counts detected for each of the filtered tag clusters before and after CPM
normalization (upper and lower panel, respectively). A) Not-normalized data before removing sample C18; B)
Not-normalized data after removing sample C18; C) Normalized data before removing sample C18; and D)
Normalized data after removing sample C18. Box plots are colored according to sample name; median (solid
horizontal line), upper and lower quartiles (upper and lower limits of box, respectively) are represented.
Data normalized with CPM
Exp
ressio
n C
ou
nts
C D
Exp
ressio
n C
ou
nts
Exp
ressio
n C
ou
nts
A B
Data not normalized
Exp
ressio
n C
ou
nts
expected to see clustering between replicates of the same group this is not the case, since the
expression varies among replicates for the same condition. One reason can be the heterogeneity of
the population, which is estimated as 80-90% of neurons and 10-20% of glial cells. The stage of
differentiation can also influence the results, since we believe that the population is not completely
homogenous regarding the differentiation stage, although we estimate that the majority of the
population represents completely/fully differentiated cells, mainly mature neurons. PCA plot does not
show clustering of samples based on time or concentration points (Figure 5.3, B and C, respectively).
Final data set consists of 35,189 TCs and 31 samples.

23
Figure 5.2 – Overall differences in gene expression of all samples for normalized and filtered
data. Principal component (PC) analysis plot illustrating the differences in normalized expression counts of
high-dimensional data consisting of 35,189 tag clusters. Replicates are colored according to experimental
condition. No visible clusters or batch effects are identified. One outlier sample is identified (C18), clearly
separated from the rest of the samples along PC1 and PC2.
Figure 5.3 – Overall differences in gene expression of all samples for normalized and filtered
data. Principal component (PC) analysis plot illustrating the differences in normalized expression counts of
high-dimensional data consisting of 35,189 tag clusters. Replicates are colored according to experimental
condition (A), time (B) and concentration (C). No visible clusters or batch effects are identified.

24
CHAPTER 1: How does gene expression mediates caffeine response of
neuronal cells and what genes mediate this response?
Gene Expression in Neuronal Cells
A total of 43,631 tag clusters were detected in the sequenced CAGE libraries. Each tag cluster
represents a group of TSSs that is associated with a gene. Several TSSs are annotated with the
same gene, which indicates that one gene can have multiple transcription start sites, or alternative
promoters. From all TCs detected, 6,062 are not annotated and the remaining represents 14,014
genes.
For all the comparisons presented in Table 5.1, a total of 307 differentially expressed tag clusters was
obtained. From all differentially expressed genes, only 268 are annotated and represent 253 genes. In
Supplementary Table 1, the list of differentially expressed tag clusters and corresponding genes can
be found, including information on the comparisons used, fold change and statistical significance.
Gene Expression Changes Due to Handling
When analyzing non-treated cells over time, we observed accentuated changes in gene expression:
15, 44 and 38 annotated TCs were up- or downregulated after 1, 3 and 9 hours, respectively (Figure
5.4, yellow bars). The changes seen for these transcription start sites do not represent a response to
caffeine, since these cells were not submitted to caffeine treatment. These alterations might represent
the result of sample handling and cell vital processes that are active in these cells. These variations,
considered as background variation, are much accentuated and can significantly mask the response
to caffeine stimulus in treated cells if not considered.
The genes represented by the mentioned TCs with altered expression are involved in processes such
as regulation of transcription from RNA polymerase II promoter (GO:0006357), regulation of cell
differentiation (GO:0045595), positive regulation of cellular biosynthetic process (GO:0031328),
positive regulation of signaling (GO:0023056), regulation of multicellular organismal development
(GO:2000026), neuron differentiation (GO:0030182), positive regulation of phosphorylation
(GO:0042327), cell motility (GO:0048870), tissue morphogenesis (GO:0048729), regulation of MAP
kinase activity (GO:0043405), and cell migration (GO:0016477). These GO terms were obtained as
described in section Methods.
25
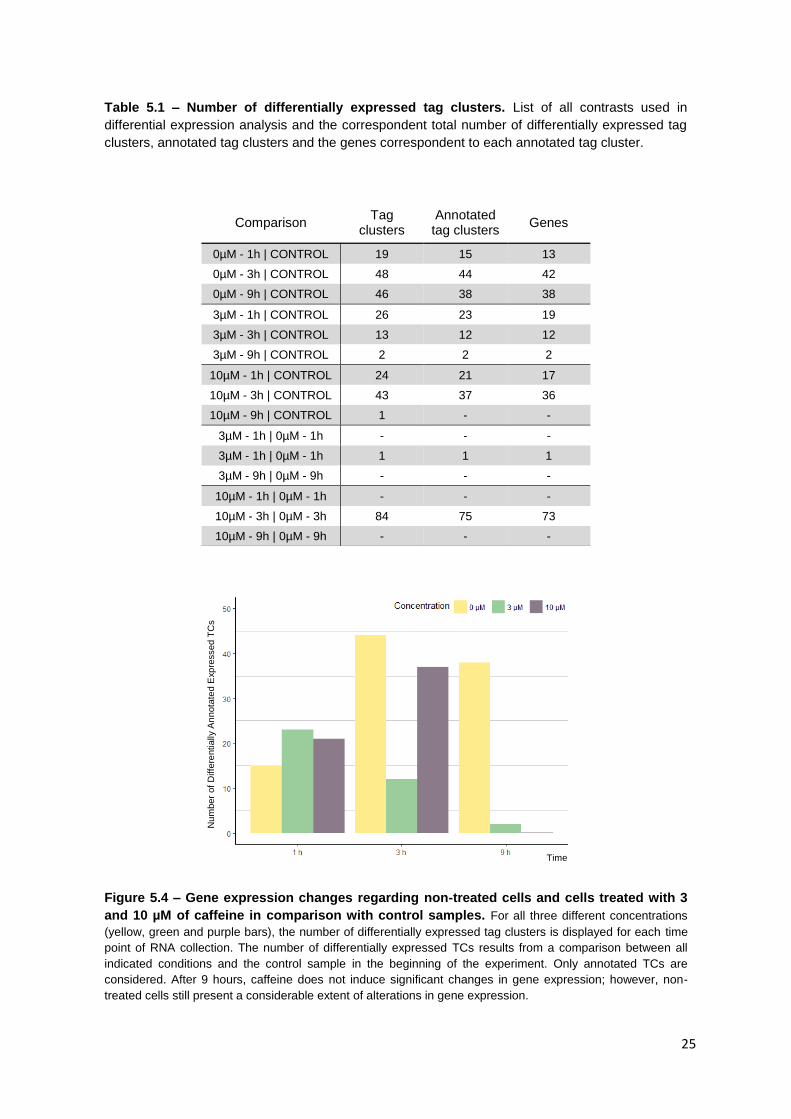
Figure 5.4 – Gene expression changes regarding non-treated cells and cells treated with 3
and 10 µM of caffeine in comparison with control samples. For all three different concentrations
(yellow, green and purple bars), the number of differentially expressed tag clusters is displayed for each time
point of RNA collection. The number of differentially expressed TCs results from a comparison between all
indicated conditions and the control sample in the beginning of the experiment. Only annotated TCs are
considered. After 9 hours, caffeine does not induce significant changes in gene expression; however, non-
treated cells still present a considerable extent of alterations in gene expression.
Num
ber
of
Diffe
rentially A
nnota
ted E
xp
ressed T
Cs
Time
Comparison Tag
clusters Annotated tag clusters
Genes
0µM - 1h | CONTROL 19 15 13
0µM - 3h | CONTROL 48 44 42
0µM - 9h | CONTROL 46 38 38
3µM - 1h | CONTROL 26 23 19
3µM - 3h | CONTROL 13 12 12
3µM - 9h | CONTROL 2 2 2
10µM - 1h | CONTROL 24 21 17
10µM - 3h | CONTROL 43 37 36
10µM - 9h | CONTROL 1 - -
3µM - 1h | 0µM - 1h - - -
3µM - 1h | 0µM - 1h 1 1 1
3µM - 9h | 0µM - 9h - - -
10µM - 1h | 0µM - 1h - - -
10µM - 3h | 0µM - 3h 84 75 73
10µM - 9h | 0µM - 9h - - -
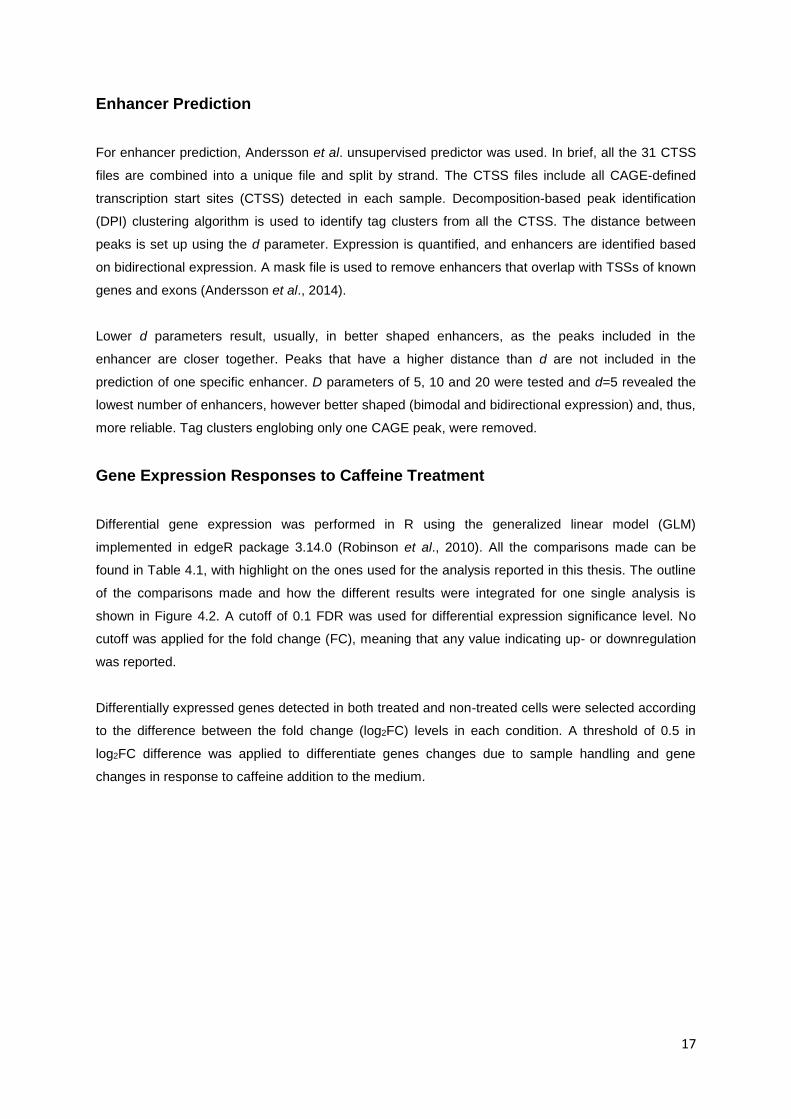
Table 5.1 – Number of differentially expressed tag clusters. List of all contrasts used in
differential expression analysis and the correspondent total number of differentially expressed tag
clusters, annotated tag clusters and the genes correspondent to each annotated tag cluster.

26
Gene Expression Changes in Cells Treated with Caffeine
Differential expression analysis allows an evaluation of differences in gene expression in different
conditions. With our first question in mind, it allows assessing how different concentrations of caffeine
affect gene expression during the course of time. If a specific gene is differentially expressed between
two conditions, then caffeine is causing a change in its expression level.
In this study, we are particularly interested in gene expression changes that occur due to caffeine
exposure, thus we compare non-treated cells with cells treated with 3 µM and 10 µM at the same time
points to see the effect of concentration. We also compare control cells (no treatment at 0 h) with 3
µM and 10 µM treated cells at all different time points to see the effect over time.
A wide number of different comparisons can be made in order to investigate what is the effect over
time, the concentration effect, which parameter (time/concentration) has the bigger impact on gene
expression variation, amongst other. However, it is not feasible to address all at once. With this in
mind, and focusing on our first aim, we evaluated how cells respond to different concentrations of
caffeine in the different time points, removing the background noise that is observed in non-treated
cells.
In respect to treated cells, the comparisons made to assess the time-dependent response to caffeine
resulted in 109 differentially expressed tag clusters, from which 95 are annotated (Figure 5.4, green
and purple bars) and represent 86 genes. The comparisons made to assess the dose-dependent
response to caffeine resulted in 85 differentially expressed tag clusters, from which 76 are annotated
and represent 74 genes. Non annotated tag clusters were considered in later correlation analysis with
enhancer expression but were omitted in gene ontology and pathway analysis.
Principal component analysis was, once again, used to visualize and summarize the high dimension
transcriptional data to identify caffeine-induced differences in the gene expression patterns of cells
(Figure 5.5). When considering all genes that exhibit gene expression changes in response to
caffeine, samples appear to group according to time of exposure. Samples corresponding to 1 hour of
exposure are very different, in their patterns of gene expression, from samples corresponding to 9
hours of exposure, regardless of the caffeine dose. The 9 hour samples are very similar to control
samples, which might indicate that gene expression returns to normal levels after 9 hours of caffeine
treatment.
27
Genes Mediating Response to Caffeine Stimulus
The changes in gene expression that are observed in non-treated cells are expected to occur in
treated cells as well. These alterations are probably a result of sample manipulation, such as
removing cells from incubation every time a measurement needs to be made. In order to assess the
effect of caffeine alone, we need to be able to distinguish the changes that occur due to handling from
the changes that occur in response to caffeine addition to the medium.
Removal of background noise was possible by integrating differential gene expression results from
three comparisons: 1) compare each time point for 3 µM and 10 µM with control; 2) compare the time
point for non-treated cells with control; and 3) compare the same time point in treated and non-treated
cells. As an example, evaluation of caffeine response in cells treated with 3 µM after 3 hours is
represented by the following comparisons: 1) 3µM-3h|CONTROL; 2) 0µM-3h|CONTROL; and 3) 3µM-
3h|0µM-3h, where “CONTROL” represents 0µM-0h (Figure 4.2).
By comparing cells treated with caffeine at different time points with the control cells we look at the
effect of caffeine over time for each concentration. The same comparison can be made for non-
treated cells, and in this case we mainly see the results of sample manipulation. The simple act of
removing cells from incubation several times during the experiment has effects on gene expression as
cells struggle to efficiently respond and compensate even the slightest stress that might be triggered
in the cells. When considering these two comparisons we can see the common genes changes and
investigate if these changes are completely due to handling or if caffeine might have a role in
amplifying the alterations. We address this question by comparing the fold change in both conditions
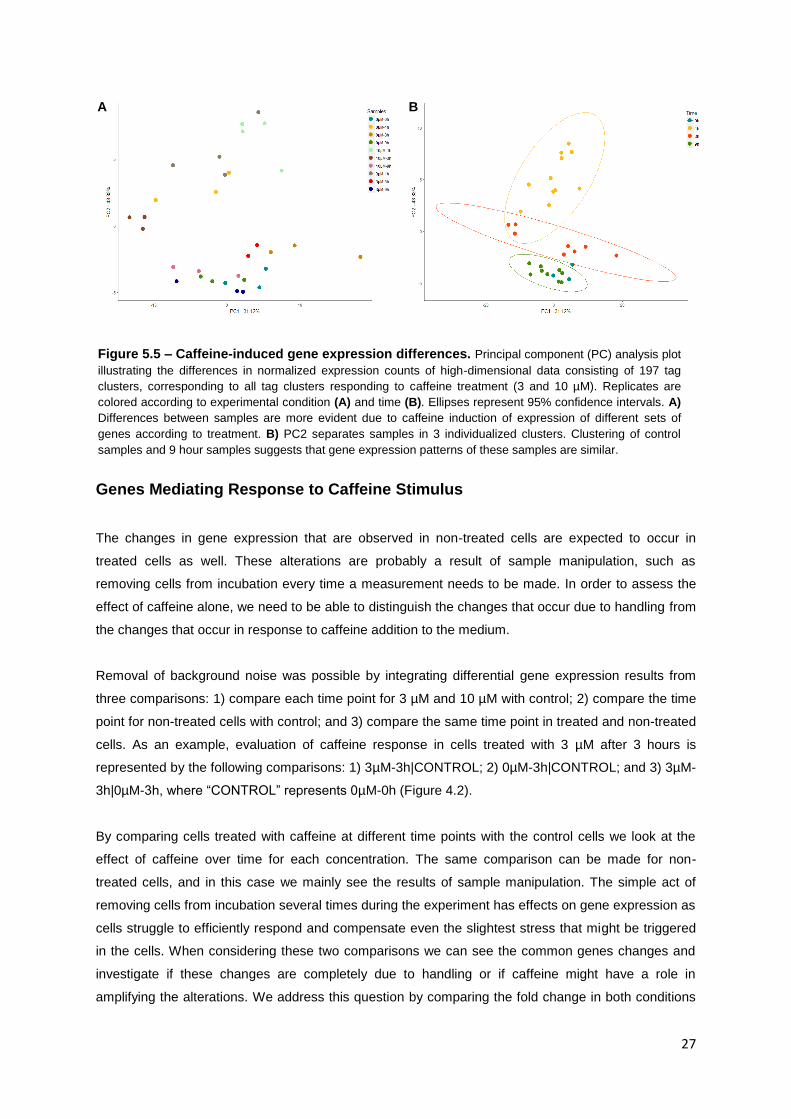
Figure 5.5 – Caffeine-induced gene expression differences. Principal component (PC) analysis plot
illustrating the differences in normalized expression counts of high-dimensional data consisting of 197 tag
clusters, corresponding to all tag clusters responding to caffeine treatment (3 and 10 µM). Replicates are
colored according to experimental condition (A) and time (B). Ellipses represent 95% confidence intervals. A)
Differences between samples are more evident due to caffeine induction of expression of different sets of
genes according to treatment. B) PC2 separates samples in 3 individualized clusters. Clustering of control
samples and 9 hour samples suggests that gene expression patterns of these samples are similar.
A B

28
and selecting the genes that show a significant difference. Last, we compare our condition of interest
with non-treated cells at the same time point to see the effect of concentration only, regardless of the
evolution of gene expression over time.
After comparing each concentration at each time point with the correspondent condition for non-
treated cells, we observe significant changes in gene expression at 1 h for cells treated with 3 µM of
caffeine and at 3 h for cells treated with 10 µM of caffeine. No other dose-dependent differentially
expressed genes were found for time points other than the ones stated.
By means of Venn diagrams illustrations, the relation between all three comparisons can be studied
as a whole and a final list of genes can be selected. The Venn diagram shown in the left panel of
Figure 5.6 illustrates the number of differentially expressed genes observed at 1 h for cells treated
with 3 µM of caffeine when compared to the control (A) and when compared to non-treated cells at
the same time point (B) as well as the number of differentially expressed genes due to handling (C). In
the right panel of the same figure, a schematic of the comparisons made is shown to support the
interpretation of the venn diagram.
Figure 5.6 – Evaluation of gene expression responses to treatment with 3 µM of caffeine. On
the left side, a venn diagram represents the number of differentially expressed genes in each comparison: A)
time-dependent response, B) concentration-dependent response and C) response to sample handling. The
number of differentially expressed genes that are common in non-treated cells and in cells treated with 3 µM of
caffeine is also shown. On the right side, a schematic of the comparison used in the analysis with colored
arrows indicating the comparisons shown in the venn diagram representation.

29
After removing the genes expressed as a result of manipulation, the resulting list of 16 genes was
further investigated to assess the nature of these genes as well as the pathways and processes they
relate to.
Gene ontology analysis (Figure 5.7) showed a total of 61 GO terms within the established parameters,
with 22 of which hereby reported as the most worth highlighting. Six GO terms related to synaptic
activity processes are perturbed, such as synaptic signaling (GO:0099536), trans-synaptic signaling
(GO:0099537), anterograde trans-synaptic signaling (GO:0098916), chemical synaptic transmission
(GO:0007268), positive regulation of dopamine uptake involved in synaptic transmission
(GO:0051586) and positive regulation of neurotransmitter uptake (GO:0051582).
One of 7 down-regulated genes is related to the two latter processes: nat8l, a gene coding for a
neuron-specific metabolite – N-acetylaspartate acid (NAA) – that, ultimately, regulates acetyl co-A
transport to nervous system and promotes dopamine uptake (Arun et al., 2009; Moffet et al., 2013).
When the process is down-regulated, acetyl co-A supply to the nervous system is strongly
conditioned, which happens after 1 hour of caffeine exposure. Nat8l is also involved in all 4 synapse-
related processes earlier mentioned, as well as three up-regulated genes: egr2, egr3 and npas4.
Early growth response (EGR) genes strongly condition neuronal plasticity and are, often, involved in
memory studies (Minatohara et al., 2015).
Several pathways appear to be perturbed at 1 hour after exposing cells to 3 µM of caffeine (Figure
5.8; Supplementary Figures S1-S3). With a an increase in expression of 16x, Fos is involved in B and
T cell receptor signaling pathways and toll-like receptor signaling pathways, which suggests an
upregulation of immune response processes. One significantly downregulated gene – TubaA – is
associated with gap junction establishment, with a decrease in expression of around 15x.
Figure 5.7 – Biological processes perturbed by treatment with 3 µM of caffeine. Gene ontology
(GO) analysis results performed in order to understand in which biological processes the caffeine response
mediator genes are involved. P-values are indicated in Supplementary Table 3.

30
A similar diagram is shown for cells after 3 hours of exposure to 10 µM of caffeine (Figure 5.9),
illustrating the number of differentially expressed genes observed for these cells when compared to
the control (A), when compared to non-treated cells at the same time point (B) as well as the number
of differentially expressed genes due to handling (C). Once again, in the right panel of the figure, a
schematic of the comparisons made is shown to support interpretation. Genes expressed as a result
of manipulation were removed and a final list of 96 TCs, was further investigated with pathway and
gene ontology analysis.
Figure 5.9 – Evaluation of gene expression responses to treatment with 10 µM of caffeine. On
the left side, a venn diagram represents the number of differentially expressed genes in each comparison: A)
time-dependent response, B) concentration-dependent response and C) response to sample handling. The
number of differentially expressed genes that are common in non-treated cells and in cells treated with 10 µM
of caffeine is also shown. On the right side, a schematic of the comparison used in the analysis with colored
arrows indicating the comparisons shown in the Venn diagram representation.
Figure 5.8 – Biological pathways perturbed by treatment with 3 µM of caffeine. Pathway
analysis results performed in order to understand in which biological pathways the caffeine response mediator
genes are involved.
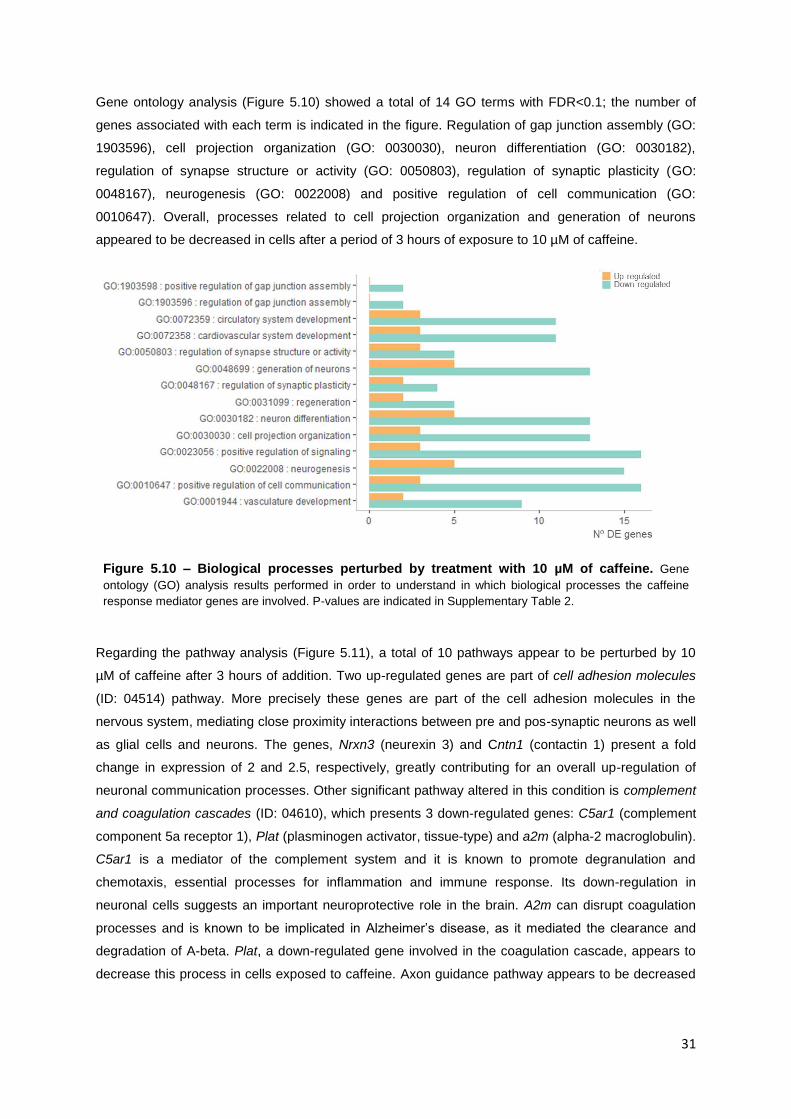
31
Gene ontology analysis (Figure 5.10) showed a total of 14 GO terms with FDR<0.1; the number of
genes associated with each term is indicated in the figure. Regulation of gap junction assembly (GO:
1903596), cell projection organization (GO: 0030030), neuron differentiation (GO: 0030182),
regulation of synapse structure or activity (GO: 0050803), regulation of synaptic plasticity (GO:
0048167), neurogenesis (GO: 0022008) and positive regulation of cell communication (GO:
0010647). Overall, processes related to cell projection organization and generation of neurons
appeared to be decreased in cells after a period of 3 hours of exposure to 10 µM of caffeine.
Regarding the pathway analysis (Figure 5.11), a total of 10 pathways appear to be perturbed by 10
µM of caffeine after 3 hours of addition. Two up-regulated genes are part of cell adhesion molecules
(ID: 04514) pathway. More precisely these genes are part of the cell adhesion molecules in the
nervous system, mediating close proximity interactions between pre and pos-synaptic neurons as well
as glial cells and neurons. The genes, Nrxn3 (neurexin 3) and Cntn1 (contactin 1) present a fold
change in expression of 2 and 2.5, respectively, greatly contributing for an overall up-regulation of
neuronal communication processes. Other significant pathway altered in this condition is complement
and coagulation cascades (ID: 04610), which presents 3 down-regulated genes: C5ar1 (complement
component 5a receptor 1), Plat (plasminogen activator, tissue-type) and a2m (alpha-2 macroglobulin).
C5ar1 is a mediator of the complement system and it is known to promote degranulation and
chemotaxis, essential processes for inflammation and immune response. Its down-regulation in
neuronal cells suggests an important neuroprotective role in the brain. A2m can disrupt coagulation
processes and is known to be implicated in Alzheimer’s disease, as it mediated the clearance and
degradation of A-beta. Plat, a down-regulated gene involved in the coagulation cascade, appears to
decrease this process in cells exposed to caffeine. Axon guidance pathway appears to be decreased
Figure 5.10 – Biological processes perturbed by treatment with 10 µM of caffeine. Gene
ontology (GO) analysis results performed in order to understand in which biological processes the caffeine
response mediator genes are involved. P-values are indicated in Supplementary Table 2.
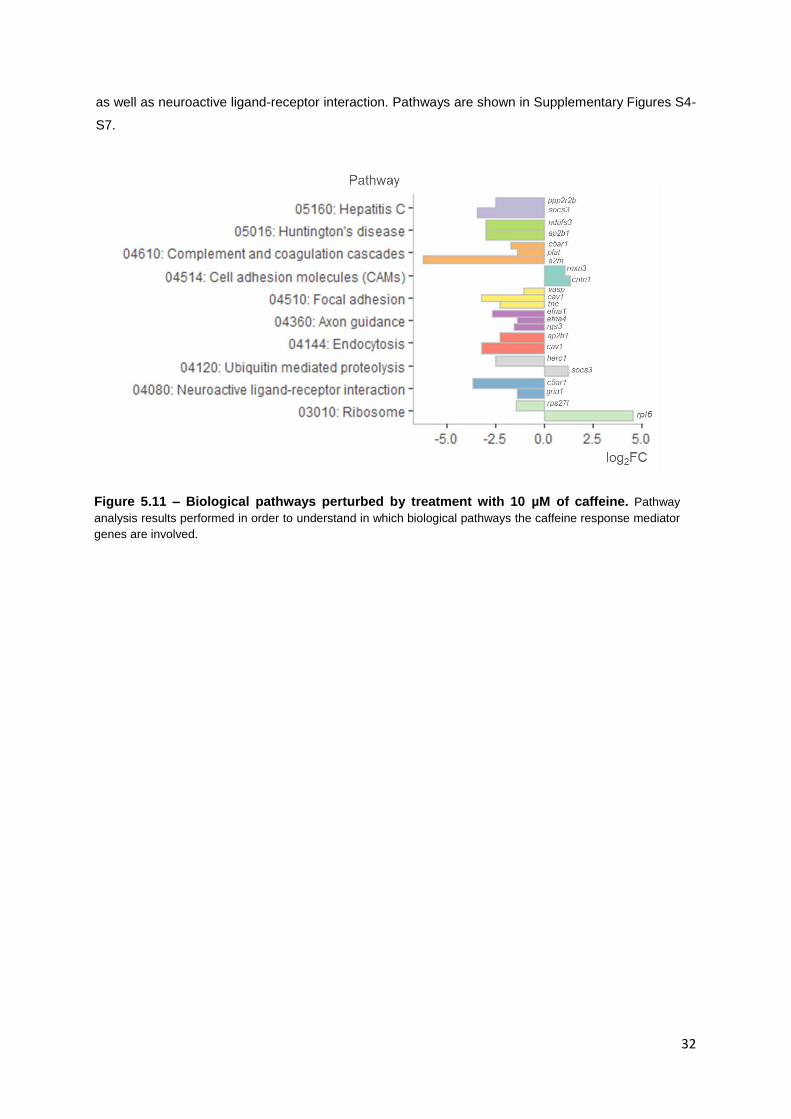
32
as well as neuroactive ligand-receptor interaction. Pathways are shown in Supplementary Figures S4-
S7.
Figure 5.11 – Biological pathways perturbed by treatment with 10 µM of caffeine. Pathway
analysis results performed in order to understand in which biological pathways the caffeine response mediator
genes are involved.

33
CHAPTER 2: Identification of active enhancers in neuronal cells and
identification of enhancers that regulate mediator genes in caffeine response
Enhancers in Neuronal Cells
The genomic localization of active transcribed enhancers was predicted as described and 8,061
enhancers were identified by the predictor. The 15 highest expressed enhancers were visually
investigated in depth in terms of shape, expression and genomic localization, using ZENBU genome
browser based on human genome 19 (hg19) for reference.
The 15 highest expressed enhancers showed bimodal and bi-directional patterns of expression. The
CAGE peaks and the enhancer representation are displayed in Figure 5.12, which illustrates the bi-
directionality of typical enhancer expression. Enhancers overlapping with coding genes were
investigated regarding the genome localization and were found to be located within intronic regions.
One enhancer was found to overlap with two TCs of annotated genes, even though the predictor
excluded these cases. Since one of the TCs is annotated as long non-coding RNA and its function is
not known so far, it can be the case that this is a real enhancer.
Enhancer Activity in Response to Caffeine Stimulus
A total of 12 enhancers were found to be differentially expressed between different conditions, 7 of
which overlap with coding genes and were confirmed to be in intronic regions (Table 5.2).
Comparisons between consecutive time points for each concentration were included in the analysis
and 1 enhancer (chr17:42589128-42589447) is differentially expressed throughout time in cells
treated with 3 µM of caffeine. The expression of this enhancer increases between hour 1 and hour 3
and decreases until hour 9 (Figure 5.13).
Comparison Enhancers
0µM - 3h | 0µM - 1h 3
3µM - 1h | CONTROL 8
3µM - 9h | CONTROL 1
3µM - 3h | 3µM - 1h 1
3µM - 9h | 3µM - 3h 1
Table 5.2 – Number of differentially expressed enhancers. List of all contrasts used in
differential expression analysis that showed differentially expressed enhancers and the
correspondent number of differentially expressed enhancers.

34
Figure 5.12 – Representation of bimodal and bidirectional expression pattern of 15 highest
expressed enhancers in neuronal cells. Green peaks represent expression detected on the forward
strand and purple peaks represent expression detected on the reverse strand. Black boxes connected by
horizontal line indicate the enhancer region.

35
Caffeine Mediator Genes Regulated by Enhancers
A pairwise correlation in expression levels between enhancers and promoter regions was performed
for all intersection pairs and we identified 909 intra chromosomal pairs with high correlation coefficient
(cor>0.5), with an average of 1.2 strongly associated TCs per enhancer.
In the same fashion as before, the 15 highest expressed enhancers were assessed in depth and from
all the promoter-enhancer pairwise combinations regarding these 15 enhancers, we identified 52 intra
chromosomal pairs with a high correlation coefficient (cor>0.5). We further investigated what was the
nature of the genes represented by TCs in close interaction with these highly expressed enhancers.
Genes involved in cell cycle regulation and cell proliferation (Malat1), centrosome cohesion before cell
division (Crocc), neuroprotective and anti-apoptotic factor (Mtrnr2l1), cell signal transduction (Cdc37),
nervous system development (GamT), cytoskeleton regulation in neurons and cell-cell adhesion
Apc2), intracellular protein transport (Reep6), among several other.
We also looked for enhancers that could potentially be regulating the differentially expressed TCs.
Nine differentially expressed TCs have a strong association with one enhancer. Even though the
target TC was differentially expressed, none of the associated enhancers were differentially
expressed in the same contrast. Concerning differentially expressed enhancers, only 1 shows a
strong association with two promoters.
Figure 5.13 – Evolution of enhancer expression over time. Enhancer chr17:42589128-42589447
shows a clear response to treatment with 3 and 10 µM of caffeine (green and purple bars). After 3 hours
of exposure, 3 µM-treatment appears to have a strong effect on the induction of this enhancer.

36
Considering the genomic localization of the 63 identified enhancer-promoter pairs that show strong
correlation in expression levels, 8 enhancers were found to be co-localized with the promoters. This
means that the expression detected for the enhancer in one direction corresponds to the tag cluster
representing the promoter, which explains the high correlation coefficient. For all cases, the tag
clusters are not annotated. Since the genes are not known, the tag clusters might, in fact, constitute
an enhancer. Here, we report some of the enhancer-promoter pairs with good correlation in
expression that look relevant and worth investigating (Figure 5.14).
C5ar1, a significantly differentially expressed gene is associated with enhancer chr19:47949383-
47949406 with a correlation coefficient of 0.73 (Figure 5.14, A). Unlike the target gene, the enhancer
is not differentially expressed in any condition. The expression of the TC is higher at hour 3 for non-
treated cells. When cells are treated with 3 µM of caffeine, expression of the enhancer appears to be
downregulated and, consequently, so is the expression of the promoter. With 10 µM treatment, the
enhancer is not expressed at all and the expression of the promotor strongly decreases. Although,
these changes are not noticeable if comparing treated cells with control cells, the results suggest that
the enhancer is regulating this gene and that the gene is a mediator of caffeine response. Caffeine
appears to contradict the upregulation of C5ar1 expression in non-treated cells.
Sfxn3, a gene that presents changes in gene expression in non-treated cells after 9 hours, appears to
be regulated by enhancer chr10:103064180-103064576. However, the expression of the promoter of
this gene seems to change in the opposite way of the enhancer. In Figure 5.14B, the expression of
the enhancer is gradually increasing in non-treated cells as opposed to the expression of the
promoter, which is progressively decreasing. This might suggest that this enhancer regulates an
intermediary gene that in turn regulates Sfxn3.
The promoter of Nfix is downregulated at 3 hours in cells treated with 10 µM of caffeine. When
evaluating the relation between the expression of the promoter and the expression of the enhancer, it
is clear that the absence of enhancer expression is mirrored is the strong downregulation seen in the
promoter (Figure 5.14C).
A high correlation in expression between a promoter and the associated enhancer is seen with the
promoter of Sox2, a transcription factor with a key role in maintenance of pluripotency state (Figure
5.14D). In all conditions, the expression of the promoter appears to follow the one of the enhancer.
Another example of very high correlation in expression patterns is the promoter of Dlgap1-as1. Cells
treated with 10 µM of caffeine appear to have a strong decrease in enhancer expression after 3 hours
of exposure and, consequently, the same decline is seen in the evolution of the promoter expression.
One enhancer (chr17:42589128-42589447, Figure 5.13) is associated with two tag clusters
(chr17:42429502..42429563,+ and chr17:42589267..42589277,-). The first one represents the
promoter of Grn, a gene involved in inflammation, wound repair, and tissue remodeling processes.

37
The second one is not annotated and, thus, its function is unknown. This enhancer appears to be
responding to treatment with 3 µM caffeine, since it shows significant upregulation after 3 hours
followed by an accentuated downregulation until 9 hours. The second promotor co-localizes with the
enhancer. As mentioned before, this might suggest the genomic region identified as a transcription
start site of an non-annotated gene might, in fact, be an enhancer region that regulates the promoter
of Grn.
A very highly expressed enhancer (chr7:157483026-157484172) shows a very high correlation (0.98)
with Ptprn2 promoter expression. However, the enhancer is located in an intronic region of this gene.
Given that the enhancer is located more than 800 kbp away from the start of the gene, which is over 1
million bp in size, it might be a real intronic enhancer.

38
Figure 5.14 – Evolution of enhancer and promoter expression over time of putative
interactions. On the left side, the enhancer expression in CPM-normalized counts. On the right side, the
promoter expression in CPM-normalized counts. All pairs represent enhancer-promoter pairs with high
correlation in expression, regarding time and caffeine treatment.
C5AR1
SFXN3
NFIX
SOX2
39
6. Discussion
The design of this study offers several advantages over other models used in similar studies. Studies
regarding neuronal cells have been performed in animal models or neuroblastoma cell lines (SH-
SY5Y), which are already very well characterized and implemented in research. The latter shows
specific adrenergic and dopaminergic phenotypes, a feature required for disease-modeling studies,
for instance. However, differentiation of iPSCs can be directed towards specific neuronal phenotypes
and obtain enriched cell lines. A more general cell population, such as the one obtained in this study,
is a good model for nervous system development or neurotoxicity studies due to its heterogeneity in
cell types.
In a study concerning the effects of caffeine on the human brain, and being impossible to use a
human brain as a model, a healthy human cell line appears very appealing and a major advantage
over commonly established models. The use of human neuronal cells derived from human iPSCs
resembles a healthy human nervous system cell population and stands as one of the major
advantages of this study. Detection of gene expression with a high throughput genome-wide
approach such as CAGE offers great coverage for the questions we proposed to answer in the
present study. Other commonly used RNA-sequencing techniques detect expression on transcript
level. CAGE allows the identification of promoter expression with high sensitivity and specificity, as
well as non-annotated transcriptional enhancers (Shiraki et al., 2003).
Most studies resort to high concentrations of caffeine in the uncertainty that low concentrations would
induce any kind of response by the cells or to try to attain similar results of those of long-term effects.
Low concentrations of caffeine have been shown to induce antagonism of adenosine receptors. Here
we show that low concentrations of caffeine have effects on specific genes’ expression, as well as on
regulator enhancers.
In chapter 1, we address our first aim of understanding what genes are responsible for mediating
caffeine response in neuronal cells. For this we sampled cells that underwent treatment with different
physiological concentrations of caffeine for 3 different exposure periods. A negative control was also
sampled and consists of cells that were not exposed to caffeine and that were sampled in hour 0 of
the experiment. To increase the precision in measuring gene expression changes, these cells were
also sampled in all time points of the experimental design (1, 3 and 9 hours). With these 4 controls we
can follow gene expression variation on non-stimulated conditions (no caffeine stimulus), considering
that manipulation and sample handling interfere with gene expression.
To identify the genes responding to caffeine and to measure this response in terms of fold change, we
used differential gene expression tools. To detect changes in gene expression we always compare
two conditions and, for each gene, we obtain the difference between the expression of that gene in

40
both conditions in terms of fold change, always considering the statistical significance of that fold
change.
The variations found in the transcriptome of non-treated cells are essential to understand and
distinguish caffeine response and manipulation effects on cells. First of all, these cells show
prominent activity in biosynthetic processes, cell motility and migration, tissue morphogenesis,
phosphorylation and cell signaling which are vital and natural occurring processes in living cells. It is
also expected to see up- and downregulation of these processes over time, which is the case. Genes
involved in cell differentiation processes also show prominent changes over time which is indicative of
the existence of a still-differentiating fraction of the cell population. We also detected up- and
downregulation in the expression of genes involved in neuron differentiation processes over time.
Upregulation of these genes shows that throughout 9 hours some cells are still differentiating and
downregulation of the same genes suggests that a fraction of the cell population is undergoing
differentiation and that this process is finalized during the experiment.
Three important points concerning treated cells are worth emphasizing. First, evaluating the evolution
of gene expression by comparing all conditions with the control sample (no treatment at hour 0)
illustrates a time-dependent response to caffeine. For a specific dose, we see the change throughout
time. Secondly, evaluating gene expression changes by comparing all conditions with non-treated
cells at 1, 3 and 9 hours illustrates a dose-dependent response to caffeine. For each specific time
point, we see the difference between the expression profile of non-treated and treated cells. Last of
all, the effects detected in non-treated cells have to be considered for treated cells as well, so that the
caffeine effect on its own can be accurately measured.
The results reported consist of an integrative approach chosen for the analysis of this data. By using
this approach, we can evaluate the time-dependent effect of caffeine, comparing the expression
profiles of cells exposed to lower doses (3 µM) and higher doses (10 µM) after 1, 3 and 9 hours with
the control cells sampled in the beginning of the experiment. We can also evaluate the dose-
dependent response and remove the background variations.
After 1 hour, 3 µM-treated cells appear to have increased activation of B and T cell receptors and toll-
like receptors. Fos proto-oncogene (Fos), a gene that codes for a subunit of AP-1 transcription factor
complex, is involved in all 3 processes mentioned above. Four tag clusters were associated with this
gene and the expression of two of them is exclusively induced after cells are exposed to 3 µM of
caffeine during 1 hour. One of these tag clusters is the one that maps closer to the known start of the
gene. Other 3 tag clusters might indicate alternative transcription start sites for the expression of this
gene. For the 3 pathways mentioned, upregulation of Fos indicates an increase in inflammatory and
chemotactic events that, ultimately, lead to complement and coagulation activation. Upregulation of
Fos and another member of the same family – FosB – indicate increase in osteoclast differentiation

41
processes. However, given the cell model and the ubiquitous nature of these genes, this might not be
true.
Similarly to Fos, JunB proto-oncogene (JunB), also a subunit of AP-1 transcription factor complex, is
perturbed by treatment with 10 µM of caffeine after 1 hour of exposure. This gene shows around 17
times more expression in cells that experience higher dose caffeine treatment and it is exclusively
differentially expressed with caffeine treatment. These genes (Fos and JunB) are two of several
immediate early response (IER) genes and have been shown to be induced by caffeine treatment
before (Svenningsson et al., 1995). Concordantly with previous studies, our results show that
physiological concentrations of caffeine can induce expression of IER genes. The list of IER genes
was obtained from the literature search presented by a previous study (Arner et al., 2015). No
enhancer was found to be regulating either of these genes.
Gap junction pathway is also found to be perturbed by 3 µM of caffeine exposure for 1 hour. Tuba1 is
the only perturbed gene associated with this pathway and is around 15 times less expression when
caffeine is present. These results suggest that lower doses of caffeine inhibit extracellular matrix
organization and cell interaction by gap junction assembly.
Synaptic activity seems to be very prominent after 1 hour of caffeine exposure in a lower dosage due
to the upregulation of immediate early genes (Egr1, Egr2 and Egr3). Neurotransmission processes
seem to lack basic supply of acetyl co-A and, ultimately, can result in the decrease of
neurotransmitters availability. Dopaminergic neurotransmission might be increased due to
downregulation of Nat8l that leads to decrease of dopamine uptake and, thus, this neurotransmitter
accumulates in synapses prolonging its excitatory activity (Arun et al., 2009; Moffet et al., 2013).
Overall, expression changes seem to be less and less evident over time in 3 µM-treated cells and
non-existing for 10 µM-treated cells after 9 hours. We see that cells that underwent caffeine treatment
show similar expression profiles after 9 hours as those of control cells. This might be explained by a
lack of energy supply in the medium after a period of 9 hours in which cells have been moving
resources to respond to caffeine stimulus. The medium was not changed during the period of the
experiment, so no more glucose was added to it.
Expression of transcribed enhancers is usually very low, compared to expression of protein-coding
genes, for instance (Andersson et al., 2014; Arner et al., 2015). Apart from few highly expressed
enhancers, we also detected low eRNA expression levels. Assessing differences in expression of
such lowly expressed genomic regions represents a challenge, mainly because no specific model has
been developed for this end. Possibly because of this, the number of enhancers found to be
differentially expressed and, thus, involved in caffeine response is very small. However, with good
shape and correlation with putative target promoters, the enhancers we report give some important
insights on regulation of gene-mediated response to caffeine.

42
For some enhancer-promoter pairs, the tag cluster representing that promoter is differentially
expressed, but the enhancer is not. This might be explained by the fact that low levels of expression
shown by most enhancers hampers the identification of slight changes in gene expression. Enhancers
activity is time and cell-type specific (Maston et al., 2006). Given the heterogeneity of cell-types
present in the cell population and presumable differences in differentiation stages of the same cells
enhancer expression might be very different within the cell population.
Higher doses of caffeine appear to perturb immune response, extracellular matrix organization,
endocytosis, axon guidance and neuroactive interaction between ligand and receptor. 10 µM of
caffeine downregulates the expression of genes involved in generation of new neurons, neurogenesis
and neuron differentiation.
Complement component 5a receptor 1 (C5ar1) is involved in the activation of the complement system
by recognition of the complement component 5a. This receptor is expressed in neuronal cells and is
involved in neuroinflammation processes. A 2.64 decrease in expression was detected in 10 µM-
treated cells after 3 hours, when compared to non-treated cells at the point of time. Caffeine appears
to inhibit the expression of this gene by shutting down the expression of one possible regulator
enhancer. The expression of both enhancer and C5ar1 promoter follow a similar pattern of gradually
lower expression with the increase of caffeine concentration. The absence of eRNA seems to have
significant effects on the promoter expression suggesting that this interaction is likely to occur in vivo.
Coagulation cascade events appear to be decreased due to downregulation of two genes:
plasminogen activator (Plat) and alpha-2 macroglobulin (A2m). However, no enhancer was found to
be potential regulator of the promoters of both genes. Our results suggest that caffeine might have a
neuroprotective role in the nervous system, by minimizing the activity of complement cascade events
and possibly by minimizing the release of coagulation factors.
Sex determining region Y-box 2 (Sox2) shows very prominent expression after 3 hours in all 3
conditions, with higher levels in cells treated with 10 µM of caffeine. This gene is known to play a key
role in somatic cell reprogramming by participating in reversing the differentiation stage of somatic
cells to an embryonic-like pluripotency stage (Zhao et al., 2005; Zhang and Cui, 2014). It is also
involved in differentiation of neuronal progenitors from pluripotent stem cells and maintenance of
neuronal progenitors’ stem cell potential. In the present study lt-NES cells, derived from iPSCs, were
differentiated into a neuronal cell lineage, consisting of a mixture of neurons and glial cells. Although
most cells showed a differentiated phenotype, a fraction of the cell population is expected to include
undifferentiated cells and still differentiating cells. In both cases, Sox2 might be actively expressed.
The changes observed for this gene might be representative of the cell population fraction that is not
fully differentiated. The expression of the enhancer that was found to be associated with Sox2
promoter shows good correlation with the expression of the promoter which indicates that the
promoter is regulated by this enhancer. Detection of expression of genes involved in differentiation

43
processes suggests that the cell population is heterogeneous regarding differentiation stages. For
specific, or follow-up, studies on neuronal gene expression, the differentiation stage of the cell
population should be considered and a selection step could be included.
Sideways with its strengths, the study also shows limitations, which are key improvement points for
follow-up or analogous studies. In order to improve the statistical significance of the results, the
number of replicates should be increased. Performing the caffeine treatment more than once, in
different weeks for instance, is also a proposal for inclusion of more biological replicates that can
increase the statistical significance of the results. Since CAGE detects transcription initiation start
sites by capturing capped mRNAs, this detection might be influenced by post-transcription re-capping
events, which can limit the sensitivity of the technique (Li et al., 2016). mRNA re-capping events in the
cytoplasm represent a mechanism of inactivation and reactivation of mRNA function and availability
(Ignatochkina et al., 2015; Mukherjee et al., 2012; Kiss et al., 2015).
Overall, the results support our hypothesis that the response to caffeine is mediated by gene
expression changes. These might occur downstream of the adenosine receptors mechanism
inhibition. Our results indicate that caffeine regulates enhancer transcription as well. However, it is not
clear if eRNA expression is a result of interaction with target promoter and, consequent, activation or
eRNA expression triggers target promoter activation (Kim et al., 2015). Thus, we cannot conclude if
the changes in enhancer expression we report are mediated by caffeine or if caffeine perturbs
promoter expression by mechanisms other than eRNA regulation and enhancer expression is just a
side response.
Our findings suggest that caffeine has subtle effects on gene expression, affecting only a small
number of genes and these effects are not harmful or related to inflammatory responses of cell death.
Lower and higher concentrations of caffeine appear to perturb different pathways and processes. The
mechanism behind caffeine perturbation of gene expression seems to encompass, in part,
perturbation of the regulatory mechanism exerted by enhancers.

44

45
7. Future Perspectives
Validation would be an essential complement to this study and, therefore, the next step. Analysis
indicated putative enhancer-promoter pairs, which can be validated with high resolution chromatin
conformation capture (Hi-C) as true interactions. Briefly, this method allows a genome-wide screen of
proximity interactions between DNA regions that can be nearby each other or as far away as some
enhancers are from the target promoter. The genomic regions in close proximity are captured together
and then sequenced. A map of all genomic interactions is obtained and putative pairs can be
validated as true interactions or not. With capture Hi-C, enrichment can be attained for the promoters
we are interested in, greatly decreasing the number of interactions reported in the interaction map
(Belton et al., 2012; Van Berkum et al., 2010).
Although extensive comparison between CAGE and qPCR has been conducted, qPCR could still be
used to confirm the results and compare in terms of fold change.
Functional validation of enhancer-promoter pairs would greatly improve the study. Gain or loss of
function experiments regarding the enhancers found to be involved in caffeine response and
regulation of mediator genes can give valuable insights on the regulatory mechanisms of these
mediator genes. If proven that eRNA has, in fact, a determining role for enhancer-mediated activation
of target promoters, then interference RNA (iRNA) strategies could have the potential for future
disruption of targeted gene expression and assessment of enhancer and promoter interaction
mechanisms (Ren, 2010; Lai et al., 2013).
From the results obtained with this study, caffeine short-term effect on gene expression regarding
physiological appears to be very subtle. Increasing the number of replicates could greatly improve the
power of a study like this as well as facilitate the analysis of transcribed enhancers.

46

47
8. Conclusion
Caffeine is present in the everyday life of our society and economy. It attracts people with its ability to
increase alertness, physical and cognitive performance and capability to develop work or other
desired activity. Pharmacological effects in nervous and other body systems are known and, some of
them, well characterized. This study showed that caffeine affects gene expression and stimulates or
constrains several neuronal and immune processes in neuronal cells depending on dose and
exposure time.
The study focuses on the effects of caffeine concerning the average daily consumption of caffeine-
containing drinks such as coffee, tea and energetic drinks. With this in mind the concentrations of
caffeine used in this study were physiological concentrations that correspond to 2-3 cups of coffee.
Our results provide strong foundation for other studies on how the human brain responds to caffeine
and what enhancers regulate this response. This matter should still be left open for further studies
and improved research. It is important to highlight the fact that no negative or dangerous effects were
detected in this study. Caffeine does not appear to induce apoptosis or cell death pathways within the
range of doses studied. Effect on gene expression appears to be very subtle, with no enormous
changes detected. Numerous studies related to the nervous system, neurons and glial cells, nervous
system development, neurodegenerative diseases or neurotoxicity studies can and should take
advantage of differentiation of human neuronal cells from iPSCs.
These insights provide concrete hypotheses of physiological processes and associated genes for
guiding further functional validation experiments with the potential to give valuable insights into the
effects of caffeine, in a broader perspective, to the human brain.

48

49
9. References
Andersson, R., Gebhard, C., Miguel-Escalada, I., Hoof, I., Bornholdt, J., Boyd, M., … Sandelin, A.
2014. An atlas of active enhancers across human cell types and tissues. Nature 507(7493): 455-461.
Arnaud M.J. 1987. The pharmacology of caffeine. In: Jucker E., Meyer U. (eds) Progress in Drug
Research/Fortschritte der Arzneimittelforschung/Progrès des recherches pharmaceutiques. Progress
in Drug Research/Fortschritte der Arzneimittelforschung/Progrès des recherches pharmaceutiques,
vol 31. Birkhäuser Basel.
Arner, E., Daub, C. O., Vitting-Seerup, K., Andersson, R., Lilje, B., Drabløs, F., … Hayashizaki, Y.
2015. Transcribed enhancers lead waves of coordinated transcription in transitioning mammalian
cells. Science (New York, NY) 347(6225): 1010-1014.
Arun, P., Moffet, J.R., Namboodiri, A.M. 2009. Evidence for mitochondrial and cytoplasmic N-
acetylaspartate synthesis in SH-SY5Y neuroblastoma cells. Neurochemistry Internation. Volume 55,
Issue 4: 219-225.
Belton, J.-M., McCord, R. P., Gibcus, J., Naumova, N., Zhan, Y., & Dekker, J. 2012. Hi-C: A
comprehensive technique to capture the conformation of genomes. Methods (San Diego, Calif) 58(3):
268-276.
Bonati, M., Latini, R., Galletti, F., Young, John F., Tognoni, G., Garattini, S. 1982. Caffeine disposition
after oral doses. Clinical Pharmacology and Therapeutics 32: 98–106.
Brand R, Koch H. 2016. Using Caffeine Pills for Performance Enhancement. An Experimental Study
on University Students’ Willingness and Their Intention to Try Neuroenhancements. Frontiers in
Psychology 7:101.
Calo E, Wysocka J. 2013. Modification of enhancer chromatin: what, how, and why. Molecular Cell
49: 825–837.
Connolly S, Kingsbury TJ. 2010. Caffeine modulates CREB-dependent gene expression in developing
cortical neurons. Biochemical and biophysical research communications 397(2): 152-156.
De Santa, F., Barozzi, I., Mietton, F., Ghisletti, S., Polletti, S., Tusi, B. K., … Natoli, G. 2010. A large
fraction of extragenic RNA pol II transcription sites overlap enhancers. PLoS Biology 8(5): e1000384.
Djebali, S., Davis, C. A., Merkel, A., Dobin, A., Lassmann, T., Mortazavi, A. M., … Gingeras, T. R.
2012. Landscape of transcription in human cells. Nature 489(7414): 101-108.

50
Dolmetsch R, Geschwind DH. 2011. The human brain in a dish: The promise of iPSC-derived
neurons. Cell 145: 831-834.
Dragunow, M., 2008. The adult human brain in preclinical drug development. Nature Reviews Drug
Discovery 7 (8): 659-66.
EFSA NDA Panel (EFSA Panel on Dietetic Products, Nutrition and Allergies). 2015. Scientific Opinion
on the safety of caffeine. EFSA J. 13:4102.
Falk, A., Koch, P., Kesavan, J., Takashima, Y., Ladewig, J., Alexander, M., … Brüstle, O. 2012.
Capture of Neuroepithelial-Like Stem Cells from Pluripotent Stem Cells Provides a Versatile System
for In Vitro Production of Human Neurons. PLoS ONE 7(1): e29597.
Fisone, G., Borqkvist, A., Usiello, A. 2003. Caffeine as a psychomotor stimulant: mechanism of action.
Cellular and Molecular Life Sciences 61 (7-8): 857-72
Franke, A.G., Christmann, M., Bonertz, C., Fellgiebel, A., Huss, M., Lieb, K. 2011. Use of coffee,
caffeinated drinks and caffeine tablets for cognitive enhancement in pupils and students in Germany.
Pharmacopsychiatry 44 (7): 331-8.
Fredholm, B.B., Bättig, K., Holmén, J., Nehliq, A., Zvartau, E.E.. 1999. Actions of Caffeine in the Brain
with Special Reference to Factors That Contribute to Its Widespread Use. Pharmacological Reviews
51(1): 83-133.
Glade, M. 2010. Caffeine – not just a stimulant. Nutrition 26: 932-938.
Grant, D.M., Campbell, M.E., Tang, B.K., Kalow, W. 1987. Biotransformation of caffeine by
microsomes from human liver. Kinetics and inhibition studies. Biochemical Pharmacology 36: 1251–
1260.
Heintzman, N.D., Ren, B. 2009a. Finding distal regulatory elements in the human genome. Current
opinion in genetics & development 19(6): 541-549.
Heintzman, N. D., Hon, G. C., Hawkins, R. D., Kheradpour, P., Stark, A., Harp, L. F., … Ren, B.
2009b. Histone Modifications at Human Enhancers Reflect Global Cell Type-Specific Gene
Expression. Nature 459(7243): 108-112.
Ignatochkina, A.V., Takagi, Y., Liu, Y., Nagata, K., Kiong Ho, C. 2015. The messenger RNA
decapping and recapping pathway in Trypanosoma. Proceedings of the National Academy of
Sciences of the United States of America 112(22): 6967-6972.
51
Kim, T.K., Hemberg, M., Gray, J. M., Costa, A. M., Bear, D. M., Wu, J., … Greenberg, M. E. 2010.
Widespread transcription at neuronal activity-regulated enhancers. Nature 465(7295):182-187.
Kim, T.K., Hemberg, M., Gray, JM. 2015. Enhancer RNAs: A Class of Long Noncoding RNAs
Synthesized at Enhancers. Cold Spring Harbor Perspectives in Biology 7: a018622.
Kiss, D.L., Oman, K., Bundschuh, R., Schoenberg, D. 2015. Uncapped 5’ ends of mRNAs targeted by
cytoplasmic capping map to the vicinity of downstream CAGE tags. FEBS letters 589(3): 279-284.
Koch, F., Jourquin, F., Ferrier, P., Andrau, J.C. 2008. Genome-wide RNA polymerase II: not genes
only! Trends in Biochemical Sciences 3(6): 239-296.
Lai, F., Orom, U. A., Cesaroni, M., Beringer, M., Taatjes, D. J., Blobel, G. A., & Shiekhattar, R. 2013.
Activating RNAs associate with Mediator to enhance chromatin architecture and
transcription. Nature, 494 (7438): 497–501.
Li, W., Notani, D., Rosenfeld, M.G. 2016. Enhancers as non-coding RNA transcription units: recent
insights and future perspectives. Nature Reviews Genetics 17(4): 207-23.
Liguori, A., Huges, J.R., Grass, J.A. 1997. Absorption and subjective effects of caffeine from coffee,
cola, and capsules. Pharmacology Biochemistry and Behavior 58: 721–726.
Lorist, M. M., Tops, M. 2003. Caffeine, fatigue and cognition. Brain and Cognition. Volume 53, Issue
1: 82-94.
Maston, G.A., Evans, S.K., Green, A.R. 2006. Transcriptional regulatory elements in the human
genome. Annual Review of Genomics and Human Genetics 7: 29-59.
Masui, S., Nakatake, Y., Toyooka, Y., Shimosato, D., Yagi, R., Takahashi, K., … Niwa, H. 2007.
Pluripotency governed by Sox2 via regulation of Oct3/4 expression in mouse embryonic stem cells.
Nature Cell Biology 9(6): 625-35.
Minatohara, K., Akiyoshi, M., & Okuno, H. 2015. Role of Immediate-Early Genes in Synaptic Plasticity
and Neuronal Ensembles Underlying the Memory Trace. Frontiers in Molecular Neuroscience, 8, 78.
Moffett, J. R., Arun, P., Ariyannur, P. S., & Namboodiri, A. M. A. 2013. N-Acetylaspartate reductions in
brain injury: impact on post-injury neuroenergetics, lipid synthesis, and protein acetylation. Frontiers in
Neuroenergetics, 5, 11.

52
Mukherjee, C., Patil, D. P., Kennedy, B. A., Bakthavachalu, B., Bundschuh, R., & Schoenberg, D. R.
2012. Identification of cytoplasmic capping targets reveals a role for cap homeostasis in translation
and mRNA stability. Cell reports 2(3): 674-684.
National Center for Biotechnology Information. PubChem Compound Database; CID=2519,
https://pubchem.ncbi.nlm.nih.gov/compound/2519 (accessed Sept. 12, 2017).
National Center for Biotechnology Information. PubChem Compound Database; CID=6083,
https://pubchem.ncbi.nlm.nih.gov/compound/6083 (accessed Sept. 12, 2017).
Ren, B. 2010. Transcription: Enhancers make non-coding RNA. Nature 465: 173–174.
Robinson, M.D., McCarthy, D.J., Smyth, G.K. 2010. EdgeR: a Bioconductor package for differential
expression analysis of digital gene expression data. Bioinformatics 26: 139-140.
Shiraki, T., Kondo, S., Katayama, S., Waki, K., Kasukawa, T., Kawaji, H., … Hayashizaki, Y. 2003.
Cap analysis gene expression for high-throughput analysis of transcriptional starting point and
identification of promoter usage. Proceedings of the National Academy of Sciences of the United
States of America 100(26): 15776-15781.
Statista Consumer Market Outlook. 2015. Available in https://www.statista.com/chart/6088/europes-
top-ten-coffee-drinking-nations/.
Stees, J. S., Varn, F., Huang, S., Strouboulis, J., & Bungert, J. 2012. Recruitment of Transcription
Complexes to Enhancers and the Role of Enhancer Transcription. Biology 1(3): 778-793.
Svenningsson, P., Ström, A., Johansson, B., Fredholm, B.B. 1995. Increased expression of c-jun,
junB, AP-1, and preproenkephalin mRNA in rat striatum following a single injection of caffeine. The
Journal of Neuroscience 15 (5): 3583-3593
Takahashi, K., Yamanaka, S. 2006. Induction of pluripotent stem cells from mouse embryonic and
adult fibroblast cultures by defines factors. Cell 126 (4): 663-76
Takahashi, H., Lassmann, T., Murata, M., & Carninci, P. 2012a. 5’ end-centered expression profiling
using cap-analysis gene expression and next-generation sequencing. Nature Protocols 7: 542–561.
Takahashi, K., Yamanaka, S. 2006. Induction of Pluripotent Stem Cells from Mouse Embryonic and
Adult Fibroblast Cultures by Defined Factors. Cell 126(4): 663 – 676.

53
Takahashi, H., Kato, S., Murata, M., & Carninci, P. 2012b. CAGE- Cap Analysis Gene Expression: a
protocol for the detection of promoter and transcriptional networks. Methods in molecular biology
(Clifton, NJ).786: 181-200.
The FANTOM Consortium and the RIKEN PMI and CLST (DGT). 2014 A promoter-level mammalian
expression atlas. Nature 507(7493): 462-470.
Van Berkum, N. L., Lieberman-Aiden, E., Williams, L., Imakaev, M., Gnirke, A., Mirny, L. A., …
Lander, E. S. 2010. Hi-C: A Method to Study the Three-dimensional Architecture of Genomes. Journal
of Visualized Experiments : JoVE (39): 1869.
Visel, A., Rubin, E.M., Pennacchio, L.A. 2009. Genomic Views of Distant-Acting Enhancers. Nature
461(7261): 199-205.
Wang, D., Garcia-Bassets, I., Benner, C., Li, W., Su, X., Zhou, Y., … Fu, X.-D. 2011. Reprogramming
Transcription via Distinct Classes of Enhancers Functionally Defined by eRNA. Nature
474(7351):390-394.
Zhang, S., Cui, W. 2014. Sox2, a key factor in the regulation of pluripotency and neural
differentiation. World Journal of Stem Cells 6(3): 305-311.
Zhao, S., Nichols, J., Smith, A.G., Li, M. 2005. SoxB transcription factors specify neuroectodermal
lineage choice in ES cells. Molecular and Cellular Neurosciences 27(3): 332-342.

54
Supplementary Table 1 – Differentially expression results for all comparisons analyzed.
Differentially expressed tag clusters are displayed with information on the correspondent comparison and the
associated gene. Also shown are the logarithm of fold change (log2FC) and statistical significance parameters.
10. Supplementary Material
TC Gene Symbol log2FC p-value FDR Regulation Contrast
chr12:52445226..52445232,+ NR4A1 5,2032 3,7527E-15 1,3205E-10 up 0µM-1h|0µM-0h
chr5:137801166..137801178,+ EGR1 3,9756 1,7282E-14 3,0407E-10 up 0µM-1h|0µM-0h
chr6:166401410..166401570,- LINC00473 3,1693 2,6212E-14 3,0746E-10 up 0µM-1h|0µM-0h
chr14:75746746..75746799,+ FOS 3,4549 2,3656E-09 2,0810E-05 up 0µM-1h|0µM-0h
chr5:137801721..137801731,+ EGR1 6,3454 3,3923E-09 2,3874E-05 up 0µM-1h|0µM-0h
chr19:45971254..45971258,+ FOSB 3,4856 2,1963E-06 1,2881E-02 up 0µM-1h|0µM-0h
chr14:75746345..75746363,+ FOS 1,6511 4,0479E-06 2,0349E-02 up 0µM-1h|0µM-0h
chr1:117142604..117142638,- IGSF3 6,2814 6,5426E-06 2,8778E-02 up 0µM-1h|0µM-0h
chr12:89746177..89746295,- DUSP6 1,2360 1,0224E-05 3,9975E-02 up 0µM-1h|0µM-0h
chr17:38506986..38507003,+ RARA 5,2045 1,2042E-05 4,2373E-02 up 0µM-1h|0µM-0h
chr5:74632605..74632742,- CTD-2235C13.2 2,0963 1,5324E-05 4,6800E-02 up 0µM-1h|0µM-0h
chr13:102069583..102069593,- None 3,6039 1,5959E-05 4,6800E-02 up 0µM-1h|0µM-0h
chr8:143696989..143697005,+ None 3,6329 1,7701E-05 4,7915E-02 up 0µM-1h|0µM-0h
chr11:66188506..66188510,+ NPAS4 4,1633 2,2816E-05 5,3798E-02 up 0µM-1h|0µM-0h
chr19:13263829..13263909,+ IER2 1,2640 2,4248E-05 5,3798E-02 up 0µM-1h|0µM-0h
chr3:79816991..79816992,- ROBO1 4,8699 2,4461E-05 5,3798E-02 up 0µM-1h|0µM-0h
chr3:47932564..47932566,- MAP4 3,5641 3,0505E-05 6,3144E-02 up 0µM-1h|0µM-0h
chr17:38375421..38375448,- None 2,1875 4,4974E-05 8,5469E-02 up 0µM-1h|0µM-0h
chr5:137802527..137802551,- None 3,2115 4,6148E-05 8,5469E-02 up 0µM-1h|0µM-0h
chr3:147127922..147127932,+ ZIC1 3,0305 7,1141E-11 2,5034E-06 up 0µM-3h|0µM-0h
chr6:166401410..166401570,- LINC00473 2,5075 8,3687E-10 1,4724E-05 up 0µM-3h|0µM-0h
chr20:50179375..50179416,- NFATC2 4,5872 1,9304E-09 2,2643E-05 up 0µM-3h|0µM-0h
chr19:45971254..45971258,+ FOSB 4,2882 4,2593E-09 3,7470E-05 up 0µM-3h|0µM-0h
chr19:54041677..54041684,+ ZNF331 5,0073 3,1816E-08 2,2391E-04 up 0µM-3h|0µM-0h
chr17:7747519..7747522,+ KDM6B 3,1991 9,7055E-08 5,6921E-04 up 0µM-3h|0µM-0h
chr13:102069583..102069593,- None 4,1373 1,3148E-07 6,4214E-04 up 0µM-3h|0µM-0h
chr13:80912984..80913112,- SPRY2 1,6158 1,4599E-07 6,4214E-04 up 0µM-3h|0µM-0h
chr1:90287518..90287585,+ LRRC8D 2,3574 2,0079E-07 6,8392E-04 up 0µM-3h|0µM-0h
chr12:52445226..52445232,+ NR4A1 3,5468 2,1136E-07 6,8392E-04 up 0µM-3h|0µM-0h
chr4:174255445..174255602,- HMGB2 1,2816 2,1379E-07 6,8392E-04 up 0µM-3h|0µM-0h
chr2:237075077..237075158,- GBX2 1,7504 2,9053E-07 8,5196E-04 up 0µM-3h|0µM-0h
chr22:38597973..38598117,+ MAFF 2,2599 3,8440E-07 1,0405E-03 up 0µM-3h|0µM-0h
chr17:46621281..46621290,- HOXB2 1,8231 5,3513E-07 1,3451E-03 up 0µM-3h|0µM-0h
chr3:181429891..181429902,+ SOX2 2,1438 8,5860E-07 2,0142E-03 up 0µM-3h|0µM-0h
chr10:112257625..112257665,+ DUSP5 2,2727 1,0241E-06 2,2524E-03 up 0µM-3h|0µM-0h
chr16:3071261..3071269,+ TNFRSF12A 5,2306 1,9134E-06 3,9606E-03 up 0µM-3h|0µM-0h
chr5:137801166..137801178,+ EGR1 2,2415 3,2651E-06 6,3831E-03 up 0µM-3h|0µM-0h
chr6:26235190..26235245,- HIST1H1D 1,1644 4,8852E-06 9,0477E-03 up 0µM-3h|0µM-0h
chr9:22009244..22009384,- CDKN2B 1,7448 5,8654E-06 1,0320E-02 up 0µM-3h|0µM-0h
chr12:50158014..50158030,+ TMBIM6 4,4168 7,2493E-06 1,2147E-02 up 0µM-3h|0µM-0h
chr15:38545343..38545363,+ SPRED1 3,8375 9,9849E-06 1,5971E-02 up 0µM-3h|0µM-0h
chr17:61823031..61823032,- RP11-51F16.8 -6,1411 1,2221E-05 1,8698E-02 down 0µM-3h|0µM-0h
chr20:36147678..36147711,- BLCAP -2,4771 1,3701E-05 2,0089E-02 down 0µM-3h|0µM-0h
chr4:73259528..73259558,- ADAMTS3 7,2818 1,4930E-05 2,0928E-02 up 0µM-3h|0µM-0h
chr14:75746345..75746363,+ FOS 1,5162 1,5463E-05 2,0928E-02 up 0µM-3h|0µM-0h
chr14:75746746..75746799,+ FOS 2,4426 1,8817E-05 2,4524E-02 up 0µM-3h|0µM-0h
chr19:47793142..47793248,+ C5AR1 1,5137 2,8083E-05 3,5293E-02 up 0µM-3h|0µM-0h
chr4:4393197..4393249,+ NSG1 -2,3406 3,4461E-05 3,9939E-02 down 0µM-3h|0µM-0h
chr15:92981585..92981785,+ ST8SIA2 -2,7957 3,5801E-05 3,9939E-02 down 0µM-3h|0µM-0h
chr9:107690783..107690836,- ABCA1 -2,6062 3,6875E-05 3,9939E-02 down 0µM-3h|0µM-0h
chr12:49582229..49582231,- TUBA1A 2,9532 3,6916E-05 3,9939E-02 up 0µM-3h|0µM-0h
chr10:64576110..64576126,- EGR2 4,2955 3,7454E-05 3,9939E-02 up 0µM-3h|0µM-0h

55
chr19:1203161..1203164,+ STK11 5,7946 4,6232E-05 4,7849E-02 up 0µM-3h|0µM-0h
chr12:17143909..17143931,+ None -2,7680 5,1267E-05 5,1544E-02 down 0µM-3h|0µM-0h
chr4:74904404..74904523,- CXCL3 1,6633 5,4626E-05 5,3395E-02 up 0µM-3h|0µM-0h
chr7:1542698..1542824,- INTS1 -2,7186 5,9057E-05 5,6166E-02 down 0µM-3h|0µM-0h
chr11:134095347..134095354,- NCAPD3 3,6841 6,3383E-05 5,8694E-02 up 0µM-3h|0µM-0h
chr17:7741660..7741714,+ None -1,1428 8,5524E-05 7,7155E-02 down 0µM-3h|0µM-0h
chr13:78477332..78477399,- EDNRB -2,5019 8,7704E-05 7,7155E-02 down 0µM-3h|0µM-0h
chr22:39639967..39639983,- PDGFB 2,0469 1,0713E-04 9,1947E-02 up 0µM-3h|0µM-0h
chr5:137801721..137801731,+ EGR1 4,2762 1,0991E-04 9,2087E-02 up 0µM-3h|0µM-0h
chr2:122097376..122097402,- CLASP1 -5,5178 1,1511E-04 9,2266E-02 down 0µM-3h|0µM-0h
chr5:55800743..55800940,- None -4,0093 1,1537E-04 9,2266E-02 down 0µM-3h|0µM-0h
chr19:13263829..13263909,+ IER2 1,1481 1,1870E-04 9,2821E-02 up 0µM-3h|0µM-0h
chr1:156084459..156084586,+ LMNA 1,3773 1,3304E-04 9,9669E-02 up 0µM-3h|0µM-0h
chr17:17399706..17399709,- RASD1 1,7490 1,3545E-04 9,9669E-02 up 0µM-3h|0µM-0h
chr6:26056567..26056704,- HIST1H1C 1,3806 1,3596E-04 9,9669E-02 up 0µM-3h|0µM-0h
chr7:1272476..1272536,+ UNCX -1,5781 5,0296E-08 1,7699E-03 down 0µM-9h|0µM-0h
chr6:33378449..33378483,+ PHF1 -1,6457 4,8325E-07 8,5025E-03 down 0µM-9h|0µM-0h
chr1:27693431..27693471,- MAP3K6 -2,4568 1,4874E-06 1,7447E-02 down 0µM-9h|0µM-0h
chr6:36164969..36164979,- RP1-179N16.6 -3,8840 3,2102E-06 2,1268E-02 down 0µM-9h|0µM-0h
chr17:42200961..42201050,- HDAC5 -1,1581 3,5261E-06 2,1268E-02 down 0µM-9h|0µM-0h
chr18:8705551..8705612,+ SOGA2 -1,5521 3,6264E-06 2,1268E-02 down 0µM-9h|0µM-0h
chr6:166401410..166401570,- LINC00473 1,8720 5,4344E-06 2,4163E-02 up 0µM-9h|0µM-0h
chr9:96214192..96214228,+ FAM120A 1,3444 5,4933E-06 2,4163E-02 up 0µM-9h|0µM-0h
chr8:80577655..80577658,+ STMN2 3,3015 6,4248E-06 2,5120E-02 up 0µM-9h|0µM-0h
chr12:50158014..50158030,+ TMBIM6 4,4283 8,3764E-06 2,9476E-02 up 0µM-9h|0µM-0h
chr2:220435334..220435365,+ INHA -2,4505 9,5424E-06 3,0526E-02 down 0µM-9h|0µM-0h
chrX:54522665..54522666,- FGD1 -1,9013 1,1022E-05 3,1925E-02 down 0µM-9h|0µM-0h
chr19:18530187..18530270,+ SSBP4 -1,2132 1,1830E-05 3,1925E-02 down 0µM-9h|0µM-0h
chr1:117142604..117142638,- IGSF3 6,0262 1,2701E-05 3,1925E-02 up 0µM-9h|0µM-0h
chr13:102069583..102069593,- None 3,5680 1,4354E-05 3,3674E-02 up 0µM-9h|0µM-0h
chr17:7307971..7307980,+ NLGN2 -1,7777 1,7180E-05 3,7785E-02 down 0µM-9h|0µM-0h
chr20:57466441..57466479,+ GNAS -1,0984 1,9883E-05 4,1156E-02 down 0µM-9h|0µM-0h
chr9:128508946..128509011,+ None -1,1303 2,5542E-05 4,8936E-02 down 0µM-9h|0µM-0h
chr1:155100330..155100396,+ EFNA1 -1,5604 2,6422E-05 4,8936E-02 down 0µM-9h|0µM-0h
chr20:60640871..60640939,- TAF4 -1,3045 2,8522E-05 5,0183E-02 down 0µM-9h|0µM-0h
chr16:28875116..28875190,+ SH2B1 -2,0415 3,2278E-05 5,2645E-02 down 0µM-9h|0µM-0h
chr16:56659693..56659694,+ MT1E 2,5236 3,2914E-05 5,2645E-02 up 0µM-9h|0µM-0h
chr2:172016919..172016950,- TLK1 1,8689 4,0912E-05 6,0411E-02 up 0µM-9h|0µM-0h
chr10:92680843..92680847,- ANKRD1 -3,6079 4,1553E-05 6,0411E-02 down 0µM-9h|0µM-0h
chr21:45553353..45553370,- None -6,3278 4,2919E-05 6,0411E-02 down 0µM-9h|0µM-0h
chr16:29817671..29817684,+ MAZ -3,2472 4,6309E-05 6,2675E-02 down 0µM-9h|0µM-0h
chr17:34058645..34058704,+ RASL10B -1,3166 5,1463E-05 6,7072E-02 down 0µM-9h|0µM-0h
chr9:134346213..134346245,- None -2,7114 5,7719E-05 7,1072E-02 down 0µM-9h|0µM-0h
chr20:3827370..3827388,- None -3,3089 5,8572E-05 7,1072E-02 down 0µM-9h|0µM-0h
chr11:32914355..32914371,+ QSER1 -1,5636 6,6184E-05 7,3784E-02 down 0µM-9h|0µM-0h
chr12:133066715..133066774,+ FBRSL1 -1,7078 6,6539E-05 7,3784E-02 down 0µM-9h|0µM-0h
chr17:79995113..79995116,- DCXR 3,3147 6,7097E-05 7,3784E-02 up 0µM-9h|0µM-0h
chr14:100437728..100437913,+ EVL -1,2841 7,2735E-05 7,7560E-02 down 0µM-9h|0µM-0h
chr4:95129064..95129065,+ SMARCAD1 6,0481 7,6289E-05 7,8956E-02 up 0µM-9h|0µM-0h
chr1:1475973..1476003,- TMEM240 -1,6149 8,1023E-05 8,0590E-02 down 0µM-9h|0µM-0h
chr8:72448325..72448332,- RP11-1102P16.1 3,3703 8,2448E-05 8,0590E-02 up 0µM-9h|0µM-0h
chr12:6930948..6931043,+ GPR162 -1,1947 8,5144E-05 8,0764E-02 down 0µM-9h|0µM-0h
chr19:46220508..46220585,- FBXO46 -2,0491 8,7216E-05 8,0764E-02 down 0µM-9h|0µM-0h
chr7:143077435..143077523,+ None -1,3229 9,3391E-05 8,4265E-02 down 0µM-9h|0µM-0h
chr3:147127922..147127932,+ ZIC1 1,8003 1,0018E-04 8,8131E-02 up 0µM-9h|0µM-0h
chr7:100810853..100810866,- None 1,5560 1,0598E-04 9,0266E-02 up 0µM-9h|0µM-0h
chr6:44238177..44238191,+ TMEM151B -1,3737 1,0800E-04 9,0266E-02 down 0µM-9h|0µM-0h
chr1:185285480..185285489,+ None 5,8428 1,1030E-04 9,0266E-02 up 0µM-9h|0µM-0h
chr20:62711332..62711464,+ OPRL1 -1,6292 1,1815E-04 9,4490E-02 down 0µM-9h|0µM-0h
chr2:219524198..219524201,- ZNF142 4,7757 1,2547E-04 9,6571E-02 up 0µM-9h|0µM-0h
chr10:102790986..102791052,+ SFXN3 -1,0863 1,2624E-04 9,6571E-02 down 0µM-9h|0µM-0h

56
chr5:137801166..137801178,+ EGR1 4,6356 1,0344E-18 3,6399E-14 up 10µM-1h|0µM-0h
chr12:52445226..52445232,+ NR4A1 5,5359 4,8420E-18 8,5192E-14 up 10µM-1h|0µM-0h
chr14:75746746..75746799,+ FOS 4,7494 2,5954E-16 3,0444E-12 up 10µM-1h|0µM-0h
chr19:45971254..45971258,+ FOSB 4,8753 1,3909E-11 1,2236E-07 up 10µM-1h|0µM-0h
chr5:137801721..137801731,+ EGR1 7,0491 2,2679E-11 1,5207E-07 up 10µM-1h|0µM-0h
chr6:166401410..166401570,- LINC00473 2,6486 2,5929E-11 1,5207E-07 up 10µM-1h|0µM-0h
chr19:13263829..13263909,+ IER2 1,8451 2,6222E-10 1,3182E-06 up 10µM-1h|0µM-0h
chr5:137802527..137802551,- None 4,7445 2,0342E-09 8,9477E-06 up 10µM-1h|0µM-0h
chr11:66188506..66188510,+ NPAS4 5,6691 4,9599E-09 1,9393E-05 up 10µM-1h|0µM-0h
chr10:64576110..64576126,- EGR2 6,0177 1,7472E-08 6,1483E-05 up 10µM-1h|0µM-0h
chr19:39897487..39897490,+ ZFP36 2,3933 7,8919E-08 2,5246E-04 up 10µM-1h|0µM-0h
chr19:2476120..2476127,+ GADD45B 1,6857 8,7102E-07 2,5542E-03 up 10µM-1h|0µM-0h
chr14:75746345..75746363,+ FOS 1,6071 1,9568E-06 5,2966E-03 up 10µM-1h|0µM-0h
chr19:54041677..54041684,+ ZNF331 4,3218 3,6149E-06 9,0861E-03 up 10µM-1h|0µM-0h
chr8:22550990..22550992,- EGR3 4,9801 5,5332E-06 1,2980E-02 up 10µM-1h|0µM-0h
chr12:89746177..89746295,- DUSP6 1,2006 6,3821E-06 1,4036E-02 up 10µM-1h|0µM-0h
chr13:102069583..102069593,- None 3,5174 8,4119E-06 1,6497E-02 up 10µM-1h|0µM-0h
chr10:112257625..112257665,+ DUSP5 1,9979 8,4387E-06 1,6497E-02 up 10µM-1h|0µM-0h
chr14:75747308..75747348,+ FOS 3,9872 9,4812E-06 1,7560E-02 up 10µM-1h|0µM-0h
chr12:50158014..50158030,+ TMBIM6 4,2637 1,0827E-05 1,9050E-02 up 10µM-1h|0µM-0h
chr18:72163641..72163644,+ CNDP2 3,1666 1,1623E-05 1,9476E-02 up 10µM-1h|0µM-0h
chr19:12902296..12902300,+ JUNB 4,1025 1,6676E-05 2,6467E-02 up 10µM-1h|0µM-0h
chr8:143696989..143697005,+ None 3,4854 1,7299E-05 2,6467E-02 up 10µM-1h|0µM-0h
chr5:137801304..137801312,+ EGR1 4,6467 3,0286E-05 4,4405E-02 up 10µM-1h|0µM-0h
chr6:166401410..166401570,- LINC00473 3,4782 8,8514E-17 3,1147E-12 up 10µM-3h|0µM-0h
chr19:54041677..54041684,+ ZNF331 6,6420 8,6392E-15 1,5200E-10 up 10µM-3h|0µM-0h
chr19:45971254..45971258,+ FOSB 4,0624 4,2281E-08 4,9595E-04 up 10µM-3h|0µM-0h
chr12:52445226..52445232,+ NR4A1 3,6001 4,5897E-07 4,0376E-03 up 10µM-3h|0µM-0h
chr7:100808717..100808856,- VGF 1,3074 1,1898E-06 7,8221E-03 up 10µM-3h|0µM-0h
chr1:117142604..117142638,- IGSF3 6,6032 1,5516E-06 7,8221E-03 up 10µM-3h|0µM-0h
chr11:66176517..66176658,+ RP11-867G23.10 1,4248 1,6910E-06 7,8221E-03 up 10µM-3h|0µM-0h
chr3:181430136..181430158,+ SOX2 2,2770 1,7783E-06 7,8221E-03 up 10µM-3h|0µM-0h
chr13:102069583..102069593,- None 3,8778 2,1963E-06 8,5873E-03 up 10µM-3h|0µM-0h
chr11:47587007..47587033,+ PTPMT1 -3,1572 3,5087E-06 1,1438E-02 down 10µM-3h|0µM-0h
chr2:74347689..74347702,- None 2,2914 3,5756E-06 1,1438E-02 up 10µM-3h|0µM-0h
chr17:76356151..76356245,- SOCS3 -2,4830 4,3333E-06 1,2707E-02 down 10µM-3h|0µM-0h
chr10:112257625..112257665,+ DUSP5 2,1410 5,4779E-06 1,4828E-02 up 10µM-3h|0µM-0h
chr1:155100330..155100396,+ EFNA1 -1,7034 6,9913E-06 1,7573E-02 down 10µM-3h|0µM-0h
chr1:90287518..90287585,+ LRRC8D 2,0456 8,0495E-06 1,8884E-02 up 10µM-3h|0µM-0h
chr1:68849933..68849989,- None -3,0006 9,4051E-06 2,0685E-02 down 10µM-3h|0µM-0h
chr9:116263519..116263529,+ RGS3 -2,6682 1,0849E-05 2,2457E-02 down 10µM-3h|0µM-0h
chr1:155036179..155036245,+ EFNA4 -1,4048 1,3215E-05 2,5835E-02 down 10µM-3h|0µM-0h
chr2:73511412..73511416,- FBXO41 3,5747 1,4219E-05 2,6335E-02 up 10µM-3h|0µM-0h
chr1:230849855..230849885,- RP11-99J16__A.2 -3,0005 1,8502E-05 3,2553E-02 down 10µM-3h|0µM-0h
chr9:117880507..117880508,- TNC -4,2949 2,0356E-05 3,3451E-02 down 10µM-3h|0µM-0h
chr10:32635948..32636143,- AL391839.1 1,0146 2,0913E-05 3,3451E-02 up 10µM-3h|0µM-0h
chr8:41045184..41045185,+ None -3,9508 3,2741E-05 5,0093E-02 down 10µM-3h|0µM-0h
chr14:75746345..75746363,+ FOS 1,4873 3,4921E-05 5,1201E-02 up 10µM-3h|0µM-0h
chr1:170632299..170632303,+ PRRX1 -6,3733 3,7061E-05 5,2166E-02 down 10µM-3h|0µM-0h
chr17:33935215..33935361,+ AP2B1 -3,2476 3,8971E-05 5,2745E-02 down 10µM-3h|0µM-0h
chr5:176738893..176738928,- MXD3 -1,2640 4,7415E-05 5,9414E-02 down 10µM-3h|0µM-0h
chr4:95129064..95129065,+ SMARCAD1 6,2807 4,8061E-05 5,9414E-02 up 10µM-3h|0µM-0h
chr18:3594147..3594151,+ DLGAP1-AS1 -1,8677 4,8965E-05 5,9414E-02 down 10µM-3h|0µM-0h
chr17:38506986..38507003,+ RARA 4,7649 6,1479E-05 7,0877E-02 up 10µM-3h|0µM-0h
chr19:1203161..1203164,+ STK11 5,7785 6,2440E-05 7,0877E-02 up 10µM-3h|0µM-0h
chr4:174255445..174255602,- HMGB2 0,9862 6,8172E-05 7,3467E-02 up 10µM-3h|0µM-0h
chr4:1988054..1988078,- MIR943 -6,0178 6,8936E-05 7,3467E-02 down 10µM-3h|0µM-0h
chr7:131708315..131708348,- None -6,3732 7,0984E-05 7,3467E-02 down 10µM-3h|0µM-0h
chr15:38545343..38545363,+ SPRED1 3,4861 7,3771E-05 7,4170E-02 up 10µM-3h|0µM-0h
chr8:8185427..8185428,- SGK223 -6,2495 7,9647E-05 7,7853E-02 down 10µM-3h|0µM-0h
chr12:50158014..50158030,+ TMBIM6 4,0916 8,3832E-05 7,9728E-02 up 10µM-3h|0µM-0h
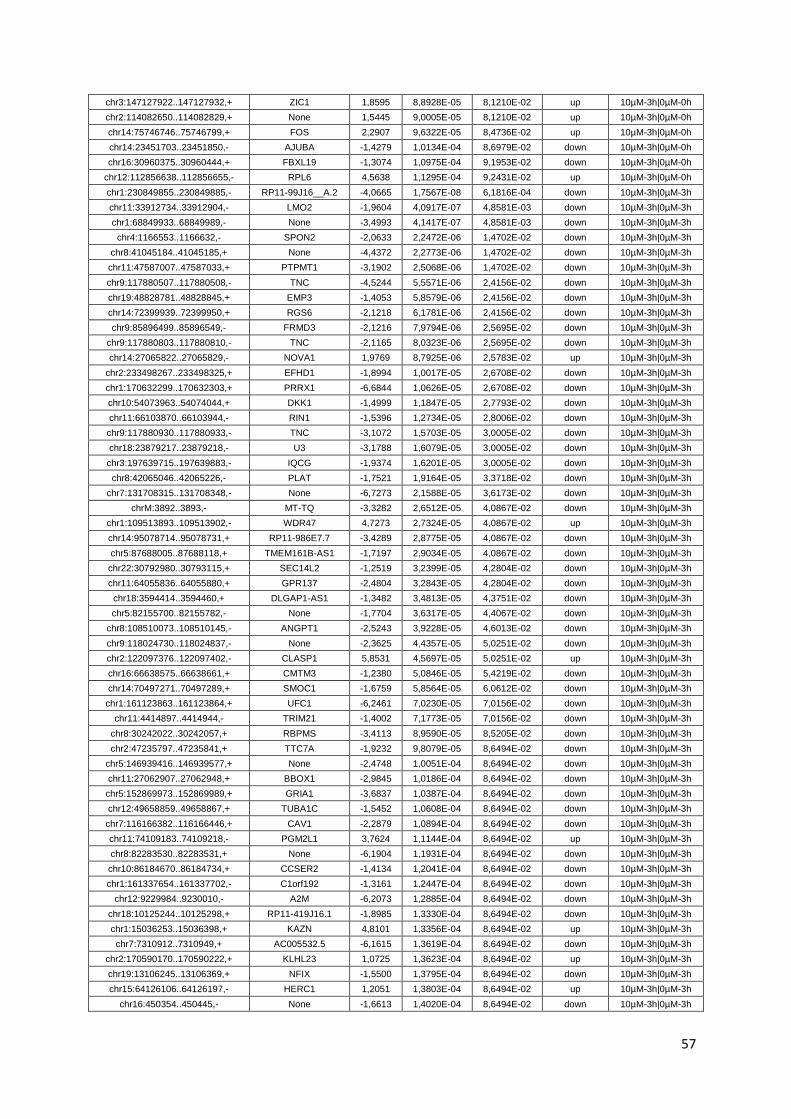
57
chr3:147127922..147127932,+ ZIC1 1,8595 8,8928E-05 8,1210E-02 up 10µM-3h|0µM-0h
chr2:114082650..114082829,+ None 1,5445 9,0005E-05 8,1210E-02 up 10µM-3h|0µM-0h
chr14:75746746..75746799,+ FOS 2,2907 9,6322E-05 8,4736E-02 up 10µM-3h|0µM-0h
chr14:23451703..23451850,- AJUBA -1,4279 1,0134E-04 8,6979E-02 down 10µM-3h|0µM-0h
chr16:30960375..30960444,+ FBXL19 -1,3074 1,0975E-04 9,1953E-02 down 10µM-3h|0µM-0h
chr12:112856638..112856655,- RPL6 4,5638 1,1295E-04 9,2431E-02 up 10µM-3h|0µM-0h
chr1:230849855..230849885,- RP11-99J16__A.2 -4,0665 1,7567E-08 6,1816E-04 down 10µM-3h|0µM-3h
chr11:33912734..33912904,- LMO2 -1,9604 4,0917E-07 4,8581E-03 down 10µM-3h|0µM-3h
chr1:68849933..68849989,- None -3,4993 4,1417E-07 4,8581E-03 down 10µM-3h|0µM-3h
chr4:1166553..1166632,- SPON2 -2,0633 2,2472E-06 1,4702E-02 down 10µM-3h|0µM-3h
chr8:41045184..41045185,+ None -4,4372 2,2773E-06 1,4702E-02 down 10µM-3h|0µM-3h
chr11:47587007..47587033,+ PTPMT1 -3,1902 2,5068E-06 1,4702E-02 down 10µM-3h|0µM-3h
chr9:117880507..117880508,- TNC -4,5244 5,5571E-06 2,4156E-02 down 10µM-3h|0µM-3h
chr19:48828781..48828845,+ EMP3 -1,4053 5,8579E-06 2,4156E-02 down 10µM-3h|0µM-3h
chr14:72399939..72399950,+ RGS6 -2,1218 6,1781E-06 2,4156E-02 down 10µM-3h|0µM-3h
chr9:85896499..85896549,- FRMD3 -2,1216 7,9794E-06 2,5695E-02 down 10µM-3h|0µM-3h
chr9:117880803..117880810,- TNC -2,1165 8,0323E-06 2,5695E-02 down 10µM-3h|0µM-3h
chr14:27065822..27065829,- NOVA1 1,9769 8,7925E-06 2,5783E-02 up 10µM-3h|0µM-3h
chr2:233498267..233498325,+ EFHD1 -1,8994 1,0017E-05 2,6708E-02 down 10µM-3h|0µM-3h
chr1:170632299..170632303,+ PRRX1 -6,6844 1,0626E-05 2,6708E-02 down 10µM-3h|0µM-3h
chr10:54073963..54074044,+ DKK1 -1,4999 1,1847E-05 2,7793E-02 down 10µM-3h|0µM-3h
chr11:66103870..66103944,- RIN1 -1,5396 1,2734E-05 2,8006E-02 down 10µM-3h|0µM-3h
chr9:117880930..117880933,- TNC -3,1072 1,5703E-05 3,0005E-02 down 10µM-3h|0µM-3h
chr18:23879217..23879218,- U3 -3,1788 1,6079E-05 3,0005E-02 down 10µM-3h|0µM-3h
chr3:197639715..197639883,- IQCG -1,9374 1,6201E-05 3,0005E-02 down 10µM-3h|0µM-3h
chr8:42065046..42065226,- PLAT -1,7521 1,9164E-05 3,3718E-02 down 10µM-3h|0µM-3h
chr7:131708315..131708348,- None -6,7273 2,1588E-05 3,6173E-02 down 10µM-3h|0µM-3h
chrM:3892..3893,- MT-TQ -3,3282 2,6512E-05 4,0867E-02 down 10µM-3h|0µM-3h
chr1:109513893..109513902,- WDR47 4,7273 2,7324E-05 4,0867E-02 up 10µM-3h|0µM-3h
chr14:95078714..95078731,+ RP11-986E7.7 -3,4289 2,8775E-05 4,0867E-02 down 10µM-3h|0µM-3h
chr5:87688005..87688118,+ TMEM161B-AS1 -1,7197 2,9034E-05 4,0867E-02 down 10µM-3h|0µM-3h
chr22:30792980..30793115,+ SEC14L2 -1,2519 3,2399E-05 4,2804E-02 down 10µM-3h|0µM-3h
chr11:64055836..64055880,+ GPR137 -2,4804 3,2843E-05 4,2804E-02 down 10µM-3h|0µM-3h
chr18:3594414..3594460,+ DLGAP1-AS1 -1,3482 3,4813E-05 4,3751E-02 down 10µM-3h|0µM-3h
chr5:82155700..82155782,- None -1,7704 3,6317E-05 4,4067E-02 down 10µM-3h|0µM-3h
chr8:108510073..108510145,- ANGPT1 -2,5243 3,9228E-05 4,6013E-02 down 10µM-3h|0µM-3h
chr9:118024730..118024837,- None -2,3625 4,4357E-05 5,0251E-02 down 10µM-3h|0µM-3h
chr2:122097376..122097402,- CLASP1 5,8531 4,5697E-05 5,0251E-02 up 10µM-3h|0µM-3h
chr16:66638575..66638661,+ CMTM3 -1,2380 5,0846E-05 5,4219E-02 down 10µM-3h|0µM-3h
chr14:70497271..70497289,+ SMOC1 -1,6759 5,8564E-05 6,0612E-02 down 10µM-3h|0µM-3h
chr1:161123863..161123864,+ UFC1 -6,2461 7,0230E-05 7,0156E-02 down 10µM-3h|0µM-3h
chr11:4414897..4414944,- TRIM21 -1,4002 7,1773E-05 7,0156E-02 down 10µM-3h|0µM-3h
chr8:30242022..30242057,+ RBPMS -3,4113 8,9590E-05 8,5205E-02 down 10µM-3h|0µM-3h
chr2:47235797..47235841,+ TTC7A -1,9232 9,8079E-05 8,6494E-02 down 10µM-3h|0µM-3h
chr5:146939416..146939577,+ None -2,4748 1,0051E-04 8,6494E-02 down 10µM-3h|0µM-3h
chr11:27062907..27062948,+ BBOX1 -2,9845 1,0186E-04 8,6494E-02 down 10µM-3h|0µM-3h
chr5:152869973..152869989,+ GRIA1 -3,6837 1,0387E-04 8,6494E-02 down 10µM-3h|0µM-3h
chr12:49658859..49658867,+ TUBA1C -1,5452 1,0608E-04 8,6494E-02 down 10µM-3h|0µM-3h
chr7:116166382..116166446,+ CAV1 -2,2879 1,0894E-04 8,6494E-02 down 10µM-3h|0µM-3h
chr11:74109183..74109218,- PGM2L1 3,7624 1,1144E-04 8,6494E-02 up 10µM-3h|0µM-3h
chr8:82283530..82283531,+ None -6,1904 1,1931E-04 8,6494E-02 down 10µM-3h|0µM-3h
chr10:86184670..86184734,+ CCSER2 -1,4134 1,2041E-04 8,6494E-02 down 10µM-3h|0µM-3h
chr1:161337654..161337702,- C1orf192 -1,3161 1,2447E-04 8,6494E-02 down 10µM-3h|0µM-3h
chr12:9229984..9230010,- A2M -6,2073 1,2885E-04 8,6494E-02 down 10µM-3h|0µM-3h
chr18:10125244..10125298,+ RP11-419J16.1 -1,8985 1,3330E-04 8,6494E-02 down 10µM-3h|0µM-3h
chr1:15036253..15036398,+ KAZN 4,8101 1,3356E-04 8,6494E-02 up 10µM-3h|0µM-3h
chr7:7310912..7310949,+ AC005532.5 -6,1615 1,3619E-04 8,6494E-02 down 10µM-3h|0µM-3h
chr2:170590170..170590222,+ KLHL23 1,0725 1,3623E-04 8,6494E-02 up 10µM-3h|0µM-3h
chr19:13106245..13106369,+ NFIX -1,5500 1,3795E-04 8,6494E-02 down 10µM-3h|0µM-3h
chr15:64126106..64126197,- HERC1 1,2051 1,3803E-04 8,6494E-02 up 10µM-3h|0µM-3h
chr16:450354..450445,- None -1,6613 1,4020E-04 8,6494E-02 down 10µM-3h|0µM-3h

58
chr17:10741371..10741417,- PIRT -1,9591 1,4108E-04 8,6494E-02 down 10µM-3h|0µM-3h
chr14:79745720..79745742,+ NRXN3 1,0336 1,4288E-04 8,6494E-02 up 10µM-3h|0µM-3h
chr7:136912578..136912580,- PTN -6,4394 1,4469E-04 8,6494E-02 down 10µM-3h|0µM-3h
chr2:105320104..105320236,+ AC068057.1 -1,2294 1,4502E-04 8,6494E-02 down 10µM-3h|0µM-3h
chr16:4750968..4750969,- ANKS3 2,2835 1,5532E-04 8,8523E-02 up 10µM-3h|0µM-3h
chr4:80994234..80994278,- ANTXR2 -1,9472 1,5945E-04 8,8523E-02 down 10µM-3h|0µM-3h
chr7:148725499..148725502,- PDIA4 -2,4839 1,5988E-04 8,8523E-02 down 10µM-3h|0µM-3h
chr19:47793142..47793248,+ C5AR1 -1,4045 1,6009E-04 8,8523E-02 down 10µM-3h|0µM-3h
chr19:46010674..46010790,+ VASP -1,0513 1,6318E-04 8,8523E-02 down 10µM-3h|0µM-3h
chr1:155100330..155100396,+ EFNA1 -1,4233 1,6352E-04 8,8523E-02 down 10µM-3h|0µM-3h
chr5:111964555..111964559,+ RP11-159K7.2 -4,0908 1,7394E-04 9,1002E-02 down 10µM-3h|0µM-3h
chr12:13349608..13349739,+ EMP1 -1,3435 1,7664E-04 9,1002E-02 down 10µM-3h|0µM-3h
chr15:63449622..63449707,- RPS27L -1,4708 1,8183E-04 9,1002E-02 down 10µM-3h|0µM-3h
chr19:18451419..18451456,+ PGPEP1 -1,3736 1,8506E-04 9,1002E-02 down 10µM-3h|0µM-3h
chr17:19619854..19619980,- SLC47A2 -2,1986 1,8545E-04 9,1002E-02 down 10µM-3h|0µM-3h
chr4:79892775..79892785,+ LINC01088 -4,5435 1,8565E-04 9,1002E-02 down 10µM-3h|0µM-3h
chr10:25304893..25305088,- ENKUR -1,1457 1,8691E-04 9,1002E-02 down 10µM-3h|0µM-3h
chr13:24144696..24144703,+ TNFRSF19 -2,2391 1,8879E-04 9,1002E-02 down 10µM-3h|0µM-3h
chr15:52312119..52312185,+ MAPK6 -1,6125 1,9881E-04 9,4542E-02 down 10µM-3h|0µM-3h
chr7:100464965..100465052,+ TRIP6 -1,2471 2,1041E-04 9,6418E-02 down 10µM-3h|0µM-3h
chr20:46414830..46414841,- SULF2 1,2280 2,1218E-04 9,6418E-02 up 10µM-3h|0µM-3h
chr1:150230218..150230301,+ CA14 -1,3272 2,1369E-04 9,6418E-02 down 10µM-3h|0µM-3h
chr6:34544362..34544543,- None -1,4623 2,1597E-04 9,6418E-02 down 10µM-3h|0µM-3h
chr7:75909940..75909961,+ SRRM3 -5,9999 2,1646E-04 9,6418E-02 down 10µM-3h|0µM-3h
chr5:146268009..146268057,- PPP2R2B -3,4618 2,2184E-04 9,7156E-02 down 10µM-3h|0µM-3h
chr12:41221614..41221806,+ CNTN1 1,3413 2,2364E-04 9,7156E-02 up 10µM-3h|0µM-3h
chr8:125384631..125384642,- TMEM65 -1,3604 2,3021E-04 9,8792E-02 down 10µM-3h|0µM-3h
chr1:1293908..1293956,- MXRA8 -1,3579 2,3561E-04 9,9620E-02 down 10µM-3h|0µM-3h
chr6:90122426..90122440,- RRAGD -3,9477 2,3780E-04 9,9620E-02 down 10µM-3h|0µM-3h
chr13:102069583..102069593,- None 4,0685 3,6670E-07 1,2904E-02 up 10µM-9h|0µM-0h
chr5:137801166..137801178,+ EGR1 4,0958 1,0159E-15 3,5750E-11 up 3µM-1h|0µM-0h
chr14:75746746..75746799,+ FOS 4,4311 1,3494E-14 2,3741E-10 up 3µM-1h|0µM-0h
chr12:52445226..52445232,+ NR4A1 4,8888 5,0204E-14 5,8888E-10 up 3µM-1h|0µM-0h
chr6:166401410..166401570,- LINC00473 2,9034 5,3483E-13 4,7050E-09 up 3µM-1h|0µM-0h
chr19:45971254..45971258,+ FOSB 5,0858 2,5220E-12 1,7749E-08 up 3µM-1h|0µM-0h
chr5:137801721..137801731,+ EGR1 6,6197 3,2280E-10 1,8932E-06 up 3µM-1h|0µM-0h
chr13:102069583..102069593,- None 4,4683 5,2749E-09 2,6517E-05 up 3µM-1h|0µM-0h
chr10:64576110..64576126,- EGR2 5,7988 4,7686E-08 2,0975E-04 up 3µM-1h|0µM-0h
chr5:137802527..137802551,- None 4,0234 2,2033E-07 8,4842E-04 up 3µM-1h|0µM-0h
chr14:75746345..75746363,+ FOS 1,7686 2,4110E-07 8,4842E-04 up 3µM-1h|0µM-0h
chr19:13263829..13263909,+ IER2 1,4664 3,4622E-07 1,1076E-03 up 3µM-1h|0µM-0h
chr11:66188506..66188510,+ NPAS4 4,7509 7,0775E-07 2,0754E-03 up 3µM-1h|0µM-0h
chr12:89746177..89746295,- DUSP6 1,2617 2,3240E-06 6,2906E-03 up 3µM-1h|0µM-0h
chr12:50158014..50158030,+ TMBIM6 4,5982 2,6975E-06 6,7802E-03 up 3µM-1h|0µM-0h
chr1:96912447..96912464,+ None -2,7486 9,5239E-06 2,2342E-02 down 3µM-1h|0µM-0h
chr4:2060965..2061039,+ NAT8L -1,8570 1,8601E-05 3,9375E-02 down 3µM-1h|0µM-0h
chr14:75747308..75747348,+ FOS 3,8262 1,9200E-05 3,9375E-02 up 3µM-1h|0µM-0h
chr8:22550990..22550992,- EGR3 4,7094 2,0141E-05 3,9375E-02 up 3µM-1h|0µM-0h
chr14:75745511..75745535,+ FOS 3,7600 2,2954E-05 4,2511E-02 up 3µM-1h|0µM-0h
chr12:49579459..49579461,- TUBA1A -3,9475 2,9478E-05 5,1859E-02 down 3µM-1h|0µM-0h
chr2:74687384..74687397,+ WBP1 -4,1459 3,2116E-05 5,1859E-02 down 3µM-1h|0µM-0h
chr11:32914355..32914371,+ QSER1 -1,5085 3,3306E-05 5,1859E-02 down 3µM-1h|0µM-0h
chr17:38506986..38507003,+ RARA 4,8353 3,3896E-05 5,1859E-02 up 3µM-1h|0µM-0h
chr1:85824476..85824535,- DDAH1 -2,4028 4,2077E-05 6,1694E-02 down 3µM-1h|0µM-0h
chr7:142375408..142375410,+ MTRNR2L6 -3,0240 5,4115E-05 7,6170E-02 down 3µM-1h|0µM-0h
chr20:36147678..36147711,- BLCAP -2,0764 6,8573E-05 9,2808E-02 down 3µM-1h|0µM-0h
chr18:5295692..5295716,- ZBTB14 6,4952 1,8309E-07 6,4427E-03 up 3µM-1h|0µM-1h
chr19:54041677..54041684,+ ZNF331 6,1251 7,3718E-12 2,5941E-07 up 3µM-3h|0µM-0h
chr19:45971254..45971258,+ FOSB 4,6676 9,2887E-10 1,6343E-05 up 3µM-3h|0µM-0h
chr6:166401410..166401570,- LINC00473 2,5737 3,1558E-09 3,7017E-05 up 3µM-3h|0µM-0h
chr20:50179375..50179416,- NFATC2 4,4732 1,5477E-08 1,3616E-04 up 3µM-3h|0µM-0h

59
chr17:7747519..7747522,+ KDM6B 3,3496 1,1822E-07 8,3201E-04 up 3µM-3h|0µM-0h
chr12:52445226..52445232,+ NR4A1 3,7482 1,6757E-07 9,8277E-04 up 3µM-3h|0µM-0h
chr3:147127922..147127932,+ ZIC1 2,3751 1,3811E-06 6,9428E-03 up 3µM-3h|0µM-0h
chr5:137801721..137801731,+ EGR1 5,3225 2,0176E-06 8,8746E-03 up 3µM-3h|0µM-0h
chr1:90287518..90287585,+ LRRC8D 2,2585 3,0132E-06 1,1781E-02 up 3µM-3h|0µM-0h
chr13:80912984..80913112,- SPRY2 1,4926 6,7983E-06 2,3922E-02 up 3µM-3h|0µM-0h
chr19:1203161..1203164,+ STK11 6,3377 1,4147E-05 4,1967E-02 up 3µM-3h|0µM-0h
chr13:102069583..102069593,- None 3,6817 1,4745E-05 4,1967E-02 up 3µM-3h|0µM-0h
chr10:112257625..112257665,+ DUSP5 2,1480 1,5504E-05 4,1967E-02 up 3µM-3h|0µM-0h
chr12:13349608..13349739,+ EMP1 1,6500 4,2195E-06 9,9027E-02 up 3µM-9h|0µM-0h
chr6:166401410..166401570,- LINC00473 1,9023 5,6283E-06 9,9027E-02 up 3µM-9h|0µM-0h
Supplementary Figure S1 – B cell receptor signaling pathway. Genes involved in response to
caffeine are highlighted in green, if up-regulated, or red, if down-regulated.
Supplementary Figure S2 – Toll-like receptor signaling pathway. Genes involved in response to
caffeine are highlighted in green, if up-regulated, or red, if down-regulated.

60
Supplementary Figure S3 – T cell receptor signaling pathway. Genes involved in response to
caffeine are highlighted in green, if up-regulated, or red, if down-regulated.
Supplementary Figure S4 – Complement and coagulation cascades pathway. Genes involved in
response to caffeine are highlighted in green, if up-regulated, or red, if down-regulated.

61
Supplementary Figure S5 – Cell adhesion molecules pathway. Genes involved in response to
caffeine are highlighted in green, if up-regulated, or red, if down-regulated.
Supplementary Figure S6 – Axon guidance pathway. Genes involved in response to caffeine are
highlighted in green, if up-regulated, or red, if down-regulated.

62
Supplementary Figure S7 – Neuroactive ligand-receptor interaction pathway. Genes involved in
response to caffeine are highlighted in green, if up-regulated, or red, if down-regulated.
Supplementary Table 2 – Biological processes perturbed by treatment with 10 µM of
caffeine. Gene ontology (GO) analysis results performed in order to understand in which biological
processes the caffeine response mediator genes are involved with corresponding statistical information and
list of genes related to each process.
ID Name P-value FDRNumber of genes
in GO termGenes in GO term
GO:0022008 neurogenesis 1,05E-05 1,54E-02 20SOX2, PRRX1, RARA, TNC, MXRA8, CAV1,
PTN, EFNA1, EFNA4, NRXN3, RGS6, DKK1, EFHD1
GO:0030182 neuron differentiation 1,72E-05 1,54E-02 18SOX2, PRRX1, RARA, TNC, CAV1, PTN,
EFNA1, EFNA4, NRXN3, RGS6, DKK1, EFHD1, NFIX
GO:0050803 regulation of synapse structure or activity 1,99E-05 1,54E-02 8VGF, RARA, GRIA1, PTN, RIN1, NRXN3,
DKK1, AGT
GO:0031099 regeneration 2,38E-05 1,54E-02 7 SOX2, PRRX1, TNC, CAV1, SULF2, C5AR1
GO:0023056 positive regulation of signaling 5,00E-05 1,93E-02 19SOX2, CMTM3, PRRX1, RBPMS, RARA, ANGPT1,
TRIP6, SOCS3, GRIA1, CAV1, PTN, EFNA1, SULF2
GO:1903598 positive regulation of gap junction assembly 5,32E-05 1,93E-02 2 CAV1, AGT
GO:0048699 generation of neurons 5,60E-05 1,93E-02 18SOX2, PRRX1, RARA, TNC, CAV1, PTN,
EFNA1, EFNA4, NRXN3, RGS6, DKK1, EFHD1, NFIX
GO:0010647 positive regulation of cell communication 5,98E-05 1,93E-02 19SOX2, CMTM3, PRRX1, RBPMS, RARA, ANGPT1,
TRIP6, SOCS3, GRIA1, CAV1, PTN, EFNA1, SULF2
GO:0048167 regulation of synaptic plasticity 8,21E-05 2,36E-02 6 VGF, RARA, GRIA1, PTN, RIN1, AGT
GO:1903596 regulation of gap junction assembly 1,06E-04 2,59E-02 2 CAV1, AGT
GO:0001944 vasculature development 1,29E-04 2,59E-02 11PRRX1, ANGTP1, SOCS3, CAV1, PTN, EFNA1,
NRXN3, AP2B1, AGT, EPC1, C5AR1
GO:0072359 circulatory system development 1,30E-04 2,59E-02 14PRRX1, RARA, ANGTP1, SOCS3, CAV1, PTN,
EFNA1, NRXN3, DKK1, AP2B1, AGT, EPC1, TMEM65
GO:0072358 cardiovascular system development 1,30E-04 2,59E-02 14PRRX1, RARA, ANGTP1, SOCS3, CAV1, PTN,
EFNA1, NRXN3, DKK1, AP2B1, AGT, EPC1, TMEM65
GO:0030030 cell projection organization 2,68E-04 4,93E-02 16PRRX1, TNC, CAV1, PTN, EFNA1, EFNA4,
NRXN3, EFHD1, SPON2, EMP1, MAPK6, HERC1, EMP3

63
ID Name p-value FDRNumber of genes
in GO termGenes in GO term
GO:0071277 cellular response to calcium ion 6,08E-04 2,60E-02 2 FOS, FOSB
GO:0009719 response to endogenous stimulus 6,35E-04 2,60E-02 6 TMBIM6, EGR2, EGR3, FOS, FOSB, NPAS4
GO:0021660 rhombomere 3 formation 6,99E-04 2,60E-02 1 EGR2
GO:0021594 rhombomere formation 6,99E-04 2,60E-02 1 EGR2
GO:0099537 trans-synaptic signaling 9,57E-04 2,97E-02 4 EGR2, EGR3, NAT8L, NPAS4
GO:0007268 chemical synaptic transmission 9,57E-04 2,97E-02 4 EGR2, EGR3, NAT8L, NPAS4
GO:0098916 anterograde trans-synaptic signaling 9,57E-04 2,97E-02 4 EGR2, EGR3, NAT8L, NPAS4
GO:0099536 synaptic signaling 1,01E-03 2,97E-02 4 EGR2, EGR3, NAT8L, NPAS4
GO:0007422 peripheral nervous system development 1,38E-03 2,97E-02 2 EGR2, EGR3
GO:0071386 cellular response to corticosterone stimulus 1,40E-03 2,97E-02 1 NPAS4
GO:0035283 central nervous system segmentation 2,09E-03 3,37E-02 1 EGR2
GO:0035284 brain segmentation 2,09E-03 3,37E-02 1 EGR2
GO:0051025 negative regulation of immunoglobulin secretion 2,09E-03 3,37E-02 1 TMBIM6
GO:0097305 response to alcohol 2,36E-03 3,53E-02 3 FOS, FOSB, NPAS4
GO:0010243 response to organonitrogen compound 2,37E-03 3,53E-02 4 TMBIM6, EGR2, FOS, FOSB
GO:0051591 response to cAMP 2,54E-03 3,53E-02 2 FOS, FOSB
GO:0051586 positive regulation of dopamine uptake involved in synaptic transmission 2,79E-03 3,53E-02 1 NAT8L
GO:1903297 regulation of hypoxia-induced intrinsic apoptotic signaling pathway 2,79E-03 3,53E-02 1 TMBIM6
GO:0051592 response to calcium ion 3,37E-03 4,07E-02 2 FOS, FOSB
GO:1901700 response to oxygen-containing compound 3,46E-03 4,07E-02 5 TMBIM6, EGR2, FOS, FOSB, NPAS4
GO:1990144 intrinsic apoptotic signaling pathway in response to hypoxia 4,18E-03 4,52E-02 1 TMBIM6
GO:0001661 conditioned taste aversion 4,18E-03 4,52E-02 1 FOS
Supplementary Table 3 – Biological processes perturbed by treatment with 3 µM of caffeine.
Gene ontology (GO) analysis results performed in order to understand in which biological processes the
caffeine response mediator genes are involved with corresponding statistical information and list of genes
related to each process.