Embed Size (px)
Citation preview

FINANCIAL SECTIO
N
The Financial Section of the Comprehensive Annual Financial Reportcontains the following:
• Independent Auditors’ Report
• Required Supplementary Information-Management’s Discussion and Analysis (MD & A)
• City’s basic financial statement, which includes the following:- The Government-wide Financial Statements- Fund Financial Statements- Notes to the Basic Financial Statements
Financial Section
1
INDEPENDENT AUDITORS' REPORT To the Honorable Mayor and Members of City Council of the City of Glendale City of Glendale, California Report on the Financial Statements We have audited the accompanying financial statements of the governmental activities, the business-type activities, each major fund, and the aggregate remaining fund information of the City of Glendale, California, (the City) as of and for the year ended June 30, 2016, and the related notes to the financial statements, which collectively comprise the City’s basic financial statements as listed in the table of contents. Management's Responsibility for the Financial Statements Management is responsible for the preparation and fair presentation of these financial statements in accordance with accounting principles generally accepted in the United States of America; this includes the design, implementation, and maintenance of internal control relevant to the preparation and fair presentation of financial statements that are free from material misstatement, whether due to fraud or error. Auditors' Responsibility Our responsibility is to express opinions on these financial statements based on our audit. We conducted our audit in accordance with auditing standards generally accepted in the United States of America and the standards applicable to financial audits contained in Government Auditing Standards, issued by the Comptroller General of the United States. Those standards require that we plan and perform the audit to obtain reasonable assurance about whether the financial statements are free from material misstatement. An audit involves performing procedures to obtain audit evidence about the amounts and disclosures in the financial statements. The procedures selected depend on the auditor’s judgment, including the assessment of the risks of material misstatement of the financial statements, whether due to fraud or error. In making those risk assessments, the auditor considers internal control relevant to the entity’s preparation and fair presentation of the financial statements in order to design audit procedures that are appropriate in the circumstances, but not for the purpose of expressing an opinion on the effectiveness of the entity’s internal control. Accordingly, we express no such opinion. An audit also includes evaluating the appropriateness of accounting policies used and the reasonableness of significant accounting estimates made by management, as well as evaluating the overall presentation of the financial statements. We believe that the audit evidence we have obtained is sufficient and appropriate to provide a basis for our audit opinions.

2
Opinions In our opinion, the financial statements referred to above present fairly, in all material respects, the respective financial position of the governmental activities, the business-type activities, each major fund, and the aggregate remaining fund information of the City, as of June 30, 2016, and the respective changes in financial position, and, where applicable, cash flows thereof, and the respective budgetary comparison for the General Fund and the Housing Assistance Special Revenue Fund for the year then ended in accordance with accounting principles generally accepted in the United States of America. Emphasis of Matter As discussed in Note 19 to the financial statements, the City implemented Governmental Accounting Standards Board (GASB) Statements No. 72, Fair Value Measurement and Application, and No. 82, Pension Issues – an Amendment of GASB Statement No. 67, No. 68, and No. 73, effective July 1, 2015. Our opinion is not modified with respect to this matter. Other Matters Required Supplementary Information
Accounting principles generally accepted in the United States of America require that the management’s discussion and analysis, the Schedule of Funding Progress, the Schedule of Changes in the Net Pension Liability and Related Ratios, and the Schedule of Contributions, as listed in the table of contents, be presented to supplement the basic financial statements. Such information, although not a part of the basic financial statements, is required by the Governmental Accounting Standards Board, who considers it to be an essential part of financial reporting for placing the basic financial statements in an appropriate operational, economic, or historical context. We have applied certain limited procedures to the required supplementary information in accordance with auditing standards generally accepted in the United States of America, which consisted of inquiries of management about the methods of preparing the information and comparing the information for consistency with management’s responses to our inquiries, the basic financial statements, and other knowledge we obtained during our audit of the basic financial statements. We do not express an opinion or provide any assurance on the information because the limited procedures do not provide us with sufficient evidence to express an opinion or provide any assurance. Other Information
Our audit was conducted for the purpose of forming opinions on the financial statements that collectively comprise the City’s basic financial statements. The introductory section, combining and individual nonmajor fund financial statements and other schedules, and statistical sections, are presented for purposes of additional analysis and are not a required part of the basic financial statements. The combining and individual nonmajor fund financial statements and other schedules are the responsibility of management and were derived from and relate directly to the underlying accounting and other records used to prepare the basic financial statements. Such information has been subjected to the auditing procedures applied in the audit of the basic financial statements and certain additional procedures, including comparing and reconciling such information directly to the underlying accounting and other records used to prepare the basic financial statements or to the basic financial statements themselves, and other additional procedures in accordance with auditing standards generally accepted in the United States of America. In our opinion, the combining and individual nonmajor fund financial statements and other schedules are fairly stated, in all material respects, in relation to the basic financial statements as a whole. The introductory and statistical sections have not been subjected to the auditing procedures applied in the audit of the basic financial statements, and accordingly, we do not express an opinion or provide any assurance on them.

3
Other Reporting Required by Government Auditing Standards In accordance with Government Auditing Standards, we have also issued our report dated November 28, 2016, on our consideration of the City’s internal control over financial reporting and on our tests of its compliance with certain provisions of laws, regulations, contracts, and grant agreements and other matters. The purpose of that report is to describe the scope of our testing of internal control over financial reporting and compliance and the results of that testing, and not to provide an opinion on internal control over financial reporting or on compliance. That report is an integral part of an audit performed in accordance with Government Auditing Standards in considering City’s internal control over financial reporting and compliance. Rancho Cucamonga, California November 28, 2016

This page is left blank intentionally.
4

CITY OF GLENDALE Management’s Discussion and Analysis June 30, 2016 (in thousands) As management of the City of Glendale (the City), we offer readers of the City’s financial statements this narrative overview and analysis of the financial activities of the City for the fiscal year ended June 30, 2016. We encourage readers to consider the information presented here in conjunction with additional information that we have furnished in our letter of transmittal, which can be found on pages i – vii of this report. Financial Highlights
• The assets and deferred outflows of resources of the City exceeded its liabilities and deferred inflows of resources at the close of FY 2015-16 by $1,496,644 (net position), which was comprised of net investment in capital assets of $1,311,654, restricted net position of $115,950 and unrestricted net position of $69,040. The unrestricted net position consisted of a negative $153,423 for governmental activities and $222,463 for business-type activities. The negative unrestricted net position for governmental activities was primarily due to the recognition of net pension liability.
• The City’s total net position increased by $252,533. Most of this increase was attributable to
higher investment income, reinstatement of loans from Glendale Successor Agency to the City, transfer of capital assets from Glendale Successor Agency to the City, elimination of OPEB implied subsidy, and the extraordinary gain resulted from San Fernando Corridor project area tax increment funds transferring from Glendale Successor Agency to the City.
• As of the close of FY 2015-16, the City’s governmental funds reported combined ending fund
balances of $263,743, an increase of $63,487 in comparison with the prior year. About 17.7% of this total amount, $46,609 was unassigned and available for spending at the government’s discretion.
• At the end of FY 2015-16, charter required stabilization reserve of $24,870, and unassigned
fund balance of $55,954 for the General Fund totaled $80,824, representing about 42.1% of the final FY 2015-16 adopted budget of $191,825. The General Fund reserve levels have historically been maintained above 30.0% of General Fund appropriations, in accordance with the current reserve policy (a floor of 30.0% with a target of 35.0%) adopted by the City Council.
• The City's total debt and liabilities decreased by $89,861 (17.7%) in FY 2015-16. The factors of
this decrease were a combination of items such as a decrease of claims payable of $1,260; a decrease of post-employment benefits of $86,709; an increase of compensated absences of $1,166; and an increase of landfill postclosure care of $1,766; as well as decreases in outstanding bonds payable and other long-term liabilities through regular annual debt retirements and refunding of Electric revenue bonds, 2006 and 2008 series.
Overview of the Financial Statements This discussion and analysis are intended to serve as an introduction to the City’s basic financial statements. The City’s basic financial statements are comprised of three components: 1) government-wide financial statements, 2) fund financial statements, and 3) notes to the financial statements. This report also contains other supplementary information in addition to the basic financial statements.
5

CITY OF GLENDALE Management’s Discussion and Analysis June 30, 2016 (in thousands) Government-wide financial statements. The government-wide financial statements are designed to provide readers with a broad overview of the City’s finances, in a manner similar to a private-sector business. The statement of net position presents information on all of the City’s assets and deferred outflows of resources, and liabilities and deferred inflows of resources, with the difference reported as net position. Over time, increases or decreases in net position may serve as a useful indicator of whether the financial position of the City is improving or deteriorating. The statement of activities presents information showing how the government’s net position changed during the recent fiscal year. All changes in net position are reported as soon as the underlying event giving rise to the change occurs, regardless of the timing of related cash flows. Thus, revenues and expenses are reported in this statement for some items that will only result in cash flows in future fiscal periods (e.g., uncollected taxes and earned but unused vacation leave). Both of the government-wide financial statements distinguish functions of the City that are principally supported by taxes and intergovernmental revenues (governmental activities) from other functions that are intended to recover all or a significant portion of their costs through user fees and charges (business-type activities). The governmental activities of the City include general government, police, fire, public works, transportation, housing, health, and community development, employment programs, public service, parks, recreation, and community services, library, and interest and fiscal charges. The business-type activities of the City include fire communications, sewer, refuse disposal, electric, and water. The government-wide financial statements include not only the City itself (known as the primary government), but also a legally separate housing authority and financing authority for which the City is financially accountable. The housing authority and the financing authority, although legally separate, function for all practical purposes as departments of the City, and therefore have been included as an integral part of the primary government. The government-wide financial statements can be found on pages 23-25 of this report. Fund financial statements. A fund is a grouping of related accounts that is used to maintain control over resources that have been segregated for specific activities or objectives. The City, like other state and local governments, uses fund accounting to ensure and demonstrate compliance with finance-related legal requirements. All of the funds of the City can be divided into three categories: governmental funds, proprietary funds, and fiduciary funds. Governmental funds. Governmental funds are used to account for essentially the same functions reported as governmental activities in the government-wide financial statements. However, unlike the government-wide financial statement, governmental fund financial statements focus on near-term inflows and outflows of spendable resources, as well as on balances of spendable resources available at the end of the fiscal year. Such information may be useful in evaluating a government’s near-term financing requirements. Because the focus of governmental funds is narrower than that of the government-wide financial statements, it is useful to compare the information presented for governmental funds with similar information presented for governmental activities in the government-wide financial statements. By
6

CITY OF GLENDALE Management’s Discussion and Analysis June 30, 2016 (in thousands) doing so, readers may better understand the long-term impact of the government’s near-term financing decisions. Both the governmental fund balance sheet and the governmental fund statement of revenues, expenditures, and changes in fund balances provide a reconciliation to facilitate this comparison between governmental funds and governmental activities. The City maintains 45 individual governmental funds. Information is presented separately in the governmental fund balance sheet and in the governmental fund statement of revenues, expenditures, and changes in fund balances for General Fund, Housing Assistance Fund and the Capital Improvement Fund, all of which are considered to be major funds. Data from the other 42 governmental funds are combined into a single, aggregated presentation. Individual fund data for each of these non-major governmental funds is provided in the form of combining statements elsewhere in this report. The City adopts an annual budget for its General Fund, special revenue and debt service fund types. Budgetary comparison information has been provided for the above fund types to demonstrate compliance with the budget. The basic governmental fund financial statements can be found on pages 26-39 of this report. Proprietary funds. The City maintains two different types of proprietary funds. Enterprise funds are used to report the same functions presented as business-type activities in the government-wide financial statements. The City uses enterprise funds to account for its refuse disposal, fire communications, sewer, and electric and water utility operations. Internal service funds are an accounting device used to accumulate and allocate costs internally among the City’s various functions. The City uses internal service funds to account for its fleet of vehicles, information services and infrastructure, joint helicopter operation, uninsurable litigation, employee benefits, and various other insurances. Proprietary funds provide the same type of information as the government-wide financial statements, only in more detail. The proprietary fund financial statements provide separate information for the sewer, electric, and water operations, all of which are considered to be major funds of the City. Conversely, all internal service funds are combined into a single, aggregated presentation in the proprietary fund financial statements. Individual fund data for the non-major enterprise and internal service funds is provided in the form of combining statements elsewhere in this report. The basic proprietary fund financial statements can be found on pages 40-44 of this report. Fiduciary funds. A fiduciary fund is used to account for resources held for the benefit of parties outside the City. The City maintains one fiduciary fund – Glendale Successor Agency Trust Fund, a Private-Purpose Trust Fund. Since the resources of fiduciary fund are not available to support the City’s own programs, it is not reflected in the government-wide financial statements. The accounting used for fiduciary funds is much like that used for proprietary funds. The basic fiduciary fund financial statement can be found on pages 45-46 of this report.
7

CITY OF GLENDALE Management’s Discussion and Analysis June 30, 2016 (in thousands) Notes to the financial statements. The notes provide additional information that is essential to a full understanding of the data provided in the government-wide and fund financial statements. The notes to the financial statements can be found on pages 47-99 of this report. The combining statements referred to earlier in connection with nonmajor governmental and enterprise funds and internal service funds are presented immediately following the required supplementary information, which can be found on pages 101-105 of this report. Combining and individual fund statements and schedules can be found on pages 107-170 of this report. Government-wide Financial Analysis The government-wide financial analysis contains comparative information from the prior year. As noted earlier, net position may serve over time as a useful indicator of a government’s financial position. In the case of the City, assets and deferred outflows of resources exceeded liabilities and deferred inflows of resources by $1,496,644 at the close of the most recent fiscal year. By far the largest portion of the City’s net position (87.6%) reflected its net investment in capital assets (e.g., infrastructure, land, buildings, machinery, and equipment) less any related debt used to acquire those assets that was still outstanding. The City uses these capital assets to provide services to citizens; consequently, these assets are not available for future spending. Although the City’s net investment in its capital assets is reported as net of related debt, it should be noted that the resources needed to repay this debt must be provided from other sources, since the capital assets themselves cannot be used to liquidate these liabilities.
City of Glendale’s Net Position
As of June 30,
Governmental activities
Business-type
activities
Total 2016 2015 2016 2015 2016 2015
Current and other assets $ 480,436 361,186 364,184 326,366
844,620 687,552Capital assets 926,004 923,344 654,773 643,611 1,580,777 1,566,955Deferred outflows of resources 28,510 25,048 11,309 6,239 39,819 31,287
Total assets and deferred outflows of resources 1,434,950 1,309,578 1,030,266 976,216
2,465,216 2,285,794
Current liabilities 62,749 47,979 35,428 24,709
98,177 72,688Noncurrent liabilities 490,694 549,066 335,537 330,701 826,231 879,767Deferred inflows of resources 35,651 70,436 8,513 18,792 44,164 89,228
Total liabilities and deferred inflows of resources 589,094 667,481 379,478 374,202
968,572 1,041,683
Net investment in capital assets 888,998 882,741 422,656 437,125
1,311,654 1,319,866Restricted 110,281 74,413 5,669 5,669 115,950 80,082Unrestricted (153,423) (315,057) 222,463 159,220 69,040 (155,837)
Total net position $ 845,856 642,097 650,788 602,014
1,496,644 1,244,111
8

CITY OF GLENDALE Management’s Discussion and Analysis June 30, 2016 (in thousands) As noted above, 7.7% of the City’s net position represents resources that are subject to external restrictions on how they may be used. The remaining balance of unrestricted net position of $69,040 may be used to meet the government’s ongoing obligations to citizens and creditors. Of this total, $223,463 is in business-type activities such as electric, water, and sewer utilities. Governmental activities. Governmental activities increased the City’s net position by $203,759. Key elements of this increase are as follows:
• Charges for services increased by $13,441 (27.5%) during the current fiscal year mainly due to the reclassification of Recreation Fund, Hazardous Disposal Fund and Parking Fund from business-type activities to governmental activities.
• Investment income increased by $6,895 (441.7%) during the current fiscal year. The City
portfolio had a better performance in the current fiscal year primarily due to higher portfolio value and rate of return ended at 1.30%, up by 10 basis points compared to previous fiscal year. The City portfolio had a 12-month average rate of return of 1.24% compared to 1.08% in the previous fiscal year.
• General government expense decreased by $27,487 (57.5%) and the City’s net OPEB
obligation had a large decrease of $82,247 (100.0%) during the current fiscal year. Both decreases were due to the elimination of the OPEB implied subsidy. In October 2015, the City Council approved unblending medical insurance premium rates between active employees and retired employees effective June 1, 2016, and authorized low income cash subsidies for existing retired employees currently participating in the City’s retiree medical insurance plans who meet specific criteria. See Note 10 for more information.
• In FY 2015-16, Museum of Neon Art (MONA) building and Central Avenue improvements project
capital assets in the amount of $6,729 were transferred from Glendale Successor Agency to the City.
• An extraordinary gain of $26,490 (100.0%) was recorded during the current year for the transfer
of the San Fernando Corridor project area tax increment funds from Glendale Successor Agency to the City. The County of Los Angeles approved the transfer due to the dissolution of Glendale Redevelopment Agency pursuant to AB 1x 26.
• $28,029 (100.0%) was a reinstatement of the loans from Glendale Successor Agency to the
City. Department of Finance approved the loans as an enforceable obligation of Glendale Successor Agency to the City.
9

CITY OF GLENDALE Management’s Discussion and Analysis June 30, 2016 (in thousands) Expenses and Program Revenues – Governmental Activities
Revenues, Transfers, Special items, Extraordinary item, and Other increases by Source – Governmental Activities
10

CITY OF GLENDALE Management’s Discussion and Analysis June 30, 2016 (in thousands)
City of Glendale’s Change in Net Position For the Fiscal Year Ended June 30,
Governmental
activities
Business-type
activities
Total 2016 2015 2016 2015 2016 2015
Revenues: Program revenues:
Charges for services $ 62,371 48,930 306,996 318,216 369,367 367,146 Operating grants and contributions 56,398 55,415 54 120 56,452 55,535 Capital grants and contributions 8,083 6,969 305 2,306 8,388 9,275
General revenues: Taxes:
Property taxes 51,709 50,883 - - 51,709 50,883 Sales taxes 46,651 36,330 - - 46,651 36,330 Utility users tax 28,662 27,766 - - 28,662 27,766 Other taxes 20,378 17,305 - - 20,378 17,305
Investment income 8,456 1,561 4,899 1,915 13,355 3,476 Other 25,988 22,766 7,702 8,593 33,690 31,359
Reinstatement of loans 28,029 - - - 28,029 -
Total revenues 336,725 267,925
319,956 331,150
656,681 599,075 Expenses:
General government 20,335 47,822 - - 20,335 47,822 Police 72,274 74,596 - - 72,274 74,596 Fire 51,386 48,796 - - 51,386 48,796 Public works 31,925 26,558 - - 31,925 26,558 Transportation 14,367 15,222 - - 14,367 15,222 Housing, health and community development 39,860 42,472
- -
39,860 42,472
Employment program 5,265 5,557 - - 5,265 5,557 Public service 6,230 5,895 - - 6,230 5,895 Parks, recreation and community services 15,889 13,325 - - 15,889 13,325 Library 8,222 8,392 - - 8,222 8,392 Interest and fiscal charges 2,203 1,398 - - 2,203 1,398 Recreation - - - 2,584 - 2,584 Hazardous disposal - - - 1,511 - 1,511 Fire communications - - 3,149 2,965 3,149 2,965 Parking - - - 7,702 - 7,702 Refuse disposal - - 18,518 18,519 18,518 18,519 Sewer - - 15,327 17,421 15,327 17,421 Electric - - 172,647 187,864 172,647 187,864 Water - - 42,017 45,068 42,017 45,068
Total expenses 267,956 290,033
251,658 283,634
519,614 573,667 Excess (deficiency) before transfers, special items and extraordinary gain 68,769 (22,108)
68,298 47,516
137,067 25,408
Transfers 19,524 62,859 (19,524) (62,859) - - Special item: Transfer of capital assets 6,729 22,087 - - 6,729 22,087 Special item: Elimination of OPEB implied subsidy 82,247 -
- -
82,247 -
Extraordinary gain 26,490 - - - 26,490 -
Change in net position 203,759 62,838
48,774 (15,343)
252,533 47,495
Net position – Beginning of the year 642,097 579,259
602,014 617,357
1,244,111 1,196,616
Net position – End of the year $ 845,856 642,097
650,788 602,014
1,496,644 1,244,111
11

CITY OF GLENDALE Management’s Discussion and Analysis June 30, 2016 (in thousands) Business-type activities. Business-type activities net position increased by $48,774. Key elements of this increase are as follows:
• Charges for services decreased by $11,220 (3.5%) during the current fiscal year. In spite of higher electric and water retail sales, the decrease was mainly due to the reclassification of Recreation Fund, Hazardous Disposal Fund, and Parking Fund to special revenue funds.
• Operating and capital grants and contributions decreased by $2,067 (85.2%) during the current
fiscal year. The decrease was mainly due to completion of Prop 50 state grant for phase 3, chromium 6 demonstration projects and a one-time reimbursement of $1,279 from LADWP for the Bette Davis Water Project. As well as recycled water pipeline extension from the prior fiscal year, completion of grant from California Energy Commission for AMI Smart Grid project, and reclassification of Recreation Fund and Hazardous Disposal Fund grants to special revenue funds.
• Investment income increased by $2,984 (155.8%) during the current fiscal year. The City
portfolio had a better performance in the current fiscal year primarily due to higher portfolio value and rate of return ended at 1.30%, up by 10 basis points compared to previous fiscal year. The City portfolio had a 12-month average rate of return of 1.24% compared to 1.08% in the previous fiscal year.
• Other revenues decreased by $891(10.4%) during the current fiscal year. The decrease was
mainly due to a one-time write-off of unclaimed construction cash bond deposits and a refund from L.A. County Sanitation District due to billing error for Scholl Canyon Landfill maintenance charges in the Refuse Disposal Fund from the prior fiscal year, as well as an adjustment in Verdugo Fire Communication billing for capital maintenance for tri-cities. Also, the reclassification of Recreation Fund, Hazardous Disposal Fund, and Parking Fund to special revenue funds contributed to the decrease.
• Sewer expense decreased by $2,094 (12.0%) during the current fiscal year. The decrease was
mainly due to the completion and final payment of Glendale’s share of the capital improvement costs at Los Angeles-Glendale Water Reclamation Plant.
• Electric expenses decreased by $15,217 (8.1%) during the current fiscal year. The decrease
was a result of a reduction in purchased power activities and decreased participation in natural gas activities.
• Water expenses decreased by $3,051 (6.8%) during the current fiscal year. The decrease was
mainly due to reduction of purchased water volume supplied by Metropolitan Water District (MWD) as a result of the water conservation mandates.
• Other expenses decreased by $11,614 (34.9%) during the current fiscal year. The decrease
was primarily attributable to the reclassification of Recreation Fund, Hazardous Disposal Fund, and Parking Fund to special revenue funds.
12

CITY OF GLENDALE Management’s Discussion and Analysis June 30, 2016 (in thousands) Expenses and Program Revenues – Business-type Activities
Revenues by Source – Business-type Activities
13
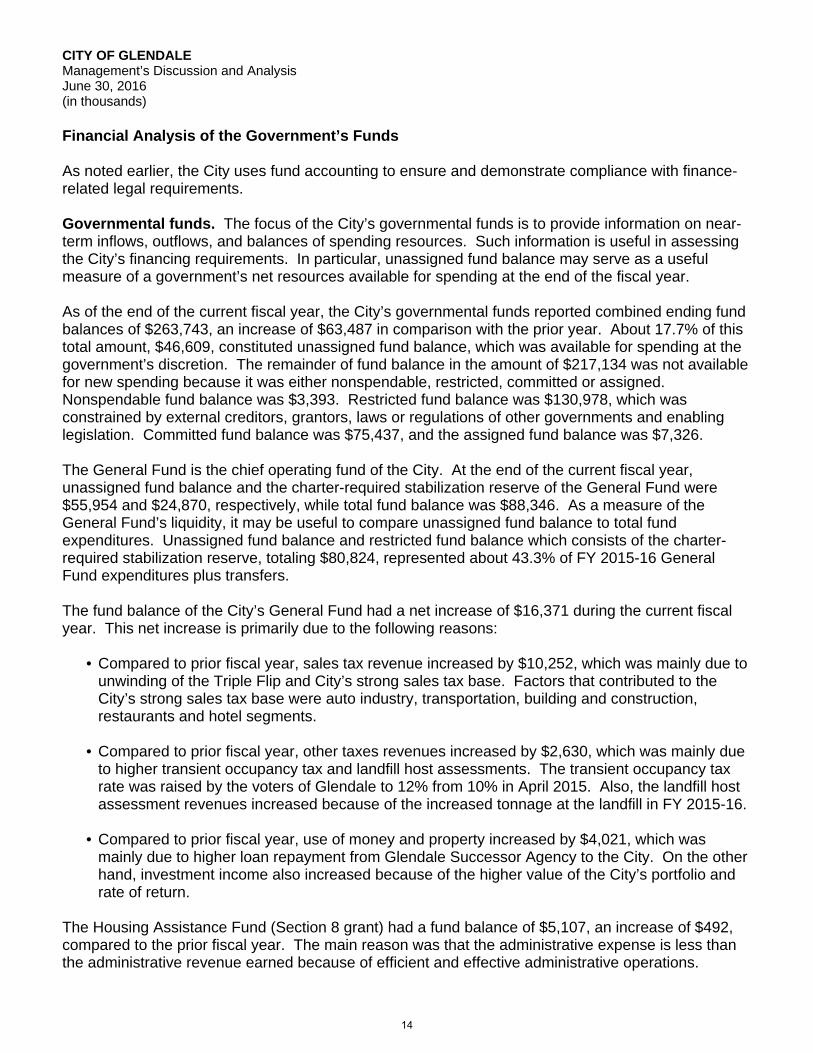
CITY OF GLENDALE Management’s Discussion and Analysis June 30, 2016 (in thousands) Financial Analysis of the Government’s Funds As noted earlier, the City uses fund accounting to ensure and demonstrate compliance with finance-related legal requirements. Governmental funds. The focus of the City’s governmental funds is to provide information on near-term inflows, outflows, and balances of spending resources. Such information is useful in assessing the City’s financing requirements. In particular, unassigned fund balance may serve as a useful measure of a government’s net resources available for spending at the end of the fiscal year. As of the end of the current fiscal year, the City’s governmental funds reported combined ending fund balances of $263,743, an increase of $63,487 in comparison with the prior year. About 17.7% of this total amount, $46,609, constituted unassigned fund balance, which was available for spending at the government’s discretion. The remainder of fund balance in the amount of $217,134 was not available for new spending because it was either nonspendable, restricted, committed or assigned. Nonspendable fund balance was $3,393. Restricted fund balance was $130,978, which was constrained by external creditors, grantors, laws or regulations of other governments and enabling legislation. Committed fund balance was $75,437, and the assigned fund balance was $7,326. The General Fund is the chief operating fund of the City. At the end of the current fiscal year, unassigned fund balance and the charter-required stabilization reserve of the General Fund were $55,954 and $24,870, respectively, while total fund balance was $88,346. As a measure of the General Fund’s liquidity, it may be useful to compare unassigned fund balance to total fund expenditures. Unassigned fund balance and restricted fund balance which consists of the charter-required stabilization reserve, totaling $80,824, represented about 43.3% of FY 2015-16 General Fund expenditures plus transfers. The fund balance of the City’s General Fund had a net increase of $16,371 during the current fiscal year. This net increase is primarily due to the following reasons:
• Compared to prior fiscal year, sales tax revenue increased by $10,252, which was mainly due to unwinding of the Triple Flip and City’s strong sales tax base. Factors that contributed to the City’s strong sales tax base were auto industry, transportation, building and construction, restaurants and hotel segments.
• Compared to prior fiscal year, other taxes revenues increased by $2,630, which was mainly due
to higher transient occupancy tax and landfill host assessments. The transient occupancy tax rate was raised by the voters of Glendale to 12% from 10% in April 2015. Also, the landfill host assessment revenues increased because of the increased tonnage at the landfill in FY 2015-16.
• Compared to prior fiscal year, use of money and property increased by $4,021, which was mainly due to higher loan repayment from Glendale Successor Agency to the City. On the other hand, investment income also increased because of the higher value of the City’s portfolio and rate of return.
The Housing Assistance Fund (Section 8 grant) had a fund balance of $5,107, an increase of $492, compared to the prior fiscal year. The main reason was that the administrative expense is less than the administrative revenue earned because of efficient and effective administrative operations.
14

CITY OF GLENDALE Management’s Discussion and Analysis June 30, 2016 (in thousands) The Capital Improvement Fund had a fund balance of $11,295. In comparison with the prior fiscal year, the fund balance increased by $1,921. The main reason of the increase was from higher landfill royalty tipping fee, which was due to increased tonnage at the landfill in the current fiscal year. Proprietary funds. The City’s proprietary funds provide the same type of information found in the government-wide financial statements, but in more detail. At the end of the year, net position was composed of $213,650 for the Sewer Fund, $297,839 for the Electric Fund, $111,808 for the Water Fund, and $35,135 for the nonmajor enterprise funds. The net position of the Sewer Fund decreased by $107 during the current fiscal year. The decrease was mainly attributable to lower single-family residential water usage during the winter months due to water conservation and additional project expenses such as the Chevy Chase Sewer Diversion and Public Works Yard Recycled Water Main Project. The net position of the Electric Fund increased by $28,765 during the current fiscal year. The increase in net position was due to an increase in electric retail sales as the Electric Fund continued phase 3 of the electric rate increase of 5% in FY 2015-16 and decrease in operating expenses. The decrease in operating expenses was primarily attributable to lower production and transmission costs. The net position of the Water Fund increased by $12,148 during the current fiscal year. The increase in net position was due to an increase in water retail sales as the Water Fund’s drought surcharge was still in effect while the mandatory water measures were still in place in FY 2015-16. The decrease in operating expenses was due to lower production and customer related costs which also contributed to higher net position. The net position of nonmajor enterprise funds increased by $3,116 during the current fiscal year. The increase was primarily attributable to continued stable operations of Refuse Disposal Fund in providing residents refuse collection and disposal services, as well as Fire Communication Fund in providing residents of its member cities an emergency coordinated assistance services. General Fund Budgetary Highlights In comparison to the FY 2015-16 final General Fund revenue budget, the actual revenue received was over by $11,957. The increase in revenue was driven by ERAF in lieu of sales tax, transient occupancy tax and landfill host assessment. The unwinding down of the Triple Flip and City’s strong sales tax base increased ERAF in lieu of sales tax revenue by $6,922. The transient occupancy tax rate was raised by the voters of Glendale to 12% from 10% in April 2015. The rate change increased revenue by $1,076. The landfill host assessment revenue also increased by $1,034. The increased tonnage at the landfill in FY 2015-16 contributed to the increase in revenue. In comparison to the FY 2015-16 original General Fund expense budget, the final expense budget increased by $6,763. The increase was primarily due to the following: $4,233 for budget carryovers, $540 for Management Services Utility User’s Tax (UUT) election costs, $143 for Human Resources compensation alignment adjustments resulting from the recent salary survey conducted and $418 for Management Services Savings Incentive Program (SIP). The City utilizes a Savings Incentive Program designated to encourage departments to remain under their appropriated budgeted amounts. At the end of each fiscal year, the program gets activated.
15

CITY OF GLENDALE Management’s Discussion and Analysis June 30, 2016 (in thousands) Compared to the FY 2015-16 final General Fund expense budget, the actual expenditures was under spent by $5,175. The variance was mainly due to salary savings from vacant positions and the expenditures in contractual services coming in less than forecasted. Although much of the vacant positions have been eliminated in the General Fund, vacancies still exist across almost every department as a result of employee turnovers. Economic Development, Public Works and Library were also under spent in their maintenance and operation. The variance was primarily due to: $1,100 Laemmle project that is still under construction, $800 for Central Library’s radio frequency identification equipment, $586 for Public Works contractual services and $362 also for Library’s contractual services. The General Fund transfer was over spent by $1,816. $1,733 of the over spending was due to the refund to Water Fund based on the judgment of the General Fund transfer litigation, which was not budgeted. $83 of the over spending was from 20% City Agency loan transfer to Low and Moderate Income Housing Asset Fund, of which the actual loan repayment was more than anticipated. Capital Asset and Debt Administration Capital assets. The City’s investment in capital assets for its governmental and business-type activities as of June 30, 2016, amounts to $1,580,777 (net of $818,610 accumulated depreciation, $8,919 gas depletion and $43,319 amortization). This investment in capital assets includes land, natural gas reserve, buildings and improvements, machinery and equipment, infrastructure, and construction in progress. The total increase in the City’s investment in capital assets for the current fiscal year was 0.9%; this represents a 0.3% increase for governmental activities and a 1.7% increase for business-type activities. Major capital asset events during the current fiscal year included the following:
• In FY 2015-16, $6,729 of Museum of Neon Art (MONA) building and Central Avenue improvements project capital assets were transferred from Glendale Successor Agency to the City.
• The City received a grant to purchase 9 Beeline Buses in the amount of $4,900. The City also
capitalized $5,342 in street and traffic light infrastructure improvements and $2,053 in parks improvements in FY 2015-16.
• The capital and intangible assets of Sewer Fund increase by $15,966 in the current fiscal year.
The following projects contributed to the increase in the capital and intangible assets: Los Angeles-Glendale Water Reclamation Plant, Chevy Chase Sewer Diversion and Hyperion Wastewater System.
• At the end of the year, Electric Fund increased its construction in progress by $24,595. The
increase was due to capital improvement projects such as Grandview Substation renovation and upgrades to support the existing loads and the expected growth in the San Fernando corridor; and Unit No. 4 Boiler Water Wall Tubes Replacement at Grayson Power Plant. The decrease of $9,058 in machinery and equipment was primarily due to the retirement of transmission and distribution equipment.
16

CITY OF GLENDALE Management’s Discussion and Analysis June 30, 2016 (in thousands)
• Glendale Water and Power has adopted a multi-year capital improvement program for water works projects scheduled for four consecutive years that included FY 2012-13 through FY 2015-16. At the end of the year, Water Fund decreased its construction in progress by $7,951. This decrease primarily reflected the completion of some major capital improvement projects, such as improvement of Supervisory Control and Data Acquisition (SCADA) system; development of recycled water line in the Bette Davis Park; and rehabilitation and replacement of Adams Hill water mains. The increase of $5,500 in infrastructure was primarily due to GWP’s continuing effort on replacing aging water pipes and extension of the Glendale recycled water pipeline to provide recycled water to the City of Los Angeles. The increase of $7,542 in machinery and equipment was primarily due to additions and upgrades to the Supervisory Control and Data Acquisition (SCADA) system which provides GWP Water the ability to centrally monitor and control all functions of City’s water storage and distribution system.
City of Glendale’s Capital Assets
Governmental Activities
Business-type Activities
Total
2016 2015 2016 2015 2016 2015
Land $ 414,298 414,298 9,490 9,490 423,788 423,788Natural gas reserve - - 22,144 22,276 22,144 22,276Buildings and improvements 364,101 357,037 265,429 260,939 629,530 617,976Machinery and equipment 126,928 120,502 558,390 561,221 685,318 681,723Infrastructure 317,093 306,837 146,476 140,976 463,569 447,813Construction in progress 59,114 59,341 68,414 43,992 127,528 103,333Intangible assets - - 99,746 95,343 99,746 95,343
Total capital assets 1,281,534 1,258,015 1,170,089 1,134,237 2,451,623 2,392,252Less: Accumulated depreciation (355,530) (334,671) (463,078) (442,264) (818,608) (776,935)Less: Gas depletion - - (8,919) (7,986) (8,919) (7,986)Less: Amortization - - (43,319) (40,376) (43,319) (40,376)
Net of depreciation, depletion, and amortization $ 926,004 923,344 654,773 643,611
1,580,777 1,566,955
Additional information on the City’s capital assets can be found in Note 6 on pages 67-68 as well as pages 171-172 of this report. Long-term debt and liabilities. The City's total debt and liabilities decreased by $89,861 (17.7%) in FY 2015-16. The factors of this decrease were a combination of items such as a decrease of claims payable of $1,260; a decrease of post-employment benefits of $86,709; an increase of compensated absences of $1,166; and an increase of landfill postclosure care of $1,766; as well as decreases in outstanding bonds payable and other long-term liabilities through regular annual debt retirements and refunding of Electric revenue bonds, 2006 and 2008 series.
17

CITY OF GLENDALE Management’s Discussion and Analysis June 30, 2016 (in thousands)
City of Glendale’s Debt and Liabilities
Governmental
Activities
Business-type
Activities
Total
2016 2015 2016 2015 2016 2015
Claims payable $ 41,942 43,202 - - 41,942 43,202 Post-employment benefits 8,134 94,843 - - 8,134 94,843 Compensated absences 21,278 20,430 6,456 6,138 27,734 26,568 Landfill postclosure care 44,684 42,918 - - 44,684 42,918 Certificates of Participation (COPs) 35,605 38,400 - - 35,605 38,400
Other long-term liabilities:
Capital Lease-Fire equipment lease 2009 – Wells Fargo 514 757
- -
514 757
2011 HUD Section 108 loan 1,305 1,491 - - 1,305 1,491
Total other long-term liabilities 1,819 2,248 - - 1,819 2,248
Bonds payable:
Electric Revenue Bonds, 2006 refunding series - -
- 28,726
- 28,726
Electric Revenue Bonds, 2008 series - - 1,880 61,284 1,880 61,284 Electric Revenue Bonds, 2013 refunding series - -
23,640 23,841
23,640 23,841
Electric Revenue Bonds, 2013 series - - 62,565 63,766 62,565 63,766 Electric Revenue Bonds, 2016 refunding series - -
89,303 -
89,303 -
Water Revenue Bonds, 2008 series - - 46,479 47,829 46,479 47,829 Water Revenue Bonds, 2012 series - - 35,554 35,575 35,554 35,575
Total bonds payable - - 259,421 261,021 259,421 261,021 Total long-term debt and liabilities $ 153,462 242,041
265,877 267,159
419,339 509,200
Credit ratings Municipal bond ratings provide investors with a simple way to compare the relative investment quality of different bonds. Bond ratings express the opinions of the rating agencies as to the issuer’s ability and willingness to pay debt service when it is due. In general, the credit rating analysis includes the evaluation of the relative strengths and weaknesses of the following four factors as they affect an issuer’s ability to pay debt and service: fiscal, economic, debt and administrative/management factors. The City continues to receive high general credit ratings from all three national rating agencies, despite the difficult financial and economic conditions the national and local economy has been faced with and continues to have a strong capacity to meet its financial commitments on obligations.
18

CITY OF GLENDALE Management’s Discussion and Analysis June 30, 2016 (in thousands) The City's bond ratings as of June 30, 2016 are as follows:
Debt Issue Moody’s
Standard & Poor’s (S & P)
Fitch Ratings’
Issuer credit rating (Implied General Obligation) Aa2 AA+ AA+ Certificates of Participation (COPs) A1* - AA Electric revenue bonds, 2008 series Aa3 AA- A+ Electric revenue bonds, 2013 refunding series Aa3 AA- A+ Electric revenue bonds, 2013 series Aa3 AA- A+ Electric revenue bonds, 2016 refunding series - AA- A+ Water revenue bonds, 2008 series A1 A+ A+ Water revenue bonds, 2012 series A1 A+ A+
* As of 10/5/16, Moody's Investors Service has upgraded the rating of City of Glendale’s
Variable Rate Demand Certificates of Participation (COPs) to Aa3 from A1. The Glendale Successor Agency’s (Fiduciary Fund) bond ratings as of June 30, 2016 are as follows:
Debt Issue Moody’s
Standard & Poor’s (S & P)
Fitch Ratings’
2011 GRA subordinate taxable tax allocation bonds - A+ - 2013 GSA tax allocation bonds, refunding series - A- - 2016 GSA tax allocation bonds, refunding series - A- -
Legal Debt Margins Under the City Charter, the total bonded debt of the city shall at no time exceed 15% of the net assessed value of all real and personal property within the City limits (“debt limit”). General obligation debt is debt secured by the City’s property tax revenues. As of June 30, 2016, the City’s net assessed value of taxable property was $21.7 billion and has no general obligation debt. Debt Administration Finance works to ensure that the City meets its debt administration obligations to:
• Pay debt service timely;
• Monitor trustee-held accounts and guaranteed investment contracts;
• Comply with bond covenants and Internal Revenue Service (IRS) rules and regulations;
• Provide continuing disclosure and other reports to the municipal bond market;
• Manage liquidity and credit enhancement contracts.
19

CITY OF GLENDALE Management’s Discussion and Analysis June 30, 2016 (in thousands) Continuing Disclosure On November 10, 1994, the Securities and Exchange Commission (“SEC”) adopted amendments to existing federal regulations (“Rule 15c-12” or the “Rule”) under which municipalities issuing securities on or after July 3, 1995 is required to:
• Prepare official statements meeting current requirements of the Rule; • Annually file certain financial information and operating data with national and state repositories; • Prepare announcements of the significant events enumerated in the Rule.
As of June 30, 2016, the City had 6 series of bonds subject to Continuing Disclosure requirements. The City prepares the Continuing Disclosure (financial and operating information) for its 6 series bonds and engaged a dissemination agent, the Trustee to disseminate such disclosures. The Glendale Successor Agency (Agency) had 1 tax-exempt tax allocation bond and 2 subordinate taxable tax allocation bonds. The Agency engages a consultant to prepare and disseminate continuing disclosure for its 2 tax-exempt tax allocation bonds and 1 subordinate taxable tax allocation bonds. These disclosures are disseminated through the use of Electronic Municipal Market Access (“EMMA”), the Municipal Securities Rulemaking Board’s (“MSRB”) disclosure website. Timely and accurate communication with the municipal marketplace is vital in retaining the City’s creditworthiness and market access. Continuing Disclosure and compliance reporting constitute a significant part of Debt Management’s compliance activity for the life of each series of bonds. Additional information on the City’s long-term debt can be found in Note 8 on pages 69-74 of this report. Economic Factors and Next Year’s Budget and Rates In the U.S. economy, the consumer sector is expected to account for almost three-quarters of all economic activity during FY 2016-17, making the consumer sector the largest of the economy’s four sectors. During 2015, consumer spending grew at a rate of 3.1%, the fastest in 10 years – perhaps in response to a notable 6.2% increase in total personal income. Continued increases in nationwide household wealth have also led to higher levels of spending in the U.S. In addition, job gains in most sectors of the economy contributed to a decline in the unemployment rate throughout the year; the average U.S. unemployment rate was just 5.3%, equivalent to the natural rate of unemployment which is thought to be somewhere between 5.2% and 5.5%. Unemployment is expected to decline further to just 4.9% in 2016. Looking ahead, it is forecasted that the U.S. economy should see steady growth at 2.5% for the next two years, in part because of further spending on housing, construction and durable goods, such as vehicles, and the expectation that energy prices will remain low. California remains the largest economy when compared to any other state in the U.S. (13% of the U.S. GDP), and its forecasted growth of 3.1% for 2016 is expected outpace that of any other state. Many regions in the state are close to regaining all of the jobs lost during the Great Recession. It is estimated that California’s unemployment rate will continue its gradual decline from 6.2% in 2015, to 5.5% in 2016 – a rate of just 5.3% is projected for 2017. With continued improvements in the labor market, both personal income and total taxable sales should increase by 4.5% and 5.6% respectively in 2016, with continued growth forecasted in 2017.
20

CITY OF GLENDALE Management’s Discussion and Analysis June 30, 2016 (in thousands) Los Angeles County is expected to experience another decline in the unemployment rate for this year, dropping from 6.9% in 2015 to 6.2% in 2016. Total personal income is expected grow at 4.4%, a -0.1% change from last year. Finally, taxable sales are expected to increase by 5.5% in 2016, a welcome jump after a relatively weak increase of 2.9% in 2015. The City’s FY 2016-17 Budget incorporates the policy direction of the City Council for services and programs to address the needs of the community. The adopted budget for FY 2016-17 reflects a minor, but planned, budget gap of $1,000. This gap has been anticipated in the financial forecasts for some time now; in fact, it is reduced from what earlier forecasts had predicted – a reflection of strengthening revenues and improved cost management. It is not uncharacteristic for a public corporation to occasionally utilize fund balance savings. As long as the City keeps the focus fixed on maintaining a structurally balanced agency, the City is confident in what the future holds. To that end, the City foresees a return to a gradual operational surplus in the General Fund as pension cost rate-smoothing takes effect in future years. Nonetheless, the City Council’s top priority of fiscal responsibility continues to pay dividends to the community, taking form through restored programming, enhanced services and capital improvement projects which will further increase the quality of life experienced by residents, businesses and visitors. The appropriation increase of $11,800 in the General Fund, when compared to the adopted budget in FY 2015-16, is mainly attributable to the overall increase in salaries & benefits and maintenance & operations. The salaries & benefits variance amounts to $5,500 and is mainly attributable to a $2,300 increase for higher PERS rates and a $1,700 increase for program restoration across all General Fund departments. General Fund departments once again froze their discretionary Maintenance & Operation budget, but were given increases at the discretion of City Council. The overall increase to this category was $5,400, mainly due to a $2,500 charge across departments to fund the Building Maintenance section which shifted out of the General Fund; this charge was offset by an equivalent reduction in salaries & benefits costs for the General Fund. The ISD service charge also increased by $825 – this charge covers the use of services provided by the Information Services Department to General Fund departments. The ISD Rate increased due to more costs being allocated through the ISD rate plan. Also, Retiree Health Savings Plan, Liability Insurance and Workers’ Compensation Rates were adjusted based on recent claims experience and the financial health of the funds. Lastly, there was a net $920 increase to transfers & capital outlay, the majority of which is due to a $1,400 increase in transfers to fund Capital Improvements and streets projects, all offset by a various decreases in appropriations for other Transfers and Capital Outlay. The General Fund budget continues to include a 10% transfer of Electric Fund operating revenues, while the City is currently engaged in litigation regarding the City’s transfer from the Electric Fund to the General Fund. Glendale Coalition for a Better Government v. City of Glendale, L.A. Superior Court Case No. 147376; Saavedra et al. v. City of Glendale, L.A. Superior Court Case No. BC539160. The court concluded that the amount of the “hidden” tax is the amount of the General Fund transfer (GFT) in the years since the new electric rate plan was imposed in August 2013. The court intends to order a remedy requiring the City to credit ratepayers the amount of the GFT since the electric rates were increased. The court will also issue a writ of mandate commanding the City to cease to include the GFT in the electric rates charged to consumers unless and until a majority of Glendale electorate approves the tax in the rates. The City has a motion for new trial that will be heard on January 19, 2017, and then the City will appeal. As such, status quo will remain in effect during the pendency of the appeal. See Note 14 for more information.
21

CITY OF GLENDALE Management’s Discussion and Analysis June 30, 2016 (in thousands) The financial pressures are not limited to the General Fund. For Special Revenue Funds, program cuts at the State and Federal levels have reduced the amount of grant funding that the City will receive. The General Fund capital improvement program has been significantly scaled back over the last several years. As noted in prior years, the City still has a significant fund balance deficit in the Workers’ Compensation Fund. The City plans to amortize this deficit over the next several years, and continues to work with departments to stabilize and reduce the amount of workers’ compensation claims. Lastly, aging infrastructure in the ISD Funds and the need to fund future replacement of vehicles in the Fleet/Equipment Replacement Fund, continue to pose financial challenges that need to be addressed in the coming years. Requests for Information This financial report is designed to provide a general overview of the City’s finances for all those with an interest in the government’s finances. Questions concerning any of the information provided in this report or requests for additional financial information should be addressed to Director of Finance, 141 North Glendale Avenue, Suite 346, Glendale, CA 91206.
22

Exhibit A-1CITY OF GLENDALEStatement of Net PositionJune 30, 2016 (in thousands)
Governmental
Activities Business-type
Activities Total
Pooled cash and investments $ 356,106 187,736 543,842Cash and investments with fiscal agent 22 11,249 11,271Investment-gas/electric commodity - 2,386 2,386Interest receivable 1,158 645 1,803Accounts receivable, net 37,294 51,322 88,616Internal balances (1,699) 1,699 -Inventories 326 5,695 6,021Prepaid items 5,106 6,206 11,312
Total current assets 398,313 266,938 665,251
Noncurrent assets:Capital assets, net of depreciation:Land 414,298 9,490 423,788Natural gas reserve - 13,225 13,225Buildings and improvements 213,244 172,012 385,256Machinery and equipment 34,692 237,606 272,298Infrastructure 204,656 97,599 302,255Construction in progress 59,114 68,414 127,528Intangible - 56,427 56,427
Total capital assets 926,004 654,773 1,580,777
Designated cash and investments - 69,250 69,250Restricted cash and investments 27,850 27,930 55,780Prepaid energy - 11 11Loans receivable 47,285 55 47,340Property held for resale 6,988 - 6,988
Total noncurrent assets 1,008,127 752,019 1,760,146
Total assets 1,406,440 1,018,957 2,425,397
Loss on refunding - 5,043 5,043Deferred outflows of resources related to pensions 28,510 6,266 34,776
Total deferred outflows of resources 28,510 11,309 39,819
Total assets and deferred outflows of resources $ 1,434,950 1,030,266 2,465,216
Current assets:
Assets and deferred outflows of resources
Deferred outflows of resources:
(Continued) See accompanying notes to basic financial statements
23

Exhibit A-1CITY OF GLENDALEStatement of Net PositionJune 30, 2016 (in thousands)
Governmental
Activities Business-type
Activities Total
Liabilities, deferred inflows of resources and net position
Current liabilities:Accounts payable $ 16,530 20,202 36,732Accrued wages and withholding 6,423 - 6,423Interest payable 63 3,060 3,123Claims payable 11,454 - 11,454Compensated absences 2,740 842 3,582Certificates of participation 1,820 - 1,820Bonds payable - 5,988 5,988Unearned revenues 336 - 336Deposits 4,945 5,336 10,281Other liabilities 18,438 - 18,438
Total current liabilities 62,749 35,428 98,177
Noncurrent liabilities:Claims payable 30,488 - 30,488Post employment benefits 8,134 - 8,134Compensated absences 18,538 5,614 24,152Landfill postclosure 44,684 - 44,684Net pension liability 353,692 76,490 430,182Certificates of participation 33,785 - 33,785Bonds payable - 253,433 253,433Other liabilities 1,373 - 1,373
Total noncurrent liabilities 490,694 335,537 826,231
Total liabilities 553,443 370,965 924,408
Deferred inflows of resources related to pensions 35,651 8,513 44,164
Total liabilities and deferred inflows of resources 589,094 379,478 968,572
Net position:Net investment in capital assets 888,998 422,656 1,311,654
RestrictedCity Charter - stabilization 24,870 - 24,870Federal and state grants 5,621 - 5,621Public safety 1,820 - 1,820Youth employment 52 - 52Transportation 22,297 - 22,297Landscaping district 139 - 139Low and moderate housing 16,795 - 16,795Air quality improvement 370 - 370SCAQMD emission controls - 5,669 5,669Cable access 2,434 - 2,434Electric public benefit AB1890 3,609 - 3,609State gas tax mandates 3,240 - 3,240Capital projects 29,034 - 29,034
Unrestricted (153,423) 222,463 69,040
Total net position $ 845,856 650,788 1,496,644
Deferred inflows of resources:
See accompanying notes to basic financial statements
24

Exhibit A-2CITY OF GLENDALEStatement of ActivitiesFiscal Year Ended June 30, 2016 (in thousands)
Expenses
Charges for
Services
Operating Grants and
Contributions
Capital Grants and
Contributions
Governmental
Activities
Business-type
Activities Total Governmental activities:
General government $ 20,335 17,554 94 - (2,687) - (2,687)Police 72,274 1,229 772 - (70,273) - (70,273)Fire 51,386 8,242 1,641 2 (41,501) - (41,501)Public works 31,925 20,732 6,526 8,081 3,414 - 3,414Transportation 14,367 9,882 7,896 - 3,411 - 3,411
Housing, health and community development 39,860 68 35,081 - (4,711) - (4,711)Employment programs 5,265 1,509 4,012 - 256 - 256Public service 6,230 - - - (6,230) - (6,230)
Parks, recreation and community services 15,889 2,999 309 - (12,581) - (12,581)Library 8,222 156 67 - (7,999) - (7,999)Interest and fiscal charges 2,203 - - - (2,203) - (2,203)
Total governmental activities 267,956 62,371 56,398 8,083 (141,104) - (141,104)
Business-type activities:Fire communications 3,149 3,515 2 5 - 373 373Sewer 15,327 14,273 - - - (1,054) (1,054)Refuse disposal 18,518 21,769 52 - - 3,303 3,303Electric 172,647 217,467 - - - 44,820 44,820Water 42,017 49,972 - 300 - 8,255 8,255
Total business-type activities 251,658 306,996 54 305 - 55,697 55,697
Total primary government $ 519,614 369,367 56,452 8,388 (141,104) 55,697 (85,407)
General revenues: Taxes: Property taxes $ 51,709 - 51,709 Sales taxes 46,651 - 46,651 Utility users tax 28,662 - 28,662 Other taxes 20,378 - 20,378 Investment income 8,456 4,899 13,355 Other 25,988 7,702 33,690 Reinstatement of loans 28,029 - 28,029Transfers 19,524 (19,524) -Special items:
6,729 - 6,72982,247 - 82,247
Extraordinary gain 26,490 - 26,490
344,863 (6,923) 337,940
Change in net position 203,759 48,774 252,533
Net position, July 1 642,097 602,014 1,244,111
Net position, June 30 $ 845,856 650,788 1,496,644
Program RevenuesNet (Expenses) Revenues and
Changes in Net Position
Transfer of capital assets from Successor Agency
Total general revenues, transfers, special items and extraordinary gain
Elimination of OPEB implied subsidy
See accompanying notes to basic financial statements
25

Exhibit B-1CITY OF GLENDALEBalance SheetGovernmental Funds June 30, 2016 (in thousands)
General Fund
Housing Assistance
Fund
Capital Improvement
Fund
Nonmajor Governmental
Funds
Total Governmental
Funds
Pooled cash and investments $ 94,426 2,726 9,612 136,131 242,895Cash and investments with fiscal agent - - - 22 22Restricted cash and investments - - - 27,850 27,850Interest receivable 290 6 - 328 624Accounts receivable, net 20,947 219 1,766 13,726 36,658Due from other funds 7,974 - - - 7,974Inventories 107 - - - 107Prepaid items 89 2,171 - 45 2,305Loans receivable 40,133 - - - 40,133Property held for resale - - - 6,988 6,988
Total assets 163,966 5,122 11,378 185,090 365,556
Liabilities:Accounts payable 4,597 15 24 10,879 15,515Due to other funds 1,733 - - 6,518 8,251Interest payable - - - 21 21Wages and benefits payable 6,423 - - - 6,423Unearned revenues - - - 336 336Deposits 4,698 - - 247 4,945Other liabilities 17,992 - - - 17,992
Total liabilities 35,443 15 24 18,001 53,483
Deferred inflows of resources:Unavailable revenues 40,177 - 59 8,094 48,330
Total liabilities and deferred inflows of resources $ 75,620 15 83 26,095 101,813
Major Funds
Assets
Liabilities, deferred inflows of resources and fund balances
(Continued) See accompanying notes to basic financial statements
26

Exhibit B-1CITY OF GLENDALEBalance SheetGovernmental Funds June 30, 2016 (in thousands)
General Fund
Housing Assistance
Fund
Capital Improvement
Fund
Nonmajor Governmental
Funds
Total Governmental
Funds
Major Funds
Nonspendable:Inventory $ 107 - - - 107Property held for resale - - - 981 981Prepaid 89 2,171 - 45 2,305
Restricted for:City Charter - stabilization 24,870 - - - 24,870Federal and state grants - 2,936 - 2,685 5,621Public safety - - - 1,820 1,820Youth employment - - - 52 52Transportation - - - 22,297 22,297Landscaping district - - - 139 139Low and moderate housing - - - 9,642 9,642Air quality improvement - - - 370 370Cable access - - - 2,434 2,434Electric public benefit AB1890 - - - 3,609 3,609State gas tax mandates - - - 3,240 3,240Landfill postclosure - - - 27,850 27,850Capital projects - - - 29,034 29,034
Committed to:Debt service - - - 19,287 19,287Urban art - - - 5,275 5,275Public safety - - - 13 13Impact fee funded projects - - - 26,078 26,078Capital projects - - 11,295 - 11,295Filming - - - 373 373Recreation - - - 3,548 3,548Hazardous materials - - - 2,057 2,057Parking - - - 7,511 7,511
Assigned to:Economic development 4,526 - - - 4,526Emergency medical services 2,000 - - - 2,000Capital projects 800 - - - 800
55,954 - - (9,345) 46,609
Total fund balances 88,346 5,107 11,295 158,995 263,743
$ 163,966 5,122 11,378 185,090 365,556
Fund balances:
Total liabilities, deferred inflows of resources and fund balances
Unassigned:
See accompanying notes to basic financial statements
27

Exhibit B-2CITY OF GLENDALEReconciliation of Balance Sheet of Governmental Funds to the Statement of Net PositionJune 30, 2016 (in thousands)
Fund balances of governmental funds $ 263,743
Amounts reported for governmental activities in the statement of net position are different because:
Capital assets are not included as financial resources in governmental fund activity: Land $ 414,298 Buildings and improvements 213,030 Equipment 18,414 Infrastructure 204,656 Construction in progress 50,102 900,500
Long-term debt is not included in the governmental funds: Due within one year: Certificates of participation (1,820) 2011 HUD Section 108 loan (194) (2,014)
Due more than one year: Certificates of participation (33,785) Landfill postclosure (44,684) 2011 HUD Section 108 loan (1,111) (79,580)
Accrued interest payable for the current portion of interest due isnot included in the governmental funds: 2011 HUD Section 108 loan (11)
Unavailable revenue in the governmental funds is revenue in thestatement of activities: 48,330
Loans receivable housing long term - non-forgiven portion 7,152
Deferred outflows of resources related to pensions 28,510
Deferred inflows of resources related to pensions (35,651)
Post employment benefits (8,134)
Net pension liability (353,692)
Internal service funds are used to charge the cost of certain activities toindividual funds, such as self insurance, and post employmentbenefits. The assets and liabilities of the internal service funds are included in the governmental activities in the statement of net position: Other improvement 214 Equipment 16,278 Construction in progress 9,012 Accrued interest - Fire Equipment Lease 2009 (12) Fire Equipment Lease 2009 - Due within one year (252) Fire Equipment Lease 2009 - Due more than one year (262) Other assets and liabilities, net 51,725 76,703
Net position of governmental activities $ 845,856
See accompanying notes to basic financial statements
28

Exhibit C-1CITY OF GLENDALEStatement of Revenues, Expenditures, and Changes in Fund BalancesGovernmental FundsFiscal Year Ended June 30, 2016 (in thousands)
General
Fund
Housing Assistance
Fund
Capital Improvement
Fund
Nonmajor Governmental
Funds
Total Governmental
Funds Revenues:
Property taxes $ 51,709 - - - 51,709Sales tax 44,451 - - 2,200 46,651Utility users tax 28,662 - - - 28,662Other taxes 13,231 - - 7,147 20,378Revenue from other agencies 950 28,852 351 31,179 61,332Licenses and permits 9,741 - - 13,522 23,263Fines and forfeitures 2,701 - - 1,598 4,299Charges for services 3,806 - 4,770 27,300 35,876Use of money and property 9,364 47 - 2,409 11,820Interfund revenue 14,950 - - - 14,950Miscellaneous revenue 2,199 10 - 1,896 4,105
Total revenues 181,764 28,909 5,121 87,251 303,045
Expenditures:Current:
General government 25,303 - 124 340 25,767Police 71,232 - - 1,964 73,196Fire 45,541 - 490 7,394 53,425Public works 18,335 - 424 9,759 28,518Transportation - - - 13,341 13,341
Housing, health and community development 3,885 28,417 - 7,563 39,865Employment programs - - - 5,603 5,603Public service - - - 6,381 6,381
Parks, recreation and community services 10,402 - 52 3,685 14,139Library 8,218 - 7 430 8,655
Capital outlay 93 - 574 12,766 13,433Debt service:
Interest - - - 268 268Principal - - - 2,981 2,981
Total expenditures 183,009 28,417 1,671 72,475 285,572
Excess (deficiency) of revenues over (under) expenditures (1,245) 492 3,450 14,776 17,473
Other financing sources (uses):Transfers in 21,257 - 471 3,437 25,165Transfers out (3,641) - (2,000) - (5,641)
Total other financing sources (uses) 17,616 - (1,529) 3,437 19,524
Extraordinary gain - - - 26,490 26,490
Net change in fund balances 16,371 492 1,921 44,703 63,487
Fund balances, July 1 71,975 4,615 9,374 114,292 200,256
Fund balances, June 30 $ 88,346 5,107 11,295 158,995 263,743
Major Funds
See accompanying notes to basic financial statements
29

Exhibit C-2CITY OF GLENDALEReconciliation of the Statement of Revenues, Expenditures, and Changes inFund Balances of Governmental Funds to the Statement of ActivitiesFiscal Year Ended June 30, 2016 (in thousands)
Net change in fund balances - total governmental funds $ 63,487
Amounts reported for governmental activities in the statement of activities are different because:
Governmental funds report capital outlays as expenditures 15,464
In the statement of activities, the cost of capital assets is allocated over their estimated useful lives as depreciation expense. (21,495)
Repayment of principal is an expenditure in the governmental funds, but the repayment reduces long-term liabilities in the statement of net position: Certificates of participation $ 2,795 2011 HUD Section 108 loan 186 2,981
Landfill postclosure care liability increased from prior year (1,766)
Unavailable revenue in the governmental funds are recognized as revenues in the statement of activities 5,651
Governmental funds report pension contributions as expenditures. However, inthe Statement of Activities, pension expense is measured as the change in net pension liability and the amortization of deferred outflows and inflows related to pensions. This amount represents the net change in pension related amounts. 9,948
Accrued interest 2011 HUD Section 108 loan (1)
Post employment benefits 86,709
Reinstatement of loans from former Redevelopment Agency to the City 28,029
Transfer of capital assets from Successor Agency 6,729
Change in net position of internal service funds allocated to governmental activities: Capital assets 2,379 Depreciation (1,260) Interest - Fire Equipment Lease 2009 (25) Other revenue (expenses) 6,929 8,023
Change in net position for governmental activities $ 203,759
See accompanying notes to basic financial statements
30

Exhibit D-1CITY OF GLENDALEStatement of Revenues and Other Financing Sources - Budget and ActualGeneral FundFiscal Year Ended June 30, 2016 (in thousands)
Original Budget Final Budget Actual
Variance With Final Budget Over/(Under)
Property taxes $ 52,740 52,740 51,709 (1,031)
Sales taxes: Sales tax 31,000 31,000 30,851 (149) ERAF in lieu of sales tax 4,900 4,900 11,822 6,922 State 1/2% sales tax 1,800 1,800 1,778 (22)
Total 37,700 37,700 44,451 6,751
Utility users tax 28,250 28,250 28,662 412
Other Taxes: Franchise tax 3,000 2,900 2,693 (207) Occupancy tax 5,200 5,350 6,426 1,076 Property transfer tax 800 900 1,078 178 Landfill host assessment 2,000 2,000 3,034 1,034
Total 11,000 11,150 13,231 2,081
Licenses and permits: Dog licenses 150 150 136 (14) Building permits 5,000 5,000 5,555 555 Green building initiative SB 1473 - - 1 1 American Disability Act SB1186 - - 2 2 Plan check fees 400 600 561 (39) Planning permits 1,200 1,200 1,679 479 Grading permits 55 105 152 47 Street permits 650 650 903 253 Business license permits 500 500 602 102 Business registration license 150 150 150 -
Total 8,105 8,355 9,741 1,386
Fines and forfeitures-traffic safety fines 2,850 2,800 2,701 (99)
Use of money and property: Interest and investment revenue 515 715 1,108 393 Interest and investment GASB 31 - - 911 911 Landfill gas royalties 2,475 2,475 2,473 (2) Rental income 550 550 538 (12) Loan repayment 3,921 3,921 4,334 413
Total $ 7,461 7,661 9,364 1,703
Revenues:
(Continued) See accompanying notes to basic financial statements
31

Exhibit D-1CITY OF GLENDALEStatement of Revenues and Other Financing Sources - Budget and ActualGeneral FundFiscal Year Ended June 30, 2016 (in thousands)
Original Budget Final Budget Actual
Variance With Final Budget Over/(Under)
Revenue from other agencies: Mutual aid reimbursement $ - - 105 105 State SB 90 350 250 464 214 Motor vehicle in lieu fee - 80 80 - Local grants - 265 301 36
Total 350 595 950 355
Miscellaneous revenue: Donations and contributions 15 15 61 46 Sponsorships - - 47 47 Advertising revenue 100 100 121 21 Miscellaneous revenue 1,887 2,137 1,970 (167)
Total 2,002 2,252 2,199 (53)
Charges for services: Zoning-subdivision fees 135 150 199 49 City Clerk fees - - 1 1 Map and publication fees 75 75 83 8 Filing-certification fee 15 15 22 7 Special event fees 150 - 3 3 Special police fees 764 764 726 (38) Vehicle tow admin cost recovery (VTACR) 375 375 394 19 Fire fees 550 725 1,063 338 Joint air support maintenance fee - - 52 52 Code enforcement fees 50 50 31 (19) Administrative citations - - 37 37 Outreach revenue 55 55 28 (27) Express plan check fees 150 400 445 45 Final map checking fees - - 37 37 Excavation fees 175 175 218 43 Construction inspection fees 80 80 133 53 Collectible jobs 100 100 29 (71) Library fines and fees 95 95 51 (44) Rental civic auditorium - - 3 3 Program/registration revenue 12 12 11 (1) Local assessment fees - - 6 6 Graphics fees - 292 234 (58)
Total 2,781 3,363 3,806 443
Interfund revenue: Charges to enterprise funds for:
Benefits cost recovery 650 500 509 9 Cost allocation revenue 14,441 14,441 14,441 -
Total 15,091 14,941 14,950 9
Transfers in 21,257 21,257 21,257 -
Total revenues and transfers $ 189,587 191,064 203,021 11,957
Other financing sources:
See accompanying notes to basic financial statements
32

Exhibit D-2CITY OF GLENDALEStatement of Expenditures and OtherFinancing Uses - Budget and ActualGeneral FundFiscal Year Ended June 30, 2016 (in thousands)
Original Budget Final Budget Actual
Variance With Final
Budget (Over)/Under
General government:City clerk $ 625 651 553 98Elections 11 11 - 11City treasurer 579 580 570 10City manager 2,857 2,878 2,790 88Legal 2,926 2,985 2,985 -Finance 3,969 3,984 3,806 178Planning 6,977 7,250 7,250 - Personnel 1,736 1,742 1,499 243Non-departmental 1,698 1,698 1,698 -
Total 21,378 21,779 21,151 628
Police 59,426 59,601 60,081 (480)
Fire 39,130 39,426 39,991 (565)
Public works 8,575 8,628 8,441 187
Housing, health and community development:Economic development 610 925 737 188Community development administration 1,569 1,574 1,538 36
Total 2,179 2,499 2,275 224
Parks, recreation and community services 6,532 6,603 6,402 201
Library 5,562 5,811 5,428 383
Total expenditures and transfers $ 142,782 144,347 143,769 578
Salaries and Benefits
(Continued) See accompanying notes to basic financial statements
33
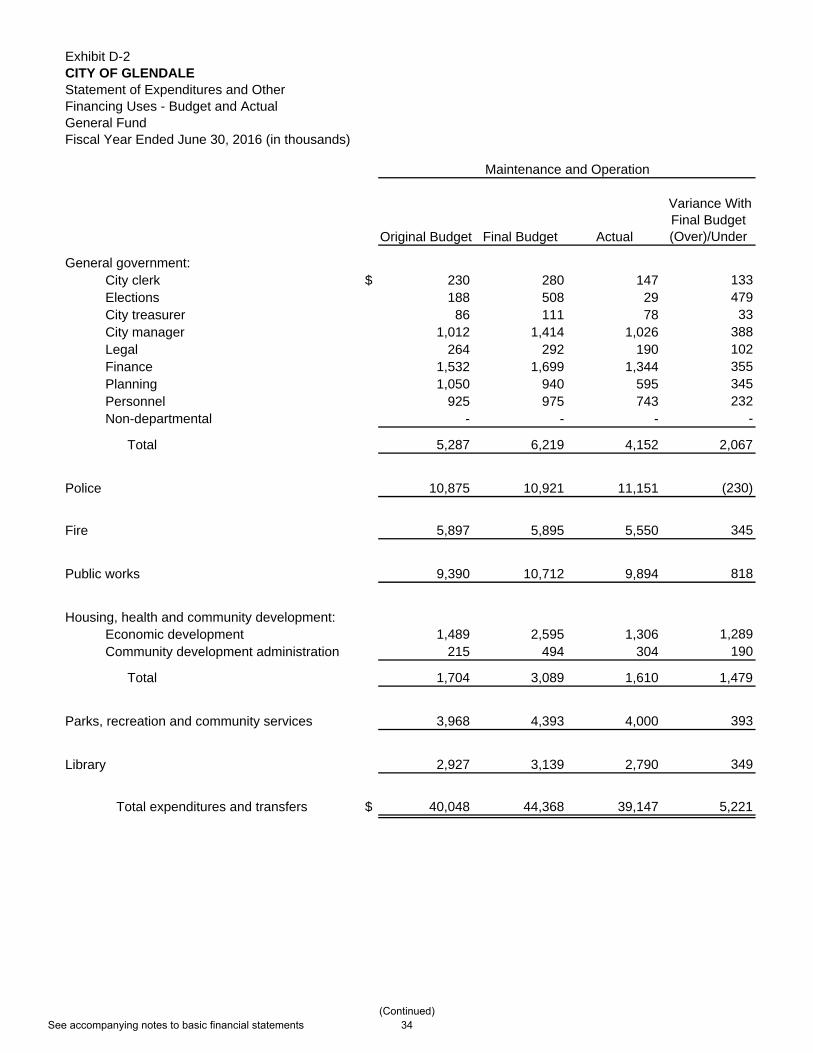
Exhibit D-2CITY OF GLENDALEStatement of Expenditures and OtherFinancing Uses - Budget and ActualGeneral FundFiscal Year Ended June 30, 2016 (in thousands)
General government:City clerk $ElectionsCity treasurerCity managerLegalFinancePlanningPersonnelNon-departmental
Total
Police
Fire
Public works
Housing, health and community development:Economic developmentCommunity development administration
Total
Parks, recreation and community services
Library
Total expenditures and transfers $
Original Budget Final Budget Actual
Variance With Final Budget (Over)/Under
230 280 147 133188 508 29 479
86 111 78 331,012 1,414 1,026 388
264 292 190 1021,532 1,699 1,344 3551,050 940 595 345
925 975 743 232- - - -
5,287 6,219 4,152 2,067
10,875 10,921 11,151 (230)
5,897 5,895 5,550 345
9,390 10,712 9,894 818
1,489 2,595 1,306 1,289215 494 304 190
1,704 3,089 1,610 1,479
3,968 4,393 4,000 393
2,927 3,139 2,790 349
40,048 44,368 39,147 5,221
Maintenance and Operation
(Continued) See accompanying notes to basic financial statements
34

Exhibit D-2CITY OF GLENDALEStatement of Expenditures and OtherFinancing Uses - Budget and ActualGeneral FundFiscal Year Ended June 30, 2016 (in thousands)
General government:City clerk $ElectionsCity treasurerCity managerLegalFinancePlanningPersonnelNon-departmental
Total
Police
Fire
Public works
Housing, health and community development:Economic developmentCommunity development administration
Total
Parks, recreation and community services
Library
Total expenditures and transfers $
Original Budget Final Budget Actual
Variance With Final
Budget (Over)/Under
- - - -- - - -- - - -- 4 4 -- - - -- - - -
35 35 7 28- - - -- - - -
35 39 11 28
- - 9 (9)
- 74 73 1
- - - -
372 372 - 372- - - -
372 372 - 372
- - - -
- 800 - 800
407 1,285 93 1,192
Capital Outlay
(Continued) See accompanying notes to basic financial statements
35

Exhibit D-2CITY OF GLENDALEStatement of Expenditures and OtherFinancing Uses - Budget and ActualGeneral FundFiscal Year Ended June 30, 2016 (in thousands)
General government:City clerk $ElectionsCity treasurerCity managerLegalFinancePlanningPersonnelNon-departmental
Total
Police
Fire
Public works
Housing, health and community development:Economic developmentCommunity development administration
Total
Parks, recreation and community services
Library
Total expenditures and transfers $
Original Budget Final Budget Actual
Variance With Final
Budget (Over)/Under
- - - -- - - -- - - -- - - -- - - -- - - -- - - -- - - -
1,825 1,825 3,641 (1,816)
1,825 1,825 3,641 (1,816)
- - - -
- - - -
- - - -
- - - -- - - -
- - - -
- - - -
- - - -
1,825 1,825 3,641 (1,816)
Transfers
(Continued) See accompanying notes to basic financial statements
36

Exhibit D-2CITY OF GLENDALEStatement of Expenditures and OtherFinancing Uses - Budget and ActualGeneral FundFiscal Year Ended June 30, 2016 (in thousands)
General government:City clerk $ElectionsCity treasurerCity managerLegalFinancePlanningPersonnelNon-departmental
Total
Police
Fire
Public works
Housing, health and community development:Economic developmentCommunity development administration
Total
Parks, recreation and community services
Library
Total expenditures and transfers $
Original Budget Final Budget Actual
Variance With Final
Budget (Over)/Under
855 931 700 231199 519 29 490665 691 648 43
3,869 4,296 3,820 4763,190 3,277 3,175 1025,501 5,683 5,150 5338,062 8,225 7,852 3732,661 2,717 2,242 4753,523 3,523 5,339 (1,816)
28,525 29,862 28,955 907
70,301 70,522 71,241 (719)
45,027 45,395 45,614 (219)
17,965 19,340 18,335 1,005
2,471 3,892 2,043 1,8491,784 2,068 1,842 226
4,255 5,960 3,885 2,075
10,500 10,996 10,402 594
8,489 9,750 8,218 1,532
185,062 191,825 186,650 5,175
Total
See accompanying notes to basic financial statements
37

Exhibit D-3CITY OF GLENDALEStatement of Revenues - Budget and ActualHousing Assistance FundFiscal Year Ended June 30, 2016 (in thousands)
Original Budget Final Budget Actual
Variance With Final Budget Over/(Under)
Revenues:Use of money and property $ 11 11 47 36Revenue from other agencies 30,083 30,083 28,852 (1,231)Miscellaneous revenue 26 26 10 (16)
Total revenues $ 30,120 30,120 28,909 (1,211)
See accompanying notes to basic financial statements
38
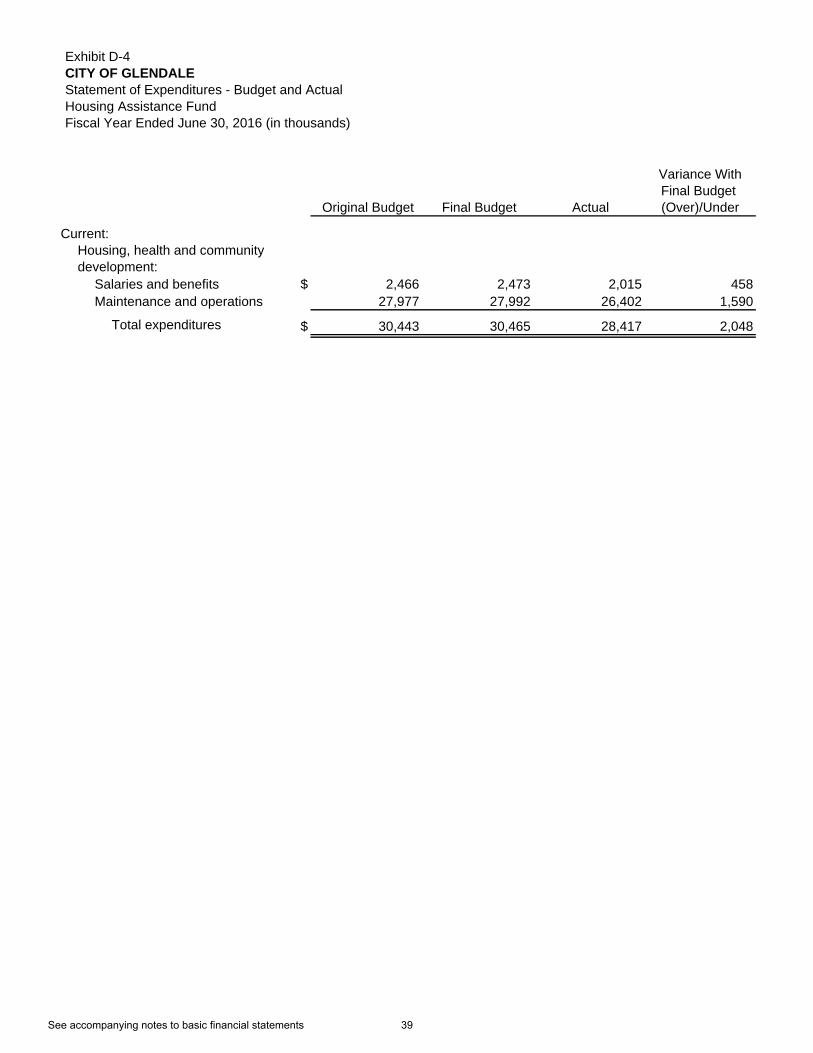
Exhibit D-4CITY OF GLENDALEStatement of Expenditures - Budget and ActualHousing Assistance FundFiscal Year Ended June 30, 2016 (in thousands)
Original Budget Final Budget Actual
Variance With Final Budget (Over)/Under
Current:
Salaries and benefits $ 2,466 2,473 2,015 458Maintenance and operations 27,977 27,992 26,402 1,590
Total expenditures $ 30,443 30,465 28,417 2,048
Housing, health and community development:
See accompanying notes to basic financial statements
39

Exhibit E-1CITY OF GLENDALEStatement of Net PositionProprietary FundsJune 30, 2016 (in thousands)
Sewer Fund
Electric Fund
Water Fund
Nonmajor Enterprise
Funds Total
Internal Service Funds
Pooled cash and investments $ 55,603 91,048 3,794 37,291 187,736 113,211Cash with fiscal agent - 4,640 5,136 - 9,776 -Investments with fiscal agent - 1,473 - - 1,473 -Interest receivable 151 402 4 88 645 533Investment-gas/electric commodity - 2,386 - - 2,386 -Accounts receivable, net 1,808 39,706 7,429 2,379 51,322 634Due from other funds - - 1,733 - 1,733 -Inventories - 5,695 - - 5,695 219Prepaid items - 6,206 - - 6,206 2,801
Total current assets 57,562 151,556 18,096 39,758 266,972 117,398
Capital assets:Land 578 6,239 1,034 1,639 9,490 -Natural gas reserve - 22,144 - - 22,144 -Buildings and improvements 132,661 65,503 60,466 6,799 265,429 214Machinery and equipment 2,048 496,926 37,952 21,464 558,390 41,649Infrastructure - - 146,476 - 146,476 -Intangible 99,746 - - - 99,746 -Accumulated depreciation (34,864) (327,227) (80,385) (20,602) (463,078) (25,371)Natural gas depletion - (8,919) - - (8,919) -Amortization (43,319) - - - (43,319) -Construction in progress 9,449 38,317 19,929 719 68,414 9,012
Total capital assets 166,299 292,983 185,472 10,019 654,773 25,504
Designated cash and investments - 66,400 2,850 - 69,250 -Restricted cash and investments - 20,922 7,008 - 27,930 -Loan receivable - - - 55 55 -Advance to other funds 1,153 - - - 1,153 -Prepaid energy - 11 - - 11 -
Total noncurrent assets 167,452 380,316 195,330 10,074 753,172 25,504
Total assets 225,014 531,872 213,426 49,832 1,020,144 142,902
Deferred outflows of resources:
Deferred outflows of resources related to pensions 355 3,634 1,229 1,048 6,266 -Loss on refunding - 5,043 - - 5,043 -
Total deferred outflows of resources 355 8,677 1,229 1,048 11,309 - Total assets and deferred outflows of resources $ 225,369 540,549 214,655 50,880 1,031,453 142,902
Business-type Activities - Enterprise Funds
Noncurrent assets:
Current assets:
Assets and deferred outflows of resources
(Continued) See accompanying notes to basic financial statements
40

Exhibit E-1CITY OF GLENDALEStatement of Net PositionProprietary FundsJune 30, 2016 (in thousands)
Sewer Fund
Electric Fund
Water Fund
Nonmajor Enterprise
Funds Total
Internal Service Funds
Business-type Activities - Enterprise Funds
Current liabilities:Accounts payable $ 6,606 8,883 3,866 846 20,201 1,013Due to other funds - - - - - 1,456Interest payable - 1,649 1,411 - 3,060 31Capital leases - - - - - 252Claims payable - - - - - 11,454Compensated absences - - - - - 3,582Bonds payable - 4,577 1,411 - 5,988 -Deposits 296 3,762 949 329 5,336 -
Total current liabilities 6,902 18,871 7,637 1,175 34,585 17,788
Noncurrent liabilities:Claims payable - - - - - 30,488Compensated absences - - - - - 24,152Bonds payable - 172,811 80,622 - 253,433 -Advance from other funds - - - - - 1,153Net pension liability 4,313 45,890 13,228 13,059 76,490 -Capital leases - - - - - 262
Total noncurrent liabilities 4,313 218,701 93,850 13,059 329,923 56,055
Total liabilities 11,215 237,572 101,487 14,234 364,508 73,843
Deferred inflows of resources: Deferred inflows of resources related to pensions 504 5,138 1,360 1,511 8,513 -
Total liabilities and deferred inflows of resources 11,719 242,710 102,847 15,745 373,021 73,843
166,299 135,891 110,447 10,019 422,656 24,103
SCAQMD emission controls - 5,669 - - 5,669 -Unrestricted 47,351 156,279 1,361 25,116 230,107 44,956
Total net position $ 213,650 297,839 111,808 35,135 658,432 69,059
Some amounts reported for business-type activities in the statement of net position are differentbecause the net adjustment pertains to items on the statement of net position of certain
internal service funds reported with business-type activities. (7,644)
Total net position of business-type activities $ 650,788
Restricted
Net position: Net investment in capital assets
Liabilities, deferred inflows of resources and net position
See accompanying notes to basic financial statements
41

Exhibit E-2CITY OF GLENDALEStatement of Revenues, Expenses and Changes in Net PositionProprietary FundsFiscal Year Ended June 30, 2016 (in thousands)
Sewer Fund
Electric Fund
Water Fund
Nonmajor Enterprise
Funds Total
Internal Service Funds
Operating revenues:Charges for services $ 14,273 217,467 49,972 25,284 306,996 92,904Miscellaneous revenue 273 4,148 2,860 334 7,615 193
Total operating revenue 14,546 221,615 52,832 25,618 314,611 93,097
Operating expenses: Maintenance and operation 9,853 143,915 34,271 19,881 207,920 28,637Claims and settlement - - - - - 51,442Depreciation 2,838 26,156 5,844 1,991 36,829 2,447Gas depletion - 933 - - 933 -Amortization 2,943 - - - 2,943 -
Total operating expenses 15,634 171,004 40,115 21,872 248,625 82,526
Operating income (loss) (1,088) 50,611 12,717 3,746 65,986 10,571
Non operating revenues (expenses):Use of money and property 981 3,259 87 684 5,011 2,049Intergovernmental grants - - - 54 54 584Loss on disposal of capital asset - - - (223) (223) -Interest expense - (4,998) (2,689) - (7,687) (332)
Total non operating revenues (expenses) 981 (1,739) (2,602) 515 (2,845) 2,301 Income before capital grants and contributions and transfers (107) 48,872 10,115 4,261 63,141 12,872
Capital grants and contributions - - 300 5 305 -Transfers in - - 1,733 - 1,733 5,640Transfers out - (20,107) - (1,150) (21,257) (5,640)
Change in net position (107) 28,765 12,148 3,116 43,922 12,872
213,757 269,074 99,660 32,019 56,187
Net position, June 30 $ 213,650 297,839 111,808 35,135 69,059
Some amounts reported for business-type activities in the statement of activities are different because the net revenue (expense) of certain internal service funds are reportedwith business-type activities. 4,852
Changes in net position of business-type activities $ 48,774
Net position, July 1
Business-type Activities - Enterprise Funds
See accompanying notes to basic financial statements
42

Exhibit E-3CITY OF GLENDALEStatement of Cash FlowsProprietary FundsFiscal Year Ended June 30, 2016 (in thousands)
Sewer Fund
ElectricFund
Water Fund
NonmajorEnterprise
Funds Total
InternalServiceFunds
Cash flows from operating activities:Cash from customers $ 14,689 221,240 51,087 25,764 312,780 92,663Cash paid to employees (3,416) (31,925) (7,348) (9,829) (52,518) (17,547)Cash paid to suppliers (820) (114,159) (27,350) (10,694) (153,023) (64,194)
Net cash provided by operating activities 10,453 75,156 16,389 5,241 107,239 10,922
Cash flows from noncapital financing activities:Amounts received from other funds 560 6,375 - - 6,935 -Amounts paid to other funds - - (6,375) - (6,375) (560)Transfers out - (20,107) - (1,150) (21,257) (5,640)Transfers in - - 1,733 - 1,733 5,640Investments with fiscal agent - 991 - - 991 -Operating grants received - - 300 54 354 584Loans receivable - - - (55) (55) -
Net cash provided (used) by noncapital financing activities 560 (12,741) (4,342) (1,151) (17,674) 24
Cash flows from capital and relatedfinancing activities:Interest on long-term debt - (6,665) (2,706) - (9,371) (50)Principal payments and premiums - (229) (1,371) - (1,600) -Capital Lease - - - - - (259)Capital grants received - - - 5 5 -Acquisition of property, plant, gas
and equipment (15,979) (28,447) (6,465) (1,200) (52,091) (4,691)
Net cash (used) by capital and related financing activities (15,979) (35,341) (10,542) (1,195) (63,057) (5,000)
Cash flows from investing activities:Investment - gas/electric commodity - (397) - - (397) -Interest received 997 3,094 83 669 4,843 2,002
Net cash provided by investing activities 997 2,697 83 669 4,446 2,002
Net increase (decrease) in cash and cash equivalents (3,969) 29,771 1,588 3,564 30,954 7,948
Cash and cash equivalents at July 1 59,572 153,239 17,200 33,727 263,738 105,263
Cash and cash equivalents at June 30 $ 55,603 183,010 18,788 37,291 294,692 113,211
Business-type Activities - Enterprise Funds
(Continued) See accompanying notes to basic financial statements
43

Exhibit E-3CITY OF GLENDALEStatement of Cash FlowsProprietary FundsFiscal Year Ended June 30, 2016 (in thousands)
Sewer Fund
ElectricFund
Water Fund
NonmajorEnterprise
Funds Total
InternalServiceFunds
Business-type Activities - Enterprise Funds
Reconciliation of operating income (loss) tonet cash provided by operating activities:Operating income (loss) $ (1,088) 50,611 12,717 3,746 65,986 10,571Adjustments to reconcile operating
income to net cash provided (used)by operating activities:Depreciation 2,838 26,156 5,844 1,991 36,829 2,447Gas depletion - 933 - - 933 -Amortization 2,943 - - - 2,943 -Pension expense (227) (2,086) (645) (662) (3,620) -
(Increase) Decrease Accounts receivable net 143 (375) (12) 146 (98) (434)(Increase) Due from other funds - - (1,733) - (1,733) -(Increase) Decrease Inventories - 234 - - 234 (219)(Increase) Prepaid expenses - (1,113) - - (1,113) (2,254)(Increase) Deferred charges - (3,799) - - (3,799) -Increase Compensated absences - - - - - 1,166Increase(Decrease) Accounts payable 5,854 3,869 170 (14) 9,879 (551)Increase Due to other funds - - - - - 1,456Increase(Decrease) Deposits (10) 726 48 34 798 -(Decrease) Claims payable - - - - - (1,260)
Total adjustments 11,541 24,545 3,672 1,495 41,253 351
Net cash provided by operating activities $ 10,453 75,156 16,389 5,241 107,239 10,922
Noncash investing, capital,and financing activities:Increase in fair value of investments 471 1,433 13 315 2,232 988
See accompanying notes to basic financial statements
44

Exhibit F-1CITY OF GLENDALEStatement of Net PositionFiduciary FundJune 30, 2016 (in thousands)
Cash and investmentsCash and investments with fiscal agentRestricted cash and investmentsAccounts receivable, netLoans receivable
Property held for resale
Total current assets
LandBuildings and improvementsAccumulated depreciationConstruction in progress
Total noncurrent assets
Total assets
Deferred outflows of resources:Loss on refunding
Total assets and deferred outflows of resources
Current liabilities:Accounts payable and accrued liabilitiesInterest payableBonds payableUnamortized premium (discount)Loans payable to the City
Total current liabilities
Noncurrent liabilities:Bonds payableUnamortized premium (discount)Loans payable to the City
Total noncurrent liabilities
Total liabilities
Net position held in trust (deficit)
Current assets:
Assets and deferred outflows of resources
Noncurrent assets:
Liabilities and net position
Glendale Successor Agency
Private Purpose Trust Fund
$ 71,45816,007
2928
1,4221,442
90,386
105377
(235)13,314
13,561
103,947
2,978
106,925
1,127514
7,995861
12,511
23,008
89,7654,210
27,622
121,597
144,605
$ (37,680)
See accompanying notes to basic financial statements
45

Statement of Changes in Net PositionFiduciary Fund
Glendale Successor Agency
Private Purpose Trust Fund
Additions: Property tax $ 35,091 Interest income 283 Rental income 18
Total additions 35,392
Deductions: Interest and amortization expense on bonds 6,070 Depreciation 9 Operating expenses 1,122
Total deductions 7,201
Change in net position before special items and extraordinary loss 28,191
Special items:Proceeds from sale of property held for resale 2,375Reestablishing refunding reserve 2,081
Reinstatement of loans payable to City (32,363)Transfer of capital assets to the City (6,729)Transfer of capital assets to the developer (1,230)
Total special items (35,866)
Extraordinary loss (26,490)
Change in net position (34,165)
Net position held in trust (deficit), July 1 (3,515)
Net position held in trust (deficit), June 30 $ (37,680)
Fiscal Year Ended June 30, 2016 (in thousands)
Exhibit F-2CITY OF GLENDALE
See accompanying notes to basic financial statements
46