Embed Size (px)
Citation preview


© University of the Philippines and the Department of Science and Technology 2015
Published by the UP Training Center for Applied Geodesy and Photogrammetry (TCAGP)College of EngineeringUniversity of the Philippines DilimanQuezon City1101 PHILIPPINES
This research work is supported by the Department of Science and Technology (DOST) Grants-in-Aid Program and is to be cited as:
UP TCAGP (2015), DREAM Ground Survey for Cagayan River, Disaster Risk and Exposure Assessment for Mitigation (DREAM) Program, DOST Grants-In-Aid Program, 135 pp.
The text of this information may be copied and distributed for research and educational purposes with proper acknowledgment. While every care is taken to ensure the accuracy of this publication, the UP TCAGP disclaims all responsibility and all liability (including without limitation, liability in negligence) and costs which might incur as a result of the materials in this publication being inaccurate or incomplete in any way and for any reason.
For questions/queries regarding this report, contact:
Engr. Louie P. Balicanta, MAURPProject Leader, Data Validation Component, DREAM ProgramUniversity of the Philippines DilimanQuezon City, Philippines 1101Email: [email protected]
Enrico C. Paringit. Dr. Eng.Program Leader, DREAM ProgramUniversity of the Philippines DilimanQuezon City, Philippines 1101E-mail: [email protected]
National Library of the PhilippinesISBN: 978-971-9695-27-1
1 INTRODUCTION ......................................................................................................... 1.1 DREAM Program Overview .............................................................................. 1.2 Objectives and target outputs .......................................................................... 1.3 General methodological framework ................................................................2 The Cagayan River Basin .........................................................................................3 DVC Methodology ..................................................................................................... 3.1Pre-fieldPreparation.......................................................................................... 3.1.1 Preparation of Field Plan ........................................................................ 3.1.2 Collection of Reference Points .............................................................. 3.2 Field Surveys ..................................................................................................... 3.2.1 Control Survey ........................................................................................ 3.2.2 Cross-Section Survey .............................................................................. 3.2.3ProfileSurveys........................................................................................ 3.2.4 Bathymetric Survey ................................................................................ 3.2.5 Hydrometric Survey ............................................................................... 3.2.6 Validation Points Acquisition Survey ..................................................... 3.3 Data Processing ................................................................................................ 3.3.1 Collection of Raw Data ........................................................................... 3.3.2 Data Processing ...................................................................................... 3.3.3 Filtering of Data ..................................................................................... 3.3.4 Final Editing ............................................................................................ 3.3.5 Output ....................................................................................................4 Cagayan River Basin Survey ..................................................................................... 4.1 Control Survey ................................................................................................... 4.2 Reconnaissance of Cross-section ..................................................................... 4.3 Bathymetric Survey .......................................................................................... 4.3.1 Cagayan River Survey – Phase 1 ............................................................. 4.3.2 Cagayan River Survey – Phase 2 ............................................................ 4.3.3 Cagayan River Survey – Phase 3 ............................................................ 4.4 Hydrometric Survey .......................................................................................... 4.4.1 Sensor Deployment ................................................................................ 4.4.2 Sensor Data ............................................................................................ 4.5 Validation Points Acquisition Survey ................................................................
ANNEX A. SUMMARY OF AWLS SURVEY ..........................................................................ANNEX B. SURVEY TEAM ....................................................................................................ANNEX C. LIST OF EQUIPMENT AND INSTRUMENTS USED ..........................................ANNEX D. SUMMARY OF ACTIVITIES ................................................................................ANNEX E. PROBLEMS ENCOUNTERED AND SOLUTIONS APPLIED ..............................ANNEX F. NAMRIA CERTIFICATES .....................................................................................ANNEX G. ACKNOWLEDGMENTS ....................................................................................
Table of Contents
122359 11 11 1112 12131414151618191923232325294562646771747681110
113119121123126127134
List of Figures
Figure 1. The General Methodological Framework of the Program ................................Figure 2. Location Map of Cagayan River Basin ................................................................Figure 3. Soil Map of Cagayan River Basin ........................................................................Figure 4. Land Cover Map of Cagayan River Basin ............................................................Figure 5. DVC Main Activities .............................................................................................Figure 6. DVC Field Activities ..............................................................................................Figure 7. Flow Chart for Stage-Discharge Correlation Computation ...............................Figure 8. Setup for GNSS Surveys ......................................................................................Figure 9. DVC Data Processing Methodology ....................................................................Figure 10. Illustration of Echo Sounder and GPS rover set-up .......................................... for Bathymetric survey Figure 11. Extent of the initial Cagayan River Survey (September 16 – 30, 2013) .............Figure 12. Extent of Cagayan River Bathymetry and Ground Validation Survey ...............Figure 13. GNSS Network of the initial survey in Cagayan River Basin ..............................Figure 14. GNSS Network of Cagayan River Survey Phase 1 (March 17-April 6, 2014) .........Figure 15. GNSS receiver set up, Trimble® SPS 882 at SB-254 ........................................... at San Pablo Bridge in San Pablo, IsabelaFigure 16. Trimble® SPS 852 setup at CG-130 in Iguig, Cagayan .........................................Figure 17. GNSS base set up, Trimble® SPS 852 at CGY-56 ................................................. in Tuguegarao City, CagayanFigure 18. Trimble® SPS 985 setup at CGY-87 in Gattaran, Cagayan ..................................Figure 19. GNSS receiver set up, Trimble® SPS 882 at UP DAB-1 2014 ............................... atDelfinAlbanoBridge,DelfinAlbino,IsabelaFigure 20. Trimble® SPS 882 setup at DPWH-A 2012, ........................................................... at Buntun Bridge, Tuguegarao City, CagayanFigure 21. GNSS base set up, Trimble® SPS 882, ................................................................. at UP NAB-1 in Ninoy Aquino Bridge, Brgy. San Luis, Tuao, Cagayan Figure 22. Trimble® SPS 882 setup at UP PAR-1, at Pared Bridge, ...................................... Brgy. Pared, Alcala, CagayanFigure 23. GNSS base set up, Trimble® SPS 882, at UP DUM-1, .......................................... at Dummum Bridge in Gattaran, CagayanFigure 24. Trimble® SPS 882 setup at CG - 186, at Magapit Bridge, ................................... Brgy. Magapit, Lal-lo, CagayanFigure 25. GNSS Network of Cagayan River Survey Phase 2 ............................................... (January 29 to February 12, 2014)Figure 26. GNSS Network of Cagayan River Survey Phase 3 .............................................. (April 28 - May 8, 2014)Figure 27. GNSS receiver set up, Trimble® SPS 852 at QRN-32, .......................................... Brgy.LiwaywayDiffun,QuirinoFigure 28. Trimble® SPS 985 setup at CAU-1, Cauyan City Isabela ......................................Figure 29. GNSS receiver set up, Trimble® SPS 985 at ALICIA-1, Alicia, Isabela ...................Figure 30. Cross-section survey along Disiluad Bridge, Aglipay, Quirino ............................. during the initial Cagayan River Survey on September 16 – 30, 2013Figure 31. Cross-section survey along Disiluad Bridge, Bagabag, Nueva Viscaya ............... during the initial Cagayan River Survey on September 16 – 30, 2013Figure 32. CrossSectionsurveyalongDelfinAlbanoBridgeinDelfinAlbano,................... Isabela during Cagayan River Survey Phase 1 on March 17-April 6, 2014Figure 33. Cross Section survey along San Pablo Bridge in San Pablo, Isabela ................... during Cagayan River Survey Phase 1 on March 17-April 6, 2014
3678101216171820
2728303233
3334
3435
36
36
37
37
38
40
42
43
434445
46
46
47

List of Figures
Figure 34. Cross Section survey along Pared Bridge in Alcala, Cagayan ............................ during Cagayan River Survey Phase 1 on March 17-April 6, 2014Figure 35. Actual cross section survey in Mallig bridge during .......................................... Cagayan River Survey Phase 2 on January 29-February 12, 2014 (a) Gathering of data from the right bank of river (b) Gathering data for sensor elevationFigure 36. Cross section Survey during Cagayan River Survey Phase 3 .............................. on April 28 - May 8, 2014 at (a) Dalibubon Bridge and (b) President BridgeFigure 37. Abuan Bridge Cross-Section Diagram ................................................................Figure 38. Arkon Bridge Cross-Section Diagram ................................................................Figure 39. Batu Bridge Cross-Section Diagram ....................................................................Figure 40. Disiluad Bridge Cross-Section Diagram ..............................................................Figure 41. Gamu Bridge Cross-Section Diagram ..................................................................Figure 42. Lucban Bridge Cross-Section Diagram ...............................................................Figure 43. Magapit Bridge Cross-Section Diagram ..............................................................Figure 44. Aurora (Magat) Bridge Cross-Section Diagram ..................................................Figure 45. Malalam Bridge Cross-Section Diagram .............................................................Figure 46. Naguilian Bridge Cross-Section Diagram ............................................................Figure 47. San Josefa Bridge Cross-Section Diagram ..........................................................Figure 48. San Lorenzo Bridge Cross-Section Diagram .......................................................Figure 49. Sangbay Bridge Cross-Section Diagram .............................................................Figure 50. SiffuBridgeCross-SectionDiagram....................................................................Figure 51. Buntun Bridge Cross-Section Diagram ...............................................................Figure 52. Dummun Bridge Cross-Section Diagram ...........................................................Figure 53. Ninoy Aquino Bridge Cross-Section Diagram .....................................................Figure 54. Pared Bridge Cross-Section Diagram .................................................................Figure 55. San Pablo Bridge Cross-Section Diagram ...........................................................Figure 56. Timauini-DelfinAlbanoBridgeCross-SectionDiagram......................................Figure 57. Mallig Bridge Cross-Section Diagram .................................................................Figure 58. Dalibubon Bridge Cross-Section Diagram ..........................................................Figure 59. Ganano Bridge Cross-Section Diagram ...............................................................Figure 60. President Bridge Cross-Section Diagram ...........................................................Figure 61. Santiago Bridge Cross-Section Diagram ............................................................Figure 62. Extent of Bathymetric Survey in Cagayan River ................................................Figure 63. Bathymetric survey (Phase 1) setup with installed ............................................ Ohmex™ Single Beam Echosounder and mounted Trimble® SPS 882Figure 64. Bathymetry center line from the Municipality of Ilagan ................................... to Tumauni in IsabelaFigure 65. Bathymetry center line from the Municipality of Tumauni ............................... to Santo Tomas in IsabelaFigure 66. Bathymetry center line from the Municipality of Santo Tomas ....................... to San Pablo and Santa Maria in IsabelaFigure 67. Bathymetry center line from the Municipalities of Santa Maria ........................ and San Pablo in Isabela to the Municipality of Alcala in CagayanFigure 68. Bathymetry center line from the Municipality of Alcala ................................... to Solana and Iguig in CagayanFigure 69. Bathymetry center line from the Municipalities of Iguig and ............................ Solana to Amulung in CagayanFigure 70. Bathymetry center line from the Municipality of Amulung ............................. to Aparri in Cagayan
47
48
48
494950505151525253535454555556565757585859596060616364
64
65
65
66
66
67
67
List of Figures
Figure 71. Bathymetric survey at Magat River using portable boat ................................... borrowed from PDRRMC. (a) Assembling the boat in preparation for the survey (b) Gathering bathymetric data using OHMEX™ single beam echosounder with mounted Trimble® SPS 882Figure 72. Bathymetric survey at Ilagan River using portable boat .................................... borrowed from PDRRMC. (a) Assembling the boat in preparation for the survey (b) Gathering bathymetric data using OHMEX™ single beam echosounder with mounted Trimble® SPS 882Figure 73. Upstream of Magat River. (a) Carrying the portable boat ................................. because of shallow water. (b) Carrying the portable boat back to the site and initiated manual gathering.Figure 74. Bathymetric Survey of Cagayan River’s Major Tributaries ................................. – Magat and Ilagan RiversFigure 75. Bathymetric survey (Phase 3) setup on a boat .................................................. (a) Qurino and (b) IsabelaFigure 76. Bathymetry center line from Nagtipunan to Maddela in Quirino .......................Figure 77. Bathymetry center line from Maddela, Quirino to San Agustin, Isabela ............Figure 78. Bathymetry center line from San Agustin to Jones in Isabela ............................Figure 79. Bathymetry center line from Jones to Dalibubon in Isabela ...............................Figure 80. Bathymetry center line from Dalibubon to Alicia in Isabela ................................Figure 81. Bathymetry center line from Alicia to Angadanan in Isabela ..............................Figure 82. Bathymetry center line from Cauayan to Naguilian Bridge in Isabela ................Figure 83. Location of the deployed ADCP during the Cagayan River Survey .....................Figure 84. ADCP (vertical) and Depth Gauge Deployment at Malalam Bridge .................... with Philippine Coast GuardFigure 85. Retrieval of ADCP (vertical) at Malalam Bridge on September 29, 2013 ............Figure 86. ADCP and Depth Gauge Deployment along Gamu Bridge .................................Figure 87. ADCP and Depth Gauge Deployment along Magapit Bridge ............................. Figure 88. At Mallig River (a) setting up the ADCP (b) deployment of ADCP ..................... in Mallig River Figure 89. At Magat River (Aurora Bridge) (a) Setting up both Depth gauge .................... and ADCP (b) Deployment of ADCPFigure 90. Deployed ADCP at Malalam Bridge, Isabela ........................................................Figure 91. Deployed ADCP at Sangbay Bridge in Nagtipunan, Quirino ...............................Figure 92. Relationship between velocity and stage in Arkon Bridge ................................ within the observation periodFigure 93. Relationship between velocity and rainfall in Arkon Bridge .............................. within the observation periodFigure 94. Relationship between stage and rainfall in Arkon Bridge .................................. within the observation periodFigure 95. Relationship between stage and discharge in Arkon Bridge .............................. within the observation periodFigure 96. Relationship between velocity and stage in Batu Bridge ................................... within the observation periodFigure 97. Relationship between velocity and rainfall in Batu Bridge ................................ within the observation period
68
68
69
70
71
717272727373737576
77787879
79
808081
81
82
82
83
83

List of Figures
Figure 98. Relationship between stage and rainfall in Batu Bridge .................................... within the observation periodFigure 99. Relationship between stage and discharge in Batu Bridge ................................ within the observation periodFigure 100. Relationship between velocity and stage in Lucban Bridge .............................. within the observation periodFigure 101. Relationship between velocity and rainfall in Lucban Bridge ............................ within the observation periodFigure 102. Relationship between stage and rainfall in Lucban Bridge ................................ within the observation periodFigure 103. Relationship between stage and discharge in Lucban Bridge ........................... within the observation periodFigure 104. Relationship between velocity and stage in Magat (Aurora) Bridge ................. within the observation periodFigure 105. Relationship between velocity and rainfall in Magat (Aurora) Bridge ............... within the observation periodFigure 106. Relationship between stage and rainfall in Magat (Aurora) Bridge ................... within the observation periodFigure 107. Relationship between stage and discharge in Magat (Aurora) Bridge .............. within the observation periodFigure 108. Relationship between velocity and stage in Malalam Bridge ............................. within the observation periodFigure 109. Relationship between velocity and rainfall in Malalam Bridge .......................... within the observation periodFigure 110. Relationship between stage and rainfall in Malalam Bridge .............................. within the observation periodFigure 111. Relationship between stage and discharge in Malalam Bridge ......................... within the observation periodFigure 112. Relationship between velocity and stage in Sangbay Bridge ............................ within the observation periodFigure 113. Relationship between velocity and rainfall in Sangbay Bridge ........................... within the observation periodFigure 114. Relationship between stage and rainfall in Sangbay Bridge .............................. within the observation periodFigure 115. Relationship between stage and discharge in Sangbay Bridge ......................... within the observation periodFigure 116. RelationshipbetweenvelocityandstageinSiffuBridge................................... within the observation periodFigure 117. RelationshipbetweenvelocityandrainfallinSiffuBridge................................. within the observation periodFigure 118. RelationshipbetweenstageandrainfallinSiffuBridge..................................... within the observation periodFigure 119. RelationshipbetweenstageanddischargeinSiffuBridge................................. within the observation periodFigure 120. Relationship between velocity and stage in Buntun Bridge .............................. within the observation period
84
84
85
85
86
86
87
87
88
88
89
89
90
90
91
91
92
92
93
93
94
94
95

List of Figures
Figure 121. Relationship between velocity and rainfall in Buntun Bridge ............................ within the observation periodFigure 122. Relationship between stage and rainfall in Buntun Bridge ................................ within the observation periodFigure 123. Relationship between stage and discharge in Buntun Bridge ........................... within the observation periodFigure 124. Velocity time series data for Ninoy Aquino Bridge .............................................Figure 125. Relationship between velocity and stage in San Pablo Bridge .......................... within the observation periodFigure 126. Relationship between velocity and rainfall in San Pablo Bridge ........................ within the observation periodFigure 127. Relationship between stage and rainfall in San Pablo Bridge ............................ within the observation periodFigure 128. Relationship between stage and discharge in San Pablo Bridge ....................... within the observation periodFigure 129. Relationship between velocity and stage in Magat (Aurora) Bridge ................. within the observation periodFigure 130. Scatter plot showing the relationship between stage and ................................ discharge in Magat (Aurora) Bridge within the observation period Figure 131. Relationship between velocity and stage in Mallig Bridge ................................ within the observation periodFigure 132. Relationship between stage and discharge in Mallig Bridge .............................. within the observation periodFigure 133. RelationshipbetweenvelocityandstageinSiffuBridge................................... within the observation periodFigure 134. RelationshipbetweenstageanddischargeinSiffuBridge............................... within the observation periodFigure 135. Relationship between velocity and stage in Malalam Bridge ............................ within the observation periodFigure 136. Relationship between velocity and rainfall in Malalam Bridge .......................... within the observation periodFigure 137. Relationship between stage and rainfall in Malalam Bridge .............................. within the observation periodFigure 138. Relationship between stage and discharge in Malalam Bridge ......................... within the observation periodFigure 139. Relationship between velocity and stage in Naguilian Bridge ........................... within the observation periodFigure 140. Relationship between velocity and rainfall in Naguilian Bridge ......................... within the observation periodFigure 141. Relationship between stage and rainfall in Naguilian Bridge ............................ within the observation periodFigure 142. Relationship between stage and discharge in Naguilian Bridge ........................ within the observation periodFigure 143. Relationship between velocity and stage in Sangbay Bridge ............................ within the observation periodFigure 144. Relationship between velocity and rainfall in Sangbay Bridge .......................... within the observation period
95
96
96
9797
98
98
99
99
100
100
101
101
102
102
103
103
103
104
104
105
105
106
106

List of Figures
Figure 145. Relationship between stage and rainfall in Sangbay Bridge .............................. within the observation periodFigure 146. Relationship between stage and discharge in Sangbay Bridge ......................... within the observation periodFigure 147. Relationship between velocity and stage in ....................................................... Santiago (Calao) Bridge within the observation period Figure 148. Relationship between velocity and rainfall in ..................................................... Santiago (Calao) Bridge within the observation periodFigure 149. Relationship between stage and rainfall in ......................................................... Santiago (Calao) Bridge within the observation periodFigure 150. Relationship between stage and discharge in .................................................... Santiago (Calao) Bridge within the observation period Figure 151. Validation points acquisition survey extent in Cagayan River Basin ....................
107
107
108
108
109
109
111

Table 1. List of Control Points used in Cagayan River Survey Phase 1 ...................... 31Table 2. List of Control Points used in Cagayan River Survey Phase 2 ..................... 39Table 3. List of Control Points used in Cagayan River Survey Phase 3 ...................... 41
List of Tables

List of Abbreviations
ADCP AcousticDopplerCurrentProfilerARG Automated Rain GaugeAWLS Automated Water Level SensorBM BenchmarkBST Bathymetric Survey TeamCST Cross-Section TeamDAC Data Acquisition ComponentDEM Digital Elevation ModelDG Depth GaugeDOST Department of Science and TechnologyDPC Data Processing ComponentDREAM Disaster Risk and Exposure Assessment for MitigationDVC Data Validation ComponentEGM 2008 Earth Gravitation Model 2008FMC Flood Modeling ComponentGCP Ground Control PointGE Geodetic EngineerGIS Geographic Information SystemGNSS Global Navigation Satellite SystemGPS Global Positioning SystemHQ Curve Stage (H) and Discharge (Q)of River relationship curveLGUs Local Government UnitsLIDAR Light Detection and RangingMSL Mean Sea LevelNAMRIA National Mapping and Resource Information AuthorityPCG Philippine Coast GuardPDRRMC Provincial Disaster Risk Reduction Management CouncilPPA Philippine Ports AuthorityPPK Post Processed KinematicPST ProfileSurveyTeamRG Rain GaugeRINEX Receiver Independent ExchangeTBC Trimble Business CenterTCAGP Training Center for Applied Geodesy and PhotogrammetryTGBM Tidal Gauge BenchmarkUTM Universal Transverse MercatorWGS84 World Geodetic System 1984
1
Introduction
2
Introduction
1.1 DREAM Program Overview The UP training Center for Applied Geodesy and Photogrammetry (UP TCAGP) conducts a research program entitled “Nationwide Disaster Risk and Exposure Assessment for Mitigation” supported by the Department of Science and Technology (DOST) Grant-in-Aide Program. The DREAM Program aims to produce detailed, up-to-date, national elevation datasetfor3Dfloodandhazardmappingtoaddressdisasterriskreductionandmitigationinthe country.
The DREAM Program consists of four components that operationalize the various stages of implementation. The Data Acquisition Component (DAC) conducts aerial surveys to collect LiDAR data and aerial images in major river basins and priority areas. The Data Validation Component (DVC) implements ground surveys to validate acquired LiDAR data, along with bathymetric measurements to gather river discharge data. The Data Processing Component (DPC) processes and compiles all data generated by the DAC and DVC. Finally, the FloodModelingComponent(FMC)utilizescompileddataforfloodmodelingandsimulation.
Overall, the target output is a national elevation dataset suitable for 1:5000 scale mapping, with 50 centimeter horizontal and vertical accuracies, respectively. These accuracies are achieved through the use of state-of-the-art airborne Light Detection and Ranging (LiDAR) Systems collects point cloud data at a rate of 100,000 to 500,000 points per second, and is capable of collecting elevation data at a rate of 300 to 400 square kilometer per day, per sensor.
1.2 Objectives and target outputs The program aims to achieve the following objectives:
a. To acquire a national elevation and resource dataset at sufficient resolutionto produce information necessary to support the different phases of disastermanagement,b. Tooperationalizethedevelopmentoffloodhazardmodelsthatwouldproduceupdatedanddetailedfloodhazardmapsforthemajorriversystemsinthecountry,c. To develop the capacity to process, produce and analyze various proven and potential thematic map layers from the 3D data useful for government agencies,d. To transfer product development technologies to government agencies with geospatial information requirements, and,e. To generate the following outputs
1. floodhazardmap2. digital surface model 3. digital terrain model and4. orthophotograph

3
Introduction
1.3 General methodological framework The methodology employed to accomplish the project’s expected outputs are subdivided into four (4) major components, as shown in Figure 1. Each component is described in detail in the following sections.
Figure 1. The General Methodological Framework of the Program


5
MethodologyThe Cagayan River Basin

6
The Cagayan River Basin
The Cagayan River Basin is located in the north eastern part of Luzon. The Cagayan River Basin is considered as the largest river catchment in the Philippines with an area of 27,280 square kilometers. The location of Cagayan River Basin is as shown in Figure 2.
Figure 2. Location Map of Cagayan River Basin
It is characterized by a valley oriented north to south. The valley is bounded on the east by the Sierra Madre Mountains, on the west by the Cordillera Mountains, on the south by the Caraballo Mountains, and on the north by the coastline of the Babuyan Channel. The basin covers the provinces Quirino, Nueva Vizcaya, Ifugao, Mountain Province, Kalinga, Apayao, Isabela, and Cagayan.
It drains the northern portion of the island and traverses through Tuguegarao City and Cauayan City and the towns of Natipunan and Maddela in Quirino; San Mateo in Ifugao; San Agustin, Jones, Echague, Angadanan, Naguilian, San Mariano, Gamu, Benito Soliven and Ilagan, Tumauini, Santo, Tomas, Cabagan, Santa Maria and San Pablo in Isabela; and, Enrile, Solana, Iguig, Samulung, Alcala, Santo Niño, Gattaran, Lasam, Lal-lo, Camalaniugan and Aparri in Cagayan.
The average annual rainfall ranges from 1,000 millimeters in the northern part up to 3,000millimetersinthesouthernmountains.FloodscausedbytheCagayanRiverflowslowlybecauseofsurfaceretentionoverthefloodplain.CagayanValley isrelativelyflatandbasincoverage has a gentle slope. Also, there are retardations of flooding due to several rivermeanders and gorges.

7
The Cagayan River Basin
The land and soil characteristics are important parameters used in assigning the roughnesscoefficientfordifferentareaswithintheriverbasin.Theroughnesscoefficient,alsocalledManning’scoefficient,representsthevariableflowofwaterindifferentlandcovers(i.e.rougher,restrictedflowwithinvegetatedareas,smootherflowwithinchannelsandfluvialenvironments).
TheshapefilesofthesoilandlandcoverweretakenfromtheBureauofSoils,whichis under the Department of Environment and Natural Resources Management, and National Mapping and Resource Information Authority (NAMRIA). The soil and land cover of the Cagayan River Basin are shown in Figure 3 & Figure 4, respectively.
Figure 3. Soil Map of Cagayan River Basin

8
The Cagayan River Basin
Figure 4. Land Cover Map of Cagayan River Basin

9
DVCMethodology

10
DVC Methodology
A set of activities were designed and implemented by DVC with four (4) main activities as shown in Figure 5.
Figure 5. DVC Main Activities

11
DVC Methodology
3.1 Pre-fieldPreparation
3.1.1 Preparation of Field Plan
Theplanningforresearchfieldworkconsidersallthenecessarytechnicalandlogisticalconcernsconceptualizedinafieldplan.
This serves as a basis and guide of the survey team in the implementation of the fieldworkactivitiesandincludedthefollowingactivities:
• Delineation of bathymetry lines and determination of the river basin extent using Google Earth® images and available topographic maps;• Listing and preparation of the survey equipment and other materials needed;• DesignationoftaskstoDVCmembersforthefieldsurvey;• Approximation of field duration and cost based on the delineated surveyextent; and• Assessmentoftheinitialfieldplanbytheprogrammanagementforapprovaland implementation.
3.1.2 Collection of Reference Points
Technical data and other relevant information are collected from the National Mapping and Resource Information Authority (NAMRIA) such as locations and descriptions of established horizontal and vertical control points with a minimum of 2nd order accuracy. These ground control points and benchmarks are selected and occupied as primary reference points for the establishment of a GNSS network for the survey.

12
DVC Methodology
3.2 Field Surveys
Figure 6. DVC Field Activities
3.2.1 Control Survey
A GNSS network is established through occupation of reference points with dual frequency GNSS receivers for four (4) hours. Reference points from NAMRIA only bear vertical coordinates (z or elevation value) and horizontal coordinates (x and y values) for benchmarks and ground control points, respectively.
Control survey aims to provide both the horizontal and vertical position for every control point established through network adjustment. Horizontal position is acquired through static survey while establishment of vertical position can be done either using a Total Station (TS) or digital level or through static survey.
For the vertical position control survey using a TS or Level, a double run is carried out connecting the nearest existing NAMRIA benchmarks (BMs) to the control point. A double run consists of a forward run (from BM to GCP) and backward run (from GCP to BM). The accuracyshallbeassessedandacceptedifitiswithinthethirdorderdifferentiallevelingstan-dard.
A benchmark may be used to refer elevation data to Mean Sea Level (MSL) within 20-km radius. Additional benchmarks are located for survey areas exceeding this 20-km radius.
Establishment of a GNSS network through control survey is pre-requisite for the con-duct of other ground survey activities. Reference and control points occupied for the control survey may serve as base stations throughout the survey area.

13
DVC Methodology
3.2.2 Cross-section Survey
Theobjectiveofthisactivityistoderiveasectionalviewofthemainriverandthefloodplain (right and left banks). Cross-sections are surveyed perpendicular to the riverbanks with an average length of 100 meters for each bank. The cross-section line shall follow the path of the nearby road or goat trails with a 10-meter interval for each point measurement. Additional points are obtained to describe apparent change in elevation along the cross-section line. Eachcross-sectionisidentifiedsequentiallyfromupstreamtodownstreamdirection.
Cross-sectionsurveysaredoneusingdualfrequencyGNSSreceiversanddifferentialkinematic GNSS survey technique. The accuracy of the horizontal position and elevation of each individual cross-section surveys is within ±20 cm for horizontal and ±10 cm for vertical position residuals.
Areas where kinematic GNSS survey is not applicable due to the presence of obstructions such as tall structures and canopy of trees, conventional surveying techniques such as total stations and level are used to collect cross-sectional data.

14
DVC Methodology
3.2.3ProfileSurveys
Profilesurveysareconductedtoobtaintheupperandlowerbanksoftheriver.Thisdata is overlaid with LIDAR data to delineate the longitudinal extent of the river.
AprofilesurveyconsistsoftheLeftUpperBank(LUB)andLeftLowerBank(LLB),RightUpperBank(RUB)andRightLowerBank(RLB).Anintervalbetweensuccessiveprofilepointsis approximately 10 meters. Additional points are gathered to describe apparent change in elevationalongtheprofileline
Profile surveys are conducted using dual frequency GNSS receivers and kinematicsurvey technique with a prescribed vertical accuracies of ±20 cm for horizontal and ±10 cm for vertical position, respectively. Conventional surveying techniques such as total stations and levelareusedtocollectprofiledataforareaswherekinematicGNSSsurveyisnotapplicabledue to obstructions such as tall structures and canopy of trees.
3.2.4 Bathymetric Survey
Bathymetric survey is performed using a survey-grade single beam echo sounder capable of logging time-stamped depth value in centimeter and dual frequency GNSS using kinematic survey technique, with prescribed vertical accuracies of ±20 cm for horizontal and ±10 cm for vertical position for rivers navigable by boat. Data acquisition is logged at one second intervals both for GPS positions and elevation and echo sounder depth reading
For portions of the river that is not navigable by boat due to shallow waterless than a meter, riverbed may be acquired using manual bathymetric survey. Manual bathymetric survey means manually acquiring riverbed points without the use of an echo sounder. It can be done using a GPS receiver, Total Station or Level.

15
DVC Methodology
3.2.5 Hydrometric Survey
Hydrometric survey consists of deployment of flow gathering sensors in order toproduceaStage-Discharge(HQ)computationforspecificlocationsintheriversuchasinitsupstream, tributaries, and downstream. This is done to determine the behavior of the river givenspecificprecipitationlevels.
Theelementsofdischargecomputationaretheff.:
• River flow data – river flow data can be acquired using an Acoustic DopplerCurrentProfiler(ADCP)orbymechanicalordigitalflowmeters.Riverflowdatasensorsmeasurevelocityoftheriverforaspecifictimeperiodandinterval.• Cross-section data – cross section data is acquired using dual frequency GPS receivers to obtain the cross-section area of the river. Cross-section area of a river changesintimeasinfluencedbywaterlevelchange.• Waterlevelchange–water level change is measured using either a depth gauge or an Automated Water Level Sensor (AWLS) installed by DOST. Depth gauges relates pressuretowaterlevelchangewhileAWLSuseslaserpulsedatspecifictimeintervalsfor measurement.• Watersurfaceelevation–water surface elevation in MSL is measured near the banks of the river with dual frequency GPS receivers. This will refer the measured water level change to a corresponding elevation value in MSL in order to derive Stage or water level height a particular time.
Precipitationisthebiggestfactorinfluencingstageandrivervelocity.Thesetwo(2)sets of data must be synchronized by time in order to compute for its cross-section area, and subsequently, for discharge.
The element of time is crucial in determining the delay between the onset of precipitationandthetimeofsignificantwaterlevelchangealongkeypointsoftheriverforearlyfloodwarningsystemofcommunities.Thecorrelationofstage-dischargecomputationisusedforcalibratingflood-simulationprogramsutilizedbytheFloodModelingComponent(FMC).
The summary of elements for discharge computation is illustrated in Figure 7.

16
DVC Methodology
Figure 7. Flow Chart for Stage-Discharge Correlation Computation
3.2.6 Validation Points Acquisition Survey
Ground validation survey is conducted for quality checking purpose of the Aerial LiDAR data acquired by the Data Acquisition Component (DAC). A roving GNSS receiver is mounted on a range pole attached to a vehicle to gather points thru continuous topo method in a PPK SurveyTechnique.Pointsaremeasuredalongmajorroadsandhighwayacrosstheflightstripsprovided by DAC.
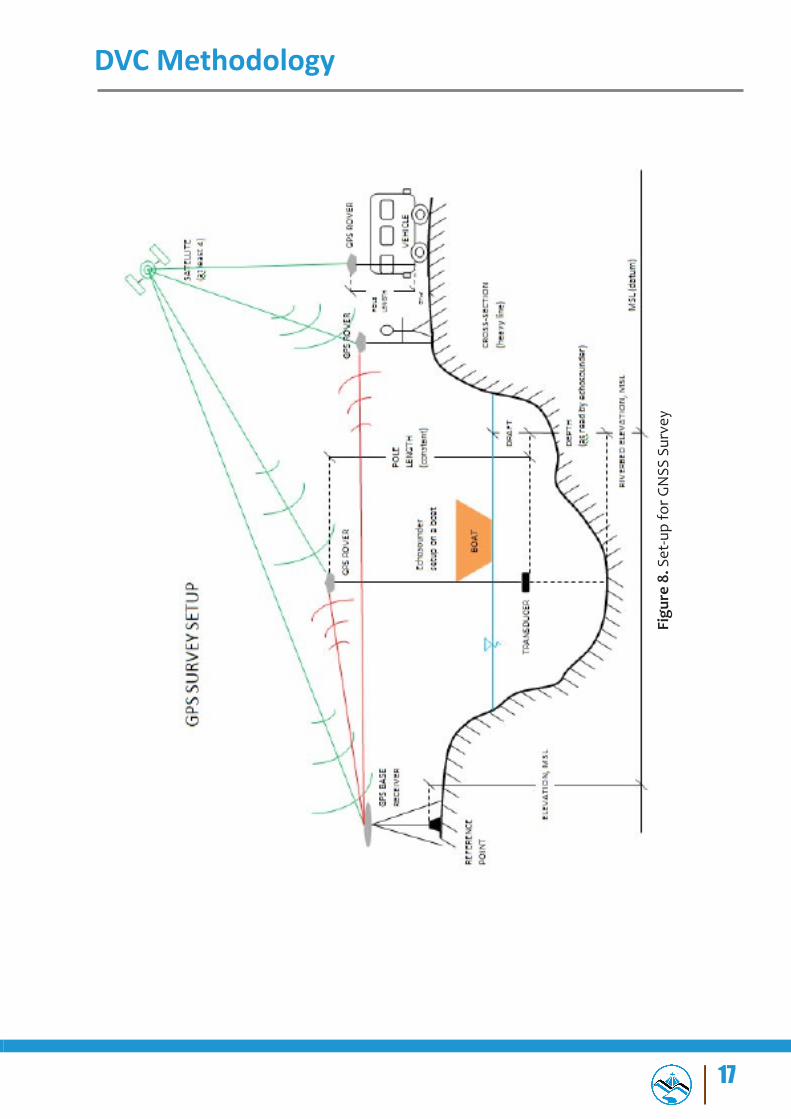
GNSSsurveyssetupusedtoaccomplishDVC’sfieldsurveyactivitiesareillustratedinFigure 8.
17
DVC Methodology
Figu
re 8
. Set
-up
for G
NSS
Sur
vey

18
DVC Methodology
Figu
re 9
. DVC
Dat
a Pr
oces
sing
Met
hodo
logy
3.3
Dat
a Pr
oces
sing
D
ata
proc
essi
ng p
roce
dure
s us
ed b
y D
VC a
re s
umm
ariz
ed in
Fig
ure
9.

19
DVC Methodology
3.3.1 Collection of Raw Data
GPS Raw data in (*.t02) format are downloaded from Trimble™ GPS receivers used in static, cross-section, LiDAR ground validation, and bathymetric surveys. Depth values in (*.som)filesfrombathymetricsurveysarealsodownloadedfromOHMEX®echosounder.
3.3.2 Data Processing
Processing for GNSS Data
The horizontal and vertical coordinates of the reference point used as base station are heldfixed,basedonitsNAMRIAcertification,fortheestablishmentofaGNSSnetworkforthesurveyarea.Coordinatesofthisfixedpointisusedtogivehorizontalandverticalcoordinatesfor the other reference points occupied and control points established.
Data from GNSS control surveys are processed in Trimble™ Business Center (TBC) software and settings were set to the required accuracy of +/-10cm for vertical and +/-20cm for horizontal controls. The TBC coordinate system parameters were set to Universal Transverse Mercator (UTM) Zone 51 North, World Geodetic System of 1984 (WGS1984), and the geoid model EGM2008 for horizontal and vertical datum, respectively.
AnoffsetisderivedbycomparingtheMSLelevationofthebenchmarkstatedintheNAMRIAcertificationanditselevationvaluethatresultedfromtheprocessedandadjustedcontrol survey.Thisoffset isusedto referallelevation fromothersurveys intoMSL(BM_Ortho).
TheformulasusedforoffsetandBM_OrthocomputationareshowninEquations1-2:
Computationforoffset: Equation 1:
OFFSET = BM - EGM
ComputationforBM_ortho:
Equation 2:
BM_ortho = EGM_ortho ± OFFSET

20
DVC Methodology
where:
OFFSET =difference/offsetbetweenGeoidmodel,EGM2008andMSL datum. Can be a positive or negative valueBM =MSLelevationofverticalcontrolpointcertifiedbyNAMRIAEGM = EGM2008 elevation of the same NAMRIA vertical control point derived from TBC software processingEGM_Ortho = elevation of points referred to geoid model, EGM 2008BM_Ortho = elevation of points referred to MSL
GNSS processing is also done for the other surveys with the coordinates from the occupiedpointsforthecontrolsurveyheldfixed,dependingonwhichbasestationisusedfor the survey.
Processedandadjusteddataareexportedtocommadelimited(*.csv)fileformatwiththeff.columns:PointName,Latitude,Longitude,EllipsoidalHeight,Northing,Easting,andElevation(EGM_Ortho).ThisfileformatcanbeaccessedthroughMicrosoftExcel/Spreadsheetprogram.
Depth Data Processing
Figure 10. Illustration of Echo Sounder and GPS rover set-up for Bathymetric survey
There are two types of echo sounders used for bathymetric surveys – Hi-Target™ single beam echo sounder which is capable of recording depth data of one decimal place and the OHMEX™ single beam echo sounder capable of recording two-decimal places of depth data.
RawdepthdatafromHi-Target™singlebeamechosounderisexportedin(*.txt)fileformatwiththeff.columns:PointNo.,Time,DepthsH,DepthsL,Draft,andSoundVelocity.This(*.txt)fileiscopiedtoaspreadsheet,retainingonlythecolumnsforTimeandDepthsH.
21
DVC Methodology
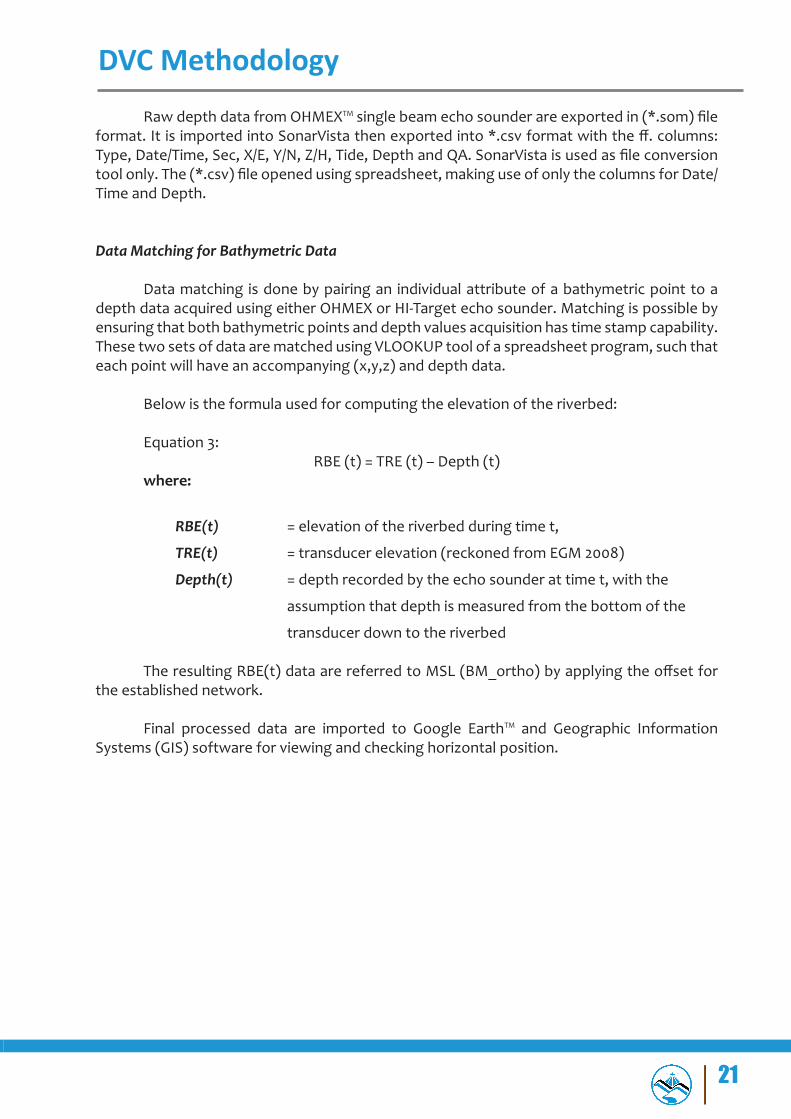
RawdepthdatafromOHMEX™singlebeamechosounderareexportedin(*.som)fileformat.ItisimportedintoSonarVistathenexportedinto*.csvformatwiththeff.columns:Type,Date/Time,Sec,X/E,Y/N,Z/H,Tide,DepthandQA.SonarVistaisusedasfileconversiontoolonly.The(*.csv)fileopenedusingspreadsheet,makinguseofonlythecolumnsforDate/Time and Depth.
Data Matching for Bathymetric Data
Data matching is done by pairing an individual attribute of a bathymetric point to a depth data acquired using either OHMEX or HI-Target echo sounder. Matching is possible by ensuring that both bathymetric points and depth values acquisition has time stamp capability. These two sets of data are matched using VLOOKUP tool of a spreadsheet program, such that each point will have an accompanying (x,y,z) and depth data.
Below is the formula used for computing the elevation of the riverbed:
Equation 3:RBE (t) = TRE (t) – Depth (t)
where:
RBE(t) = elevation of the riverbed during time t,
TRE(t) = transducer elevation (reckoned from EGM 2008)
Depth(t) = depth recorded by the echo sounder at time t, with the
assumption that depth is measured from the bottom of the
transducer down to the riverbed
TheresultingRBE(t)dataarereferredtoMSL(BM_ortho)byapplyingtheoffsetforthe established network.
Final processed data are imported to Google Earth™ and Geographic Information Systems (GIS) software for viewing and checking horizontal position.

22
DVC Methodology
Hydrometry Data Processing
TheprocessesdoneforHydrometrydataforHQcomputationaredescribedintheff.steps:
1. River Flow Data
a.) ADCP
Data from the ADCP is logged internally and can be downloaded using either SonUtils™ or View Argonaut™ software. River velocity is recorded for a specifiedtimedurationandintervalcanbeexportedina(*.csv)format.
b.) Flow Meter
Acquisitionofrivervelocityusingflowmetersisdonemanually.Measurementsforaspecifiedtimedurationandintervalisrecordedinafieldnotebookandsaved in a spreadsheet program.
2. Cross Section and Water Surface Elevation Data
Cross Section data and water surface elevation data is acquired using GNSS receiversdescribedinsection3.3.4forGNSSdataprocessingwitharesultingfilein (*.xls) format.
3. Water Level Change-Stage
a.) Depth Gauge
Data from depth gauge can be downloaded using HobowarePro™. Water levelinmetersareloggedforaspecifictimeintervalanditcanbeexportedin a (*.csv) format.
b.) AWLS
Data from installed AWLS can be accessed via the internet (http://repo.pscigrid.gov.ph/predict/). Water levels are logged in ten-minute time intervals and can be copied into a spreadsheet program.
4. Discharge Computation
Riverflowdataandwaterlevelchangeissynchronizedbytime.Parameterswerepreset in its respective programs so the deployment of each instrument will begin and end in the same time. All data in (*.csv) and (*.csv) format are combined in asingleworksheetwhereinthecomputationforthecoefficientofdeterminationor R2 are done.
The illustration in Figure 7 shows how each set of data from each instrument can be synchronized.

23
DVC Methodology
3.3.3 Filtering of Data
A processed pointwhich resulted to float or did notmeet the desired accuracy isfilteredout.Resurveysareconducted immediately ifdatagapsarepresentforthegroundsurveys.
3.3.4 Final Editing
Final editing is performed to be able to come up with the desired data format: Point Value, Latitude, Longitude, Ellipsoidal Height, Northing, Easting, EGM_Ortho and BM_Ortho.
Processes discussed are valid for static, cross section, ground validation, and manual bathymetric surveys not employing echo sounders. For bathymetric surveys using a single beam echo sounder, the GPS rover is mounted on top of a 2m pole and a transducer at the bottom (see Figure 10). Figure is valid in both using OHMEX and HI-Target echo sounders. The GPS rover provides horizontal and vertical coordinates whereas the echo sounder transducer measures depth of the river from its bottom down to the riverbed.
3.3.5 Output
Filtered data are furthered processed into desired template using a spreadsheet program.Finaldataaregenerated intomapsandCADplots for cross-section,profile, andriverbed profiles. Cross-section, Profile, Validation Points, and Bathymetric data shall beturned-over to DPC while hydrometric data shall be turned-over to FMC.

25
Cagayan RiverBasin Survey

26
Cagayan River Basin Survey
ThesurveyperformedinCagayanRiverBasinwascomprisedoffourfieldworksdueto logistical concerns such as availability of DVC personnel and equipment. These surveys were conducted on September 16 – 30, 2013 (Initial Survey), March 17-April 6, 2014 (Phase 1), January 29 to February 12, 2014 (Phase 2), and April 28 - May 8, 2014 (Phase 3).
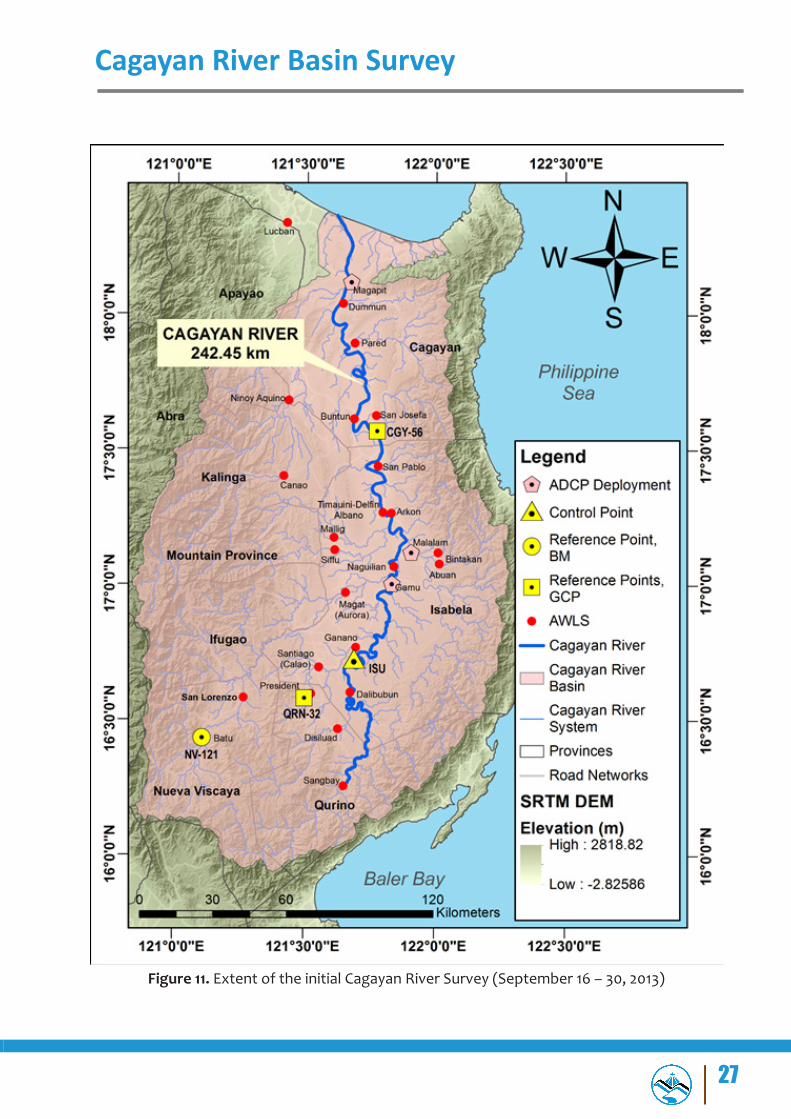
The initial survey included cross-sections, installation of ADCP and data gathering from deployed sensors of all bridges in the river basin with AWLS as shown in Figure 11. Datacollectionfromsensorswhichwerenotabletogivesufficientdataandcompletionofunaccomplished cross-section survey were designated to the remaining three (3) surveys.
Due to the huge length of Cagayan River, the bathymetry survey was divided into three (3)fieldworks.Anyphasementioneduntiltheendofthereportcorrespondstothe3phasesurvey for the bathymetry of Cagayan River.
Cagayan River Survey Phase 1 covered bathymetric survey starting from the Municipality of Ramon, Isabela down to the Municipality of Aparri, Cagayan; cross section and flowmeasurements surveys were also conducted in the AWLS of four (4) bridges in Cagayan and Isabela; and ground validation survey traversing the provinces of Cagayan down to Isabela.
The scope of the Cagayan River Survey Phase 2 included bathymetric survey of two principal tributaries of Cagayan River – Magat and Ilagan Rivers; cross section flowmeasurements surveys were also conducted in AWLS of three bridge; ground validation surveyfromRoxastoGamuandfromDelfinAlbanotoSanMariano;anddeploymentofADCPin two (2) bridges, all in the province of Isabela.
Last phase of the survey in Cagayan River covered a bathymetric survey from Quirino down to the the southern part of Isabela; cross section and flowmeasurements surveysin four (4) bridges; ground validation survey traversing Cordon to Maddela and Jones to Nagtipunan; and deployment of ADCP in two (2) bridges, all in Quirino and Isabela. The extent of the bathymetry survey for Cagayan River is summarized in Figure 12.
27
Cagayan River Basin Survey
Figure 11. Extent of the initial Cagayan River Survey (September 16 – 30, 2013)

28
Cagayan River Basin Survey
Figure 12. Extent of Cagayan River Bathymetry and Ground Validation Survey

29
Cagayan River Basin Survey
4.1 Control Survey Technical data and available information from NAMRIA relevant to the ground validation surveys were reviewed and retrieved. Coordination with NAMRIA was done to collect information on location and descriptions of established horizontal and vertical ground control points within or near the survey area. These control points were obtained because of their importance in the establishment of the network for the GNSS survey.
Continuousdifferential staticobservationsusingaTrimble®SPS852GNSSModularReceiver were done for at least three (3) hours in these stations. NAMRIA established control points such as reference points bear horizontal coordinates (Northing and Easting) whereas benchmarks bear vertical coordinate (Elevation in MSL). A static GNSS observation occupying these control points will tie their coordinates, so each control point will have its individual Northing, Easting, and Elevation in mean sea level (MSL). This provided coordinates for the newly established control point for ground and bathymetric surveys. The horizontal coordinates and elevations of these control points were derived using Trimble® Business Center GNSS processing software.
The initial control survey conducted in Cagayan River Basin on September 16 – 30, 2013 as exhibited in Figure 13 occupied Ground Control Point (GCP) QRN-32 at Brgy. Liwayway, Diffun,Quirino;aBenchmark(BM)NV-121inNuevaVizcaya;anotherGCP,CGY-56inCagayanand ISU, a UP-established control point inside Isabela State University as bases for GPS surveying.

30
Cagayan River Basin Survey
Figure 13. GNSS Network of the initial survey in Cagayan River Basin

31
Cagayan River Basin Survey
Cagayan River Survey – Phase 1 established two (2) GNSS networks on March 17-April 6,2014Thecontrolpointsconsideredforthesurveyareaaretheff.:SB-254intheMunicipalityof San Pablo (Figure 15); CGY-56 in Tuguegarao City (Figure 17); CG-130 in the Municipality of Iguig (Figure 16), and CGY-87 (Figure 18) in the Municipality of Gattaran. Additionally, baseline surveys were performed at the approach of the bridges with installed AWLS in Isabela and Cagayan, namely: Delfin Albano (Figure 19), Ninoy Aquino (Figure 21), Pared (Figure 22),Buntun (Figure 20), Dummun (Figure 23), and Magapit Bridges (Figure 24) in mainstream Cagayan River.
A summary of the control points used during the survey is shown in Table 1. The map on Figure14exhibitsthelocationofthecontrolpointsusedforCagayanRiverPhase1fieldwork.
Table 1. List of Control Points used in Cagayan River Survey Phase 1 (March 17-April 6, 2014)
Base Station Order of Accuracy Latitude Longitude Ellipsoidal
Height (m)CGY - 56 2nd order 17o34'07.37984" N 121o46'30.66402" E 75.522SB-254 1st order 17 o26'20.72161" N 121o46'43.82331" E 74.364CGY-87 2nd order 18o03'40.17189" N 121o38'43.36204" E 71.061CG-130 1st order 17o43'47.82677" N 121o44'20.02512" E 65.224DPWH
(UP Occupied) - 17o15'55.43093" N 121o49'57.14379" E 79.58

32
Cagayan River Basin Survey
Figure 14. GNSS Network of Cagayan River Survey Phase 1 (March 17-April 6, 2014)

33
Cagayan River Basin Survey
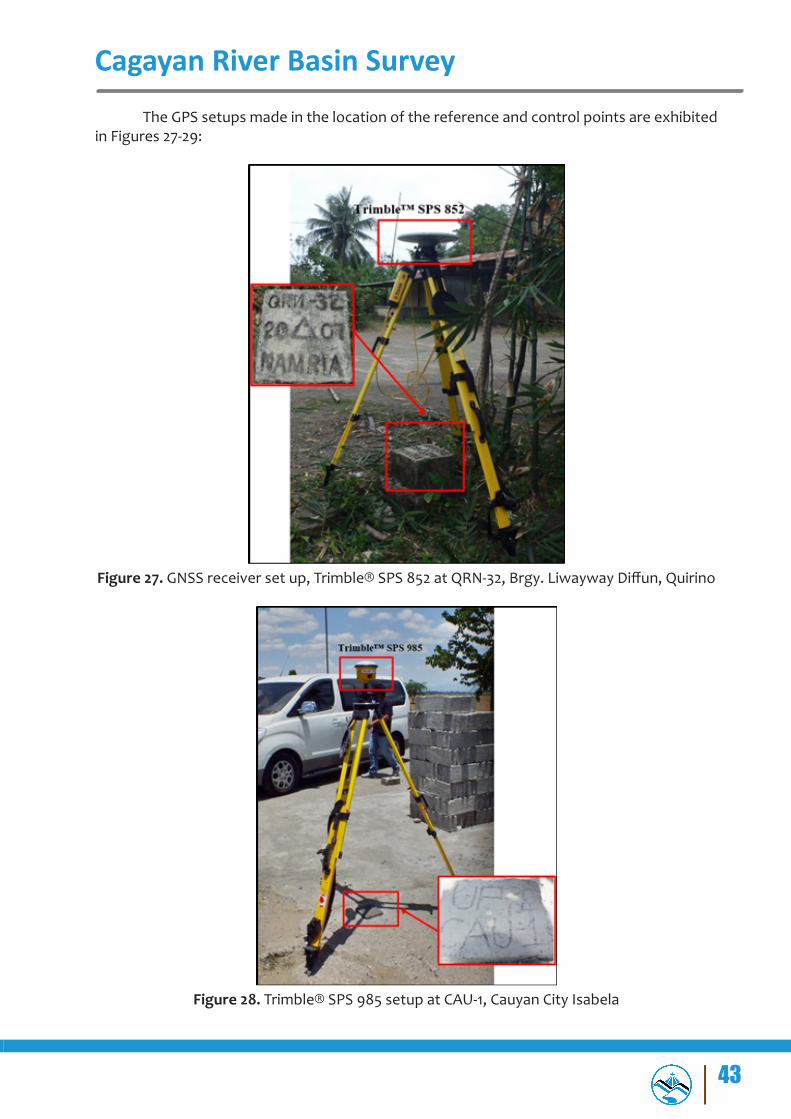
The GPS setups made in the location of the reference and control points are shown in Figures 15-18:
Figure 15. GNSS receiver set up, Trimble® SPS 882 at SB-254 at San Pablo Bridge in San Pablo, Isabela
Figure 16. Trimble® SPS 852 setup at CG-130 in Iguig, Cagayan

34
Cagayan River Basin Survey
Figure 17. GNSS base set up, Trimble® SPS 852 at CGY-56 in Tuguegarao City, Cagayan
Figure 18. Trimble® SPS 985 setup at CGY-87 in Gattaran, Cagayan

35
Cagayan River Basin Survey
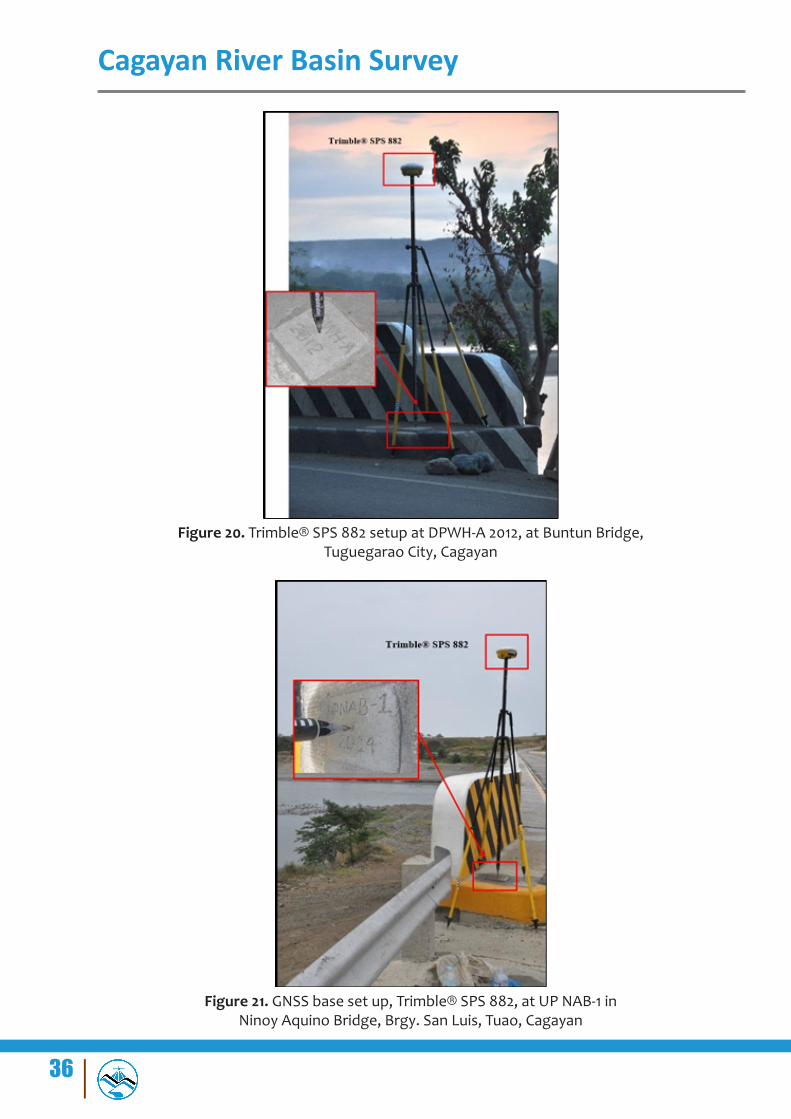
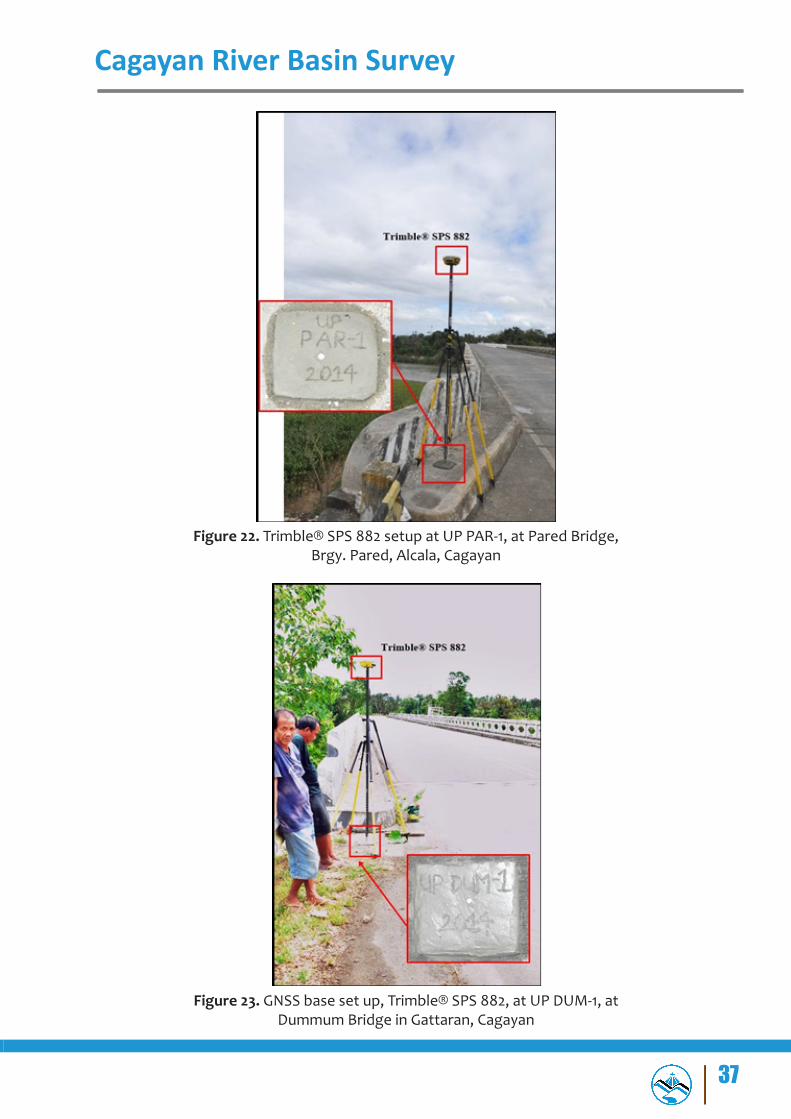
The following images from Figures 19-24 show the UP established control points at the approachofDelfinAlbano,Buntun,NinoyAquino,Pared,Dummun,andMagapitBridges.
Figure 19. GNSS receiver set up, Trimble® SPS 882 at UP DAB-1 2014 at DelfinAlbanoBridge,DelfinAlbino,Isabela
36
Cagayan River Basin Survey
Figure 20. Trimble® SPS 882 setup at DPWH-A 2012, at Buntun Bridge, Tuguegarao City, Cagayan
Figure 21. GNSS base set up, Trimble® SPS 882, at UP NAB-1 in Ninoy Aquino Bridge, Brgy. San Luis, Tuao, Cagayan
37
Cagayan River Basin Survey
Figure 22. Trimble® SPS 882 setup at UP PAR-1, at Pared Bridge, Brgy. Pared, Alcala, Cagayan
Figure 23. GNSS base set up, Trimble® SPS 882, at UP DUM-1, at Dummum Bridge in Gattaran, Cagayan

38
Cagayan River Basin Survey
Figure 24. Trimble® SPS 882 setup at CG - 186, at Magapit Bridge, Brgy. Magapit, Lal-lo, Cagayan

39
Cagayan River Basin Survey
The second phase for Cagayan River Survey was conducted on January 29 – February 12, 2014.ThecontrolpointsrecoveredandoccupiedforthisfieldworkwereQRN-32,a2nd-orderGCPinBrgy.Liwayway,Diffun,QuirinoProvince;ISB-3452,a3rd-orderGCPinBrgy.Poblacion,San Mateo, Isabela; NV-121, a 1st-order BM in Brgy. Sto. Domingo, Bayombong, Nueva Viscaya and GAMU, an established point located in Brgy. Buenavista in Gamu, Isabela.
AsummaryofthecontrolpointsusedduringthesurveyisshowninTable2.Adifferencein elevation of 3.3741 meters between geoid (EGM2008) and MSL values of the reference point NV-121 was applied for referring the elevation of the control points to MSL. The map on Figure25showsthelocationofthecontrolpointsusedforCagayanRiverPhase2fieldwork.
Table 2. List of Control Points used in Cagayan River Survey Phase (January 29 to February 12, 2014)
Control Point
Order of Accuracy Latitude Longitude
Ellipsoid Height,
(m)
Northing, (m)
Easting, (m)
EGMOrtho 2008
BMOrtho
QRN-32 2nd Order 16d34'53.28043" 121d30'02.16602" 162.778 1833853 340033.8 118.993 115.6189ISB-3452 3rd order 16d52'45.49631" 121d35'23.48074" 123.601 1866740 349791.2 81.642 78.2679NV-121 1st order 16d25’58.01266” 121d06’33.3337” 354.481 1817751 298117 309.095 305.7209GAMU Established 17d03'59.46646” 121d50'28.09859” 90.137 1887280 3766844 48.877 45.5029

40
Cagayan River Basin Survey
Figu
re 2
5. G
NSS
Net
wor
k of
Cag
ayan
Riv
er S
urve
y Ph
ase
2 (J
anua
ry 2
9 to
Feb
ruar
y 12
, 201
4

41
Cagayan River Basin Survey
Thelastfieldwork,Phase3,conductedinCagayanRiverBasinwasheldonApril28-May 8, 2014. Static survey was conducted among the following control points: QRN-32 (Figure 30) located at Brgy. Liwayway Diffun, Quirino; QRN-40 situated at Villa Agullana, the UPestablished control points, CAU-1 (Figure 31), SNP-1; and ALICIA-1 (Figure 32) While benchmark NV-121,whichwasoccupiedasbaseinthepreviousfieldworklastSeptember16-30,2013,wasused to tie with QRN-32 to refer the AWLS elevation to MSL.
AsummaryofthecontrolpointsusedduringthesurveyisshowninTable3.Adifferencein elevation of 3.3741 meters between geoid (EGM2008) and MSL values of the reference point NV-121 was applied for referring the elevation of the control points to MSL. The map on Figure26showsthelocationofthecontrolpointsusedforCagayanRiverPhase2fieldwork.
Table 3. List of Control Points used in Cagayan River Survey Phase 3 (April 28 - May 8, 2014)
Control Point
Order of Accuracy Latitude Longitude
Ellipsoid Height,
(m)
Northing, (m)
Easting, (m)
EGMOrtho 2008
BMOrtho
CAU-1 3rd Order 16d57'14.22297" 121d47'04.65121" 86.949 1874861 370591.9 45.565 42.1909ISB-126 2nd Order 16d45'25.25196" 121d36'50.37015" 118.036 1853190 352267.9 75.555 72.1809QRN-32 2nd Order 16d34'53.28044" 121d30'02.16601" 162.778 1833853 340033.8 118.993 115.6189QRN-40 2nd Order 16d15'02.32851" 121d42'11.92719" 502.369 1797100 361429.7 457.354 453.9799
SNP-1 3rd Order 16d21'01.17958" 121d42'07.61455" 195.573 1808129 361371.8 150.976 147.6019ALICIA-1 3rd Order 16d47'01.57111" 121d42'11.38556" 109.747 1856087 361793.2 67.566 64.1919NV-121 1st order 16d25’58.01266” 121d06’33.3337” 354.481 1817751 298117 309.095 305.7209

42
Cagayan River Basin Survey
Figu
re 2
6. G
NSS
Net
wor
k of
Cag
ayan
Riv
er S
urve
y Ph
ase
3 (A
pril
28 -
May
8, 2
014)
43
Cagayan River Basin Survey
The GPS setups made in the location of the reference and control points are exhibited in Figures 27-29:
Figure 27. GNSSreceiversetup,Trimble®SPS852atQRN-32,Brgy.LiwaywayDiffun,Quirino
Figure 28. Trimble® SPS 985 setup at CAU-1, Cauyan City Isabela

44
Cagayan River Basin Survey
Figure 29. GNSS receiver set up, Trimble® SPS 985 at ALICIA-1, Alicia, Isabela

45
Cagayan River Basin Survey
4.2 Reconnaissance of Cross-section Cross-section survey is necessary to compute the discharge of the river. In order for the data of AWLS be usable, cross-section elevation were obtained and referred to MSL. Acquired cross-section and water surface elevation from AWLS, will eventually produce cross-sectional area. This cross-sectional area varies the water level changes thru time. Combining cross-sectional area with river velocity will obtain discharge. These discharge data will be plugged in tothefloodsimulationprogramtocreatefloodscenarios.
Ocular inspection and cross-section measurements of most of the bridges with AWLS inCagayanRiverSystemwasconductedintheinitialfieldworkonSeptember16–30,2013.Forthosebridgesthatwerenotabletobemeasuredwasresurveyedonthenextfieldworks.
Each cross-section lines were located using handheld GPS (Garmin Montana™ 650). Summaryof reconnaissance for the24 cross-sectionsare shown in thenextfigures.Reconnaissanceforprofilelineswereconductedsimultaneouslywiththebathymetricsurveys.
Examples of cross-section survey conducted are exhibited in Figures 30-36.
Figure 30. Cross-section survey along Disiluad Bridge, Aglipay, Quirino during the initial Cagayan River Survey on September 16 – 30, 2013

46
Cagayan River Basin Survey
Figure 31. Cross-section survey along Disiluad Bridge, Bagabag, Nueva Viscaya during the initial Cagayan River Survey on September 16 – 30, 2013
Figure 32. CrossSectionsurveyalongDelfinAlbanoBridgeinDelfinAlbano,IsabeladuringCagayan River Survey Phase 1 on March 17-April 6, 2014

47
Cagayan River Basin Survey
Figure 33. Cross Section survey along San Pablo Bridge in San Pablo, Isabela during Cagayan River Survey Phase 1 on March 17-April 6, 2014
Figure 34. Cross Section survey along Pared Bridge in Alcala, Cagayan during Cagayan River Survey Phase 1 on March 17-April 6, 2014

48
Cagayan River Basin Survey
Figure 35. Actual cross section survey in Mallig bridge during Cagayan River Survey Phase 2 on January 29-February 12, 2014 (a) Gathering of data from the right bank of river (b)
Gathering data for sensor elevation
Figure 36. Cross section Survey during Cagayan River Survey Phase 3 on April 28 - May 8, 2014 at (a) Dalibubon Bridge and (b) President Bridge
All the data gathered from cross-section surveys were processed and visualized using AutoCAD. Cross-section diagrams of measured bridges are shown in Figures 37-61.

49
Cagayan River Basin Survey
Figure 37. Abuan Bridge Cross-Section Diagram
Figure 38. Arkon Bridge Cross-Section Diagram

50
Cagayan River Basin Survey
Figure 39. Batu Bridge Cross-Section Diagram
Figure 40. Disiluad Bridge Cross-Section Diagram

51
Cagayan River Basin Survey
Figure 41. Gamu Bridge Cross-Section Diagram
Figure 42. Lucban Bridge Cross-Section Diagram

52
Cagayan River Basin Survey
Figure 43. Magapit Bridge Cross-Section Diagram
Figure 44. Aurora (Magat) Bridge Cross-Section Diagram

53
Cagayan River Basin Survey
Figure 45. Malalam Bridge Cross-Section Diagram
Figure 46. Naguilian Bridge Cross-Section Diagram

54
Cagayan River Basin Survey
Figure 47. San Josefa Bridge Cross-Section Diagram
Figure 48. San Lorenzo Bridge Cross-Section Diagram

55
Cagayan River Basin Survey
Figure 49. Sangbay Bridge Cross-Section Diagram
Figure 50.SiffuBridgeCross-SectionDiagram
56
Cagayan River Basin Survey
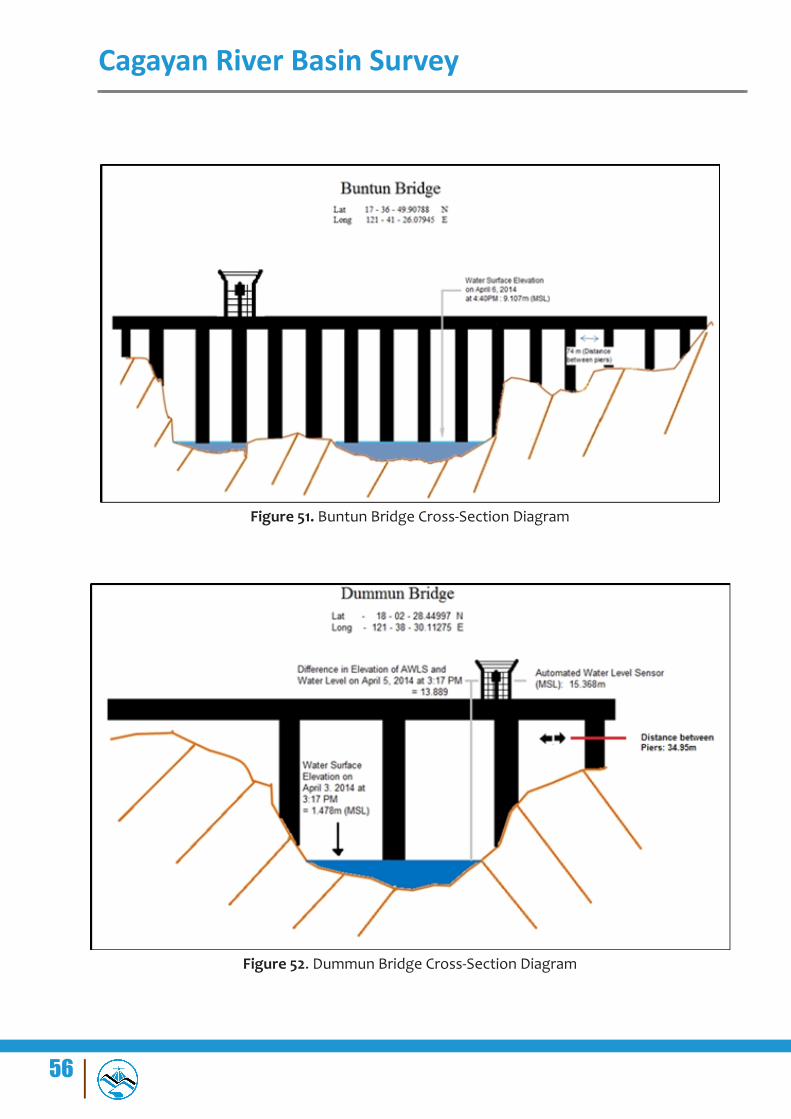
Figure 51. Buntun Bridge Cross-Section Diagram
Figure 52. Dummun Bridge Cross-Section Diagram

57
Cagayan River Basin Survey
Figure 53. Ninoy Aquino Bridge Cross-Section Diagram
Figure 54. Pared Bridge Cross-Section Diagram

58
Cagayan River Basin Survey
Figure 55. San Pablo Bridge Cross-Section Diagram
Figure 56. Timauini-DelfinAlbanoBridgeCross-SectionDiagram

59
Cagayan River Basin Survey
Figure 57. Mallig Bridge Cross-Section Diagram
Figure 58. Dalibubon Bridge Cross-Section Diagram

60
Cagayan River Basin Survey
Figure 59. Ganano Bridge Cross-Section Diagram
Figure 60. President Bridge Cross-Section Diagram

61
Cagayan River Basin Survey
Figure 61. Santiago Bridge Cross-Section Diagram

62
Cagayan River Basin Survey
4.3 Bathymetric Survey Thebathymetryoftheriverchannelwassurveyedusinganechosounder.DifferentialGNSS surveying technique using survey grade GNSS Receivers and an Ohmex™ single beam echosounder were utilized in measuring the depth, eventually obtaining elevation with corresponding horizontal position.
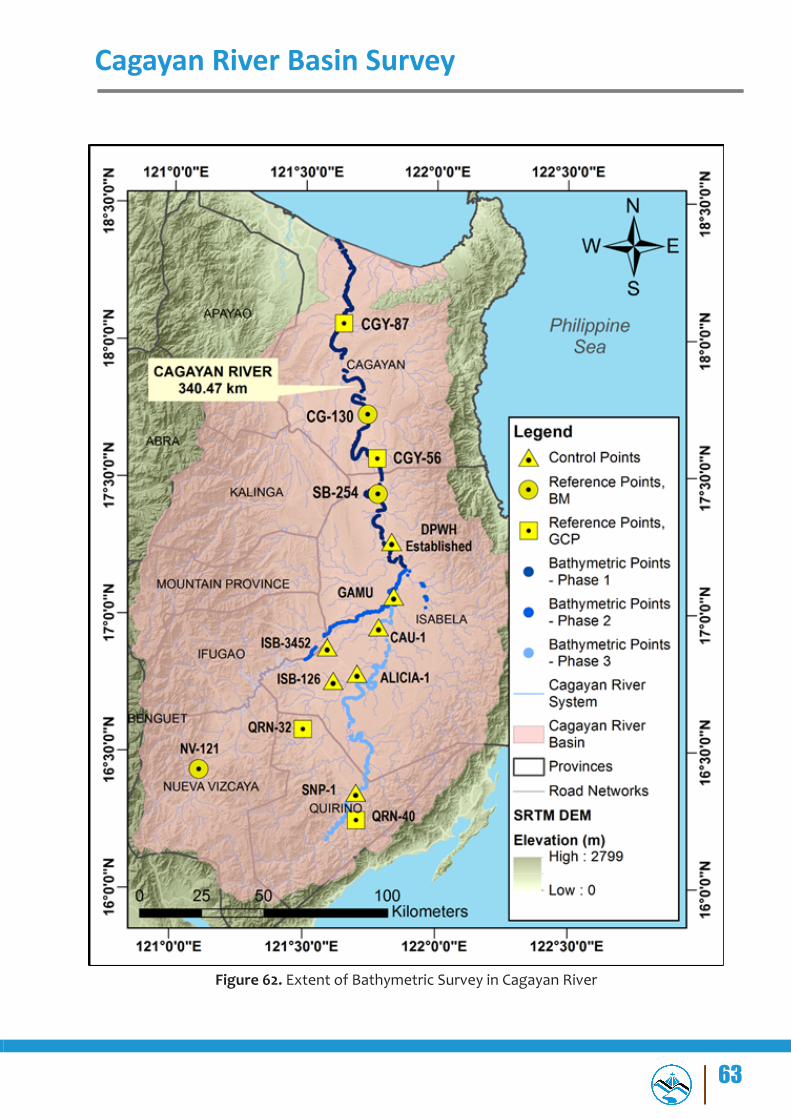
BathymetricsurveyoftheentireCagayanRiverSystemwasdividedintothreedifferentfieldworks.ThefirstphasecoveredtheprovinceofCagayanandcentralIsabela.Thesecondphase involved only the major tributary rivers of Cagayan River, which are Magat and Ilagan Rivers. The last phase included the remaining part of Cagayan River from central Isabela to Quirino. Extent of bathymetric survey conducted is exhibited in Figure 62.
63
Cagayan River Basin Survey
Figure 62. Extent of Bathymetric Survey in Cagayan River

64
Cagayan River Basin Survey
4.3.1 Cagayan River Survey – Phase 1
During March 17-April 6, 2014, this phase of bathymetric survey started from the Municipality of Ilagan in Isabela down to its mouth in Aparri in Cagayan. The team sought assistance from PDRRMC Cagayan and Isabela for boat and manpower prior the execution of the survey. It took ten (10)days tofinish the204.58kmcenterlinebathymetric survey.Sample boat setup is exhibited in Figure 63 and riverbed centerline profiles are shown in Figures 64-70.
Figure 63. Bathymetric survey (Phase 1) setup with installed Ohmex™ Single Beam Echosounder and mounted Trimble® SPS 882
Figure 64. Bathymetry center line from the Municipality of Ilagan to Tumauni in Isabela

65
Cagayan River Basin Survey
Figure 65. Bathymetry center line from the Municipality of Tumauni to Santo Tomas in Isabela
Figure 66. Bathymetry center line from the Municipality of Santo Tomas to San Pablo and Santa Maria in Isabela
66
Cagayan River Basin Survey
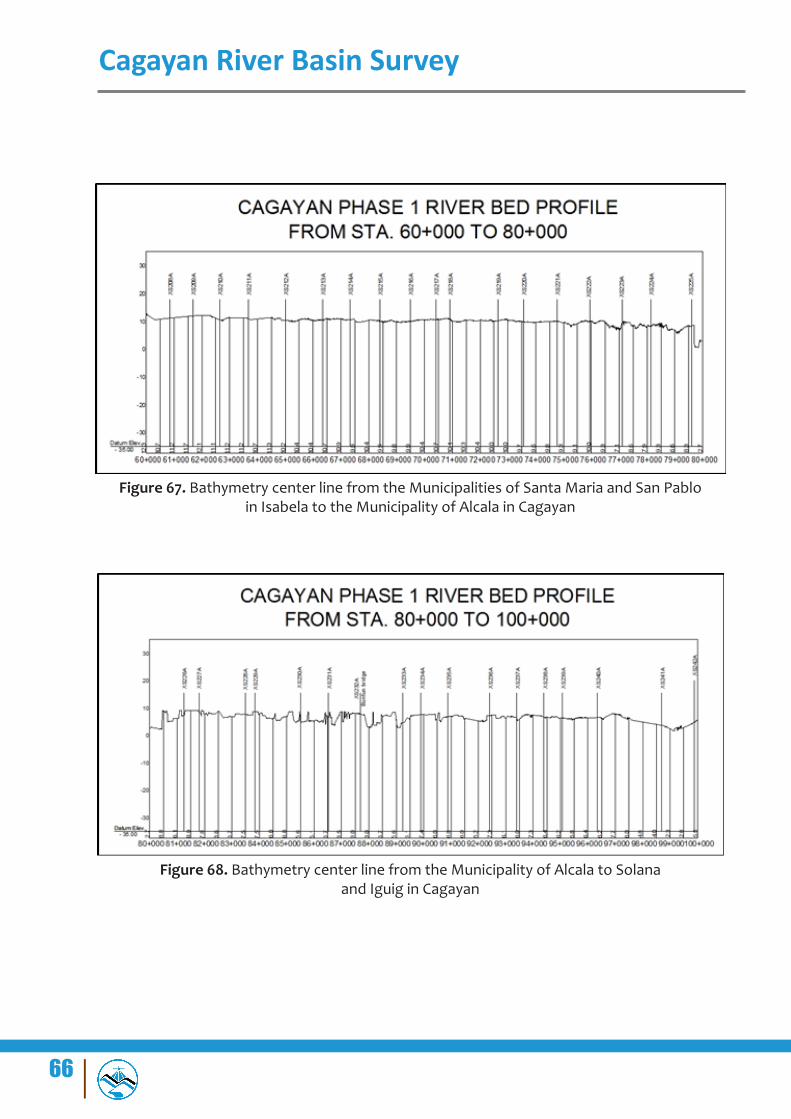
Figure 67. Bathymetry center line from the Municipalities of Santa Maria and San Pablo in Isabela to the Municipality of Alcala in Cagayan
Figure 68. Bathymetry center line from the Municipality of Alcala to Solana and Iguig in Cagayan

67
Cagayan River Basin Survey
Figure 69. Bathymetry center line from the Municipalities of Iguig and Solana to Amulung in Cagayan
Figure 70. Bathymetry center line from the Municipality of Amulung to Aparri in Cagayan
4.3.2 Cagayan River Survey – Phase 2
This phase of bathymetric survey was conducted on January 29 - February 12, 2014 and covered the major tributaries of Cagayan River, Magat and Ilagan Rivers. Magat River was surveyed from Magat Dam which is about 71.10 km before merging with Cagayan River. It is on the western portion of the mainstream. On the other hand, Ilagan River survey started from the Municipality of San Mariano, Isabela, about 39.11 km upon merging with the Cagayan River. It lies on the eastern part of the mainstream
The survey teams sought for an assistance from the Provincial Disaster Risk Reduction and Management Council (PDRRMC) of Isabela headed by Mr. Edmund A. Guzman. The Council lent four (4) portable boat with outboard motor. The teams were accompanied with four (4) personnel of PDRRMC. Sample boat setup is exhibited in Figures 71-73 and a much closer-look at the extent of this bathymetric survey is shown in Figure 74.

68
Cagayan River Basin Survey
Figure 71. Bathymetric survey at Magat River using portable boat borrowed from PDRRMC. (a) Assembling the boat in preparation for the survey (b) Gathering bathymetric data using
OHMEX™ single beam echosounder with mounted Trimble® SPS 882
Figure 72. Bathymetric survey at Ilagan River using portable boat borrowed from PDRRMC. (a) Assembling the boat in preparation for the survey (b) Gathering bathymetric data using
OHMEX™ single beam echosounder with mounted Trimble® SPS 882
Upstream of Magat River is shallow and mostly dry. Quarry activities are dominant along the river. Manual gathering of bathymetry data was initiated. The downstream of the Magat River is navigable. Using single beam echosounder is applicable in this area.

69
Cagayan River Basin Survey
Figure 73. Upstream of Magat River. (a) Carrying the portable boat because of shallow water. (b) Carrying the portable boat back to the site and initiated manual gathering.

70
Cagayan River Basin Survey
Figu
re 7
4. B
athy
met
ric S
urve
y of
Cag
ayan
Riv
er’s
Maj
or T
ribut
arie
s –
Mag
at a
nd Il
agan
Riv
ers

71
Cagayan River Basin Survey
4.3.3 Cagayan River Survey – Phase 3
This phase of bathymetric survey was conducted on April 28 - May 8, 2014 and covered the remaining survey portions of Cagayan River from Nagtipunan, Quirino down to Naguilian, Isabela with a length of 135.89 km. Sample boat setup is exhibited in Figure 75 and riverbed centerlineprofilesareshowninFigure76-82.
Figure 75. Bathymetric survey (Phase 3) setup on a boat (a) Qurino and (b) Isabela
Figure 76. Bathymetry center line from Nagtipunan to Maddela in Quirino

72
Cagayan River Basin Survey
Figure 77. Bathymetry center line from Maddela, Quirino to San Agustin, Isabela
Figure 78. Bathymetry center line from San Agustin to Jones in Isabela
Figure 79. Bathymetry center line from Jones to Dalibubon in Isabela

73
Cagayan River Basin Survey
Figure 80. Bathymetry center line from Dalibubon to Alicia in Isabela
Figure 81. Bathymetry center line from Alicia to Angadanan in Isabela
Figure 82. Bathymetry center line from Cauayan to Naguilian Bridge in Isabela

74
Cagayan River Basin Survey
4.4 Hydrometric Survey Hydrometric survey consists of deployment of flow gathering sensors in order toproduceaStage-Discharge(HQ)computationforspecificlocationsintheriversuchasinitsupstream, tributaries, and downstream. For Cagayan River, deployment of ADCP sensors was done in six (6) bridges. All gathered data were processed to produce a statistical output that determinesthebehaviorofCagayanRiverindifferentlocationsinspecificamountofrainfall.The locations of these sensors are exhibited in Figure 83.

75
Cagayan River Basin Survey
Figure 83. Location of the deployed ADCP during the Cagayan River Survey

76
Cagayan River Basin Survey
4.4.1 Sensor Deployment
The deployed sensors were left on the site to continuously collect data while being monitored by a group of temporarily employed local hires. The sensors were checked every day especially during and after rainfall events to ensure the safety of the equipment as well as downloading of data for safekeeping in case of unforeseen events.
DuringtheinitialfieldworkonSeptember16–30,2013,three(3)ADCPsweredeployed.Side Looking ADCP with Depth Gauges were deployed in Gamu and Magapit Bridges while a Vertical ADCP with Depth Gauge was deployed in Malalam Bridge.
Vertical ADCP with Depth Gauge was deployed along Malalam Bridge on September 20, 2013 with the aid of the Philippine Coast Guard. The ADCP and depth gauge was then retrieved on September 29, 2013, after nine (9) days. Setting up of vertical ADCP at Malalam bridge are shown in Figures 84-85.
Figure 84. ADCP (vertical) and Depth Gauge Deployment at Malalam Bridge with Philippine Coast Guard
77
Cagayan River Basin Survey
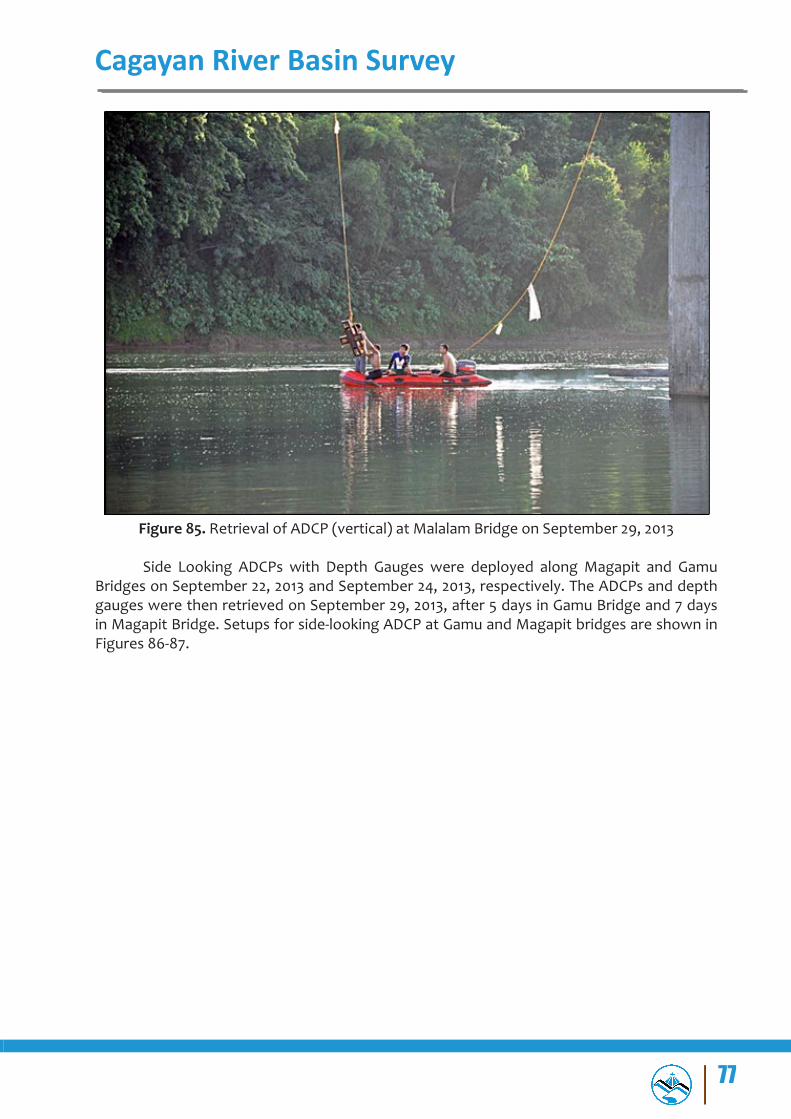
Figure 85. Retrieval of ADCP (vertical) at Malalam Bridge on September 29, 2013
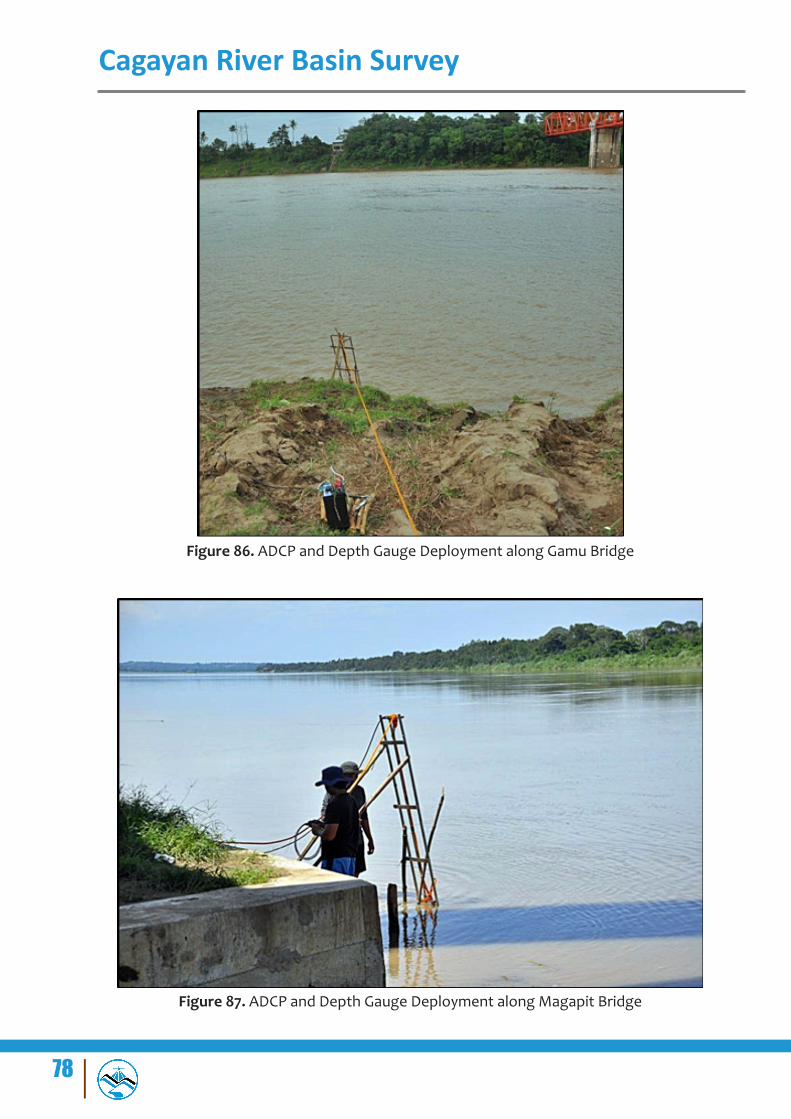
Side Looking ADCPs with Depth Gauges were deployed along Magapit and Gamu Bridges on September 22, 2013 and September 24, 2013, respectively. The ADCPs and depth gauges were then retrieved on September 29, 2013, after 5 days in Gamu Bridge and 7 days in Magapit Bridge. Setups for side-looking ADCP at Gamu and Magapit bridges are shown in Figures 86-87.
78
Cagayan River Basin Survey
Figure 86. ADCP and Depth Gauge Deployment along Gamu Bridge
Figure 87. ADCP and Depth Gauge Deployment along Magapit Bridge

79
Cagayan River Basin Survey
On January 29 - February 12, 2014, Cagayan River Survey Phase 2 included two (2) deployment of side-looking ADCP in Mallig and Aurora Bridges. The setup of these deployed sensors are exhibited in Figure 88-89.
Figure 88. At Mallig River (a) setting up the ADCP (b) deployment of ADCP in Mallig River
Figure 89. At Magat River (Aurora Bridge) (a) Setting up both Depth gauge and ADCP (b) Deployment of ADCP

80
Cagayan River Basin Survey
On April 28 - May 8, 2014, Cagayan River Survey Phase 3 included two (2) deployment of side-looking ADCP in Malalam and Sangbay Bridges. The setup of these deployed sensors are exhibited in Figure 90-91.
Figure 90. Deployed ADCP at Malalam Bridge, Isabela
Figure 91. Deployed ADCP at Sangbay Bridge in Nagtipunan, Quirino

81
Cagayan River Basin Survey
4.4.2 Sensor Data
All the data involving river flow, cross-section,water level change andwater levelelevation were process to come up with Stage-Discharge (HQ) computation. Diagrams showingthebehavioroftheriverforspecificlocationsareshowninFigure92-150.
Hydrometry data for following bridges, Figure 92-119, were acquired during the initial survey for Cagayan River.
Arkon Bridge – Timauini, Isabela
Figure 92. Relationship between velocity and stage in Arkon Bridge within the observation period
Figure 93. Relationship between velocity and rainfall in Arkon Bridge within the observation period
82
Cagayan River Basin Survey
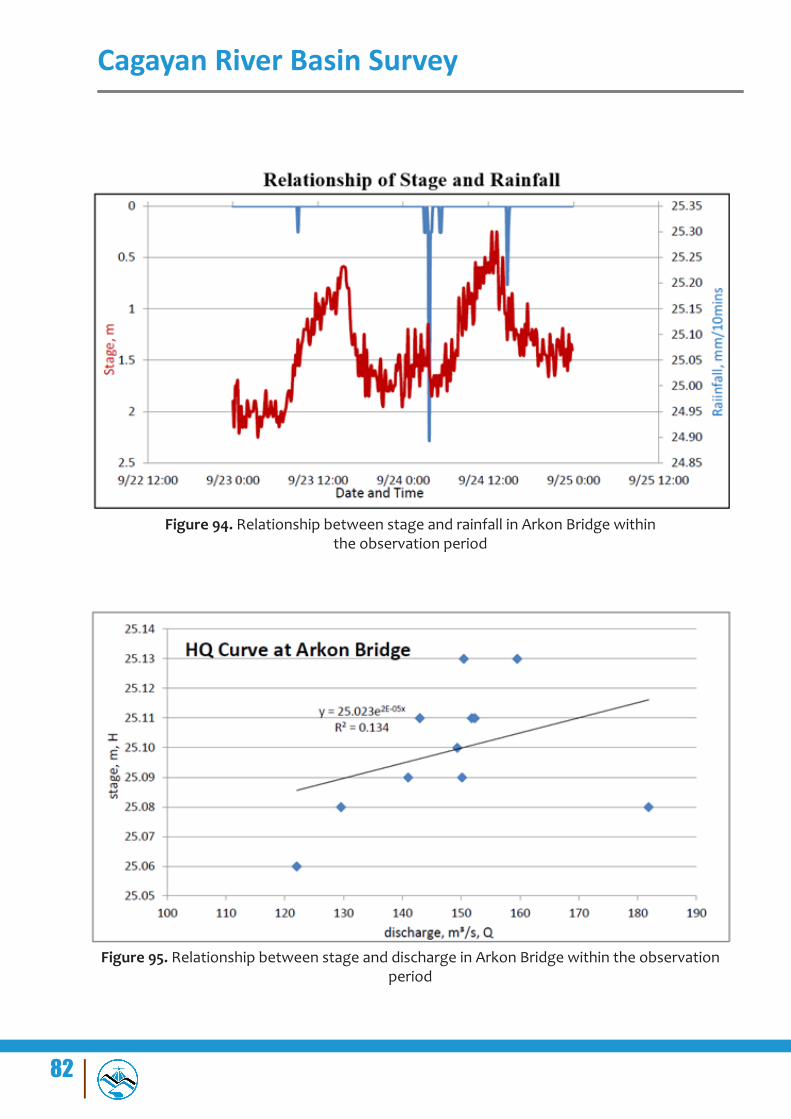
Figure 94. Relationship between stage and rainfall in Arkon Bridge within the observation period
Figure 95. Relationship between stage and discharge in Arkon Bridge within the observation period

83
Cagayan River Basin SurveyBatu Bridge – Bayombong, Nueva Vizcaya
Figure 96. Relationship between velocity and stage in Batu Bridge within the observation period
Figure 97. Relationship between velocity and rainfall in Batu Bridge within the
observation period

84
Cagayan River Basin Survey
Figure 98. Relationship between stage and rainfall in Batu Bridge within the observation period
Figure 99. Relationship between stage and discharge in Batu Bridge within the observation period
85
Cagayan River Basin Survey
Lucban Bridge – Abulug, Cagayan
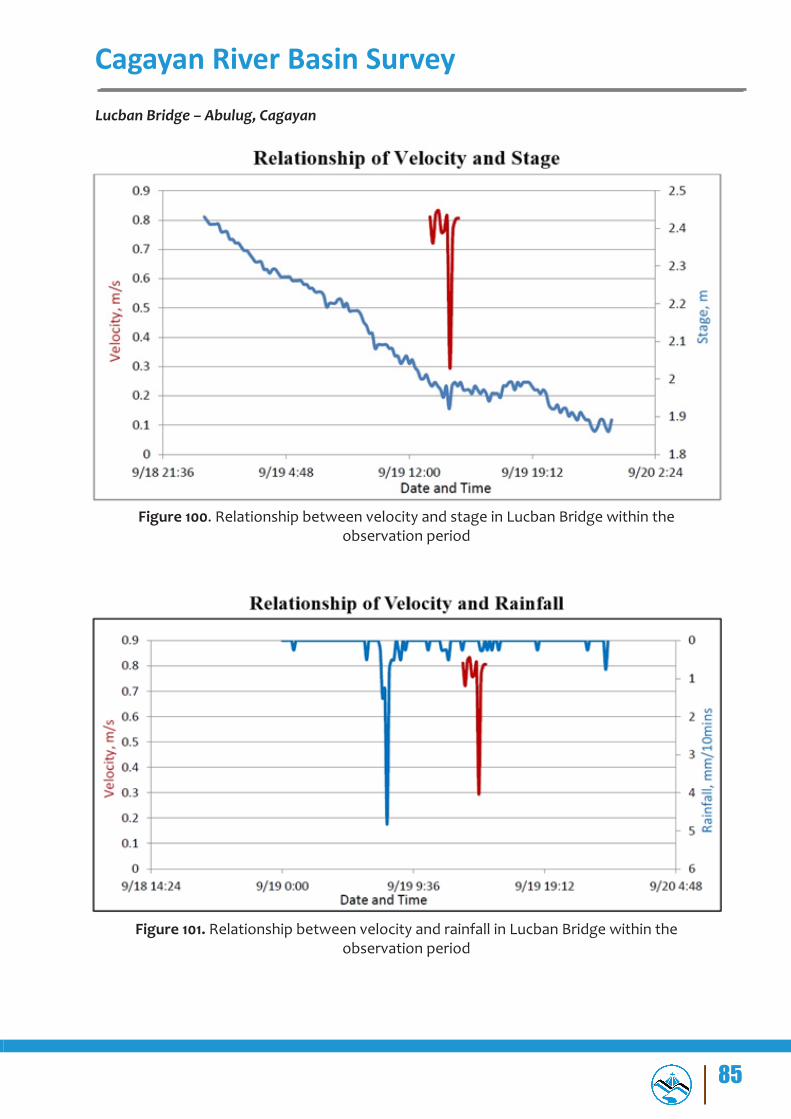
Figure 100. Relationship between velocity and stage in Lucban Bridge within the observation period
Figure 101. Relationship between velocity and rainfall in Lucban Bridge within the observation period

86
Cagayan River Basin Survey
Figure 102. Relationship between stage and rainfall in Lucban Bridge within the observation period
Figure 103. Relationship between stage and discharge in Lucban Bridge within the observation period

87
Cagayan River Basin Survey
Magat (Aurora) Bridge – Aurora, Isabela
Figure 104. Relationship between velocity and stage in Magat (Aurora) Bridge within the observation period
Figure 105. Relationship between velocity and rainfall in Magat (Aurora) Bridge within the observation period
88
Cagayan River Basin Survey
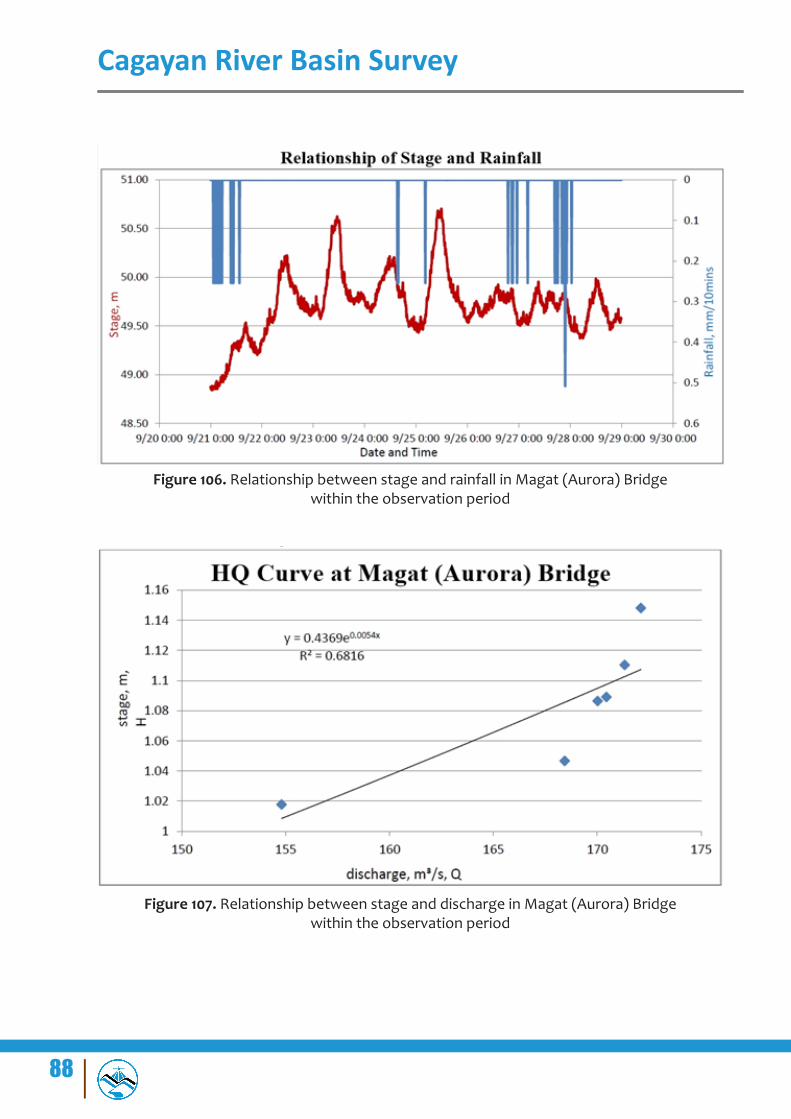
Figure 106. Relationship between stage and rainfall in Magat (Aurora) Bridge within the observation period
Figure 107. Relationship between stage and discharge in Magat (Aurora) Bridge within the observation period

89
Cagayan River Basin Survey
Malalam Bridge – Ilagan, Isabela
Figure 108. Relationship between velocity and stage in Malalam Bridge within the observation period
Figure 109. Relationship between velocity and rainfall in Malalam Bridge within the observation period

90
Cagayan River Basin Survey
Figure 110. Relationship between stage and rainfall in Malalam Bridge within the observation period
Figure 111. Relationship between stage and discharge in Malalam Bridge within the observation period

91
Cagayan River Basin Survey
Sangbay Bridge – Maddela, Quirino
Figure 112. Relationship between velocity and stage in Sangbay Bridge within the observation period
Figure 113. Relationship between velocity and rainfall in Sangbay Bridge within the observation period
92
Cagayan River Basin Survey
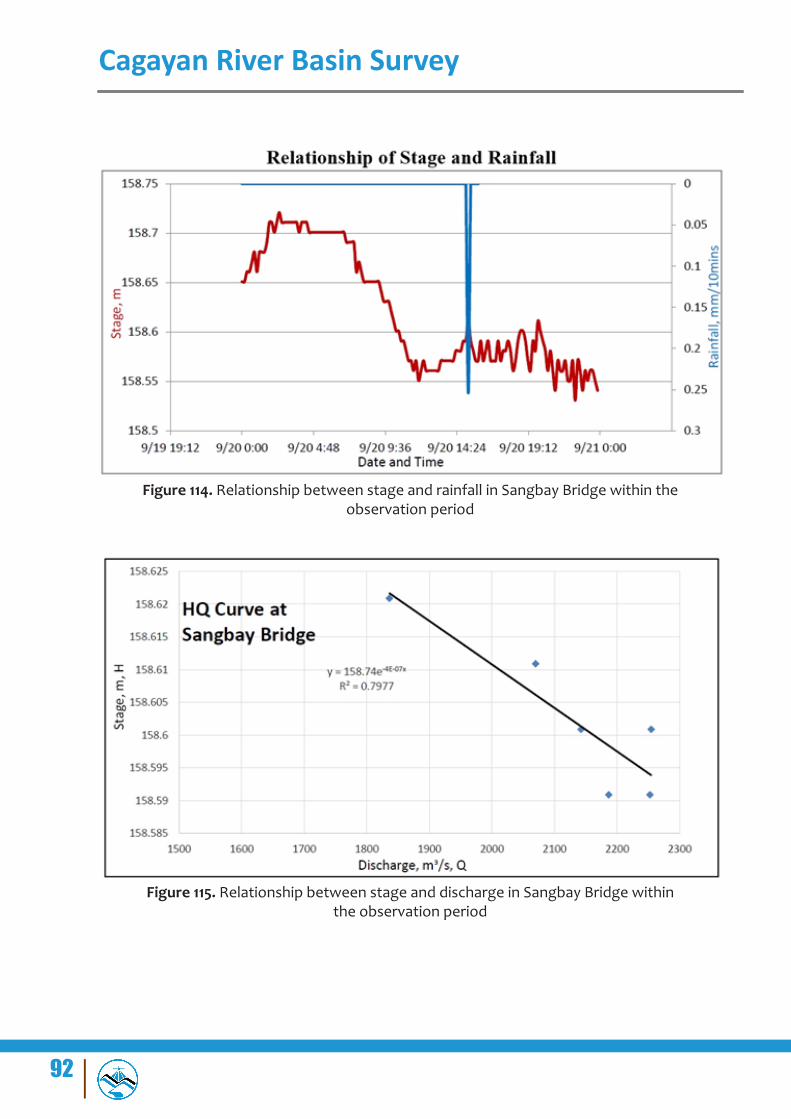
Figure 114. Relationship between stage and rainfall in Sangbay Bridge within the observation period
Figure 115. Relationship between stage and discharge in Sangbay Bridge within the observation period

93
Cagayan River Basin Survey
Siffu Bridge – Roxas, Isabela
Figure 116.RelationshipbetweenvelocityandstageinSiffuBridgewithintheobservation period
Figure 117.RelationshipbetweenvelocityandrainfallinSiffuBridgewithinthe observation period
94
Cagayan River Basin Survey
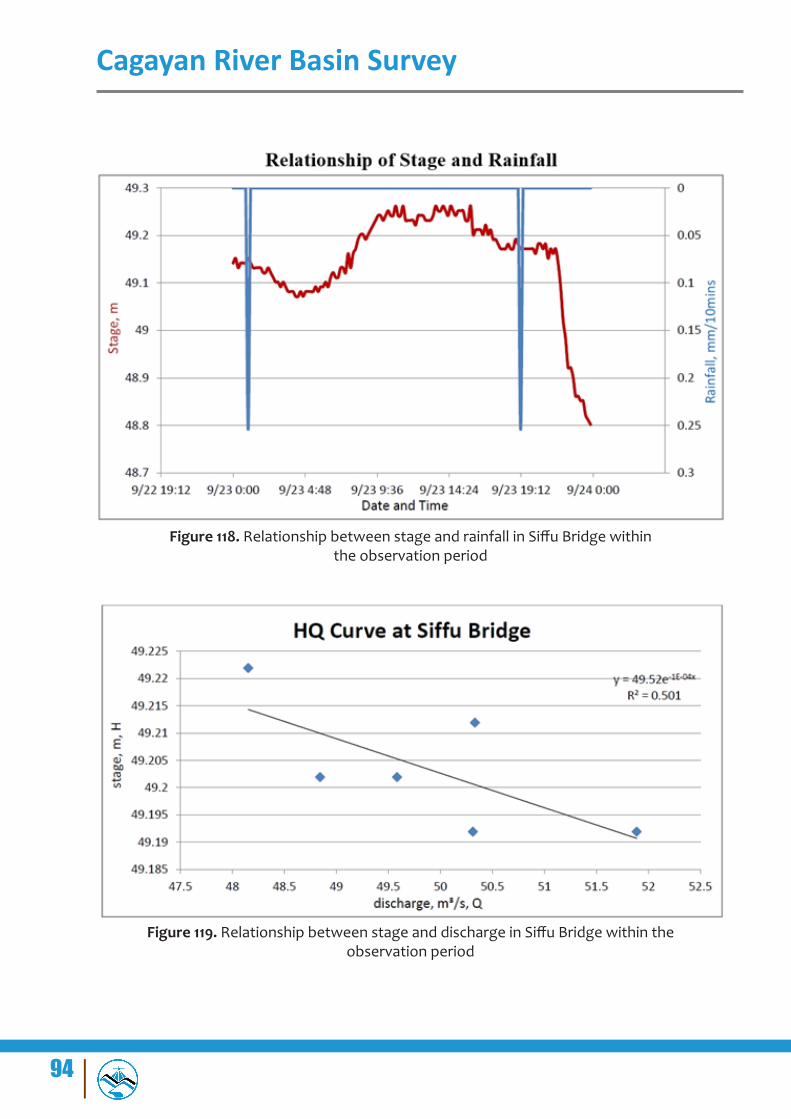
Figure 118. RelationshipbetweenstageandrainfallinSiffuBridgewithinthe observation period
Figure 119. RelationshipbetweenstageanddischargeinSiffuBridgewithintheobservation period

95
Cagayan River Basin Survey
Hydrometry data for following bridges, Figure 120-128, were acquired during Cagayan River Survey Phase 1
Buntun Bridge – Tuguegarao City, Cagayan
Figure 120. Relationship between velocity and stage in Buntun Bridge within the observation period
Figure 121. Relationship between velocity and rainfall in Buntun Bridge within the observation period

96
Cagayan River Basin Survey
Figure 122. Relationship between stage and rainfall in Buntun Bridge within the observation period
Figure 123. Relationship between stage and discharge in Buntun Bridge within the observation period

97
Cagayan River Basin Survey
Ninoy Aquino Bridge - Tuao, Cagayan
HQ Curve for Ninoy Aquino Bridge was not able to generate because no water level data was read by the sensor by the time of acquisition of river velocity data.
Figure 124. Velocity time series data for Ninoy Aquino Bridge
San Pablo Bridge - San Pablo, Isabela
Figure 125. Relationship between velocity and stage in San Pablo Bridge within the observation period

98
Cagayan River Basin Survey
Figure 126. Relationship between velocity and rainfall in San Pablo Bridge within the observation period
Figure 127. Relationship between stage and rainfall in San Pablo Bridge within the observation period

99
Cagayan River Basin Survey
Figure 128. Relationship between stage and discharge in San Pablo Bridge within the observation period
Hydrometry data for following bridges, Figure 129-134, were acquired during Cagayan River Survey Phase 2.
Magat (Aurora) Bridge – Aurora, Isabela
Figure 129. Relationship between velocity and stage in Magat (Aurora) Bridge within the observation period

100
Cagayan River Basin Survey
Figure 130. Scatter plot showing the relationship between stage and discharge in Magat (Aurora) Bridge within the observation period
Mallig Bridge – Mallig, Isabela
Figure 131. Relationship between velocity and stage in Mallig Bridge within the observation period

101
Cagayan River Basin Survey
Figure 132. Relationship between stage and discharge in Mallig Bridge within the observation period
Siffu Bridge – Roxas, Isabela
Figure 133. RelationshipbetweenvelocityandstageinSiffuBridgewithintheobservation period

102
Cagayan River Basin Survey
Figure 134.RelationshipbetweenstageanddischargeinSiffuBridgewithinthe observation period
Hydrometry data for following bridges, Figure 135-150, were acquired during Cagayan River Survey Phase 3.
Malalam Bridge – Ilagan, Isabela
Figure 135. Relationship between velocity and stage in Malalam Bridge within the observation period

103
Cagayan River Basin Survey
Figure 136. Relationship between velocity and rainfall in Malalam Bridge within the observation period
Figure 137. Relationship between stage and rainfall in Malalam Bridge within the observation period
Figure 138. Relationship between stage and discharge in Malalam Bridge within the observation period

104
Cagayan River Basin Survey
Naguilian Bridge – Naguilian, Isabela
Figure 139. Relationship between velocity and stage in Naguilian Bridge within the observation period
Figure 140. Relationship between velocity and rainfall in Naguilian Bridge within the observation period

105
Cagayan River Basin Survey
Figure 141. Relationship between stage and rainfall in Naguilian Bridge within the observation period
Figure 142. Relationship between stage and discharge in Naguilian Bridge within the observation period

106
Cagayan River Basin Survey
Sangbay Bridge – Maddela, Quirino
Figure 143. Relationship between velocity and stage in Sangbay Bridge within the observation period
Figure 144. Relationship between velocity and rainfall in Sangbay Bridge within the observation period

107
Cagayan River Basin Survey
Figure 145. Relationship between stage and rainfall in Sangbay Bridge within the observation period
Figure 146. Relationship between stage and discharge in Sangbay Bridge within the observation period
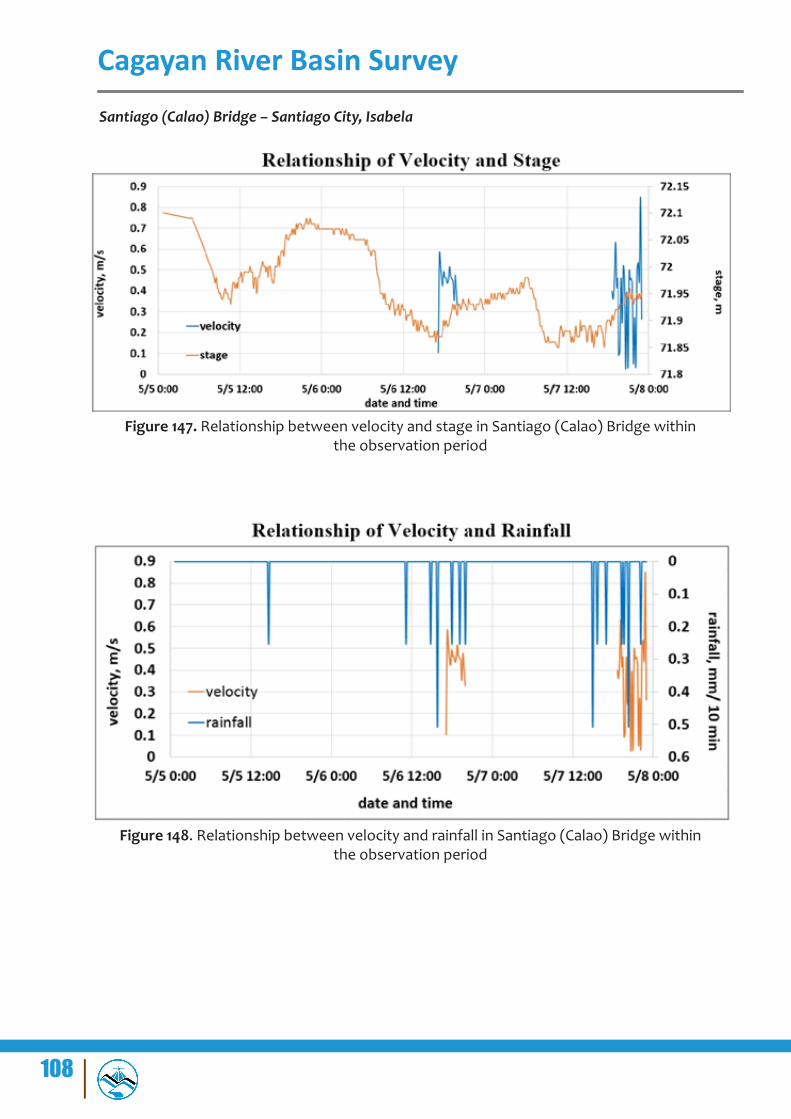
108
Cagayan River Basin Survey
Santiago (Calao) Bridge – Santiago City, Isabela
Figure 147. Relationship between velocity and stage in Santiago (Calao) Bridge within
the observation period
Figure 148. Relationship between velocity and rainfall in Santiago (Calao) Bridge within the observation period

109
Cagayan River Basin Survey
Figure 149. Relationship between stage and rainfall in Santiago (Calao) Bridge within the observation period
Figure 150. Relationship between stage and discharge in Santiago (Calao) Bridge within the observation period

110
Cagayan River Basin Survey
4.5 Validation Points Acquisition Survey Ground Validation Survey was done for quality checking purpose of the Aerial LiDAR Survey done by DAC of the DREAM Program. In this survey, a roving GNSS receiver, Trimble™ SPS882, was mounted on a range pole attached to a vehicle to measure points utilizing Continuous Topo Method in a PPK Survey Technique. The GPS was set in continuous topo mode with a 1-second interval and observing a vehicle speed of 10 – 15 kph. Points were measured alongmajorroadsandhighwaysacrosstheflightplansprovidedbyDAC.Theroadorgroundshould be concrete so that it has occurred relatively minimal amount of change especially in verticalpositions.Theoffset for the instrumentheightwas recorded in theTrimble®TSC3GNSScontroller.DatawereprocessedusingTrimble®BusinessCenterSoftware.Thefiguresbelow show the ground validation done for each Cagayan River Survey.
ThefirstphaseofgroundvalidationwasconductedonMarch17-April6,2014withalength of 153 km traversing the provinces of Cagayan down to Isabela. The second phase was onJanuary29-February12,2014covering67kmfromRoxastoGamuandfromDelfinAlbanoto San Mariano in Isabela. The last phase was on April 28 - May 8, 2014 completing 103 km of ground validation from Cordon, Isabela to Maddela, Quirno and Jones, Isabela to Nagtipunan, Quirino. Extent of the entire ground validation survey is exhibited in Figure 151.

111
Cagayan River Basin Survey
Figure 151. Validation points acquisition survey extent in Cagayan River Basin


113
MethodologyAnnexes
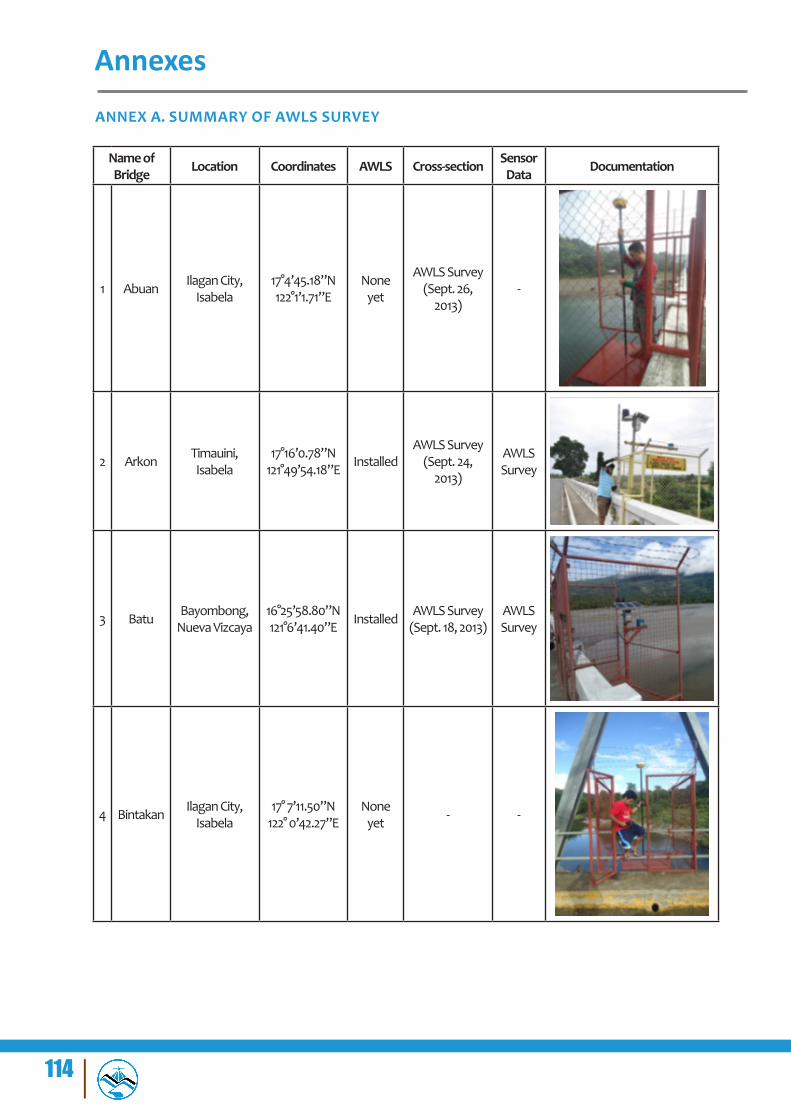
114
Annexes
ANNEX A. SUMMARY OF AWLS SURVEY
Name of Bridge Location Coordinates AWLS Cross-section Sensor
Data Documentation
1 Abuan Ilagan City, Isabela
17°4’45.18”N122°1’1.71”E
None yet
AWLS Survey (Sept. 26,
2013)-
2 Arkon Timauini, Isabela
17°16’0.78”N121°49’54.18”E Installed
AWLS Survey (Sept. 24,
2013)
AWLS Survey
3 Batu Bayombong,Nueva Vizcaya
16°25’58.80”N121°6’41.40”E Installed AWLS Survey
(Sept. 18, 2013)AWLS Survey
4 Bintakan Ilagan City, Isabela
17° 7’11.50”N122° 0’42.27”E
None yet - -

115
Annexes
Name of Bridge Location Coordinates AWLS Cross-section
Sensor Data Documentation
5 Buntun
Tuguegarao City,
Cagayan
17°36’42.47”N121°41’38.02”E Installed
Phase 1 (Apr. 6, 2014)
Phase 1
6 Canao Tabuk, Kalinga 17°24’9.45”N121°25’4.12”E Installed - -
7 Dalibubun Echague, Isabela
16°36’13.85”N121°40’36.81”E Installed
Phase 3 (May 3, 2014)
-
8 Disiluad Aglipay, Quirino
16°28’6.99”N121°37’47.91”E Installed
AWLS Survey
(Sept. 20, 2013)
-
9 Dummun Gattaran, Cagayan
18°2’29.96”N121°38’29.29”E Installed
Phase 1 (Apr. 5, 2014)
-

116
Annexes
Name of Bridge Location Coordinates AWLS Cross-section
Sensor Data Documentation
10 Gamu Gamu, Isabela 17°4’8.22”N121°50’33.59”E
Installed but stolen
AWLS Survey
(Sept. 20, 2013)
-
11 Ganano Alicia, Isabela 16°46’10.83”N121°41’52.16”E Installed
Phase 3 (May 4, 2014)
-
12 Lucban Abulag, Cagayan
18°20’17.74”N121°25’30.81”E Installed
AWLS Survey
(Sept. 19, 2013)
AWLS Survey
13 Magapit Lal-Lo, Cagayan
18°7’19.70”N121°40’21.02”E Installed
AWLS Survey
(Sept. 19, 2013)
-
14 Magat (Aurora)
Aurora, Isabela
16°58’16.86”N121°39’27.60”E Installed
AWLS Survey
(Sept. 28, 2013)
AWLS Survey; Phase 2
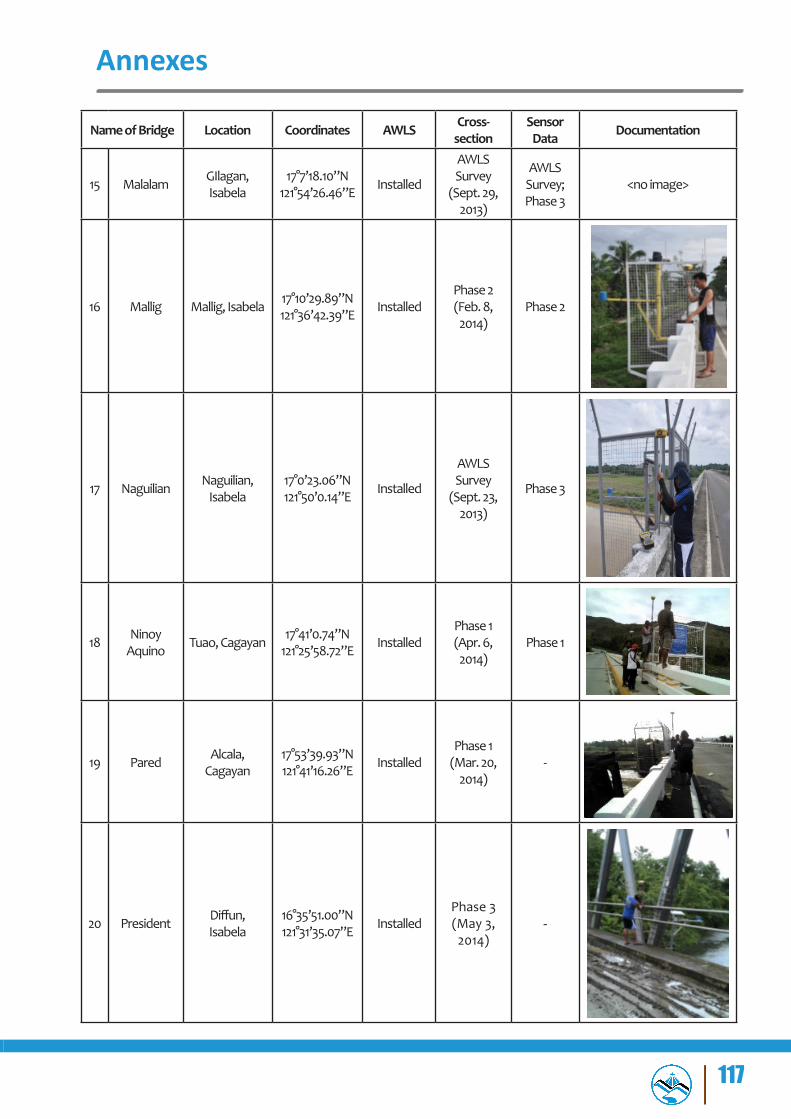
117
Annexes
Name of Bridge Location Coordinates AWLS Cross-section
Sensor Data Documentation
15 Malalam GIlagan, Isabela
17°7’18.10”N121°54’26.46”E Installed
AWLS Survey
(Sept. 29, 2013)
AWLS Survey; Phase 3
<no image>
16 Mallig Mallig, Isabela 17°10’29.89”N121°36’42.39”E Installed
Phase 2 (Feb. 8, 2014)
Phase 2
17 Naguilian Naguilian, Isabela
17°0’23.06”N121°50’0.14”E Installed
AWLS Survey
(Sept. 23, 2013)
Phase 3
18 Ninoy Aquino Tuao, Cagayan 17°41’0.74”N
121°25’58.72”E InstalledPhase 1 (Apr. 6, 2014)
Phase 1
19 Pared Alcala, Cagayan
17°53’39.93”N121°41’16.26”E Installed
Phase 1 (Mar. 20,
2014)-
20 President Diffun,Isabela
16°35’51.00”N121°31’35.07”E Installed
Phase 3 (May 3,
2014)-

118
Annexes
Name of Bridge Location Coordinates AWLS Cross-section
Sensor Data Documentation
21 San Josefa Peñablanca, Cagayan
17°37’45.30”N121°46’17.80”E Installed
AWLS Survey
(Sept. 23, 2013)
-
22 San Lorenzo
Bagabag, Nueva Vizcaya
16°34’59.92”N121°16’8.93”E Installed
AWLS Survey
(Sept. 20, 2013)
-
23 San Pablo San Pablo, Isabela
17°26’21.26”N121°46’44.67”E Installed
Phase 1 (Apr. 5, 2014)
Phase 1
24 Sangbay Maddela Quirino
16°15’26.44”N121°39’8.13”E Installed
AWLS Survey
(Sept. 20, 2013)
AWLS Survey; Phase 3
25 Santiago (Calao)
Santiago City, Isabela
16°41’46.91”N121°33’21.84”E Installed
Phase 3 (Apr. 28,
2014)Phase 3
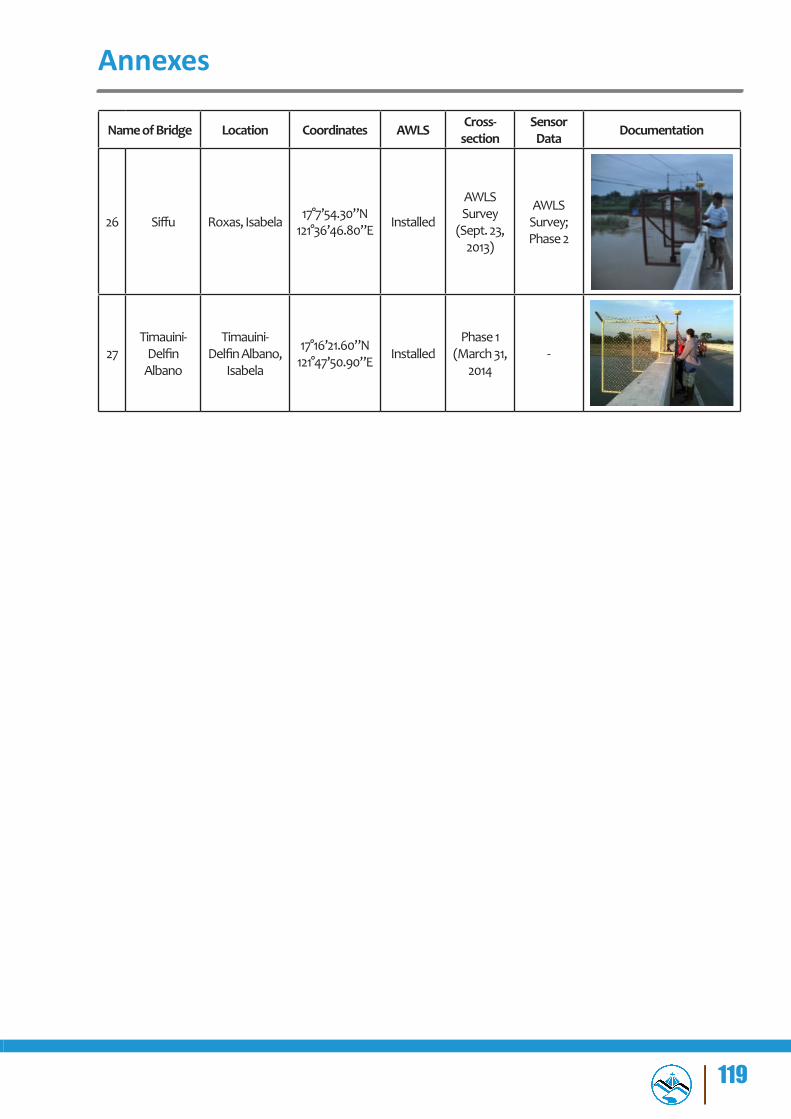
119
Annexes
Name of Bridge Location Coordinates AWLS Cross-section
Sensor Data Documentation
26 Siffu Roxas, Isabela 17°7’54.30”N121°36’46.80”E Installed
AWLS Survey
(Sept. 23, 2013)
AWLS Survey; Phase 2
27Timauini-Delfin
Albano
Timauini-DelfinAlbano,
Isabela
17°16’21.60”N121°47’50.90”E Installed
Phase 1 (March 31,
2014-

120
Annexes
ANNEX B. SURVEY TEAM
AWLS SURVEY SURVEY TEAMName In-ChargeOf:
Engr. Dexter T. Lozano SupervisingEngr. Bernard Paul D. Maramot
Cross-sectionJeline M. Amante
Engr. JMson J. CalalangMichael Anthony C. Labrador
Kenneth Niño PunaySensor Deployment
Neil Eneri TinginMaximo A. Nieves Driver
PHASE 1 SURVEY TEAMName In-ChargeOf:
Engr. Melchor Rey M. Nery Supervising / Bathymetry
Jeline M. Amante Supervising / GPS Base Setup
Engr. JMson J. Calalang Cross Section / Flow Measurement
Engr. Edjie M. Abalos Cross Section/GPS Base Setup
Michael Anthony C. Labrador Cross Section/BathymetryPatrizcia Mae P. dela Cruz Bathymetry/Flow
MeasurementFor. Nancy A. Dimayacyac
PHASE 2 SURVEY TEAMName In-ChargeOf:
Engr. Melchor Rey M. Nery Supervising (Team 1)Engr. JMson J. Calalang
Bathymetry (Team 1)Engr. Edjie M. AbalosMichael Anthony C. Labrador
Engr. Bernard Paul D. Maramot Supervising (Team 2)Engr. Mark Lester Rojas
Bathymetry (Team 2)For. Maridel P. MirasErlan Patrick Mendoza

121
Annexes
PHASE 3 SURVEY TEAMName In-ChargeOf:
Engr. Melchor Rey M. Nery Supervising
Engr. Bernard Paul D. Maramot Supervising / GPS Base Setup
Engr. Mark Lester Rojas Cross Section / Flow Measurement
For. Rodel C. Alberto Cross Section/GPS Base Setup
Erlan Patrick MendozaCross Section/Bathymetry
Engr. Bernice H. FuraggananFor. Maridel P. Miras Bathymetry/Flow
MeasurementFor. Dona Rina Patricia C. Tajora

122
Annexes
ANNEX C. LIST OF EQUIPMENT AND INSTRUMENTS USED
CAGAYAN RIVER SURVEY PHASE 1Equipment Quantity Serial Number
Dual Frequency GPS (Base) 1 unit 2Dual Frequency GPS (Rover) 4 units 2297, 9327, 2302, 2179
Tripod 2 units TP9, DL TP1Digital Level 1 unit Box 5
Bipods 4 units BP7, BP10, BP9, BP11Notebook Computer 1 unit D6420 Dell Latitude
Handheld GPS 2 units 5, 10
OHMEX Sonarmite Echo Sounder 1 unit
(Rented from Sitech Philippines with 3 parts
transducer)Portable Depth Sounder 1 unit 236946
Flow Meter4 unit (1 propeller type and 2 digital flowmeters)
4977, 4975, 26297
Trimble Business Center Don-gle 1 unit
Toolbox 1 unit
CAGAYAN RIVER SURVEY PHASE 2Type Brand Quantity
GPS ReceiversTrimble SPS882 5 roversTrimble SPS852 1 baseTrimble SPS985 1 rover
Single Beam EchosounderOHMEX 1 unit
HI-TARGET 1 unitHandheld Garmin Oregon 550 5 units
Laptop Dell ATG 2 unitsTripod Trimble 2 units
Range pole with Bipod Trimble 5 unitsAcousticCurrentProfiler
(Side Looking) Sontek 2 units
Flowmeter (Propeller type) 1 unitsDepth Gauge Hobo 2 units

123
Annexes
CAGAYAN RIVER SURVEY PHASE 3Equipment Quantity Serial Number
Dual Frequency GPS (852) 1 unit 5208k82363Dual Frequency GPS (ROVER ) 4 units 1142, 2056, 9972, 2179
Digital Level 1 unit 510770
Controller 5 units 3446, 13419, 8662, 6213, 13432
Trimble bags 4 pieces 1, 2, 3, 4Level Rods 2
Tripods 2 units 8,4Tripods (aluminum) 1 unit 5
Range Poles and Bipods 6 units 1, 2, 3. 4, 5, 6data connector (Hobo) 2 units HB1, HB 2
Depth gauge 3 units 5080, 5078, 3753Rain gauge 2 units 10431539, 10431538
ADCP (SL or XR) with accesso-ries 2 units
Notebook Computer 2 unitsHandheld GPS 4 units 1,2,6,3
Trimble battery 12 units 25, 27, 28, 7, 8, 9, 10, 12, 15, 16, 19, 20
Battery charger (dock) 4 units 1, 2, 3, 4Battery charger 3 units 3, 4, 6
Car Battery charger 2 units 2 & 6Controller charger 4 units 4, 5, 6, 7
Toolbox 2 unitsSingle Beam Echo sounder
(OHMEX and HI-Target) and accessories
2 units
Outboard motors (OBM 25 HP & 30 HP) 2 units

124
Annexes
ANNEX D. SUMMARY OF ACTIVITIES
CAGAYAN RIVER SURVEY AWLS SURVEY
Bridges Cross-section AWLS Flow
measurement Remarks
Abuan ✓ ✓ ✓Arkon ✓ ✓ ✓Batu ✓ ✓ ✓
Bintakan ✓ ✓ ✓Canao No data No data No data Lost data
Dalibunbun No data No data ✓Disiluad ✓ ✓ ✓
Dummun No data No data ✓ Float cross-section data
Gamu ✓ ✓ ADCP ADCP - Side looking deployed
Ganano ✓ ✓ ✓Ganano ✓ ✓ ✓Lucban ✓ ✓ ✓
Magapit ✓ ✓ ADCP ADCP - Side looking deployed
Magat (Aurora) ✓ ✓ ✓
Malalam ✓ ✓ ADCP ADCP - Vertical de-ployed
Mallig No data No data ✓Naguillian ✓ ✓ Noflow Lost data
Pared No data No data ✓ Float cross-section data
San Josefa ✓ ✓ ✓San Lorenzo ✓ ✓ ✓
San Pablo ✓ ✓ ✓Sangbay ✓ ✓ ✓
Santiago (Calao) No data No data No data Lost dataSiffu ✓ ✓
Timauini-DelfinAlbano No data No data ✓ Lost data
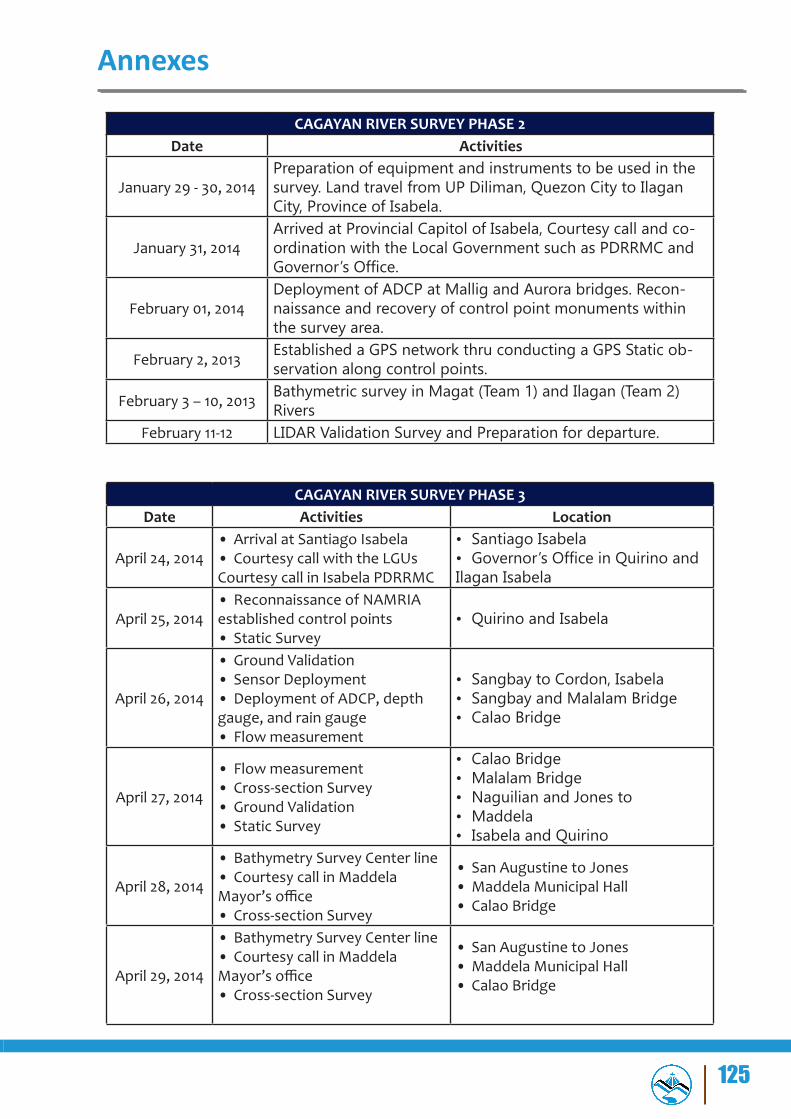
125
Annexes
CAGAYAN RIVER SURVEY PHASE 2Date Activities
January 29 - 30, 2014Preparation of equipment and instruments to be used in the survey. Land travel from UP Diliman, Quezon City to Ilagan City, Province of Isabela.
January 31, 2014Arrived at Provincial Capitol of Isabela, Courtesy call and co-ordination with the Local Government such as PDRRMC and Governor’s Office.
February 01, 2014Deployment of ADCP at Mallig and Aurora bridges. Recon-naissance and recovery of control point monuments within the survey area.
February 2, 2013 Established a GPS network thru conducting a GPS Static ob-servation along control points.
February 3 – 10, 2013 Bathymetric survey in Magat (Team 1) and Ilagan (Team 2) Rivers
February 11-12 LIDAR Validation Survey and Preparation for departure.
CAGAYAN RIVER SURVEY PHASE 3Date Activities Location
April 24, 2014• Arrival at Santiago Isabela• Courtesy call with the LGUs Courtesy call in Isabela PDRRMC
• Santiago Isabela• Governor’s Office in Quirino and Ilagan Isabela
April 25, 2014• Reconnaissance of NAMRIA established control points• Static Survey
• Quirino and Isabela
April 26, 2014
• Ground Validation• Sensor Deployment• Deployment of ADCP, depth gauge, and rain gauge• Flow measurement
• Sangbay to Cordon, Isabela• Sangbay and Malalam Bridge• Calao Bridge
April 27, 2014
• Flow measurement• Cross-section Survey• Ground Validation• Static Survey
• Calao Bridge• Malalam Bridge• Naguilian and Jones to• Maddela• Isabela and Quirino
April 28, 2014
• Bathymetry Survey Center line• Courtesy call in Maddela Mayor’soffice• Cross-section Survey
• San Augustine to Jones• Maddela Municipal Hall• Calao Bridge
April 29, 2014
• Bathymetry Survey Center line• Courtesy call in Maddela Mayor’soffice• Cross-section Survey
• San Augustine to Jones• Maddela Municipal Hall• Calao Bridge

126
Annexes
CAGAYAN RIVER SURVEY PHASE 3Date Activities Location
April 30, 2014 • Bathymetry Survey Center line• Flow measurement
• Echague to Angadanan• Calao Bridge
May 1, 2014 • Bathymetry Survey Center line• Flow measurement
• Angadanan to Naguilian• Calao Bridge
May 2, 2015• Courtesy call with LGUs in the Ba-rangays of Nagtipunan and Maddela• Checked sensors; downloaded data
• Nagtipunan and Maddela Isabela• Sangbay and Malalam Bridge
May 3, 2015 • Bathymetry Survey Center line• Cross-section Survey
• Maddela Quirino• Dalibubon and President’s Bridge
May 4, 2015 • Bathymetry Survey Center line• Flow measurement
• Nagtipunan Quirino• Naguilian Bridge
May 5, 2015• Returned the boats to PDRRMC of Isabela• Bathy Data Processing
• Ilagan Isabela
May 6, 2015 • Flow measurement • Calao Bridge
May 7, 2015 • Flow measurement• Instrument inventory
May 8, 2015
• Sensor Retrieval of ADCP, depth gauge, and rain gauge• Checked sensors; downloaded data• Preparation for Travel
• Malalam and Sangbay Bridge

127
Annexes
ANNEX E. PROBLEMS ENCOUNTERED AND SOLUTIONS APPLIED
CAGAYAN RIVER SURVEY PHASE 1Problems Remarks/Solutions
Float data for bathymetric survey at certain portions of Cagayan River along the municipalities of Cabagan, Alcala, and Aparri
The survey team immediately processed the data to identify data gaps needed to be re-surveyed. Re-survey was done for the identifiedportionsofCagayanRiverwithfloatdata
Float data for Buntun Bridge Cross Section
The bridge was re-surveyed thrice to obtain cross section data
Norainfalldatagatheredforflowmeasurements site in San Pablo and Ninoy Aquino Bridges during the survey period
BaseflowdataweregatheredfortheAWLSsites
No water level data was read by the AWLS in Ninoy Aquino Bridge by thetimeofcrosssectionandflowmeasurement survey done by the team
No HQ Curve was generated for Ninoy Aquino Bridge
CAGAYAN RIVER SURVEY PHASE 2Problems Remarks/Solutions
Bathymetric survey using echosounder is not suitable.
The team conducted a manual gathering of bathymetry data.
Dense tree canopies along the road which made the acquisition of ground validation point more challenging. This consumed more time.
The team allot extra time for this activity. Data gathered before and after the canopieswerefilteredout.
CAGAYAN RIVER SURVEY PHASE 3Problems Remarks/Solutions
The battery of the ADCP deployed at Malalam bridge got empty
Replaced the empty battery with fully charge one
TheBSThaddifficultiesinsurveyingthe river along Maddela because of the unsecured part of the area
The BST coordinated and requested assistance from the LGU in Maddela to reassure the safety of the team
Some parts of the river are rapid that the instruments cannot function properly
The BST as much as possible avoid the very rapid part of the river

128
Annexes
ANNEX F. NAMRIA CERTIFICATES

129
Annexes
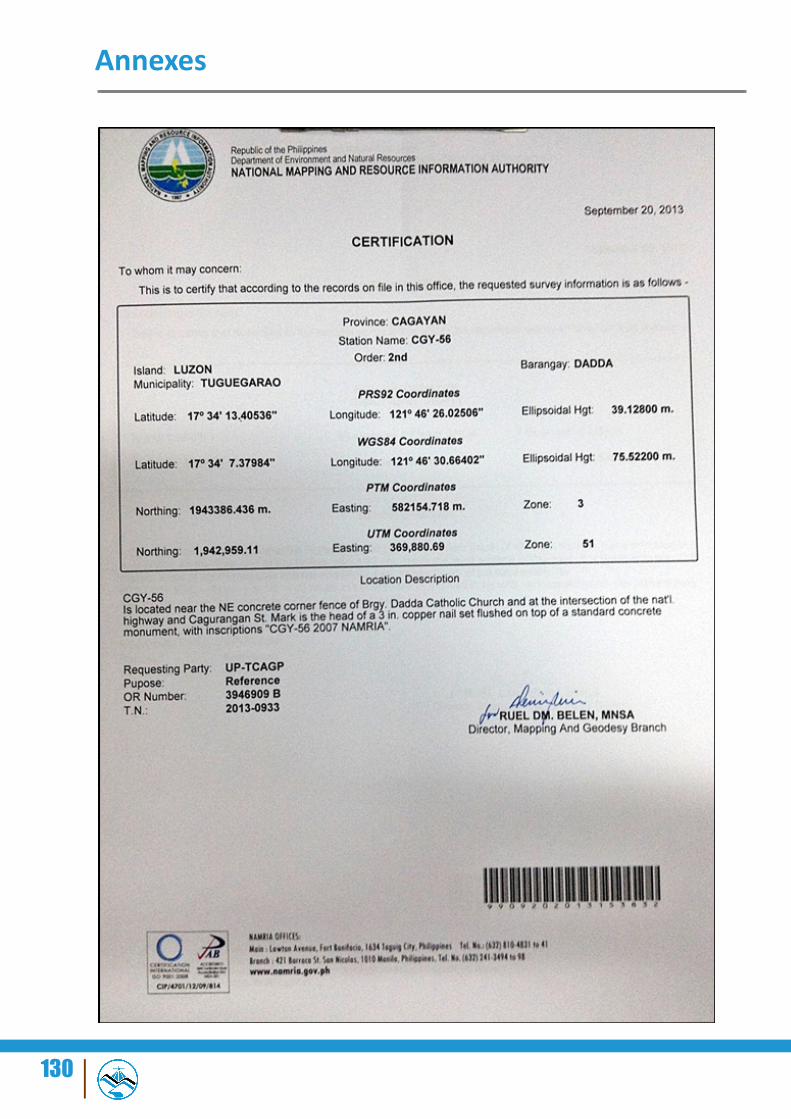
130
Annexes

131
Annexes

132
Annexes

133
Annexes

134
Annexes
135
Annexes
ANNEX F. ACKNOWLEDGMENTS
We are very thankful to the following individuals and agencies for their generous supportduringtheconductofourfieldsurveys:
• The Provincial Government of Cagayan Valley and Isabela and their respective PDRRMCs for lending us portable boat and manpower to assist and guide us in the survey
• DOST Region 2 for the assistance extended to the UP Survey Team;• Local hires from Region 2, without which, the field survey would not be made
possible.• Joy C. Samson Transport van rentals for the survey team’s mobilization;• Piazza Zicarelli for the team’s accommodations during the survey; and• The local residents of Cagayan, Isabela, Quirino and Nueva Viscaya for the invaluable
assistance extended to the UP Survey team.

Bibliography
• CAGAYAN RIVER BASIN. (n.d.). Retrieved August 12, 2015, from https://kidlat.pagasa.dost.gov.ph/index.php/hydrometeorology/c
• The Cagayan River Basin. (2009, October 23). Retrieved August 12, 2015, from http://www.abs-cbnnews.com/research/10/23/09/cagayan-river-basin

137