Embed Size (px)
Citation preview
© 2011 1
Calculate a Production Plan with the Inventory Chain Template
Intermediate Cost Analysis and Management
© 2011 2
What is a Forecast?
• A forecast is a plan for the future based on estimates, strategies and historical data
• Represents a standard for comparison to actual performance
• Implies a commitment to an agreed-upon level of output at an agreed-upon cost
• Encourages “What-If?” scenarios• May or may not be tied to the legal budget
© 2011 3
Terminal Learning Objective
• Task: Calculate a Production Plan with the Inventory Chain Template
• Condition: You are training to become an ACE with access to ICAM course handouts, readings, and spreadsheet tools and awareness of Operational Environment (OE)/Contemporary Operational Environment (COE) variables and actors
• Standard: with at least 80% accuracy:• Identify and enter relevant scenario data into macro
enabled templates to calculate Production Needs, then Plan Direct Labor, Overhead and Forecast Material Purchases
© 2011 4
Consider the Following Process Flow
• Building, manufacturing, and all other processes start with inputs and physically progress to outputs
• Purchase meat for freezer, move from freezer to refrigerator to defrost, move to grill, move to table
© 2011 5
Planning’s Key Difference: Backward Chaining
• Planning starts with outputs and end state goals and logically works backwards to determine needed inputs
• If you are planning a menu with a desired output of ten burgers you will have to work backwards through the process
• If there is no inventory in the refrigerator and freezer, you will need to purchase hamburger meat for ten burgers
• If you wish to maintain inventories in the refrigerator and freezer for future cookouts you will need to specify output and inventory end states in order to plan properly
© 2011 6
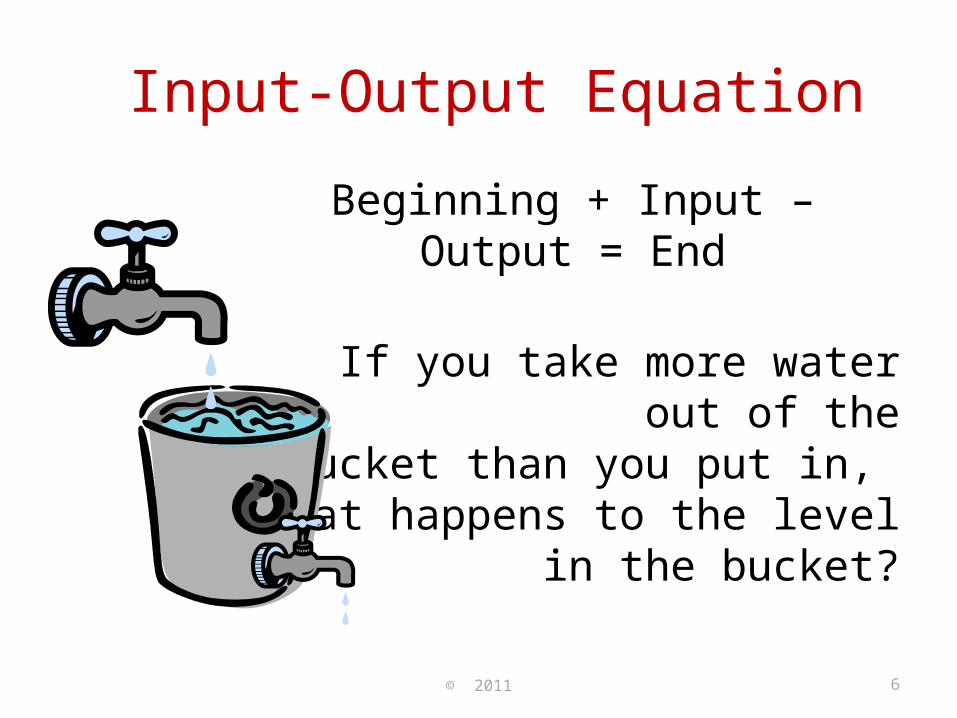
Input-Output Equation
Beginning + Input – Output = End
If you take more water out of the bucket than you put in,
what happens to the level in the bucket?
© 2011 7
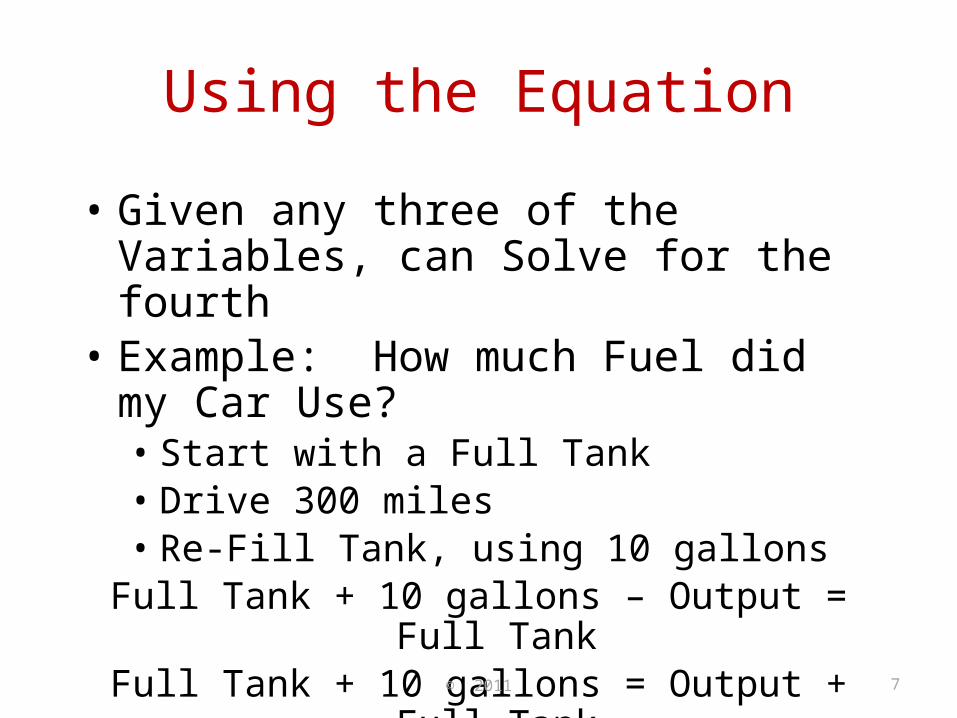
Using the Equation
• Given any three of the Variables, can Solve for the fourth
• Example: How much Fuel did my Car Use? • Start with a Full Tank • Drive 300 miles• Re-Fill Tank, using 10 gallons
Full Tank + 10 gallons – Output = Full TankFull Tank + 10 gallons = Output + Full TankFull Tank + 10 gallons = Output + Full Tank
© 2011 8
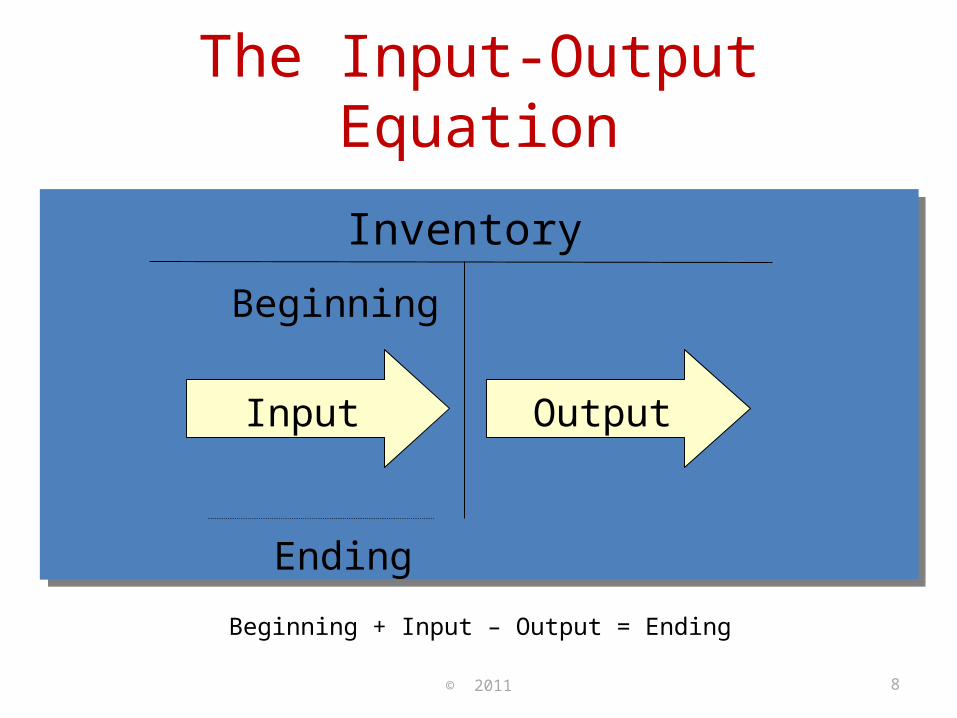
The Input-Output Equation
Inventory
Beginning
Input Output
Ending
Beginning + Input – Output = Ending
© 2011 9
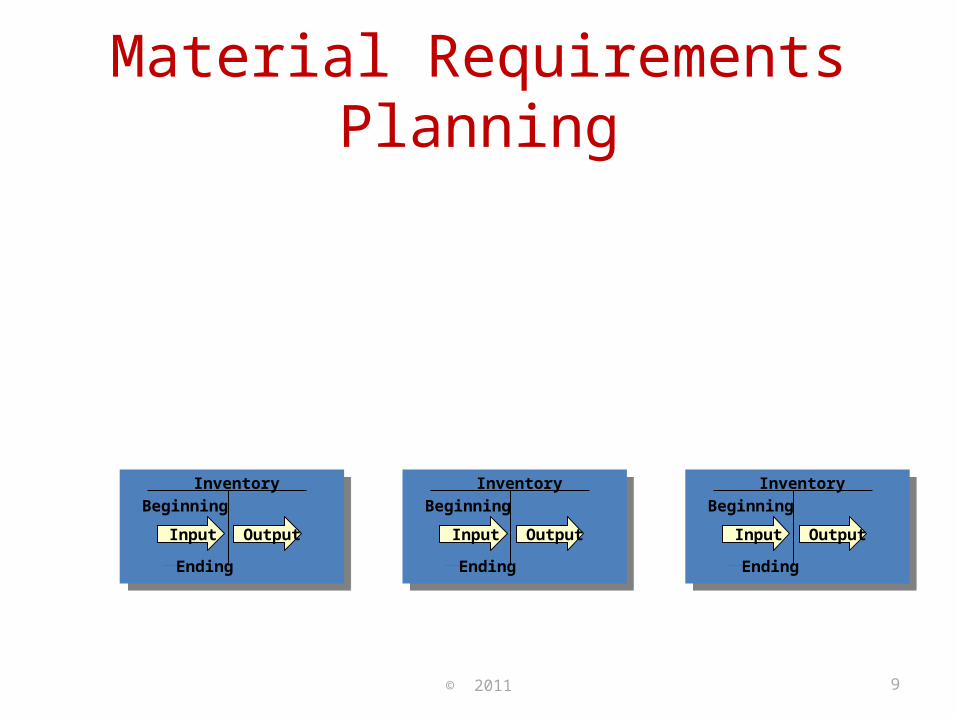
Material Requirements Planning
InventoryBeginning
Input Output
Ending
InventoryBeginning
Input Output
Ending
InventoryBeginning
Input Output
Ending
© 2011 10
Learning Check
• How does a forecast differ from The Budget?• Where does the planning process begin?
© 2011 11
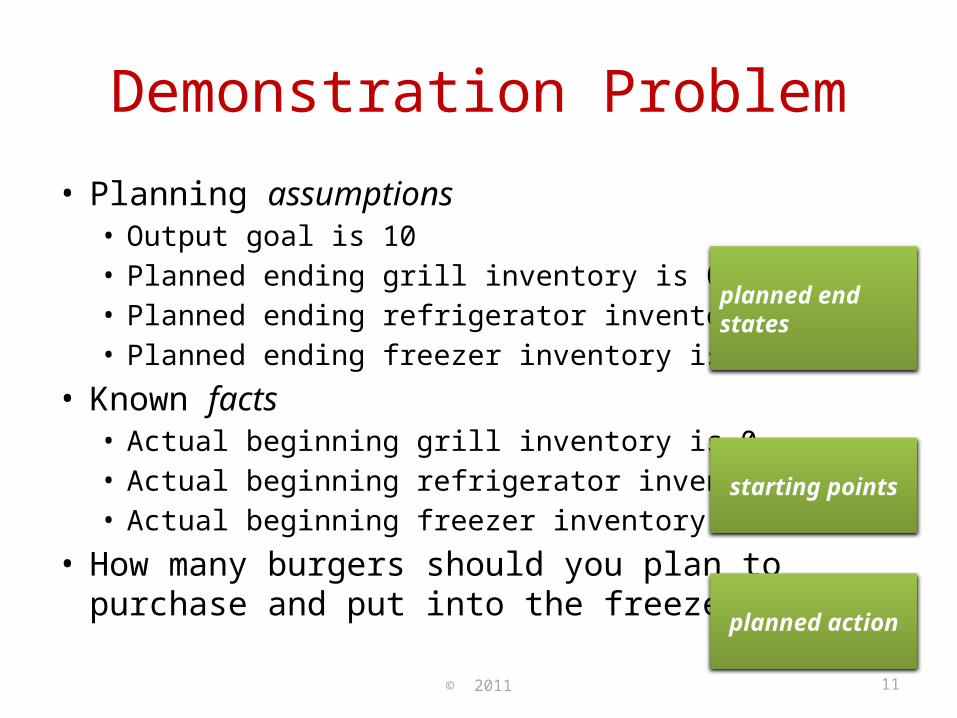
Demonstration Problem
• Planning assumptions• Output goal is 10• Planned ending grill inventory is 0• Planned ending refrigerator inventory is 35• Planned ending freezer inventory is 20
• Known facts• Actual beginning grill inventory is 0• Actual beginning refrigerator inventory is 10• Actual beginning freezer inventory is 30
• How many burgers should you plan to purchase and put into the freezer?
planned end states
starting points
planned action
© 2011 12
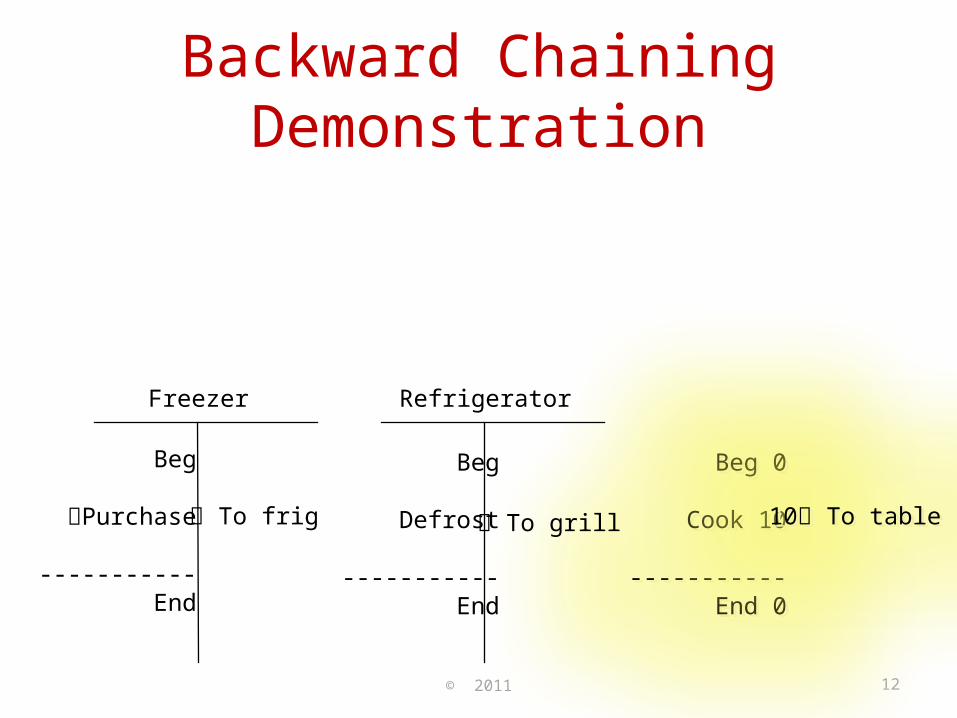
Backward Chaining Demonstration
Freezer
Beg
Purchase
-----------End
To frig
Beg 0
Cook 10
-----------End 0
Beg 0
Cook 10
-----------End 0
10 To table10 To table
Refrigerator
Beg
Defrost
-----------End
To grill
© 2011 13
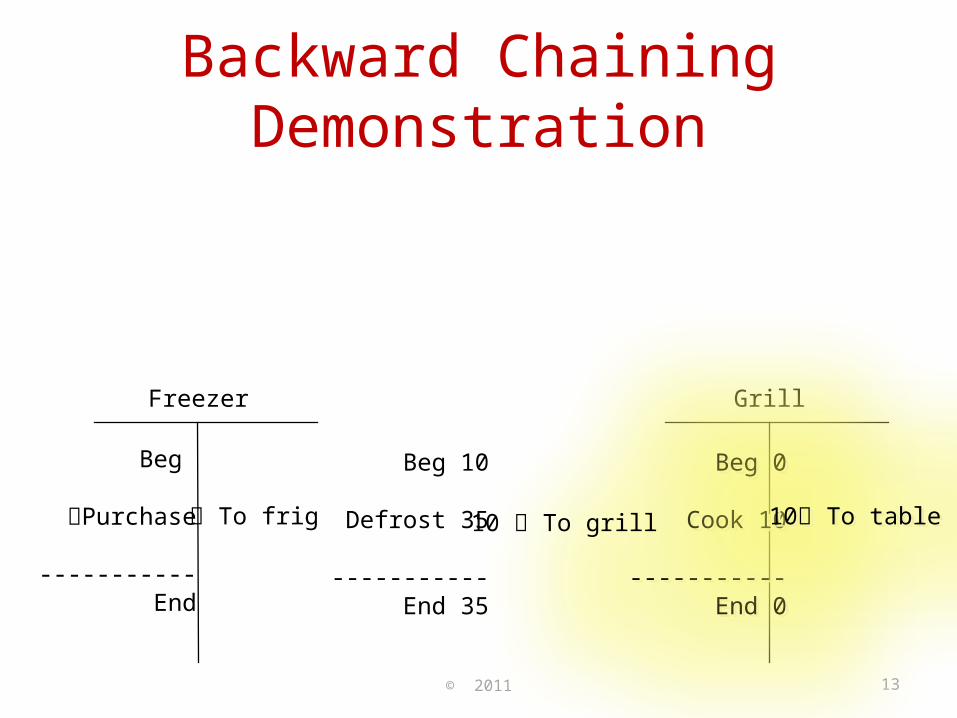
Backward Chaining Demonstration
Freezer Grill
Beg
Purchase
-----------End
To frig
Beg 0
Cook 10
-----------End 0
Beg 0
Cook 10
-----------End 0
10 To table10 To table
Beg 10
Defrost 35
-----------End 35
10 To grill
© 2011 14
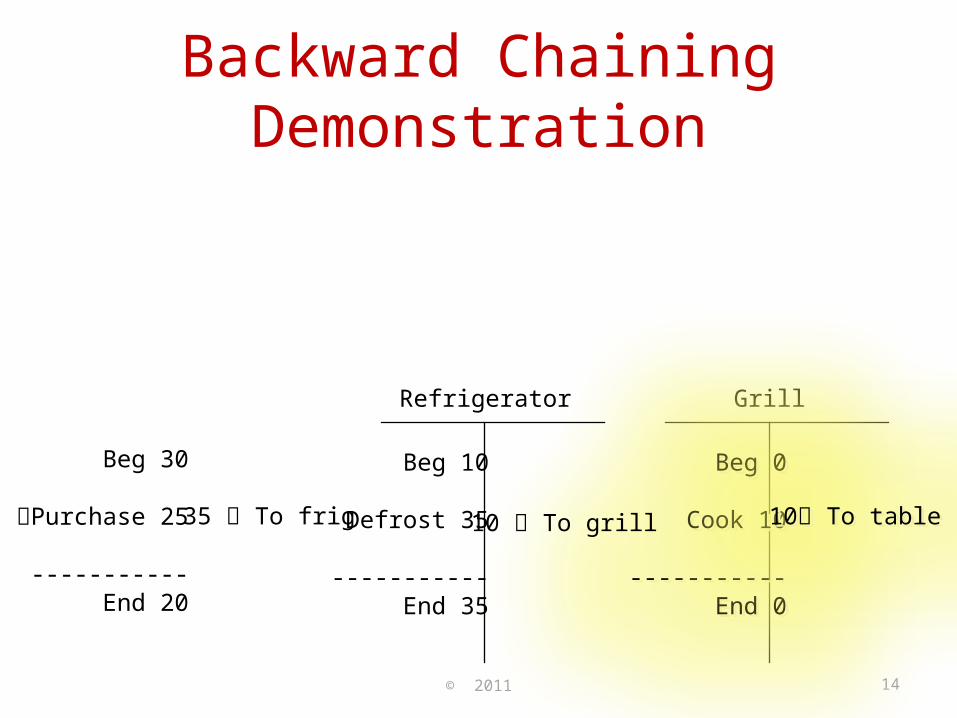
Backward Chaining Demonstration
Grill
Beg 30
Purchase 25
-----------End 20
35 To frig
Beg 0
Cook 10
-----------End 0
Beg 0
Cook 10
-----------End 0
10 To table10 To table
Refrigerator
Beg 10
Defrost 35
-----------End 35
10 To grill
© 2011 15
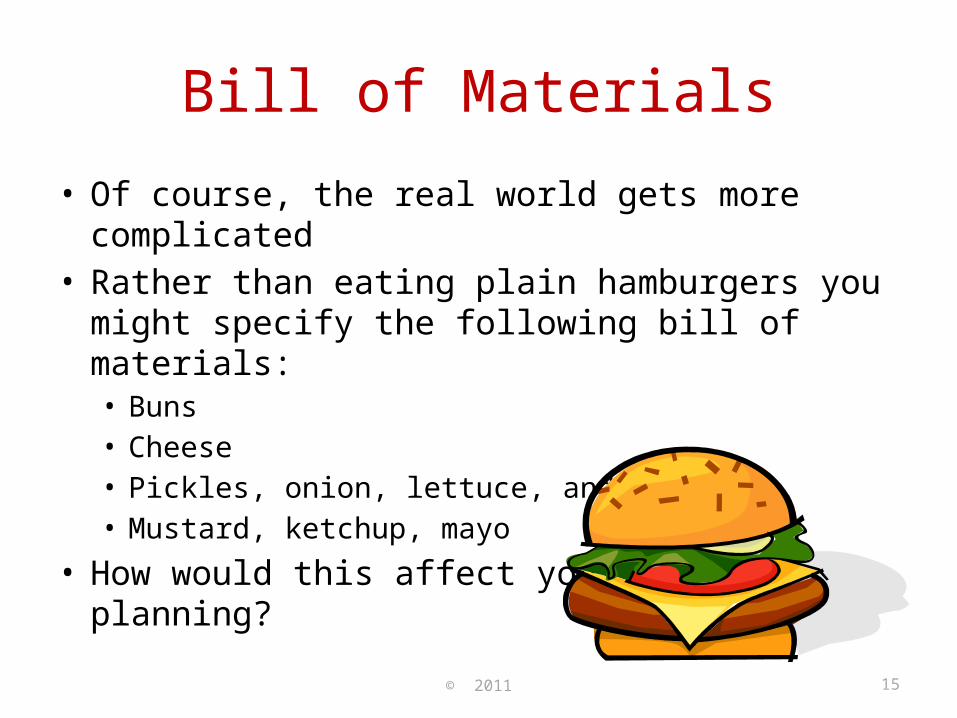
Bill of Materials
• Of course, the real world gets more complicated• Rather than eating plain hamburgers you might
specify the following bill of materials:• Buns• Cheese• Pickles, onion, lettuce, and tomatoes• Mustard, ketchup, mayo
• How would this affect your planning?
© 2011 16
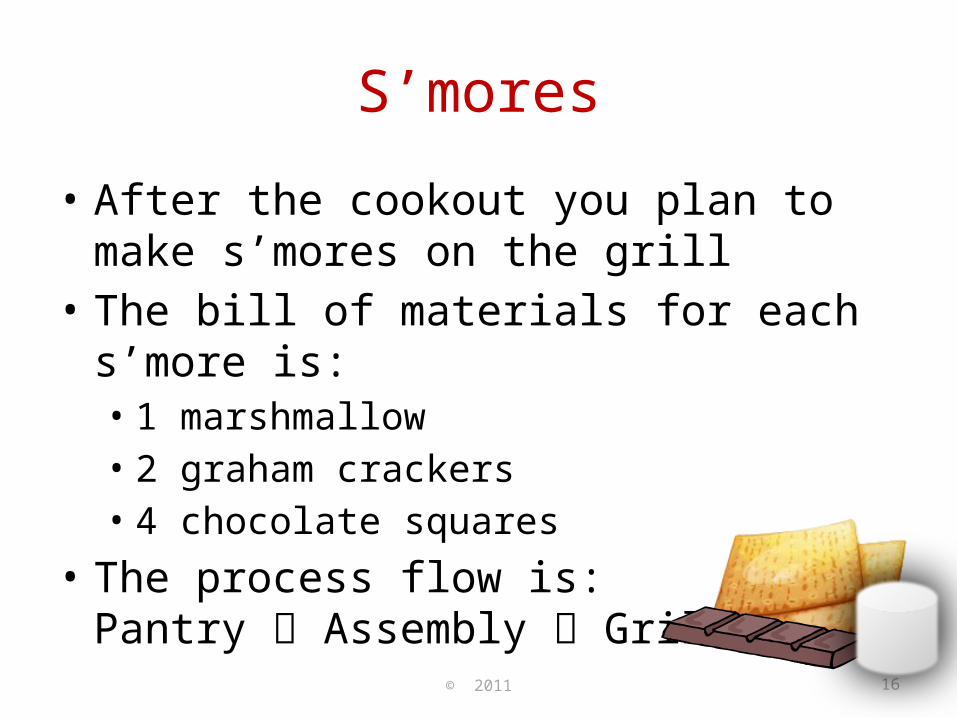
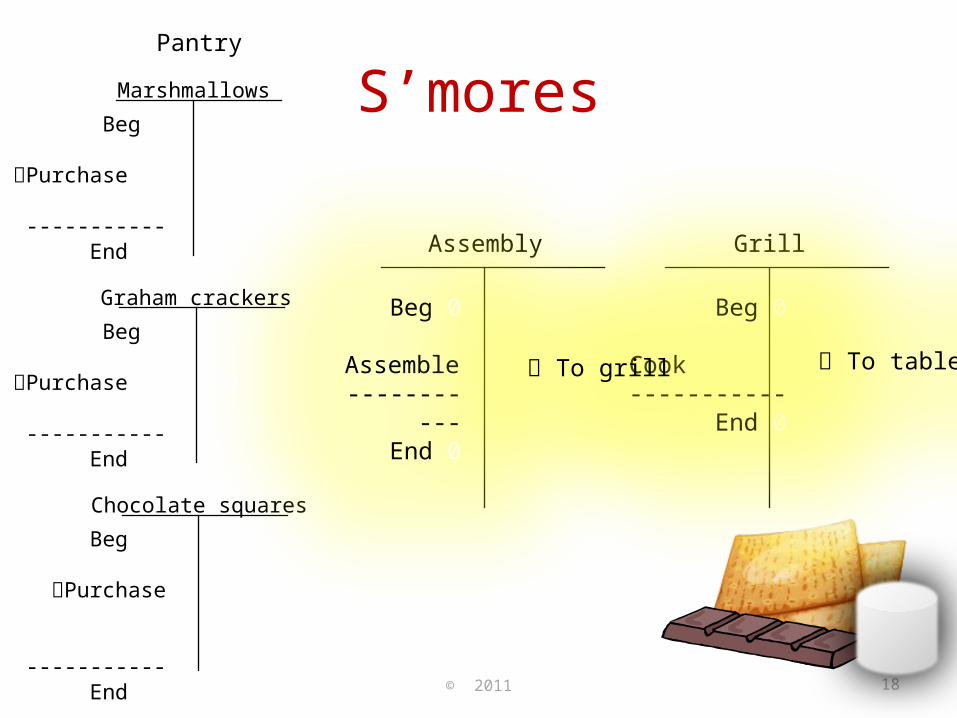
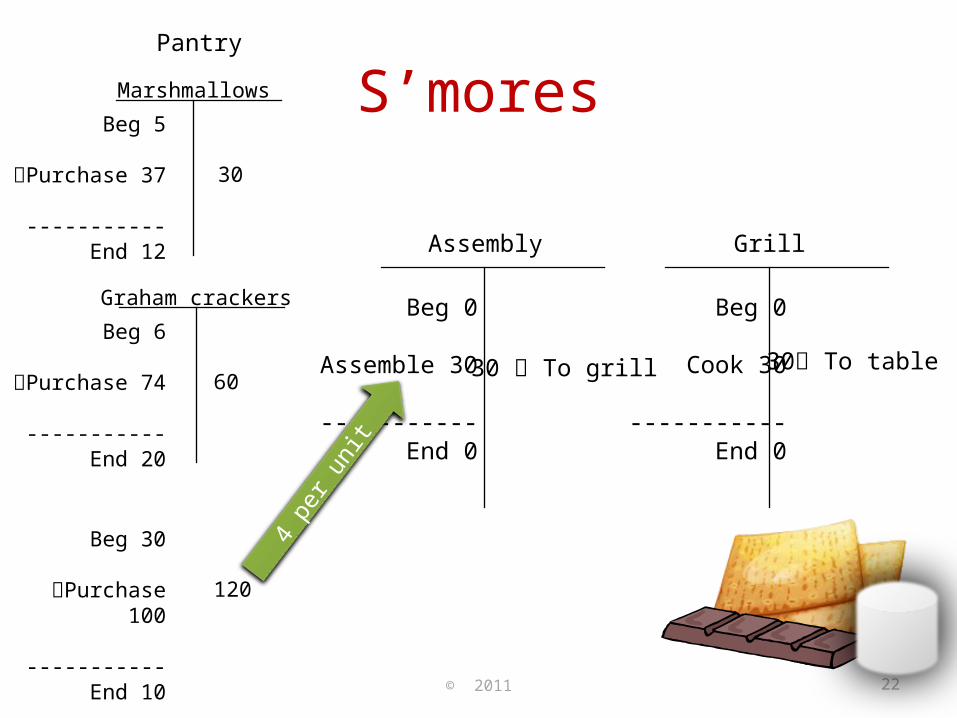
S’mores
• After the cookout you plan to make s’mores on the grill
• The bill of materials for each s’more is:• 1 marshmallow• 2 graham crackers• 4 chocolate squares
• The process flow is:Pantry Assembly Grill
© 2011 17
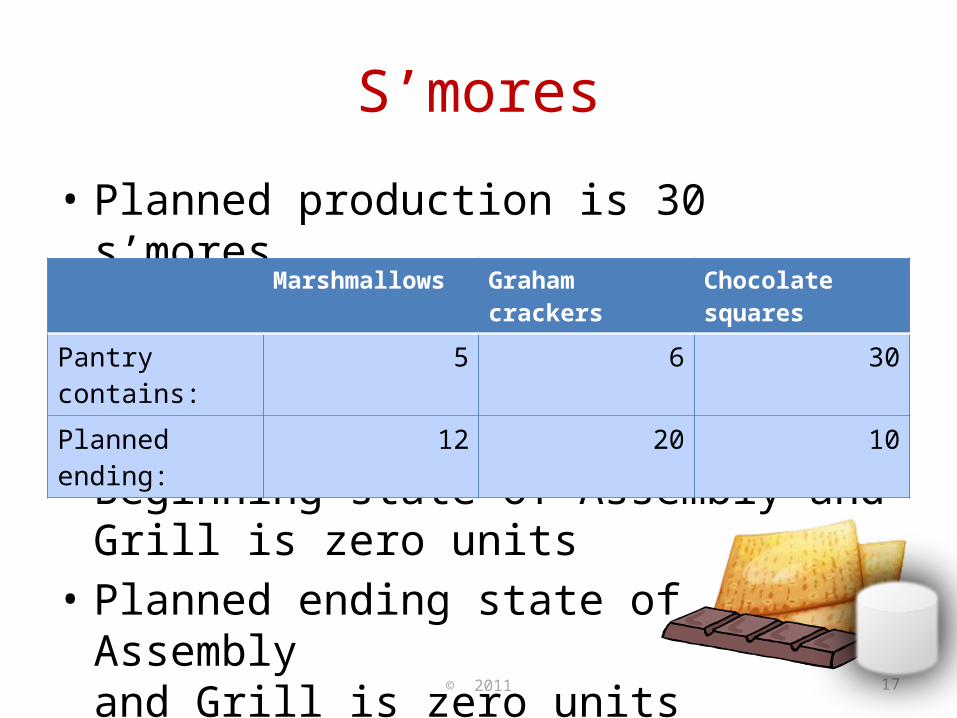
S’mores
• Planned production is 30 s’mores
• Beginning state of Assembly and Grill is zero units
• Planned ending state of Assembly and Grill is zero units
Marshmallows Graham crackers Chocolate squares
Pantry contains: 5 6 30Planned ending: 12 20 10
© 2011 18
S’mores
Chocolate squares
Grill
Beg 30
Purchase 100
-----------End 10
120
Beg 0
Cook-----------
End 0
To table
Assembly
Beg 0
Assemble-----------
End 0
To grill
Graham crackers
Beg 6
Purchase 74
-----------End 20
60
Marshmallows
Beg 5
Purchase 37
-----------End 12
30
Pantry
© 2011 19
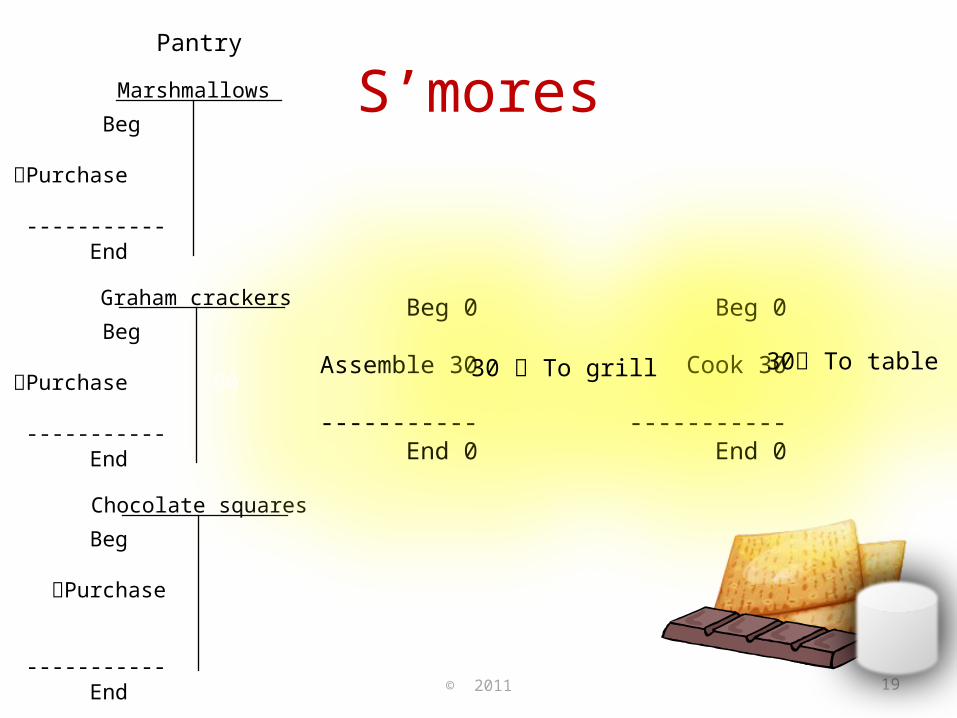
S’mores
Chocolate squares
Beg 30
Purchase 100
-----------End 10
120
Beg 0
Cook 30
-----------End 0
30 To table
Beg 0
Assemble 30
-----------End 0
30 To grill
Graham crackers
Beg 6
Purchase 74
-----------End 20
60
Marshmallows
Beg 5
Purchase 37
-----------End 12
30
Pantry
© 2011 20
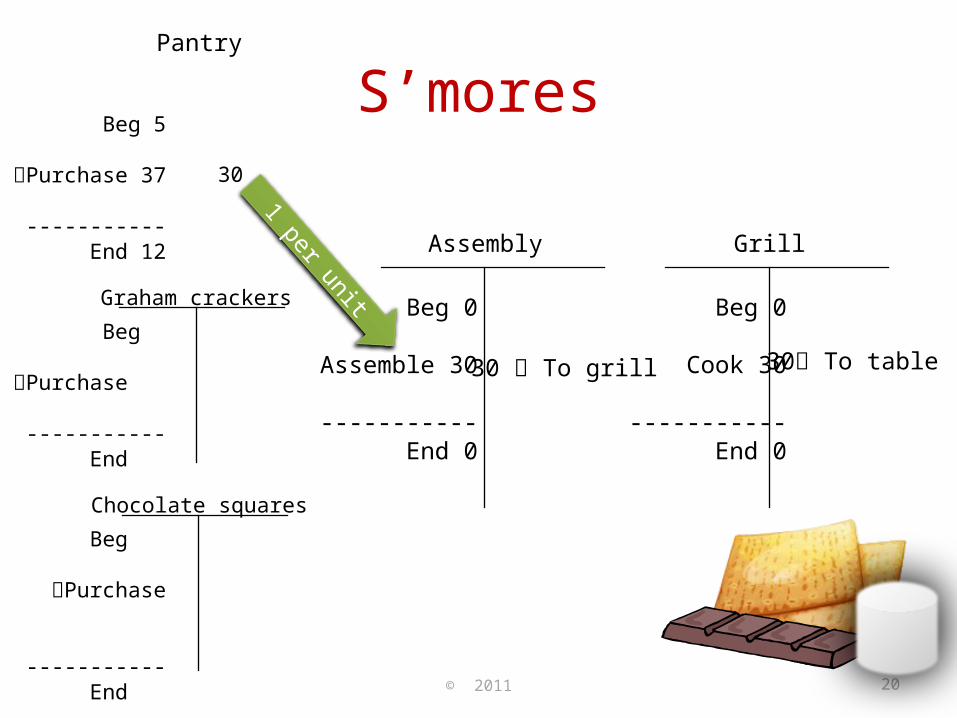
S’mores
Chocolate squares
Grill
Beg 30
Purchase 100
-----------End 10
120
Beg 0
Cook 30
-----------End 0
30 To table
Assembly
Beg 0
Assemble 30
-----------End 0
30 To grill
Graham crackers
Beg 6
Purchase 74
-----------End 20
60
Beg 5
Purchase 37
-----------End 12
30
Pantry
1 per unit
© 2011 21
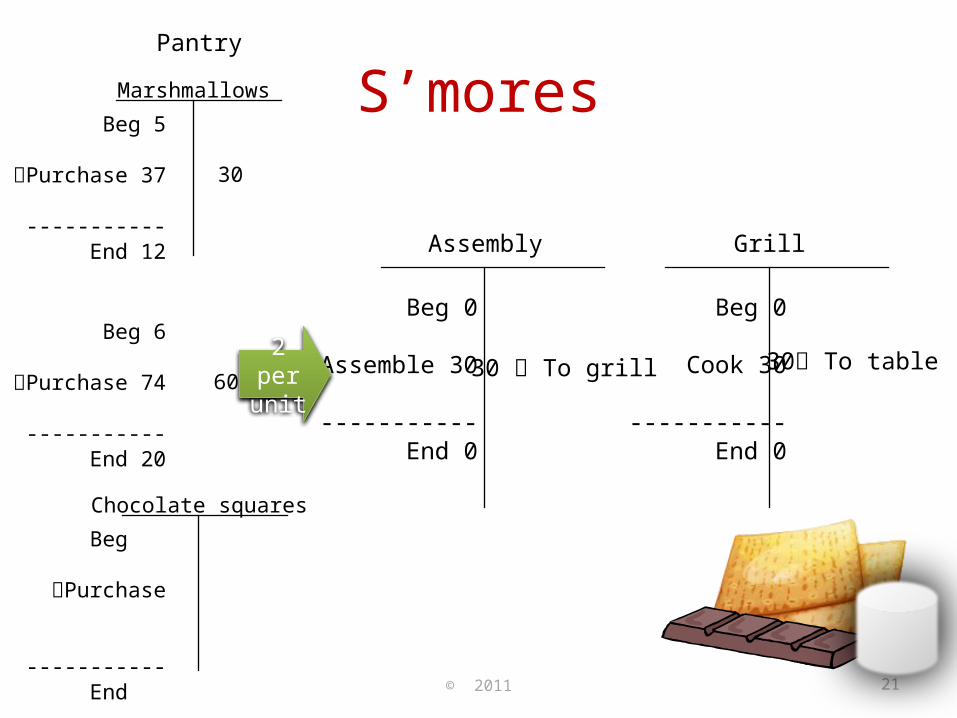
S’mores
Chocolate squares
Grill
Beg 30
Purchase 100
-----------End 10
120
Beg 0
Cook 30
-----------End 0
30 To table
Assembly
Beg 0
Assemble 30
-----------End 0
30 To grill
Beg 6
Purchase 74
-----------End 20
60
Marshmallows
Beg 5
Purchase 37
-----------End 12
30
Pantry
2 per unit
© 2011 22
S’mores
Grill
Beg 30
Purchase 100
-----------End 10
120
Beg 0
Cook 30
-----------End 0
30 To table
Assembly
Beg 0
Assemble 30
-----------End 0
30 To grill
Graham crackers
Beg 6
Purchase 74
-----------End 20
60
Marshmallows
Beg 5
Purchase 37
-----------End 12
30
Pantry
4 per
unit
© 2011 23
Real World Complexities
• These simple concepts are applied through materials requirement planning (MRP) systems in much more complex situations
• Consider the complexities of:• Automobile manufacturing• Computer assembly• Making and launching a space shuttle
• Can you see applications for ARFORGEN?
especially when you consider the
lead times of purchasing and
assembly!
© 2011 24
But My Organization Doesn’t Have Inventory!
• What about staffing and training requirements?• Ex. Air traffic controllers, Nuclear reactor
operators• Not having an adequate supply of trained
workers can be costly• Overtime, exhaustion, errors
• A “Just-in-Time” effort requires even more careful planning
© 2011 25
Learning Check
• How does the Bill of Materials affect the materials planning process?
• What are the non-manufacturing applications of Materials Resource Planning?
© 2011 26
Planning’s Impact on Cost
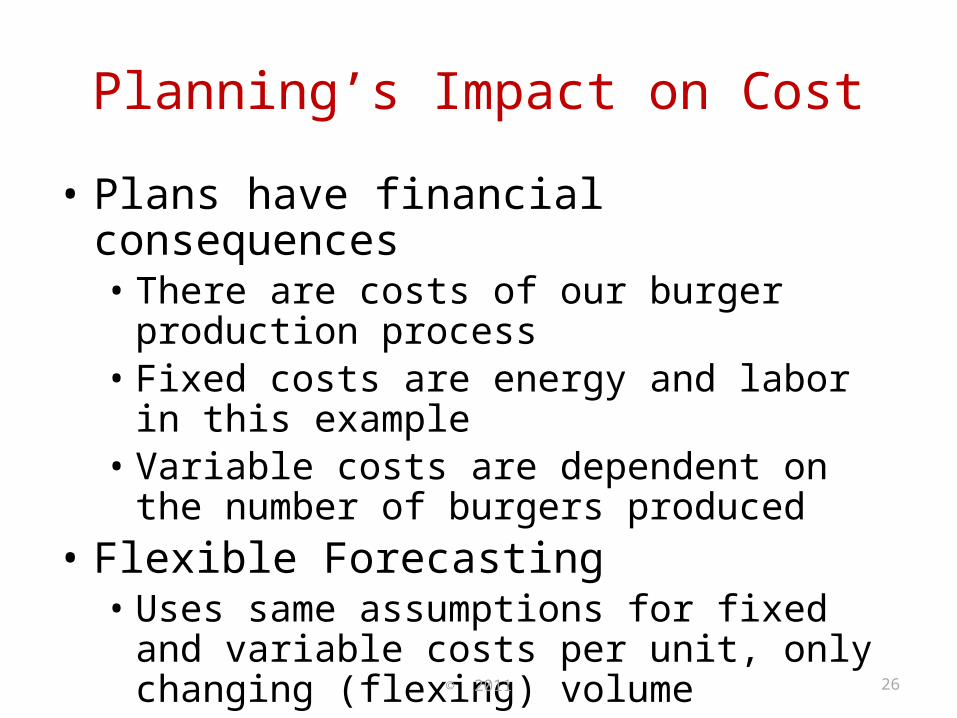
• Plans have financial consequences • There are costs of our burger production process• Fixed costs are energy and labor in this example• Variable costs are dependent on the number of
burgers produced• Flexible Forecasting• Uses same assumptions for fixed and variable
costs per unit, only changing (flexing) volume
© 2011 27
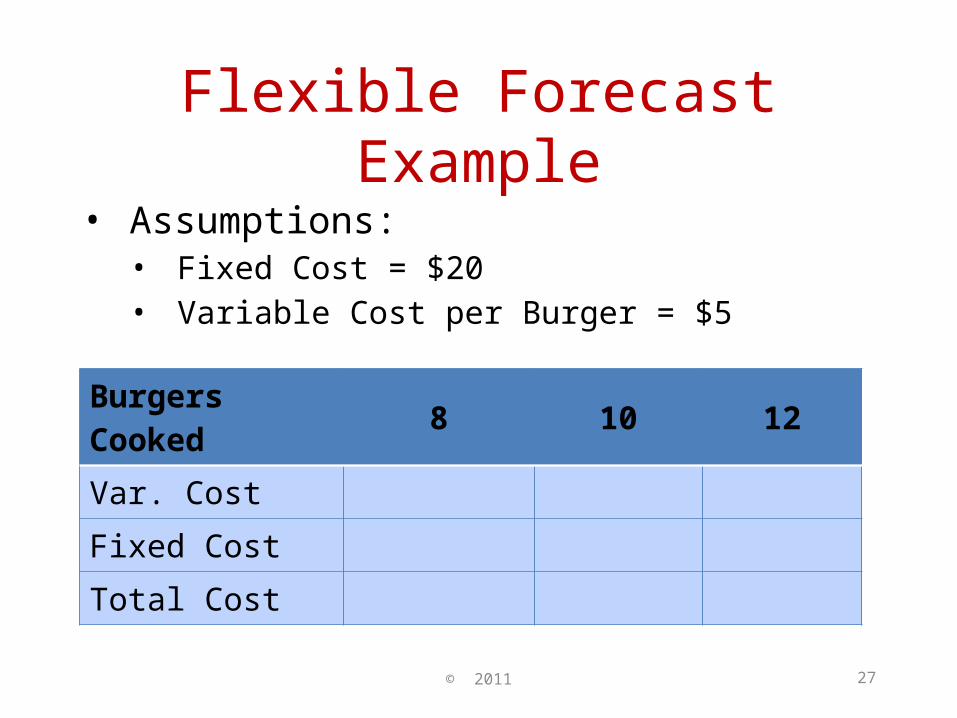
Flexible Forecast Example• Assumptions:• Fixed Cost = $20• Variable Cost per Burger = $5
Burgers Cooked 8 10 12Var. CostFixed Cost Total Cost
© 2011 28
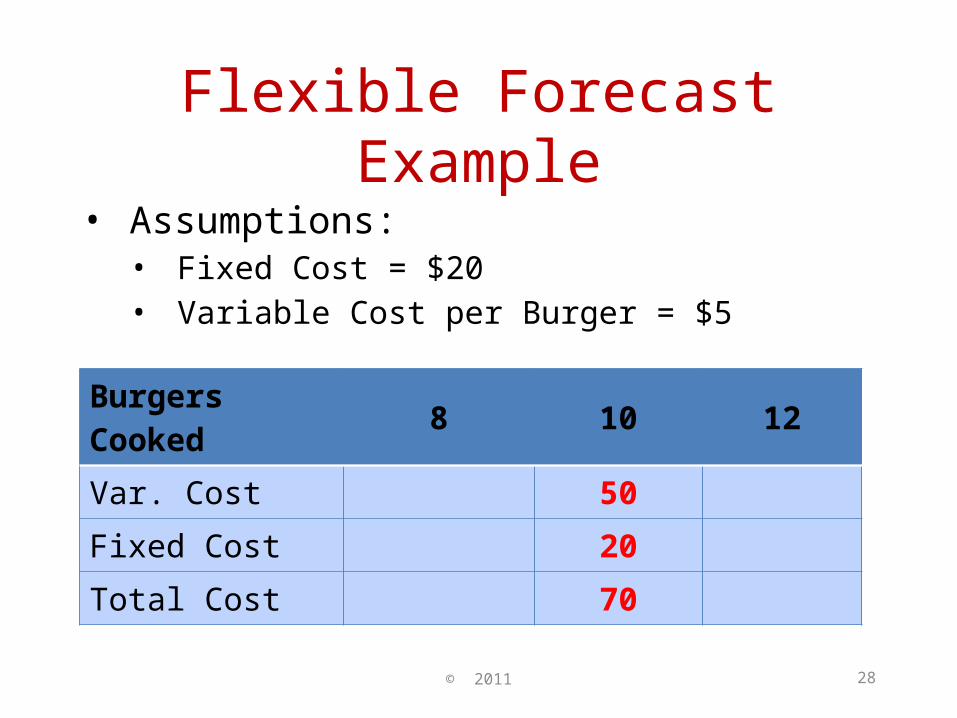
Flexible Forecast Example• Assumptions:• Fixed Cost = $20• Variable Cost per Burger = $5
Burgers Cooked 8 10 12Var. Cost 50Fixed Cost 20Total Cost 70
© 2011 29
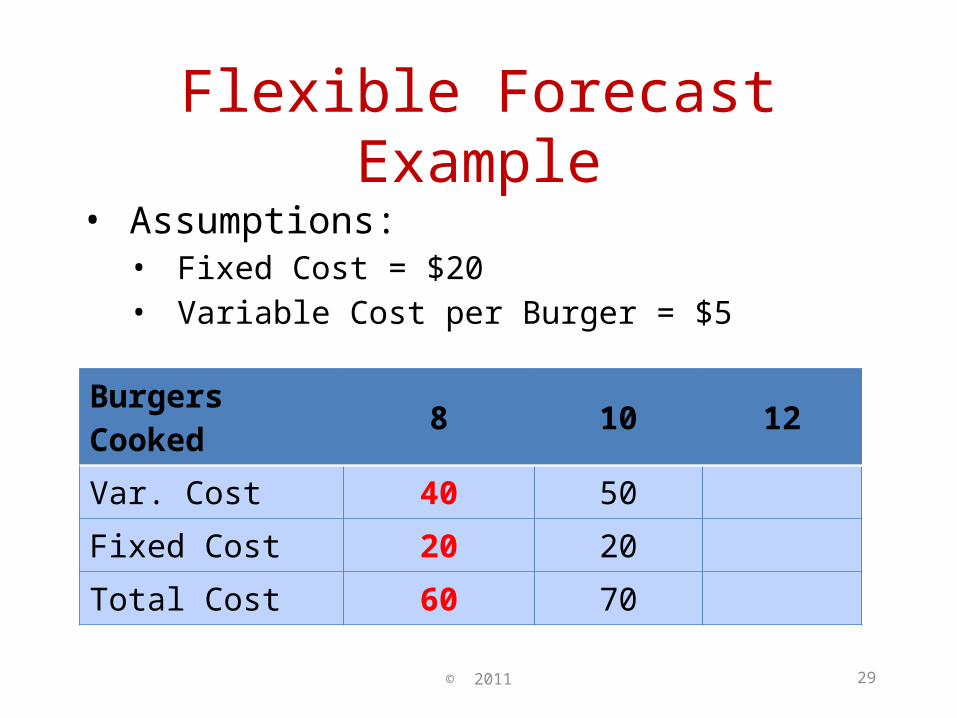
Flexible Forecast Example• Assumptions:• Fixed Cost = $20• Variable Cost per Burger = $5
Burgers Cooked 8 10 12Var. Cost 40 50Fixed Cost 20 20Total Cost 60 70
© 2011 30
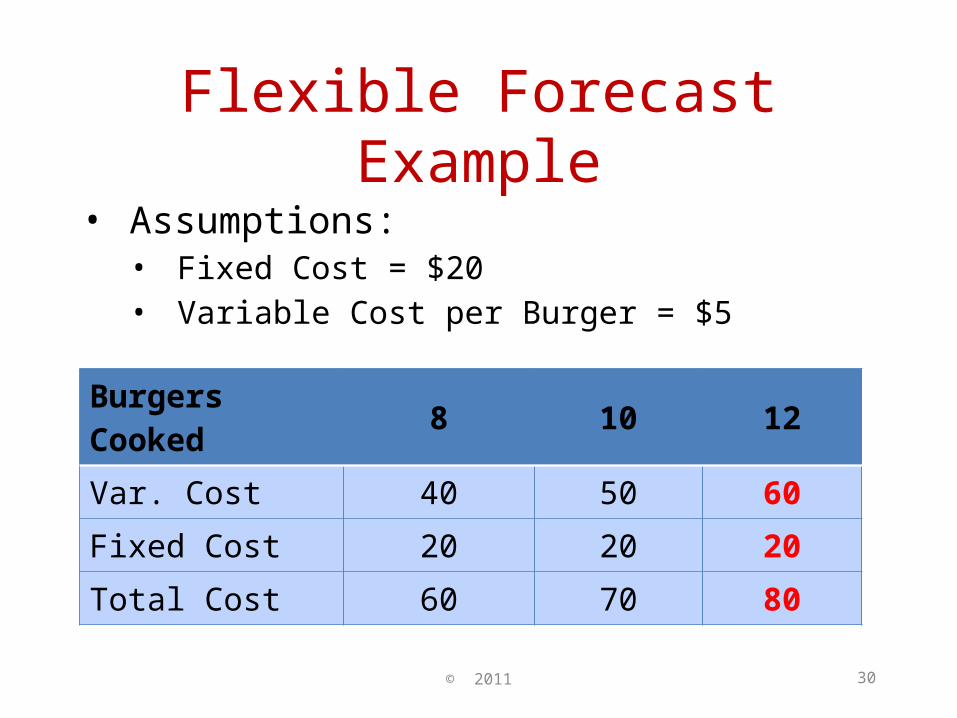
Flexible Forecast Example• Assumptions:• Fixed Cost = $20• Variable Cost per Burger = $5
Burgers Cooked 8 10 12Var. Cost 40 50 60Fixed Cost 20 20 20Total Cost 60 70 80
© 2011 31
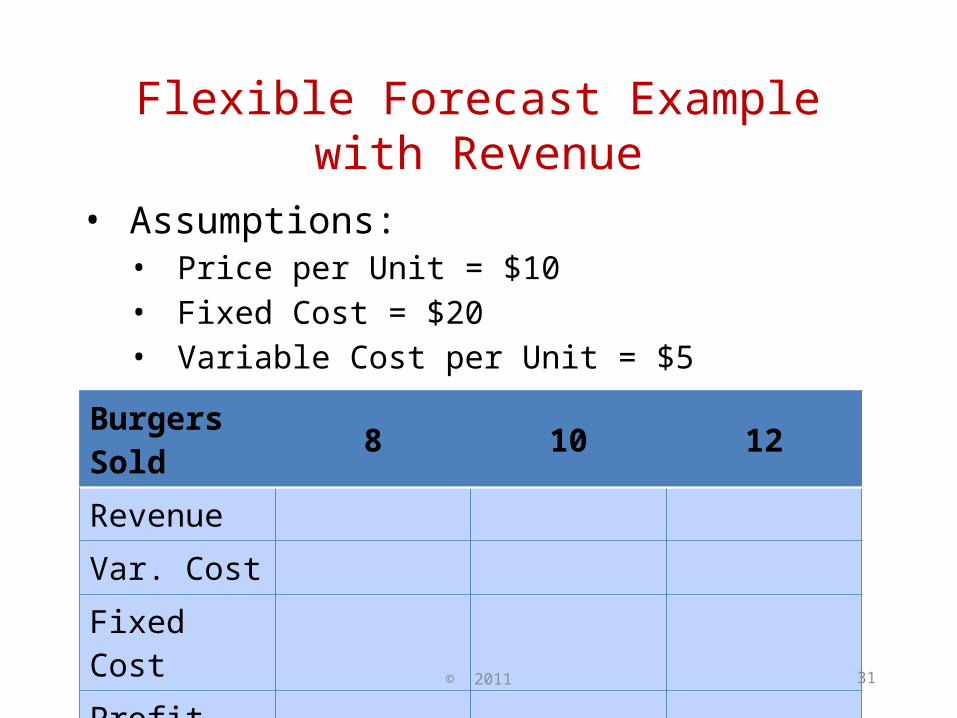
Flexible Forecast Example with Revenue
• Assumptions:• Price per Unit = $10• Fixed Cost = $20• Variable Cost per Unit = $5
Burgers Sold 8 10 12RevenueVar. CostFixed Cost Profit
© 2011 32
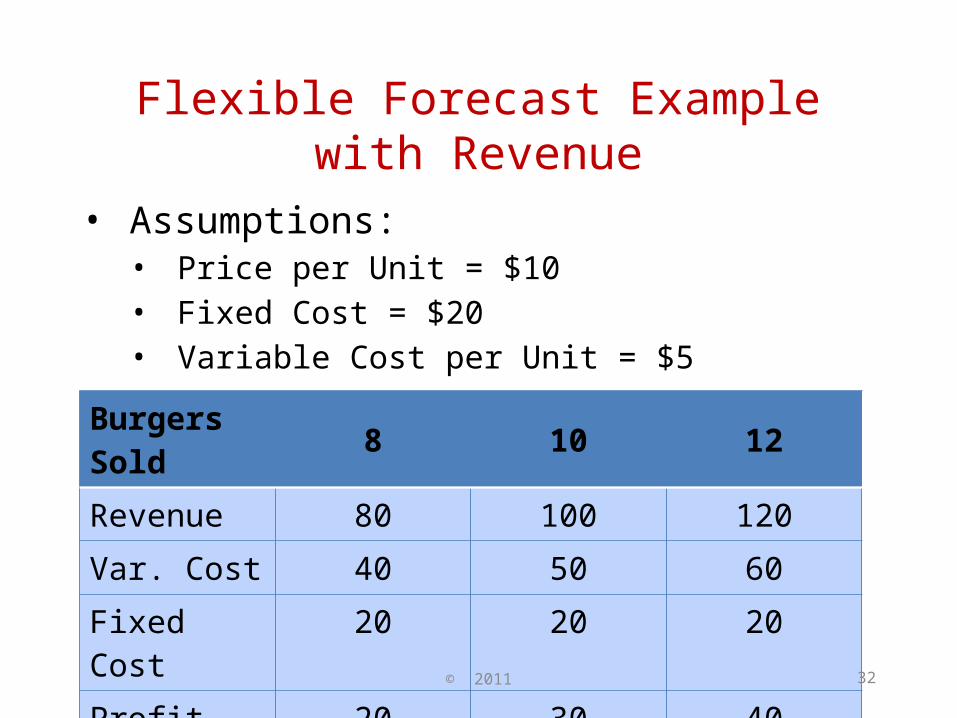
Flexible Forecast Example with Revenue
• Assumptions:• Price per Unit = $10• Fixed Cost = $20• Variable Cost per Unit = $5
Burgers Sold 8 10 12Revenue 80 100 120Var. Cost 40 50 60Fixed Cost 20 20 20Profit 20 30 40
© 2011 33
Learning Check
• How does total cost change as quantity produced increases?
• What is a flexible forecast?
© 2011 34
Practical Exercise
© 2011 35
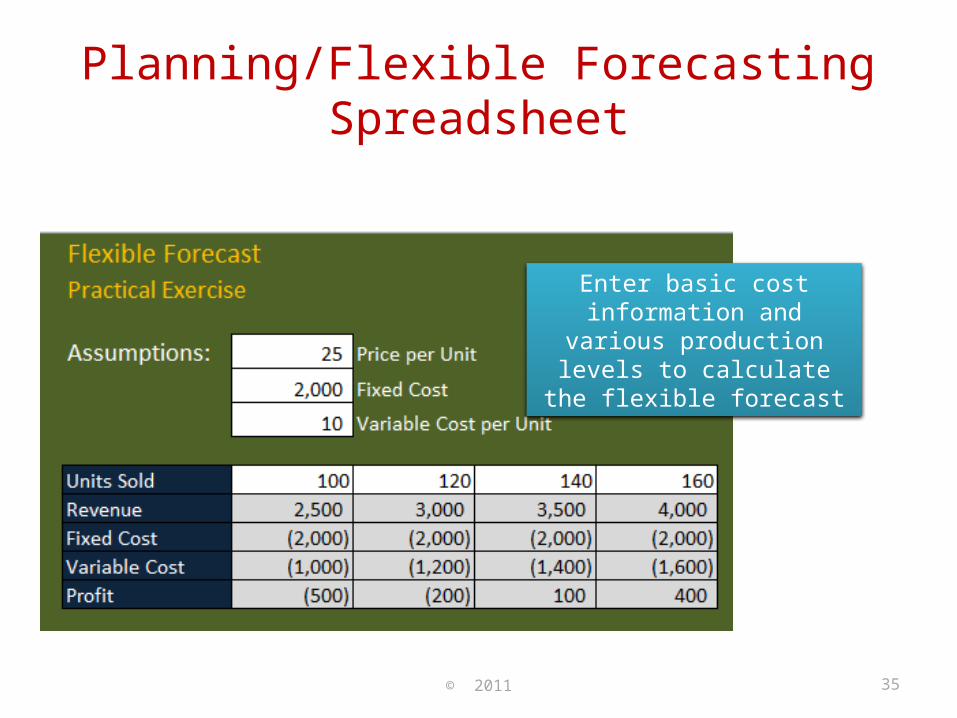
Planning/Flexible Forecasting Spreadsheet
Enter basic cost information and various production levels to
calculate the flexible forecast
© 2011 36
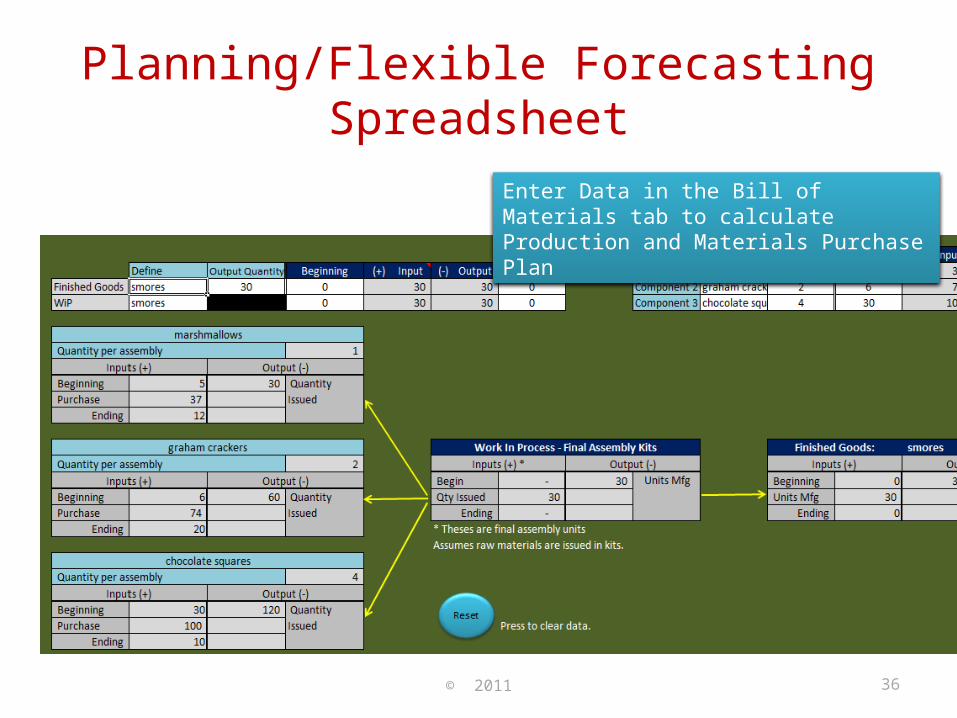
Planning/Flexible Forecasting Spreadsheet
Enter Data in the Bill of Materials tab to calculate Production and Materials Purchase Plan
© 2011 37
Practical Exercise
• Complete Practical Exercise