Embed Size (px)
Citation preview

Contents lists available at ScienceDirect
Applied Energy
journal homepage: www.elsevier.com/locate/apenergy
Calculation and analysis of efficiencies and annual performances of Power-to-Gas systems
Elimar Frank, Jachin Gorre⁎, Fabian Ruoss, Markus J. FriedlUniversity of Applied Science Rapperswil, Institute for Energy Technology, Oberseestrasse 10, CH-8640 Rapperswil, Switzerland
H I G H L I G H T S
• Comprehensive, universal and unambiguous approach to evaluate the efficiency.
• The approach allows any plant configuration.
• The unambiguous assignment of the efficiency to a system boundary makes comparability easier.
• The plant can be characterized with an annual performance over one year and not with one operating point.
A R T I C L E I N F O
Keywords:Power-to-GasElectrolysisMethanationEfficiencyAnnual performanceSystem boundary
A B S T R A C T
This paper describes a generic and systematic method to calculate the efficiency and the annual performance forPower-to-Gas (PtG) systems. This approach gives the basis to analytically compare different PtG systems usingdifferent technologies under different boundary conditions. To have a comparable basis for efficiency calcula-tions, a structured break down of the PtG system is done. Until now, there has not been a universal approach forefficiency calculations. This has resulted in a wide variety of efficiency calculations used in feasibility studies andfor business-case calculations. For this, the PtG system is divided in two sub-systems: the electrolysis and themethanation. Each of the two sub-systems consists of several subsystem boundary levels. Staring from the mainunit, i.e. the electrolysis stack and/or methanation reactor, further units that are required to operate completePtG system are considered with their respective subsystem boundary conditions.
The paper provides formulas how the efficiency of each level can be calculated and how efficiency deviationscan be integrated which are caused by the extended energy flow calculations to and from energy users andthermal losses. By this, a sensitivity analysis of the sub-systems can be gained and comprehensive goal functionsfor optimizations can be defined.
In a second step the annual performance of the system is calculated as the ratio of useable output and en-ergetic input over one year. The input is the integral of the annual need of electrical and thermal energy of a PtGsystem, depending on the different operation states of the plant. The output is the higher heating value of theproduced gas and – if applicable – heat flows that are used externally.
The annual performance not only evaluates the steady-state operating efficiency under full load, but alsoother states of the system such as cold standby or service intervals. It is shown that for a full system operationassessment and further system concept development, the annual performance is of much higher importance thanthe steady-state system efficiency which is usually referred to.
In a final step load profiles are defined and the annual performance is calculated for a specific system con-figuration. Using this example, different operation strategies are compared.
1. Introduction
Power-to-Gas (PtG) systems use electric energy to produce hydrogenor methane. The hydrogen is generated in a first step by electrolysis. Inan optional second step which is usually referred to as “methanation”,
the hydrogen is mixed with carbon dioxide and converted into me-thane. If the latter is synthesized as described, it is also referred to assynthetic natural gas (SNG).
With PtG systems, seasonal storage of renewable electrical energycan be achieved. Boer et al. [1] compare the performance of PtG
https://doi.org/10.1016/j.apenergy.2018.02.105Received 31 October 2017; Received in revised form 14 February 2018; Accepted 15 February 2018
⁎ Corresponding author.E-mail address: [email protected] (J. Gorre).
Applied Energy 218 (2018) 217–231
0306-2619/ © 2018 The Author(s). Published by Elsevier Ltd. This is an open access article under the CC BY license (http://creativecommons.org/licenses/BY/4.0/).
T

systems as a storage technique with the most cost effective storageoptions at the current time. Aiming at the assessment of the future roleof PtG or the transition of national energy supply concepts, Schieberet al. [2] and Gutierres and Rodriguez [3] show how PtG can be used tostore terawatt hours (TWh) of energy for long term.
In addition to the effect of seasonal storage, PtG provides flexibilityand stability in the electricity grid due to providing secondary controlreserve [4], using surplus electricity [5–7] or due to coupling withenergy production facilities directly, as investigated in [8,9]. PtG is alsodescribed in literature as an economic alternative to network expansion[10]. All contributions cited so far are based on an average efficiencyfor the performance of the PtG systems.
A view on techno-economic analysis of different PtG concepts aredone by [11,12]. The studies of [13–15], complemented the techno-economic analysis with a life cycle assessment. The key messages of[16,17] are the feasibility of improving the efficiency and reduction ofCO2 emissions with PtG in the electrochemical and steel industry.
Increasing the hydrogen content in the injected gas increases theefficiency of a PtG plant, as more of the gas does not undergo themethanation process with its associated losses. PtG allows to increasethe hydrogen contend of the natural gas. Hydrogen-rich natural gasreduces emissions of carbon monoxide, nitrogen oxides and unburnedhydrocarbons [18–20]. The implication of different gas qualities on enduser devices has been investigated by [21,22]. A decreasing energy dutyis one negative aspect of hydrogen-rich gases.
Focusing on different PtG applications and different aspects of PtG,the results and conclusions of the currently available publications andstudies are difficult to compare with each other. When calculating theefficiency of a PtG system or the amount of gas produced, some pub-lications use values from own equilibrium simulations, e.g., [23], othersrely on literature studies and select values from other publications, e.g.[5,13,15,24], which are mostly not deduced from scientific analysis bute.g. specific field experience. Also the description of plant operation aredifficult to compare since deviating measuring points and process
Nomenclature
PtG Power-to-GasSBL sub-system boundary levelTA temperature adjustment (of methanation)HHV higher heating value [kWh /kgch ]px y. pressure [barg]mx y. mass flow [kg/h]Ex y. energy flow across the boundaries of SBL x .y [kW]Eth x y, . flow of thermal energy contained in a flow of fluid across
the boundaries of SBL x .y [kW ]thEch x y, . flow of chemical energy expressed with the higher heating
value contained in a flow of fluid across the boundaries ofSBL x .y [kW ]ch
Px y. electrical demand [kWel]Q x y. non-convective flow of thermal energy across the bound-
aries of SBL x .y [kW ]th
Hh z, higher heating value of media z. [kWhkg
ch ]
HΔV enthalpy of vaporization of water [kWhmol
]
averaged heat capacity at constant pressure [∗
kWhkg K
]
T temperature [°C]Tuse external useable temperature level of waste heat [°C]Tref reference temperature set to be = °T 25 Cref [°C]ηx y a. , efficiency with internal heat use
∗ηx y a. , efficiency with internal heat use and the external usage ofheat transferred over the boundaries of a sub-system.
ηx y b. , efficiency (internal heat use is not possible)ηHX heat recovery efficiencyAC alternating current [kWAC]DC direct current [kWDC]kWel kilowatt (electrical) [kWel]kWth kilowatt (thermal) [kWth]NOH non-operating hours [h]
Indices
x sub-system electrolyser =x 1 or methanation =x 2y sub-system boundary level (SBL)x y. variable concerning SBL x y. .z third index of efficiency designation describing the in-
ternal use of heat/mediuma internal use of waste heat of the sub-systemb no use of waste heat∗ additional external use of waste heat, which is not used
internally
0. System Power-to-Gas1. sub-system electrolysis2. sub-system methanationout output streami number/name of unitin input streamh higher (heating value)el electricalth thermalstack electrolysis stackely electrolyteH2 hydrogenO2 oxygenH2O waterpr product gasHS thermal energy supplyFC feed gas compressorMR methanation reactorGD gas dryingCM cooling mediapr productIC SNG compressor before injectionHX heat exchangerSNG synthetic natural gasref referencecir circulation pump of electrolyteuse usableTA temperature adjustment (of methanation)AC/DC alternating/direct current rectifierEHX electrical heatertrans transformerpermeate permeate from the product gas purification membraneAC alternating currentDC direct currentHM heat managementgrid electrical gridlosses losses of an unitgas gaseous medium at reference temperature (25 °C)liq liquid medium at reference temperature (25 °C) and am-
bient pressureeva evaporated medium, which is at reference temperature
(25 °C) liquidHΔ enthalpy of evaporation
HS thermal supply of water
E. Frank et al. Applied Energy 218 (2018) 217–231
218
parameter calculations are used. Beilera et al. [25], Gahlleitner [26]and Rönsch et al. [23] give an overview of the worldwide existing PtGprojects. Especially those approaches with less specific technical detailsare based on different system boundaries for calculating process para-meters and must therefore be interpreted differently since a commonmethod is lacking.
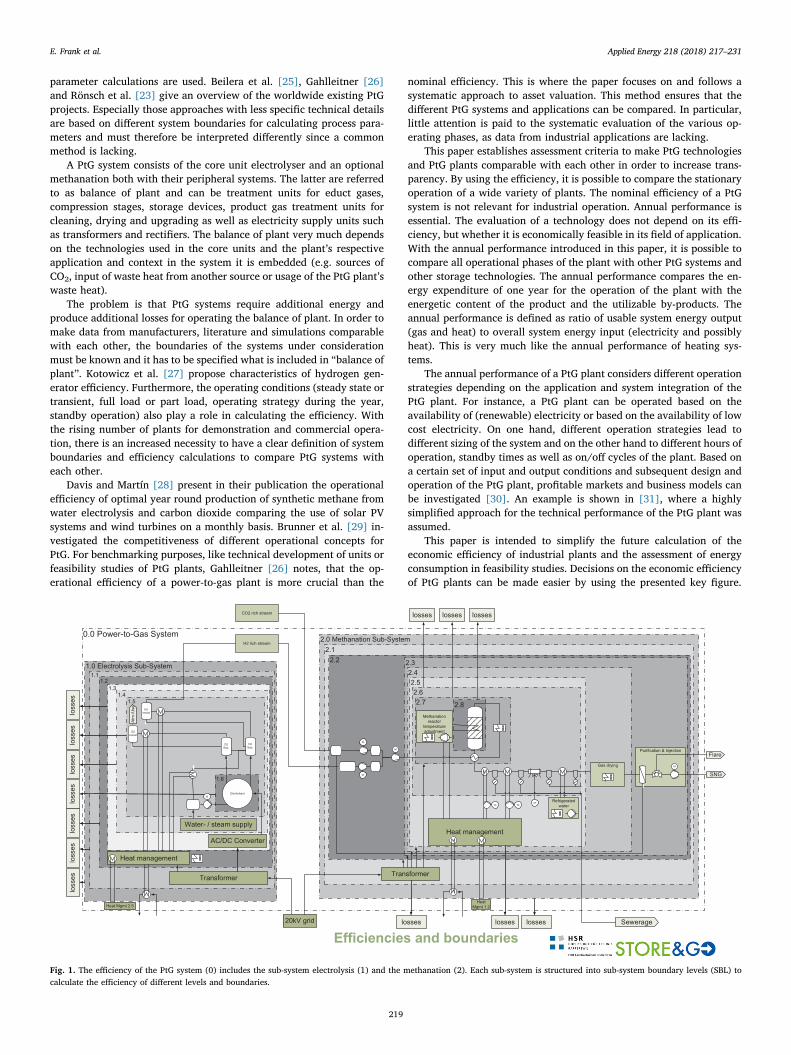
A PtG system consists of the core unit electrolyser and an optionalmethanation both with their peripheral systems. The latter are referredto as balance of plant and can be treatment units for educt gases,compression stages, storage devices, product gas treatment units forcleaning, drying and upgrading as well as electricity supply units suchas transformers and rectifiers. The balance of plant very much dependson the technologies used in the core units and the plant’s respectiveapplication and context in the system it is embedded (e.g. sources ofCO2, input of waste heat from another source or usage of the PtG plant’swaste heat).
The problem is that PtG systems require additional energy andproduce additional losses for operating the balance of plant. In order tomake data from manufacturers, literature and simulations comparablewith each other, the boundaries of the systems under considerationmust be known and it has to be specified what is included in “balance ofplant”. Kotowicz et al. [27] propose characteristics of hydrogen gen-erator efficiency. Furthermore, the operating conditions (steady state ortransient, full load or part load, operating strategy during the year,standby operation) also play a role in calculating the efficiency. Withthe rising number of plants for demonstration and commercial opera-tion, there is an increased necessity to have a clear definition of systemboundaries and efficiency calculations to compare PtG systems witheach other.
Davis and Martín [28] present in their publication the operationalefficiency of optimal year round production of synthetic methane fromwater electrolysis and carbon dioxide comparing the use of solar PVsystems and wind turbines on a monthly basis. Brunner et al. [29] in-vestigated the competitiveness of different operational concepts forPtG. For benchmarking purposes, like technical development of units orfeasibility studies of PtG plants, Gahlleitner [26] notes, that the op-erational efficiency of a power-to-gas plant is more crucial than the
nominal efficiency. This is where the paper focuses on and follows asystematic approach to asset valuation. This method ensures that thedifferent PtG systems and applications can be compared. In particular,little attention is paid to the systematic evaluation of the various op-erating phases, as data from industrial applications are lacking.
This paper establishes assessment criteria to make PtG technologiesand PtG plants comparable with each other in order to increase trans-parency. By using the efficiency, it is possible to compare the stationaryoperation of a wide variety of plants. The nominal efficiency of a PtGsystem is not relevant for industrial operation. Annual performance isessential. The evaluation of a technology does not depend on its effi-ciency, but whether it is economically feasible in its field of application.With the annual performance introduced in this paper, it is possible tocompare all operational phases of the plant with other PtG systems andother storage technologies. The annual performance compares the en-ergy expenditure of one year for the operation of the plant with theenergetic content of the product and the utilizable by-products. Theannual performance is defined as ratio of usable system energy output(gas and heat) to overall system energy input (electricity and possiblyheat). This is very much like the annual performance of heating sys-tems.
The annual performance of a PtG plant considers different operationstrategies depending on the application and system integration of thePtG plant. For instance, a PtG plant can be operated based on theavailability of (renewable) electricity or based on the availability of lowcost electricity. On one hand, different operation strategies lead todifferent sizing of the system and on the other hand to different hours ofoperation, standby times as well as on/off cycles of the plant. Based ona certain set of input and output conditions and subsequent design andoperation of the PtG plant, profitable markets and business models canbe investigated [30]. An example is shown in [31], where a highlysimplified approach for the technical performance of the PtG plant wasassumed.
This paper is intended to simplify the future calculation of theeconomic efficiency of industrial plants and the assessment of energyconsumption in feasibility studies. Decisions on the economic efficiencyof PtG plants can be made easier by using the presented key figure.
0.0 Power-to-Gas System
1.0 Electrolysis Sub-System
2.0 Methanation Sub-System2.1
2.2 2.3
Purification & Injection
2.42.52.62.7 2.8
1.11.2
1.31.4
1.5
1.6
Methanation reactor
temperature adjustment
Sewerage
Gas drying
Efficiencies and boundaries
CO2 rich stream
Electrolyser
H2vessel
O2 vessel
O2Sep.
H2Sep.
Atm
./Use
Water- / steam supply
AC/DC Converter
Transformer
Heat management
loss
eslo
sses
loss
es
20kV grid
Refrigerated water
SNG
Flare
Transformer
losses
Heat management
losses losses
losseslosseslosses
loss
eslo
sses
loss
eslo
sses
M
M
M
M
MM
M
M
H2 rich stream
Heat Mgmt 2.5Heat
Mgmt 1.2
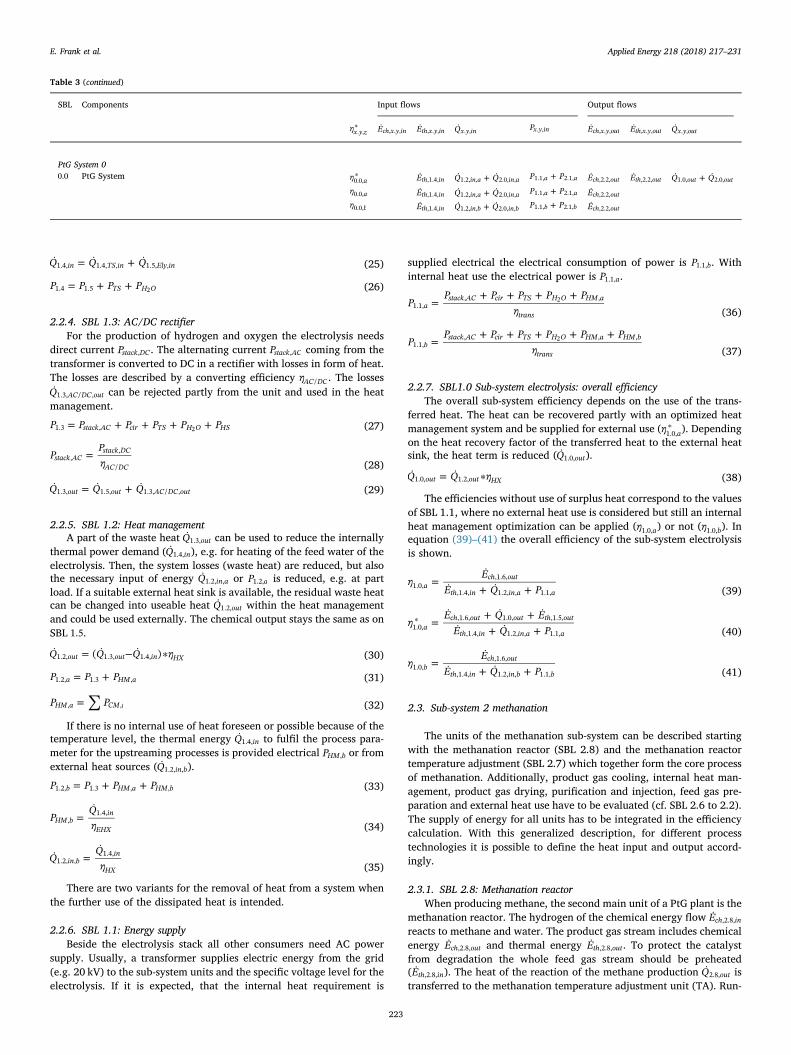
Fig. 1. The efficiency of the PtG system (0) includes the sub-system electrolysis (1) and the methanation (2). Each sub-system is structured into sub-system boundary levels (SBL) tocalculate the efficiency of different levels and boundaries.
E. Frank et al. Applied Energy 218 (2018) 217–231
219
Section 2Section 2.1 describes a generic PtG system definition, breaking the
system down into the two sub-systems of electrolysis and methanation.Each sub-system has a core process unit and is extended with sub-system boundary levels (SBL) according to an onion-shell principle. TheSBLs of the sub-system electrolysis are described in Section 2.2, theSBLs of the methanation in Section 2.3. The overall efficiency of the PtGsystem is defined in Section 2.4 and the quantities derived from it de-scribing the annual performance are defined in Section 2.5 . Section 2.6lists the parameters required as input data when applying the method.
In Section 3, the method is applied to hypothetical examples of apower-to-gas system. The results of efficiency calculation are presentedin Sections 3.1.1–3.1.3 for the sub-system electrolysis, methanation andthe PtG system. With the efficiency calculation of the entire system andthe definition of different energetic operation modes of the system overa year, the annual performances is calculated in Section 3.2.
With the results of this paper, a complete analysis and assessment oftechno-economic indicators are possible and make them comparablewith the values of other plants.
2. Methods
2.1. System description and efficiencies
In this paper “Power-to-Gas system” refers to a complete PtG plantas shown in Fig. 1. It comprises two sub-systems: electrolysis denotedby index =x 1 and methanation denoted by index =x 2. Within both ofthese main parts, sub-system boundary levels (SBL x y. ) are defined,which include different parts of the plant equipment. The SBLs containbalance of plant units required for it operation. Each time a new sub-system boundary level is added to the core, the efficiency is labelledwith new indices and an asterisk. Through this procedure, the notationindicates systematically which units are included in the respective ef-ficiency calculation. By defining these numbering and system bound-aries within a sub-system, it is possible to compare any system design,despite the complexity and individuality of each system. It starts withthe electrolyser and all its balance of plant denoted as SBL 1.0 down toits core component the bare electrolyser stack denoted as SBL 1.6. Themethanation with the entire balance of plant is SBL 2.0 and the me-thanation reactor only is SBL 2.8. The structure is also shown in Table 3.
All efficiencies η of the entire system, of the sub-systems and of theSBLs are defined as quotients of flows of usable output power Eout toinput power Ein.
=η EE
out
in (1)
The efficiency ηx y z. , has three indexes. The first two identify the SBLaccording to Fig. 1 and Table 3. The third index is =z a if the efficiencyincludes heat used somewhere else in the same sub-system or PtGsystem 0.0. This is for instance the case when looking at efficiencies ofthe Methanation Sub-System, if the thermal energy flow of the hotmethane from SBL 2.8 is used to preheat any of the media in the samesub-system. If the output of thermal energy is not used inside thepower-to-gas system, it can’t be considered in the efficiency which isindicated by the third index being =z b. An additional asterisk to theefficiency variable ∗ηx y z. , indicates that heat leaving the SBL is usedoutside the sub-system considered or the PtG system. An overview onhow efficiencies are denominated depending on whether heat usedinternal or external of the power-to-gas system is given in Table 1.
The primary output of a PtG plant is the chemical energy containedin the gas produced calculated according to Eq. (4). The first priority ofa PtG plant is to provide as much chemical energy as possible. To in-crease the efficiency, the part of the heat ejected by one component,which is above the usable temperature Tuse can be used internal of thePtG plant in a heat sink as a second priority. If a relevant amount ofrejected heat is still available above the useable temperature Tuse, it can
be used external of the plant as a third priority. This increases the ef-ficiency according to the previous definitions. The temperature Tuse,above which heat is considered useable, is determined specifically foreach specific system concept.
In the PtG system and its SBLs x y. , we consider four different formsof power and energy flows: Electric power Px y. , flow of chemical energyEch x y, . , convective flow of thermal energy Eth x y, . and non-convective flowof thermal energy Q x y. . Flows into the system boundaries are indicatedwith the index “in” and flows out of the system are indicated with index“out”. Further indices indicate the fluid containing the chemical orthermal energy flow.
The output power is the sum of all flows of chemical energy Ech x y out, . ,
and usable thermal energies Eth x y out, . , and Q x y out. , . The input power is thesum of all flows of electricity Px y. , chemical energy Ech x y in, . , and thermalenergies Eth x y in, . , and Q x y in. , .
= + + +E E E Q P x y in ch x y in th x y in x y in x y. , , . , , . , . , . (2)
= + +E E E Q x y out ch x y out th x y out x y out. , , . , , . , . , (3)
The flows of chemical energy Ech x y, . are calculated in using thehigher heating value Hh.
=E m H ·ch x y x y h, . . (4)
Convective flows of thermal energy into the system boundaryEth x y in, . , , contained thermal energy of gaseous, liquid or evaporatedmedia. The flow of the non-condensable gases N2, O2, H2, CO2 and CH4,are calculated in using the heat capacity cp gas, averaged over the tem-perature range between = °T 25 Cref and the temperature T of the gasaccording to equation (5). Linear regressions for averaged heat capa-cities cp gas, are given in Table 2.
= −E m c T T · ·( )th x y gas in gas p gas ref, . , , , (5)
For liquid media the convective flow of the thermal energy Eth liq in, , iscalculated according to Eq. (6) in using the heat capacity cp liq, of theliquid averaged over the temperature range between its temperature Tand the reference temperature = °T 25 Cref . If the liquid medium isevaporated, i.e. liquid water to steam, the heat capacity cp liq, of the li-quid is averaged over the temperature range between Tref and theevaporation temperature TΔH , the heat of evaporation H TΔ ( )H ΔH at TΔHas well the heat capacity cp liq eva, , of the evaporated medium averagedover the temperature range between TΔH and the media temperature Thave to be considered to calculate the flow of thermal energy Eth liq eva in, , ,according to Eq. (7). Linear regressions for averaged heat capacities cp liq,and cp liq eva, , and the heat of evaporation of water are given in Table 2.
= −E m c T T · ·( )th x y liq in liq p liq ref, . , , , (6)
= − + + −E m c T T H T c T T ·( ·( ) Δ ( ) ·( ))th x y liq eva in liq p liq ref V p liq eva, . , , , , Δ Δ , , ΔH H H
(7)
When flows of thermal energy Eth x y out, . , out of the SBL are used ex-ternal of the sub-system considered or PtG system, they are not calcu-lated in using the range between the medium’s temperature T and thereference temperature Tref but only the range between the medium’stemperature T and the temperature Tuse above which heat can be used.
Table 1Definition of efficiency denomination.
Heat is used internal of the PtGsystem
Yes No3rd index is a 3rd index is b
Excess heat is used outside of thesub-system or PtG system
Yes ∗η ∗ηx y a. ,∗ηx y b. ,
No η ηx y a. , ηx y b. ,
E. Frank et al. Applied Energy 218 (2018) 217–231
220
For a gas, the flow of thermal energy Eth x y gas out, . , , is calculated accordingto Eq. (8).
= −E m c T T · ·( )th x y gas out gas p gas use, . , , , (8)
The thermal energy in the flow of a liquid media in its liquid orevaporated state are given in Eqs. (9) and (10) respectively.
= −E m c T T · ·( )th x y liq out liq p liq use, . , , , (9)
= − + + −E m c T T H T c T T ·( ·( ) Δ ( ) ·( ))th x y liq eva out liq p liq use V p liq eva, . , , , , Δ Δ , , ΔH H H
(10)
According to Eqs. (4)–(12), a fluid flow has neither chemical northermal energy if the fluid has no heating value (N2, O2, CO2 and H2O),its temperature is = °T 25 Cref and in the case of water, it is in its liquidstate. This represents the origin in the enthalpy scale chosen in thispaper.Qth x y, . denotes the non-convective heat transfer in or out of a SBL.Assuming a fluid, that do not change the phase, the change in thematerial density, due to temperature and pressure variation can beneglected, the heat capacity is calculated with the equations fromTable 2. The non-convective heat transfer into the system
Qth x y in, . , and out of the system are given in Eqs. (12) and (11) re-spectively.
= −Q m c · ·(T T )th x y out x y p, . , . use (11)
and
= −Q m c · ·(T T )th x y in x y p ref, . , . (12)
If heat is transferred from one medium to another with the sameproperties, the heat recovery efficiency ηHX can be used for calculatingthe transferred heat.
=−
−η T T
T THX2 1
3 1 (13)
Summarized for each SBL, sub-system and the whole PtG system thepotential energy flows for calculating an efficiency are listed in Table 3.Eqs. (2), (3) and (14) define the calculation of the efficiency of a PtGsystem, sub-system or SBL. Each energy flow is descripted for theelectrolyser sub-system in Section 2.2 and for the methanation sub-system in Section 2.3. The potential energy flows have to be checked foreach project individually
=∗ηEE
x y out
x y inx.y,z
. ,
. , (14)
2.2. Sub-System 1 electrolysis
The electrolysis sub-system 1 can be described starting with the sub-system boundary levels electrolysis stack, electrolyte circuit and pro-duct gas treatment (SBL 1.6 and 1.5 in Fig. 1) which represent theprocedural levels. Additionally, the heat management and the supply of
water or steam is considered and are included when applying the cal-culation method. On the electrical side the transformer and the rectifierare considered. Both have to be integrated in the calculation of theefficiency of an electrolysis sub-system. This section covers conven-tional technologies as the alkaline electrolyser and the PEM electrolyserboth fed with liquid water. It also covers the Solid Oxide ElectrolyserCell (SOEC) using hot steam.
2.2.1. SBL 1.6: Electrolysis stackThe core element of the electrolysis sub-system is the electrolysis
stack. Depending on the connected load several electrolysis stacks canbe operated in parallel mode. The efficiency ∗η a1.6, is a quotient with thenumerator containing the chemical power Ech out,1.6, in the hydrogen flowand the thermal power Eth out,1.6, above Tuse in the flows of hydrogen(Eth H out,1.6, ,2 ), oxygen (Eth O out,1.6, ,2 ) and electrolyte (Eth ely out,1.6, , ). The de-nominator is the electrical input power (Pel,1.6) and thermal energyEth in,1.6, in the electrolyte (Eth ely in,1.6, , ).
If none of the heat rejected by the electrolyser stack is used ex-ternally, the efficiencies of SBL 1.6 η a1.6, , internal heat use only, andη b1.6, , non heat use internal either external are lower.
=E E th in th ely in,1.6, ,1.6, , (15)
=P Pstack DC1.6 , (16)
=E m H ·ch out H h H,1.6, 1.6, 2 , 2 (17)
= + +E E E E th out th H out th O out th ely out,1.6, ,1.6, , ,1.6, , ,1.6, ,2 2 (18)
2.2.2. SBL 1.5: Electrolyte or water circuitIn an electrolysis process, the flow of electrolyte has to be main-
tained, controlled and circulated requiring the electric power Pcir . Inmost cases, this is done with a pump. During start-up and during op-eration both in part-load as well as full-load the temperature of theelectrolyte has to be kept at operation temperature. Therefore de-pending on the insulation thermal power Q in1.5, has to be suppliedthermal (Q in1.5, ) or electrical (PHS), rejected thermal power is describedwith Q out1.5, . The thermal power is rejected from gaseous products of theelectrolysis process and the electrolyte. The gases have to be condi-tioned depending on the downstream processes or use. The heat fromcooling the gas and the electrolyte is transferred to a cooling circuitmedium, again with losses depending on insulation. The amount ofthermal energy Eth H O, 2 in the water supplied to the process is given byits temperature T and whether the water is liquid or gaseous accordingEqs. (6) and (7).
=E E th in th H O in,1.5, ,1.5, 2 , (19)
=Q Q in Ely in1.5, 1.5, , (20)
= + +P P P Pcir HS1.5 1.6 (21)
= +E E E th out th H out th O out,1.5, ,1.5, , ,1.5, ,2 2 (22)
= + +Q Q Q Q out H out O out Ely out1.5, 1.5, 2, 1.5, 2, 1.5, , (23)
2.2.3. SBL 1.4: Water/steam supplyThe inputs for the electrolysis are electricity and water. The supply
of water can be liquid or gaseous depending on the electrolysis processdesign. The thermal energy to fulfil the process parameter for the up-streaming processes is provided from the heat management in SBL 1.2(Q TS in1.4, , ), electrical (PTS) or is already part of the fresh water streamE H O in1.4, 2 , . Electricity PH O2 is needed to transport water or steam to theprocess upstream of this SBL or for electrical supply of thermal energy,while the output stays the same as on SBL 1.5.
=E E th in H O in,1.4, 1.4, 2 , (24)
Table 2Values and linear regressions for averaged heat capacities proposed for the calculation ofthermal energy flows according Eqs. (5)–(11) and (13).
Oxygen O2 for ≈ + −c T885.4 0.071 ·( 273.15 K)p O, 2J
kg·KJ
kg·K2
Hydrogen H2 for ≈ + −c T13973.4 1.256 ·( 273.15 K)p H, 2J
kg·KJ
kg·K2
Carbon dioxide CO2 for ≈ + −c T617.3 0.950 ·( 273.15 K)p CO, 2J
kg·KJ
kg·K2
Methane CH4 for ≈ + −c T1282.4 2.828 ·( 273.15 K)p CH, 4J
kg·KJ
kg·K2
Liquid water for° < < °T1 C 286 C
≈ + −c T4075 0.806 ·( 273.15 K)p H O l, 2 ,J
kg·KJ
kg·K2
Steam for ° < < °T1 C 1000 C ≈ + −c T1864 0.295 ·( 273.15 K)p H O g, 2 ,J
kg·KJ
kg·K2
Evaporation enthalpy of water at°100 C
° =HΔ (100 C) 2.26·10 J/kgV 6
E. Frank et al. Applied Energy 218 (2018) 217–231
221
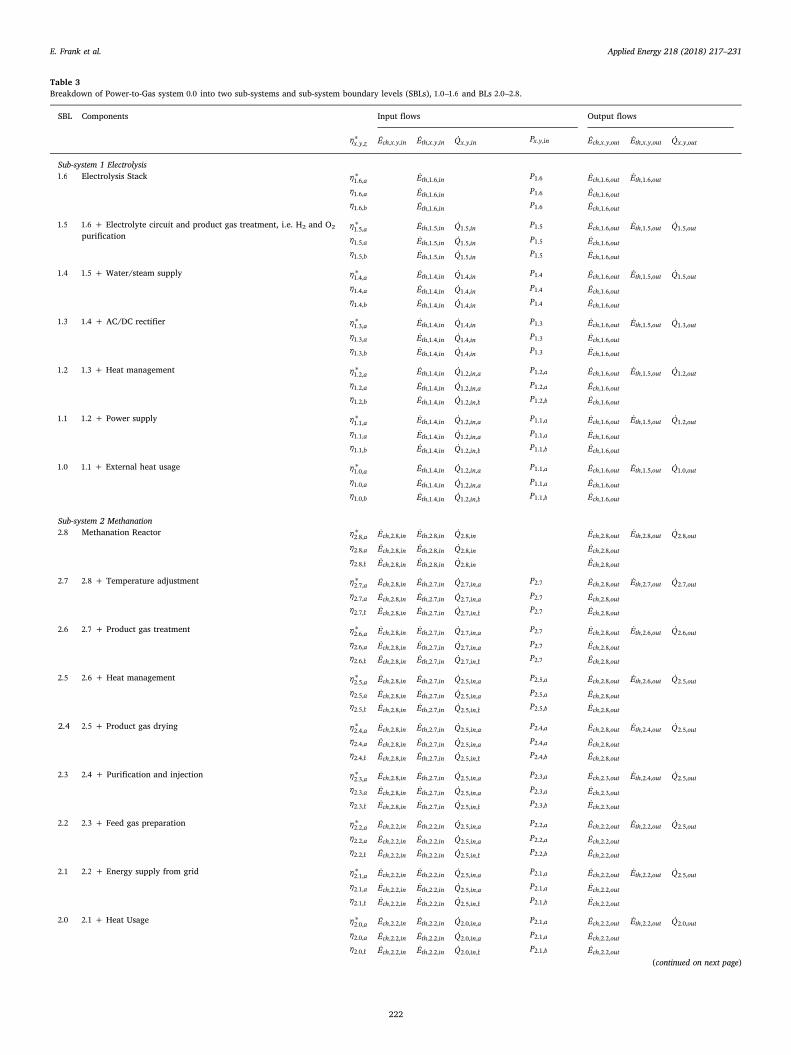
Table 3Breakdown of Power-to-Gas system 0.0 into two sub-systems and sub-system boundary levels (SBLs), 1.0–1.6 and BLs 2.0–2.8.
SBL Components Input flows Output flows
∗ηx y z. , Ech x y in, . , Eth x y in, . , Q x y in. , Px y in. , Ech x y out, . , Eth x y out, . , Q x y out. ,
Sub-system 1 Electrolysis1.6 Electrolysis Stack ∗η a1.6, Eth in,1.6, P1.6 Ech out,1.6, Eth out,1.6,
η a1.6, Eth in,1.6, P1.6 Ech out,1.6,η b1.6, Eth in,1.6, P1.6 Ech out,1.6,
1.5 1.6 + Electrolyte circuit and product gas treatment, i.e. H2 and O2
purification
∗η a1.5, Eth in,1.5, Q in1.5, P1.5 Ech out,1.6, Eth out,1.5, Q out1.5,
η a1.5, Eth in,1.5, Q in1.5, P1.5 Ech out,1.6,
η b1.5, Eth in,1.5, Q in1.5, P1.5 Ech out,1.6,
1.4 1.5 + Water/steam supply ∗η a1.4, Eth in,1.4, Q in1.4, P1.4 Ech out,1.6, Eth out,1.5, Q out1.5,
η a1.4, Eth in,1.4, Q in1.4, P1.4 Ech out,1.6,
η b1.4, Eth in,1.4, Q in1.4, P1.4 Ech out,1.6,
1.3 1.4 + AC/DC rectifier ∗η a1.3, Eth in,1.4, Q in1.4, P1.3 Ech out,1.6, Eth out,1.5, Q out1.3,
η a1.3, Eth in,1.4, Q in1.4, P1.3 Ech out,1.6,η b1.3, Eth in,1.4, Q in1.4, P1.3 Ech out,1.6,
1.2 1.3 + Heat management ∗η a1.2, Eth in,1.4, Q in a1.2, , P a1.2, Ech out,1.6, Eth out,1.5, Q out1.2,
η a1.2, Eth in,1.4, Q in a1.2, , P a1.2, Ech out,1.6,
η b1.2, Eth in,1.4, Q in b1.2, , P b1.2, Ech out,1.6,
1.1 1.2 + Power supply ∗η a1.1, Eth in,1.4, Q in a1.2, , P a1.1, Ech out,1.6, Eth out,1.5, Q out1.2,
η a1.1, Eth in,1.4, Q in a1.2, , P a1.1, Ech out,1.6,η b1.1, Eth in,1.4, Q in b1.2, , P b1.1, Ech out,1.6,
1.0 1.1 + External heat usage ∗η a1.0, Eth in,1.4, Q in a1.2, , P a1.1, Ech out,1.6, Eth out,1.5, Q out1.0,
η a1.0, Eth in,1.4, Q in a1.2, , P a1.1, Ech out,1.6,
η b1.0, Eth in,1.4, Q in b1.2, , P b1.1, Ech out,1.6,
Sub-system 2 Methanation2.8 Methanation Reactor ∗η a2.8, Ech in,2.8, Eth in,2.8, Q in2.8, Ech out,2.8, Eth out,2.8, Q out2.8,
η a2.8, Ech in,2.8, Eth in,2.8, Q in2.8, Ech out,2.8,
η b2.8, Ech in,2.8, Eth in,2.8, Q in2.8, Ech out,2.8,
2.7 2.8 + Temperature adjustment ∗η a2.7, Ech in,2.8, Eth in,2.7, Q in a2.7, , P2.7 Ech out,2.8, Eth out,2.7, Q out2.7,
η a2.7, Ech in,2.8, Eth in,2.7, Q in a2.7, , P2.7 Ech out,2.8,η b2.7, Ech in,2.8, Eth in,2.7, Q in b2.7, , P2.7 Ech out,2.8,
2.6 2.7 + Product gas treatment ∗η a2.6, Ech in,2.8, Eth in,2.7, Q in a2.7, , P2.7 Ech out,2.8, Eth out,2.6, Q out2.6,
η a2.6, Ech in,2.8, Eth in,2.7, Q in a2.7, , P2.7 Ech out,2.8,
η b2.6, Ech in,2.8, Eth in,2.7, Q in b2.7, , P2.7 Ech out,2.8,
2.5 2.6 + Heat management ∗η a2.5, Ech in,2.8, Eth in,2.7, Q in a2.5, , P a2.5, Ech out,2.8, Eth out,2.6, Q out2.5,
η a2.5, Ech in,2.8, Eth in,2.7, Q in a2.5, , P a2.5, Ech out,2.8,η b2.5, Ech in,2.8, Eth in,2.7, Q in b2.5, , P b2.5, Ech out,2.8,
2.4 2.5 + Product gas drying ∗η a2.4, Ech in,2.8, Eth in,2.7, Q in a2.5, , P a2.4, Ech out,2.8, Eth out,2.4, Q out2.5,
η a2.4, Ech in,2.8, Eth in,2.7, Q in a2.5, , P a2.4, Ech out,2.8,
η b2.4, Ech in,2.8, Eth in,2.7, Q in b2.5, , P b2.4, Ech out,2.8,
2.3 2.4 + Purification and injection ∗η a2.3, Ech in,2.8, Eth in,2.7, Q in a2.5, , P a2.3, Ech out,2.3, Eth out,2.4, Q out2.5,
η a2.3, Ech in,2.8, Eth in,2.7, Q in a2.5, , P a2.3, Ech out,2.3,
η b2.3, Ech in,2.8, Eth in,2.7, Q in b2.5, , P b2.3, Ech out,2.3,
2.2 2.3 + Feed gas preparation ∗η a2.2, Ech in,2.2, Eth in,2.2, Q in a2.5, , P a2.2, Ech out,2.2, Eth out,2.2, Q out2.5,
η a2.2, Ech in,2.2, Eth in,2.2, Q in a2.5, , P a2.2, Ech out,2.2,η b2.2, Ech in,2.2, Eth in,2.2, Q in b2.5, , P b2.2, Ech out,2.2,
2.1 2.2 + Energy supply from grid ∗η a2.1, Ech in,2.2, Eth in,2.2, Q in a2.5, , P a2.1, Ech out,2.2, Eth out,2.2, Q out2.5,
η a2.1, Ech in,2.2, Eth in,2.2, Q in a2.5, , P a2.1, Ech out,2.2,
η b2.1, Ech in,2.2, Eth in,2.2, Q in b2.5, , P b2.1, Ech out,2.2,
2.0 2.1 + Heat Usage ∗η a2.0, Ech in,2.2, Eth in,2.2, Q in a2.0, , P a2.1, Ech out,2.2, Eth out,2.2, Q out2.0,
η a2.0, Ech in,2.2, Eth in,2.2, Q in a2.0, , P a2.1, Ech out,2.2,η b2.0, Ech in,2.2, Eth in,2.2, Q in b2.0, , P b2.1, Ech out,2.2,
(continued on next page)
E. Frank et al. Applied Energy 218 (2018) 217–231
222
= +Q Q Q in TS in Ely in1.4, 1.4, , 1.5, , (25)
= + +P P P PTS H O1.4 1.5 2 (26)
2.2.4. SBL 1.3: AC/DC rectifierFor the production of hydrogen and oxygen the electrolysis needs
direct current Pstack DC, . The alternating current Pstack AC, coming from thetransformer is converted to DC in a rectifier with losses in form of heat.The losses are described by a converting efficiency ηAC DC/ . The lossesQ AC DC out1.3, / , can be rejected partly from the unit and used in the heatmanagement.
= + + + +P P P P P Pstack AC cir TS H O HS1.3 , 2 (27)
=PPηstack ACstack DC
AC DC,
,
/ (28)
= +Q Q Q out out AC DC out1.3, 1.5, 1.3, / , (29)
2.2.5. SBL 1.2: Heat managementA part of the waste heat Q out1.3, can be used to reduce the internally
thermal power demand (Q in1.4, ), e.g. for heating of the feed water of theelectrolysis. Then, the system losses (waste heat) are reduced, but alsothe necessary input of energy Q in a1.2, , or P a1.2, is reduced, e.g. at partload. If a suitable external heat sink is available, the residual waste heatcan be changed into useable heat Q out1.2, within the heat managementand could be used externally. The chemical output stays the same as onSBL 1.5.
= − ∗Q Q Q η ( )out out in HX1.2, 1.3, 1.4, (30)
= +P P Pa HM a1.2, 1.3 , (31)
∑=P PHM a CM i, , (32)
If there is no internal use of heat foreseen or possible because of thetemperature level, the thermal energy Q in1.4, to fulfil the process para-meter for the upstreaming processes is provided electrical PHM b, or fromexternal heat sources (Q in b1.2, , ).
= + +P P P Pb HM a HM b1.2, 1.3 , , (33)
=PQη
HM b
in
EHX,
1.4,
(34)
=QQη
in bin
HX1.2, ,
1.4,
(35)
There are two variants for the removal of heat from a system whenthe further use of the dissipated heat is intended.
2.2.6. SBL 1.1: Energy supplyBeside the electrolysis stack all other consumers need AC power
supply. Usually, a transformer supplies electric energy from the grid(e.g. 20 kV) to the sub-system units and the specific voltage level for theelectrolysis. If it is expected, that the internal heat requirement is
supplied electrical the electrical consumption of power is P b1.1, . Withinternal heat use the electrical power is P a1.1, .
=+ + + +
PP P P P P
ηastack AC cir TS H O HM a
trans1.1,
, ,2
(36)
=+ + + + +
PP P P P P P
ηbstack AC cir TS H O HM a HM b
trans1.1,
, , ,2
(37)
2.2.7. SBL1.0 Sub-system electrolysis: overall efficiencyThe overall sub-system efficiency depends on the use of the trans-
ferred heat. The heat can be recovered partly with an optimized heatmanagement system and be supplied for external use ( ∗η a1.0, ). Dependingon the heat recovery factor of the transferred heat to the external heatsink, the heat term is reduced (Q out1.0, ).
= ∗Q Q η out out HX1.0, 1.2, (38)
The efficiencies without use of surplus heat correspond to the valuesof SBL 1.1, where no external heat use is considered but still an internalheat management optimization can be applied (η a1.0, ) or not (η b1.0, ). Inequation (39)–(41) the overall efficiency of the sub-system electrolysisis shown.
=+ +
ηE
E Q P
a
ch out
th in in a a1.0,
,1.6,
,1.4, 1.2, , 1.1, (39)
=+ +
+ +∗η
E Q EE Q P
a
ch out out th out
th in in a a1.0,
,1.6, 1.0, ,1.5,
,1.4, 1.2, , 1.1, (40)
=+ +
ηE
E Q P
b
ch out
th in in b b1.0,
,1.6,
,1.4, 1.2, , 1.1, (41)
2.3. Sub-system 2 methanation
The units of the methanation sub-system can be described startingwith the methanation reactor (SBL 2.8) and the methanation reactortemperature adjustment (SBL 2.7) which together form the core processof methanation. Additionally, product gas cooling, internal heat man-agement, product gas drying, purification and injection, feed gas pre-paration and external heat use have to be evaluated (cf. SBL 2.6 to 2.2).The supply of energy for all units has to be integrated in the efficiencycalculation. With this generalized description, for different processtechnologies it is possible to define the heat input and output accord-ingly.
2.3.1. SBL 2.8: Methanation reactorWhen producing methane, the second main unit of a PtG plant is the
methanation reactor. The hydrogen of the chemical energy flow Ech in,2.8,reacts to methane and water. The product gas stream includes chemicalenergy Ech out,2.8, and thermal energy Eth out,2.8, . To protect the catalystfrom degradation the whole feed gas stream should be preheated(Eth in,2.8, ). The heat of the reaction of the methane production Q out2.8, istransferred to the methanation temperature adjustment unit (TA). Run-
Table 3 (continued)
SBL Components Input flows Output flows
∗ηx y z. , Ech x y in, . , Eth x y in, . , Q x y in. , Px y in. , Ech x y out, . , Eth x y out, . , Q x y out. ,
PtG System 00.0 PtG System ∗η a0.0, Eth in,1.4, +Q Q in a in a1.2, , 2.0, , +P Pa a1.1, 2.1, Ech out,2.2, Eth out,2.2, +Q Q out out1.0, 2.0,
η a0.0, Eth in,1.4, +Q Q in a in a1.2, , 2.0, , +P Pa a1.1, 2.1, Ech out,2.2,η b0.0, Eth in,1.4, +Q Q in b in b1.2, , 2.0, , +P Pb b1.1, 2.1, Ech out,2.2,
E. Frank et al. Applied Energy 218 (2018) 217–231
223

up needs additional thermal energy Q in2.8, , which is transferred from theTA to the reactor to reach the process parameter.
= +E E E ch in ch in ch Permeate,2.8, ,2.2, , (42)
=E E th in th Feed in,2.8, ,2.8, , (43)
=Q Q in MR in2.8, 2.8, , (44)
=E E ch out ch pr out,2.8, ,2.8, , (45)
=E E th out th pr out,2.8, ,2.8, , (46)
=Q Q out MR out2.8, 2.8, , (47)
2.3.2. SBL 2.7: Temperature adjustmentThe temperature of the methanation reactor is controlled to follow
specific process properties. The additional heat (Q TA in2.7, , ) for run-upand thermal power to reach the essential input temperature of the feedgas (Q Feed in2.7, , ) is provided by the heat management in SBL 2.5 (Q in2.7, )or electrical (PTA and PFeed). The steady operation usually needs heatdissipation out of the TA (Qth out,2.7, ).
=E E th in th Feed in,2.7, ,2.7, , (48)
= +Q Q Q in TA in Feed in2.7, 2.7, , 2.7, , (49)
= +P P PTA Feed2.7 (50)
=E E th out th pr out,2.7, ,2.7, , (51)
=Q Q out TA out2.7, 2.7, , (52)
= ∗ −Q m c T T | ( )Feed in p TT
in in2.7, , 2.3 ,2.7 2.8, 2.7,inin
2.7,2.8,
(53)
2.3.3. SBL 2.6: Product gas treatmentAfter reaction of feed gas to methane and water the products have to
be conditioned (active cooling and condensation of water) so that theproduct gas methane can be separated (Eth pr out,2.6, , ). The latent and thesensitive heat are received by cooling media Q CM out2.6, , .
=E E th out th pr out,2.6, ,2.6, , (54)
∑= +Q Q Q out CM i out TA out2.6, , , 2.7, , (55)
2.3.4. SBL 2.5: Heat managementThe heat of the product gas treatment processes and the reaction is
prepared to be used internally, combined internally and externally ornot at all. The surplus usable heat (Qth out,2.5, ) is available in the heatmanagement for externally use and increase the efficiency of the sub-system. The cooling media are circulated by pumps (PHM a, ) and run at aspecific load. For run-up or specific loads the thermal energy can besupplied from an external heat source (Q in2.5, ) or electrical P b2.5,
=QQη
inin
HX2.5,
2.7,
(56)
= +P P Pa HM a2.5, 2.7 , (57)
∑=P PHM a CM i, , (58)
= + +P P P Pb HM a HM b2.5, 2.7 , , (59)
=PQη
HM b
in
EHX,
2.7,
(60)
= − ∗Q Q Q η ( )out out in HX2.5, 2.6, 2.7, (61)
2.3.5. SBL 2.4: Product gas dryingAfter cooling of the product gas an additional drying unit may be
used to reach the required dew point for the injection into the gas grid.For this, additional energy is needed.
= +P P Pa b a b GD2.4, / 2.5, / (62)
=E E th out th pr out,2.4, ,2.4, , (63)
2.3.6. SBL 2.3: PurificationIf the gas quality of the non-condensational products of the me-
thanation reactor does not fulfil the quality for an injection in the gasgrid, an additional purification can be installed. The purification can bedone with a membrane. The product stream is split in the injectableSNG stream and the permeate stream. If the gas has to be compressedfor the designated application the electrical demand PPC has to beprovided.
= +P P Pa b a b PC2.3, / 2.4, / (64)
= +E E E ch out ch SNG ch Permeate,2.3, , , (65)
2.3.7. SBL 2.2: Methanation sub-system from feed gas preparation toinjection
After purification permeate can be returned and mixed with the feed(Ech in,2.2, ). The quality of the gaseous output, Ech out,2.2, and Eth out,2.2, , isconform to the injection requirement or designated application.
=E E ch in ch Feed in,2.2, , , (66)
=E E th in th Feed in,2.2, , , (67)
∑= +P P Pa b a b FC i2.2, / 2.3, / , (68)
=E E ch out ch SNG out,2.2, , , (69)
=E E th out th SNG out,2.2, , , (70)
2.3.8. SBL 2.1: Methanation sub-system with energy supply from gridHeating and cooling of the sub-system needs electrical units. The
supply for all units of the methanation is summarized in P2.1. Theequation includes the losses of the transformer from network level tothe consumer level.
=+ + + + + ∑
PP P P P P P
ηaTA Feed HM a GD PC FC i
trans2.1,
, ,
(71)
=+ + + + + + ∑
PP P P P P P P
ηbTA Feed HM a HM b GD PC FC i
trans2.1,
, , ,
(72)
2.3.9. Sub-system Methanation: Overall efficiencyThe overall sub-system efficiency depends on the use of the trans-
ferred heat. The heat can be recovered partly with an optimized heatmanagement system and be supplied for external use ( ∗η a2.0, ). Dependingon the use of heat, the heat term in the efficiency calculation has to bemultiplied by a heat recovery factor for heat exchanger.
= ∗Q Q η out out HX2.0, 2.5, (73)
Excess energy has to be rejected. The efficiencies without externaluse of surplus heat correspond to the values of SBL 2.1, where no ex-ternal heat use is considered but still an internal heat managementoptimization can be applied (η a2.0, ). A sub-system methanation withoutinternal and external use of heat is also possible (η b1.0, ). In equation(74)–(76) the overall efficiency of the sub-system methanation isshown.
E. Frank et al. Applied Energy 218 (2018) 217–231
224

=+ + +
ηE
E E Q P
a
ch out
ch in th in in a a2.0,
,2.2,
,2.2, ,2.2, 2.0, , 2.1, (74)
=+ +
+ + +∗η
E Q EE E Q P
a
ch out out th out
ch in th in in a a2.0,
,2.2, 2.0, ,2.2,
,2.2, ,2.2, 2.0, , 2.1, (75)
=+ + +
ηE
E E Q P
b
ch out
ch in th in in b b2.0,
,2.2,
,2.2, ,2.2, 2.0, , 2.1, (76)
2.4. Power-to-Gas System 0
The Power-to-Gas System 0 comprises the whole sub-system elec-trolyser and the sub-system methanation. The energy flows for calcu-lating the PtG system efficiency include all thermal, electrical, andconvective energy flows that cross the outer system boundary of thepower-to-gas system. The overall System efficiency depends on the useof the transferred heat from both sub-systems. The heat can be re-covered partly with an optimized heat management system and betransferred between both sub-systems. The exchange of heat for theinternal heating use takes place within the system boundary and is notcontained in the output energy flow, but leads to a reduction in theamount of energy supplied. The excess heat of the heat managementcan be supplied for external use.
The efficiency calculation of a system with several sub-systems de-pends on the structure of the concerned sub-systems. If a system hasseveral sub-systems, the efficiency of each sub-system can only bemultiplied for calculating the system efficiency, if the output of sub-system A corresponds to the input sub-system B, e.g. paddle wheel of aturbine and a connected generator. For the PtG system this does notapply. Each sub-system has additional auxiliary energies or auxiliarymedia that are added to the subsystem. Therefore, if further inputs areadded to sub-system B (e.g. methanation, input of A is the hydrogen,but in addition there is electricity for the consumption of the coolingunits and pumps to sub-system B), then the efficiency of the sub-systemscannot be multiplied. A new efficiency balance of the entire system hasto be drawn.
=+ + + +
ηE
E Q Q P P
a
ch out
th in in a in a a a0.0,
,2.2,
,1.4, 1.2, , 2.0, , 1.1. 2.1, (77)
=+ +
+ + + +∗η
E Q EE Q Q P P
a
ch out out th out
th in in a in a a a0.0,
,2.2, 2.0, ,2.2,
,1.4, 1.2, , 2.0, , 1.1. 2.1, (78)
=+ +
+ + + +∗η
E Q EE Q Q P P
a
ch out out th out
th in in a in a a a0.0,
,2.2, 1.0, ,2.2,
,1.4, 1.2, , 2.0, , 1.1. 2.1, (79)
=+ + +
+ + + +∗η
E Q Q EE Q Q P P
a
ch out out out th out
th in in a in a a a0.0,
,2.2, 1.0, 2.0, ,2.2,
,1.4, 1.2, , 2.0, , 1.1. 2.1, (80)
=+ + + +
ηE
E Q Q P P
b
ch out
th in in b in b b b0.0,
,2.2,
,1.4, 1.2, , 2.0, , 1.1. 2.1, (81)
2.5. Annual performance
While a first and rough estimation of a PtG plant performance canbe based on stationary (full load) efficiencies, the annual efficiency hasto consider more detailed specifications. In addition to the more de-tailed calculation of the performance in different load states (as de-scribed in the previous section), the distribution of full and part loadconditions throughout the year has to be assessed. Furthermore, theplant will not always be operated in full load or part load (i.e. pro-duction modes) but also in two other states: Hot standby (idle) or coldstandby (see Fig. 2).
The annual performance represents the distribution and sequence ofall different operation states over the year and calculates the overall
energy demand which is compared to the energetic output, consisting ofthe product gas and possibly also a usage of the heat rejected from theprocesses.
In order to be able to calculate the distribution and sequence of theoperation states several parameters have to be defined that are neces-sary to control the system operation accordingly:
1. Energy consumption for the states “Cold Standby”, “Hot standby”and “Production”
2. Energy consumption during transition from “Cold Standby” to “HotStandby”
3. System reaction times for changing the operation state
In status “Cold Standby” all reaction processes are stopped and thegas-bearing pipes are flushed with nitrogen. If necessary, a freezingprotection has to be applied for pipes filled with water. All safety-re-levant process units are kept in operation. The energy consumption forthe state “Cold Standby” is the demand of all parts keeping the systemin a useable mode: control, communication and safety feature andequipment, pumps of cooling media and electrolyte.
From the status “Hot Standby” the production of methane can startimmediately. To enter the status “Hot Standby”, first of all the sub-system methanation has to be heated up to the required process tem-peratures. The temperature control limit is 50 K/h to reduce thermalstress within the reactor. The electrolysis sub-system can be operatedvery dynamic with fast “cold-start” ability. In this paper it was assumedthat the temperature control of both subsystems would take the sametime. In addition, the maximum hydrogen product rate of the electro-lysis corresponds to the maximum input of methanation. The systemcould be optimized by a hydrogen buffer tank to operate the sub-sys-tems separately. This was not implemented here. The system has to beflushed with hydrogen to be ready for production. The electrolyzer isheated indirectly electrically, as a higher voltage than the thermo-neutral decomposition voltage of water is required for splitting water.This leads to heat generation and heats up the electrolyser. The me-thanation gets it heat from electrical heating of the media, temperingthe methanation reactor. The duration of ramping up depends on thesystem configuration. The status change from cold standby into hotstandby can take several hours.
If the PtG system remains in status “Hot Standby” the losses of heathave to be compensated. Almost all heat losses of the two sub-systemsshould origin from circulated media. For the electrolysis this is theelectrolyte and for the methanation the reactor temperature adjustmentmedia.
Considering this, the annual performance factor can be defined asquotient of the energy output (gas heating value and usable heat) of oneyear and the necessary electrical and thermal energy input to operatethe system or to keep it in standby mode. The output is defined as theproduced mass of SNG and the external used heat from the sub-systemselectrolyser and methanation. The input can be defined as the electricalinput and heat requirement for the whole system operation over oneyear. It is possible that the heat requirement of the system is deliveredelectrical.
Annual performance factor FPtG:
∫ ∫
∫ ∫ ∫
∫ ∫
=+ +
+ +
+ +
∗FE t dt Q t dt Q t dt
E t dt Q t dt Q t dt
P t dt P t dt
( ) ( ) ( ) ( ) ( ) ( )
( ) ( )
ach out out out
th in in a in a
a a
0.0,,2.0, 1.0, 2.0,
,1.4, 1.2, , 2.0, ,
1.1, 2.1, (82)
Fig. 2. Different states of a PtG-plant and the possible changeover between this states.
E. Frank et al. Applied Energy 218 (2018) 217–231
225
∫
∫ ∫ ∫
∫ ∫
=+ +
+ +
FE t dt
E t dt Q t dt Q t dt
P t dt P t dt
( ) ( ) ( ) ( )
( ) ( )
ach out
th in in a in a
a a
0.0,,2.0,
,1.4, 1.2, , 2.0, ,
1.1, 2.1, (83)
2.6. Calculation data
In order to compare the results of all unit efficiencies presented inSections 2.2 and 2.3, representative input data for the calculation of aPtG system were defined. Properties of gaseous compounds were cal-culated at standard condition (T=273.15 K, p=101325 Pa).
3. Results
For the exemplary calculation of SBL, sub-system and system effi-ciencies and annual performance presented in this section, an alkalineelectrolysis and a catalytic methanation has been assumed. The ex-ample is hypothetical but based on real case assumptions. All relevantdata are listed in Section 2.6.
3.1. Efficiency
A PtG plant may be operated in part load. Then, some units of thesub-equipment will still run at full load since a power control of the unitis not necessary, too expensive or not applicable. For instance, theelectrical heating of the drying unit only runs at full load operationmode. The electrolyte pump and the cooling unit should be adapted tothe load, to have an optimal heat recovery value. For calculating theenergy demand of the circulation pumps, however, a constant operationat full load may be expected.
The specific energy demand of the electrolysis may also change withpart load conditions, as well as the operation of the methanation.Therefore, if part load operation is considered, the dependency of thesub-system and system efficiencies has to be considered in the calcu-lations. In this paper, the dependency of efficiencies on part-load op-eration is neglected since currently almost all PtG plants will be oper-ated with 0/100% load conditions.
The calculation of the efficiency shows that the use of waste heat tocover internal heat sinks results in an increase of efficiency, since theenergy input of the sub-system is reduced. If waste heat is still availableafter internal heat use, the efficiency can be increased once more. Thecoverage of internal and external heat sinks is useful when the tem-perature levels of the two heat sinks do not overlap or the proportion of
waste heat is much greater than the proportion of internal heat. Then:> >∗η η ηx a x a x b.0, .0, .0, .
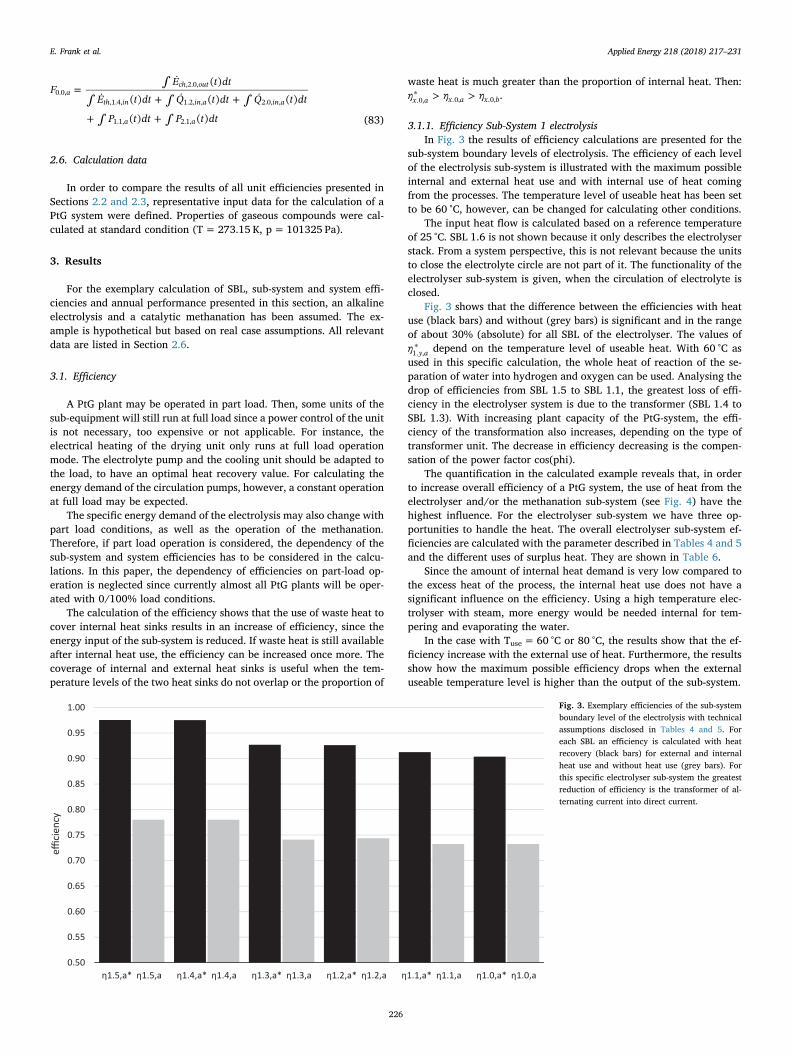
3.1.1. Efficiency Sub-System 1 electrolysisIn Fig. 3 the results of efficiency calculations are presented for the
sub-system boundary levels of electrolysis. The efficiency of each levelof the electrolysis sub-system is illustrated with the maximum possibleinternal and external heat use and with internal use of heat comingfrom the processes. The temperature level of useable heat has been setto be 60 °C, however, can be changed for calculating other conditions.
The input heat flow is calculated based on a reference temperatureof 25 °C. SBL 1.6 is not shown because it only describes the electrolyserstack. From a system perspective, this is not relevant because the unitsto close the electrolyte circle are not part of it. The functionality of theelectrolyser sub-system is given, when the circulation of electrolyte isclosed.
Fig. 3 shows that the difference between the efficiencies with heatuse (black bars) and without (grey bars) is significant and in the rangeof about 30% (absolute) for all SBL of the electrolyser. The values of
∗η y a1. , depend on the temperature level of useable heat. With 60 °C asused in this specific calculation, the whole heat of reaction of the se-paration of water into hydrogen and oxygen can be used. Analysing thedrop of efficiencies from SBL 1.5 to SBL 1.1, the greatest loss of effi-ciency in the electrolyser system is due to the transformer (SBL 1.4 toSBL 1.3). With increasing plant capacity of the PtG-system, the effi-ciency of the transformation also increases, depending on the type oftransformer unit. The decrease in efficiency decreasing is the compen-sation of the power factor cos(phi).
The quantification in the calculated example reveals that, in orderto increase overall efficiency of a PtG system, the use of heat from theelectrolyser and/or the methanation sub-system (see Fig. 4) have thehighest influence. For the electrolyser sub-system we have three op-portunities to handle the heat. The overall electrolyser sub-system ef-ficiencies are calculated with the parameter described in Tables 4 and 5and the different uses of surplus heat. They are shown in Table 6.
Since the amount of internal heat demand is very low compared tothe excess heat of the process, the internal heat use does not have asignificant influence on the efficiency. Using a high temperature elec-trolyser with steam, more energy would be needed internal for tem-pering and evaporating the water.
In the case with Tuse= 60 °C or 80 °C, the results show that the ef-ficiency increase with the external use of heat. Furthermore, the resultsshow how the maximum possible efficiency drops when the externaluseable temperature level is higher than the output of the sub-system.
0.50
0.55
0.60
0.65
0.70
0.75
0.80
0.85
0.90
0.95
1.00
η1.5,a* η1.5,a η1.4,a* η1.4,a η1.3,a* η1.3,a η1.2,a* η1.2,a η1.1,a* η1.1,a η1.0,a* η1.0,a
effici
ency
Fig. 3. Exemplary efficiencies of the sub-systemboundary level of the electrolysis with technicalassumptions disclosed in Tables 4 and 5. Foreach SBL an efficiency is calculated with heatrecovery (black bars) for external and internalheat use and without heat use (grey bars). Forthis specific electrolyser sub-system the greatestreduction of efficiency is the transformer of al-ternating current into direct current.
E. Frank et al. Applied Energy 218 (2018) 217–231
226
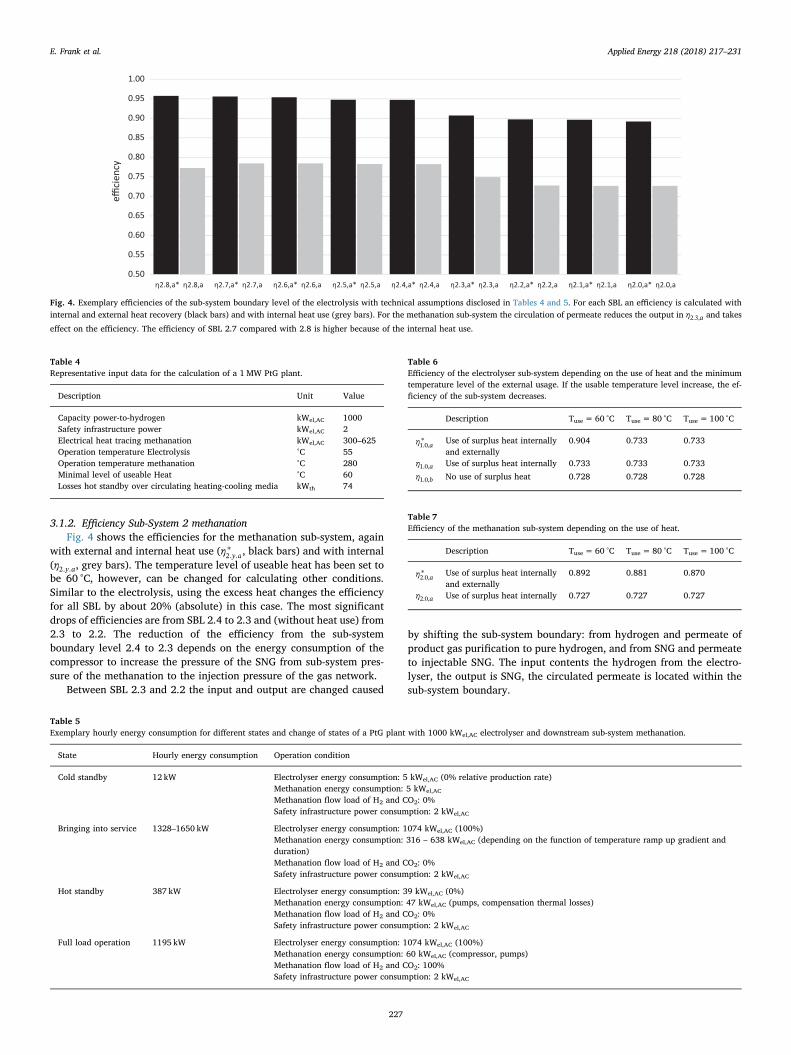
3.1.2. Efficiency Sub-System 2 methanationFig. 4 shows the efficiencies for the methanation sub-system, again
with external and internal heat use ( ∗η y a2. . , black bars) and with internal(η y a2. . , grey bars). The temperature level of useable heat has been set tobe 60 °C, however, can be changed for calculating other conditions.Similar to the electrolysis, using the excess heat changes the efficiencyfor all SBL by about 20% (absolute) in this case. The most significantdrops of efficiencies are from SBL 2.4 to 2.3 and (without heat use) from2.3 to 2.2. The reduction of the efficiency from the sub-systemboundary level 2.4 to 2.3 depends on the energy consumption of thecompressor to increase the pressure of the SNG from sub-system pres-sure of the methanation to the injection pressure of the gas network.
Between SBL 2.3 and 2.2 the input and output are changed caused
by shifting the sub-system boundary: from hydrogen and permeate ofproduct gas purification to pure hydrogen, and from SNG and permeateto injectable SNG. The input contents the hydrogen from the electro-lyser, the output is SNG, the circulated permeate is located within thesub-system boundary.
0.50
0.55
0.60
0.65
0.70
0.75
0.80
0.85
0.90
0.95
1.00
η2.8,a* η2.8,a η2.7,a* η2.7,a η2.6,a* η2.6,a η2.5,a* η2.5,a η2.4,a* η2.4,a η2.3,a* η2.3,a η2.2,a* η2.2,a η2.1,a* η2.1,a η2.0,a* η2.0,a
effici
ency
Fig. 4. Exemplary efficiencies of the sub-system boundary level of the electrolysis with technical assumptions disclosed in Tables 4 and 5. For each SBL an efficiency is calculated withinternal and external heat recovery (black bars) and with internal heat use (grey bars). For the methanation sub-system the circulation of permeate reduces the output in η a2.3, and takes
effect on the efficiency. The efficiency of SBL 2.7 compared with 2.8 is higher because of the internal heat use.
Table 4Representative input data for the calculation of a 1MW PtG plant.
Description Unit Value
Capacity power-to-hydrogen kWel,AC 1000Safety infrastructure power kWel,AC 2Electrical heat tracing methanation kWel,AC 300–625Operation temperature Electrolysis °C 55Operation temperature methanation °C 280Minimal level of useable Heat °C 60Losses hot standby over circulating heating-cooling media kWth 74
Table 5Exemplary hourly energy consumption for different states and change of states of a PtG plant with 1000 kWel,AC electrolyser and downstream sub-system methanation.
State Hourly energy consumption Operation condition
Cold standby 12 kW Electrolyser energy consumption: 5 kWel,AC (0% relative production rate)Methanation energy consumption: 5 kWel,AC
Methanation flow load of H2 and CO2: 0%Safety infrastructure power consumption: 2 kWel,AC
Bringing into service 1328–1650 kW Electrolyser energy consumption: 1074 kWel,AC (100%)Methanation energy consumption: 316 – 638 kWel,AC (depending on the function of temperature ramp up gradient andduration)Methanation flow load of H2 and CO2: 0%Safety infrastructure power consumption: 2 kWel,AC
Hot standby 387 kW Electrolyser energy consumption: 39 kWel,AC (0%)Methanation energy consumption: 47 kWel,AC (pumps, compensation thermal losses)Methanation flow load of H2 and CO2: 0%Safety infrastructure power consumption: 2 kWel,AC
Full load operation 1195 kW Electrolyser energy consumption: 1074 kWel,AC (100%)Methanation energy consumption: 60 kWel,AC (compressor, pumps)Methanation flow load of H2 and CO2: 100%Safety infrastructure power consumption: 2 kWel,AC
Table 6Efficiency of the electrolyser sub-system depending on the use of heat and the minimumtemperature level of the external usage. If the usable temperature level increase, the ef-ficiency of the sub-system decreases.
Description Tuse= 60 °C Tuse= 80 °C Tuse= 100 °C
∗η a1.0, Use of surplus heat internallyand externally
0.904 0.733 0.733
η a1.0, Use of surplus heat internally 0.733 0.733 0.733
η b1.0, No use of surplus heat 0.728 0.728 0.728
Table 7Efficiency of the methanation sub-system depending on the use of heat.
Description Tuse= 60 °C Tuse= 80 °C Tuse= 100 °C
∗η a2.0, Use of surplus heat internallyand externally
0.892 0.881 0.870
η a2.0, Use of surplus heat internally 0.727 0.727 0.727
E. Frank et al. Applied Energy 218 (2018) 217–231
227

Theoretically, a complete conversion of hydrogen to methane (andwater) would lead to a methanation efficiency (without heat usage) of83%. If the conversion is not complete, the efficiency is higher becausethe calorific value of hydrogen that is not converted to methane ishigher than the formed methane.
The overall efficiencies of the sub-system methanation, which arecalculated with the parameter described Tables 4 and 5 and the dif-ferent uses of surplus heat, are shown in Table 7. Also for the sub-system methanation an internal and external heat usage can be ana-lysed. We only present calculations of two options: The combined use ofheat for internal and external sinks ( ∗η a2.0, ) and the use of heat for in-ternal heat sinks only (η a2.0, ).
Considering the whole PtG system by combining η1.0 and η2.0 wehave several cases with and without different heat use concepts forelectrolysis and/or methanation which lead to varying results based onspecific boundary conditions.
3.1.3. Efficiency Power-to-Gas System 0In Fig. 5 the overall efficiency of the PtG-system is presented based
on the conditions described in Tables 4 and 5 for the following cases:Internal usage of heat of both sub-systems (electrolyser and methana-tion), external and internal usage of heat of both sub-systems, and thetwo cross combinations.
Again, Fig. 5 clearly shows the benefit of using the excess heat of thetwo main processes on the system efficiency ( ∗η a0.0, vs. η a0.0, ). Because ofthe higher amount of surplus heat against the amount of internal heatnecessity the greatest increase of efficiency can be reached if the surplusheat is used internally and externally. If no excess heat is used at all, thehighest overall system efficiency that can be reached is as low as 54.3%,whereas the highest system efficiency with a comprehensive usage ofexcess heat and technical assumptions as described in Tables 4 and 5 is85.9%.
It has to be noted again that the results and conclusions presented inthis section are only valid for the specific assumptions that were in-troduced. For other process technologies or heat use concepts, etc., allefficiencies can be calculated accordingly and related conclusions canbe drawn from the results.
3.2. Annual performance
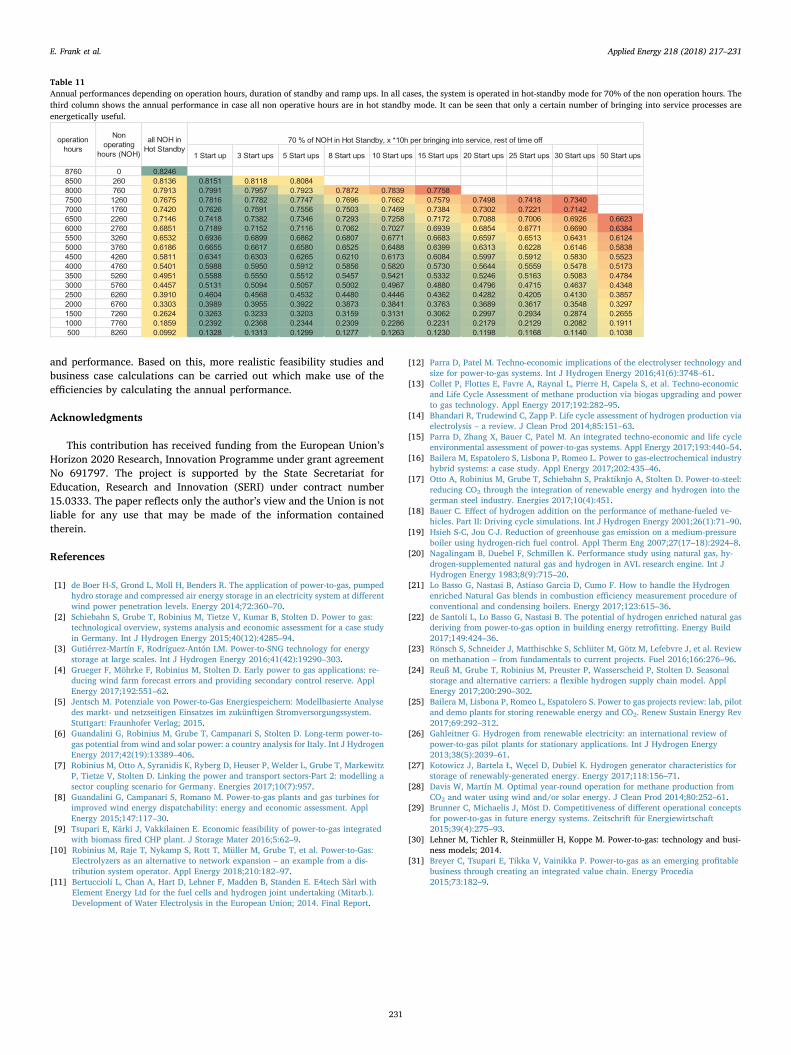
In the following several exemplary calculations of annual effi-ciencies are presented, based on the theoretical system described inSection 2 and theoretical load profiles (see Fig. 6 and Table 9). Calcu-lation is performed with a stationary Excel system model and calculatedwith a time step of one hour . The results are presented in Table 10.
For real operation, the plant control would have to decide on theoperation state (production, hot standby or cold standby). This includesthe integration of the reaction (or heating-up) time of the system andthe ability to foresee optimal operation state for a certain number ofhours, e.g. whether the system should remain in hot standby since theproduction should be started again soon. For the latter, a new para-meter “Hot Standby duration equivalent” is introduced which describesthe number of hours for which it is worthwhile (from an energetic pointof view) to keep the plant in hot standby instead of switching to coldstandby. Obviously, hot standby will be applied if the time until thenext predicted production starts is expected in a shorter time than thecalculated “Hot Standby duration equivalent”. The hourly energy con-sumption of the sequence “bringing into service” depends on the gra-dient of the temperature ramp-up. For the system specification assumedhere, the gradient should not be higher than 50 K/h since thermal straincould damage the material.
Table 8 shows the consumption of energy during “bringing intoservice” dependent of the duration of heating and compares the energyconsumption with the possible hours of “Hot Standby” using the sameenergy demand. It is supposed that the losses of the electrolysis subsystem as well as the methanation sub system are 5% based on the
energy in the circulated media.The decision to change from hot standby to cold standby depends on
the forecast of the upcoming electricity price for the next few days. Forthe calculations presented in this paper, the prediction accuracy wasassumed to be perfect. In real applications, the prediction accuracy willbe better the smaller the time range of the prediction is.
In the following, calculations of the annual performance of a PtGsystem for different cases are presented (see Fig. 6). The states “op-eration”, “hot standby” and “cold standby” have been taken into ac-count for the calculation of the annual performance (see Table 9).Changing the states, only the bringing into service procedure is calcu-lated in detail. A cooling of the system has not been considered. Theassumption is that the change from cold standby to operating conditionalways takes the full duration of 12 h. The operation mode of all fivecases is only in full-load mode.
Following assumption applies to case 1 to 4: For a certain number ofhours in the year (here 4000) the electricity price is below the (calcu-lated) threshold to turn the plant on for 100% production. All theseproduction hours are in one sequence.
For case 1 to 3 the plant starts already in production mode. In case 4the plant starts from or cold standby mode and one bringing into servicesequence has to be done.
For case 1 there is no hot standby required but the plant is turned ononce, runs 4000 h and is then turned off again. The electricity pricedistribution above the threshold does not matter, as well as the hour ofthe year when the production starts.
For case 2 the plant is turned into hot standby after 4000 h opera-tion.In case 3 the plant is also turned into cold standby for a certain timeafter hot standby.In case 5 the complexity is increasing. Changes to the first cases arean elaborated electricity function that reflects the variation of theelectricity price over the year (on an hourly basis). Different op-eration states of the plant have to be applied, including hot and coldstandby.
4. Discussion
The investigations reveal that for the assessment of a PtG plant it isnecessary to specify appropriate system boundaries. If two sub-systems(electrolysis and methanation) are applied, the sub-system efficiencies
0.00
0.10
0.20
0.30
0.40
0.50
0.60
0.70
0.80
0.90
1.00
η0.0,a η0.0,a* η0.0,a* η0.0.a*
effici
ency
Fig. 5. PtG system efficiency for the specific system configuration described in Tables 4and 5 with different heat use strategies. The overall efficiency of a PtG system is theenergy balance for the whole system, including the sub-system electrolyser and metha-nation and the heat use strategy for each sub-system. The calculated efficiencies are fromleft to right: internal heat use in both sub-systems electrolyser and methanation (η a0.0, ),
additional external heat use of surplus heat of the electrolyser, additional external heatuse of surplus heat of the methanation, additional external heat use of surplus heat of theelectrolyser and the methanation.
E. Frank et al. Applied Energy 218 (2018) 217–231
228

cannot be multiplied to obtain the efficiency of the whole plant. Thereason for this are additional flows of auxiliary energy or auxiliarymedia that are added to each of them. Therefore, the concept of effi-ciency calculations presented in this paper is a relevant basis for theinvestigation of PtG systems.
The biggest efficiency decrease of the electrolysis sub-system resultsfrom the conversion of AC to DC. The need for internal heat use inalkaline or PEM electrolysers is restricted to preheating fresh
demineralized water and has a minor influence on the efficiency. Due tothe low temperature level (approx. 60–90 °C), external heat use is re-stricted to building heating and hot water supply.
Table 8Calculated hot standby duration with the equivalent amount of energy for bringing theplant once into service.
Duration of ramp-up “ColdStandby” to “Hot Standby” in h
“Hot Standby” duration for equivalentenergy consumption as ramp up in h
5 17.66 19.87 22.08 24.29 26.410 28.611 30.812 33.024 59.4
1
0
t in h
Ove
rall
Dem
and
LoadElectrolyser
Hot Standby
Case 1
4000 8760
1
0
t in h
Ove
rall
Dem
and
LoadElectrolyser
Hot Standby
Case 2
4000 8760
1
0
t in h
Ove
rall
Dem
and
LoadElectrolyser
Hot Standby
Case 3
4000 8760
1
0
t in h
Ove
rall
Dem
and
LoadElectrolyser
Hot Standby
Case 4
4000 8760
1
0
t in h
Ove
rall
Dem
and
LoadElectrolyser
Hot Standby
Case 5
4000 8760
Fig. 6. Symbolic graphs of the five operating cases for the calculation of the annual performance.
Table 9Overview of the operation cases for calculating the annual performance.
Case Operation/h Cold standby/h Bringing into service/– Hot standby/h
1 4000 4760 – –2 4000 – – 47603 4000 1760 – 30004 4000 – 1 47485 4000 1580 15 3000
Table 10Annual performance of the specifically selected cases.
Case With heat usage Without heat usage
1 0.825 0.5082 0.540 0.3323 0.619 0.3804 0.539 0.3325 0.589 0.363
E. Frank et al. Applied Energy 218 (2018) 217–231
229
In the methanation process the compression of SNG from systempressure to grid pressure can result in a significant decrease of effi-ciency. In the case of chemical methanation, heat is available at amedium temperature level (approx. 200–300 °C) and can be used forinternal heat recovery or external applications.
For increasing the overall system efficiency by using waste heat forappropriate heat sinks, waste heat should preferably be used internallysince the primary output of a PtG plant is SNG. The efficiency mightfurther be increased if waste heat from the system can be used for anexternal application. Yet, from an efficiency perspective internal heatrecovery should be prioritized because it reduces the required energyinput.
The electrolysis can be operated dynamically with fast “cold-start”ability. In contrast, the methanation unit is slow due to the maximumtemperature increment of 50 K per hour. E.g. the electrolysis can op-erate and store hydrogen, while the methanation reactor is still heatingup. Even with changes in load during operation, electrolysis can reactfaster than methanation. The different load change abilities and therequirement to keep the product quality constant results in the ne-cessity to integrate a hydrogen storage, which allows a more in-dependent operation of the two subsystems.
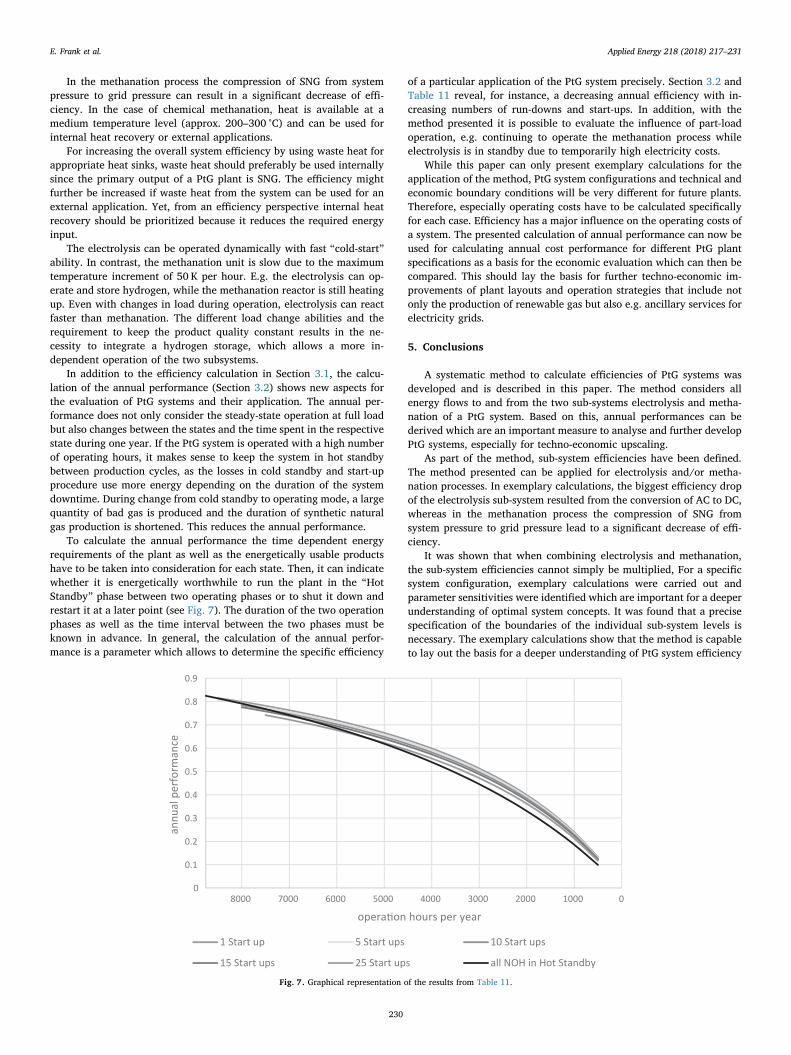
In addition to the efficiency calculation in Section 3.1, the calcu-lation of the annual performance (Section 3.2) shows new aspects forthe evaluation of PtG systems and their application. The annual per-formance does not only consider the steady-state operation at full loadbut also changes between the states and the time spent in the respectivestate during one year. If the PtG system is operated with a high numberof operating hours, it makes sense to keep the system in hot standbybetween production cycles, as the losses in cold standby and start-upprocedure use more energy depending on the duration of the systemdowntime. During change from cold standby to operating mode, a largequantity of bad gas is produced and the duration of synthetic naturalgas production is shortened. This reduces the annual performance.
To calculate the annual performance the time dependent energyrequirements of the plant as well as the energetically usable productshave to be taken into consideration for each state. Then, it can indicatewhether it is energetically worthwhile to run the plant in the “HotStandby” phase between two operating phases or to shut it down andrestart it at a later point (see Fig. 7). The duration of the two operationphases as well as the time interval between the two phases must beknown in advance. In general, the calculation of the annual perfor-mance is a parameter which allows to determine the specific efficiency
of a particular application of the PtG system precisely. Section 3.2 andTable 11 reveal, for instance, a decreasing annual efficiency with in-creasing numbers of run-downs and start-ups. In addition, with themethod presented it is possible to evaluate the influence of part-loadoperation, e.g. continuing to operate the methanation process whileelectrolysis is in standby due to temporarily high electricity costs.
While this paper can only present exemplary calculations for theapplication of the method, PtG system configurations and technical andeconomic boundary conditions will be very different for future plants.Therefore, especially operating costs have to be calculated specificallyfor each case. Efficiency has a major influence on the operating costs ofa system. The presented calculation of annual performance can now beused for calculating annual cost performance for different PtG plantspecifications as a basis for the economic evaluation which can then becompared. This should lay the basis for further techno-economic im-provements of plant layouts and operation strategies that include notonly the production of renewable gas but also e.g. ancillary services forelectricity grids.
5. Conclusions
A systematic method to calculate efficiencies of PtG systems wasdeveloped and is described in this paper. The method considers allenergy flows to and from the two sub-systems electrolysis and metha-nation of a PtG system. Based on this, annual performances can bederived which are an important measure to analyse and further developPtG systems, especially for techno-economic upscaling.
As part of the method, sub-system efficiencies have been defined.The method presented can be applied for electrolysis and/or metha-nation processes. In exemplary calculations, the biggest efficiency dropof the electrolysis sub-system resulted from the conversion of AC to DC,whereas in the methanation process the compression of SNG fromsystem pressure to grid pressure lead to a significant decrease of effi-ciency.
It was shown that when combining electrolysis and methanation,the sub-system efficiencies cannot simply be multiplied, For a specificsystem configuration, exemplary calculations were carried out andparameter sensitivities were identified which are important for a deeperunderstanding of optimal system concepts. It was found that a precisespecification of the boundaries of the individual sub-system levels isnecessary. The exemplary calculations show that the method is capableto lay out the basis for a deeper understanding of PtG system efficiency
0
0.1
0.2
0.3
0.4
0.5
0.6
0.7
0.8
0.9
010002000300040005000600070008000
annu
al p
erfo
rman
ce
operation hours per year
1 Start up 5 Start ups 10 Start ups
15 Start ups 25 Start ups all NOH in Hot Standby
Fig. 7. Graphical representation of the results from Table 11.
E. Frank et al. Applied Energy 218 (2018) 217–231
230
and performance. Based on this, more realistic feasibility studies andbusiness case calculations can be carried out which make use of theefficiencies by calculating the annual performance.
Acknowledgments
This contribution has received funding from the European Union’sHorizon 2020 Research, Innovation Programme under grant agreementNo 691797. The project is supported by the State Secretariat forEducation, Research and Innovation (SERI) under contract number15.0333. The paper reflects only the author’s view and the Union is notliable for any use that may be made of the information containedtherein.
References
[1] de Boer H-S, Grond L, Moll H, Benders R. The application of power-to-gas, pumpedhydro storage and compressed air energy storage in an electricity system at differentwind power penetration levels. Energy 2014;72:360–70.
[2] Schiebahn S, Grube T, Robinius M, Tietze V, Kumar B, Stolten D. Power to gas:technological overview, systems analysis and economic assessment for a case studyin Germany. Int J Hydrogen Energy 2015;40(12):4285–94.
[3] Gutiérrez-Martín F, Rodríguez-Antón LM. Power-to-SNG technology for energystorage at large scales. Int J Hydrogen Energy 2016;41(42):19290–303.
[4] Grueger F, Möhrke F, Robinius M, Stolten D. Early power to gas applications: re-ducing wind farm forecast errors and providing secondary control reserve. ApplEnergy 2017;192:551–62.
[5] Jentsch M. Potenziale von Power-to-Gas Energiespeichern: Modellbasierte Analysedes markt- und netzseitigen Einsatzes im zukünftigen Stromversorgungssystem.Stuttgart: Fraunhofer Verlag; 2015.
[6] Guandalini G, Robinius M, Grube T, Campanari S, Stolten D. Long-term power-to-gas potential from wind and solar power: a country analysis for Italy. Int J HydrogenEnergy 2017;42(19):13389–406.
[7] Robinius M, Otto A, Syranidis K, Ryberg D, Heuser P, Welder L, Grube T, MarkewitzP, Tietze V, Stolten D. Linking the power and transport sectors-Part 2: modelling asector coupling scenario for Germany. Energies 2017;10(7):957.
[8] Guandalini G, Campanari S, Romano M. Power-to-gas plants and gas turbines forimproved wind energy dispatchability: energy and economic assessment. ApplEnergy 2015;147:117–30.
[9] Tsupari E, Kärki J, Vakkilainen E. Economic feasibility of power-to-gas integratedwith biomass fired CHP plant. J Storage Mater 2016;5:62–9.
[10] Robinius M, Raje T, Nykamp S, Rott T, Müller M, Grube T, et al. Power-to-Gas:Electrolyzers as an alternative to network expansion – an example from a dis-tribution system operator. Appl Energy 2018;210:182–97.
[11] Bertuccioli L, Chan A, Hart D, Lehner F, Madden B, Standen E. E4tech Sàrl withElement Energy Ltd for the fuel cells and hydrogen joint undertaking (Mitarb.).Development of Water Electrolysis in the European Union; 2014. Final Report.
[12] Parra D, Patel M. Techno-economic implications of the electrolyser technology andsize for power-to-gas systems. Int J Hydrogen Energy 2016;41(6):3748–61.
[13] Collet P, Flottes E, Favre A, Raynal L, Pierre H, Capela S, et al. Techno-economicand Life Cycle Assessment of methane production via biogas upgrading and powerto gas technology. Appl Energy 2017;192:282–95.
[14] Bhandari R, Trudewind C, Zapp P. Life cycle assessment of hydrogen production viaelectrolysis – a review. J Clean Prod 2014;85:151–63.
[15] Parra D, Zhang X, Bauer C, Patel M. An integrated techno-economic and life cycleenvironmental assessment of power-to-gas systems. Appl Energy 2017;193:440–54.
[16] Bailera M, Espatolero S, Lisbona P, Romeo L. Power to gas-electrochemical industryhybrid systems: a case study. Appl Energy 2017;202:435–46.
[17] Otto A, Robinius M, Grube T, Schiebahn S, Praktiknjo A, Stolten D. Power-to-steel:reducing CO2 through the integration of renewable energy and hydrogen into thegerman steel industry. Energies 2017;10(4):451.
[18] Bauer C. Effect of hydrogen addition on the performance of methane-fueled ve-hicles. Part II: Driving cycle simulations. Int J Hydrogen Energy 2001;26(1):71–90.
[19] Hsieh S-C, Jou C-J. Reduction of greenhouse gas emission on a medium-pressureboiler using hydrogen-rich fuel control. Appl Therm Eng 2007;27(17–18):2924–8.
[20] Nagalingam B, Duebel F, Schmillen K. Performance study using natural gas, hy-drogen-supplemented natural gas and hydrogen in AVL research engine. Int JHydrogen Energy 1983;8(9):715–20.
[21] Lo Basso G, Nastasi B, Astiaso Garcia D, Cumo F. How to handle the Hydrogenenriched Natural Gas blends in combustion efficiency measurement procedure ofconventional and condensing boilers. Energy 2017;123:615–36.
[22] de Santoli L, Lo Basso G, Nastasi B. The potential of hydrogen enriched natural gasderiving from power-to-gas option in building energy retrofitting. Energy Build2017;149:424–36.
[23] Rönsch S, Schneider J, Matthischke S, Schlüter M, Götz M, Lefebvre J, et al. Reviewon methanation – from fundamentals to current projects. Fuel 2016;166:276–96.
[24] Reuß M, Grube T, Robinius M, Preuster P, Wasserscheid P, Stolten D. Seasonalstorage and alternative carriers: a flexible hydrogen supply chain model. ApplEnergy 2017;200:290–302.
[25] Bailera M, Lisbona P, Romeo L, Espatolero S. Power to gas projects review: lab, pilotand demo plants for storing renewable energy and CO2. Renew Sustain Energy Rev2017;69:292–312.
[26] Gahleitner G. Hydrogen from renewable electricity: an international review ofpower-to-gas pilot plants for stationary applications. Int J Hydrogen Energy2013;38(5):2039–61.
[27] Kotowicz J, Bartela Ł, Węcel D, Dubiel K. Hydrogen generator characteristics forstorage of renewably-generated energy. Energy 2017;118:156–71.
[28] Davis W, Martín M. Optimal year-round operation for methane production fromCO2 and water using wind and/or solar energy. J Clean Prod 2014;80:252–61.
[29] Brunner C, Michaelis J, Möst D. Competitiveness of different operational conceptsfor power-to-gas in future energy systems. Zeitschrift für Energiewirtschaft2015;39(4):275–93.
[30] Lehner M, Tichler R, Steinmüller H, Koppe M. Power-to-gas: technology and busi-ness models; 2014.
[31] Breyer C, Tsupari E, Tikka V, Vainikka P. Power-to-gas as an emerging profitablebusiness through creating an integrated value chain. Energy Procedia2015;73:182–9.
Table 11Annual performances depending on operation hours, duration of standby and ramp ups. In all cases, the system is operated in hot-standby mode for 70% of the non operation hours. Thethird column shows the annual performance in case all non operative hours are in hot standby mode. It can be seen that only a certain number of bringing into service processes areenergetically useful.
E. Frank et al. Applied Energy 218 (2018) 217–231
231